Cracking the Population Code Dario Ringach University of California, Los Angeles

Cracking the Population Code Dario Ringach University of California, Los Angeles.
Dec 22, 2015
Welcome message from author
This document is posted to help you gain knowledge. Please leave a comment to let me know what you think about it! Share it to your friends and learn new things together.
Transcript

Cracking the Population Code
Dario Ringach
University of California, Los Angeles
Two basic questions in cortical computation:
The Questions
How is information represented?
How is information processed?
How is information encoded in populations of neurons?
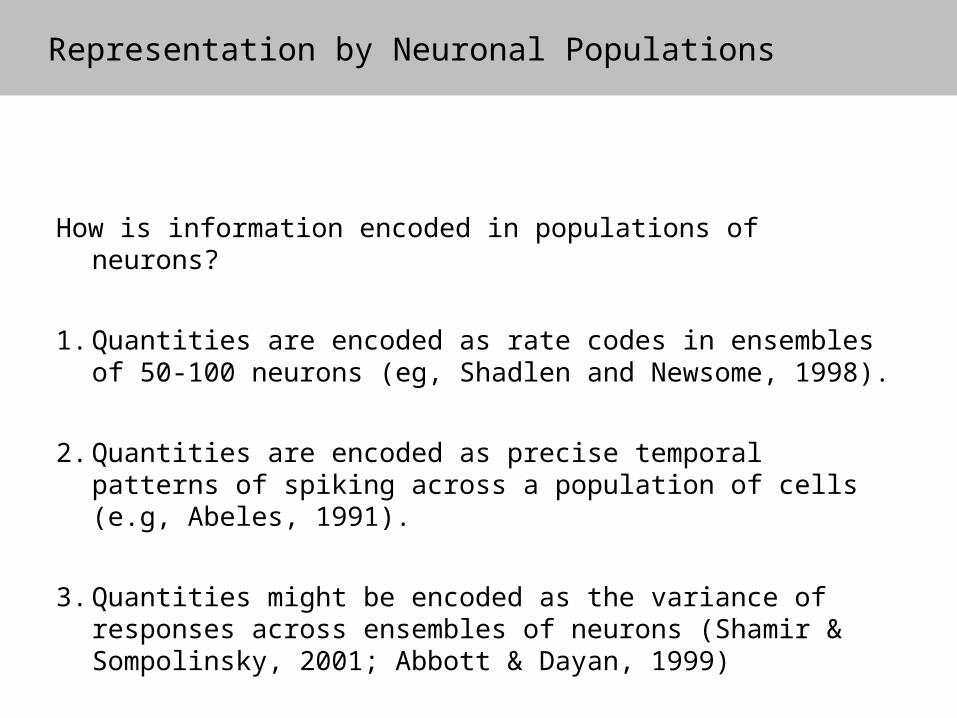
Representation by Neuronal Populations
How is information encoded in populations of neurons?
1. Quantities are encoded as rate codes in ensembles of 50-100 neurons (eg, Shadlen and Newsome, 1998).
Representation by Neuronal Populations
How is information encoded in populations of neurons?
1. Quantities are encoded as rate codes in ensembles of 50-100 neurons (eg, Shadlen and Newsome, 1998).
2. Quantities are encoded as precise temporal patterns of spiking across a population of cells (e.g, Abeles, 1991).
3. Quantities might be encoded as the variance of responses across ensembles of neurons (Shamir & Sompolinsky, 2001; Abbott & Dayan, 1999)
Representation by Neuronal Populations
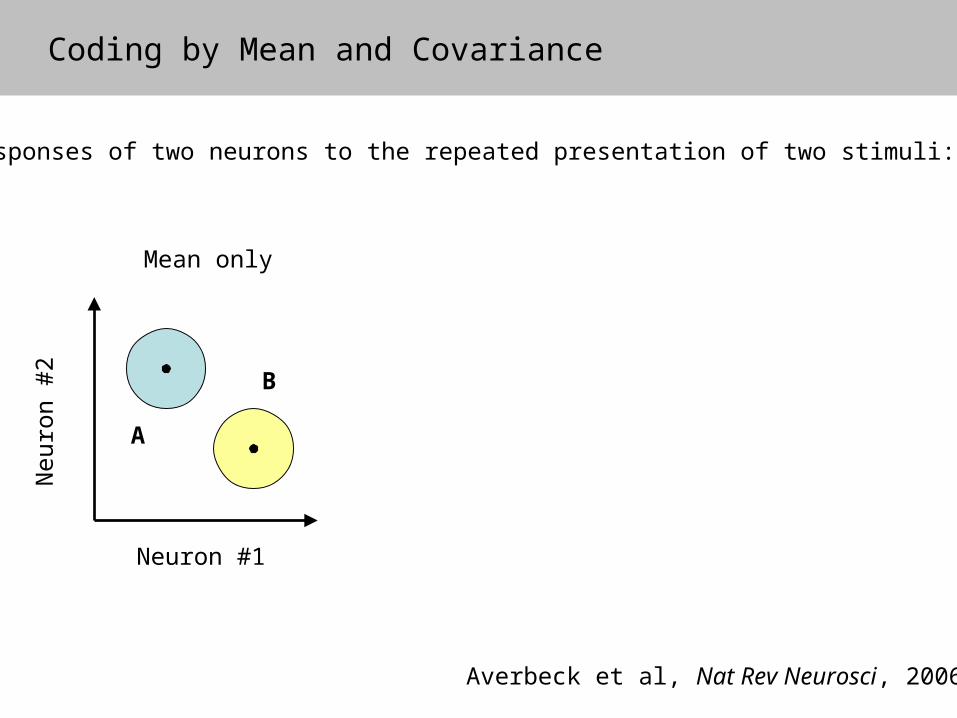
Coding by Mean and Covariance
Neuron #1
Neuro
n #
2
Averbeck et al, Nat Rev Neurosci, 2006
Mean only
B
A
Responses of two neurons to the repeated presentation of two stimuli:
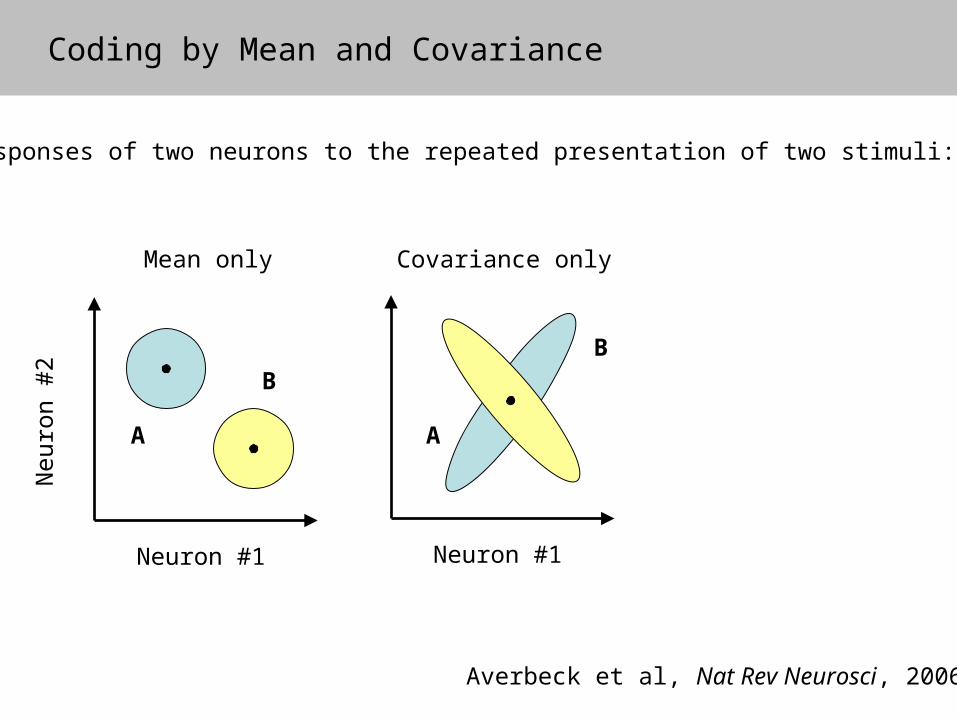
Coding by Mean and Covariance
Neuron #1
Neuro
n #
2
Averbeck et al, Nat Rev Neurosci, 2006
Neuron #1
Mean only Covariance only
B
A A
B
Responses of two neurons to the repeated presentation of two stimuli:
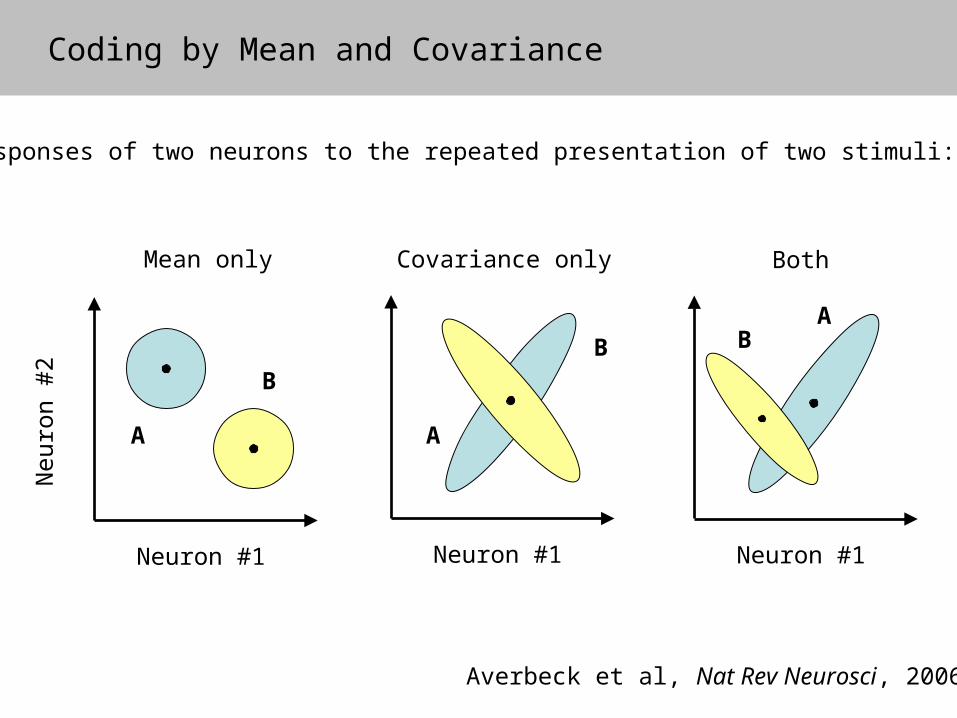
Coding by Mean and Covariance
Neuron #1
Neuro
n #
2
Averbeck et al, Nat Rev Neurosci, 2006
Neuron #1
Mean only Covariance only
Neuron #1
Both
B
A A
B BA
Responses of two neurons to the repeated presentation of two stimuli:
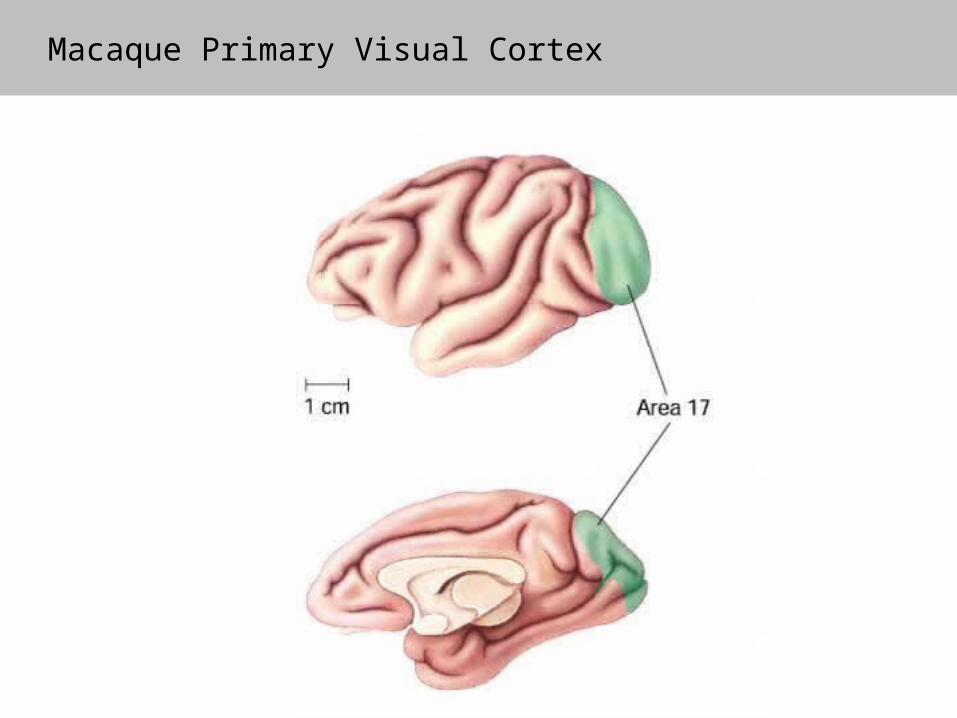
Macaque Primary Visual Cortex
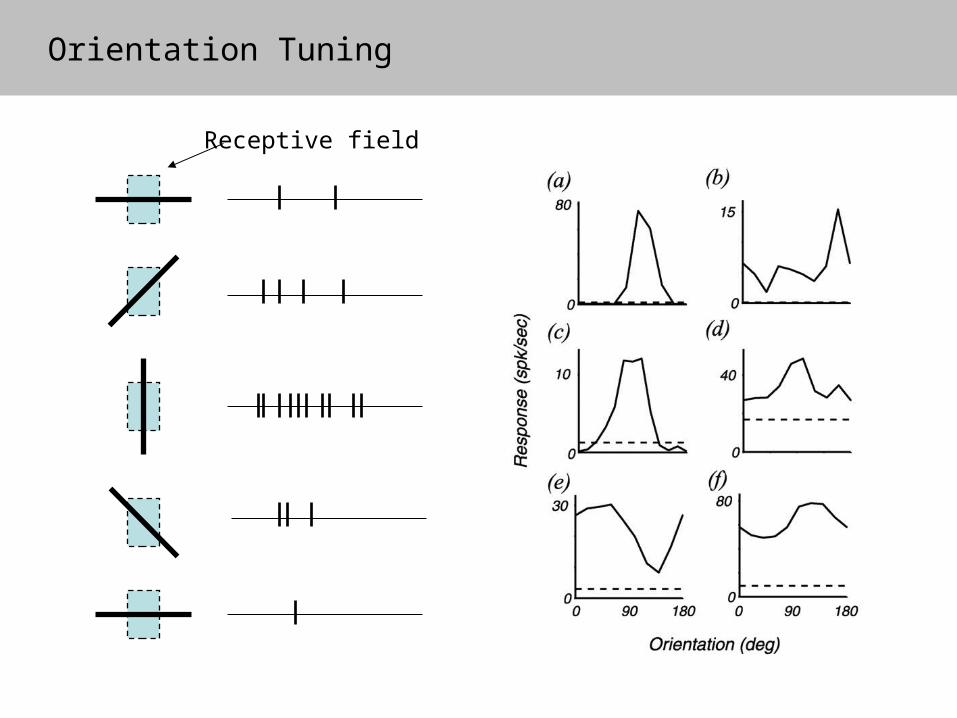
Orientation Tuning
Receptive field
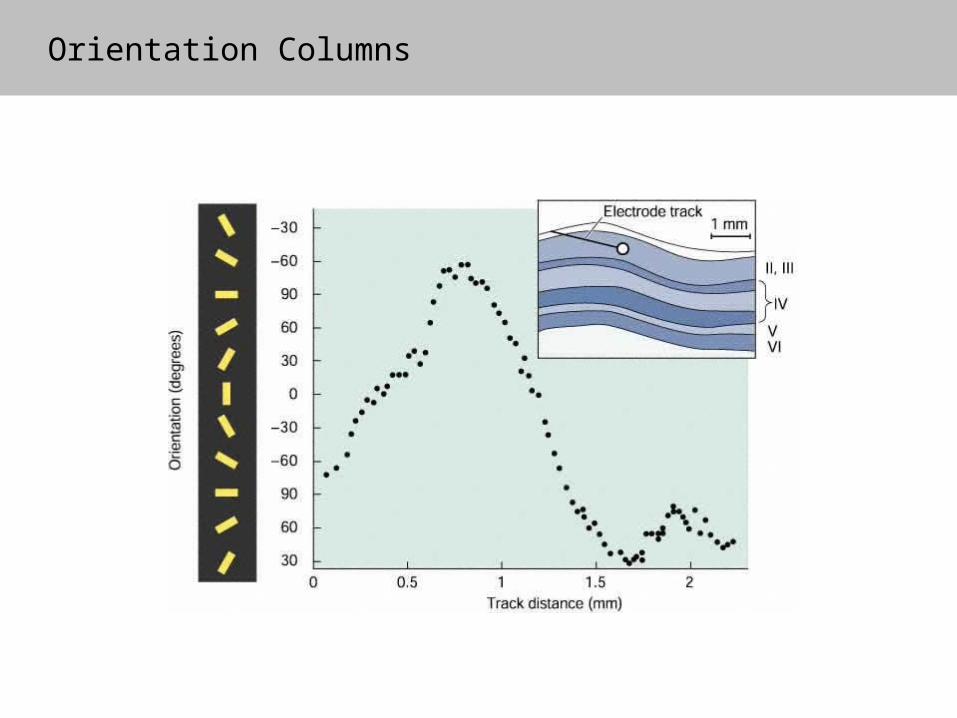
Orientation Columns
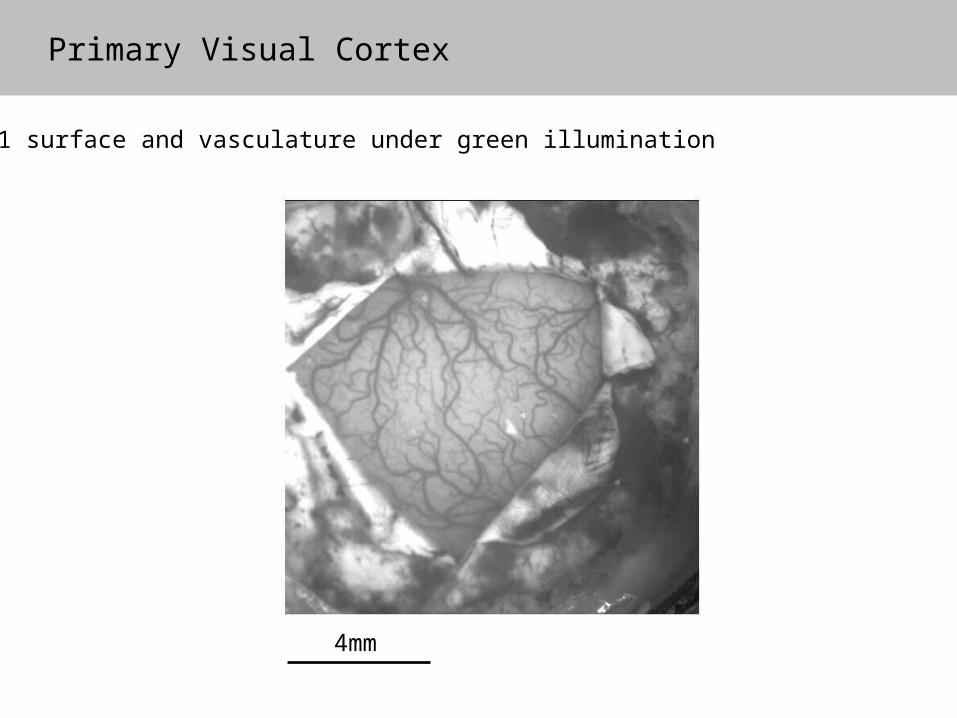
Primary Visual Cortex
4mm
V1 surface and vasculature under green illumination
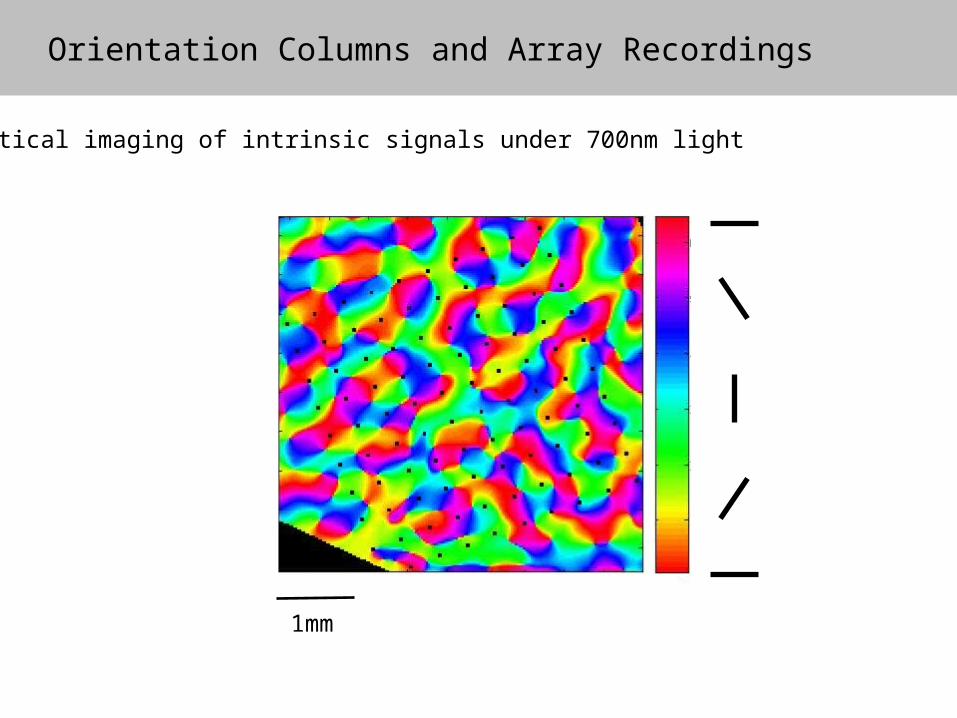
Orientation Columns and Array Recordings
1mm
Optical imaging of intrinsic signals under 700nm light
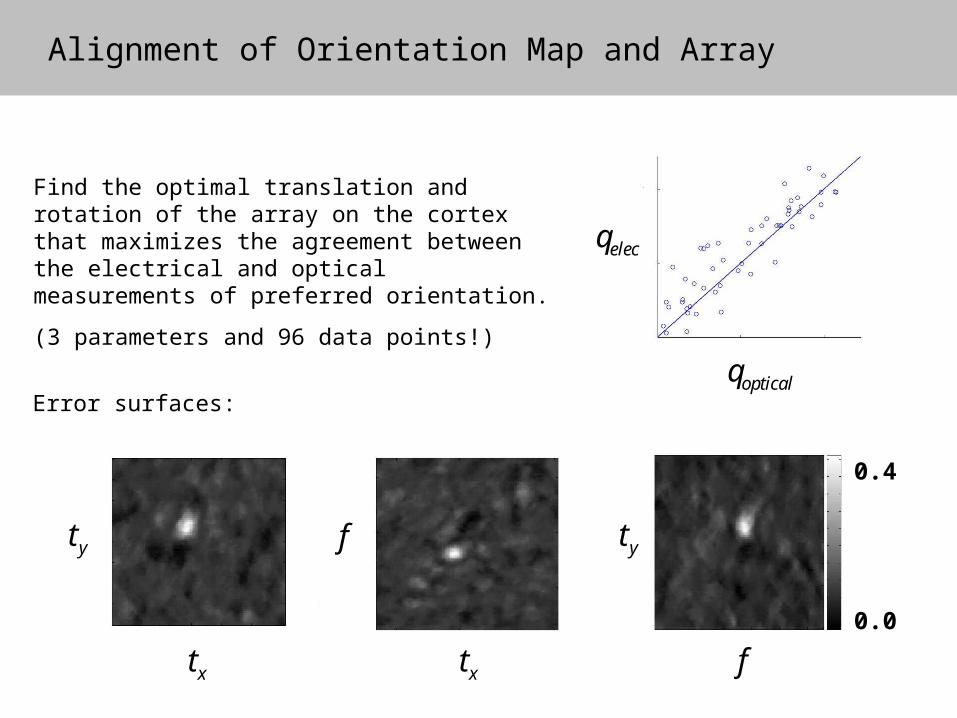
Alignment of Orientation Map and Array
0.0
0.4
Find the optimal translation and rotation of the array on the cortex that maximizes the agreement between the electrical and optical measurements of preferred orientation.
(3 parameters and 96 data points!)
Error surfaces:
xt xt
yt ytf
f
opticalq
elecq
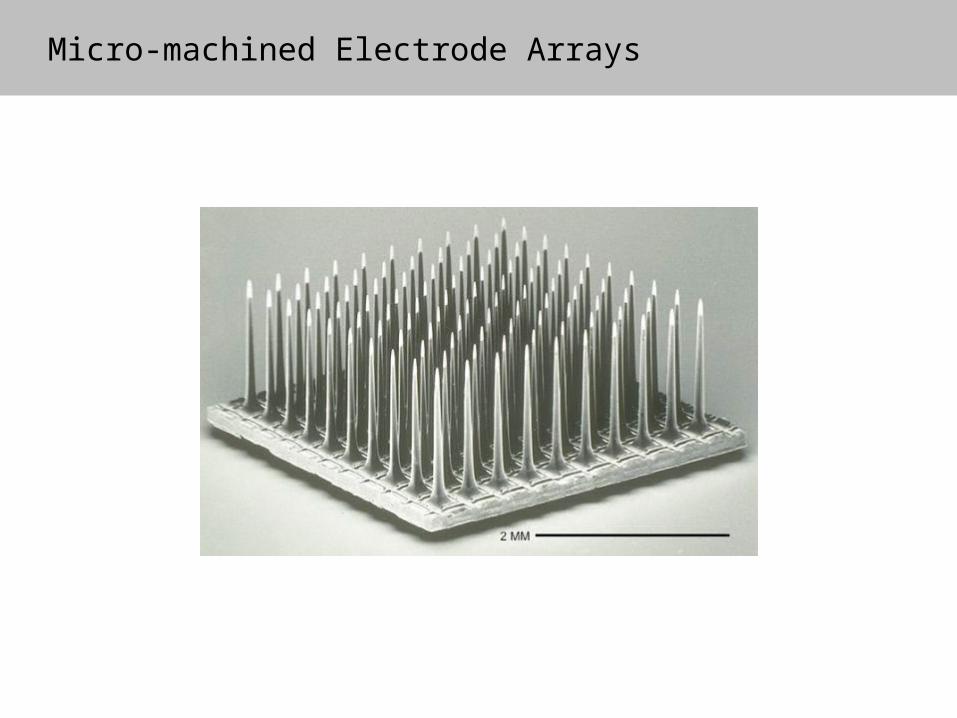
Micro-machined Electrode Arrays
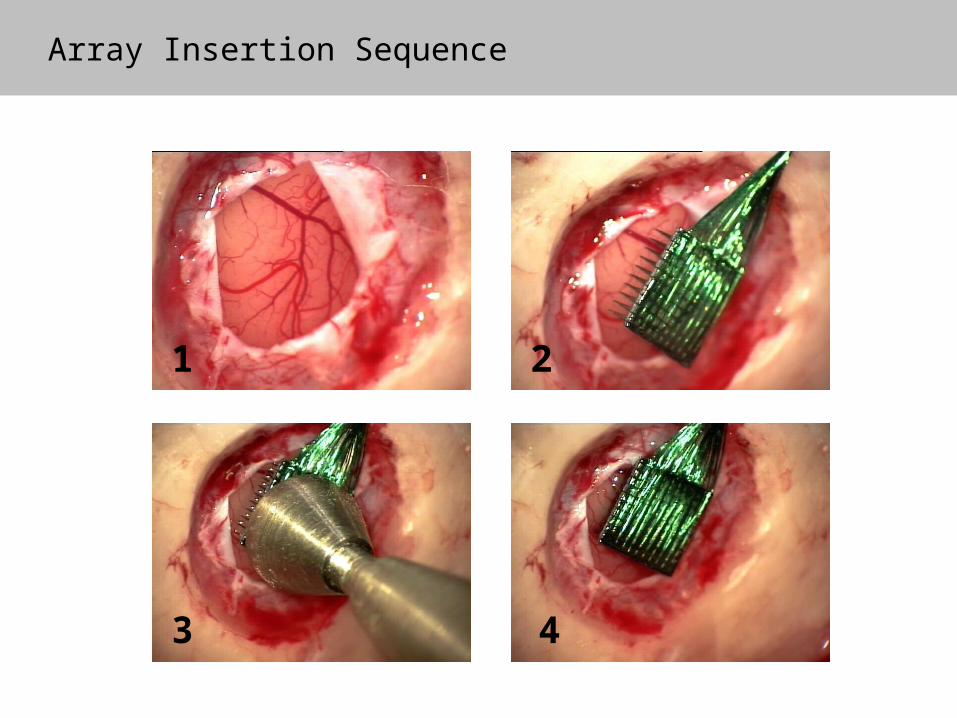
Array Insertion Sequence
1 2
3 4
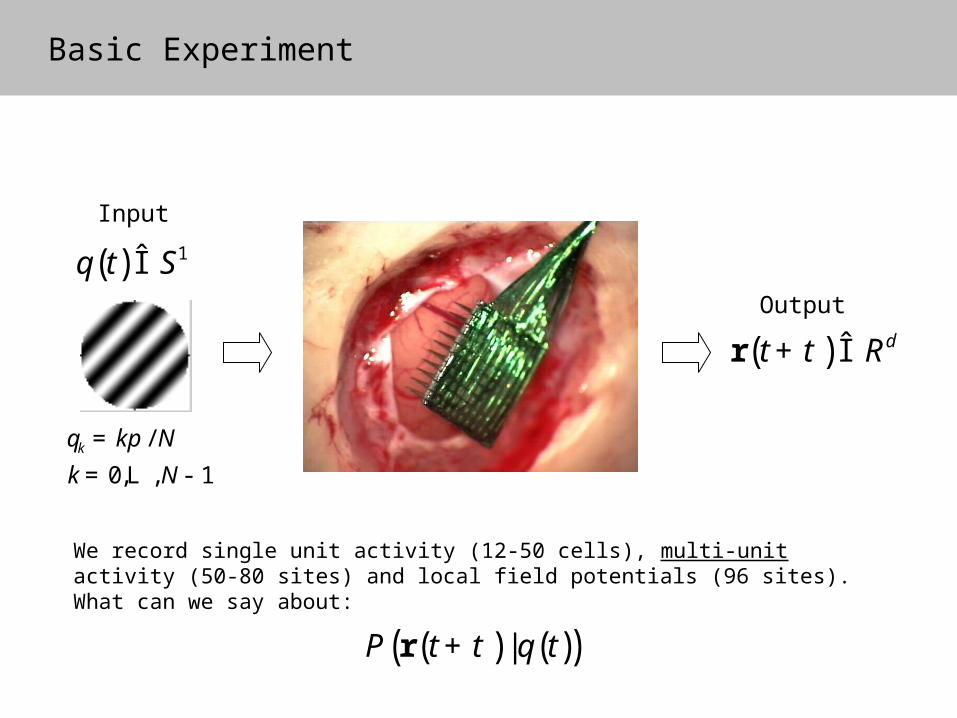
( ) dt Rt+ Îr
Input
Output
Basic Experiment
( ) 1t Sq Î
We record single unit activity (12-50 cells), multi-unit activity (50-80 sites) and local field potentials (96 sites). What can we say about:
/
0, , 1k k N
k N
q p=
= -L
( ) ( )( )|P t tr t q+
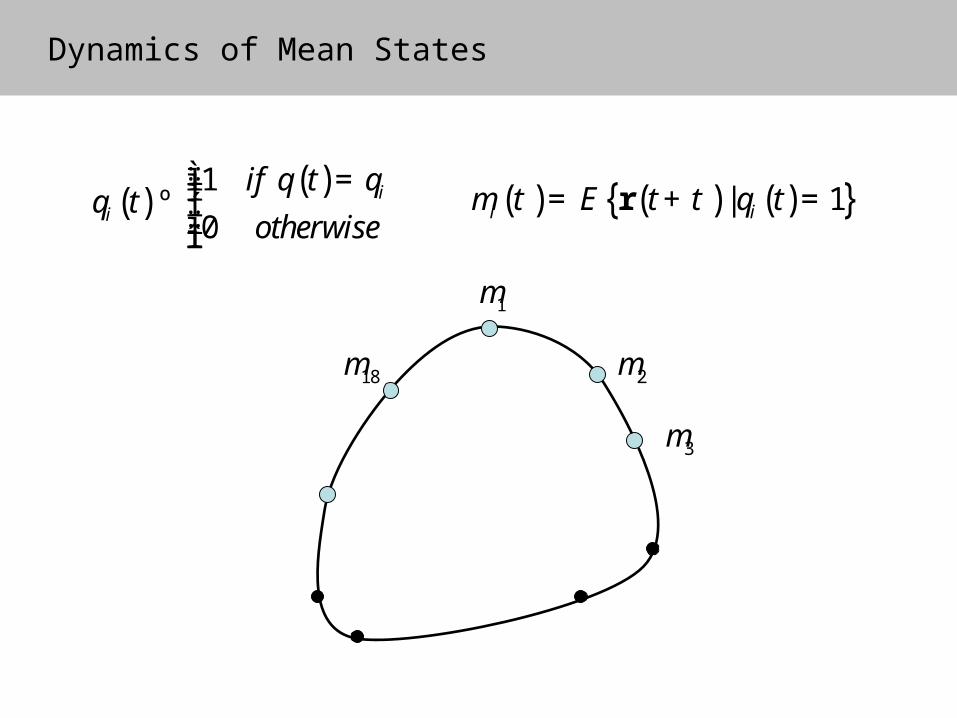
Dynamics of Mean States
( ) ( ) ( ){ }| 1i iE t trm t t q= + =
18m
1m
( )( )1
0i
i
if tt
otherwise
q qq
ì =ïïº íïïî
2m
3m
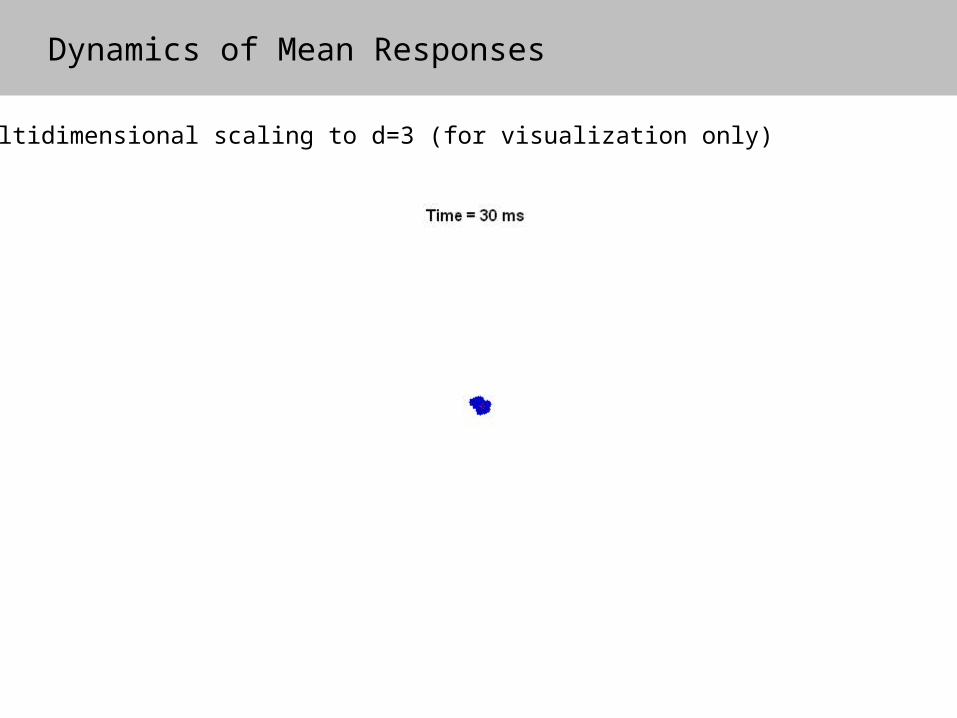
Dynamics of Mean Responses
Multidimensional scaling to d=3 (for visualization only)
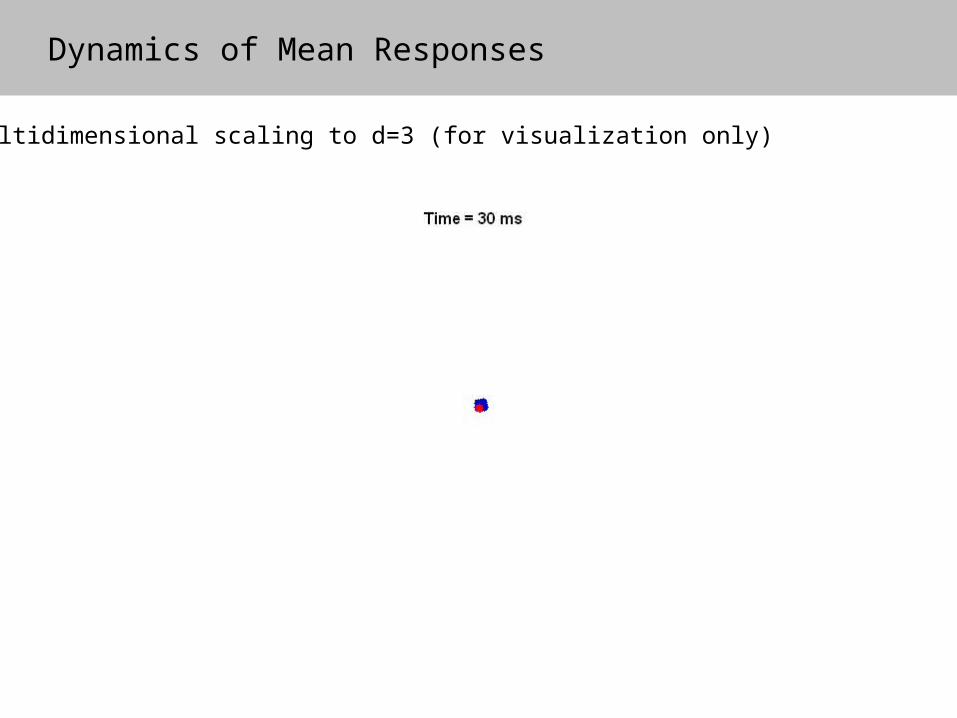
Dynamics of Mean Responses
Multidimensional scaling to d=3 (for visualization only)
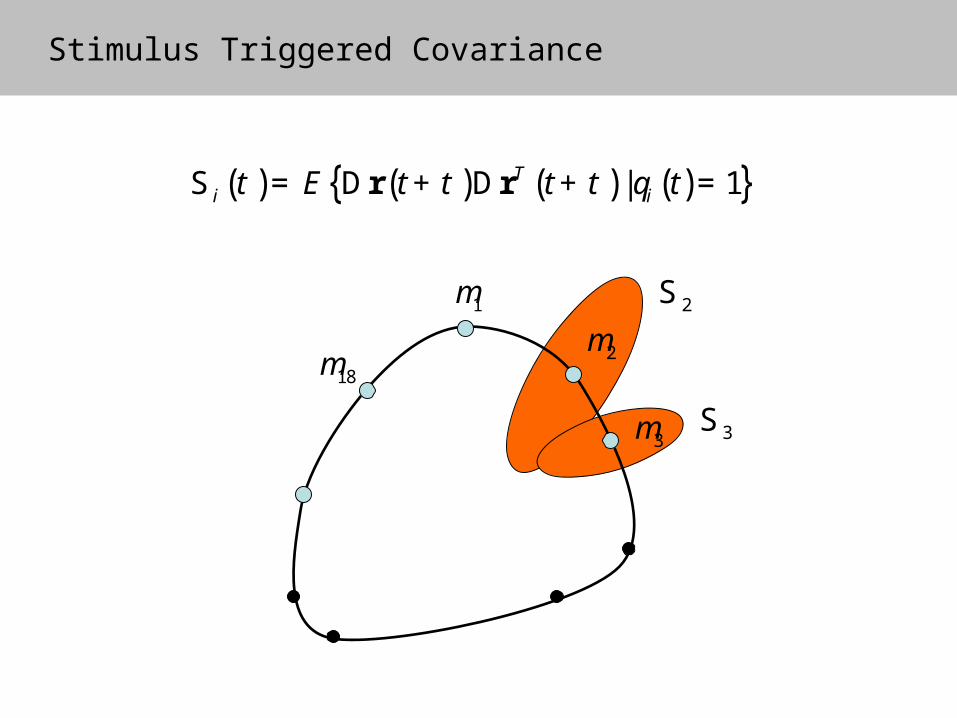
Stimulus Triggered Covariance
( ) ( ) ( ) ( ){ }| 1Ti iE t t tr rt t t qS = D + D + =
18m
1m
2m
3m
2S
3S
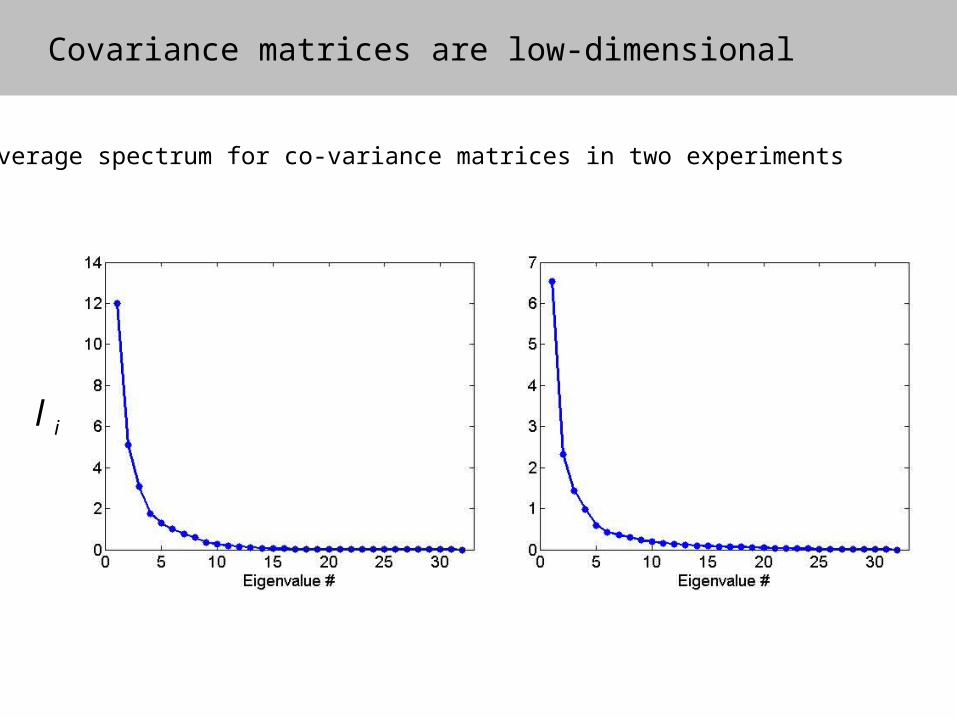
Covariance matrices are low-dimensional
il
Average spectrum for co-variance matrices in two experiments
Covariance matrices are low-dimensional (!)
Two Examples
18m
1m
im
jm
iS
jS
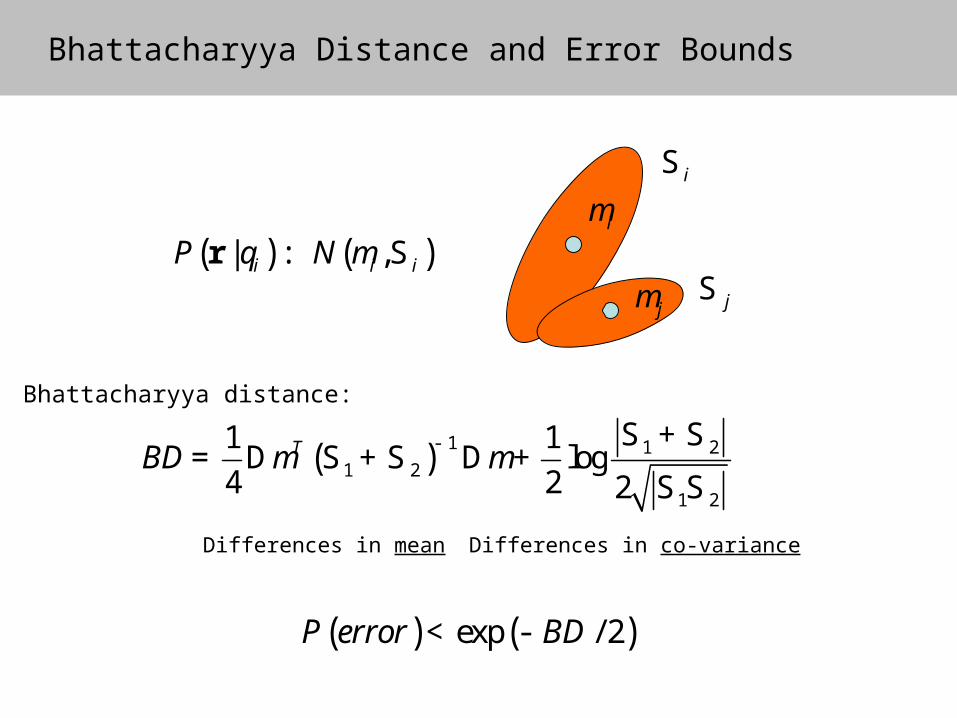
Bhattacharyya Distance and Error Bounds
( ) ( )| ,i i iP Nr :q m S
( ) 1 1 21 2
1 2
1 1log
4 2 2
TBD m m- S +S
= D S +S D +S S
Differences in mean Differences in co-variance
( ) ( )exp / 2P error BD< -
Bhattacharyya distance:
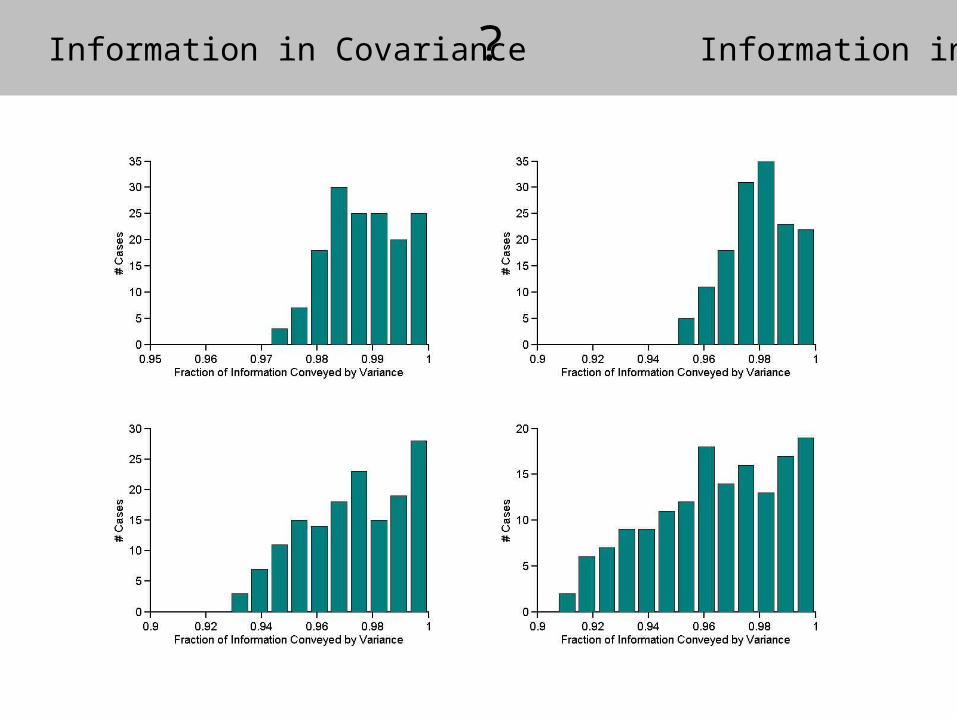
Information in Covariance Information in Mean?
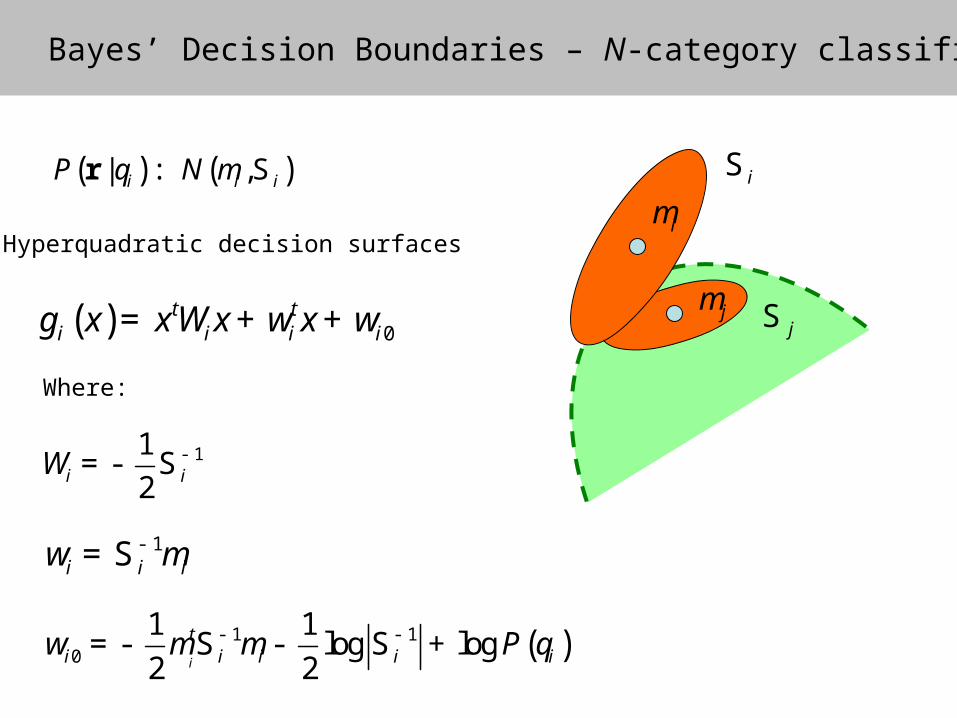
Bayes’ Decision Boundaries – N-category classification
( ) ( )| ,i i iP Nr :q m S iS
jmjS
imHyperquadratic decision surfaces
( ) 0t t
i i i ig x xW x w x w= + +
Where:
11
2i iW -=- S
1i i iw m-=S
( )1 10
1 1log log
2 2i
ti i i i iw Pm m q- -=- S - S +
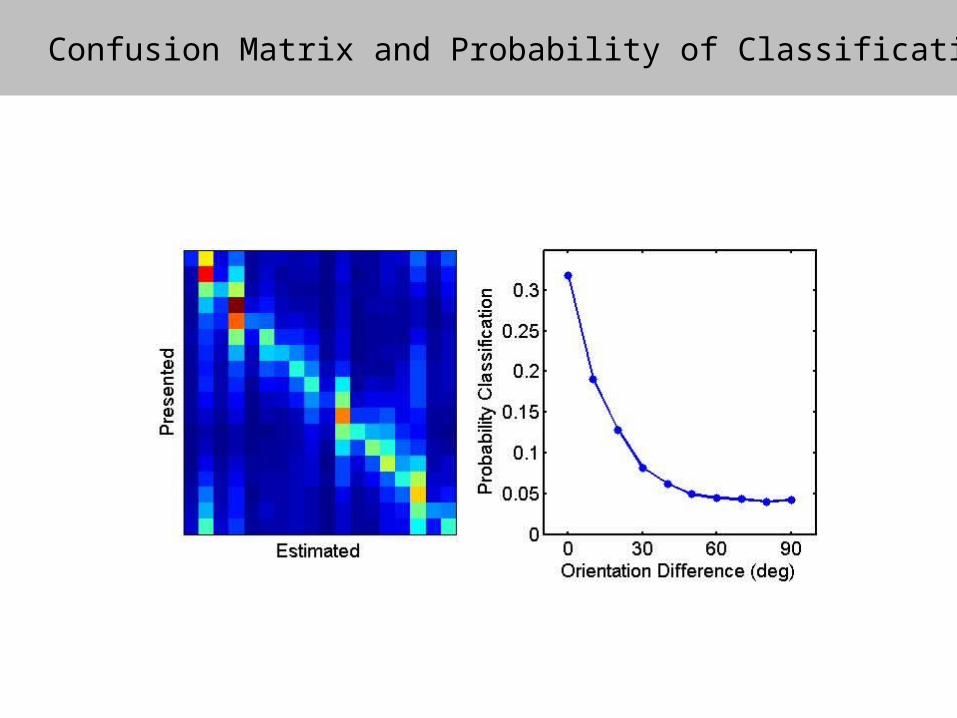
Confusion Matrix and Probability of Classification
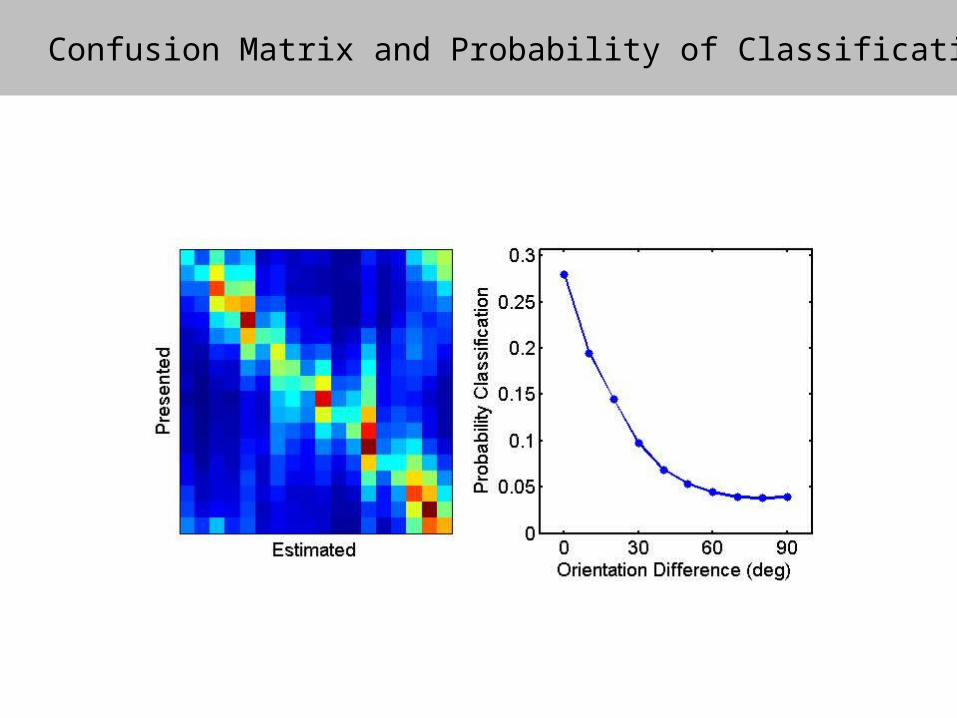
Confusion Matrix and Probability of Classification
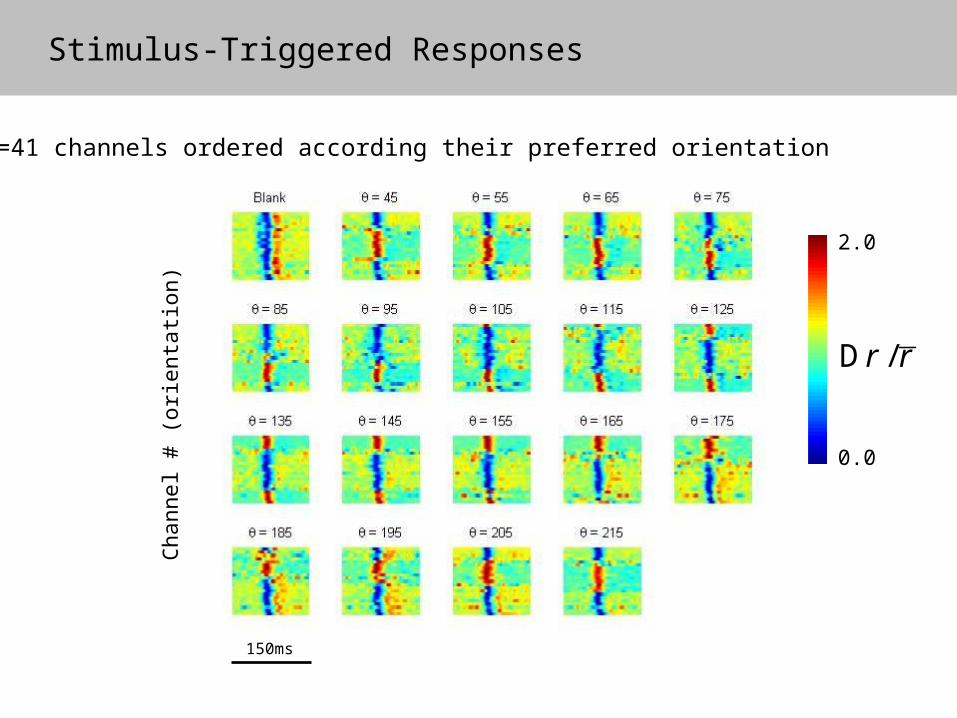
Stimulus-Triggered Responses
150ms
n=41 channels ordered according their preferred orientationC
hannel #
(ori
enta
tion)
0.0
2.0
/r rD
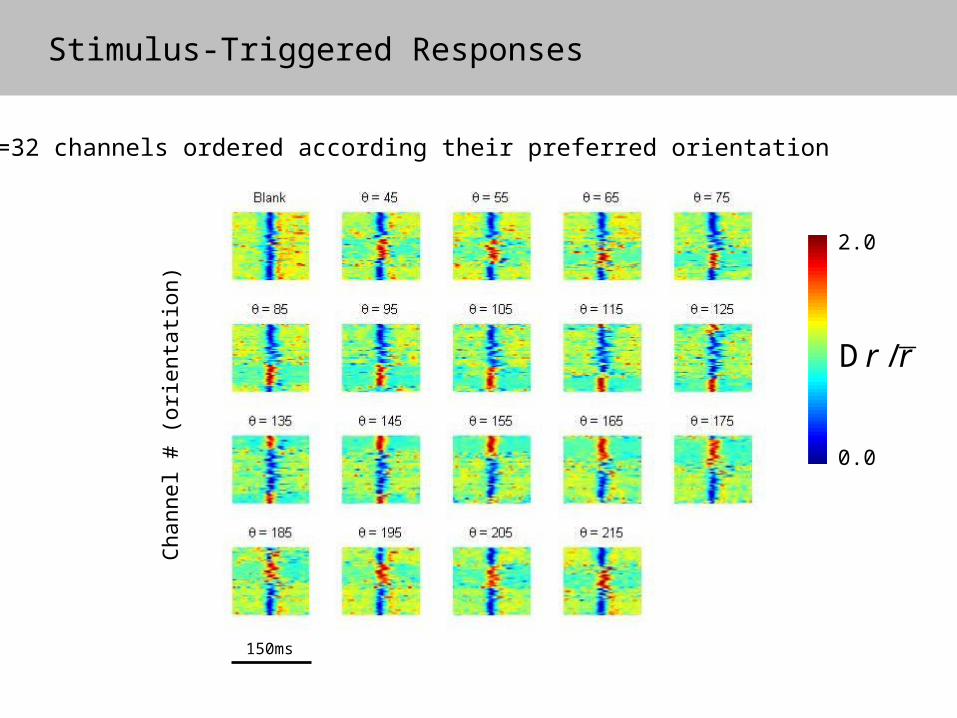
Stimulus-Triggered Responses
150ms
n=32 channels ordered according their preferred orientationC
hannel #
(ori
enta
tion)
0.0
2.0
/r rD
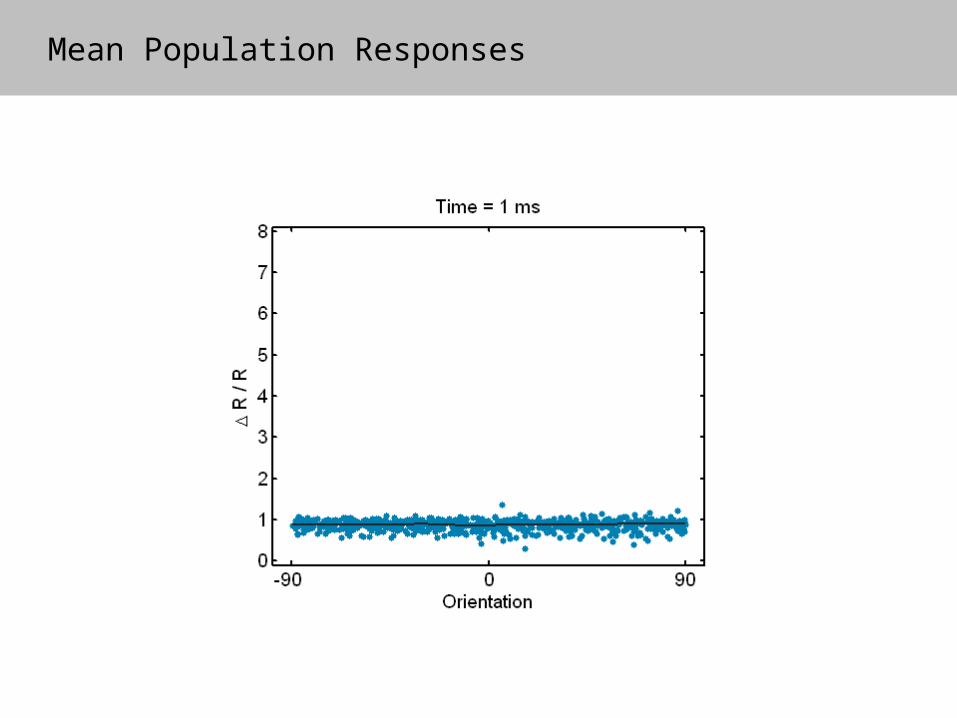
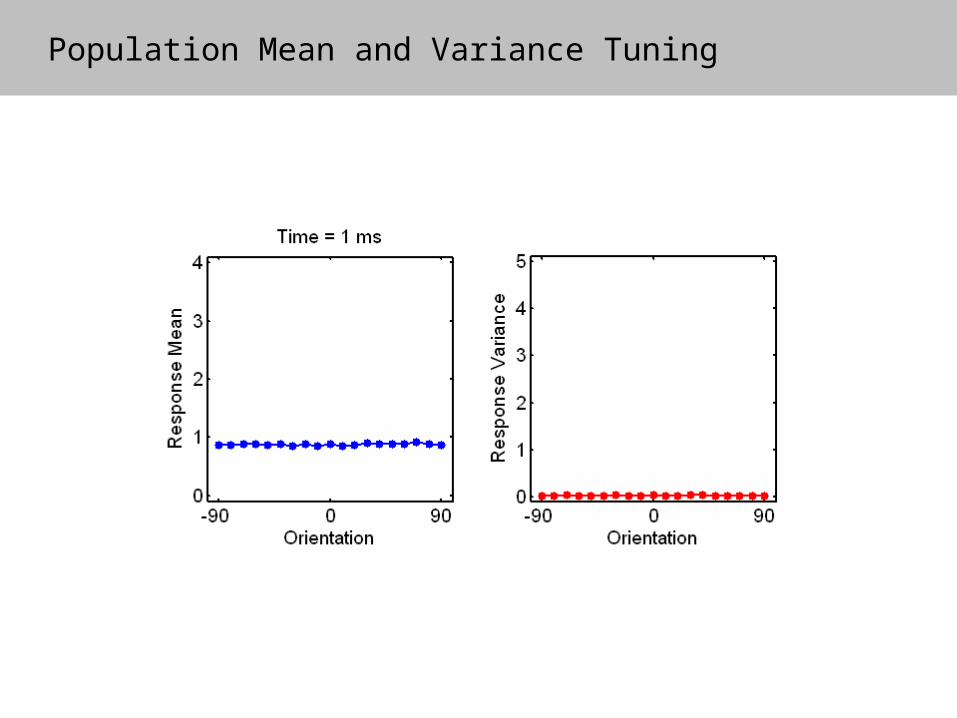
Mean Population Responses
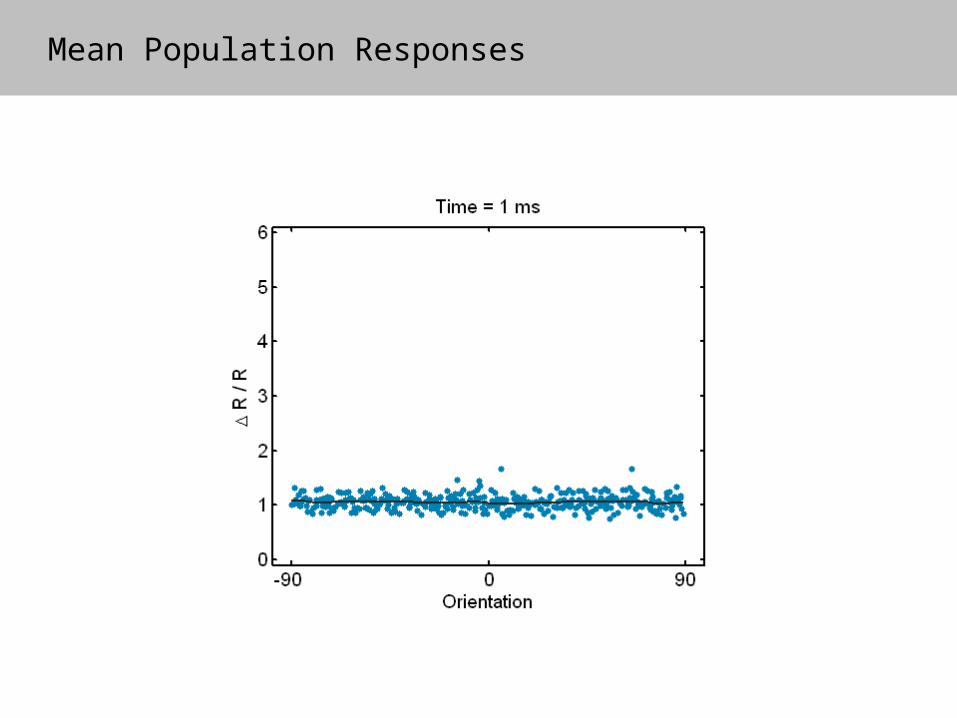
Mean Population Responses
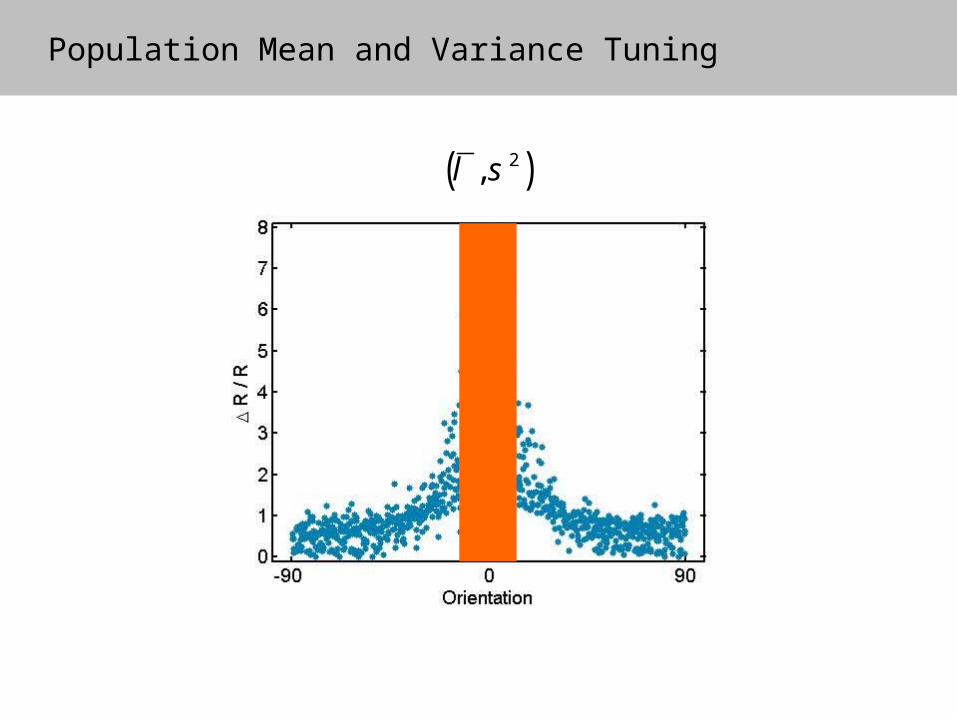
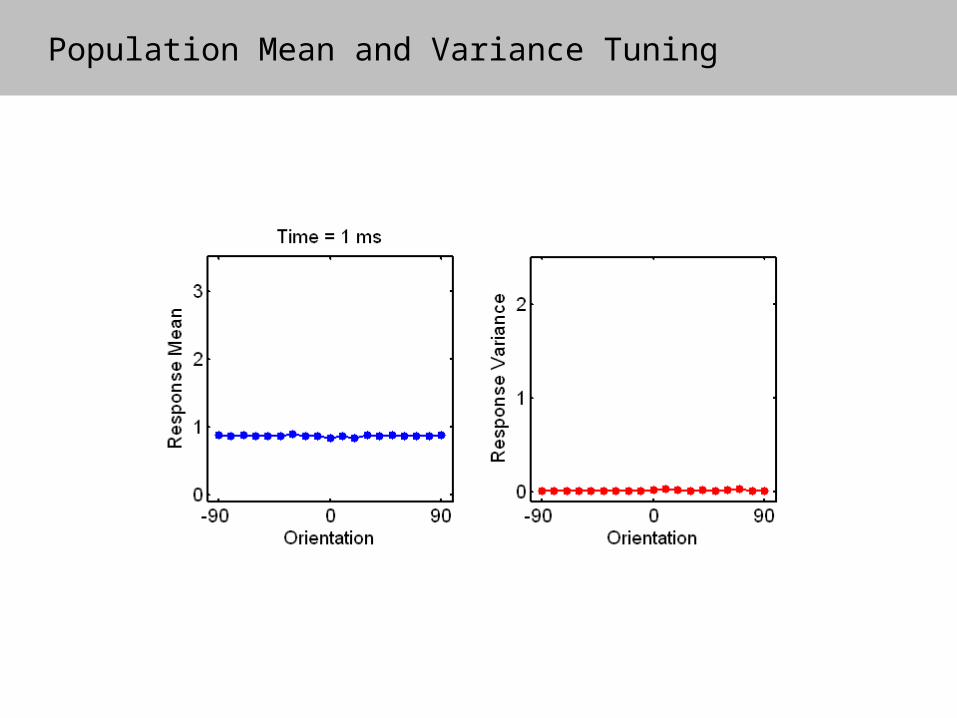
Population Mean and Variance Tuning
( )2,l s
( )2,l s
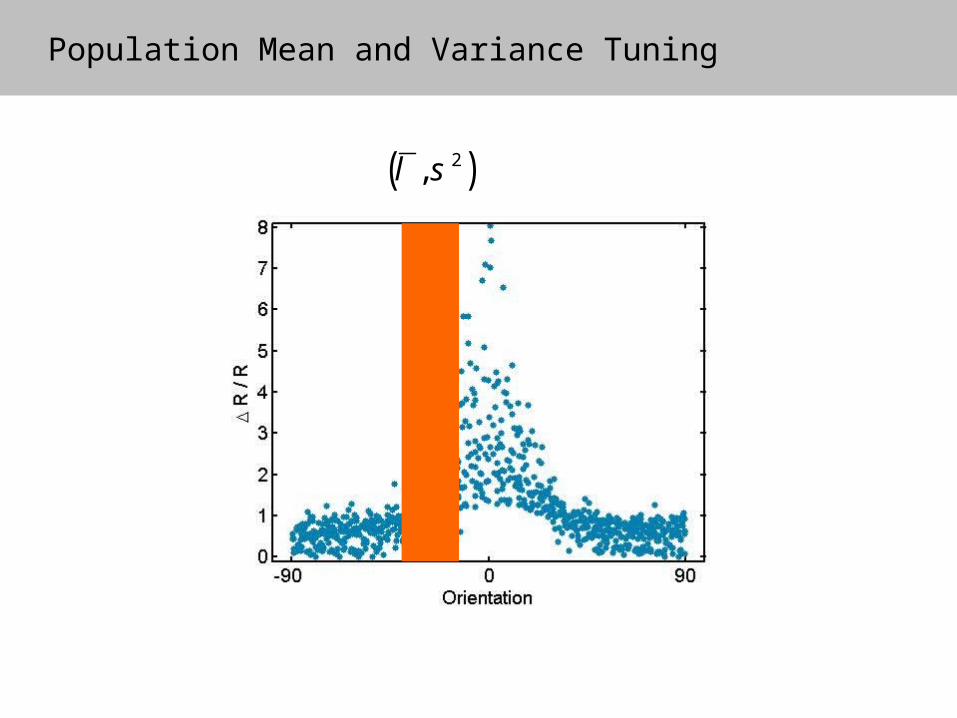
Population Mean and Variance Tuning
( )2,l s
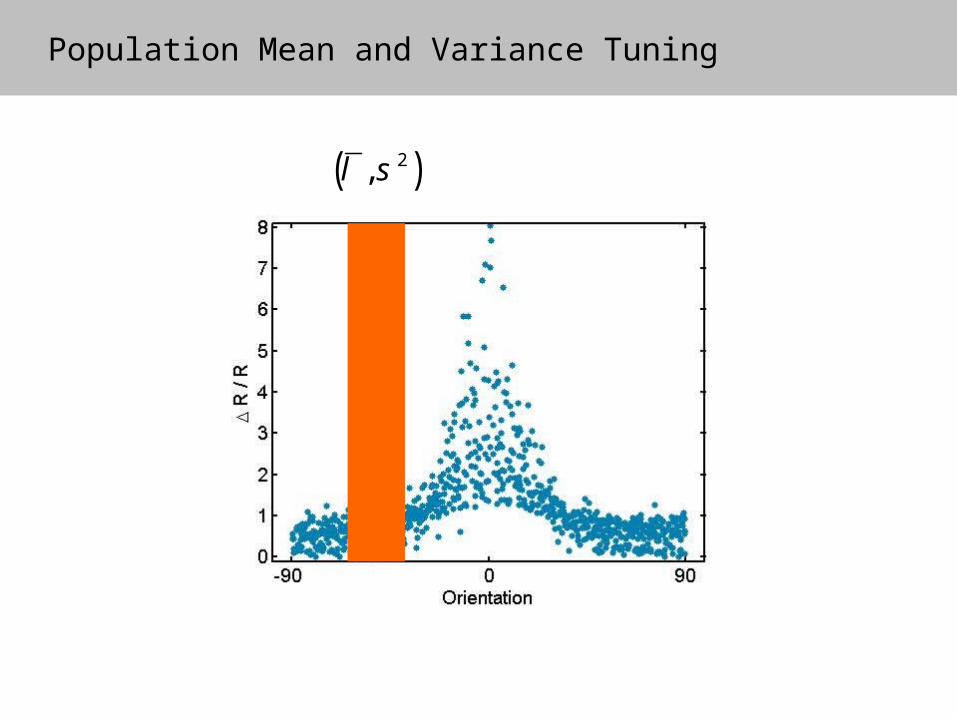
Population Mean and Variance Tuning
Population Mean and Variance Tuning
Population Mean and Variance Tuning
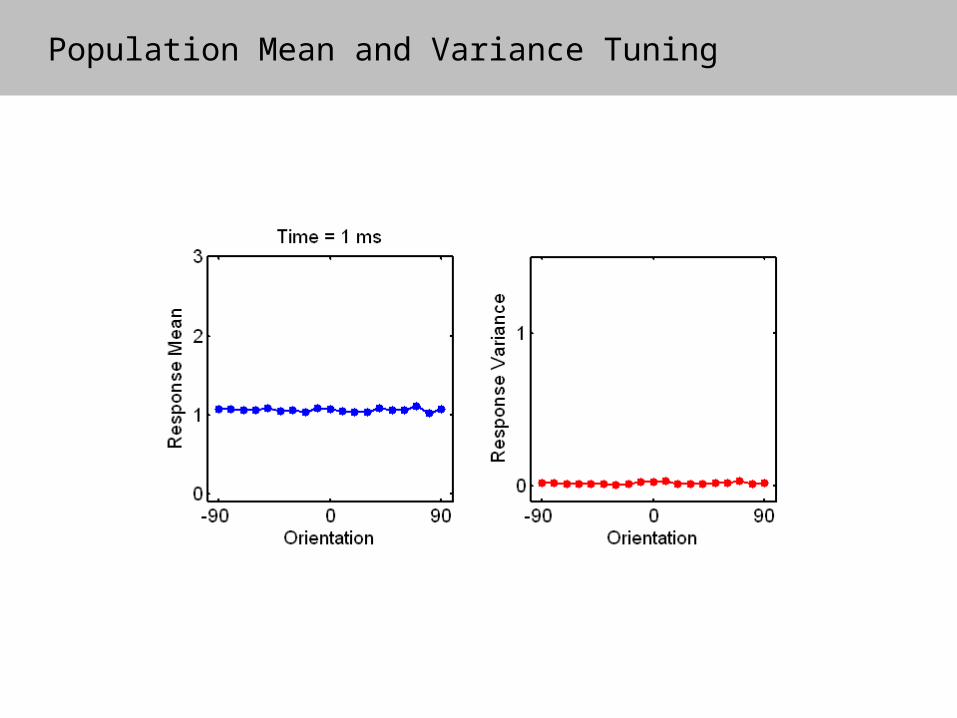
Population Mean and Variance Tuning
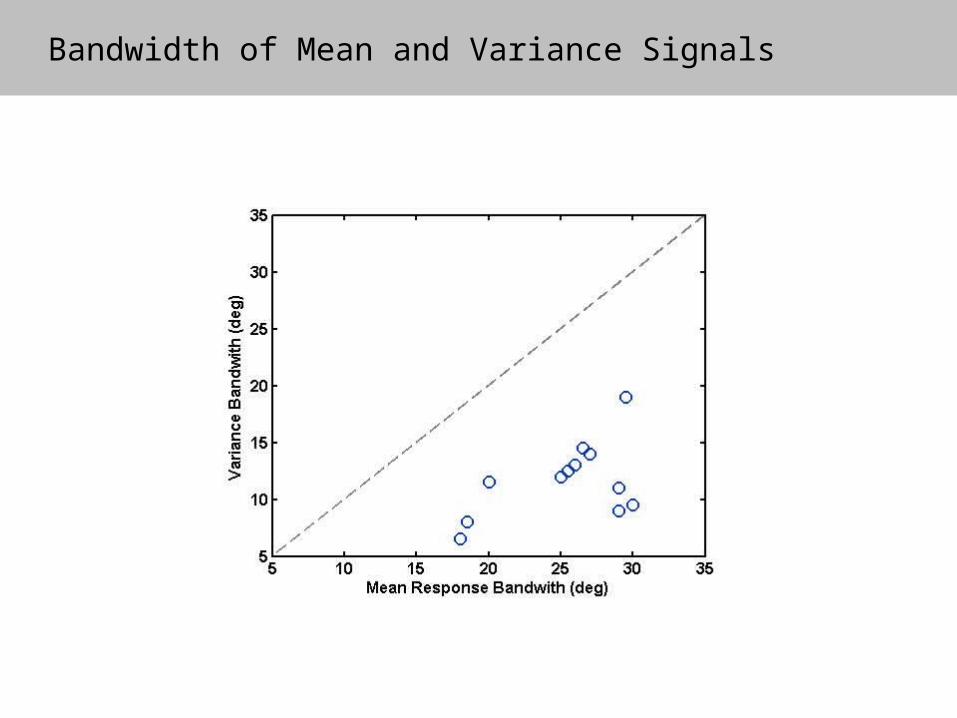
Bandwidth of Mean and Variance Signals
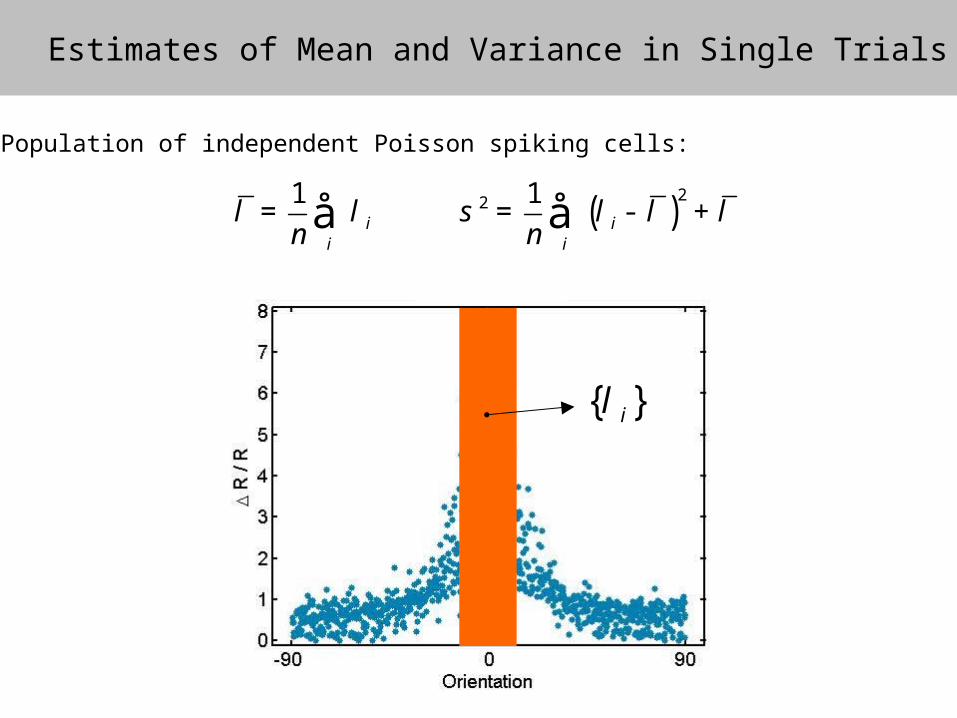
Estimates of Mean and Variance in Single Trials
1i
inl l= å ( )
22 1i
ins l l l= - +å
Population of independent Poisson spiking cells:
{ }il
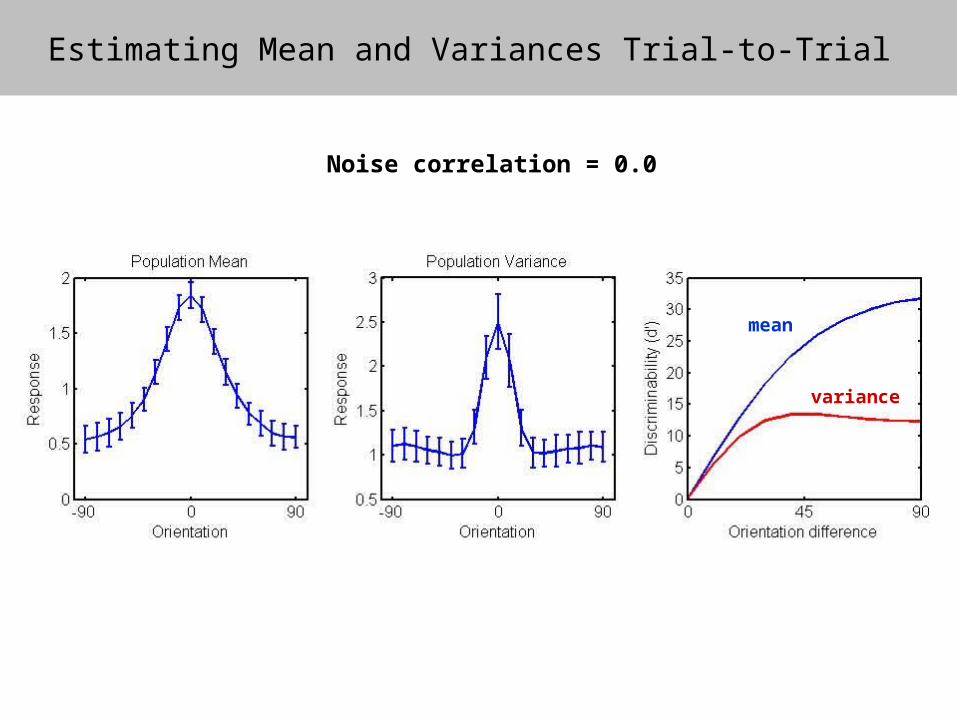
Estimating Mean and Variances Trial-to-Trial
mean
variance
Noise correlation = 0.0
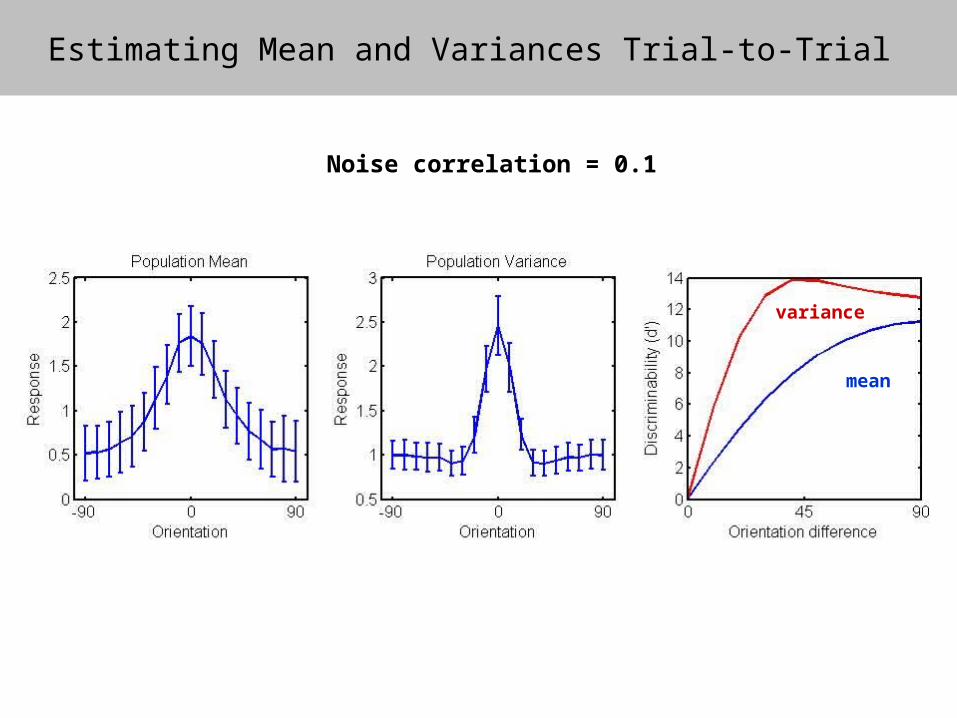
Estimating Mean and Variances Trial-to-Trial
mean
variance
Noise correlation = 0.1
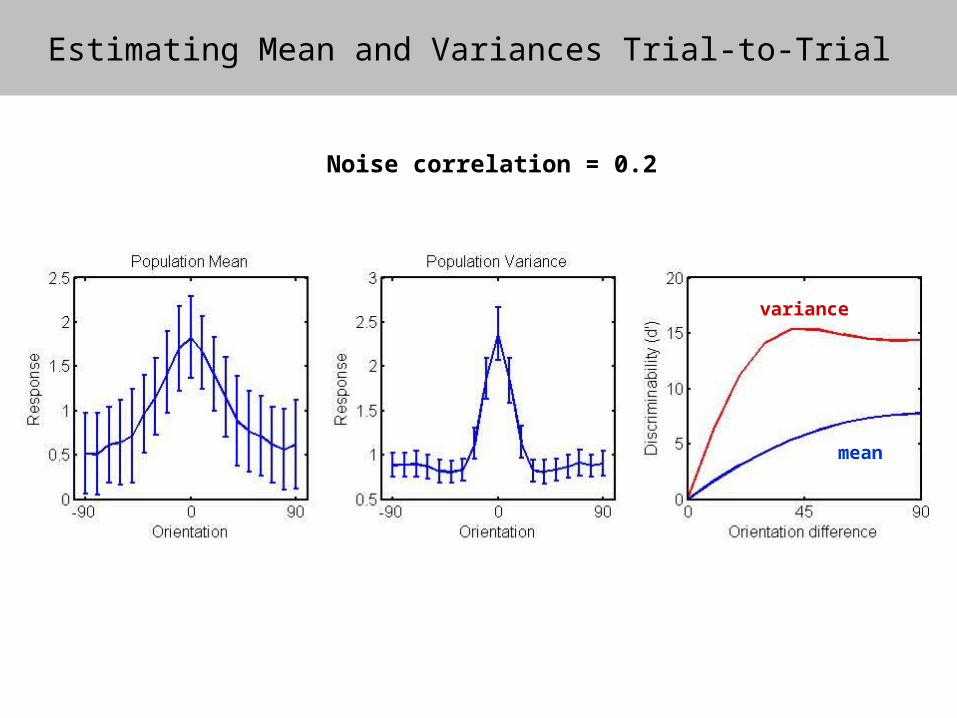
Estimating Mean and Variances Trial-to-Trial
mean
variance
Noise correlation = 0.2
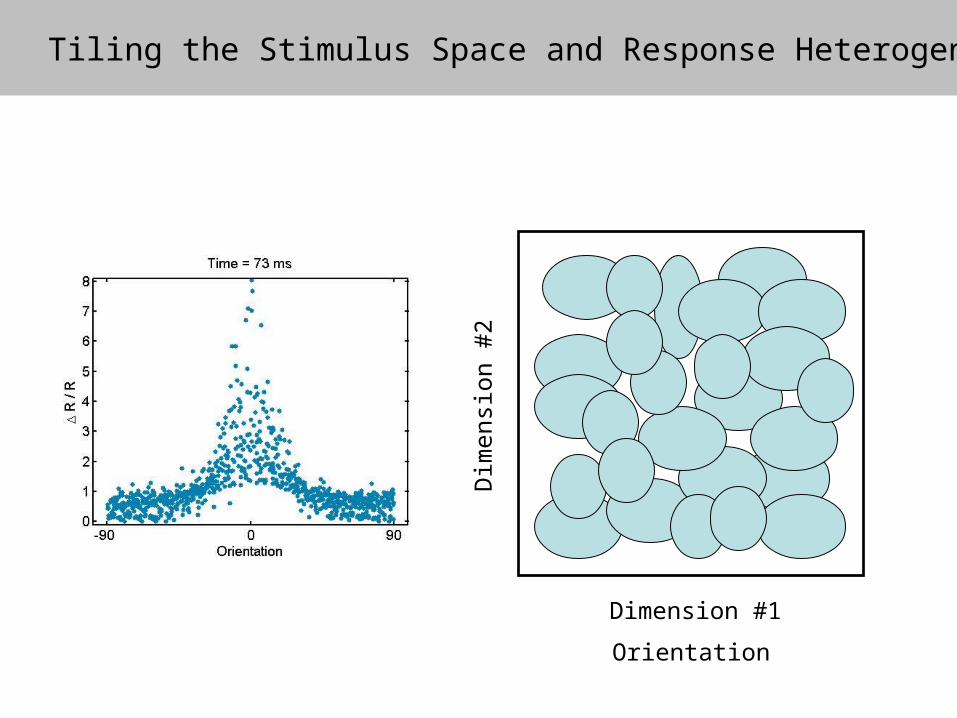
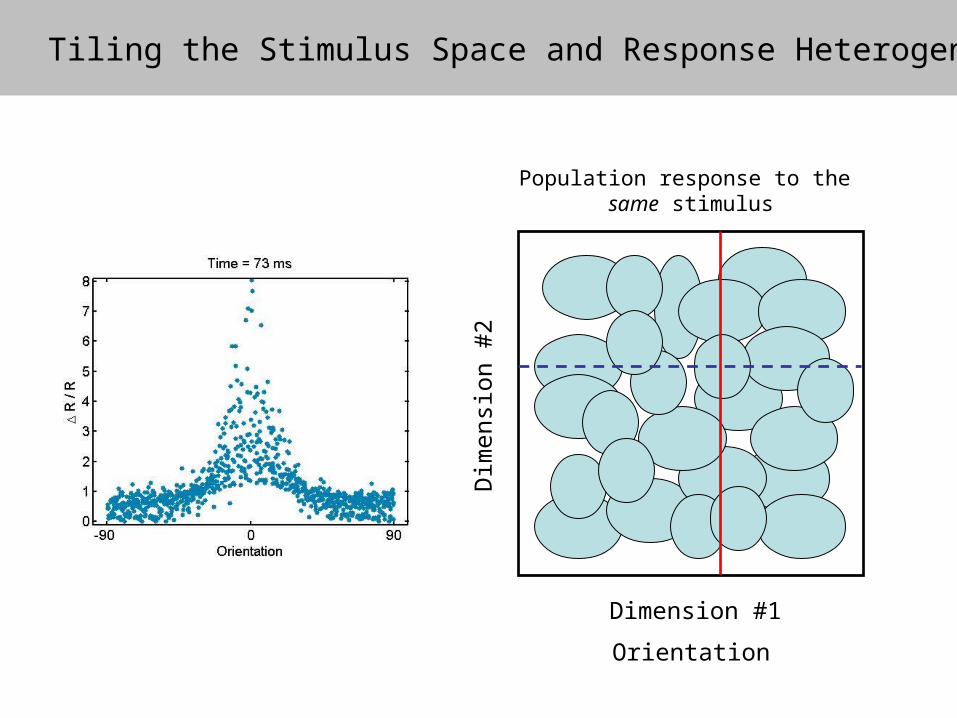
Tiling the Stimulus Space and Response Heterogeneity
Dimension #1
Dim
en
sion #
2
Orientation
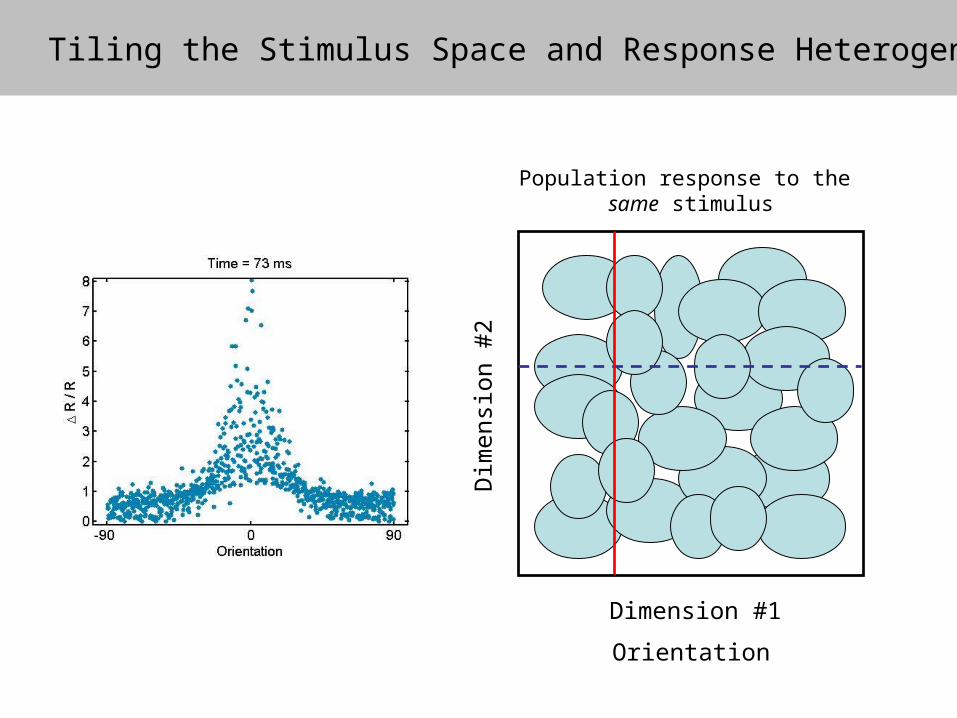
Tiling the Stimulus Space and Response Heterogeneity
Dimension #1
Dim
en
sion #
2
Orientation
Population response to the same stimulus
Tiling the Stimulus Space and Response Heterogeneity
Dimension #1
Dim
en
sion #
2
Orientation
Population response to the same stimulus
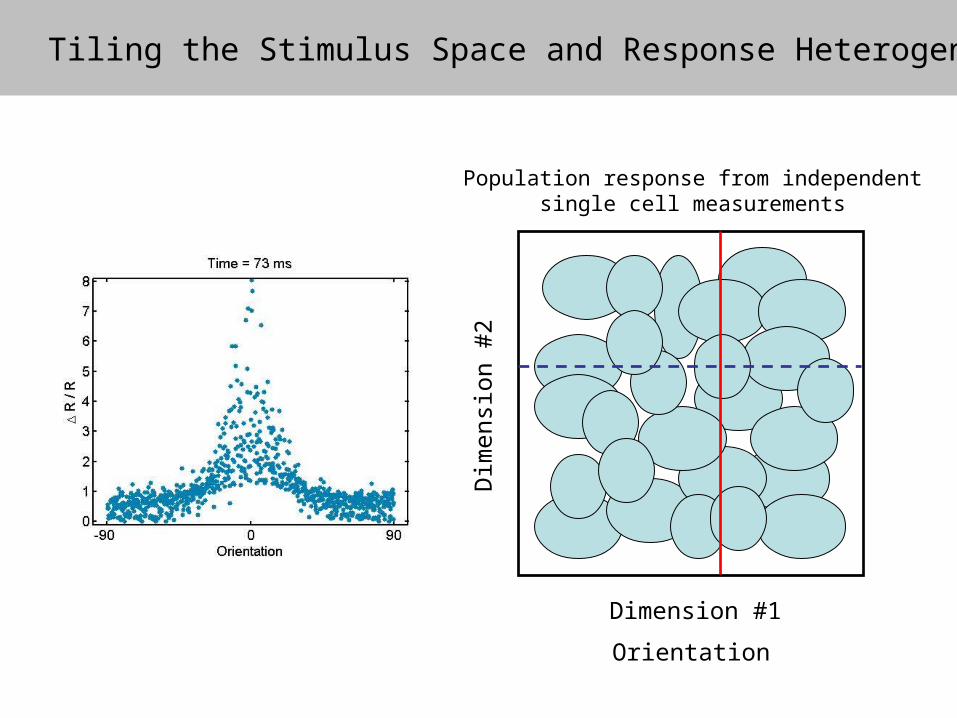
Tiling the Stimulus Space and Response Heterogeneity
Dimension #1
Dim
en
sion #
2
Orientation
Population response from independentsingle cell measurements
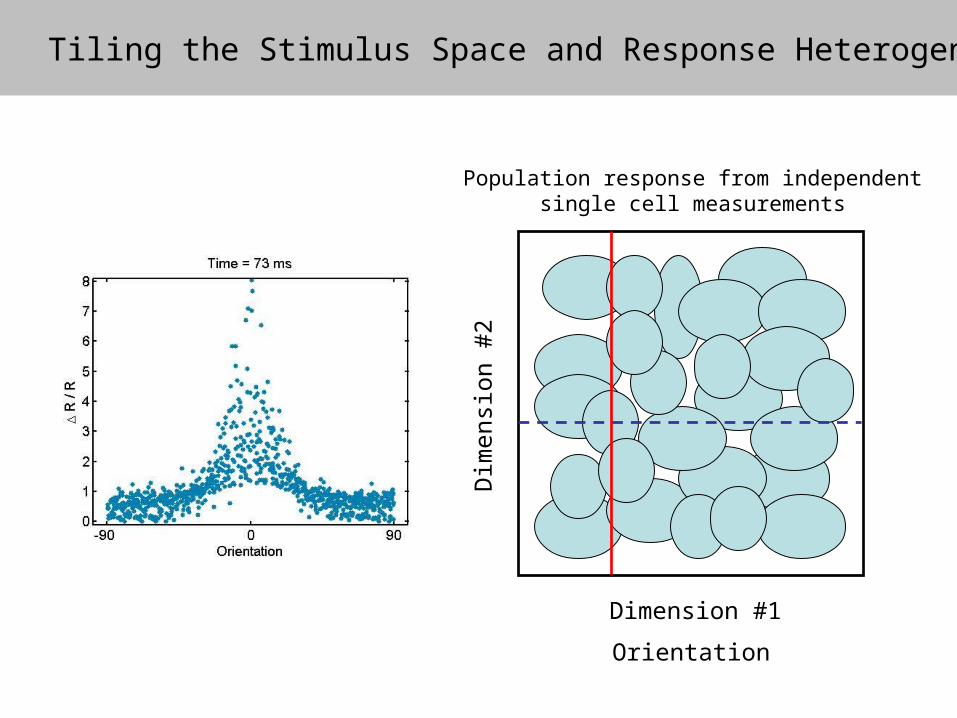
Tiling the Stimulus Space and Response Heterogeneity
Dimension #1
Dim
en
sion #
2
Orientation
Population response from independentsingle cell measurements
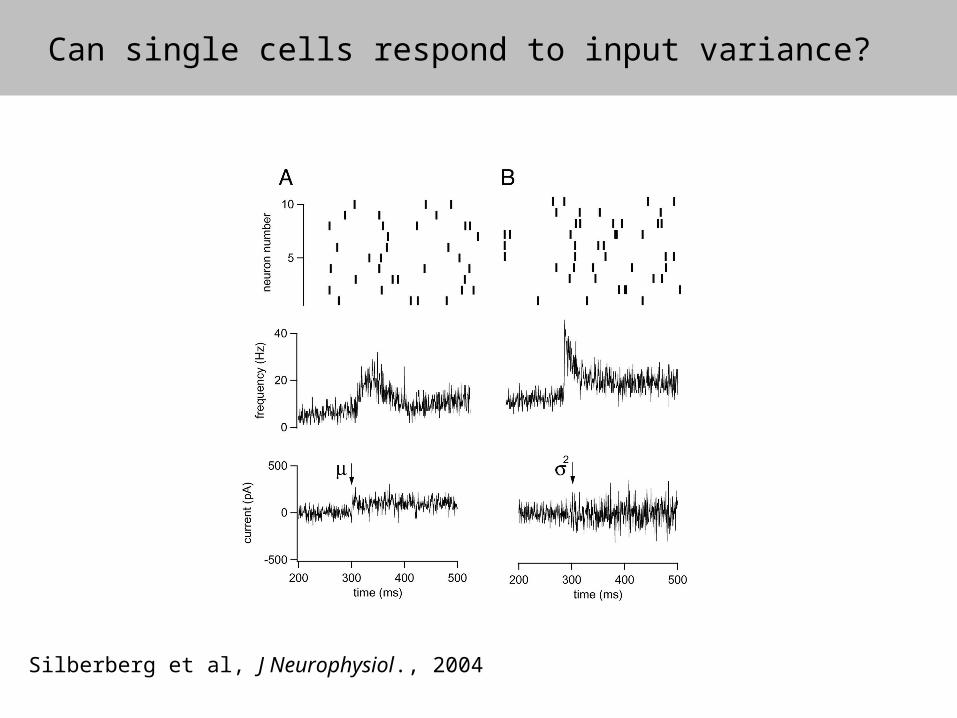
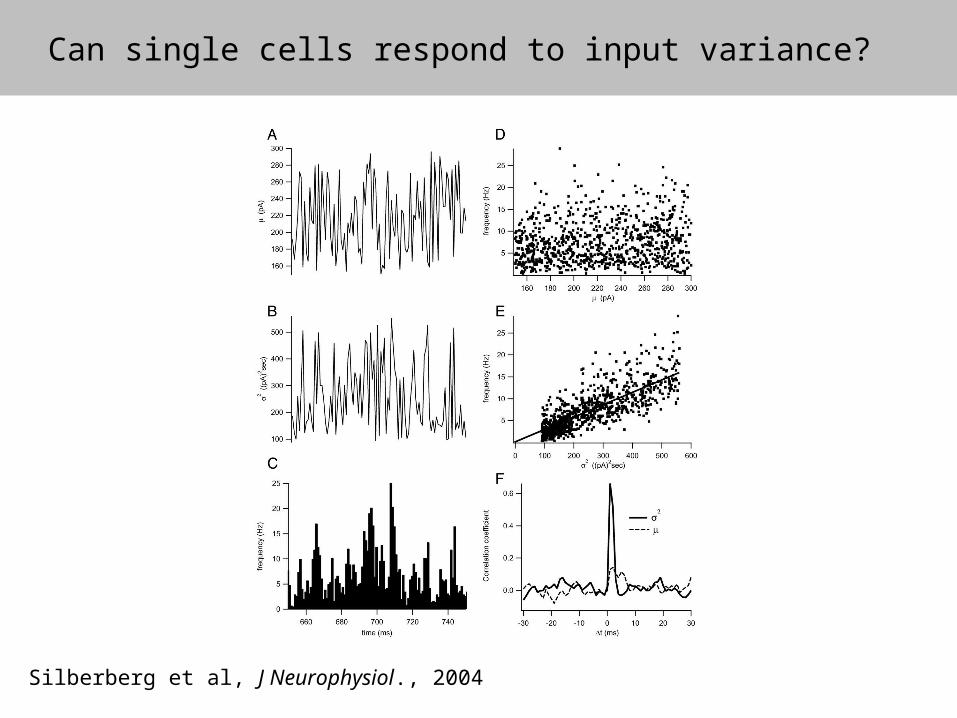
Silberberg et al, J Neurophysiol., 2004
Can single cells respond to input variance?
Can single cells respond to input variance?
Silberberg et al, J Neurophysiol., 2004
Summary
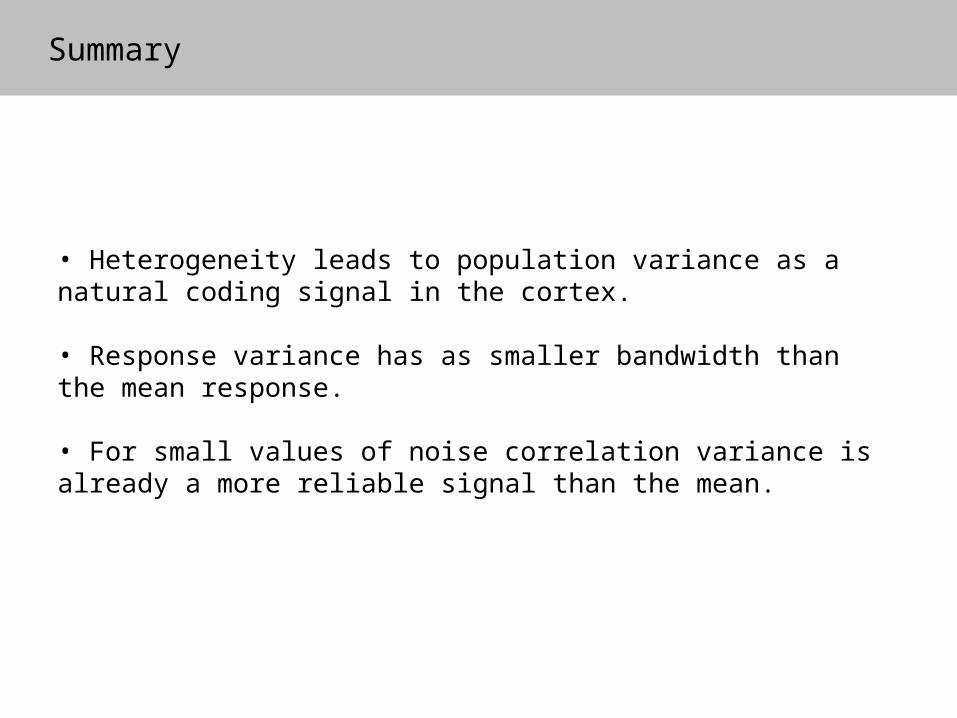
• Heterogeneity leads to population variance as a natural coding signal in the cortex.
• Response variance has as smaller bandwidth than the mean response.
• For small values of noise correlation variance is already a more reliable signal than the mean.
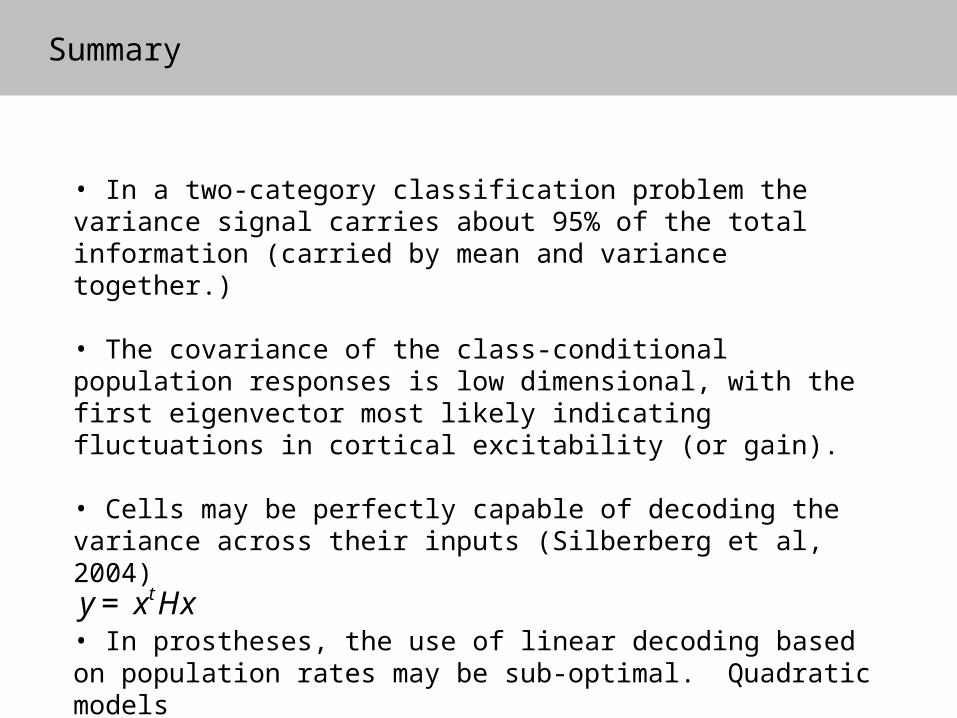
• In a two-category classification problem the variance signal carries about 95% of the total information (carried by mean and variance together.)
• The covariance of the class-conditional population responses is low dimensional, with the first eigenvector most likely indicating fluctuations in cortical excitability (or gain).
• Cells may be perfectly capable of decoding the variance across their inputs (Silberberg et al, 2004)
• In prostheses, the use of linear decoding based on population rates may be sub-optimal. Quadratic models may work better.
Summary
ty x Hx=
Acknowledgements
V1 imaging/electrophysiology (NIH/NEI)
Brian MaloneAndy HenrieIan Nauhaus
Topological Data Analysis (DARPA)
Gunnar Carlsson (Stanford)Guillermo Sapiro (UMN)Tigran Ishakov (Stanford)Facundo Memoli (Stanford)
Bayesian Analysis of Motion in MT (NSF/ONR)
Alan Yuille (UCLA)HongJing Lu (Hong Kong)
Neovision phase 2 (DARPA)
Frank Werblin (Berkeley)Volkan Ozguz (Irvine Sensors)Suresh Subramanian (Irvine Sensors)James DiCarlo (MIT)Bob Desimone (MIT)Tommy Poggio (MIT)Dean Scribner (Naval Research Labs)
Related Documents