Crack Instability in Ductile Materials Analyzed by the Method of Interpolated Ellipses by D. Vavrik and J. Zemankova ABSTRACT--The subject of this work is the description of the experimental "method of interpolated ellipses" (MIE) and its application in fracture mechanics studies. The MIE is a new technique based on the optical monitoring of deforma- tions during the loading processes of hexagonal grids of dots deposited on the surface of the monitored specimen. Load- ing the specimen deforms a circle on the surface into an el- lipse. Each ellipse is interpolated by six neighboring dots of the hexagonal grid. Knowledge of the ellipse parameters directly yields the magnitude and the direction of principal strains on the specimen surface. Principal strain evolution yields knowl- edge of evolution of the plastic strain field by numerical post- processing. Experimental results obtained from fracture tests of specimens with varying constraint at the crack tip have proven the evolution of plastic strain field to be a discontin- uous process. This has been shown to be especially the case at the decisive time interval just before crack instability occurs. KEY WORDS--Grid method, method of interpolated ellipses, plastic zones, thermodynamic fracture concept Introduction The "method of interpolated ellipses" (MIE) 1 has been used as an experimental tool in fracture mechanics studies. 2 The prediction ability for ductile materials of the Kj fracture cri- terion and the Sih strain energy density criterion were tested. The proposed concept based on the principle of the maximum energy dissipation rate (MEDR) 2 was also evaluated. Classi- cal fracture mechanics theories are based on the assumption that only a small plastic zone exists around the crack tip. How- ever, we show that under particular conditions an extensive plastic zone develops in ductile materials. The MEDR concept is based on the idea that all systems undergoing a flow of energy tend to the state of balance by the dissipation of energy as quickly as possible in accor- dance with the principle of maximum entropy production (MEDR). 3 Engineering materials dissipate potential energy through different mechanisms, from plastic yielding to the processes of reconstruction and damage of internal struc- ture. Energy dissipation through crack growth takes place at the moment when the energy dissipation rate of the preceding D. Vavrik ([email protected]) is a Sc&ntist and J. Zemankova is a Senior Scientist, Institute of Theoretical and Applied Mechanics, Czech Academy of Sciences, Prosecka 76, 19000, Prague 9, Czech Republic. Original manuscript submitted: March 28, 2001. Final manuscript received: February 25, 2004. DOI: 10.1177/001448511MIM6084 mechanism does not balance the work rate of external force. As a first approximation we assume the key mechanism of energy dissipation before crack instability to be the plastic work rate around the crack tip. An experimental method which would enable the quantifi- cation of the time evolution of plastic strain and the extremes of plastic work rate would have significant importance for the reasons indicated above. The proposed MIE technique enables direct experimental measurement of principal strain fields. The plastic strain field is calculated by numerical post- processing from these data. Although the MIE can only pro- vide information on the specimen surface, one can assume that surface behaviors reflect internal physical mechanisms. Principle of the Method of Interpolated Ellipses We assume that the surface deformation of a continuous material is approximately homogeneous inside a circle with initial radius r. Loading the specimen will deform a circle on the surface into an ellipse. Each ellipse is interpolated by six neighboring dots of a hexagonal grid, as shown in Fig. 1. Knowledge of the ellipse parameters yields the magnitude and direction of the principal in-plane strains el, ~2 on the specimen surface as engineering strains a-r b-r el -- , e2 ---- (1) F F and true strains a b 81 = In-, e2 = In . (2) r r The angle ~0in Fig. 1 represents the angular rotation of the local coordinate system of the principal strains in the exam- ined element (cell) relative to the global coordinate system XY. The Y-axis is oriented in the direction of the loading force. The local coordinate system xy is defined so that the y-axis is oriented in the direction of the principal strain e~ while the x-axis follows the direction of the principal strain e2. True strains are used in our calculations below. Principal strains are evaluated independently from the ori- entation of the global coordinate system without having to determine the shear strain. This is the main advantage of this approach, which becomes important especially in the situation when non-uniform strain fields surround the crack tip. The commonly used orthogonal grid can measure noise only under the condition of pure shear strain where the 2004 Society for Experimental Mechanics Experimental Mechanics 327

Welcome message from author
This document is posted to help you gain knowledge. Please leave a comment to let me know what you think about it! Share it to your friends and learn new things together.
Transcript
Crack Instability in Ductile Materials Analyzed by the Method of Interpolated Ellipses
by D. Vavrik and J. Zemankova
ABSTRACT--The subject of this work is the description of the experimental "method of interpolated ellipses" (MIE) and its application in fracture mechanics studies. The MIE is a new technique based on the optical monitoring of deforma- tions during the loading processes of hexagonal grids of dots deposited on the surface of the monitored specimen. Load- ing the specimen deforms a circle on the surface into an el- lipse. Each ellipse is interpolated by six neighboring dots of the hexagonal grid. Knowledge of the ellipse parameters directly yields the magnitude and the direction of principal strains on the specimen surface. Principal strain evolution yields knowl- edge of evolution of the plastic strain field by numerical post- processing. Experimental results obtained from fracture tests of specimens with varying constraint at the crack tip have proven the evolution of plastic strain field to be a discontin- uous process. This has been shown to be especially the case at the decisive time interval just before crack instability occurs.
KEY WORDS--Grid method, method of interpolated ellipses, plastic zones, thermodynamic fracture concept
Introduction
The "method of interpolated ellipses" (MIE) 1 has been used as an experimental tool in fracture mechanics studies. 2 The prediction ability for ductile materials of the Kj fracture cri- terion and the Sih strain energy density criterion were tested. The proposed concept based on the principle of the maximum energy dissipation rate (MEDR) 2 was also evaluated. Classi- cal fracture mechanics theories are based on the assumption that only a small plastic zone exists around the crack tip. How- ever, we show that under particular conditions an extensive plastic zone develops in ductile materials.
The MEDR concept is based on the idea that all systems undergoing a flow of energy tend to the state of balance by the dissipation of energy as quickly as possible in accor- dance with the principle of maximum entropy production (MEDR). 3 Engineering materials dissipate potential energy through different mechanisms, from plastic yielding to the processes of reconstruction and damage of internal struc- ture. Energy dissipation through crack growth takes place at the moment when the energy dissipation rate of the preceding
D. Vavrik ([email protected]) is a Sc&ntist and J. Zemankova is a Senior Scientist, Institute of Theoretical and Applied Mechanics, Czech Academy of Sciences, Prosecka 76, 19000, Prague 9, Czech Republic.
Original manuscript submitted: March 28, 2001. Final manuscript received: February 25, 2004. DOI: 10.1177/001448511MIM6084
mechanism does not balance the work rate of external force. As a first approximation we assume the key mechanism of energy dissipation before crack instability to be the plastic work rate around the crack tip.
An experimental method which would enable the quantifi- cation of the time evolution of plastic strain and the extremes of plastic work rate would have significant importance for the reasons indicated above. The proposed MIE technique enables direct experimental measurement of principal strain fields. The plastic strain field is calculated by numerical post- processing from these data. Although the MIE can only pro- vide information on the specimen surface, one can assume that surface behaviors reflect internal physical mechanisms.
Principle of the Method of Interpolated Ellipses
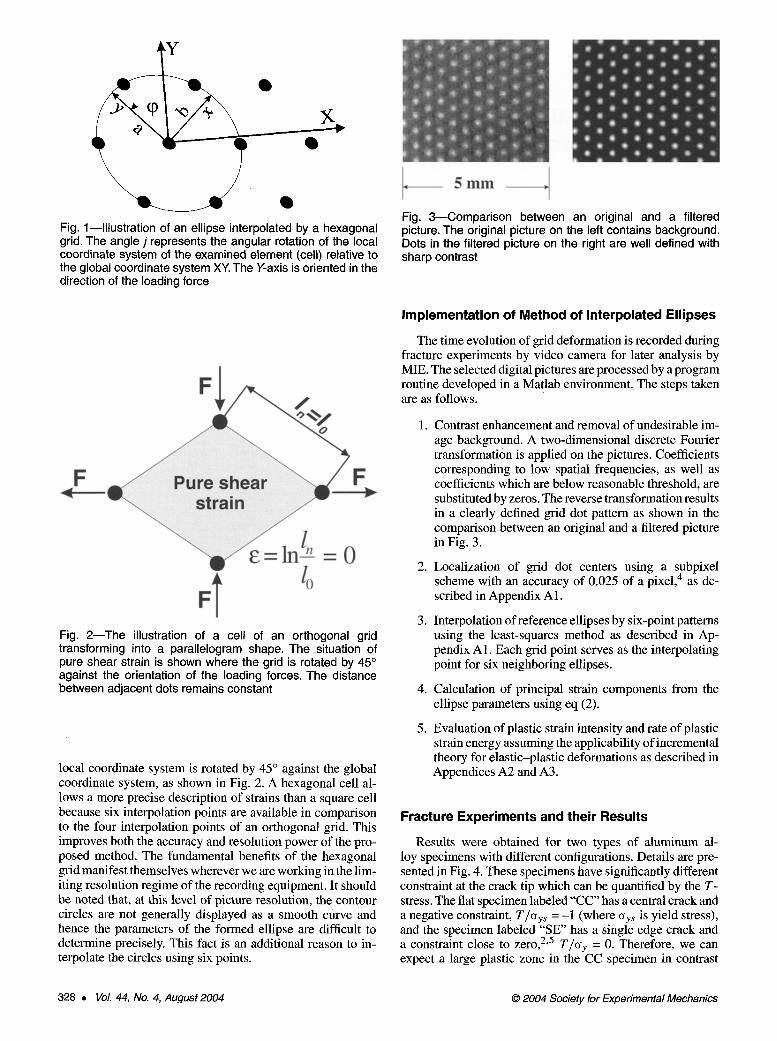
We assume that the surface deformation of a continuous material is approximately homogeneous inside a circle with initial radius r. Loading the specimen will deform a circle on the surface into an ellipse. Each ellipse is interpolated by six neighboring dots of a hexagonal grid, as shown in Fig. 1. Knowledge of the ellipse parameters yields the magnitude and direction of the principal in-plane strains el, ~2 on the specimen surface as
engineering strains
a - r b - r e l - - , e2 ---- ( 1 )
F F
and true strains
a b 81 = I n - , e2 = In . (2)
r r
The angle ~0 in Fig. 1 represents the angular rotation of the local coordinate system of the principal strains in the exam- ined element (cell) relative to the global coordinate system XY. The Y-axis is oriented in the direction of the loading force. The local coordinate system xy is defined so that the y-axis is oriented in the direction of the principal strain e~ while the x-axis follows the direction of the principal strain e2. True strains are used in our calculations below.
Principal strains are evaluated independently from the ori- entation of the global coordinate system without having to determine the shear strain. This is the main advantage of this approach, which becomes important especially in the situation when non-uniform strain fields surround the crack tip. The commonly used orthogonal grid can measure noise only under the condition of pure shear strain where the
�9 2004 Society for Experimental Mechanics Experimental Mechanics �9 327
X
Fig. I--Illustration of an ellipse interpolated by a hexagonal grid. The angle j represents the angular rotation of the local coordinate system of the examined element (cell) relative to the global coordinate system XY. The Y-axis is oriented in the direction of the loading force
F
to
Fig. 2--The illustration of a cell of an orthogonal grid transforming into a parallelogram shape. The situation of pure shear strain is shown where the grid is rotated by 45 ~ against the orientation of the loading forces. The distance between adjacent dots remains constant
local coordinate system is rotated by 45 ~ against the global coordinate system, as shown in Fig. 2. A hexagonal cell al- lows a more precise description of strains than a square cell because six interpolation points are available in comparison to the four interpolation points of an orthogonal grid. This improves both the accuracy and resolution power of the pro- posed method. The fundamental benefits of the hexagonal grid manifest themselves wherever we are working in the lim- iting resolution regime of the recording equipment. It should be noted that, at this level of picture resolution, the contour circles are not generally displayed as a smooth curve and hence the parameters of the formed ellipse are difficult to determine precisely. This fact is an additional reason to in- terpolate the circles using six points.
, 5 m m ,
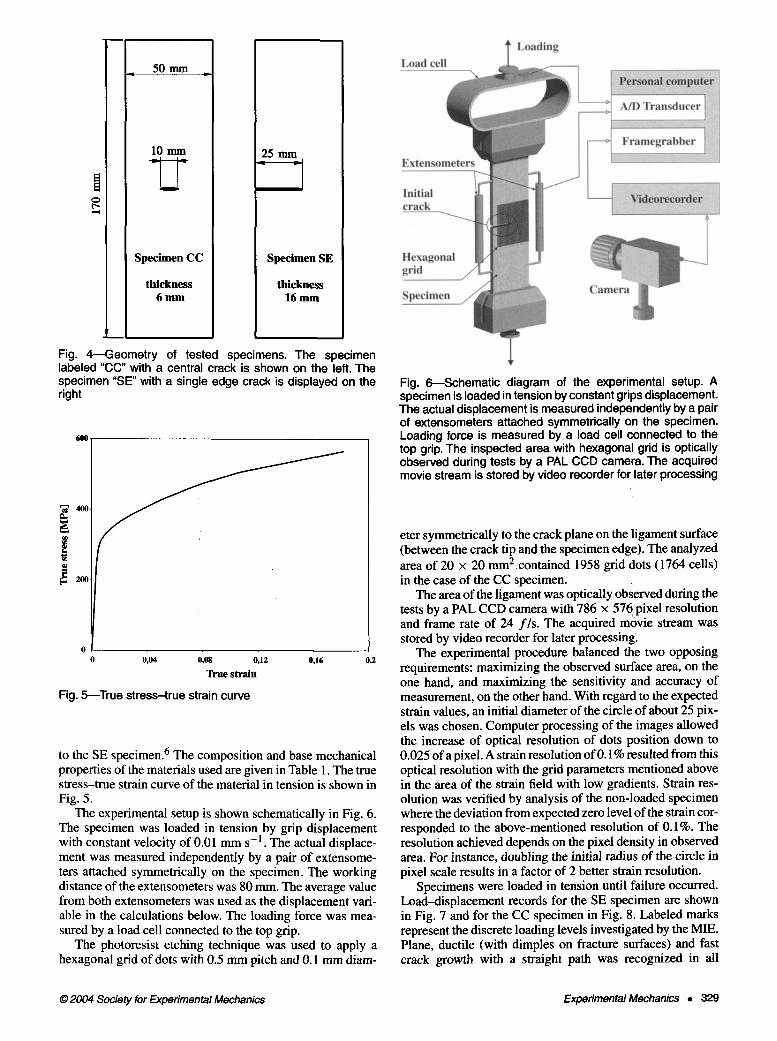
Fig. 3--Comparison between an original and a filtered picture. The original picture on the left contains background. Dots in the filtered picture on the right are well defined with sharp contrast
Implementation of Method of Interpolated Ellipses
The time evolution of grid deformation is recorded during fracture experiments by video camera for later analysis by MIE. The selected digital pictures are processed by a program routine developed in a Matlab environment. The steps taken are as follows.
1. Contrast enhancement and removal of undesirable im- age background. A two-dimensional discrete Fourier transformation is applied on the pictures. Coefficients corresponding to low spatial frequencies, as well as coefficients which are below reasonable threshold, are substituted by zeros. The reverse transformation results in a clearly defined grid dot pattern as shown in the comparison between an original and a filtered picture in Fig. 3.
2. Localization of grid dot centers using a subpixel scheme with an accuracy of 0.025 of a pixel, 4 as de- scribed in Appendix A1.
3. Interpolation of reference ellipses by six-point patterns using the least-squares method as described in Ap- pendix A 1. Each grid point serves as the interpolating point for six neighboring ellipses.
4. Calculation of principal strain components from the ellipse parameters using eq (2).
5. Evaluation of plastic strain intensity and rate of plastic strain energy assuming the applicability of incremental theory for elastic-plastic deformations as described in Appendices A2 and A3.
Fracture Experiments and their Results
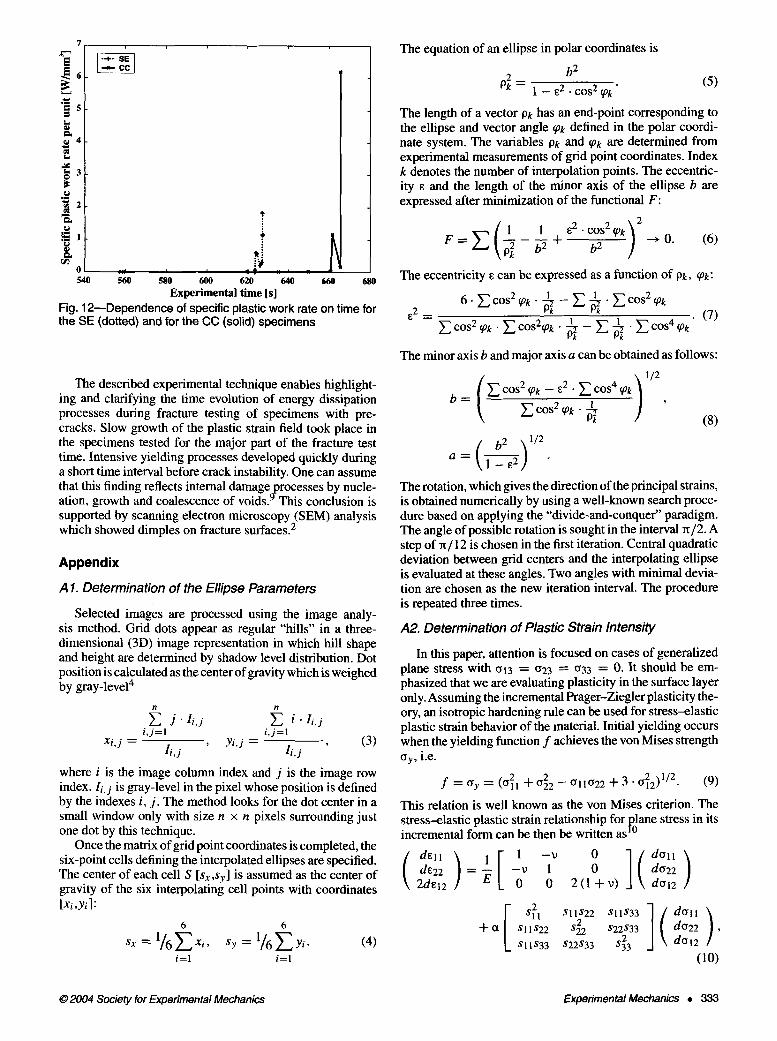
Results were obtained for two types of aluminum al- loy specimens with different configurations. Details are pre- sented in Fig. 4. These specimens have significantly different constraint at the crack tip which can be quantified by the T- stress. The fiat specimen labeled"CC" has a central crack and a negative constraint, T/cry s = - I (where ays is yield stress), and the specimen labeled "SE" has a single edge crack and a constraint close to zero, 2,5 T/~y = 0. Therefore, we can expect a large plastic zone in the CC specimen in contrast
328 �9 VoL 44, No. 4, August 2004 �9 2004 Society for Experimental Mechanics
p,.
50 mm
10 mm
Specimen CC
thickness 6 m m
25 mm
Specimen SE
thickness 16 m m
Fig. 4~Geometry of tested specimens. The specimen labeled "CC" with a central crack is shown on the left. The specimen "SE" with a single edge crack is displayed on the right
600
400
.=
J
0,04 0,08 0,12
True strain
Fig. 5~True stress-true strain curve
0,16 0,2
to the SE specimen. 6 The composition and base mechanical properties of the materials used are given in Table 1. The true stress-true strain curve of the material in tension is shown in Fig. 5.
The experimental setup is shown schematically in Fig. 6. The specimen was loaded in tension by grip displacement with constant velocity of 0.01 mm s -1 . The actual displace- ment was measured independently by a pair of extensome- ters attached symmetrically on the specimen. The working distance of the extensometers was 80 mm. The average value from both extensometers was used as the displacement vari- able in the calculations below. The loading force was mea- sured by a load cell connected to the top grip.
The photoresist etching technique was used to apply a hexagonal grid of dots with 0.5 mm pitch and 0.1 mm diam-
Fig. 6--Schematic diagram of the experimental setup. A specimen is loaded in tension by constant grips displacement. The actual displacement is measured independently by a pair of extensometers attached symmetrically on the specimen. Loading force is measured by a load cell connected to the top grip. The inspected area with hexagonal grid is optically observed during tests by a PAL CCD camera. The acquired movie stream is stored by video recorder for later processing
eter symmetrically to the crack plane on the ligament surface (between the crack tip and the specimen edge). The analyzed area of 20 x 20 mm2 contained 1958 grid dots (1764 cells) in the case of the CC specimen.
The area of the ligament was optically observed during the tests by a PAL CCD camera with 786 x 576 pixel resolution and frame rate of 24 f ls . The acquired movie stream was stored by video recorder for later processing.
The experimental procedure balanced the two opposing requirements: maximizing the observed surface area, on the one hand, and maximizing the sensitivity and accuracy of measurement, on the other hand. With regard to the expected strain values, an initial diameter of the circle of about 25 pix- els was chosen. Computer processing of the images allowed the increase of optical resolution of dots position down to 0.025 ofa pixel. A strain resolution of 0.1% resulted from this optical resolution with the grid parameters mentioned above in the area of the strain field with low gradients. Strain res- olution was verified by analysis of the non-loaded specimen where the deviation from expected zero level of the strain cor- responded to the above-mentioned resolution of 0.1%. The resolution achieved depends on the pixel density in observed area. For instance, doubling the initial radius of the circle in pixel scale results in a factor of 2 better strain resolution.
Specimens were loaded in tension until failure occurred. Load-displacement records for the SE specimen are shown in Fig. 7 and for the CC specimen in Fig. 8. Labeled marks represent the discrete loading levels investigated by the MIE. Plane, ductile (with dimples on fracture surfaces) and fast crack growth with a straight path was recognized in all
�9 2004 Society for Experimental Mechanics Experimental Mechanics �9 329

Si Fe Ni 0.17 0.26 0.09
60-
50.
lO.
40.
30.
..~
20-
0~ o 0,1 0,2 0,3 0,4 0,5 0,6
TABLE 1--BASE MECHANICAL PROPERTIES AND COMPOSITION OF THE AI ALLOY USED
Elastic modulus E = 70 GPa AI Cu Mg Mn Zn Yield stress ~ys = 296 MPa 92.1 4.9 1.6 0.85 0.03 Poisson ratio IX = 0.315
Displacement [mm]
Fig. 7--Experimental load-displacement records for speci- men SE. Labeled marks represent loading levels investigated by the MIE
80
60
40
..~
20
0 0.1 0.2 0.3 0.4 0.5 0.6 0.7 0.8
Displacement [nun]
Fig. 8--Experimental load-displacement records for speci- men CC
specimens regardless of constraint at the crack tip and spec- imen thickness. No slow stable crack growth was observed.
The prediction ability of the "classical" fracture parameter Kj, the Sih 7 criteria, and of the MEDR concept were com- pared with experimentally determined fracture loads. The Kj values were calculated from Jlc integral values for both spec- imen types. 2 The tested prediction of fracture instability by the S-criterion (Sih) for specimen CC was taken from Thireos and Gdoutos 8 where an equivalent material and specimen type have been used. This prediction was not performed for the SE specimen in Thireos and Gdoutos. 8
The prediction based on a one-parameter fracture mechan- ics approach was satisfactory for the SE specimen only. The- oretical fracture stress (YfrK (theoretical loading force FfrK divided by the cross-section area outside a crack plane) pre- dicted by the one-parameter fracture mechanics Kj criteria exhibited a deviation of 15% from the experimental fracture stress CrfrE. On the other hand, the predicted fracture stress (YfrK w a s tWO times larger than the experimental fracture stress CrfrE for the CC specimen. The numerically predicted fracture stress ~frS for crack instability from the Sih criterion 2 agreed with a deviation of about 11% from experimental fracture stress C3fr E for the CC specimen. See Table 2 for comparison of theoretical predictions and experimental results. Although slow stable crack growth preceding fast instability was pre- dicted in Thireos and Gdoutos, 8 this effect was not observed in our experiments.
The influence of crack configuration on the shape of the plastic zone around the crack tip was confirmed. It has been also confirmed that plasticity near the crack tip develops in
6 agreement with the prediction of constraint effect. The plas- tic zone reached 1/2 of the ligament for the SE specimen with high constraint at the moment of crack instability as
seen in loading level 9 in Fig. 9. On the other hand, the plas- tic zone surrounding the crack tip in the CC specimen with low constraint extended almost through the whole ligament at the moment of crack instability, as seen in loading level 8 in Fig. 10.
Detailed analysis of plastic strain evolution was per- formed in order to verify the proposed thermodynamic MEDR fracture concept. Although the test bodies were loaded monotonically and slowly (grip displacement velocity was 0.01 mm s- l ) , the plastic strain evolution near the crack tip exhibited a discontinuous character in the crucial seconds preceding crack instability. Plastic zone shape and intensity grew continuously up to the boundary restricted by constraint until reaching the moment of maximum loading force as seen in loading levels 1-6 in Fig. 9 (for specimen SE) and loading levels 1--6 in Fig. 10 (for the specimen CC). After reaching this point, the plastic zone shape changed only slightly but its intensity grew dramatically and suddenly in the vicinity of the crack tip. The last evaluated loading level corresponds to the crack instability as seen in loading level 8 (for the CC specimen) and loading level 9 (for the SE specimen). The maximal level of plastic strain intensity was 12.4% for the CC specimen and 11.8% for the SE specimen at this instant. The rupture of a specimen occurred in the next video frame (1/24 s later). The assumption of a nearly homogenous de- formation inside an ellipse was not fulfilled precisely in the three cells nearest to the crack tip at this loading level. Max- imum deviation from the regular ellipse shape occurred in the cell nearest to the crack tip. The approximation by means of ellipses satisfactorily described local deformations in the area outside of aforementioned three cells.
The above-mentioned time nonlinearity of plastic strain evolution can be illustrated by the time increments of the
330 �9 VoL 44, No. 4, August 2004 �9 2004 Society for Experimental Mechanics

TABLE 2~OMPARISON OF THEORETICAL PREDICTION AND EXPERIMENTAL RESULTS FOR FRACTURE STRESSES Experimental Fracture Stress Fracture Stress
Fracture crfr K Predicted (~frS Predicted Specimen Stress (Sfr E T/ay by Kj Criteria by S Criteria
CC 265.3 MPa -1 491 MPa 267 MPa SE 65 MPa 0 56.5 MPa - -
-5 loading level 1 loading level 2
2"I loading level 3
0 5 10 15 20 25 5 10 15 20 5 10 15 20 25 X [mm]
-5
,r
loading level 4 loading level 5 loading level 6
o
0 5 10 15 20 25 0 5 10 15 20 25 0 5 10 15 20 25
Ioadinq level 7 Ioadina level 8 Ioadin(] level 9
0 5 10 15 20 25 0 5 10 15 20 25 0 5 10 15 20 25
--ip 0 1 2 3 4 5 6 7 8 9 10
Fig. 9---Time development of plastic zone in specimen SE. The plastic zone reached 50% of the ligament width at the moment of crack instability (loading level 9). The axes in the subfigures have millimeter units. The coordinates [0,0] correspond to the initial crack tip. Contour levels represent the plastic strain levels in a percent scale
plastic strain field during increasing load, as shown in Fig. 11 for the CC specimen. The original "butterfly" of the plastic zone disappeared after reaching the maximum loading force at loading level 6. The new, smaller intensive zone shifted in the last stage of loading process, loading levels 7 and 8. The highest intensity of the plastic strain field increment was observed just in front of the crack tip in loading level 8. This zone corresponds to maximal triaxiality of stress inside the specimen and indicates a damage zone inducted by hydro- static stress. 9 Similar processes were observed in the case of the SE specimen.
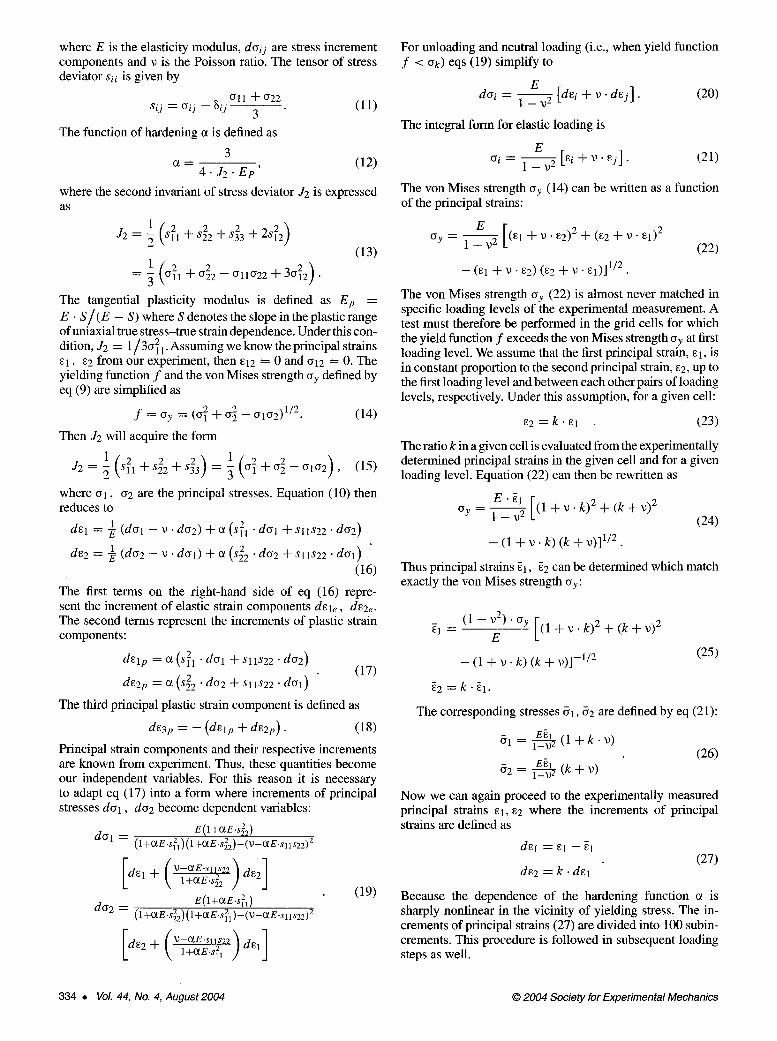
The calculated dependence of the specific plastic work rate (see eq (34) in Appendix A3) calculated over all cells in the surface layer versus time exhibited two extremes. The first extreme appeared at the moment of reaching the maxi- mum loading force (plastic instability). The second extreme occurred at the moment of crack growth initiation, as illus- trated in Fig. 12.
C o n c l u s i o n s
The experimental MIE presented in this paper has high- resolution ability for a large range of measurement deforma- tions (from 0.1% to 17% of principal strain in the example presented).
The stress-strain field was shown to be highly dependent on the specimen type due to the constraint effect. The com- mon characteristic feature for both tested specimens was the rapid increase of specific plastic work rate in a short time interval before crack instability.
Experimentally measured surface strains were used as the basis for the identification of specific plastic work rate in the surface layer of the analyzed specimens. Regardless of the type of the specimens, two time extremes were found as a function of specific plastic work rate. One extreme related to the maximum loading force. Another extreme related to the fracture load (fracture instability) in the experiment.
�9 2004 Society for Experimental Mechanics Experimental Mechanics �9 331

:I lO
0
loading level 1
5 10 15 X [mm]
loading level 2 -1~l -10
-
.25
5 I 0.25 0.25
10 '- 10 '
loading level 3 loading level 4 -10
-5
0
5
10 0 20 0 5 10 15 20 0 5 10 15 20 15 20
O. 5
0.25
0.25
0.25
5 10
loading level 5 -10
0.25 0.25
~ 0 0.25
7 0.25
5
10 0 5 10
X [rnrn] 15 20 0
loading level 6 -10
-5
0
loading level 7 loading level 8
5
10 5 10 15 20 0 5 10 15 20 0 5 10 15 20
s ~ip 0 I 2 a 4 5 S 7 a ~) lo
Fig. lO- -T ime development of plastic zone in specimen CC. The plastic zone reached 90% of the ligament width at the moment of crack instability, as seen in loading level 8
-10
-5
EO >-
10
loading level 1
5 10 15 20 X [mrn]
loading level 2 -10
-5
o ~,~.2
5
10 0 5 10 15 20
loading level 3 -10
-5 0.2
0 ifr-o.2 .2
5
10 5 10 15
-10
-5
0
loading level 4
f f
10
(~o~ ~--~o.~
20 0 5 10 15 20
-lO
-5
>-
5
10 0
loading level 5
/
0.2
5 10 15 20 X [mm]
-10
-5
0
loading level 6
5
10 0 5
0.2
' ~ 0 . 2
10 15 20
loading level 7 -10 1
-5 { o~/~ '~ 2
5
2
10 0 5 10 15
-10
-5
loading level 8
o
5 t
lol 20 0 5 10 15 20
ip 0 0.5 1 1.5 2 2.5 3 3.5
Fig. 11- -T ime increments of the plastic strain field under increasing loading for the specimen CC
332 �9 Vol. 44, No. 4, August 2004 �9 2004 Society for Experimental Mechanics
5 t~ e~ ~ 4
~3
_~2
N1 r~
0 56O 680
T t
580 600 620 640 660 E ~ e r ~ e n t M time [s]
Fig. 12--Dependence of specific plastic work rate on time for the SE (dotted) and for the CC (solid) specimens
The described experimental technique enables highlight- ing and clarifying the time evolution of energy dissipation processes during fracture testing of specimens with pre- cracks. Slow growth of the plastic strain field took place in the specimens tested for the major part of the fracture test time. Intensive yielding processes developed quickly during a short time interval before crack instability. One can assume that this finding reflects internal damageprocesses by nucle- ation, growth and coalescence of voids, u This conclusion is supported by scanning electron microscopy (SEM) analysis which showed dimples on fracture surfaces. 2
Appendix
A 1. Determination of the Ellipse Parameters
Selected images are processed using the image analy- sis method. Grid dots appear as regular "hills" in a three- dimensional (3D) image representation in which hill shape and height are determined by shadow level distribution. Dot position is calculated as the center of gravity which is weighed by gray-level 4
n
j . li,j k i . Ii,j i,j=l i,j=l
Xi,j -- Ii,j , Yi,j -- ii,j , (3)
where i is the image column index and j is the image row index. Ii, j is gray-level in the pixel whose position is defined by the indexes i, j . The method looks for the dot center in a small window only with size n x n pixels surrounding just one dot by this technique.
Once the matrix of grid point coordinates is completed, the six-point cells defining the interpolated ellipses are specified. The center of each cell S [Sx,Sy] is assumed as the center of gravity of the six interpolating cell points with coordinates [xi,yi]:
6 6 Sx --- 1/6 Z xi, sy = 1/6 E Yi. (4)
i = 1 i = 1
The equation of an ellipse in polar coordinates is
b 2 ~ = 1 - ~2. cos 2 ~ok" (5)
The length of a vector Ok has an end-point corresponding to the ellipse and vector angle tpk defined in the polar coordi- nate system. The variables Ok and tp, are determined from experimental measurements of grid point coordinates. Index k denotes the number of interpolation points. The eccentric- ity e and the length of the minor axis of the ellipse b are expressed after minimization of the functional F:
( l l e 2 " C O S 2 t p k ) 2 ~ k 2 b 2 b 2 F = Z + --~ 0. (6)
The eccentricity ~ can be expressed as a function of Ok, tpk:
1 1 6. E co s2 - E E cos2 8 2 = ( 7 )
1 1 " E COS2 ~ 0k" E COS2~0k " ~kk -- E pk2" E COS4 (ilk
The minor axis b and major axis a can be obtained as follows:
b (ZCOS2tpk--~'2"-~I---COS4~kl 1/2
(8) ( b2 ~1/2
a = ~,1 --e2J "
The rotation, which gives the direction of the principal strains, is obtained numerically by using a well-known search proce- dure based on applying the "divide-and-conquer" paradigm. The angle of possible rotation is sought in the interval ~/2. A step of 7t/12 is chosen in the first iteration. Central quadratic deviation between grid centers and the interpolating ellipse is evaluated at these angles. Two angles with minimal devia- tion are chosen as the new iteration interval. The procedure is repeated three times.
A2. Determinat ion of Plast ic Strain Intensity
In this paper, attention is focused on cases of generalized plane stress with c~13 = a23 ---- o33 = 0. It should be em- phasized that we are evaluating plasticity in the surface layer only. Assuming the incremental Prager-Ziegler plasticity the- ory, an isotropic hardening rule can be used for stress-elastic plastic strain behavior of the material. Initial yielding occurs when the yielding function f achieves the von Mises strength Oy, i.e.
= O 2 ) 1 / 2 f =Gy ((~21 +(122--~11Cr22 + 3 " 12 " (9)
This relation is well known as the yon Mises criterion. The stress-elastic plastic strain relationship for ~ane stress in its incremental form can be then be written as
o ](,o,,) de22 = -~ - v 1 0 do22 2del2 0 0 2 (1 + '0) dtrl2
[ ,,,,22 s,,s33](,o1,) + 0t s 11 s22 s22 S22s33 d(r22 ,
s 1 1 s 3 3 $22s33 -$23 d(~12
(lO)
�9 2004 Society for Experimental Mechanics Experimental Mechanics �9 333
where E is the elasticity modulus, d(1ij are stress increment components and v is the Poisson ratio. The tensor of stress deviator sii is given by
(111 + (122 sij = (1ij - aij 3 (11)
The function of hardening c~ is defined as
3 ct - (12)
4 . J 2 . E p '
where the second invariant of stress deviator ,/2 is expressed as
1 (41 + 42 + 43 + 2,122) J 2 = ~
(13)
= ! ((121 + (122 _ (111(122 + 3(122). 3
The tangential plasticity modulus is defined as E p =
E �9 S / ( E - S) where S denotes the slope in the plastic range of uniaxial true stress-true strain dependence. Under this con- dition, J2 = 1/3(1121 �9 Assuming we know the principal strains el , 82 from our experiment, then 812 = 0 and (112 = 0. The yielding function f and the von Mises strength Cry defined by eq (9) are simplified as
f = (1y = ((12 + (12 _ (11(12)1/2. (14)
Then ,/2 will acquire the form
j 2 = ~ l (s21 +s222 + 8 2 3 ) = 31((12 q_ cr2 -- (11(12) , (15)
where (11, (12 are the principal stresses. Equation (10) then reduces to
d81 = 1 (d(11 - u-dcr2) + ct (s21 �9 d(11 + S,lS22. d(12)
dee = ~ (d(12 - v . d(11) + c~ (s22 .doe + ' 11 ' 22" d(11) (16)
The first terms on the right-hand side of eq (16) repre- sent the increment of elastic strain components dSle , de2e. The second terms represent the increments of plastic strain components:
d e l p = (2 ($21 �9 d(11 + SllS22 " d(12) (17)
d 8 2 p ------ (~ ($22 "d(12 + Sl1S22" d(11)
The third principal plastic strain component is defined as
d83p = - (d81p -'}- d82p) . (18)
Principal strain components and their respective increments are known from experiment. Thus, these quantities become our independent variables. For this reason it is necessary to adapt eq (17) into a form where increments of principal stresses d(11, d(12 become dependent variables:
E(l +etE.s22) 2 2 2 d(11 = (1+Ot.E.Sll)(1+OlE.s22)_(~O_OtE.SllS22)
bl+" - slls22, ) (19) e(1+ e40
d(12 = ( l+~E.s22) (1+OtE . s21)_OO_OtE.S l lS22) 2
For unloading and neutral loading (i.e., when yield function f < (1k) eqs (19) simplify to
E d(1i -- 1 - v 2 [dgi + "o. d s j ] . (20)
The integral form for elastic loading is
E cri - - 1 - v -------~ [Ei + V" 8 j ] . (21)
The yon Mises strength Cry (14) can be written as a function of the principal strains:
CrY - - 1 - - '92 (81 + v . 82) 2 + (82 + v . 81) 2 (22)
-- (81 + V" 82) (82 + V" El)] 1/2 .
The von Mises strength Cry (22) is almost never matched in specific loading levels of the experimental measurement. A test must therefore be performed in the grid cells for which the yield function f exceeds the yon Mises strength Cry at first loading level. We assume that the first principal strain, 81, is in constant proportion to the second principal strain, 82, up to the first loading level and between each other pairs of loading levels, respectively. Under this assumption, for a given cell:
82 = k . 81 (23)
The ratio k in a given cell is evaluated from the experimentally determined principal strains in the given cell and for a given loading level. Equation (22) can then be rewritten as
E . ~1 [(1 + v . k) 2 q- (k q- v) 2 Cry I. (24)
-- (1 + v - k) (k + v)] 1/2.
Thus principal strains ~1, ~2 can be determined which match exactly the von Mises strength cry:
(1 - v2) �9 (1y [ E L(1 + v . k) 2 + (k + v ) 2
- (1 + v . k) (k + v)] -1 /2 (25)
~2 = k �9 ~1.
The corresponding stresses 61,62 are defined by eq (21):
E~l (1 + k . v ) 61 = (26)
E~l (k + v) 6 2 = ~
Now we can again proceed to the experimentally measured principal strains 81, 82 where the increments of principal strains are defined as
ds1 = E1 - - E1 (27)
d82 = k �9 d81
Because the dependence of the hardening function ct is sharply nonlinear in the vicinity of yielding stress. The in- crements of principal strains (27) are divided into 100 subin- crements. This procedure is followed in subsequent loading steps as well.
334 �9 VoL 44, No. 4, August 2004 �9 2004 Society for Experimental Mechanics

Now principal stress components crl, cr2 are evaluated for each cell at the first loading level. These are defined by eq (21) in cells where the yield function f appears below the von Mises strength Cry (elastic loading). Stress components cr], cr2 are assembled from 61, 52 (26) and from the sum of incre- ments defined by eq (19) in the cells where the yield function f achieved the von Mises strength cry.
A similar scheme is used in subsequent loading steps. The von Mises criterion is tested in the cells that were loaded elas- tically. However, the criterion of plastic loading is tested in the cells where the von Mises strength was already reached in some previous loading level:
af Ocrij dcrij = $11 " dcrl + s22 �9 dcr2 > 0. (28)
The incremental plastic strain intensity is defined by the well- known relation:
dEip ~- V ~ " ~dE2p q- dE2p -{- dE2p. ( 2 9 )
The integral plastic strain intensity is evaluated as the sum of m plastic strain increments acquired during the loading process:
m
Sip = Z dEip. (30) n = l
A3. Evaluation of Plastic Strain Energy and its Rate
The plastic strain energy density increment in one cell is defined as 10
d(~ = ot ((T1s21dcrl ---]- cr2s22dcr2 + crlS11s22dcr2 \
(31)
+ c r 2 S l l s 2 2 d c r l ) .
Integral plastic strain energy density is evaluated as the sum of m plastic strain density increments (31) acquired due to loading process in each cell:
m
~b = Z d~b. (32) n = l
Local plastic work rate is calculated from known time incre- ments AtL between corresponding loading levels L for each cell:
,i, = ~L -- ~L-1 (33) tL -- t L - 1
The specific plastic work rate is defined as the sum of all cell local plastic work rates divided by the number of cells in the analyzed picture:
k l 1
I~) = k---~ " E y~- +rs" (34) r = l s-----1
Acknowledgments
This work was made possible by grants 106/95/1433 and 106/99/1467, from the Grant Agency of the Czech Republic.
References
1. Vavrik, D., "Optical Identification of Surface Plastic Zone Shape and Size Near Crack Tip,'" PhD Thesis, Czech Technical University, Prague (1999).
2. Zemankova, J. et al., "Thermodynamical Concept of Fracture Me- chanics," Final report of Grant No 106/95/1433 GACR, ITAM CAS, Prague (1998).
3. Ziegler, H., An Introduction to Thermomechanics, 2nd Ed., North- Holland, Amsterdam (1983).
4. Sewenhuijsen, P..J., "'Current Trends in Obtaining Deformation Data from Grids," Experimental Techniques, 17, 22-26.
5. Korous, J., Fiala, Z., and Bielak, 0., "Numerical Computation of Quantities of Two-Parameter Fracture Mechanics for a TDCB Specimen," Engineering Mechanics, 4 (2), 87-93 (1997).
6. Haul D.E., Parks, D.M., and Lee, H., "A Modified Effective Crack Length Formulation in Elastic-Plastic Fracture Mechanics," Mechanics of Materials, 20, 273-289 (1995).
Z Sih, G.C., Mechanics of Fracture Initiation and Propagation, Kluwer Academic, Dordrecht (1991).
8. Thireos, C.G. and Gdoutos, E.E., "Crack Curving under Mode I Load- ing," Proceedings of the 4th Greek National Congress on Mechanics, VoL 1, 375-383 (1995).
9. Tvergaard, V, "'Material Failure by Void Growth to Coalescence," Advances in Applied Mechanics, 27, 83-150 (1990).
I0 Lee, D.J., Liebowitz, H., and Lee, K.Y., "The Quest of a Universal Fracture Law Governing the Process of Slow Crack Growth," Engineering Fracture Mechanics, 55, 61-83 (1996).
�9 2004 Society for Experimental Mechanics Experimental Mechanics �9 335
Related Documents