CRACK IDENTIFICATION OF A ROTATING SHAFT WITH INTEGRATED WIRELESS SENSOR F. Andrés Bejarano, Yi Jia * , Frederick Just Department of Mechanical Engineering University of Puerto Rico, Mayaguez Campus PO Box 9045, Mayagüez, Puerto Rico 00681-9045, USA Emails: [email protected] Abstract- This paper presents a novel real-time crack identification method to determine the position and depth of a transverse open crack on a rotating shaft. A newly developed wireless sensor capable of being mounted directly on the shaft is employed to monitor acceleration at different points of the shaft in a rotating coordinate system. The vibration parameters obtained from the wireless sensors and Finite Element Model provide operational data to perform Modal Analysis with different mock crack positions and depths, and an unique relation between the vibration parameters and crack characteristics is developed by Neural Networks Method working as function approximator to predict the crack size and location on the shaft. The method was experimentally validated and results have shown that the crack detection sensitivity parameters depend on the acceleration signals at different points of the shaft. Index terms: rack detection, wireless sensor, vibration modal analysis, finite element method, neural Networks, rotating shaft. I. INTRODUCTION Rotating shafts carrying disks are broadly used in many mechanical applications like pumps, engines and turbines. It is observed that high speed and heavy duty shafts develop transverse cross-sectional cracks due to fatigue at some time during their life period. Cracks may be caused by mechanical stress raisers, such as sharp keyways, abrupt cross sectional changes, metallurgical INTERNATIONAL JOURNAL ON SMART SENSING AND INTELLIGENT SYSTEMS, VOL. 2, NO. 4, DECEMBER 2009 564

Welcome message from author
This document is posted to help you gain knowledge. Please leave a comment to let me know what you think about it! Share it to your friends and learn new things together.
Transcript
CRACK IDENTIFICATION OF A ROTATING SHAFT
WITH INTEGRATED WIRELESS SENSOR
F. Andrés Bejarano, Yi Jia*, Frederick Just
Department of Mechanical Engineering
University of Puerto Rico, Mayaguez Campus
PO Box 9045, Mayagüez, Puerto Rico 00681-9045, USA
Emails: [email protected]
Abstract- This paper presents a novel real-time crack identification method to determine the position
and depth of a transverse open crack on a rotating shaft. A newly developed wireless sensor capable of
being mounted directly on the shaft is employed to monitor acceleration at different points of the shaft
in a rotating coordinate system. The vibration parameters obtained from the wireless sensors and Finite
Element Model provide operational data to perform Modal Analysis with different mock crack positions
and depths, and an unique relation between the vibration parameters and crack characteristics is
developed by Neural Networks Method working as function approximator to predict the crack size and
location on the shaft. The method was experimentally validated and results have shown that the crack
detection sensitivity parameters depend on the acceleration signals at different points of the shaft.
Index terms: rack detection, wireless sensor, vibration modal analysis, finite element method, neural
Networks, rotating shaft.
I. INTRODUCTION
Rotating shafts carrying disks are broadly used in many mechanical applications like pumps,
engines and turbines. It is observed that high speed and heavy duty shafts develop transverse
cross-sectional cracks due to fatigue at some time during their life period. Cracks may be caused
by mechanical stress raisers, such as sharp keyways, abrupt cross sectional changes, metallurgical
INTERNATIONAL JOURNAL ON SMART SENSING AND INTELLIGENT SYSTEMS, VOL. 2, NO. 4, DECEMBER 2009
564
factors, heavy shrink fits, grooves, and other stress concentration factors that promote the crack
initiation. Once a crack is initiated it propagates and the stress required for propagation is smaller
than that required for crack initiation. After many cycles operating stresses may be sufficient to
propagate the crack. The crack propagation takes place over a certain depth when it is sufficient
to create unstable conditions and fracture take place. It is important to develop new real-time
based non destructive techniques to predict the behavior of a crack in order to avoid human and
economical disasters.
Crack detection and diagnostic techniques can be classified into signal-based and model-based
methods. Y. Narkis in 1992 [1] derived a continuous equation to determine the location of a crack
on a homogeneous and symmetric rotor. The crack was simulated by an equivalent spring,
connecting the two segments of the beam. Narkis used algebraic equations which relate natural
frequencies to beam and crack characteristics. It was found that the only information required for
accurate crack identification is the variation of the first two natural frequencies due to the crack.
The reliability of the proposed method was evaluated with finite element method using ANSYS
software giving acceptable results. K. Bikri, R. Benamar and M.M Bennouna. in 2006 [2]
performed a theoretical investigation of the geometrically non-linear free vibrations of a
clamped–clamped beam containing an open crack. The approach used a semi-analytical model
based on an extension of the Rayleigh–Ritz method to non-linear vibrations. Emphasis was made
on the backbone curves, i.e. amplitude-frequency dependence, obtained for various crack depth,
and the effect of the vibration amplitudes upon the non-linear mode shapes of a cracked beam
was examined. The work was restricted to the fundamental mode in order to concentrate on the
study of the influence of the crack on the non-linear dynamic response near to the fundamental
resonance.
G. M Owolabi. in 2002 [3] studied the vibration behavior of aluminum beams based on changes
in the natural frequencies and amplitudes of the FRFs. Galerkin’s method was utilized to solve
for the frequencies and vibration modes in a simulating model. Modal analysis was performed in
the experimental work employing a dual channel signal analyzer and seven light accelerometers
placed at different points of the beam. Results have shown that vibration behavior of the beams
are very sensitive to the crack location, crack depth and mode number. This study illustrates that
measured parameters of frequencies and response amplitudes are unique values. The unique
values of the crack location and crack depth were obtained by plotting the contour lines of the
565
F. Andrés Bejarano, Yi Jia, Frederick Just, Crack Identification of A Rotating Shaft with Integrated Wireless Sensor
first three modes of the fixed beam. Y. Fan and J. Li in 2000 [4] used an embedded modeling
approach to identify the change in stiffness of a shaft as a result of a crack. They worked with a
new methodology to identify multi-degree of freedom nonlinear systems from the system’s
operating data. The methodology includes a new nonlinear model architecture which embeds
feedforward neural networks to represent unknown nonlinearities in a lumped parameter model,
and a learning algorithm to train the embedded neural networks as well as model parameters to
obtain model fidelity. The change in stiffness of the shaft was approximated using neural
network, which is then, in turn, embedded in a lumped parameter model of the shaft. The neural
network is refined iteratively with a solution method to minimize a cost function based on the
difference in the response of an embedded model and the data collected from the cracked system.
Model based methods treated the crack identification in the static frame of coordinates to
estimate the changes in natural frequencies, mode shapes and damping ratios of the shaft due to a
reduction in local stiffness provoked by the presence of a crack. These methods require enormous
amounts of computational time and effort. Furthermore, it is not easy to obtain an accurate
measurement of the crack effects using an analytical approach. The simulating study presented in
this research introduces the analysis of the dynamic system in the rotating coordinates based on
the acceleration signals at different points of the shaft rotating at a constant driving frequency. An
attempt has been made to detect the presence of a crack in a rotating shaft, and determine its
location and size, based on experimental modal analysis. Previews experimental methods require
high speeds to extract modal parameters like natural frequencies and frequency response
amplitudes. Another advantage of the proposed method is that the system can be safety
monitored online without the need to reach the fundamental frequency avoiding extreme
operational conditions for diagnosis. Therefore, the crack can be identified and characterized in
operational condition without the need of dismounting the shaft.
This paper presents a novel real time monitoring technology, which uses a set of acceleration
frequency response of a shaft rotating at a fixed driving frequency, to determine position and
depth of a transverse open crack on the shaft. A fault simulator machine was employed to
simulate the system, where a shaft is supported on two bearings and a disk is attached at the
midspan. The shaft is rotated by an electrical motor coupled to the shaft on one side. The rotating
shaft vibrates in bending due to the harmonic excitation force induced by the unbalanced disk.
Finite element method was used to calculate the modal parameters of the cracked shaft for known
INTERNATIONAL JOURNAL ON SMART SENSING AND INTELLIGENT SYSTEMS, VOL. 2, NO. 4, DECEMBER 2009
566
crack depths and positions. The artificial neural network trained with Backpropagation algorithm
is found from a design of experiment to solve the inverse problem: from the modal parameters
estimate the crack characteristics. Analog signal was conditioned and processed to obtain the
acceleration signal in the radial direction of the shaft for three different points. Finally the
diagnostic network is selected to associate the acceleration signal with the crack depth and
position. Simulation results and experimental results are compared.
II. GENERAL DESCRIPTION OF THE SYSTEM
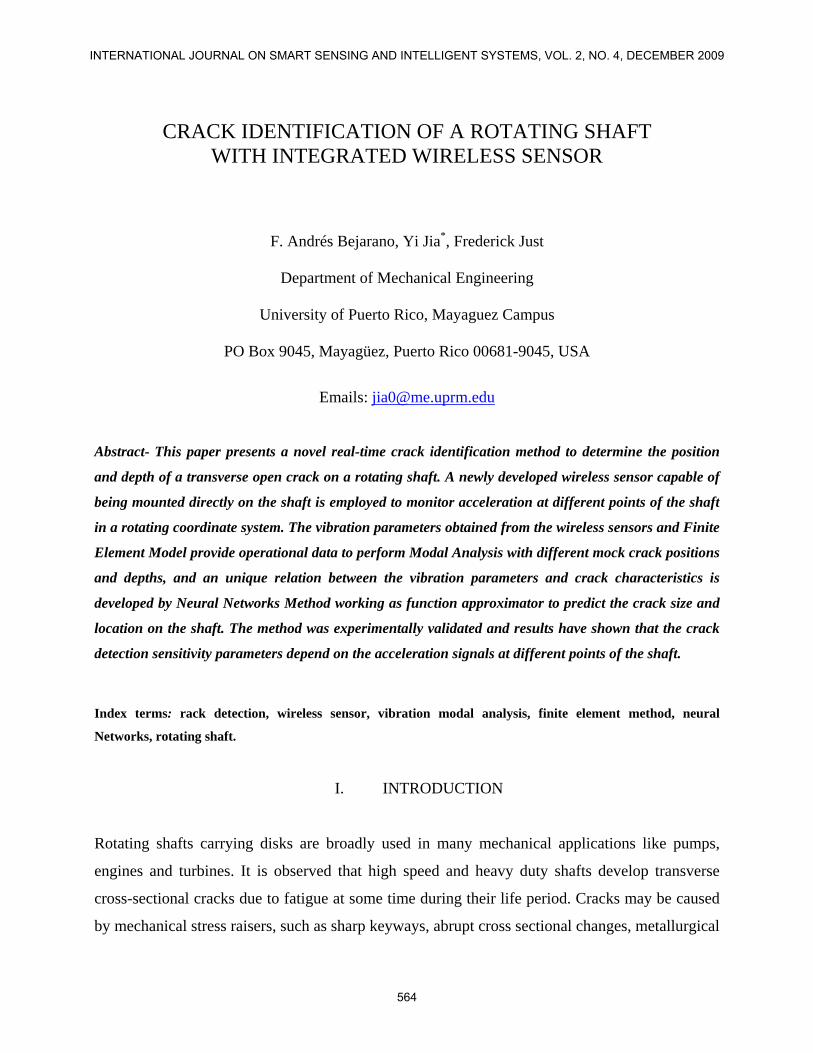
A complex system like a steam turbine can be represented by a Jeffcott Rotor in
Figure 1 (a), where the rotating shaft-disk system is modeled assuming that the bearings are rigid and provide no damping to the system. The shaft is assumed elastic and will deflect with respect to its equilibrium position in the presence of external mass unbalance due to the eccentricity of disk mounted at the midspan.
Figure 1(b) shows the section of the disk with the resulting acceleration components.
The vectors of motion involving the mass center C are calculated as:
/ /c s c s c s c s c s c s
Position Velocity Accelerationp p p v v v a a a= + = + = + /
(1)
Figure 1. (a) The Jeffcott Rotor (b) Section of the unbalanced disk
From the vectorial analysis the acceleration components in the rotating coordinates we have:
567
F. Andrés Bejarano, Yi Jia, Frederick Just, Crack Identification of A Rotating Shaft with Integrated Wireless Sensor
2 2 2cos( ) 2 sin( )Ci Cja r r e t a r r e tθ ω ω θ θ θ ω ω= − − − = + − −θ (2)
Applying Newton’s second law to equations of motion in the radial direction to find the harmonic
force ( )F tω we get:
( )2 2 2( ) cos ( ) cos(d d
dm mc kr r r e t where F t m e t )θ ω ω θ ω ω ω+ + − = − = −θ (3)
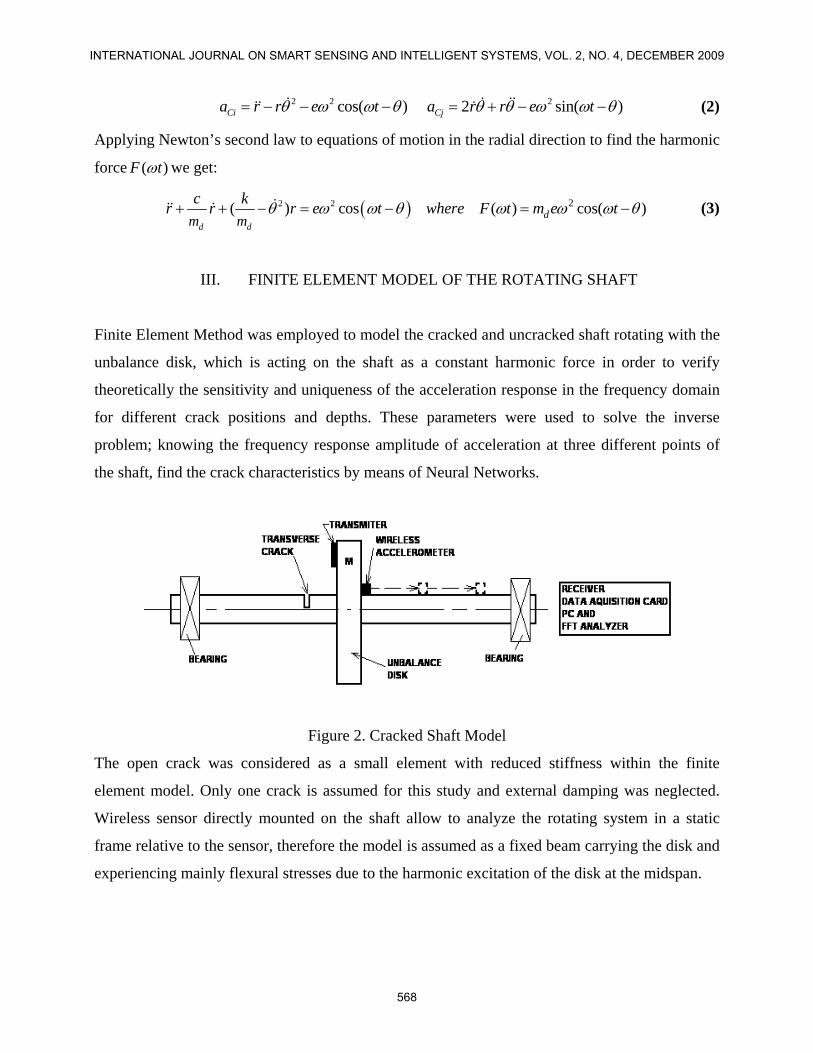
III. FINITE ELEMENT MODEL OF THE ROTATING SHAFT
Finite Element Method was employed to model the cracked and uncracked shaft rotating with the
unbalance disk, which is acting on the shaft as a constant harmonic force in order to verify
theoretically the sensitivity and uniqueness of the acceleration response in the frequency domain
for different crack positions and depths. These parameters were used to solve the inverse
problem; knowing the frequency response amplitude of acceleration at three different points of
the shaft, find the crack characteristics by means of Neural Networks.
Figure 2. Cracked Shaft Model
The open crack was considered as a small element with reduced stiffness within the finite
element model. Only one crack is assumed for this study and external damping was neglected.
Wireless sensor directly mounted on the shaft allow to analyze the rotating system in a static
frame relative to the sensor, therefore the model is assumed as a fixed beam carrying the disk and
experiencing mainly flexural stresses due to the harmonic excitation of the disk at the midspan.
INTERNATIONAL JOURNAL ON SMART SENSING AND INTELLIGENT SYSTEMS, VOL. 2, NO. 4, DECEMBER 2009
568
Figure 3. Fixed shaft divided in six elements and its nodal coordinates
Applying the dynamic condensation method proposed by M. Paz (1984) [Error! Reference source not found.] as an extension of the Static Condensation Method where the fixed degrees of freedom are reduced by expressing them in terms of the independent or primary degrees of freedom, the secondary degrees of freedom {Ys} (slopes 1 to 5) are condensed, and the primary degrees of freedom are retained (deflections 6 to 10 in
Figure 3). The secondary degrees of freedom are arranged at the first s coordinates and the
primary degrees of freedom are the last p coordinates. After these arrangements the equations of
free motion can be written in partitioned matrix form as
[ ]{ } [ ] { } {0}|
[ ] [ ] { } {0}{ }
sps ss s
ps pp pp
KY K YK K YY
⎧ ⎫ ⎡ ⎤ ⎧ ⎫ ⎧ ⎫⎪ ⎪ ⎪ ⎪+ ⎢ ⎥⎨ ⎬ ⎨ ⎬ ⎨⎢ ⎥ ⎩ ⎭⎪ ⎪⎪ ⎪ ⎣ ⎦ ⎩ ⎭⎩ ⎭
ii
ii = ⎬ (4)
The reduced stiffness and mass matrices are calculated as
[ ]2T
i i i i i iK D M and M T M Tω− − − − − −⎡ ⎤ ⎡ ⎤ ⎡ ⎤ ⎡ ⎤ ⎡ ⎤ ⎡ ⎤= + =⎢ ⎥ ⎢ ⎥ ⎢ ⎥ ⎢ ⎥ ⎢ ⎥ ⎢ ⎥⎣ ⎦ ⎣ ⎦ ⎣ ⎦ ⎣ ⎦ ⎣ ⎦ ⎣ ⎦
(5)
Requiring for a nontrivial solution that
2[ ] [ ] 0K Mω− −
− = (6)
The force vector of the system and the modal matrix are employed to estimate the steady state
response of the shaft subjected to the harmonic force 0 cos( )F tω θ− acting on the node 4 due to
the unbalance disk. The force vector is assembled as follows.
{ }00 0 cos( ) 0 0 'F F tω θ= − (7)
569
F. Andrés Bejarano, Yi Jia, Frederick Just, Crack Identification of A Rotating Shaft with Integrated Wireless Sensor
Neglecting damping and assuming 0θ = , the system can be represented with the normal equation
2 10
1
cos( )N
n n n n ni
iZ Z P t where P Fω ω −
=
+ = = Φ∑ (8)
Solving the nonhomegeneous ordinary differential equation (8) employing the undetermined
coefficient method and applying the initial conditions we have the deflection solution of the
nodal coordinates in the time as follows:
2 2 [cos( ) cos( )]nn
n
Pz tω ωω ω
= −− nt (9)
The deflection of the nodal coordinates are found from the transformation
{ } [ ]{ } [ ]ny Z where is the modal matrix= Φ Φ (10)
Substituting the values of { }nZ into Equation (10) gives the amplitudes of deflection at the nodal
coordinates. The second derivative corresponds to the amplitudes of acceleration at the nodal
coordinates is.
{ } [ ]{ }2 22 2 [ cos( ) cos( )]
( )n n nn
PnnZ t t yω ω ω ω
ω ω= − ⇒
−Z= Φ (11)
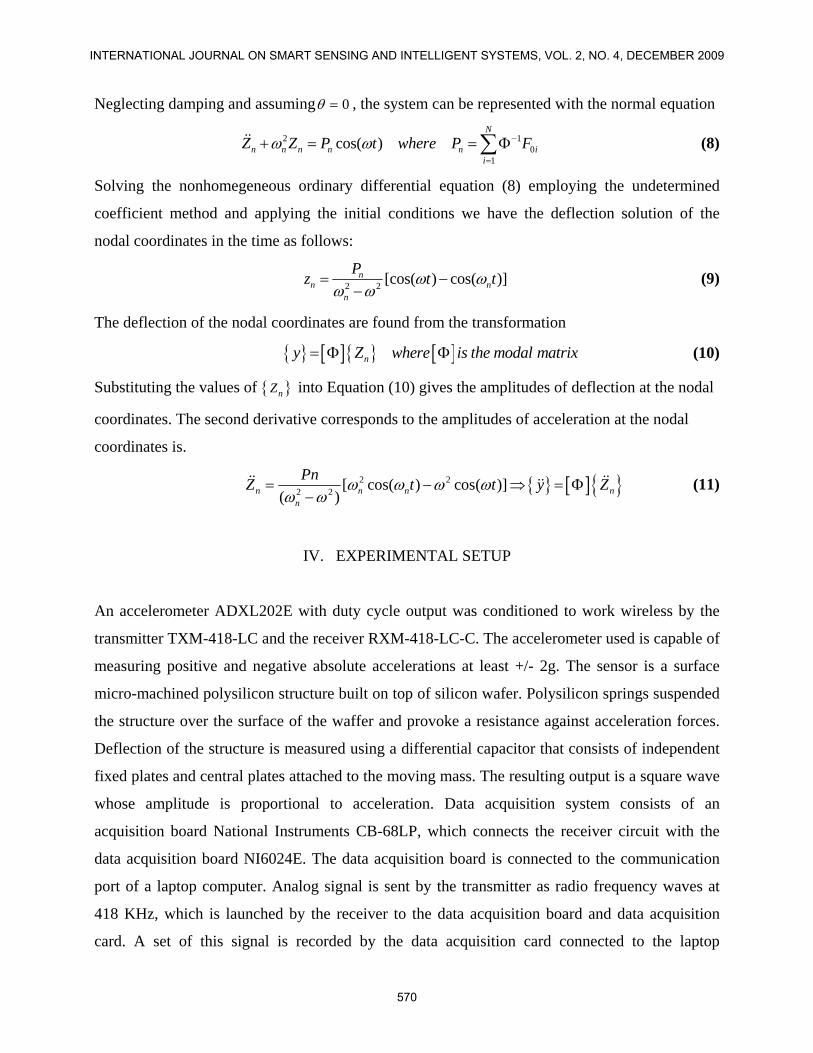
IV. EXPERIMENTAL SETUP
An accelerometer ADXL202E with duty cycle output was conditioned to work wireless by the
transmitter TXM-418-LC and the receiver RXM-418-LC-C. The accelerometer used is capable of
measuring positive and negative absolute accelerations at least +/- 2g. The sensor is a surface
micro-machined polysilicon structure built on top of silicon wafer. Polysilicon springs suspended
the structure over the surface of the waffer and provoke a resistance against acceleration forces.
Deflection of the structure is measured using a differential capacitor that consists of independent
fixed plates and central plates attached to the moving mass. The resulting output is a square wave
whose amplitude is proportional to acceleration. Data acquisition system consists of an
acquisition board National Instruments CB-68LP, which connects the receiver circuit with the
data acquisition board NI6024E. The data acquisition board is connected to the communication
port of a laptop computer. Analog signal is sent by the transmitter as radio frequency waves at
418 KHz, which is launched by the receiver to the data acquisition board and data acquisition
card. A set of this signal is recorded by the data acquisition card connected to the laptop
INTERNATIONAL JOURNAL ON SMART SENSING AND INTELLIGENT SYSTEMS, VOL. 2, NO. 4, DECEMBER 2009
570
computer. This card was configured to work with the software Matlab 7.1 and the signal
processing toolbox. The signal was also monitored by an oscilloscope connected in parallel to the
receiver circuit during the sampling. Figure 4 shows experimental setup and wireless sensor.
Figure 4. Data Acquisition System and Experimental Setup
571
F. Andrés Bejarano, Yi Jia, Frederick Just, Crack Identification of A Rotating Shaft with Integrated Wireless Sensor
V. IDENTIFICATION OF CRACK SIZE AND LOCATION BASED ON ARTIFICIAL
NEURAL NETWORKS
Multilayer feedforward neural networks with Backpropagation Levenberg Marquardt (LMBP)
training algorithm was employed in this study as a non linear function approximator to establish a
relationship between input vectors and target values. LMBP algorithm introduced by Hagan [5]
was selected because it is one of the most efficient and fasted algorithms. The performance of the
network is measured by comparing the output of the network with the corresponding target value.
Known inputs P and targets T were obtained first theoretically by the simulation with finite
element method and then experimentally employing the wireless accelerometer. The input vector
(P) was created from the difference in the spectral amplitudes of acceleration response between
cracked and uncracked shaft at nodes 4, 5 and 6. The target matrices were constructed by
considering known locations and depths of the crack to be associated with the pattern of
amplitudes of acceleration response differences. A neural network is trained when the learning
algorithm find the weight matrices and bias vector in such way that the error between predicted
and actual data is minimized.
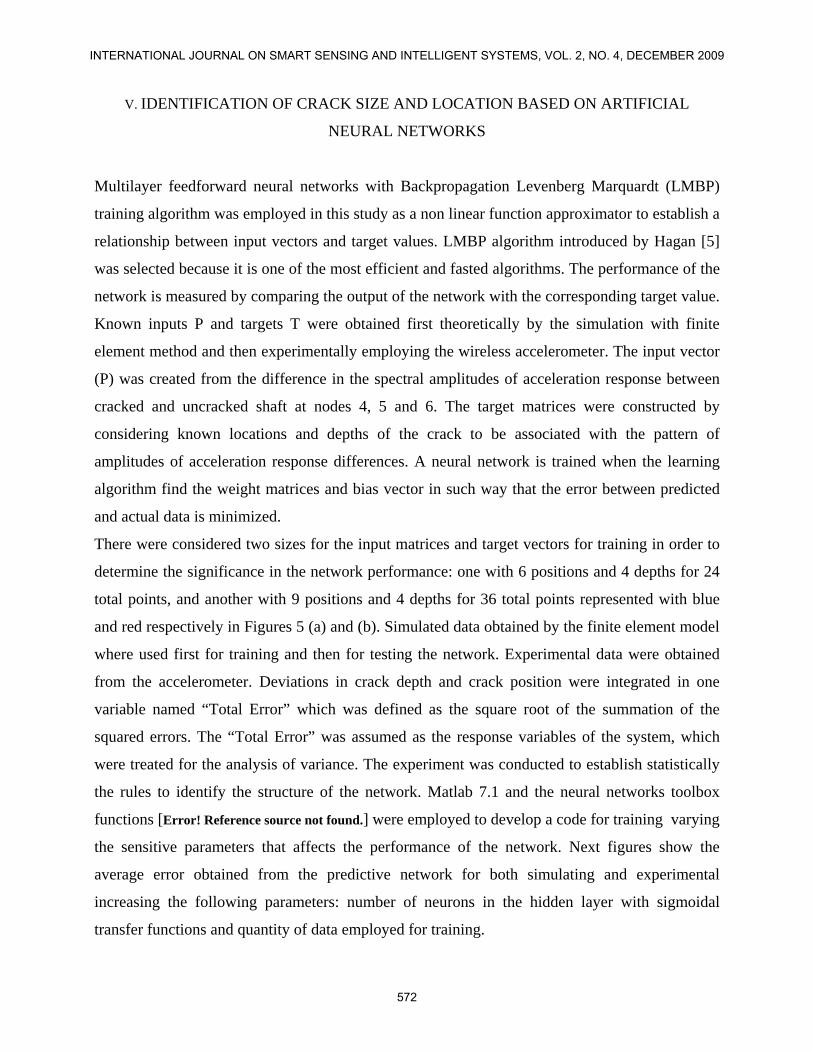
There were considered two sizes for the input matrices and target vectors for training in order to
determine the significance in the network performance: one with 6 positions and 4 depths for 24
total points, and another with 9 positions and 4 depths for 36 total points represented with blue
and red respectively in Figures 5 (a) and (b). Simulated data obtained by the finite element model
where used first for training and then for testing the network. Experimental data were obtained
from the accelerometer. Deviations in crack depth and crack position were integrated in one
variable named “Total Error” which was defined as the square root of the summation of the
squared errors. The “Total Error” was assumed as the response variables of the system, which
were treated for the analysis of variance. The experiment was conducted to establish statistically
the rules to identify the structure of the network. Matlab 7.1 and the neural networks toolbox
functions [Error! Reference source not found.] were employed to develop a code for training varying
the sensitive parameters that affects the performance of the network. Next figures show the
average error obtained from the predictive network for both simulating and experimental
increasing the following parameters: number of neurons in the hidden layer with sigmoidal
transfer functions and quantity of data employed for training.
INTERNATIONAL JOURNAL ON SMART SENSING AND INTELLIGENT SYSTEMS, VOL. 2, NO. 4, DECEMBER 2009
572
(a)
(b)
Figure 5. Predicted average error (a) Simulated data (b) Experimental data
Figure 5 (a) corresponding to simulating results shows how increasing the number of data for
training and reducing the number of neurons in the hidden layer the average error of the
predictive network is reduced. Therefore the best structure selected was the one that reveals the
lowest average error with the smallest number of neurons. A single neuron in the hidden layer
was selected with a sigmoidal transfer function for the network. The icons and notation presented
573
F. Andrés Bejarano, Yi Jia, Frederick Just, Crack Identification of A Rotating Shaft with Integrated Wireless Sensor
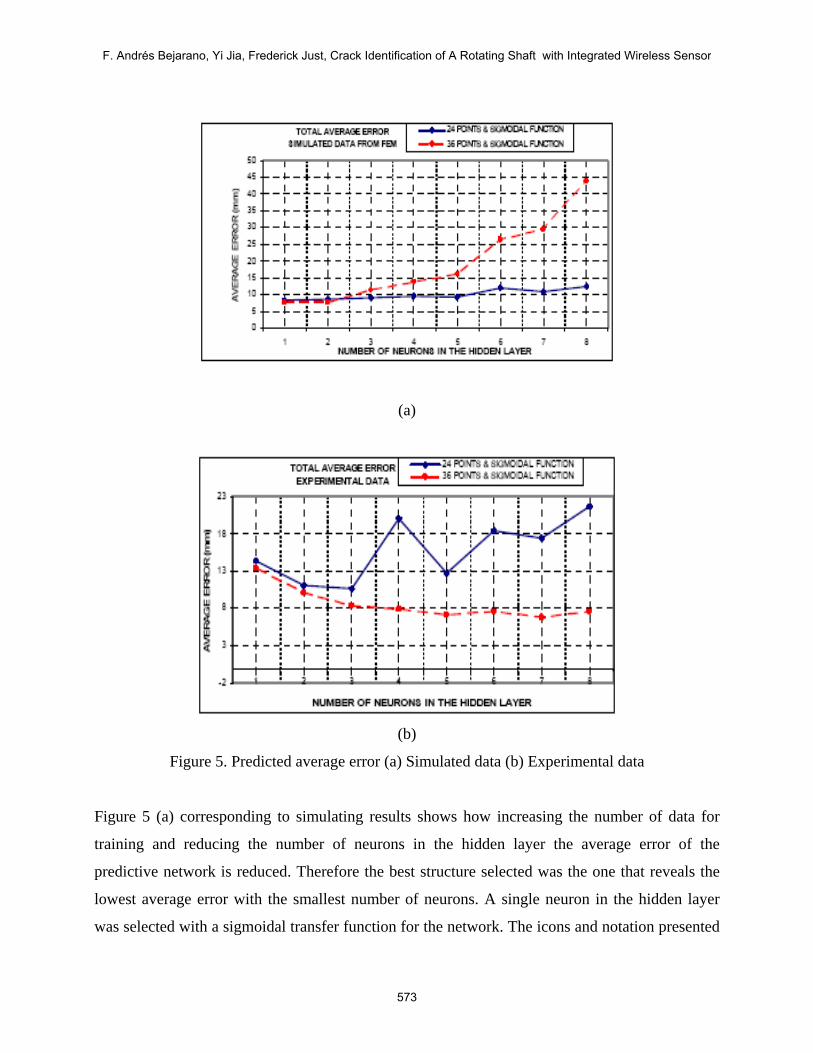
in Figure 6 were taken from Hagan [5], where W(m) represents the weight matrix of the mth
layer, b(m) is the bias vector of the mth layer, n(m) is the net input vector to the network in the
mth layer, a(m) is the net output of the network in the mth layer.
Figure 6. Neural network structure schematic of the predictive model for the simulated data Figure 6 shows one input vector P of 3 x 1 with the three differences in amplitude of acceleration:
P1,P2 and P3 , and two neurons with linear transfer functions in the output layer that give the
output vector corresponding to crack depth and position . Figure 5 (b) corresponding to
experimental results shows how increasing the number of data for training and the number of
neurons in the hidden layer the average error of the predictive network is reduced. The structure
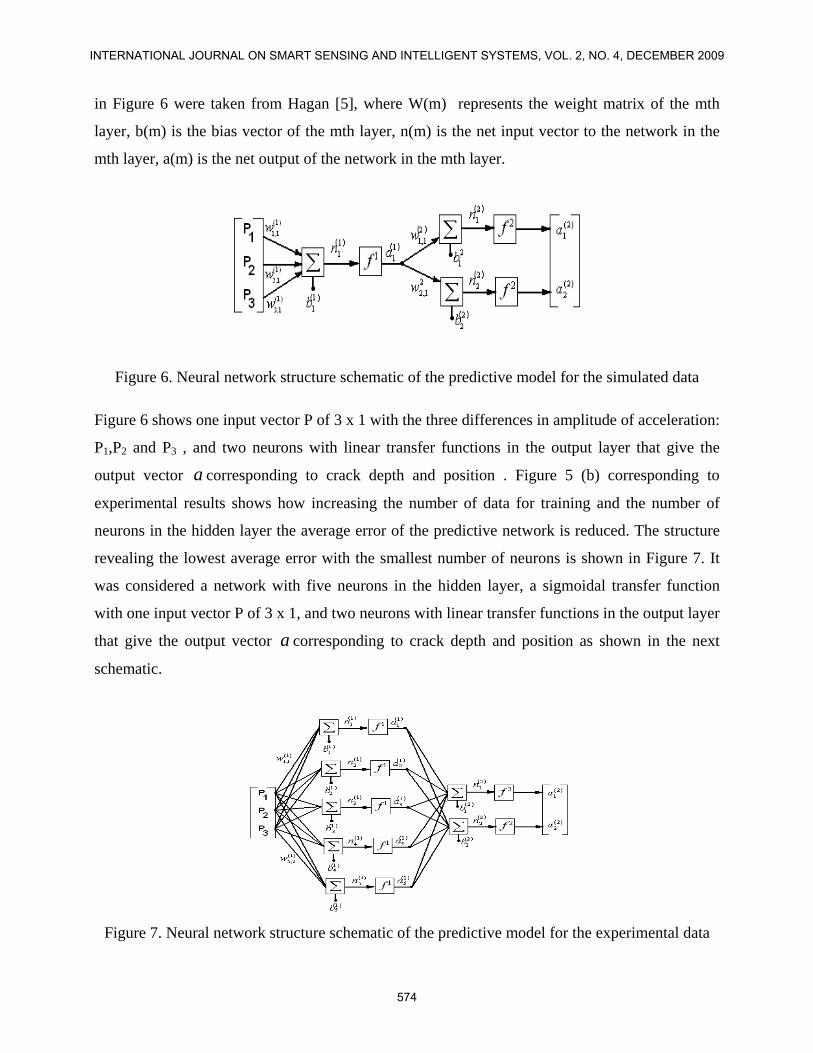
revealing the lowest average error with the smallest number of neurons is shown in Figure 7. It
was considered a network with five neurons in the hidden layer, a sigmoidal transfer function
with one input vector P of 3 x 1, and two neurons with linear transfer functions in the output layer
that give the output vector a corresponding to crack depth and position as shown in the next
schematic.
a
Figure 7. Neural network structure schematic of the predictive model for the experimental data
INTERNATIONAL JOURNAL ON SMART SENSING AND INTELLIGENT SYSTEMS, VOL. 2, NO. 4, DECEMBER 2009
574
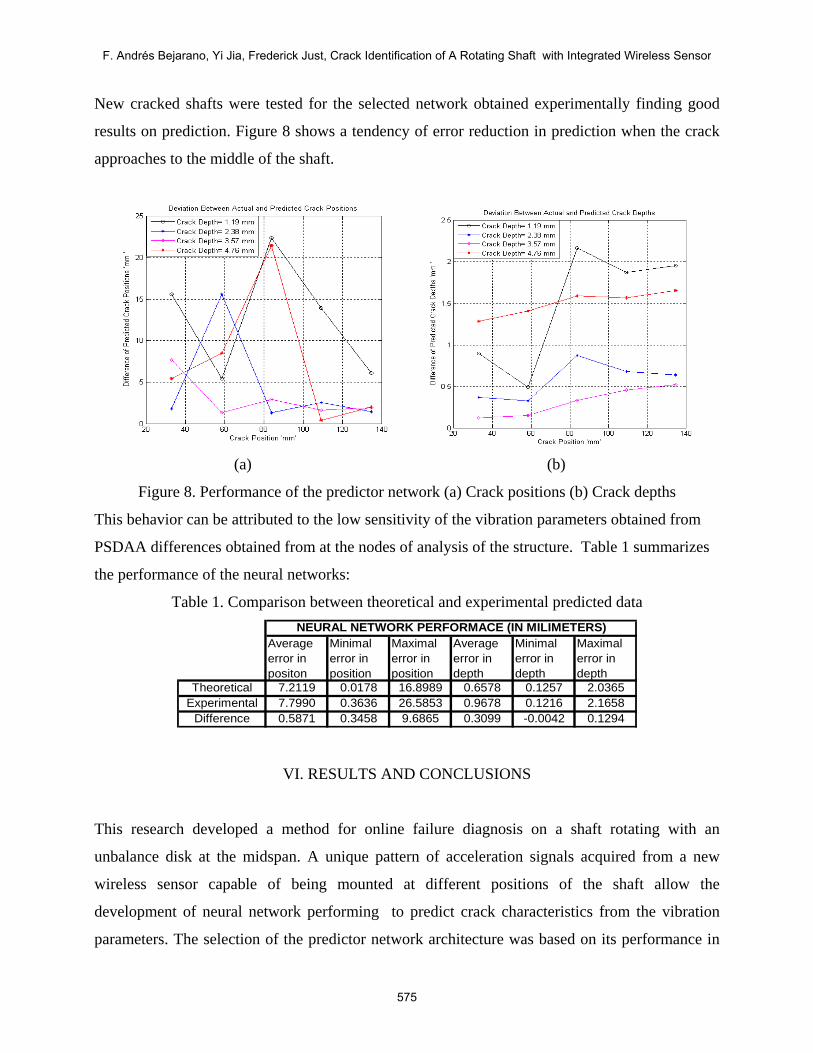
New cracked shafts were tested for the selected network obtained experimentally finding good
results on prediction. Figure 8 shows a tendency of error reduction in prediction when the crack
approaches to the middle of the shaft.
(a) (b)
Figure 8. Performance of the predictor network (a) Crack positions (b) Crack depths
This behavior can be attributed to the low sensitivity of the vibration parameters obtained from
PSDAA differences obtained from at the nodes of analysis of the structure. Table 1 summarizes
the performance of the neural networks:
Table 1. Comparison between theoretical and experimental predicted data
Average error in positon
Minimal error in position
Maximal error in position
Average error in depth
Minimal error in depth
Maximal error in depth
Theoretical 7.2119 0.0178 16.8989 0.6578 0.1257 2.0365Experimental 7.7990 0.3636 26.5853 0.9678 0.1216 2.1658
Difference 0.5871 0.3458 9.6865 0.3099 -0.0042 0.1294
NEURAL NETWORK PERFORMACE (IN MILIMETERS)
VI. RESULTS AND CONCLUSIONS
This research developed a method for online failure diagnosis on a shaft rotating with an
unbalance disk at the midspan. A unique pattern of acceleration signals acquired from a new
wireless sensor capable of being mounted at different positions of the shaft allow the
development of neural network performing to predict crack characteristics from the vibration
parameters. The selection of the predictor network architecture was based on its performance in
575
F. Andrés Bejarano, Yi Jia, Frederick Just, Crack Identification of A Rotating Shaft with Integrated Wireless Sensor
pattern recognition. A simulating study was carried out employing the finite element method to
model the problem before experimental application. The method was successfully implemented
within a degree of accuracy to diagnose the crack depth and position in a rotating shaft
demonstrating the effectiveness of the artificial neural networks predictor working in
combination with the wireless sensor giving a signal in the rotating coordinates. Modal
parameters such as mode shapes and natural frequencies obtained from the finite element model
resulted to be very sensitive to crack depth and crack location. The differences of power spectral
densities amplitudes of acceleration between the cracked and uncracked shaft at three different
positions have shown a unique pattern of the failure scenario, except in crack positions close to
the shaft support. This unique characteristic was successfully employed as the diagnostic input
sensitive parameter to find a function approximator networks able to correlate this pattern with
the failure characteristics employing the Back propagation training algorithm. The small error
differences between actual and predicted data in the simulated and experimental studies
demonstrated the consistency of the proposed method in the crack identification of a shaft
employing wireless sensors and artificial neural networks method in a real system.
VII. ACKNOWLEDGMENTS
The authors would like to acknowledge National Science Foundation and US Department of
Energy for the research support under grant NSF- CMMI- 0757486 and DE-FG26-07NT43061.
REFERENCES
[1] Y. Narkis, “Identification of Crack Location in Vibrating Simply Supported Beams’’,
Journal of Sound and Vibration, 172(4), pp.549-558, 1994.
[2] K. Bikri, R. Benamar and M.M Bennouna., “Geometrically non-linear free vibrations of
clamped-clamped beams with an edge crack’’, Elservier, Computers and Structures 84, pp.
485-502, 2006.
[3] G.M. Owolabi., A.S.J Swamidas and R. Seshadri, “Crack Detection in Beams Using
Changes in Frequencies and Amplitudes of Frequency Response Functions’’, Journal of
Sound and Vibration, 263 ,pp1-22,2003.
INTERNATIONAL JOURNAL ON SMART SENSING AND INTELLIGENT SYSTEMS, VOL. 2, NO. 4, DECEMBER 2009
576
[4] Y. Fan and. J. Li, “Nonlinear System Identification Using Lumped Parameter Models With
Embedded Feedforward Neural Networks”, Rensselaer Polytechnic Institute, 2000.
[5] H. Demuth, M. Hagan and M. Beale, “Neural Network Design”, Thompson Learning, Inc.,
1996.
[6] M. Feldman & S. Seibold, “Damage Diagnosis of Rotors: Application of Hilbert Transform
and Multi-Hypotesis Testing”, Israel Institute of Technology, 1998.
[7] D. J. Inman., “Engineering Vibration”, second edition, Prentice-Hall Inc., 2001.
[8] MATLAB Version 7.1.0.246 Release 14, Neural Network Toolbox, the Mathworks Inc.,
August 02, 2005.
[9] M. Paz, “Structural Dynamics Theory and Computation’’, Van Nostrand Reinhold, Third
Edition, 626 pages, 1991.
[10] Adewusi Surajudeen Adedotun, “ Detection of a Transverse Crack in a Rotating Shaft Using
Wavelet Transform”, Thesis of Master of Science in Mechanical Engineering, King Fahd
University of Petroleum & Minerals, 233 pages, May 2000.
[11] Analog Devices, Inc, ADXL202E Catalog, at http://www.analog.com,2000.
[12] Bachschmid N., Pennacchi P., Tanzi E. and Vania A., “Identification of Transverse Crack
Position and Depth in Rotor Systems”, Meccanica, vol 35, pp. 563-582, 2000.
[13] Ewins D.J., “ Modal Testing Theory and Practice” , Research Studies Press Ltd, 269 pages,
1984.
[14] Grabowski B., “The Vibrational Behavior of a Turbine Rotor Containing a Transverse
Crack", Transactions of the ASME, vol. 102, Jan. 1980.
[15] Haberman Richard ‘’Elementary Applied Partial Differential Equations’’ whit Fourier Series
and Boundary Value Problems, second edition by Prentice –Hall, 1987.
[16] Maharbiz Michael, “Introduction to MEMS – EECS 414 lectures”, Center for Wireless
Integrated MicroSystems, University of Michigan, September 2005.
[17] McKee Kristoffer K., “Rotor Transverse Crack Detection and Diagnosis Using Embedded
Modeling”, Thesis of Doctor of Philosophy in Mechanical Engineering, Rensselaer
Polytechnic Institute, Troy, New York, 191 pages, November 2002.
[18] Sekhar A.S., “Identification of a Crack in a Rotor System Using a Model-based Wavelet
Approach”, Technische Universitat Darmstadt, Institute fur Mechanik, 2001.
577
F. Andrés Bejarano, Yi Jia, Frederick Just, Crack Identification of A Rotating Shaft with Integrated Wireless Sensor
[19] Sinha Jyoti K., “Bi-spectrum for identifying crack and misalignment in shaft of a rotating
machine’’, Smart Structures and Systems, Vol. 2, No. 1, pp. 47-60, 2006.
[20] Tsai T. C. And. Wang Y. Z, “Vibration Analysis and Diagnosis of a Cracked Shaft”, Journal
of Sound and Vibration, vol.192, No.3, pp.607-620, 1996.
[21] Xiao Yingming B, “An Experimental Study of Crack Detection in a Rotating Shaft”, Thesis
for Master Engineering, Memorial University of Newfoundland-Canada, 109 pages, July
1995.
INTERNATIONAL JOURNAL ON SMART SENSING AND INTELLIGENT SYSTEMS, VOL. 2, NO. 4, DECEMBER 2009
578
Related Documents


