1 J. Adhesion, vol. 80, 2004, 169-201 Crack Growth of Structural Adhesive Joints in Humid Environments C. F. KORENBERG*, A. J. KINLOCH Department of Mechanical Engineering, Imperial College London, Exhibition Road, London SW7 2AZ, UK. * Presently at Department of Conservation, Documentation and Science, The British Museum, London WC1B 3DG, UK. and J. F. WATTS The Surface Analysis Laboratory, School of Engineering, University of Surrey, Guildford, Surrey, GU2 7XH, UK. The adhesive fracture energy, G c , of aluminium-alloy and steel joints, bonded with a rubber- toughened epoxy adhesive, has been measured using monotonically-loaded tests. Such tests have been conducted at different levels of relative humidity and two surface pretreatments have been employed for the substrates prior to bonding: a simple grit-blast and degrease (‘GBD’) pretreatment or a silane primer (‘GBS’) pretreatment. When G c was plotted against the crack velocity, three regions of fracture behaviour could be distinguished. At low rates of displacement the crack grew in a stable manner, visually along the interface, and relatively low crack velocities could be readily measured. This was termed ‘Region I’ and here the value of the adhesive fracture energy was relatively low and decreased steadily as the relative humidity was increased. On the other hand, at relatively high rates of displacement the crack grew in a stick-slip manner mainly cohesively in the adhesive layer at approximately 20 km/minute. This was termed ‘Region III’, and here the value of G c was relatively high and independent of the relative humidity. In this region the crack was considered to grow faster than the water molecules were able to reach the crack tip, which explains the independence of G c upon the test environment. In between ‘Region I’ and ‘Region III’, a transition region was observed which was designated as ‘Region II’. The major effect of the ‘GBS’ pretreatment, compared to the ‘GBD’ pretreatment, was to increase the value of G c both in ‘Regions I and III’, although the presence of the silane primer had the greater effect in ‘Region I’.

Welcome message from author
This document is posted to help you gain knowledge. Please leave a comment to let me know what you think about it! Share it to your friends and learn new things together.
Transcript

1
J. Adhesion, vol. 80, 2004, 169-201
Crack Growth of Structural Adhesive Joints in Humid Environments
C. F. KORENBERG*, A. J. KINLOCH
Department of Mechanical Engineering, Imperial College London, Exhibition Road, London SW7 2AZ, UK. * Presently at Department of Conservation, Documentation and Science, The British Museum, London WC1B 3DG, UK.
and J. F. WATTS
The Surface Analysis Laboratory, School of Engineering, University of Surrey, Guildford, Surrey, GU2 7XH, UK.
The adhesive fracture energy, Gc, of aluminium-alloy and steel joints, bonded with a rubber-
toughened epoxy adhesive, has been measured using monotonically-loaded tests. Such tests have
been conducted at different levels of relative humidity and two surface pretreatments have been
employed for the substrates prior to bonding: a simple grit-blast and degrease (‘GBD’)
pretreatment or a silane primer (‘GBS’) pretreatment. When Gc was plotted against the crack
velocity, three regions of fracture behaviour could be distinguished. At low rates of displacement
the crack grew in a stable manner, visually along the interface, and relatively low crack velocities
could be readily measured. This was termed ‘Region I’ and here the value of the adhesive fracture
energy was relatively low and decreased steadily as the relative humidity was increased. On the
other hand, at relatively high rates of displacement the crack grew in a stick-slip manner mainly
cohesively in the adhesive layer at approximately 20 km/minute. This was termed ‘Region III’,
and here the value of Gc was relatively high and independent of the relative humidity. In this
region the crack was considered to grow faster than the water molecules were able to reach the
crack tip, which explains the independence of Gc upon the test environment. In between ‘Region
I’ and ‘Region III’, a transition region was observed which was designated as ‘Region II’. The
major effect of the ‘GBS’ pretreatment, compared to the ‘GBD’ pretreatment, was to increase the
value of Gc both in ‘Regions I and III’, although the presence of the silane primer had the greater
effect in ‘Region I’.

2
Keywords: Accelerated testing, Durability, Environmental attack, Fracture mechanics, Structural
adhesives

3
INTRODUCTION
The use of structural adhesives offers many advantages when compared with other more
traditional joining methods such as welding, riveting and mechanical fasteners [1]. However, as
with any technology, there are some potential disadvantages associated with the use of adhesives.
In particular, adhesive joints may suffer environmental attack when exposed to relatively hot and
humid environments. The development of a sound accelerated-ageing test method to assess the
susceptibility of an adhesive ‘system’ (i.e. the adhesive/primer (if any)/substrate and substrate
surface pretreatment in combination) to such attack would represent a significant advance,
especially if such tests could be completed in a relatively short time-scale [2].
The aim of a sound and meaningful accelerated ageing test must be to accelerate the
mechanisms of attack seen during the service-life of the bonded joint, and not to induce
misleading and irrelevant mechanisms. For example, it is well known that to accelerate the rate of
environmental attack it is not possible simply to raise the temperature of the environment, since
unrealistically high test temperatures will indeed change the mechanisms of attack. One method
of accelerating the rate of attack which has recently been explored in detail by Kinloch and co-
workers (e.g. [3]) has been the use of cyclic-fatigue tests, using a fracture-mechanics approach,
conducted in aqueous and salt-water environments at relatively low temperatures, i.e. at
temperatures less than about 30oC. This has yielded a test method which gives a quantitative
‘ranking’ order for the durability of adhesive systems and, furthermore, the results may be
combined with a finite-element analysis of a bonded component or structure to give an estimate
of its fatigue life in the environment of interest [4]. However, the cyclic-fatigue tests require
expensive test equipment and are often time-consuming to undertake, typically involving
continued use of the fatigue test equipment for several months.

4
The main aim of the present work is to study the use of monotonically-loaded tests as a
method for assessing the joint durability. Fracture-mechanics tests have been conducted, using a
tapered double-cantilever beam (TDCB) specimen and the essence of the test procedure is the
examination of the failure behaviour over a wide range of rates of displacement. In order to assess
joint durability, tests have been carried out at various levels of relative humidity. Further, two
different substrates, an aluminium-alloy and a steel, have been employed, along with either (a) a
grit-blast and degrease (‘GBD’) pretreatment or (b) a silane primer (‘GBS’) pretreatment prior to
bonding. The adhesive employed was a commercially-available rubber-toughened epoxy. In
addition, the loci of failure have been assessed using scanning electron microscopy (SEM) and X-
ray photoelectron spectroscopy (XPS) to help identify the mechanisms of failure.
EXPERIMENTAL
Materials and Surface Pretreatments
To determine the adhesive fracture energy, Gc, an adhesively-bonded tapered double-cantilever
beam (TDCB) specimen was employed, see Figure 1. The adhesive employed was a hot-cured
rubber-toughened epoxy-paste adhesive that was based upon a diglycidyl ether of bisphenol-A
epoxy cured with dicyandiamide. The substrates were manufactured from either steel (Grade BS
970 070M55) or aluminium alloy (Grade BS 7075 (unclad)). Their compositions are given in
Tables 1 and 2 respectively.
For both types of substrate, two different surface pretreatments prior to bonding were
employed. The first surface pretreatment consisted of degreasing the substrates in a liquid bath of
boiling 1,1,1-trichloroethylene which was followed by grit-blasting using 60µm-78µm mesh
alumina particles. The substrates were then vapour degreased above a bath of boiling
trichloroethylene and allowed to cool to room temperature. This pretreatment is denoted as the
‘GBD’ pretreatment. In the second pretreatment employed, the previous grit-blasting and

5
degreasing procedures were first undertaken which was then followed by the application of a
silane-based primer, to give the ‘GBS’ pretreatment. A 1%w/w solution of γ-
glycidoxypropyltrimethoxy silane (GPS) solution, using a 90:10 by weight of ethanol:deionised
water mixture, was prepared and its pH was adjusted to approximately five by the addition of
acetic acid. This solution was stirred for 60 minutes to allow complete hydrolysis of the GPS to
occur. The solution was then painted onto the surfaces of the substrates that were to be bonded,
using a small brush. The substrates were drained onto a tissue and the GPS layer was cured at
93oC for 60 minutes. This procedure is very similar to that recommended by Digby and Shaw [5].
Joint Preparation
At the end of the substrates where the load was to be applied, a thin layer of silicon-based release
agent was painted over a length of about 90 mm of the substrate surface to act as a precrack.
Applying the release agent with a ‘chevron-shaped’ end was found to give a precrack that tended
to promote stable failure, as opposed to unstable failure, as described below.
The adhesive was degassed under vacuum for a short time at 80oC and was then applied
to the faces of the substrates to be bonded using a spatula. The thickness of the adhesive layer was
0.4 mm and was controlled via thin steel wires inserted into either end of the TDCB specimen.
The adhesive layer was cured by heating the adhesive for two hours at 130oC, as monitored via an
in-situ thermocouple, and the joints were then cooled in the oven overnight.
Fracture-Mechanics Tests
Tests were conducted at a constant rate of displacement, y , of the crosshead of the tensile testing
machine and the crack length was monitored as a function of time using a video camera. The rate
of displacement used for these monotonically-loaded tests was varied between 0.005 to 10
mm/minute. The tests were conducted at 21±2°C in an environmental chamber which permitted a

6
wide range of relative humidities to be employed. The relative humidity, RH, in the
environmental chamber was controlled using various salt solutions [6] and was measured using a
hair hygrometer. The experimentally measured RH values were in close agreement with the
expected RH values, see Table 3.
The value of the adhesive fracture energy, Gc, was determined using the expression:
dadC.
bP
G cc 2
2= (1)
where Pc is the critical load for crack growth as discussed below, a is the crack length, b is the
width of the specimen and C is the compliance of the specimen (C = y/P; where y is the
displacement and P is the load).
Examination of the Fracture Surfaces
In the present work, a ‘JEOL JSM 5300’ scanning electron microscope was used to examine the
surfaces of the fractured joints. As it is not always possible to determine with certainty the locus
of failure using a scanning electron microscope (for example, a very thin layer of adhesive or
oxide would not be detectable), X-ray photoelectron spectroscopy was also employed. The
apparatus used in the present study was a ‘VG Scientific Sigma Probe’ spectrometer. Survey
spectra were acquired with a pass energy of 100 eV and the high resolution spectra with a pass
energy of 50 eV. Quantitative surface chemical analyses and peak fitting were undertaken on the
high resolution spectra using the software provided by the manufacturer.

7
CRACK PROPAGATION STUDIES AT 55%RH
Introduction
Before considering the effects of the relative humidity of the test environment on the bonded
joints in detail, it is useful to consider the general form of the relationships which were obtained
between the adhesive fracture energy, Gc, and the corresponding crack velocity, a . These are
shown in Figures 2 and 3 for the aluminium-alloy and the steel joints that were tested at 55%
relative humidity, RH, (which was the ambient RH in the air-conditioned laboratory) where the
data are plotted in the form of log10 Gc versus log10 a . In these figures, results for the two
pretreatments (i.e. the ‘GBD’ and ‘GBS’) are given for both types of joints. Three different
regions of crack growth behaviour may be identified and these have been labelled ‘Region I’,
‘Region II’ and ‘Region III’, following the classic studies of Wiederhorn [7] on crack growth in
glass. ‘Region I’ occurred at relatively low rates of displacement and the fracture was stable in
nature and was visually interfacial, whereas ‘Region III’ was observed at relatively high rates of
displacement and the fracture was unstable and essentially cohesive in the adhesive layer.
‘Region II’ was the transition region between ‘Region I’ and ‘Region III’.
‘Region I’ Behaviour
This region was observed at relatively low rates of displacement, y , and the crack propagated in
a stable manner visually along the substrate/adhesive interface. During crack growth in ‘Region
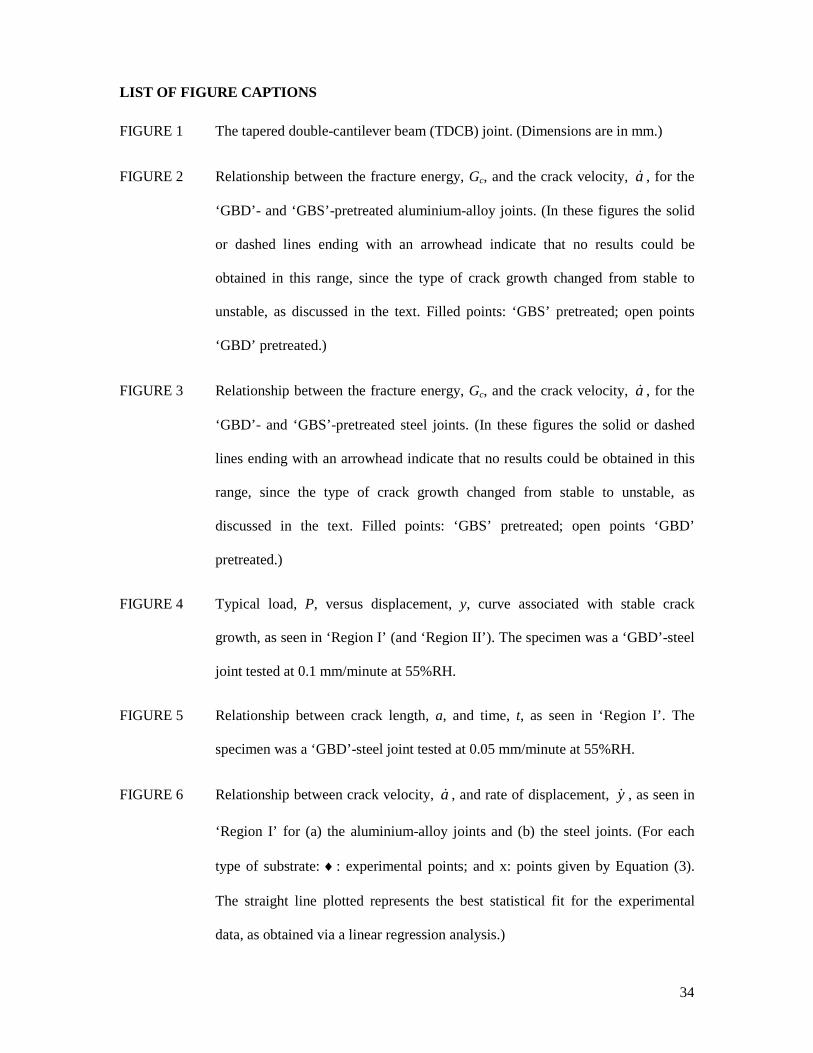
I’, the load was essentially constant at a value of Pc, and a typical load, P, versus displacement, y,
curve associated with stable crack growth is shown in Figure 4. The average value of the load, Pc,
for crack growth was employed to determine the value of the adhesive fracture energy, Gc, as
indicated above (see Equation (1)).

8
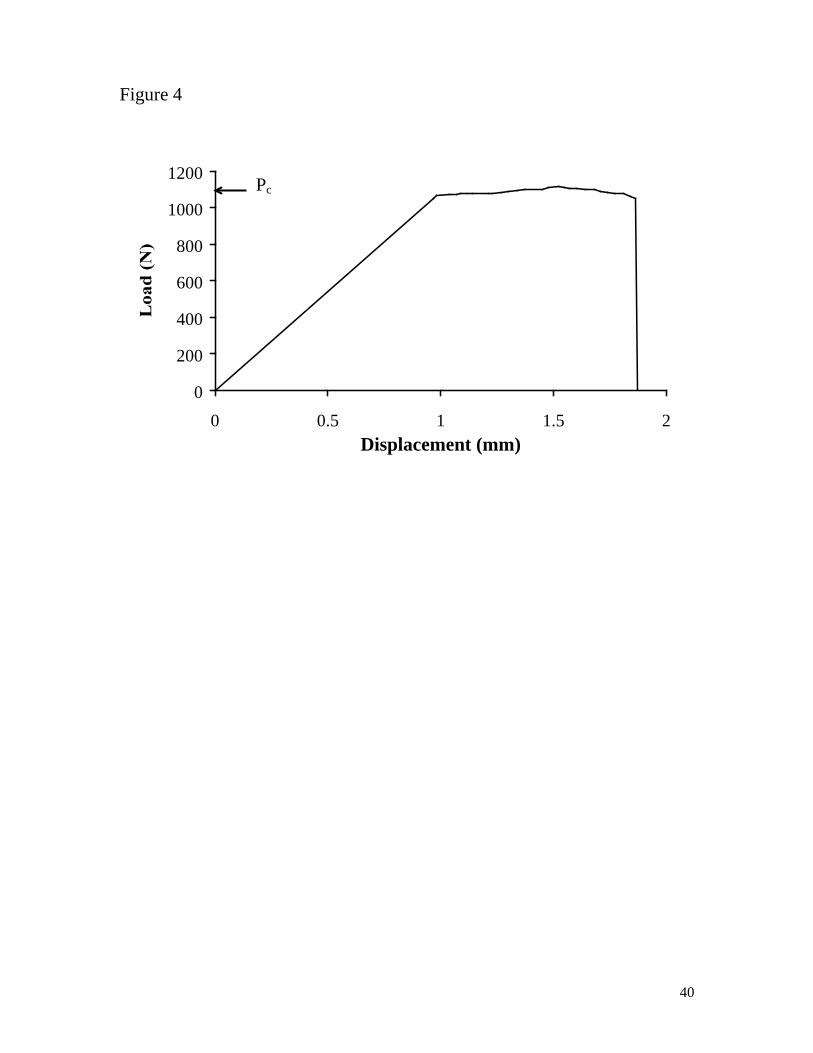
For a test at a given rate of displacement, y , the relationship between crack length, a,
and time, t, was linear as shown in Figure 5 which leads, of course, to a constant value of the
crack velocity, a , throughout the test, as the crack propagates down the length of the TDCB
specimen. The higher the rate of displacement employed within ‘Region I’, then the higher the
resulting crack velocity, as illustrated in Figure 6. Thus, for a given joint system, the crack
velocity, a , is controlled by the rate of displacement, y , of the crosshead. A theoretical
relationship between a and y may be derived using simple beam theory [8], assuming that the
load, Pc, at fracture remains constant for a given TDCB test. Thus, the derivative of the
compliance is given by:
yP
Cc
⋅=1
(2)
Rearranging Equation (1) using Equation (2) yields:
ybGP
ac
c ⋅=2
(3)
The values of the crack velocity, a , versus the applied rate of displacement, y , of the crosshead
from both the experiments and Equation (3) are shown in Figures 6a and b for the aluminium-
alloy and the steel joints, respectively. The agreement between the experimental and the
theoretical values is relatively good.
As may be seen from Figures 2 and 3, for the aluminium-alloy and steel joints
respectively, in ‘Region I’ the value of Gc is not greatly dependent upon the value of the
corresponding crack velocity, a . The locus of joint failure associated with this type of stable
9
crack growth in ‘Region I’ was always visually interfacial between the adhesive and the substrate.
In Figures 2 and 3, the final point shown for the Gc versus a relationships (i.e. at the highest
value of a ) for ‘Region I’ behaviour represents the fastest crack velocity that could be recorded.
Indeed, increasing the rate of displacement of the test above this value by a small increment led to
the observation of ‘Region II’ or ‘Region III’ behaviour.
‘Region III’ Behaviour
‘Region III’ behaviour was observed at relatively high rates of displacement, y . Here the crack
grew in an unstable, stick-slip manner with the crack growing in an uncontrolled way, at a
relatively fast velocity, and then arresting. These observations are clearly in direct contrast to the
results from ‘Region I’. Furthermore, unlike that found in ‘Region I’, the locus of joint failure in
‘Region III’ was always essentially cohesive through the adhesive layer.
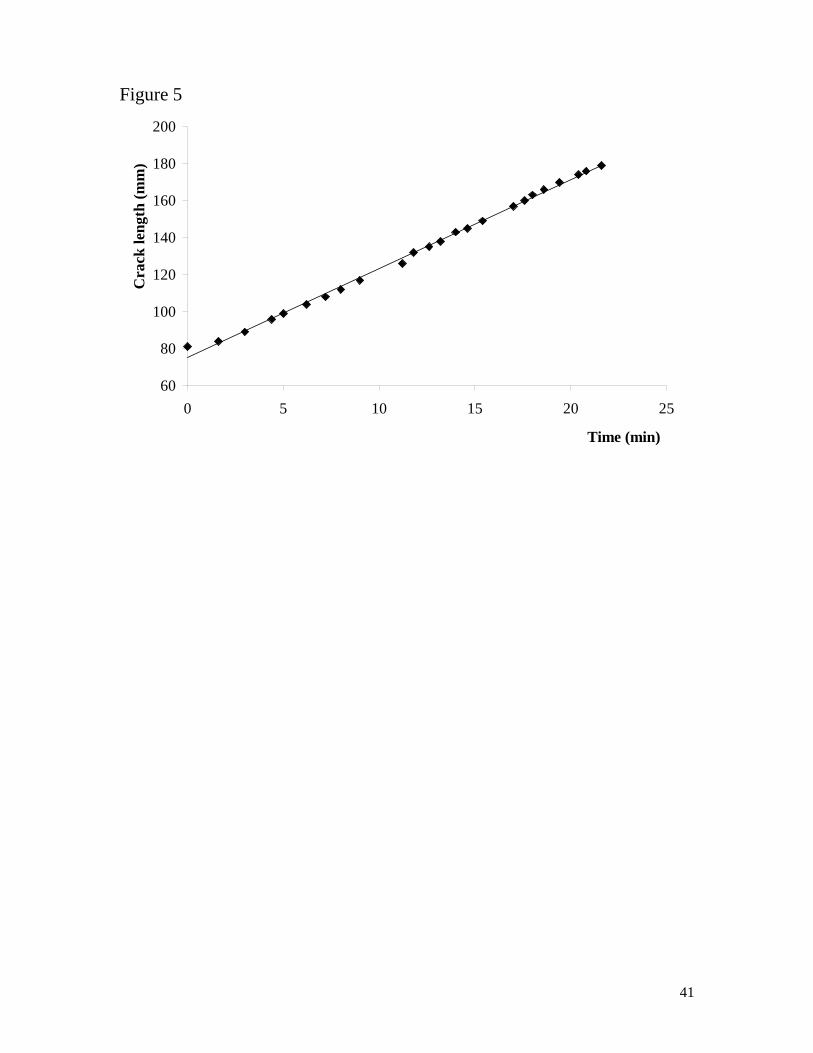
This type of unstable crack growth has a significant effect on the associated load, P,
versus displacement, y, curve which now had a characteristic saw-tooth appearance, as may be
seen from Figure 7. The peak values of the load, Pc, represent the value of the load for the onset
of crack growth and the average of these values was used to determine the value of the adhesive
fracture energy, Gc, as indicated above. The values of Gc obtained are of the order expected for
this type of adhesive [4]. When unstable crack growth was observed the crack propagated at a
relatively high velocity, which was too high to be measured using the video camera. However, an
approximate value of the crack velocity was estimated from previously published data by Gledhill
and Kinloch [9]. They applied a grid of conductive paint to the side of the TDCB specimen and,
via the change in electrical resistance of the grid as the crack propagated and ruptured the paint
grid, obtained the relationship between Gc and a for a similar adhesive system which exhibited
unstable crack growth. Using the data of Gledhill and Kinloch, the crack velocity corresponding
to the Gc value in ‘Region III’ for the present tests was about 20 km/minute for both the ‘GBD’-

10
and ‘GBS’-pretreated joints. This value was therefore taken to represent the resulting crack
velocity for unstable crack growth in the present studies. This is obviously an approximation, but
the absolute value of the crack velocity associated with the unstable crack growth ‘Region III’ has
no significant effect on the interpretation of the results obtained in the present study.
Finally, it is noteworthy that Arnott and Kindermann [10] have also studied the effect of a
constant rate of displacement on the value of Gc of structural joints. Although they did observe in
their experiments what we have termed ‘Region III’ behaviour, such cohesive in the adhesive
failure was still associated with stable crack growth
‘Region II’ Behaviour
‘Region II’ is a transition region between ‘Region I’ and ‘Region III’. Two sub-types of ‘Region
II’ were identified as explained below, denoted as ‘Region IIa’ and ‘Region IIb’ respectively.
In the transition region ‘Region IIa’ data could be obtained for joints where the values of
Gc were intermediate between those recorded in ‘Region I’ and those in ‘Region III’. This
behaviour may be seen clearly in Figures 2 and 3 for the ‘GBD’-pretreated aluminium-alloy and
steel joints, respectively. In ‘Region IIa’, the locus of joint failure associated with this type of
stable crack growth was always visually interfacial between the adhesive and the substrate, as was
observed in ‘Region I’.
In ‘Region IIb’ it was not possible to obtain experimental data in the transition region
between ‘Region I’ and ‘Region III’, as it was for ‘Region IIa’. Furthermore, in some instances
the increase in the value of Gc on going from ‘Region I’ to ‘Region III’ behaviour was relatively
low. The regions denoted ‘Regions IIb’ in Figures 2 and 3 for the ‘GBS’-pretreated aluminium-
alloy and steel joints, respectively, illustrate both of these aspects for the ‘Region IIb’ behaviour.

11
Thus, the term ‘Region IIb’ is simply used to represent a change in the type of crack growth, i.e.
from stable to stick-slip crack growth, which is always accompanied by a change from visually
interfacial to cohesive in the adhesive failure, as the rate of displacement, y , is steadily
increased.
Effect of Substrate
As noted above, the results for the values of Gc as a function of corresponding crack velocity, a ,
are shown for the aluminium-alloy and steel joints in Figures 2 and 3, respectively. For the data
associated with both ‘Region I’ and ‘Region III’, there is no statistical difference in the values of
Gc associated with the aluminium-alloy and steel joints for a given type of surface pretreatment.
Effect of Surface Pretreatment
The effect of the type of surface pretreatment employed is evident in all three regions of the
fracture behaviour of these joints, as may been seen from Figures 2 and 3.
In ‘Region I’, the values of Gc for the ‘GBS’-pretreated joints are clearly higher than for
the ‘GBD’-pretreated joints for both the aluminium-alloy and the steel substrates, although the
locus of failure was visually at, or very close to, the adhesive/substrate interface for all these
types of joint. Nevertheless, it is noteworthy that the slope of the Gc versus a relationship is not
affected by the surface pretreatment employed.
In ‘Region III’, the values of Gc for the ‘GBS’-pretreated joints were again somewhat
higher than for the ‘GBD’-pretreated joints, and this was observed for both the aluminium-alloy
and the steel joints, even though the locus of failure was essentially cohesive in the adhesive layer
in all cases. The values of Gc, considering both types of substrate, were 1010 J/m2 (±100 J/m2)
and 780 J/m2 (±100 J/m2) for the ‘GBS’- and ‘GBD’-pretreated joints, respectively. This

12
intriguing observation is discussed in more detail below, when the mechanisms of failure are
examined.
Finally, considering the onset of ‘Region II’ behaviour, the maximum velocity that could
be sustained in ‘Region I’, before the transition to ‘Region III’ behaviour was observed, was far
greater for the ‘GBD’-pretreated joints than for the ‘GBS’-pretreated joints. For instance, the
maximum velocity measured in ‘Region I’ for the ‘GBD’-pretreated aluminium-alloy joints was 5
mm/minute, whereas for the ‘GBS’-pretreated aluminium-alloy joints it was 1 mm/minute. Thus,
the transition ‘Region II’ occurred in the ‘GBD’-pretreated joints at a significantly higher rate of
displacement than in the ‘GBS’-pretreated joints.
EFFECT OF RELATIVE HUMIDITY
Introduction
To explore the interactions between the relative humidity and the rate of displacement, firstly the
relationships shown above between the adhesive fracture energy, Gc, and the corresponding crack
velocity, a , at 55%RH were studied for the ‘GBD’-pretreated aluminium-alloy joints as a
function of the relative humidity. These results are shown in Figure 8.
In ‘Region I’, the slopes of the Gc versus a relationships obtained at the different values
of RH are essentially the same, although the height of the Gc versus a relationship, with respect
to the Gc axis, is very dependent upon the value of the relative humidity employed. For example,
Gc ≈ 700 J/m2 at 0%RH but Gc ≈ 300 J/m2 at 100%RH. It is very noteworthy that that there is
‘Region I’ behaviour observed at 0%RH, and it is considered that the use of P2O5 would indeed
give a 0%RH test environment, see Table 3. This demonstrates that ‘Region I’ behaviour is not
solely the result of the presence of water molecules at the crack tip. This observation from the
present work is discussed further below.

13
Considering ‘Region III’, it may be seen that there is no significant effect of the relative
humidity on the value of Gc in this region where unstable, stick-slip crack growth is observed.
Indeed, since the locus of failure is cohesive in the adhesive and the timescale of the experiment
gives relatively little scope for water diffusion and plasticisation of the adhesive, this observation
would indeed be expected.
Effect of Relative Humidity and Surface Pretreatment in ‘Region I’
Introduction
From the above results, it is evident that the most pronounced effects of varying the relative
humidity are seen in ‘Region I’, when the crack velocity is relatively low and the joints exhibit a
visual locus of failure at the adhesive/substrate interface. The effect of relative humidity was
therefore explored in detail by selecting a rate of displacement which should essentially lead to
‘Region I’ behaviour, although as will be seen below some ‘Region III’ behaviour was still
recorded at the lowest relative humidities. The ‘GBD’-pretreated aluminium-alloy joints were
therefore tested at a rate of displacement of 0.02 mm/minute whilst the ‘GBS’-pretreated
aluminium-alloy joints were tested at a rate of displacement of 0.005 mm/minute. The resulting
average crack velocities were 1.15±0.20 mm/minute and 0.25±0.10 mm/minute for the ‘GBD’-
and ‘GBS’-pretreated joints, respectively.
The ‘GBD’-Pretreated Aluminium-Alloy Joints
The results for the ‘GBD’-pretreated aluminium-alloy joints tested at a rate of 0.02 mm/minute
are shown in Figure 9 where the value of Gc is given as a function of the measured RH. The
straight line plotted through these data represents the best statistical fit via a linear regression
analysis to the results which exhibited stable crack growth, i.e. ‘Region I’ behaviour. As may be
seen, the vast majority of the joints tested exhibit ‘Region I’ behaviour and there is a clear

14
dependence of the value of Gc upon the RH, with the value of Gc decreasing steadily as the RH is
increased. However, at the lowest values of RH, a few joints exhibited ‘Region III’ behaviour and
thus failed cohesively through the adhesive layer with a relatively high value of Gc being
recorded.
The ‘GBS’-Pretreated Aluminium-Alloy Joints
The results for the ‘GBS’-pretreated aluminium-alloy joints tested at a rate of 0.005 mm/minute
are shown in Figure 10 where the value of Gc is given as a function of the measured RH. Again,
the straight line plotted through these data represents the best statistical fit via a linear regression
analysis to the results which exhibited ‘Region I’ behaviour. As observed for the ‘GBD’-
pretreated joints, the vast majority of the joints tested exhibited ‘Region I’ behaviour and the
value of Gc decreases steadily as the RH is increased. However, at the lowest values of RH, the
joints consistently exhibited ‘Region III’ behaviour and thus failed cohesively through the
adhesive layer with a relatively high value of Gc being recorded.
There are some noticeable differences arising from the effects of the two different surface
pretreatments. Firstly, at relatively low values of RH, the transition from ‘Region III’ to ‘Region
I’ behaviour is far more marked for the ‘GBS’-pretreated joints than for the ‘GBD’-pretreated
joints. Indeed, for the ‘GBS’-pretreated joints one could infer that a critical RH of about 20%RH
exists, below which interfacial attack and weakening of the joints does not occur. The concept
that a minimum, or critical, concentration of water needs to be present in order for the mechanism
of environmental attack to proceed has been previously suggested (e.g. [11, 12]) and obviously is
in agreement with the transition currently observed between the ‘Region I’ and the ‘Region III’
behaviour, as discussed in detail below. Secondly, for the ‘GBS’-pretreated joints the levels of Gc
are significantly higher for both ‘Region I’ and ‘Region III’ behaviour. This may be readily seen
from Figure 11, where the data from Figures 9 and 10 are directly compared. The underlying

15
mechanisms for this observation are discussed below. (Note: in Figure 11 the slope for the results
of Gc versus RH for the ‘GBD’-pretreated joints (see Figure 9) is re-plotted to have the same
slope as for the ‘GBS’-pretreated joints (see Figure 10), since this is within the experimental
scatter band.)
MECHANISMS OF FAILURE IN ‘REGION I’
Introduction
The above results have led to several interesting observations and highlight the interaction
between the rate of displacement, the relative humidity of the test environment and the type of
surface pretreatment employed. The mechanisms of failure responsible for these observations will
now be considered.
The Relationship Between Gc and a
From the results shown in Figures 2, 3 and 8 the relationship between Gc versus a may be
described by a power-law equation of the form:
nc aG α (4)
where the slope of the relationship is given by the power, n. Furthermore, the value of n clearly is
relatively low in value and is independent of the RH, the type of substrate and the surface
pretreatment employed.
Previous workers [13-15] have found a similar relationship for crack growth in
thermoplastic and thermosetting polymers, which is also associated with a relatively low value of
n. Williams [14] has postulated that viscoelastic processes occurring at the crack tip control the

16
dependence of Gc upon the crack velocity, a , and that the value of n is related to the polymer’s
viscoelastic properties by:
rtanntan δ=π2
(5)
where tanδr is the viscoelastic loss factor. For the epoxy adhesive, from dynamic mechanical
thermal analysis (DMTA) studies, the value of tanδr at room temperature and a relatively low test
frequency of 1 rad/s is 0.014 [16]. From Equation (5), this value of tanδr yields a value of n ≈
0.01. This value of n ≈ 0.01 would obviously give an excellent fit to the slopes of the Gc versus a
relationships shown in Figures 2, 3 and 8, i.e. very little rate dependence of the value of Gc is
observed in ‘Region I’. Also, this value of n is in very good agreement with values from previous
work where the ‘bulk’ fracture of epoxy polymers was studied [9].
Thus, from (a) the current values of n being very similar as deduced from the fracture
tests and the DMTA studies and (b) by analogy to previous work [13-15], it appears that the
viscoelastic processes which operate in the vicinity of the crack tip control the rate dependence of
the toughness, Gc, of the present adhesive joints. This explains why no effect of the RH, substrate
type or surface pretreatment used is observed with respect to the rate dependence; i.e. with respect
to the slope, n, of the Gc versus a logarithmic relationship.
Constant Crack Opening Displacement Criterion
When the rate dependence of the Gc versus a relationship is governed by viscoelastic processes
which occur in the viscoelastic-plastic zone ahead of the crack tip, then it is invariably found that
the fracture process can be considered to be controlled by a critical value of the crack opening
displacement, δt, where the value of δt is given by:
y
ct
Gσ
=δ (6)

17
and where σy is the uniaxial yield stress of the polymer or polymeric adhesive layer.
The yield stress of the adhesive used in the present studies was measured via plane-strain
compression tests and was found to increase somewhat as the strain rate, ε , was increased, as
would be expected: the uniaxial yield stress, σy, so deduced increased from 71 MPa to 75 MPa as
the strain rate was increased over two decades.
From Equation (7), the value of the critical crack opening displacement, δt, may be
deduced and since, there is very little rate dependence of the terms Gc or σy, then a constant value
of δt, independent of crack velocity, is obtained. For the ‘GBD’- and the ‘GBS’-pretreated joints,
the values of the critical crack opening displacement were calculated to be about 5µm and 12 µm
respectively. These values are not significantly dependent upon the type of substrate, but the far
higher value of δt ascertained for the ‘GBS’-pretreated joints again reflects the superior durability
offered by this form of surface pretreatment.
Environmental Attack
Introduction
First, it must be underlined that interfacial fracture in ‘Region I’ is not intrinsically the result of
environmental attack, since joints tested at 0%RH were observed to exhibit ‘Region I’ behaviour
and hence to fail visually along the interface between the adhesive and the substrate. However,
there is a clear effect of the relative humidity of the test environment in ‘Region I’: the higher the
relative humidity, the lower the adhesive fracture energy, see Figures 8 to 11. As commented
above, the type of substrate (i.e. whether aluminium-alloy or steel) appears to play no significant
role in the degree of environmental attack, but the choice of surface pretreatment (i.e. ‘GBD’
versus ‘GBS’) and the concentration of water (i.e. the RH) are critical factors, as may be seen
18
from Figures 9 to 11. Nonetheless, it should again be emphasised that, whilst the absolute value
of Gc is a function of these parameters, the dependence of Gc upon the crack velocity, a , is
controlled by the viscoelastic nature of the epoxy adhesive, as discussed above.
These observations firstly imply that in ‘Region I’, at values of RH greater than 0%RH,
as the RH increases then higher concentrations of water reach the vicinity of the crack tip and
increasingly attack and weaken the interphase regions of the joints. Hence, the value of Gc
decreases, although a critical concentration of water molecules may have to be attained in the
case of the ‘GBS’-pretreated joints before any environmental attack mechanism may be initiated.
Secondly, the water molecules reach the vicinity of the crack tip at a sufficiently fast rate to
enable the environmental attack mechanism to occur readily, since the Gc versus crack velocity
dependence is controlled by the viscoelastic nature of the epoxy adhesive, not by the RH
employed.
The ‘GBD’-Pretreated Joints
In the case of the ‘GBD’-pretreated joints, the intrinsic stability of the adhesive/substrate interface
in the presence of an aqueous environment in the long term may be assessed from the
thermodynamic arguments advanced by Gledhill and Kinloch [17]. The thermodynamic work of
adhesion is defined as the energy required to separate unit area of two phases forming an
interface. If only secondary forces (e.g. van der Waals forces) are acting across the interface
which is considered to be the main mechanism of adhesion of most epoxy adhesives, then the
work of adhesion, WA, in an inert medium may be expressed by:
assaAW γγγ −+= (7)

19
where γa and γs are the surface free energies of the adhesive and substrate, respectively, and γas is
the interfacial free energy. In the presence of a liquid (denoted by the suffix ‘l’), such as water,
this expression must be modified and the work of adhesion WAl is now given by:
asslalAlW γγγ −+= (8)
where γal and γsl are the interfacial free energies between the adhesive/liquid and substrate/liquid
interfaces, respectively. For an adhesive/substrate interface the work of adhesion, WA, in an inert
atmosphere, for example dry air, usually has a positive value indicating thermodynamic stability
of the interface. However, in the presence of a liquid the thermodynamic work of adhesion, WAl,
may well have a negative value indicating that the interface is now unstable and may dissociate.
Thus, calculation of the terms WA and WAl may enable the durability of the interface in the long
term to be predicted. The values of WA and WAl for epoxy/steel joints, respectively, have been
reported to be +291 and –255 mJ/m2 [17]; and for epoxy/aluminium-alloy joints +232 and –137
mJ/m2 [18]. These values lead to the conclusion that the epoxy/oxide interfaces will indeed be
susceptible to attack and degradation upon exposure to water molecules.
To assist in establishing the mechanisms of failure for the ‘GBD’-pretreated joint, the
exact locus of failure in ‘Region I’ was determined using scanning electron microscopy and X-ray
photoelectron spectroscopy (XPS). The joints failed visually along the adhesive/substrate
interface. Notwithstanding this observation, failure could have occurred within the adhesive layer,
or oxide layer, with a very thin layer of adhesive, or oxide, retained on the opposite side of the
joint which would be invisible to the naked eye. The substrate beam of a failed joint that visually
appeared to have no adhesive left on its surface was referred to as the ‘metal’ side, whilst the
beam that was visually covered with adhesive was termed the ‘adhesive’ side.

20
When the ‘metal’ sides of a fractured ‘GBD’-pretreated aluminium-alloy joint and a
‘GBD’-pretreated steel joint were examined using scanning electron microscopy, only a few
isolated areas of the ‘metal’ side of the joint appeared to be covered by any retained adhesive.
The remainder of the surface appeared to be metallic in nature, implying that interfacial failure
had occurred.
The XPS spectra of the control (i.e. unbonded) adhesive and ‘GBD’-pretreated
aluminium-alloy materials are shown in Figures 12 and 13, respectively. As expected the
aluminium-alloy surface prior to bonding is covered by a thin layer of carbonaceous
contamination adsorbed from the atmosphere, as may be seen from the relatively strong C1s peak
in Figure 13. However, previous work [19] has established that such contamination is readily
absorbed and displaced during the bonding operation.
The XPS spectra of the ‘adhesive’ and ‘metal’ sides taken from a failed ‘GBD’-pretreated
aluminium-alloy joint, tested at 55%RH at a crack velocity of approximately 0.3 mm/minute, are
shown in Figures 14a and b, respectively. The spectrum of the ‘adhesive' side is rather similar to
that of the control adhesive material (see Figure 12) and that of the ‘metal’ side is very similar to
that of the control ‘GBD’-pretreated aluminium-alloy material (see Figure 13). This suggests that
the failure occurred mainly along the adhesive/substrate interface. However, the presence of
aluminium peaks in the spectrum of the ‘adhesive’ side (see Figure 14a) reveals that the fracture
occurred also to a small extent in the oxide layer. Further, the increase in the ‘C/O’ ratio in the
XPS spectrum of the ‘metal’ failure side (see Figure 14b) compared with that recorded from the
control ‘GBD’-pretreated aluminium-alloy (see Figure 13) is indicative of a small amount of
adhesive being retained on the ‘metal’ side. This observation is supported by the presence of a
small ‘N1s’ signal (at a binding energy of about 400 eV) which is presumably attributable to a
curing agent or other, minor, component of the adhesive formulation. Thus, it may be concluded

21
that the ‘GBD’-pretreated aluminium-alloy joints failed mainly along the adhesive/substrate
interface. However, the crack occasionally travelled in the oxide and in the adhesive layer and
this might be simply be due to the crack growing through the oxide asperities, and leaving
adhesive retained in the ‘valleys’ of the very rough surface, as the crack travelled mainly along
the substrate/adhesive interface Similar conclusions were reached for the ‘GBD’-pretreated steel
joints.
The fact that the fracture occurred mainly at the interface is in agreement with the
thermodynamic arguments reported above. However, it should be borne in mind that the
thermodynamic approach describes the behaviour of the joints at equilibrium (i.e. over a
relatively long timescale) and, given the short length of the test (i.e. a few hours), it is unlikely
that the failure solely occurred as a result of the presence of water molecules. Thus, it is suggested
that the joints failed due to both the application of a stress and the presence of water molecules at
the crack tip, a phenomenon similar to stress corrosion cracking which occurs in metals and
ceramics (see for example [20]). As the relative humidity was increased, the number of water
molecules was higher and the value of the adhesive fracture energy was seen to decrease, as
indeed would be expected.
‘GBS’-Pretreated Joints
Silane pretreatments are known to increase the degree of interfacial adhesion, see for example
[21-24]. This increase in the intrinsic adhesion has been attributed to the formation of covalent
bonds between the metallic substrate and silane primer, and in turn between the silane primer and
the adhesive layer; i.e. the silane primer acts as a ‘coupling agent’. Indeed, covalent bonds
between the substrates and the silane, based upon GPS, have been detected for steel [21,23] and
aluminium [24] using secondary ion-mass spectrometry.

22
From using scanning electron microscopy, the ‘metal’ side of a ‘GBS’-pretreated
aluminium-alloy joint and a ‘GBS’-pretreated steel joint appeared to be predominantly covered
with adhesive.
The XPS spectra of the control (i.e. unbonded) adhesive and ‘GBS’-pretreated
aluminium-alloy materials are shown in Figures 12 and 15, respectively. The XPS spectra of the
‘adhesive’ and ‘metal’ sides taken from a failed ‘GBS’-pretreated aluminium-alloy joint, tested at
55%RH at a crack velocity of approximately 0.15 mm/minute, are shown in Figures 16a and 16b,
respectively. The ratio of the ‘C1s’ and ‘O1s’ peaks in these spectra appear to be of the same
order as that for the control adhesive (see Figure 12), which suggests that the failure occurred
mainly in the adhesive layer. However, the presence of aluminium and silicon on the ‘adhesive’
side of the ‘GBS’-pretreated aluminium-alloy joint (see Figure 16a) suggests that fracture also
occurred to a certain extent in the silane and oxide layers. This is presumably due to the asperities
on the grit-blasted substrate surface being pulled off during failure and indicates a complex
fracture path. Similar conclusions were reached for the ‘GBS’-pretreated steel joints.
The fact that the failure occurred mainly in the adhesive layer is consistent with the
presence of covalent bonds being formed across the adhesive/substrate interface when a silane
coupling agent is used, as widely reported in the literature. As for the ‘GBD’-pretreated joints, it
appears that the ‘GBS’-pretreated joints failed as a result of both the application of a stress and
the presence of water molecules at the crack tip. And as the relative humidity was increased, the
number of water molecules at the crack tip increased and the adhesive fracture energy decreased
as a result, possibly due to the interfacial covalent bonds being attacked and ruptured. Although
there is a clear suggestion that a critical concentration of water molecules may have to be attained
in the case of the ‘GBS’ surface-treated joints before any such environmental attack occurs.

23
MECHANISMS OF FAILURE IN ‘REGION III’
‘Region III’ was observed at relatively high rates of displacement. In this region, the crack grew
in a stick-slip manner, mainly cohesively in the adhesive layer, and the adhesive fracture energy,
Gc, was relatively high. Indeed, as mentioned previously, the crack velocity was estimated to be
equal to approximately 20 km/minute. Furthermore, the values of the adhesive fracture energy did
not depend on the test environment, but only on the surface pretreatment.
The fact that Gc was independent of the test environment and that the crack velocity was
relatively high suggests that ‘Region III’ corresponds to the situation when the rate of flow of
water molecules to the crack tip is substantially slower than the rate of crack advance. Thus, the
concentration of water molecules reaching the crack tip is below that needed for environmental
attack on the interphase to occur. Hence, a relative high value of Gc is recorded with the locus of
joint failure being mainly cohesively in the adhesive layer. This suggested mechanism is in
agreement with similar work which has been previously reported on glass [7] and thermoplastic
polymers [13, 14].
In ‘Region III’, the ‘GBS’-pretreated joints had a relatively high Gc value at crack
initiation of 1010 ±100 J/m2, compared with the GBD joints where the value of Gc was 780 ±100
J/m2. However, it should be noted that the ‘GBS’-pretreated joints always failed completely in the
adhesive layer. This is in contrast to the ‘GBD’-pretreated joints, where many of the joints
exhibited some fraction of interfacial failure at the very point of crack initiation; with completely
cohesive failure in the adhesive occurring as the crack propagated, at a relatively high velocity,
down the TDCB specimen. However, the value of Gc for the ‘GBD’-pretreated joints was not
significantly dependent upon the details of the locus of failure. This suggests that the difference in
the values of the Gc for the ‘GBD’- and ‘GBS’-pretreated joints was not due to any minor

24
difference in the locus of failure at crack initiation. The underlying reason for these intriguing
observations are discussed below.
THE TRANSITION FROM ‘REGION I’ TO ‘REGION III’ BEHAVIOUR
Maugis [25] has reviewed the transition from stable to stick-slip crack growth that occurs in
brittle materials as the crack velocity is increased. To model the transition between stable (i.e. our
‘Region I’ behaviour) and unstable crack growth (i.e. our ‘Region III’ behaviour), he assumed
that the log Gc versus log a curve observed experimentally was the result of the superposition of
two curves, as shown schematically in Figure 17:
(a) A curve corresponding to stable crack growth, i.e. curve ‘CAD’: which shows an increase
in Gc with crack velocity governed by viscoelastic losses, followed by a decrease in Gc.
The reason for this decrease is not clear, although this has been the subject of much
debate. Maugis [25] has attributed the decrease in Gc after point ‘A’ has been reached to a
significant reduction in the loss modulus, occurring when the crack propagates
sufficiently fast that the material tends to behave in a more elastic fashion. On the other
hand, Williams [14] has speculated that, for poly(methyl methacrylate), the decrease in Gc
reported to occur between 1.5 m/minute and 6 m/minute (see [26-29]) corresponded to
the case where the heat generated at the crack tip is not dissipated, resulting in a softening
of the polymer and a decrease in the fracture energy. Notwithstanding, other workers [26]
have suggested that the decrease in Gc is associated with a tanδR peak, and that this tanδR
peak is governed by the β process, i.e. the viscoelastic relaxation corresponding to
localised main-chain motions.

25
(b) A second curve corresponding to purely ‘brittle’ fracture with dynamic effects, i.e. curve
‘CDB’. In this region, the crack velocity cannot exceed the Rayleigh velocity, which is
the velocity of propagation of a stress wave travelling along a stress-free surface.
Now, for relatively low crack velocities, the initial dependence of fracture energy on
crack velocity is governed by viscoelastic losses, and the portion ‘CA’ of the curve ‘CAD’ is
appropriate, i.e. the portion of the curve ‘CA’ is equivalent to ‘Region I’ behaviour. However,
when the rate of test is now increased by a small increment and the fracture energy becomes
slightly greater than Gccrit (point ‘A’ on Figure 17), the crack is forced to jump to the curve
‘CDB’, and hence the crack velocity jumps suddenly from ca to 1a (i.e. point ‘B’ is now
attained). Thus, the essential argument is that the portion of the two curves ‘ADB’ is not
experimentally accessible: so that ‘Region I’ behaviour is seen (curve ‘CA’) and is followed by
‘Region III’ (point ‘B’).
However, in the present experiments, a further complication is that the transition from
‘Region I’ to ‘Region III’ behaviour is also accompanied by a change from visually interfacial
failure to cohesive fracture through the adhesive layer. There are two factors which need to be
considered to that may possibly explain this accompanying change in the locus of failure. Firstly,
that except at 0%RH, this change in the locus in failure upon going from ‘Region I’ to ‘Region
III’ will arise, at least in part, from the lack of environmental attack, and hence lack of associated
interfacial weakening, that occurs in ‘Region III’. However, from Figure 8, it may be seen that
this change in the locus of failure is also seen for the joints tested at 0%RH. Thus, secondly, it is
noteworthy that several groups of workers [e.g. 30-32] have clearly shown that the locus of joint
failure is not necessarily located where the joint may be at its weakest; e.g. the plane where the
value of Gc may be at its lowest. Instead, the locus is joint failure is governed by such factors as
the values of Gc for the various potential failure paths coupled with the local strain-energy release

26
rates, G, and stress fields available to initiate and propagate failure along these potential failure
paths. For example, the above workers have shown that an increase in the shear stress component
(i.e. Mode II (in-plane shear) component) at an interfacial crack tip would tend to favour the
crack kinking towards the centre-line of the adhesive layer. This arises since cracks always tend
to favour growing along a pure Mode I (tensile) path. Now, interfacial cracks between materials
possessing very different moduli and Poisson’s ratios do have a significant shear stress
component. In particular, Fleck et al. [31] have shown that for a crack in an adhesive joint a
relatively very small change in the Mode I/Mode II ratio in the stress field at the crack tip can
result in a change in the locus of failure from interfacial to cohesive in the adhesive layer. Thus, it
is suggested that, as the value of Gc increases in the present TDCB joints upon going from
‘Region I’ to ‘Region III’ behaviour, the shear stress component at the interfacial crack will
increase and so cause the change from a visually interfacial to a cohesive (in the adhesive layer)
locus of failure which is observed to accompany this change in behaviour.
Finally, we need to explain why the value of the adhesive fracture energy for stick-slip
crack growth (i.e. ‘Region III’) is higher for the ‘GBS’-pretreated joints than for the ‘GBD’-
pretreated joints, as was noted earlier. According to Maugis [25], the Gc value on the ‘dynamic
effects curve’, i.e. at point ‘B’, is dependent upon the Gc value in the stable regime of crack
growth prior to the instability occurring (i.e. the value of Gc at point ‘A’). Thus, if the portion of
the curve ‘CA’, corresponding to ‘Region I’ stable crack growth, is shifted upwards, then the Gc
value corresponding to point ‘B’ (i.e. ‘Region III’ behaviour) will also increase.
CONCLUSIONS
In the present study the adhesive fracture energy, Gc, of aluminium-alloy and steel joints, bonded
using a rubber-toughened epoxy, has been measured via a fracture-mechanics approach
employing tapered double-cantilever beam (TDCB) tests which were loaded monotonically. The

27
substrates were either (a) grit-blasted and degreased (‘GBD’) or (b) silane (‘GBS’) pretreated.
The monotonically-loaded tests were undertaken over a wide range of constant rates of
displacement, y , of the crosshead and at different levels of relative humidity. The adhesive
fracture energy, Gc, was determined as a function of the crack velocity, a . When the data were
plotted in the form of log10 Gc versus log10 a , three clearly different regions of crack growth
behaviour could be identified and these have been labelled ‘Region I’, ‘Region II’ and ‘Region
III’,
‘Region I’: At slow crack velocities, the value of the adhesive fracture energy, Gc, was relatively
low and the crack grew visually along the adhesive/substrate interface. The value of Gc was
almost constant with increasing crack velocity and the dependence of Gc upon the crack velocity,
a , was controlled by the viscoelastic nature of the epoxy adhesive. The low dependence of the
value of Gc upon the crack velocity was attributed to the low value of the viscoelastic loss factor
of the epoxy adhesive in this range, arising from the highly cross-linked structure of the epoxy
polymer. The Gc value was observed to decrease linearly with the relative humidity, since water
molecules were readily able to reach the crack tip and to attack the interface. Although, especially
for the ‘GBS’-pretreated joints, one could infer that a critical RH, below which interfacial attack
and weakening of the joints did not occur, might well exist. Further, the use of the silane
pretreatment was clearly successful in increasing the value of the adhesive fracture energy, Gc.
The improvement in joint durability observed in this ‘Region I’ when using the silane primer was
considered to arise from the formation of covalent bonds between the substrates and the adhesive.
‘Region III’: The crack velocity was constant and estimated to be equal to approximately 20
km/minute. The crack grew in a stick-slip manner, with relatively high values of fracture energy
at crack initiation. No water molecules were considered to be able to reach the crack tip, since the
environment had no effect on the value of Gc. The crack grew mainly cohesively in the adhesive
28
layer, possibly because the shear stress component of the local stress field at the crack tip was
sufficiently high so as to force the crack to kink towards the centre of the adhesive layer. In this
region, the ‘GBS’-pretreated joints had a higher Gc value at crack initiation than the ‘GBD’-
pretreated joints, due to the higher intrinsic adhesion achieved when employing the silane
pretreatment.
‘Region II’: Between ‘Region I’ and ‘Region III’, two types of transition region were observed,
termed either ‘Region IIa’ or ‘Region IIb’. In ‘Region IIa’, the crack grew stably along the
interface and the value of Gc increased sharply before the crack propagated cohesively in the
adhesive layer in a stick-slip manner (i.e. ‘Region III’ was attained). The crack velocity
(corresponding to the sharp increase in Gc) was considered to equivalent to the rate of water
molecules flowing to the crack tip. When the crack velocity was somewhat higher than the rate of
the flow of water molecules to the crack tip, then the concentration of water molecules at the
crack tip would be insufficient to cause interfacial attack and weakening. Hence, the value of Gc
now increased sharply to give ‘Region III’ behaviour. In ‘Region IIb’, only a change in the type
of crack growth was observed (i.e. from stable (interfacial) crack growth in ‘Region I’ to
unstable, slip-stick (cohesively in the adhesive) crack growth in ‘Region III’), with no sharp
increase in Gc being observed as in ‘Region IIa’.
Acknowledgements
The authors would like to thank Dr. D. Tod (QinetiQ) for financial support for Dr. C. Korenberg
and Mr. K.T. Tan and Dr. V. Tropsa (Imperial College London) for helpful discussions. They also
wish to thank Mr. Steve Greaves of the University of Surrey for conducting the XPS studies.

29
References
[1] A. J. Kinloch (Ed.), Durability of Structural Adhesives, (Applied Science, London and New York, 1983).
[2] R. J. Davies and A. J. Kinloch, In: Adhesion 13, K. W. Allen, Ed. (Elsevier, London, 1988), p.8-21.
[3] J. K. Jethwa and A. J. Kinloch, J. Adhesion 61, 71-95 (1997).
[4] A. J. Curley, H. Hadavinia, A. J. Kinloch and A. C. Taylor, Int. J. Fract. 103, 41-69 (2000).
[5] R. P. Digby and S. J. Shaw, Int. J. Adhesion and Adhesives 18, 261-264 (1998).
[6] F. E. M. O'Brien, J. Scientific Instruments 25, 73-76 (1948).
[7] S. M. Wiederhorn, J. Am. Ceram. Soc. 50, 407-414 (1967).
[8] B. R. K. Blackman, H. Hadavinia, A. J. Kinloch, M. Paraschi and J. G. Williams, Eng. Fract. Mech. 70, 233-248 (2003).
[9] R. A. Gledhill and A. J. Kinloch, J. Mater. Sci. Letters 10, 1261-1263 (1975).
[10] D. R. Arnott and M. R. Kindermann, J. Adhesion 48, 85-100 (1995).
[11] R. A. Gledhill and A. J. Kinloch and S. J. Shaw, J. Adhesion 11, 3-15 (1980).
[12] D.M. Brewis, J. Comyn, A.K. Raval and A.J. Kinloch, Int. J. Adhesion and Adhesives 10, 247-253 (1990).
[13] J. G. Williams and G. P. Marshall, Proc. R. Soc. Lond. A 342, 55-57 (1975).
[14] J. G. Williams, Fracture Mechanics of Polymers (Ellis Horwood Ltd, Chichester, 1984) p. 175-235.
[15] R. A. Gledhill, A. J. Kinloch, S. Yamini and R. J. Young, Polymer 19, 574-582 (1978).
[16] G. M. Kavanagh and D. A. Tod, Proceedings of the Euradh 2002-Adhesion’02 conference, Glasgow, UK (Institute of Materials, London, 2002) p.100-104.
[17] R. A. Gledhill and A. J. Kinloch, J. Adhesion 6, 315-330 (1974).
[18] A. J. Kinloch, W. A. Dukes and R. A. Gledhill, Adhesion Science and Technology Vol. B, (Plenum Press, New York, 1975). p.597-614.
[19] M.Gettings, F.S. Baker and A.J. Kinloch, J. Applied Polymer Sci., 21, 2375-2392 (1977).
[20] J. Yahalom and A. Aladjem (Ed.), Stress Corrosion Cracking (Freund, Tel Aviv, 1980).
[21] M. Gettings and A. J. Kinloch, J. Mater. Sci. 12, 2511-2518 (1977).

30
[22] E. P. Plueddeman (Ed.), Silane Coupling Agents, (Plenum Press, New York, 1982).
[23] S. J. Davis and J. F. Watts, Int. J. Adhesion and Adhesives 16, 5-15 (1996).
[24] M.-L. Abel, R. P. Digby, I. W. Fletcher and J. F. Watts, Surface and Interface Analysis 29, 115-125 (2000).
[25] D. Maugis, J. Mater. Sci. 20, 3041-3073 (1980).
[26] F. A. Johnson and J. C. Radon, Eng. Fract. Mech. 4, 555-576 (1972).
[27] J. G. Williams, Int. J. Fract. Mech. 8, 393-401 (1972).
[28] G. P. Marshall, L. H. Coutts and J. G. Williams, J. Mater. Sci. 9, 1409-1419 (1974).
[29] W. Doll and G. W. Weidmann, J. Mater. Sci. Letters 11, 2348-2350 (1976).
[30] J. S. Wang and Z. Suo, Acta Metall. Mater. 38, 1279-1290 (1990).
[31] N. A. Fleck, J. W. Hutchinson, and Z. Suo, Int. J. Solids and Structures 27, 1683-1703 (1991).
[32] A.J. Kinloch, E. Thrusabanjong and J.G. Williams, J. Mater. Sci. 26, 6260-6270 (1991).

31
Table 1 Chemical composition of BS 970 070M55 steel (by weight).
C Mn Si S P Fe
0.5-0.6 % 0.5-0.8% 0.15-0.35% 0.04% max 0.04% max balance

32
Table 2 Chemical composition of BS 7075 aluminium-alloy (by weight).
Zn Mg Cu Cr Fe Si Ti Al
5.1-6.1 % 2.1-2.8% 1.2-2.0% 0.18-0.4% 0.7% max 0.50% max 0.20% max balance

33
Table 3 Expected and measured relative humidities (RHs) obtained
from using the saturated salt solutions.
Saturated salt solution Expected RH Measured RH
CaHPO4.2H2O 95% 96-98%
Na2SO4 93% 88-94%
(NH4)2SO4 81% 78%
NaNO2 66% 58-72%
KNO2 45% 48-50%
CaCl2 32% 36-38%
CH3COOH 20% 19-22%
ZnCl2 10% 10-13%
P2O5 0% 1-5%
34
LIST OF FIGURE CAPTIONS
FIGURE 1 The tapered double-cantilever beam (TDCB) joint. (Dimensions are in mm.)
FIGURE 2 Relationship between the fracture energy, Gc, and the crack velocity, a , for the
‘GBD’- and ‘GBS’-pretreated aluminium-alloy joints. (In these figures the solid
or dashed lines ending with an arrowhead indicate that no results could be
obtained in this range, since the type of crack growth changed from stable to
unstable, as discussed in the text. Filled points: ‘GBS’ pretreated; open points
‘GBD’ pretreated.)
FIGURE 3 Relationship between the fracture energy, Gc, and the crack velocity, a , for the
‘GBD’- and ‘GBS’-pretreated steel joints. (In these figures the solid or dashed
lines ending with an arrowhead indicate that no results could be obtained in this
range, since the type of crack growth changed from stable to unstable, as
discussed in the text. Filled points: ‘GBS’ pretreated; open points ‘GBD’
pretreated.)
FIGURE 4 Typical load, P, versus displacement, y, curve associated with stable crack
growth, as seen in ‘Region I’ (and ‘Region II’). The specimen was a ‘GBD’-steel
joint tested at 0.1 mm/minute at 55%RH.
FIGURE 5 Relationship between crack length, a, and time, t, as seen in ‘Region I’. The
specimen was a ‘GBD’-steel joint tested at 0.05 mm/minute at 55%RH.
FIGURE 6 Relationship between crack velocity, a , and rate of displacement, y , as seen in
‘Region I’ for (a) the aluminium-alloy joints and (b) the steel joints. (For each
type of substrate: ♦: experimental points; and x: points given by Equation (3).
The straight line plotted represents the best statistical fit for the experimental
data, as obtained via a linear regression analysis.)

35
FIGURE 7 Typical load, P, versus displacement, y, curve associated with stick-slip crack
growth, as seen in ‘Region III’. The peaks correspond to crack initiation and the
valleys to crack arrest. The specimen was a ‘GBS’-pretreated aluminium-alloy
joint tested at 0.1 mm/minute at 55%RH.
FIGURE 8 Relationship between the fracture energy, Gc, and the crack velocity, a , for the
‘GBD’-pretreated aluminium-alloy joints obtained at 0%, 55% and 100%RH.
(Filled circles: 0%RH; open circles: 55%RH and open diamonds: 100%RH.)
FIGURE 9 Relationship between the fracture energy, Gc, and crack velocity, a , as a
function of the relative humidity for the ‘GBD’-pretreated aluminium-alloy joints
(Δ: joints exhibiting stick-slip crack growth; ♦: joints exhibiting stable crack
growth).
FIGURE 10 Relationship between the fracture energy, Gc, and the relative humidity for the
‘GBS’-pretreated aluminium-alloy joints (Δ: joints exhibiting stick-slip crack
growth; ♦: joints exhibiting stable crack growth).
FIGURE 11 Comparison between the relationships between the fracture energy, Gc, and the
relative humidity obtained for the ‘GBD’-pretreated aluminium-alloy joints and
the ‘GBS’-pretreated aluminium-alloy joints for the stable crack growth regime,
‘Region I’.
FIGURE 12 XPS spectrum of the cured adhesive.
FIGURE 13 XPS spectrum of the ‘GBD’-pretreated aluminium-alloy surface.

36
FIGURE 14 XPS spectra of a failed ‘GBD’-pretreated aluminium-alloy joint: (a) ‘adhesive’
side, (b) ‘metal’ side. (Tested at 55%RH at a crack velocity of approximately 0.3
mm/minute.)
FIGURE 15 XPS spectrum of a ‘GBS’-pretreated aluminium-alloy surface.
FIGURE 16 XPS spectra of a failed ‘GBS’-pretreated aluminium-alloy joint: (a) ‘adhesive’
side, (b) ‘metal’ side. (Tested at 55%RH at a crack velocity of approximately
0.15 mm/minute.)
FIGURE 17 Schematic diagram showing the relationship between the fracture energy and
crack velocity. The curve corresponding to stable (viscoelastic-controlled) crack
growth is in light grey, whereas that corresponding to ‘brittle’ fracture with
dynamic effects is in black. (Note: in this diagram the viscoelastic losses are
schematically shown as being relatively large, to highlight the transition, which is
not the case for the present adhesive and is not a necessary requirement.)

37
Figure 1
a =133 mm
Substrates
13
2
213 −=+= mmhh
am
h =30 mm
b =10 mm
Starter crack Adhesive
layer

38
Figure 2

39
Figure 3
40
Figure 4
0
200
400
600
800
1000
1200
0 0.5 1 1.5 2Displacement (mm)
Pc
41
Figure 5
60
80
100
120
140
160
180
200
0 5 10 15 20 25
Time (min)
Cra
ck le
ngth
(mm
)

42
Figure 6
0
1
2
3
4
5
6
7
0 0.02 0.04 0.06 0.08 0.1 0.12Rate of displacement (mm/min)
(a)
0
2
4
6
8
10
12
14
0 0.02 0.04 0.06 0.08 0.1Rate of displacement (mm/min)
(b)
43
Figure 7
0
200
400
600
800
1000
0 0.5 1 1.5 2 2.5 3Displacement (mm)
Pc Pc

44
Figure 8
0.1 1 10 1E710
10
100Region III
Region II
Region I
0%RH
100%RH
55%RH
Crack velocity (mm/minute)
Gc (
J/m
2 )

45
Figure 9

46
Figure 10

47
Figure 11
0
250
500
750
1000
0 20 40 60 80 100Relative humidity (%)
'GBS'-pretreated joints'GBD'-pretreated joints

48
Figure 12

49
Figure 13

50
Figure 14
0
5000
10000
15000
20000
020040060080010001200
Binding energy (eV)
C 1s
O 1s
N 1s
O KLL
a)
b)
Al 2s
Al 2p

51
Figure 15

52
Figure 16
b)
a)
Si 2s Al 2sSi 2p Al 2p

53
Figure 17
A
C
B
D
critcG
alog
cGlog
ca
1a
Related Documents