Danijela Živojinović 1 , Aleksandar Sedmak 2 , Aleksandar Grbović 2 CRACK GROWTH ANALYSIS IN FRICTION STIR WELDED JOINT ZONES USING EXTENDED FINITE ELEMENT METHOD ANALIZA RASTA PRSLINE U ZONAMA SPOJA FRIKCIONO ZAVARENOG MEŠANJEM KORIŠĆENJEM PROŠIRENE METODE KONAČNIH ELEMENATA Originalni naučni rad / Original scientific paper UDK /UDC: 621.791.05: 669.715 621.791.05:539.4 Rad primljen / Paper received: 10.12.2013. Adresa autora / Author's address: 1) Technical College, bul. Zorana Djindjića 152-a Belgrade, Serbia, [email protected] 2) University of Belgrade, Faculty of Mechanical Enginee- ring, Belgrade, Serbia Keywords • aluminium • crack • fracture • friction stir welding (FSW) • extended finite element method (XFEM) • fatigue Abstract Presented in this paper is the analysis of crack growth in zones of a welded joint, obtained by Friction Stir Welding - FSW. Plates of aluminium alloy 2024-T351 are frontally welded using the FSW procedure. Plate models are made using ABAQUS software. Material properties in the weld zones are adopted from papers by other authors. The plate is subjected to tensile fatigue loading with cycle asymmetry factor of R = 0. The crack growth is observed (for a non- stationary crack) and stress intensity factors are analysed around the crack tip for every crack front. The eXtended Finite Element Method (XFEM) in this analysis has enabled automatic mesh generation around the crack tip for every step of its growth. The aim of this paper is the integrity assessment of a structure that is produced by friction stir welding with an initial crack. Ključne reči • aluminijum • prslina • lom • frikciono zavarivanje mešanjem (FSW) • proširena metoda konačnih elemenata (XFEM) • zamor Izvod U ovom radu je prikazana analiza rasta prsine u zonama zavarenog spoja izvedenog postupkom frikcionog zavariva- nja mešanjem (FSW). Ploče od legure aluminijuma 2024- T351 su sučeono zavarene primenom postupka FSW. Ploče su modelirane primenom softvera ABAQUS. Osobine mate- rijala u zonama zavarenog spoja su prihvaćene iz radova drugih autora. Ploča je podvrgnuta zamornom opterećenju zatezanjem sa faktorom nesimetričnosti ciklusa R = 0. Rast prsline je praćen (za nestacionarnu prslinu) i faktori inten- ziteta napona su analizirani u okolini vrha prsline za svaki front prsline. Proširena metoda konačnih elemenata (XFEM) u ovoj analizi je omogućila automatsku generaciju mreže oko vrha prsline kod svakog koraka tokom njenog rasta. Cilj ovog rada je procena integriteta konstrukcije sa inicijalnom prslinom, dobijene frikcionim zavarivanjem mešanjem. INTRODUCTION Structural integrity assessment represents a relatively new scientific discipline that is widely applied in the engineering practice. Calculating structural life enables the evaluation of its operational readiness. The emergence of “fail safe” design concept implies the assessment of load bearing capacity of a structural component. By detecting cracks in the structure, followed by monitoring their growth, it is possible to assess the structural integrity, i.e. component life with sufficient accuracy. Application of new technological solutions, such as friction stir welding (FSW) enables welding of different alloys. In this way, FSW finds extensive application in various branches of industry, including aviation. Thanks to the fact that during this welding procedure, there is no melting of the material within the weld zone, the welding of aluminium alloys is made possible. This significantly reduces cost, and robust differential structures are replaced with integral structures, which leads to reduction in mass of structures, whereas connections in structural components are formed by FSW joints. Thanks to the achievements in the field of information technologies, i.e. the development of adequate applicative software enabled an elegant approach to structural analysis. Solving current problems with stress-strain state calculation in structures with and without cracks can be performed by using some of the existing programs for this purpose, such as: Abaqus/ Morfeo, Ansys, FRANC2D/3D, NASGRO, etc. Applying the laws of fracture mechanics to a discretized system with the use of numerical methods allows for solving of existing problems. Particular attention is given to the crack growth phenomenon in structures (non-stationary cracks). The following fracture mechanics parameters are obtained that represent relevant results in the calculation: stress intensity factors – K I , K II , K III and K eq in every point INTEGRITET I VEK KONSTRUKCIJA Vol. 13, br. 3 (2013), str. 179–188 STRUCTURAL INTEGRITY AND LIFE Vol. 13, No 3 (2013), pp. 179–188 179

Welcome message from author
This document is posted to help you gain knowledge. Please leave a comment to let me know what you think about it! Share it to your friends and learn new things together.
Transcript

Danijela Živojinović1, Aleksandar Sedmak2, Aleksandar Grbović2
CRACK GROWTH ANALYSIS IN FRICTION STIR WELDED JOINT ZONES USING EXTENDED FINITE ELEMENT METHOD
ANALIZA RASTA PRSLINE U ZONAMA SPOJA FRIKCIONO ZAVARENOG MEŠANJEM KORIŠĆENJEM PROŠIRENE METODE KONAČNIH ELEMENATA
Originalni naučni rad / Original scientific paper UDK /UDC: 621.791.05: 669.715 621.791.05:539.4 Rad primljen / Paper received: 10.12.2013.
Adresa autora / Author's address: 1) Technical College, bul. Zorana Djindjića 152-a Belgrade, Serbia, [email protected] 2) University of Belgrade, Faculty of Mechanical Enginee-ring, Belgrade, Serbia
Keywords • aluminium • crack • fracture • friction stir welding (FSW) • extended finite element method (XFEM) • fatigue
Abstract
Presented in this paper is the analysis of crack growth in zones of a welded joint, obtained by Friction Stir Welding - FSW. Plates of aluminium alloy 2024-T351 are frontally welded using the FSW procedure. Plate models are made using ABAQUS software. Material properties in the weld zones are adopted from papers by other authors. The plate is subjected to tensile fatigue loading with cycle asymmetry factor of R = 0. The crack growth is observed (for a non-stationary crack) and stress intensity factors are analysed around the crack tip for every crack front. The eXtended Finite Element Method (XFEM) in this analysis has enabled automatic mesh generation around the crack tip for every step of its growth. The aim of this paper is the integrity assessment of a structure that is produced by friction stir welding with an initial crack.
Ključne reči • aluminijum • prslina • lom • frikciono zavarivanje mešanjem (FSW) • proširena metoda konačnih elemenata (XFEM) • zamor
Izvod
U ovom radu je prikazana analiza rasta prsine u zonama zavarenog spoja izvedenog postupkom frikcionog zavariva-nja mešanjem (FSW). Ploče od legure aluminijuma 2024-T351 su sučeono zavarene primenom postupka FSW. Ploče su modelirane primenom softvera ABAQUS. Osobine mate-rijala u zonama zavarenog spoja su prihvaćene iz radova drugih autora. Ploča je podvrgnuta zamornom opterećenju zatezanjem sa faktorom nesimetričnosti ciklusa R = 0. Rast prsline je praćen (za nestacionarnu prslinu) i faktori inten-ziteta napona su analizirani u okolini vrha prsline za svaki front prsline. Proširena metoda konačnih elemenata (XFEM) u ovoj analizi je omogućila automatsku generaciju mreže oko vrha prsline kod svakog koraka tokom njenog rasta. Cilj ovog rada je procena integriteta konstrukcije sa inicijalnom prslinom, dobijene frikcionim zavarivanjem mešanjem.
INTRODUCTION
Structural integrity assessment represents a relatively new scientific discipline that is widely applied in the engineering practice. Calculating structural life enables the evaluation of its operational readiness. The emergence of “fail safe” design concept implies the assessment of load bearing capacity of a structural component. By detecting cracks in the structure, followed by monitoring their growth, it is possible to assess the structural integrity, i.e. component life with sufficient accuracy.
Application of new technological solutions, such as friction stir welding (FSW) enables welding of different alloys. In this way, FSW finds extensive application in various branches of industry, including aviation. Thanks to the fact that during this welding procedure, there is no melting of the material within the weld zone, the welding of aluminium alloys is made possible. This significantly
reduces cost, and robust differential structures are replaced with integral structures, which leads to reduction in mass of structures, whereas connections in structural components are formed by FSW joints.
Thanks to the achievements in the field of information technologies, i.e. the development of adequate applicative software enabled an elegant approach to structural analysis. Solving current problems with stress-strain state calculation in structures with and without cracks can be performed by using some of the existing programs for this purpose, such as: Abaqus/ Morfeo, Ansys, FRANC2D/3D, NASGRO, etc. Applying the laws of fracture mechanics to a discretized system with the use of numerical methods allows for solving of existing problems. Particular attention is given to the crack growth phenomenon in structures (non-stationary cracks). The following fracture mechanics parameters are obtained that represent relevant results in the calculation: stress intensity factors – KI, KII, KIII and Keq in every point
INTEGRITET I VEK KONSTRUKCIJA Vol. 13, br. 3 (2013), str. 179–188
STRUCTURAL INTEGRITY AND LIFEVol. 13, No 3 (2013), pp. 179–188
179
Crack growth analysis in friction stir welded joint zones using Analiza rasta prsline u zonama spoja frikciono zavarenog
of the crack front, for every step of growth. In case of fatigue load, the crack growth dependence (crack length a) is obtained as a function of the number of cycles of the applied load – N. By analyzing the results obtained in the calculation, it is possible to perform structural integrity assessment.
Owing to the emergence of a new method, the eXtended Finite Element Method – XFEM, solving of the crack growth phenomenon is significantly simplified, along with obtaining of relevant fracture mechanics parameters for each step of the crack growth.
FRICTION STIR WELDING – FSW
The friction stir welding process was patented by Wayne Thomas at TWI (The Welding Institute, Cambridge, UK) in 1991, /1/. It quickly found wide application as a very effi-cient welding process. In this way, it is possible to connect similar as well as different metals. FSW is the process of welding materials in a solid state. Temperatures that do not exceed the melting point of metals (400-500°C) occur in the zones of the newly formed weld. This process has found particularly significant applications in welding of aluminium alloys. This process allows welding of alloys that are not usually connected in this way (because of a considerable decrease in the quality of mechanical properties in the weld zones) up until now, which enabled the manufacturing of light structures used for transportation, such as: cars, ships, trains and airplanes.
Thus, applications of this relatively new procedure have significantly reduced the development cost. On the other hand, applying FSW produces high quality welds, with varying forms and dimensions in different materials.
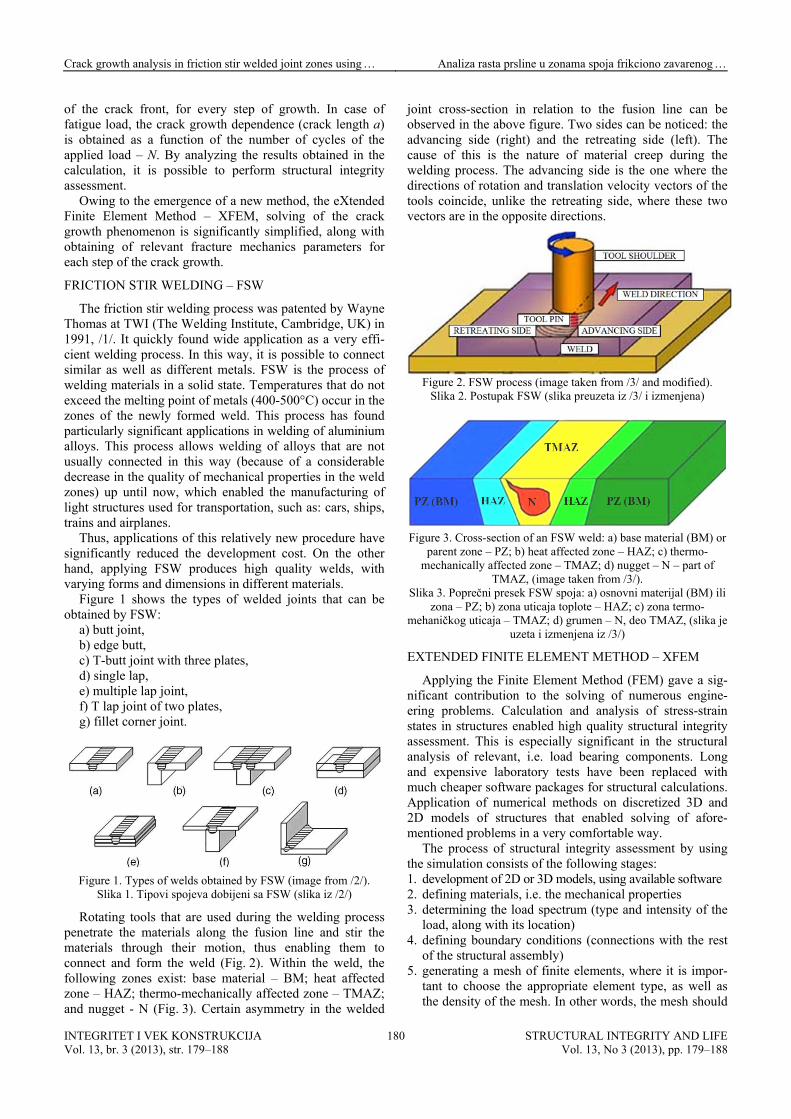
Figure 1 shows the types of welded joints that can be obtained by FSW:
a) butt joint, b) edge butt, c) T-butt joint with three plates, d) single lap, e) multiple lap joint, f) T lap joint of two plates, g) fillet corner joint.
Figure 1. Types of welds obtained by FSW (image from /2/).
Slika 1. Tipovi spojeva dobijeni sa FSW (slika iz /2/)
Rotating tools that are used during the welding process penetrate the materials along the fusion line and stir the materials through their motion, thus enabling them to connect and form the weld (Fig. 2). Within the weld, the following zones exist: base material – BM; heat affected zone – HAZ; thermo-mechanically affected zone – TMAZ; and nugget - N (Fig. 3). Certain asymmetry in the welded
joint cross-section in relation to the fusion line can be observed in the above figure. Two sides can be noticed: the advancing side (right) and the retreating side (left). The cause of this is the nature of material creep during the welding process. The advancing side is the one where the directions of rotation and translation velocity vectors of the tools coincide, unlike the retreating side, where these two vectors are in the opposite directions.
Figure 2. FSW process (image taken from /3/ and modified). Slika 2. Postupak FSW (slika preuzeta iz /3/ i izmenjena)
Figure 3. Cross-section of an FSW weld: a) base material (BM) or
parent zone – PZ; b) heat affected zone – HAZ; c) thermo-mechanically affected zone – TMAZ; d) nugget – N – part of
TMAZ, (image taken from /3/). Slika 3. Poprečni presek FSW spoja: a) osnovni materijal (BM) ili
zona – PZ; b) zona uticaja toplote – HAZ; c) zona termo-mehaničkog uticaja – TMAZ; d) grumen – N, deo TMAZ, (slika je
uzeta i izmenjena iz /3/)
EXTENDED FINITE ELEMENT METHOD – XFEM
Applying the Finite Element Method (FEM) gave a sig-nificant contribution to the solving of numerous engine-ering problems. Calculation and analysis of stress-strain states in structures enabled high quality structural integrity assessment. This is especially significant in the structural analysis of relevant, i.e. load bearing components. Long and expensive laboratory tests have been replaced with much cheaper software packages for structural calculations. Application of numerical methods on discretized 3D and 2D models of structures that enabled solving of afore-mentioned problems in a very comfortable way.
The process of structural integrity assessment by using the simulation consists of the following stages: 1. development of 2D or 3D models, using available software 2. defining materials, i.e. the mechanical properties 3. determining the load spectrum (type and intensity of the
load, along with its location) 4. defining boundary conditions (connections with the rest
of the structural assembly) 5. generating a mesh of finite elements, where it is impor-
tant to choose the appropriate element type, as well as the density of the mesh. In other words, the mesh should
INTEGRITET I VEK KONSTRUKCIJA Vol. 13, br. 3 (2013), str. 179–188
STRUCTURAL INTEGRITY AND LIFEVol. 13, No 3 (2013), pp. 179–188
180
Crack growth analysis in friction stir welded joint zones using Analiza rasta prsline u zonama spoja frikciono zavarenog
INTEGRITET I VEK KONSTRUKCIJA Vol. 13, br. 3 (2013), str. 179–188
STRUCTURAL INTEGRITY AND LIFEVol. 13, No 3 (2013), pp. 179–188
181
be finer in areas around the initial crack and the expected propagation. In case of the calculation of a non-stationary crack, i.e.
when its growth in the structure is observed, the application of this method is not simple. The reason for this is that every step requires performing the finite element fracture in the area around the tip of the previously formed crack, and then a generation of a new finite element mesh in the same region. Hence, the application of FEM becomes noticeably more complicated. However, this method has recently been advanced by developing the so-called extended finite element method (XFEM). Automatic mesh generation with each new step in crack growth has given significant results.
XFEM is based on the correction of existing displace-ment equations in mesh nodes by using special Heavyside functions whose application is limited to the region around the crack tip.
4. criteria: VCCT – the Virtual Crack Closure Technique, 5. criteria: dependence of da/dN based on Paris law.
Figure 4. Finite elements for XFEM: a) linear hexahedron
element-C3D6; b) second order tetrahedron element-C3D10; c) first order hexahedron element-C3D8R, (image taken from /4/). Slika 4. Konačni elementi za XFEM: a) linearni heksaedar C3D6; b) tetraedar drugog reda C3D8R; c) heksaedar prvog reda C3D8R,
(slika je uzeta iz /4/) XFEM SOFTWARE APPLICATIONS – ABAQUS/ MORFEO (EXAMPLES)
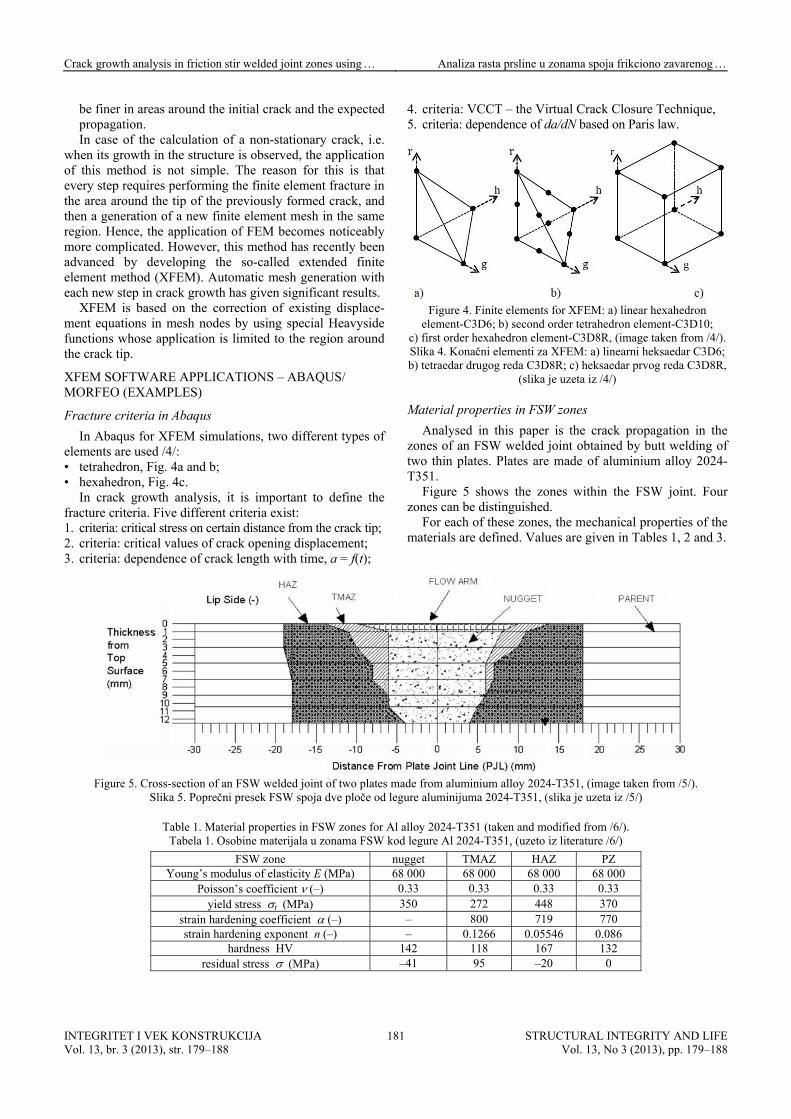
Material properties in FSW zones Fracture criteria in Abaqus Analysed in this paper is the crack propagation in the
zones of an FSW welded joint obtained by butt welding of two thin plates. Plates are made of aluminium alloy 2024-T351.
In Abaqus for XFEM simulations, two different types of elements are used /4/: • tetrahedron, Fig. 4a and b; • hexahedron, Fig. 4c.
In crack growth analysis, it is important to define the fracture criteria. Five different criteria exist:
Figure 5 shows the zones within the FSW joint. Four zones can be distinguished.
For each of these zones, the mechanical properties of the materials are defined. Values are given in Tables 1, 2 and 3.
1. criteria: critical stress on certain distance from the crack tip; 2. criteria: critical values of crack opening displacement;
3. criteria: dependence of crack length with time, a = f(t);
Figure 5. Cross-section of an FSW welded joint of two plates made from aluminium alloy 2024-T351, (image taken from /5/).
Slika 5. Poprečni presek FSW spoja dve ploče od legure aluminijuma 2024-T351, (slika je uzeta iz /5/)
Table 1. Material properties in FSW zones for Al alloy 2024-T351 (taken and modified from /6/). Tabela 1. Osobine materijala u zonama FSW kod legure Al 2024-T351, (uzeto iz literature /6/)
FSW zone nugget TMAZ HAZ PZ Young’s modulus of elasticity E (MPa) 68 000 68 000 68 000 68 000
Poisson’s coefficient (–) 0.33 0.33 0.33 0.33 yield stress t (MPa) 350 272 448 370
strain hardening coefficient (–) – 800 719 770 strain hardening exponent n (–) – 0.1266 0.05546 0.086
hardness HV 142 118 167 132 residual stress (MPa) –41 95 –20 0

Crack growth analysis in friction stir welded joint zones using Analiza rasta prsline u zonama spoja frikciono zavarenog
Table 2. Stress–relative strain – data in FSW zones for Al alloy 2024-T351 (taken from /6/ and modified). Tabela 2. Napon–relativna deformacija – unutar zona FSW kod legure Al 2024-T351 (preuzeto iz /6/ i modifikovano)
nugget TMAZ HAZ PZ (MPa) (%) (MPa) (%) (MPa) (%) (MPa) (%)
30.43 0.00044 50.34 0.00070 25 0.00040 20 0.0003 51.30 0.00080 75.86 0.00123 35 0.00060 40 0.0006 69.56 0.00120 106.90 0.00160 58 0.00100 45 0.0009 91.30 0.00150 131.03 0.00200 83 0.00126 90 0.0014 130.43 0.00210 186.21 0.00310 95 0.00150 125 0.0021 186.95 0.00320 268.96 0.00450 130 0.00200 220 0.0034 286.96 0.00430 331.03 0.00570 175 0.00280 300 0.0050 331.91 0.00550 280 0.00438 320 0.0058
330 0.00558 440 0.0084 480 0.00898 487 0.0120 540 0.01166
Table 3. Constants in the Paris equation determined by: Bussu and Irwin (2003), Ali et al. (2008) and the regression calculation in FSW zones for Al 2024-T351 (taken and modified from /6/).
Tabela 3. Konstante u izrazu Parisa koje su odredili: Busi i Irvin (2003), Ali et al. (2008) i proračun regresione linije kod zona FSW za leguru Al 2024-T351 (preuzeto i modifikovano iz /6/)
FSW zones Paris’s model constants Bussu-Irvin experiments Ali experiments regression calculations
C (cycles–1) 2.02345.10–10 2.02345.10–10 2.8338.10–12 nugget
n 3.106 2.94 3.80
C (cycles–1) 3.987.10–10 2.02345.10–10 5.5837.10–12 TMAZ
n 2.254 2.94 2.76
C (cycles–1) 8.41.10–10 2.02345.10–10 1.1778.10–12 HAZ
n 2.28 2.94 2.79
C (cycles–1) 2.035.10–10 2.02345.10–10 1.1778.10–12 PZ
n 2.4 2.94 2.94
MODELLING OF THE FSW JOINT, /7/
As an example of crack growth analysis in an FSW joint, a model obtained by butt welding of two plates is made. A 3D model of a plate with FSW zones is developed in ABAQUS software. Zone dimensions are determined based on metallographic images (Fig. 5).
Different shapes, dimensions and crack locations in FSW joints are analysed. However, further detailed analysis determined that certain limitations exist within the ABAQUS software. Thus, fracture mechanics parameters, as the final result of crack growth analysis in a structure, are possible to calculate only in the case when all points of the crack front in a given moment are located exclusively within a single region (zone). In case of a real 3D model (Fig. 6), regard-less of the shape and dimensions of the initial crack, this problem occurs and is impossible to solve with software.
This leads to simplified 3D models of FSW joints. The approximation of the weld is performed by using flat zones (Fig. 7). Hence, plate dimensions are 1 20 60 mm (2W = 60 mm, t = 1 mm). Figures 7 and 8 show the zones within a FSW welded joint. Based on the given dimensions, the 3D modelling is performed on butt welded plates using FSW joints.
An initial crack with a length 2a0 = 3 mm is introduced into the TMAZ zone. The right end of the crack is located at a distance of 1 mm from the N-TMAZ border. Further propagation of the crack through all zones in the weld is observed.
Figure 6. 3D model of a FSW welded joint (taken from /7/).
Slika 6. 3D model FSW zavarenog spoja (preuzeto iz /7/)
Figure 7. Simplified 3D model of FSW welded joint (from /7/). Slika 7. Pojednostavljen 3D model FSW spoja (preuzeto iz /7/)
INTEGRITET I VEK KONSTRUKCIJA Vol. 13, br. 3 (2013), str. 179–188
STRUCTURAL INTEGRITY AND LIFEVol. 13, No 3 (2013), pp. 179–188
182
Crack growth analysis in friction stir welded joint zones using Analiza rasta prsline u zonama spoja frikciono zavarenog
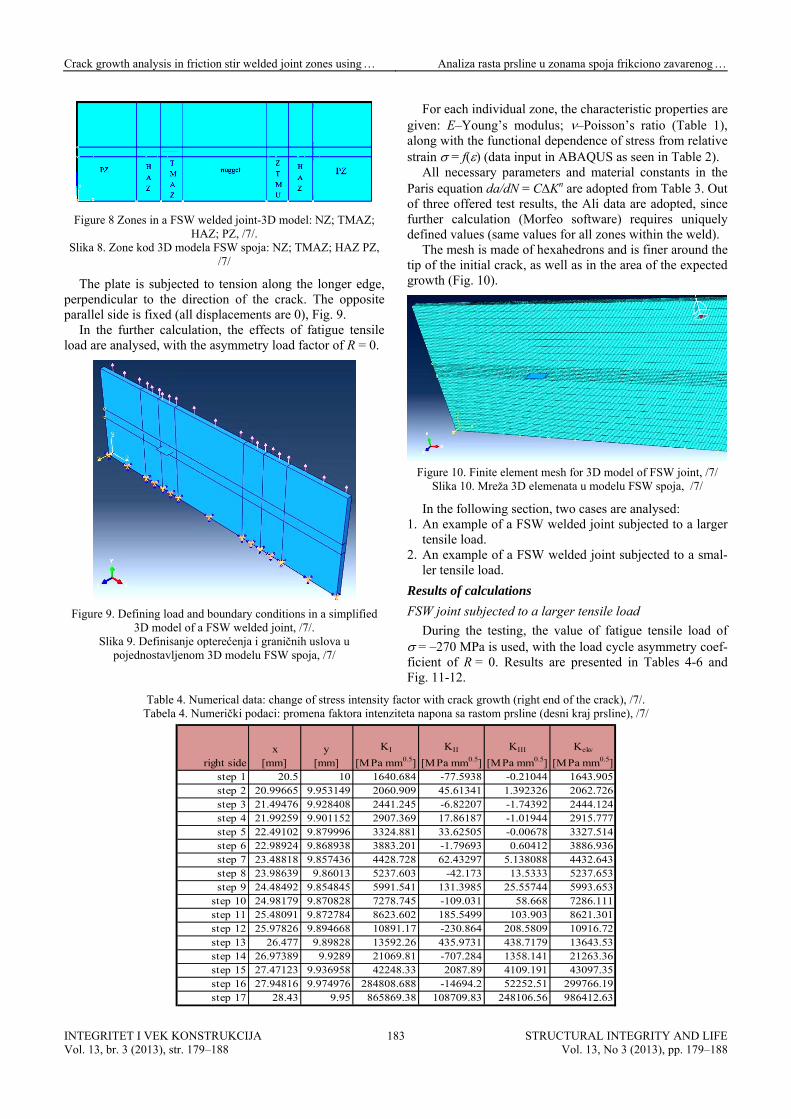
Figure 8 Zones in a FSW welded joint-3D model: NZ; TMAZ;
HAZ; PZ, /7/. Slika 8. Zone kod 3D modela FSW spoja: NZ; TMAZ; HAZ PZ,
/7/
The plate is subjected to tension along the longer edge, perpendicular to the direction of the crack. The opposite parallel side is fixed (all displacements are 0), Fig. 9.
In the further calculation, the effects of fatigue tensile load are analysed, with the asymmetry load factor of R = 0.
Figure 9. Defining load and boundary conditions in a simplified
3D model of a FSW welded joint, /7/. Slika 9. Definisanje opterećenja i graničnih uslova u
pojednostavljenom 3D modelu FSW spoja, /7/
For each individual zone, the characteristic properties are given: E–Young’s modulus; –Poisson’s ratio (Table 1), along with the functional dependence of stress from relative strain = f() (data input in ABAQUS as seen in Table 2).
All necessary parameters and material constants in the Paris equation da/dN = CKn are adopted from Table 3. Out of three offered test results, the Ali data are adopted, since further calculation (Morfeo software) requires uniquely defined values (same values for all zones within the weld).
The mesh is made of hexahedrons and is finer around the tip of the initial crack, as well as in the area of the expected growth (Fig. 10).
Figure 10. Finite element mesh for 3D model of FSW joint, /7/
Slika 10. Mreža 3D elemenata u modelu FSW spoja, /7/
In the following section, two cases are analysed: 1. An example of a FSW welded joint subjected to a larger
tensile load. 2. An example of a FSW welded joint subjected to a smal-
ler tensile load.
Results of calculations
FSW joint subjected to a larger tensile load
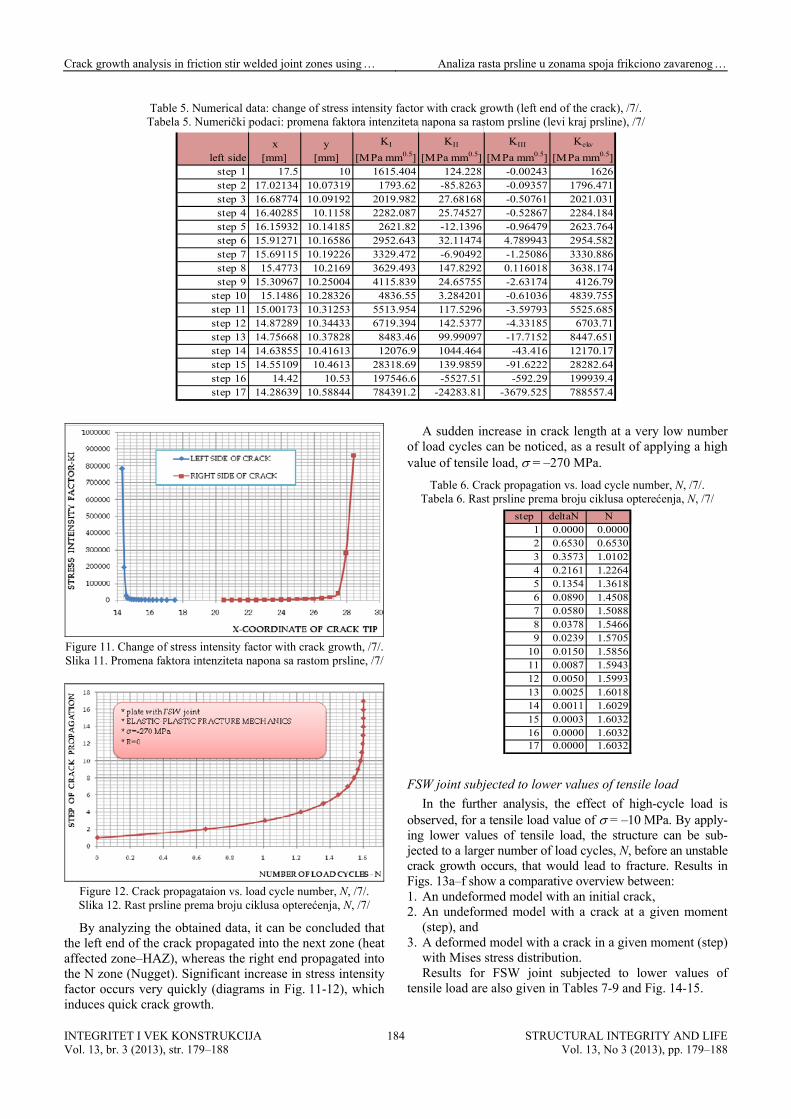
During the testing, the value of fatigue tensile load of = –270 MPa is used, with the load cycle asymmetry coef-ficient of R = 0. Results are presented in Tables 4-6 and Fig. 11-12.
Table 4. Numerical data: change of stress intensity factor with crack growth (right end of the crack), /7/. Tabela 4. Numerički podaci: promena faktora intenziteta napona sa rastom prsline (desni kraj prsline), /7/
right sidex
[mm]y
[mm]
KI
[MPa mm0.5]
KII
[MPa mm0.5]
KIII
[MPa mm0.5]
Kekv
[MPa mm0.5]step 1 20.5 10 1640.684 -77.5938 -0.21044 1643.905
step 2 20.99665 9.953149 2060.909 45.61341 1.392326 2062.726 step 3 21.49476 9.928408 2441.245 -6.82207 -1.74392 2444.124step 4 21.99259 9.901152 2907.369 17.86187 -1.01944 2915.777
step 5 22.49102 9.879996 3324.881 33.62505 -0.00678 3327.514 step 6 22.98924 9.868938 3883.201 -1.79693 0.60412 3886.936 step 7 23.48818 9.857436 4428.728 62.43297 5.138088 4432.643 step 8 23.98639 9.86013 5237.603 -42.173 13.5333 5237.653 step 9 24.48492 9.854845 5991.541 131.3985 25.55744 5993.653
step 10 24.98179 9.870828 7278.745 -109.031 58.668 7286.111 step 11 25.48091 9.872784 8623.602 185.5499 103.903 8621.301 step 12 25.97826 9.894668 10891.17 -230.864 208.5809 10916.72 step 13 26.477 9.89828 13592.26 435.9731 438.7179 13643.53 step 14 26.97389 9.9289 21069.81 -707.284 1358.141 21263.36 step 15 27.47123 9.936958 42248.33 2087.89 4109.191 43097.35 step 16 27.94816 9.974976 284808.688 -14694.2 52252.51 299766.19step 17 28.43 9.95 865869.38 108709.83 248106.56 986412.63
INTEGRITET I VEK KONSTRUKCIJA Vol. 13, br. 3 (2013), str. 179–188
STRUCTURAL INTEGRITY AND LIFEVol. 13, No 3 (2013), pp. 179–188
183
Crack growth analysis in friction stir welded joint zones using Analiza rasta prsline u zonama spoja frikciono zavarenog
Table 5. Numerical data: change of stress intensity factor with crack growth (left end of the crack), /7/. Tabela 5. Numerički podaci: promena faktora intenziteta napona sa rastom prsline (levi kraj prsline), /7/
left sidex
[mm]y
[mm]
KI
[MPa mm0.5]
KII
[MPa mm0.5]
KIII
[MPa mm0.5]
Kekv
[MPa mm0.5] step 1 17.5 10 1615.404 124.228 -0.00243 1626 step 2 17.02134 10.07319 1793.62 -85.8263 -0.09357 1796.471 step 3 16.68774 10.09192 2019.982 27.68168 -0.50761 2021.031 step 4 16.40285 10.1158 2282.087 25.74527 -0.52867 2284.184 step 5 16.15932 10.14185 2621.82 -12.1396 -0.96479 2623.764 step 6 15.91271 10.16586 2952.643 32.11474 4.789943 2954.582 step 7 15.69115 10.19226 3329.472 -6.90492 -1.25086 3330.886 step 8 15.4773 10.2169 3629.493 147.8292 0.116018 3638.174 step 9 15.30967 10.25004 4115.839 24.65755 -2.63174 4126.79
step 10 15.1486 10.28326 4836.55 3.284201 -0.61036 4839.755 step 11 15.00173 10.31253 5513.954 117.5296 -3.59793 5525.685 step 12 14.87289 10.34433 6719.394 142.5377 -4.33185 6703.71 step 13 14.75668 10.37828 8483.46 99.99097 -17.7152 8447.651 step 14 14.63855 10.41613 12076.9 1044.464 -43.416 12170.17 step 15 14.55109 10.4613 28318.69 139.9859 -91.6222 28282.64 step 16 14.42 10.53 197546.6 -5527.51 -592.29 199939.4 step 17 14.28639 10.58844 784391.2 -24283.81 -3679.525 788557.4
Figure 11. Change of stress intensity factor with crack growth, /7/. Slika 11. Promena faktora intenziteta napona sa rastom prsline, /7/
Figure 12. Crack propagataion vs. load cycle number, N, /7/. Slika 12. Rast prsline prema broju ciklusa opterećenja, N, /7/
By analyzing the obtained data, it can be concluded that the left end of the crack propagated into the next zone (heat affected zone–HAZ), whereas the right end propagated into the N zone (Nugget). Significant increase in stress intensity factor occurs very quickly (diagrams in Fig. 11-12), which induces quick crack growth.
A sudden increase in crack length at a very low number of load cycles can be noticed, as a result of applying a high value of tensile load, = –270 MPa.
Table 6. Crack propagation vs. load cycle number, N, /7/. Tabela 6. Rast prsline prema broju ciklusa opterećenja, N, /7/
step deltaN N1 0.0000 0.00002 0.6530 0.65303 0.3573 1.01024 0.2161 1.22645 0.1354 1.36186 0.0890 1.45087 0.0580 1.50888 0.0378 1.54669 0.0239 1.5705
10 0.0150 1.585611 0.0087 1.594312 0.0050 1.599313 0.0025 1.601814 0.0011 1.602915 0.0003 1.603216 0.0000 1.603217 0.0000 1.6032
FSW joint subjected to lower values of tensile load
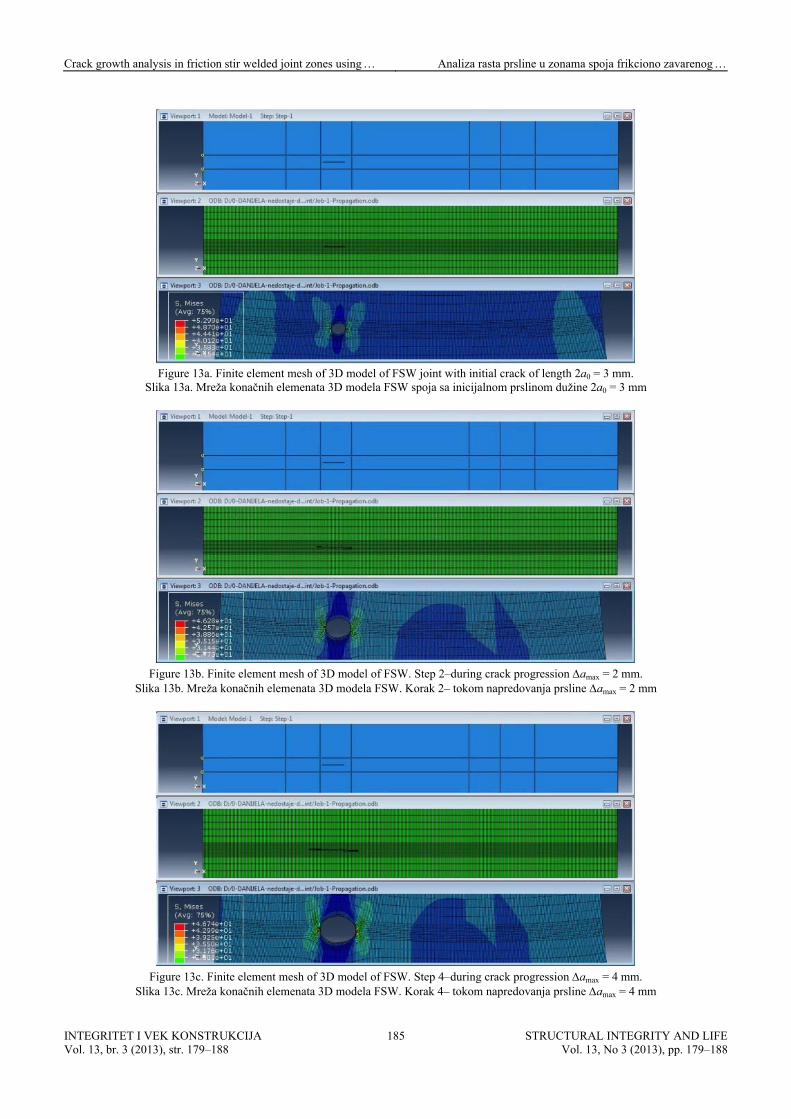
In the further analysis, the effect of high-cycle load is observed, for a tensile load value of = –10 MPa. By apply-ing lower values of tensile load, the structure can be sub-jected to a larger number of load cycles, N, before an unstable crack growth occurs, that would lead to fracture. Results in Figs. 13a–f show a comparative overview between: 1. An undeformed model with an initial crack, 2. An undeformed model with a crack at a given moment
(step), and 3. A deformed model with a crack in a given moment (step)
with Mises stress distribution. Results for FSW joint subjected to lower values of
tensile load are also given in Tables 7-9 and Fig. 14-15.
INTEGRITET I VEK KONSTRUKCIJA Vol. 13, br. 3 (2013), str. 179–188
STRUCTURAL INTEGRITY AND LIFEVol. 13, No 3 (2013), pp. 179–188
184
Crack growth analysis in friction stir welded joint zones using Analiza rasta prsline u zonama spoja frikciono zavarenog
Figure 13a. Finite element mesh of 3D model of FSW joint with initial crack of length 2a0 = 3 mm.
Slika 13a. Mreža konačnih elemenata 3D modela FSW spoja sa inicijalnom prslinom dužine 2a0 = 3 mm
Figure 13b. Finite element mesh of 3D model of FSW. Step 2–during crack progression amax = 2 mm.
Slika 13b. Mreža konačnih elemenata 3D modela FSW. Korak 2– tokom napredovanja prsline amax = 2 mm
Figure 13c. Finite element mesh of 3D model of FSW. Step 4–during crack progression amax = 4 mm.
Slika 13c. Mreža konačnih elemenata 3D modela FSW. Korak 4– tokom napredovanja prsline amax = 4 mm
INTEGRITET I VEK KONSTRUKCIJA Vol. 13, br. 3 (2013), str. 179–188
STRUCTURAL INTEGRITY AND LIFEVol. 13, No 3 (2013), pp. 179–188
185

Crack growth analysis in friction stir welded joint zones using Analiza rasta prsline u zonama spoja frikciono zavarenog
INTEGRITET I VEK KONSTRUKCIJA Vol. 13, br. 3 (2013), str. 179–188
STRUCTURAL INTEGRITY AND LIFEVol. 13, No 3 (2013), pp. 179–188
186
Figure 13d. Finite element mesh of 3D model of FSW. Step 11–during crack progression amax = 11 mm.
Slika 13d. Mreža konačnih elemenata 3D modela FSW. Korak 11– tokom napredovanja prsline amax = 11 mm
Figure 13e. Finite element mesh of 3D model of FSW. Step 20–during crack progression amax = 20 mm.
Slika 13e. Mreža konačnih elemenata 3D modela FSW. Korak 20– tokom napredovanja prsline amax = 20 mm
Figure 13f. Finite element mesh of 3D model of FSW. Step 31–during crack progression amax = 31 mm.
Slika 13f. Mreža konačnih elemenata 3D modela FSW. Korak 31– tokom napredovanja prsline amax = 31 mm
Crack growth analysis in friction stir welded joint zones using Analiza rasta prsline u zonama spoja frikciono zavarenog
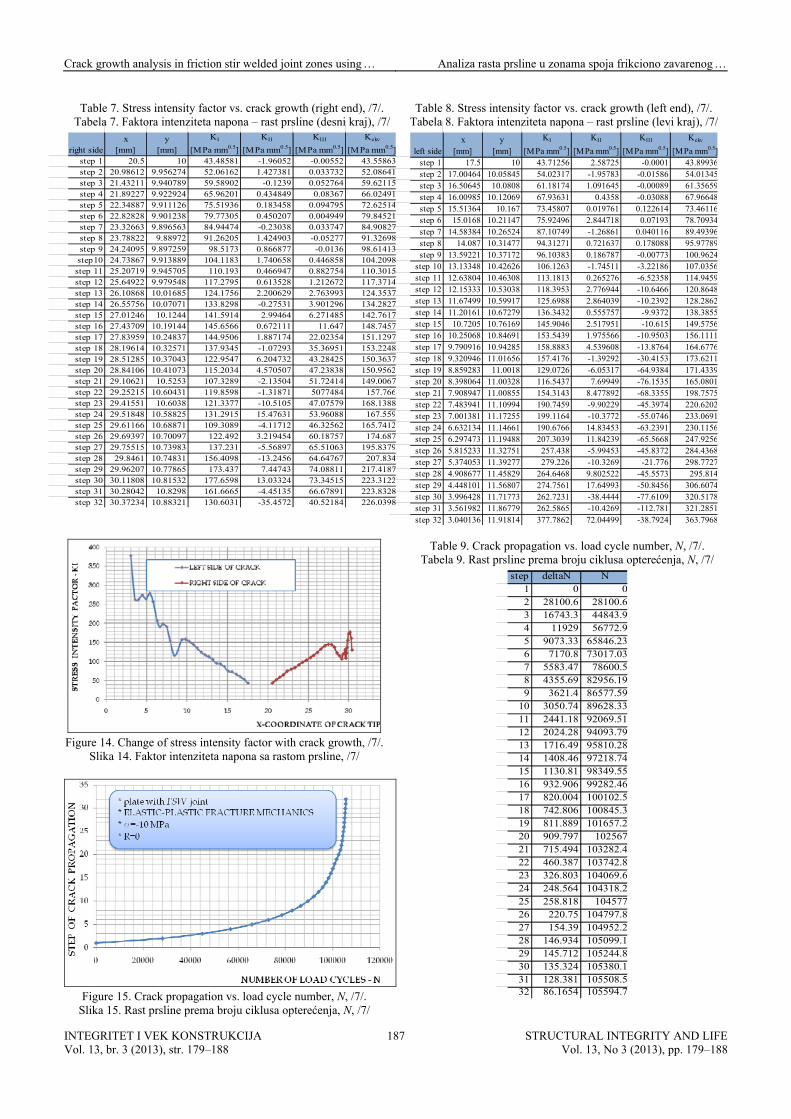
Table 7. Stress intensity factor vs. crack growth (right end), /7/. Table 8. Stress intensity factor vs. crack growth (left end), /7/. Tabela 7. Faktora intenziteta napona – rast prsline (desni kraj), /7/ Tabela 8. Faktora intenziteta napona – rast prsline (levi kraj), /7/
right sidex
[mm]y
[mm]
KI
[MPa mm0.5]
KII
[MPa mm0.5]
KIII
[MPa mm0.5]
Kekv
[MPa mm0.5] step 1 20.5 10 43.48581 -1.96052 -0.00552 43.55863 step 2 20.98612 9.956274 52.06162 1.427381 0.033732 52.08641 step 3 21.43211 9.940789 59.58902 -0.1239 0.052764 59.62115 step 4 21.89227 9.922924 65.96201 0.434849 0.08367 66.02491step 5 22.34887 9.911126 75.51936 0.183458 0.094795 72.62514step 6 22.82828 9.901238 79.77305 0.450207 0.004949 79.84521
step 7 23.32663 9.896563 84.94474 -0.23038 0.033747 84.90827step 8 23.78822 9.88972 91.26205 1.424903 -0.05277 91.32698step 9 24.24095 9.897259 98.5173 0.866877 -0.0136 98.61413
step10 24.73867 9.913889 104.1183 1.740658 0.446858 104.2098step 11 25.20719 9.945705 110.193 0.466947 0.882754 110.3015step 12 25.64922 9.979548 117.2795 0.613528 1.212672 117.3714step 13 26.10868 10.01685 124.1756 2.200629 2.763993 124.3537
step 14 26.55756 10.07071 133.8298 -0.27531 3.901296 134.2827 step 15 27.01246 10.1244 141.5914 2.99464 6.271485 142.7617step 16 27.43709 10.19144 145.6566 0.672111 11.647 148.7457step 17 27.83959 10.24837 144.9506 1.887174 22.02354 151.1297step 18 28.19614 10.32571 137.9345 -1.07293 35.36951 153.2248step 19 28.51285 10.37043 122.9547 6.204732 43.28425 150.3637step 20 28.84106 10.41073 115.2034 4.570507 47.23838 150.9562step 21 29.10621 10.5253 107.3289 -2.13504 51.72414 149.0067step 22 29.25215 10.60431 119.8598 -1.31871 5077484 157.766step 23 29.41551 10.6038 121.3377 -10.5105 47.07579 168.1388step 24 29.51848 10.58825 131.2915 15.47631 53.96088 167.559step 25 29.61166 10.68871 109.3089 -4.11712 46.32562 165.7412step 26 29.69397 10.70097 122.492 3.219454 60.18757 174.687step 27 29.75515 10.73983 137.231 -5.56897 65.51063 195.8379step 28 29.8461 10.74831 156.4098 -13.2456 64.64767 207.834step 29 29.96207 10.77865 173.437 7.44743 74.08811 217.4187step 30 30.11808 10.81532 177.6598 13.03324 73.34515 223.3122step 31 30.28042 10.8298 161.6665 -4.45135 66.67891 223.8328step 32 30.37234 10.88321 130.6031 -35.4572 40.52184 226.0398
left sidex
[mm]y
[mm]
KI
[MPa mm0.5]
KII
[MPa mm0.5]
KIII
[MPa mm0.5]
Kekv
[MPa mm0.5]step 1 17.5 10 43.71256 2.58725 -0.0001 43.89936step 2 17.00464 10.05845 54.02317 -1.95783 -0.01586 54.01345step 3 16.50645 10.0808 61.18174 1.091645 -0.00089 61.35659step 4 16.00985 10.12069 67.93631 0.4358 -0.03088 67.96648step 5 15.51364 10.167 73.45807 0.019761 0.122614 73.46116step 6 15.0168 10.21147 75.92496 2.844718 0.07193 78.70934step 7 14.58384 10.26524 87.10749 -1.26861 0.040116 89.49396step 8 14.087 10.31477 94.31271 0.721637 0.178088 95.97789step 9 13.59221 10.37172 96.10383 0.186787 -0.00773 100.9624
step 10 13.13348 10.42626 106.1263 -1.74511 -3.22186 107.0356step 11 12.63804 10.46308 113.1813 0.265276 -6.52358 114.9459step 12 12.15333 10.53038 118.3953 2.776944 -10.6466 120.8648step 13 11.67499 10.59917 125.6988 2.864039 -10.2392 128.2862step 14 11.20161 10.67279 136.3432 0.555757 -9.9372 138.3855step 15 10.7205 10.76169 145.9046 2.517951 -10.615 149.5756step 16 10.25068 10.84691 153.5439 1.975566 -10.9503 156.1111step 17 9.790916 10.94285 158.8883 4.539608 -13.8764 164.6776step 18 9.320946 11.01656 157.4176 -1.39292 -30.4153 173.6211step 19 8.859283 11.0018 129.0726 -6.05317 -64.9384 171.4339step 20 8.398064 11.00328 116.5437 7.69949 -76.1535 165.0801step 21 7.908947 11.00855 154.3143 8.477892 -68.3355 198.7575step 22 7.483941 11.10994 190.7459 -9.90229 -45.3974 220.6202step 23 7.001381 11.17255 199.1164 -10.3772 -55.0746 233.0691step 24 6.632134 11.14661 190.6766 14.83453 -63.2391 230.1156step 25 6.297473 11.19488 207.3039 11.84239 -65.5668 247.9256step 26 5.815233 11.32751 257.438 -5.99453 -45.8372 284.4368step 27 5.374053 11.39277 279.226 -10.3269 -21.776 298.7727step 28 4.908677 11.45829 264.6468 9.802522 -45.5573 295.814step 29 4.448101 11.56807 274.7561 17.64993 -50.8456 306.6074step 30 3.996428 11.71773 262.7231 -38.4444 -77.6109 320.5178step 31 3.561982 11.86779 262.5865 -10.4269 -112.781 321.2851step 32 3.040136 11.91814 377.7862 72.04499 -38.7924 363.7968
Figure 14. Change of stress intensity factor with crack growth, /7/.
Slika 14. Faktor intenziteta napona sa rastom prsline, /7/
Figure 15. Crack propagation vs. load cycle number, N, /7/.
Slika 15. Rast prsline prema broju ciklusa opterećenja, N, /7/
Table 9. Crack propagation vs. load cycle number, N, /7/. Tabela 9. Rast prsline prema broju ciklusa opterećenja, N, /7/
step deltaN N1 0 02 28100.6 28100.63 16743.3 44843.94 11929 56772.95 9073.33 65846.236 7170.8 73017.037 5583.47 78600.58 4355.69 82956.199 3621.4 86577.59
10 3050.74 89628.3311 2441.18 92069.5112 2024.28 94093.7913 1716.49 95810.2814 1408.46 97218.7415 1130.81 98349.5516 932.906 99282.4617 820.004 100102.518 742.806 100845.319 811.889 101657.220 909.797 10256721 715.494 103282.422 460.387 103742.823 326.803 104069.624 248.564 104318.225 258.818 10457726 220.75 104797.827 154.39 104952.228 146.934 105099.129 145.712 105244.830 135.324 105380.131 128.381 105508.532 86.1654 105594.7
INTEGRITET I VEK KONSTRUKCIJA Vol. 13, br. 3 (2013), str. 179–188
STRUCTURAL INTEGRITY AND LIFEVol. 13, No 3 (2013), pp. 179–188
187
Crack growth analysis in friction stir welded joint zones using Analiza rasta prsline u zonama spoja frikciono zavarenog
CONCLUSIONS
Based on the previously presented analysis, the follow-ing conclusions are made: • Maximum stress is formed around the crack tip and
reaches its highest value in that zone (see Table 2), • At a certain point, the crack changes its direction (devi-
ates from the straight path), which is caused by the de-forming of the structure due to fracture (crack propaga-tion). Thus, tensile load also has a shearing component and because of that, in addition to tensile load mode I, the remaining modes (stress intensity factors, KII and KIII) also occur.
• During the low-cycle fatigue load, after only one load cycle, significant increase in the crack growth, which is quickly followed by structural failure. Hence, the nature of the load is almost static, because of an extremely high load intensity, which leads to unstable crack growth. In case of applying lower load values, crack growth is stab-le until a certain number of N ≈80,000, after which rapid crack growth leads to structural failure.
Remarks: During the 3D modelling and application of appropriate
software, it is necessary to pay attention to the following: − Defining of boundary conditions (loads and constraints-
connections with the rest of the structure or assembly). − Designer’s experience is of great importance for the
mesh generating process. Thus, type and size of finite elements can significantly affect the outcome of the calculation. In addition, making the mesh finer around the crack tip, as well as the region of its expected propa-gation is important.
Drawbacks: − Impossibility of obtaining relevant results for the crack
front that simultaneously passes through different regions (materials with different properties) – a feature that available software (ABAQUS, FRANC) lack.
− High requirements for PC characteristics: a PC with exceptional performance: multi-core processor with a RAM capacity as high as possible.
REFERENCES
1. http://www.twi.co.uk/technologies/welding-coating-and-material-processing/friction-stir-welding/ (13.06.2013)
2. Mishra, R.S., Ma, Z.Y., Friction stir welding and processing, Materials Science and Engng. R 50 (2005), pp.1-78.
3. Grujičić, M., Arakere, G., Yen, C.F., Cheeseman, B.A., Com-putational Investigation of Hardness Evolution During Fric-tion-Stir Welding of AA5083 and AA2139 Aluminum Alloys, J Materials Engng. and Perf., 2011, Vol.20, 7, pp.1097-1108.
4. Abaqus, Tutorials 5. Golestaneh, A.F., Ali, A., Zadeh, M., Modelling the fatigue
crack growth in friction stir welded joint of 2024-T351 Al alloy, Materials and Design, 30 (2009), pp.2928-2937.
6. Golestaneh, A.F., Ali, A., Voon, W.S., Faizal, M., Moha-mmadi, M.Z., Simulation of fatigue crack growth in friction stir welded joints in 2024-T351 Al alloy, Suranaree J Sci. Technol., Vol.16 (1), 2009, pp.35-46.
7. Živojinović, D., Primena mehanike loma na procenu integrite-ta zavarenih konstrukcija od legura aluminijuma, PhD disserta-tion in Serbian, University of Belgrade, Faculty of Mechanical Engineering, Belgrade, 2013.
INTEGRITET I VEK KONSTRUKCIJA Vol. 13, br. 3 (2013), str. 179–188
STRUCTURAL INTEGRITY AND LIFEVol. 13, No 3 (2013), pp. 179–188
188
Related Documents