Central Pattana Plc. Property Development and Investment Corporate Presentation: 1Q16 Performance Review CentralPlaza Nakhon Si Thammarat

Welcome message from author
This document is posted to help you gain knowledge. Please leave a comment to let me know what you think about it! Share it to your friends and learn new things together.
Transcript

Central Pattana Plc. Property Development and Investment
Corporate Presentation: 1Q16 Performance Review
CentralPlaza Nakhon Si Thammarat

2
Contents
► Our Company
► Growth
► Financing
► Looking ahead
► Appendices

3
Our company
Malls
1 Residence
Central City Residence @ Bangna
Project 2016-2020
Announced: 3 Condominiums
Target: 3 Condominiums/Yr
Commercial Hotel Residential
1
21
6
1 centralcenter
7 Office Buildings
• Lardprao
• Pinklao Tower A
• Pinklao Tower B
• Bangna
• CentralWorld Tower
• Chaengwattana
• Rama9
2
15 New Projects (2016-2020):
12 domestic malls and
3 overseas malls (i-City and 2 new malls)
Renovation projects:
2016:
BNA, RM3, PTC, and PKT
2017-2020: CMA, CTW, CWN, and RM2
New Retail format and paid attraction
Flagship business of the Central Group (Chirathivat Family)
Other related business
Hotels
CPN at a Glance
29 Shopping Malls
1.6 mn sqm
NLA 93%
Occ. Rate 21%
Market Share 15%
5-yr top line growth

4
5-yr target: revenue growth of 15%CAGR
4 Source: Company estimate as at 31 March 2016. Retail space: Includes leasable area of CentralPlaza Rama 2, CentralPlaza Rama 3, CentralPlaza Pinklao, and CentralPlaza Chiangmai Airport, which were
partially transferred to CPNRF, but still under CPN’s management.
Overall NLA to increase by 20% between 2015 and 2018F
97 98 96 95 96 97 96 96 94 94 94 94
-
10
20
30
40
50
60
70
80
90
100
-
0.2
0.4
0.6
0.8
1.0
1.2
1.4
1.6
1.8
2.0
Existing New Unannounced RS: Occupancy rate
10
projects 11
15 15
18 20
23 25
29
30
33
36
SQMmn
Retail NLA and occupancy rates
Growth
%

5
53%
47%
BMA
Provinces
CPN average occupancy rate remains high
5 (1) Excludes area transferred to CPNRF and CPNCG (2) Excludes rental agreements < 1 year, such as kiosk, carts, ATMs and coin machines.
Growth
Breakdown: NLA Breakdown: rental income
Retail
Property No. of
Projects
Land NLA (2) (sqm million) Occupancy Rate (%)
Freehold Leasehold Freehold &
Leasehold Retail
Dept.
Store Total 1Q15 4Q15 1Q16
BMA 13 4 7 2 0.68 0.06 0.74 93 94 94
Provinces 16 12 4 0 0.61 0.05 0.65 95 94 94
Total (1) 29 16 11 2 1.28 0.12 1.40 94 94 94
60%
40% BMA
Provinces

6
Upside from expirations of Long-term Lease Contracts
6 Source: Company estimate as of 31 March 2016. (1) Percentage based on occupied area. (%) 1Q15 figure (2) Total long-term lease area is 163,157 sq.m. with less than 4% rental income contribution.
Conversion into short term contracts at market rental rate should help increase revenues.
PKO
Types of rental contract (1) % of expired area to total long-term lease area (2)
Potential higher revenue
Growth
Reliable contract structure
3
3
3
4
26
12
17
31
- 20 40 60
FY2016
'17
'18
'19
'20
>'21
Retail shops Department Stores in Acquired Projects
%
48% 35%
17% Long-term Lease
Fixed Rent Consignment
(48%) (33%)
(19%)

7 7
28 July 2016 2017
Investment cost (1) : THB1.90bn
NLA (2) : 26,000 sqm
Joint developer (3) : Robinson Department Store
Land Size : 20 acres (51 rais) (Freehold)
Parking : 1,500 cars
Investment cost (1) : THB6.65bn
NLA (2) : 63,000 sqm
Joint developer (3) : -
Land Size : 22 acres (57 rais) (Leasehold)
Parking : 3,000 cars
Investment cost (1) : THB5.00bn
NLA (2) : 56,000 sqm
Joint developer (3) : Central Department Store
Land Size : 26 acres (65 rais) (Freehold)
Parking : 3,500 cars
CentralPlaza Nakhon Si Thammarat
Central Phuket Phase 2
Note 1: Includes land and construction cost of shopping center and parking building. Excludes those of Central Department Store or Robinson Department Store (CRC) Note 2: Excludes CRC’s area. Note 3: Area will be developed and owned by the joint developer. However the store will serve as a magnet to draw traffic into CPN’s plaza area.
CentralPlaza Nakhon Ratchasima
Domestic expansion continues Growth
2020
12 additional projects ′17-′20

8
2016 2017
4 Projects in ’16
• CentralPlaza Bangna
• CentralPlaza Rama3
• Central Center Pattaya
• CentralFestival Phuket
Asset enhancement projects Growth
2020
4 Additional Projects ′17-′20
• CentralPlaza Chiangmai Airport
• CentralWorld
• CentralPlaza Chaengwattana
• CentralPlaza Rama 2
Modernize malls to enhance asset value and draw traffic
Growth
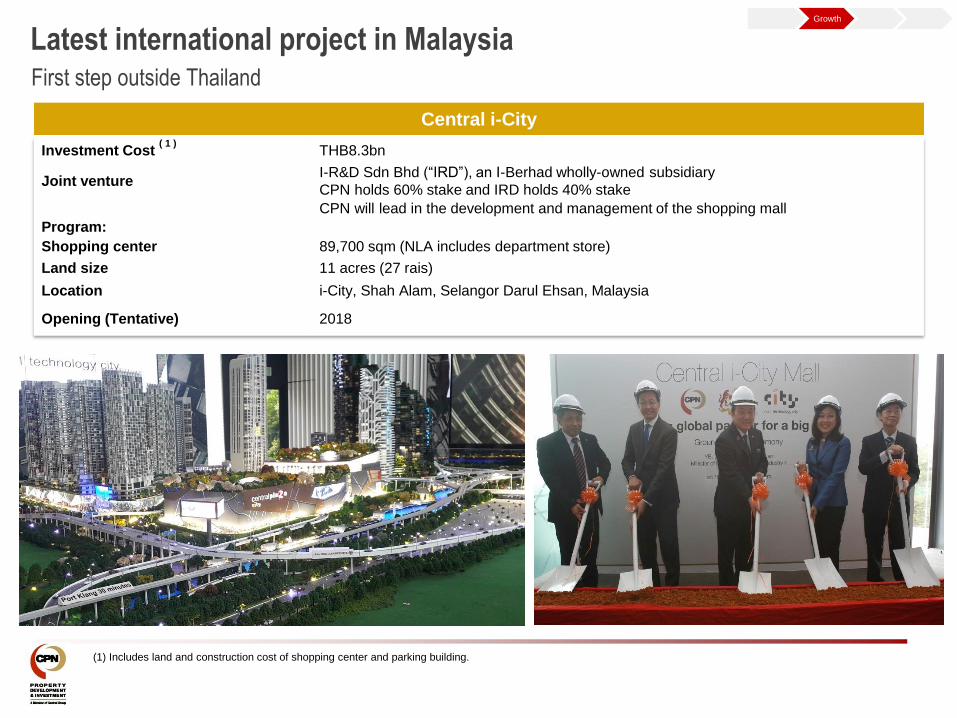
First step outside Thailand
Latest international project in Malaysia
Investment Cost ( 1 )
THB8.3bn
Joint venture I-R&D Sdn Bhd (“IRD”), an I-Berhad wholly-owned subsidiary
CPN holds 60% stake and IRD holds 40% stake
CPN will lead in the development and management of the shopping mall
Program:
Shopping center 89,700 sqm (NLA includes department store)
Land size 11 acres (27 rais)
Location i-City, Shah Alam, Selangor Darul Ehsan, Malaysia
Opening (Tentative) 2018
(1) Includes land and construction cost of shopping center and parking building.
Central i-City

10
Potential expansion in neighboring countries
Thailand
Malaysia
Indonesia
Vietnam
Completed JV Agreement
Potential Locations
Malaysia
Realistic land prices and freehold ownership
Moderate competition and fragmented market
High spending power with customer profile similar to
Thailand
Vietnam
Large population
Low competition with few major players
Strong growth in disposable income/low spending power
Indonesia
Large population
Rapidly growing middle class population with increasing
spending power
Sophisticated market but strong competition from existing
players
High cost of fund and unrealistic land price with limited
infrastructure
Investment strategy
Joint venture with local partners with focus on retail
properties
To be a property manager
Growth

11
Residential projects in the provinces
• 3 key projects in high-growth provinces: Chiangmai, Rayong, and Khonkaen;
• encouraging pre-sales; and
• maximize value creation from outstanding mall locations
Growth
Value-added condominium projects in key domestic market
ESCENT Chiangmai
400 Units
26-storey condo
ESCENT Khonkaen
408 Units
24-storey condo
ESCENT Rayong
419 Units
25 storey condo

12
Additional capex to drive future growth
Capex will continue to focus on core business
(THBbn) FY2015 ‘16F ‘17F ‘18F
Under construction 12.00 9.21 7.00 3.33
Enhancement 2.16 3.10 1.42 1.30
Potential 2.79 4.05 4.99 9.09
Total malls 16.96 16.36 13.40 13.73
Residential 0.01 0.44 1.22 1.55
Total Capex 16.97 16.81 14.63 15.28
Capex 2015-2018F
Financing
Source: Company estimate as of 31 March 2016.

13
Solid balance sheet despite expansion
Declining gearing and cost of debt
-
0.2
0.4
0.6
0.8
1.0
1.2
1.4
-
10
20
30
40
50
60
FY2011 '12 '13 '14 '15 1Q16
Cash¤t investment Interest bearing debts
Equity RS: Net D:E
THBbn x
Financing
Balance sheet and D:E
-
0.5
1.0
1.5
2.0
2.5
3.0
3.5
4.0
4.5
5.0
-
0.2
0.4
0.6
0.8
1.0
1.2
Finance Costs RS: Cost of debt
% THBbn
Finance Costs and cost of debt (1)
(1) Cost of debt was derived from interest expenses including interest capitalization for projects under development

14
CPNRF
No. of project: 5
Listed date: 23 August 2005
NAV(1) : THB 13.34 per unit
NAV(1) : THB 29.52 bn
Units: 2.21 bn
CPNCG
No. of project: 1
Listed date: 21 September 2012
NAV(1) : THB 11.55 per unit
NAV(1) : THB 4.93 bn
Units: 426 bn
Possibility of converting property fund to REIT
Thai corporates and foreign investors will lose tax benefits from dividend exemption.
No impact on Thai retail investors.
- Thai corporates will be subject to 20% corporate tax
- Foreign investors will be subject to 10% withholding tax
Tax on dividends
Higher gearing under REIT structure should compensate lower yield from tax issue (REIT =
35-60% vs. Property Fund = 10%)
Gearing
Our company
Growth Financing Look
ahead
(1) as of 31 March 2016.

15
Looking ahead
Financial • Revenue growth from new projects, asset enhancement, same store rental growth,
and space utilization (promotional events, on-site media, and convention halls)
• Mixed Use Development:
New shopping mall : CentralPlaza Nakhon Si Thammarat
Enhancement (4) : CentralPlaza Bangna, CentralPlaza Rama3,
Central Center Pattaya, and CentralFestival Phuket
Residential (3 condominiums) : ESCENT Chiangmai, Rayong, and Khonkaen
• Looking for acquisition opportunities in domestic and overseas markets
• New format and new attraction
• Cost efficiency improvement
• Tenants management
• Customers experiences
• Space utilization efficiency management
• Online social community
• Studying property fund conversion to REIT
• Increase DJSI score through programs :
CSR - education program, reduction in Carbon Footprint and support community
economic growth
CG Individual Assessment for all staff
Investment
Operation
Funding
CG & SD

16
The information contained in this presentation is for information purposes only and does not constitute an offer or invitation to sell or the
solicitation of an offer or invitation to purchase or subscribe for share in Central Pattana Public Company Limited (“CPN” and shares in
CPN, “shares”) in any jurisdiction nor should it or any part of it form the basis of, or be relied upon in any connection with, any contract or
commitment whatsoever.
This presentation may include information which is forward-looking in nature. Forward-looking information involve known and unknown
risks, uncertainties and other factors which may impact on the actual outcomes, including economic conditions in the markets in which CPN
operates and general achievement of CPN business forecasts, which will cause the actual results, performance or achievements of CPN to
differ, perhaps materially, from the results, performance or achievements expressed or implied in this presentation.
This presentation has been prepared by the CPN. The information in this presentation has not been independently verified. No
representation, warranty, express or implied, is made as to, and no reliance should be placed on, the fairness, accuracy, completeness or
correctness of the information and opinions in this presentation. None of the CPN or any of its agents or advisers, or any of their respective
affiliates, advisers or representatives, shall have any liability (in negligence or otherwise) for any loss howsoever arising from any use of this
presentation or its contents or otherwise arising in connection with this presentation.
This presentation is made, furnished and distributed for information purposes only. No part of this presentation shall be relied upon directly
or indirectly for any investment decision-making or for any other purposes.
This presentation and all other information, materials or documents provided in connection therewith, shall not, either in whole or in part, be
reproduced, redistributed or made available to any other person, save in strict compliance with all applicable laws.
Disclaimer
Note: All currency figures within this presentation are presented in Thai Baht unless otherwise stated.

17
Appendices

18
29 existing projects (23 Greenfields, 6 Acquisitions <=> 13 in Bangkok, 16 in Provinces)
1980s 1990s 2000s 2010-2015
Bangkok (2)
2002 CentralPlaza Rama 2
2008 CentralPlaza Chaengwattana
Provinces (3)
2009 CentralFestival Pattaya Beach
2009 CentralPlaza Chonburi
2009 CentralPlaza Khonkaen
Bangkok (3)
1993 CentralPlaza Ramindra
1995 CentralPlaza Pinklao
1997 CentralPlaza Rama 3
Province (1)
1995 Central Center Pattaya
Bangkok (4)
2011 CentralPlaza Grand Rama 9
2014 CentralPlaza Salaya
2015 CentralPlaza WestGate
2015 CentralFestival EastVille
Provinces (9)
2011 CentralPlaza Chiangrai
2011 CentralPlaza Phitsanulok
2012 CentralPlaza Suratthani
2012 CentralPlaza Lampang
2013 CentralPlaza Ubonratchathani
2013 CentralFestival Chiangmai
2013 CentralFestival Hatyai
2014 CentralFestival Samui
2015 CentralPlaza Rayong
Strong Development & Acquisition Pipeline
Bangkok (1)
1980 Established under Central
Plaza Co., Ltd.
1982 CentralPlaza Lardprao
Acq
uis
itio
n
Re
de
ve
lop
me
nt
& E
nh
an
ce
me
nt
Province (1)
1996 CentralPlaza Chiangmai Airport
Province (1)
2000 CentralPlaza Chiangmai Airport
Phase 2A
Bangkok (2)
2013 CentralPlaza Bangna
2015 CentralPlaza Pinklao
Province (1)
2012 CentralPlaza Udonthani (Phase 2)
Bangkok (2)
2004 The Offices at CentralWorld
2006 CentralWorld
Province (1)
2003 CentralPlaza Chiangmai Airport
Phase 2B
Source: Company data and company estimate as of December 2015.
CentralPlaza Lardprao
Gre
en
-fie
ld D
ev
elo
pm
en
t
Bangkok (3)
2001 CentralPlaza Bangna
2002 CentralWorld
2003 CentralPlaza Rattanathibet
Province (1)
2009 CentralPlaza Udonthani
Province (1)
2015 CentralFestival Phuket

19
Property Locations
Note: As of March 2016.
Shopping Centers (13 BMA, 16 Provinces) Offices (7) Hotels (2)
1 (Province) centralcenter
Bangkok
Metropolitan Area (BMA)
Existing Projects (29) Residence (1)
1 (BMA)
21 (11 BMA, 10 Provinces)
6 ( 1 BMA, 5 Provinces)
WestGate
Pinklao
Rama2
Rama3
Salaya
Rattanathibet
Chaengwattana Ramindra
Ladprao
Bangna
Grand Rama 9
EastVille

Leasable Area and Occupancy
20 (1) Excludes rental agreements < 1 year, such as kiosk, carts, ATMs and coin machines. (2) Percentage based on leasable area. Excludes areas transferred to CPNRF and CPNCG. (3) Outsource the management, Pattaya (302 rooms) managed by Hilton and Udonthani (259 rooms) managed by Centara. Occupancy rate of Hotel Business was an average of 3 months
Other Related Business
Retail
Property No. of
Projects
Land NLA (2) (sqm million) Occupancy Rate (%)
Freehold Leasehold Freehold &
Leasehold Retail
Dep
Store Total 1Q15 4Q15 1Q16
BMA 13 4 7 2 0.68 0.06 0.74 93 94 94
Provinces 16 12 4 0 0.61 0.05 0.65 95 94 94
Total (1) 29 16 11 2 1.28 0.12 1.40 94 94 94
Retail Business
Non-core Properties No. of
Projects
Net Leasable Area (sq.m.) Occupancy Rate (%)
or
No. of Units or Room 1Q15 4Q15 1Q16
Office in BMA (2) 5 55,108 95 97 96
Residential in BMA 1 1,568 38 30 37
Hotel in provincial area (3) 2 561 rooms 78 75 80

21
#1 Market Share in Thailand
Source: Figures and strategy were collected from public media and had not been verified. This is made for information purposes only.
Owners No. of new
projects GFA (sqm mn)
Investment
(THBbn) Year Strategy
The Mall 4 1.75 50 ′16-′20 City within the city malls in Bangkok World iconic tourist
destination for new malls in tourist destination
SF 1 0.40 10 ′19-′20 Expand 2-3 community malls per year JV with IKANO for
super regional malls
Future Park 1 0.16 4 ′15 Expand mall adjoining Future Park Rangsit
Use model of mall in CBD area
TCC Land 3 104 rais
(41 acres) 7
′17-′18
Mixed use projects in tourist destination and fine dining
concept
Siam Piwat,
CP, Magnolia 1
40 rais
(16 acres) 35 ′17
Plan to be Bangkok’s iconic landmark, Mixed-use project
with mall, residential, and entertainment
New projects by other players
CPN key success factors
Central Group Synergy
Financial Flexibility
Prime Location
CPN has 21% market share in Bangkok

Central Group 27%
Chirathivat Family
26%
Free float 47%
Strategic Shareholders
22
CPN is one of the flagship businesses of the Central Group (Chirathivat Family). As a strong and supportive
shareholder, the Chirathivat family brings to CPN a wealth of retail-related expertise through the family’s long
record and successful leadership in Thailand’s dynamic and competitive landscape of shopping mall
developments and department store / specialty store operations.
Source: TSD as of 4 March 2016..
53% Foreign funds 68%
Local funds 21%
Individuals 11%
23
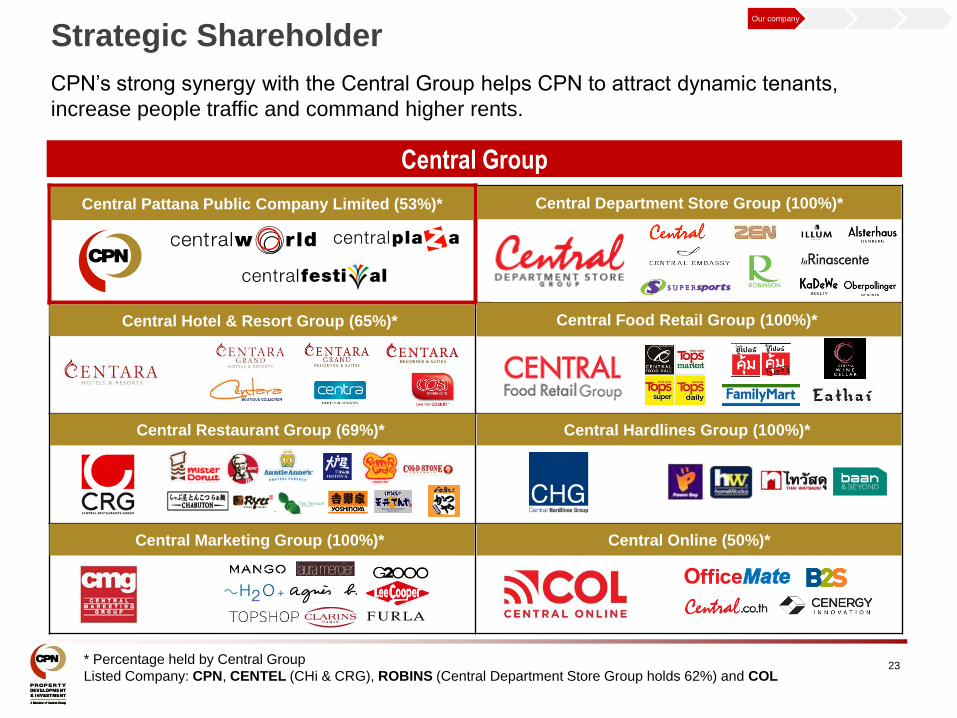
Strategic Shareholder
Central Group
CPN’s strong synergy with the Central Group helps CPN to attract dynamic tenants,
increase people traffic and command higher rents.
Central Department Store Group (100%)*
Central Food Retail Group (100%)*
Central Pattana Public Company Limited (53%)*
Central Hotel & Resort Group (65%)*
Central Restaurant Group (69%)*
Central Marketing Group (100%)*
Central Hardlines Group (100%)*
Central Online (50%)*
* Percentage held by Central Group
Listed Company: CPN, CENTEL (CHi & CRG), ROBINS (Central Department Store Group holds 62%) and COL
Our company

Property Development and Management
24
Department Store
& Category killers
CRG & CMG
• ~12% of total leasable areas
and also in term of total
revenue
• Pricing criteria as same as
others
Joint developers
• Sharing cost of land and common
area
• Owning its investment cost and assets
Property Developer
& Property Manager
Other tenants
• ~88% of total leasable areas and also in
term of total revenue
CRG
CMG
Other
Tenants
Other
Tenants
Other
Tenants
Other
Tenants
Other
Tenants
Other
Tenants
Other
Tenants
Other
Tenants
Shopping Mall
Our company

25
0123456789
10
1Q
12
2Q
12
3Q
12
4Q
12
1Q
13
2Q
13
3Q
13
4Q
13
1Q
14
2Q
14
3Q
14
4Q
14
1Q
15
2Q
15
3Q
15
4Q
15
1Q
16
Industry update
• Retail supply +0.7%QoQ and 5.7%YoY in 4Q15
• Occupancy rate increased to 93.2% due to reopening of major refurbished malls
• Consumer Confidence Index declined to 73.5 in March 2016 after reaching its recent-
high in December of 2015 at 76.1.
• Tourist arrivals reached a record-high level to 9mn in 1Q16, up 15% YoY
mn
Tourist arrivals
Source: Department of Tourism
Consumer Confidence Index
Source: UTCC
Industry
50
55
60
65
70
75
80
85
90
Jan
-12
Ap
r-1
2
Jul-
12
Oct
-12
Jan
-13
Ap
r-1
3
Jul-
13
Oct
-13
Jan
-14
Ap
r-1
4
Jul-
14
Oct
-14
Jan
-15
Ap
r-1
5
Jul-
15
Oct
-15
Jan
-16

4,413
5,991
7,307 7,746
2,390
6,189 6,293
7,231
7,880
2,390
2,000
3,000
4,000
5,000
6,000
7,000
8,000
2012 2013 2014 2015 1Q16
Normalized Net profit Net profit
5,590
7,345
8,447 9,074
2,835
2,000
3,000
4,000
5,000
6,000
7,000
8,000
9,000
10,000
2012 2013 2014 2015 1Q16
Operating profit
Financial Summary
26
(1) Total revenue includes rental & service, hotel operation, food & beverage, and other incomes, excluding interest income, share of profit from investment.
(2) Excl. non-recurring items
(3) Excl. CentralPlaza Ubonratchathani, CentralFestival Chiangmai, CentralFestival Hatyai, CentralFestival Samui, CentralPlaza Salaya, and CentralPlaza Chiangmai Airport.
(4) Excl. CentralPlaza Chiangmai Airport, CentralPlaza Pinklao, CentralFestival Samui, CentralPlaza Salaya, CentralPlaza Rayong, CentralFestival Phuket, CentralPlaza WestGate, CentralFestival
EastVille, and Langsuan Colonade.
(5) Excl. CentralPlaza Rayong, CentralFestival Phuket, CentralPlaza WestGate, CentralFestival EastVille, and Langsuan Colonade.
17,687
21,234
23,668
25,713
7,229
5,000
7,000
9,000
11,000
13,000
15,000
17,000
19,000
21,000
23,000
25,000
27,000
2012 2013 2014 2015 1Q16
Total revenues (excl non-recurring items)
% YoY Growth 2012 2013 2014 2015 1Q16
Total revenues (excl non-recurring items) /1 39% 19% 13% /2 9% 19%
Operating profit (excl non-recurring items) 113% 31% 15% 7% 20%
Normalized Net profit 136% 36% 21% 7% 19%
Net profit 201% 2% 16% 8% 11%
Same store revenue growth 29% 12% 4% /2,3 2% /4 2% /5
Gross Profit Margin (Exc. Other Income)(%) 44% 47% 48% 48% 50%
EBITDA Margin (%) 54% 52% 53% 53% 56%
(THB mn) (THB mn) (THB mn)
/2
/2
/2
/3

Retail 84% Office 2%
F&B 4%
Hotel 4%
Management fee 2%
Other income 4%
17,687
21,234
23,668 25,713
6,086 7,113 7,229
0
4,000
8,000
12,000
16,000
20,000
24,000
28,000
2012 2013 2014 2015 1Q15 4Q15 1Q16
(THB mn)
Retail Office F&B Hotel Management fee Other income
Revenue Breakdown
27 (1) Includes revenues from residential projects and water & amusement park, and property management fees from CPNRF & CPNCG. (2) Excl. non-recurring of THB 134 mn reversals of provisions for impairments recorded under 1Q15 other income.
1Q16 Revenue breakdown
1Q16 total revenues /1,2 +19% YoY or THB 1,143
mn YoY mainly contributed by
Rent and services +18% YoY
• Contributions from 4 new projects launched
during 2015, i.e. CentralPlaza Rayong,
CentralPlaza WestGate, CentralFestival Phuket
and CentralFestival EastVille.
• Increased revenues from a new look
CentralPlaza Pinklao (“PKO”) with higher rate
and occupancy after completing Phase 1
renovation.
• Rental revenue increased over 22% from
promotional areas.
• Higher revenues generated by existing malls
nationwide.
Hotel +3% YoY
• Contributions from strong performance of Hilton
Pattaya Hotel, due to wholesale segment
especially from Asia (China, South Korea and
Hong Kong).
F&B sales +40% YoY
• Contributions mainly from 4 new food courts
launched in 2015 including the one inside Food
Destination at PKO and existing outlets. - Rent from shops
- Promotion Area
(Events)
- Service income
- Convention Hall
- Onsite Media
+9% YoY
+19% YoY
+2% QoQ
Implementing strategic marketing activities:
• In collaboration with business partners, holding
promotional campaigns to encourage more
spending from local customers and cater for
expanding foreign tourists visiting Thailand.

9,434
10,542
11,616 12,634
2,864 3,505 3,424
0
2,000
4,000
6,000
8,000
10,000
12,000
14,000
2012 2013 2014 2015 1Q15 4Q15 1Q16
(THB mn)
Retail Office F&B Hotel Others
Costs Breakdown
28 Note: Excludes non-recurring items.
1Q16 Cost breakdown
1Q16 total costs +20% YoY or THB 560 mn YoY
mainly due to
Cost of Rent and Services +19% YoY,
• Operating costs and depreciation of projects
launched in 2015, and addition of new
projects launched in 2015.
• Increased in personnel costs, depreciation
and utilities costs following the launch of 4
new malls.
Cost of Hotel Business +5% YoY
• Higher personnel costs at Hilton for hiring
temporary workers to accommodate high
occupancy seen during 1Q16.
Cost of F&B +37% YoY
• In line with a 40% revenue growth, mainly
derived from new malls launched in 2015.
20% YoY
-2% QoQ
+9% YoY
Focusing on efficient cost management:
• Upgrading to high efficiency chiller, resulted in
more efficient use of energy.
Retail 89%
Office 1%
F&B 7%
Hotel 3%

Personnel 50%
Advertising & promotion
17%
Depreciation 13%
Others 20%
2,741
3,446 3,667
4,030
863
1,349
977
0
500
1,000
1,500
2,000
2,500
3,000
3,500
4,000
4,500
2012 2013 2014 2015 1Q15 4Q15 1Q16
(THB mnl)
Personnel Advertising & promotion Depreciation Others
SG&A Expenses Breakdown
29
SG&A expenses +13% YoY or THB 114 mn YoY
mainly due to
• Additional personnel expenses following the
launch of both 4 new malls in 2015 as well as
3 condominium projects.
• Higher marketing expenses mainly from new
malls.
Note: Excludes non-recurring items.
1Q16 SG&A breakdown
+13% YoY
-28% QoQ
Ability to control expenses:
• Continuous pooled mechanism with Central
Group to achieve economies of scale
• Marketing campaign
• Supply chain management
+10% YoY
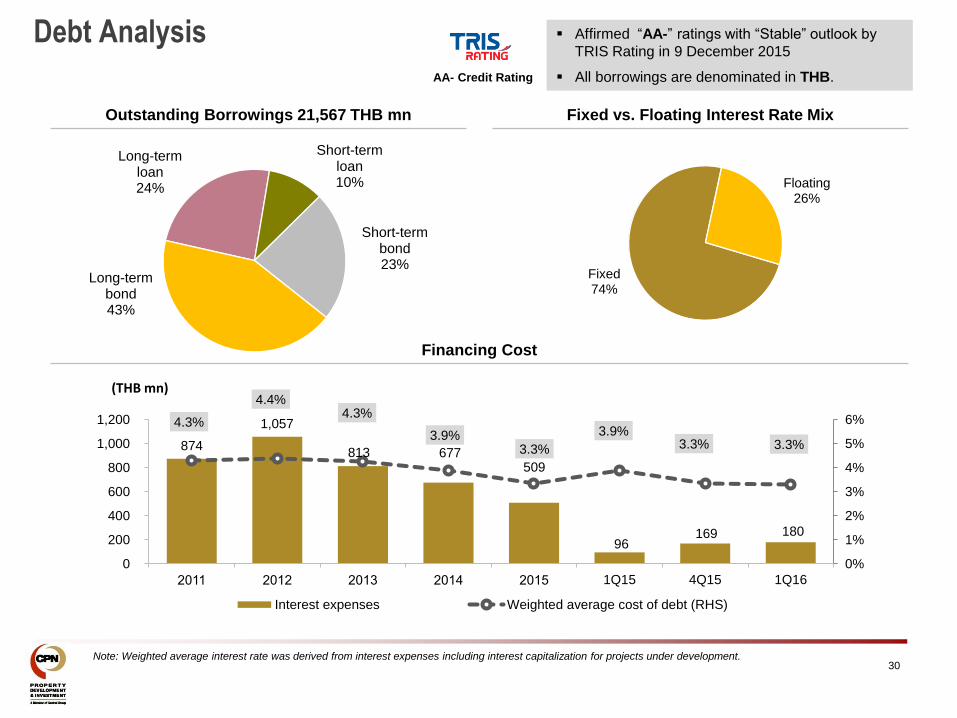
Fixed 74%
Floating 26%
Debt Analysis
30 Note: Weighted average interest rate was derived from interest expenses including interest capitalization for projects under development.
Outstanding Borrowings 21,567 THB mn Fixed vs. Floating Interest Rate Mix
Financing Cost
AA- Credit Rating
Affirmed “AA-” ratings with “Stable” outlook by
TRIS Rating in 9 December 2015
All borrowings are denominated in THB.
Long-term loan 24%
Short-term loan 10%
Short-term bond 23%
Long-term bond 43%
874
1,057
813 677 509
96 169 180
4.3%
4.4% 4.3%
3.9% 3.3%
3.9% 3.3% 3.3%
0%
1%
2%
3%
4%
5%
6%
0
200
400
600
800
1,000
1,200
2011 2012 2013 2014 2015 1Q15 4Q15 1Q16
Interest expenses Weighted average cost of debt (RHS)
(THB mn)

Capital Structure
31
CPN’s net D/E stood at 0.33 times, against its debt covenant of 1.75 times.
2,541 1,632 945
4,207 1,869
3,773 2,828 4,326 5,358
16,669 19,085
25,245 25,568
19,842
16,019 15,208
22,623 21,567
19,008 18,918
20,448
25,900
36,824
41,748
43,951 46,801
49,221
0.74
0.92
1.19
0.82
0.49
0.29 0.28
0.39 0.33
0.00
0.20
0.40
0.60
0.80
1.00
1.20
1.40
0
5,000
10,000
15,000
20,000
25,000
30,000
35,000
40,000
45,000
50,000
2009 2010 2011 2012 2013 2014 1Q15 4Q15 1Q16
(Times) (THB mn)
Cash & current investment Interest bearing debts Equity RS: Net D/E

Statement of Financial Position
32 (1) Investment Properties are booked at cost and depreciated with the straight-line basis over the life of the assets. The estimated fair value is THB 157,100 mn (THB
127,664 mn in December 2014), stated in the disclosure notes to the main financial statements no. 12 under “Investment Properties”.
Current assets
Cash and current investments 2,828 4,326 5,358 24% 89%
Other current assets 2,704 3,011 2,571 (15%) (5%)
Total current assets 5,532 7,337 7,929 8% 43%
Non-current assets
Investment properties (1) 63,421 74,796 74,742 (0%) 18%
Leasehold rights 11,519 11,644 11,482 (1%) (0%)
Property & equipment (PP&E) 2,074 1,939 1,883 (3%) (9%)
Other non-current assets 7,171 7,328 7,542 3% 5%
Total non-current assets 84,186 95,708 95,650 (0%) 14%
Total assets 89,718 103,045 103,579 1% 15%
Current liabilities 13,632 15,530 16,707 8% 23%
Non-current liabilities 32,135 40,714 37,652 (8%) 17%
Total liabilities 45,767 56,244 54,358 (3%) 19%
Total equity 43,951 46,801 49,221 5% 12%
Financial Position (MB) End of 1Q15% Change
Q-o-QEnd of 4Q15
% Change
Y-o-YEnd of 1Q16

33
Statement of Comprehensive Income
% YoY % QoQ
Change Change
Revenue from rent and services 5,271 6,033 6,213 18% 3%
Retail 5,169 5,920 6,105 18% 3%
Office 98 112 108 10% (3%)
Other supportive businesses 3.6 0.3 0.3 (92%) 0%
Revenue from hotel operations 268 264 277 3% 5%
Revenue from food and beverage 223 306 313 40% 2%
Other income 459 511 426 (7%) (17%)
Total revenues 6,221 7,113 7,229 16% 2%
Total revenues excluding non-recurring items 6,086 7,113 7,229 19% 2%
Cost of rent and services 2,602 3,175 3,093 19% (3%)
Retail 2,554 3,130 3,047 19% (3%)
Office 45 45 45 0% 0%
Other supportive businesses 3.7 0.3 0.3 (92%) 0%
Cost of hotel operation 83 83 88 5% 5%
Cost of food and beverage 178 246 244 37% (1%)
Total costs 2,864 3,505 3,424 20% (2%)
Operating profit 2,501 2,265 2,835 13% 25%
Operating profit excluding non-recurring items 2,367 2,265 2,835 20% 25%
Net profit excluding non-recurring items 2,013 1,911 2,390 19% 25%
EPS (Bt) 0.48 0.43 0.53 11% 23%
Gross Profit Margin (excl. other income) 50% 47% 50% (1%) 3%
Operating Profit Margin 39% 32% 39% 0.3% 7%
1Q16Consolidated Earnings (MB) 1Q15 4Q15

34
2015 Awards and Achievements
Member of Dow Jones Sustainability Indices (DJSI) Emerging Markets 2015
for two consecutive years
“ASEAN CG Scorecard 2015”
CPN has been ranked Top 50 Companies in ASEAN Corporate Governance Awards 2015
“BCI Asia Top 10 Developer Awards 2015”
Recognized the top architectural firms and developers that had the greatest impact on the
built environment in Southeast Asia
“Corporate Governance Report of Thai Listed Companies 2015”
“Excellence Score” had been earned by CPN for seven consecutive years from 2009-
2015.
“Thailand Energy Awards 2015” honoured companies with outstanding performance in
both energy conservation and renewable energy development:
The winner of “Best Regulating Structure” – CentralPlaza Lardprao
The winner of “Innovation for Energy Efficiency” – CentralFestival Hatyai and
CentralFestival Chiangmai
The winner of “Outstanding Responsibility for Energy Efficiency” - CentralPlaza Lardprao

Key Trading Statistics and Dividend
35
Dividend
Dividend policy is paid annually approximately 40% of net profit (unless there is
compelling reason against this).
Note 1: Dividend payout ratio of 25% in 2009 was derived from 40% of normal net profit and 14% of
gain from transferring assets into CPNRF.
Note 2: Dividend payout ratio of 33% in 2012 was derived from 40% of normal net profit and 17% of
gain from transferring assets into CPNCG.
Note 3: Par split to THB 0.50 per share effective on 7 May 2013
Key Trading Statistics
Key Metrics THB
Par Value 0.50
Stock Price (1) 51.50
EPS (2) 0.53
P/E (x)(1) 29.33
Market Capitalization (THB bn)(1) 231
Authorized Share Capital (mil. shares) 4,488
Key Metrics 2015 2014 2013 2012 2011 2010 2009
Par Value (THB) 0.50(3) 0.50(3) 0.50(3) 1.00 1.00 1.00 1.00
Dividend
(THB/Share)
0.70 0.65 0.55 0.475 0.37 0.25 0.58
Dividend Paid
(THB. mil)
3,142 2,917 2,468 2,070 806 545 1,264
Dividend Payout
Ratio
39.9% 39.9% 39.2% 33%(2) 39% 48% 25%(1)
Note 1: SetSmart as of 31 March 2016.
Note 2: 1Q16 Performance. EPS excluding non-recurring items

Operational Performance: CPNRF and CPNCG
36 Note 1: Includes rental agreements < 1 year such as kiosk, carts, ATMs and coin machines and CPN acts as the property manager. Note 2: Percentage based on leasable area.
In 1Q16, CPN Retail Growth Leasehold Property Fund (“CPNRF”) had four shopping centers and two
office towers. In Sep12, CPN Commercial Growth Leasehold Property Fund (“CPNCG”) was launched
and currently owns one office.
CPNRF and CPNCG are managed by SCB Asset Management, Fund Manager. Their properties are
managed by CPN, Property Manager.
Remaining Life Leasable Area (1)
(years) (sq.m.) 1Q15 4Q15 1Q16
1. Rama 2 (Retail) 9 Yr & 4 M 88,068 96% 96% 87%
2. Rama 3 (Retail) 79 Yr & 4 M 37,346 91% 92% 91%
3. Pinklao (Retail) 8 Yr & 9 M 27,807 77% 67% 75%
4. Pinklao Tower A & B (Office) 8 Yr & 9 M 33,760 97% 97% 97%
5. Chiangmai Airport (Retail) 28 Yr & 1 M 37,484 98% 97% 97%
224,466 93% 92% 89%
Occupancy Rate (2)
CPNRF Properties
Total
Remaining Life
(years) 1Q15 4Q15 1Q16
CentralWorld (Office) 16 Yr & 9 M 81,474 99% 99% 99%
Occupancy Rate (2)
CPNCG Office Property Leasable Area(1) (sq.m.)

Investor Relations
Address
Central Pattana Public Company Limited
31st Fl, the Offices at CentralWorld
999-9 Rama I Rd., Patumwan District
Bangkok 10330
Thailand
Tel: +66(0) 2667 5555 ext. 1614, 1688, 1689
Facsimile: +66(0) 2264 5593
Email: [email protected]
37
Related Documents