MAGNETIC RESONANCE IN MEDICINE 16,67-79 ( 1990) CPMG Imaging Sequences for High Field in Vivo Transverse Relaxation Studies R. V. MULKERN, S. T. S. WONG, P. JAKAB, A. R. BLEIER, T. SANDOR, AND F. A. JOLESZ Department ofRadiology, Brigham and Women ’s Hospital, Boston, Massachusetts 021 IS Received April 21, 1989; revised November 13, 1989 Two-dimensional Fourier transform Cam-Purcell-Meiboom-Gill ( CPMG ) imaging se- quences were implemented on 1.9-T and 1.5-T imaging systems in order to test their ability to characterize in vivo transverse decay curves (TDCs). Both hard- and soft-pulse CPMG imaging sequences, consisting of up to 128 echoes with echo spacings of approximately 10 ms were developed, implemented, and tested. These sequences provide one of the most detailed samplings of TDCs from image data sets reported to date. Good agreement between image-extracted T2 values and spectroscopically obtained Tz values of NiC12-doped saline solutions was found with both hard- and soft-pulse sequences. In vivo TDCs were extracted from rabbit and human image data sets. For several tissues, biexponential TDC fits provided considerable improvement over monoexponential fits and the sensitivity of the fitting parameters to positive baseline offsets was examined. With the time coverage of the relax- ation decay curves available from these sequences, the TDCs from white matter in humans appear largely monoexponential while those from cortical grey matter demonstrate biex- ponential behavior. 0 1990 Academic F’ress, Inc. INTRODUCTION Numerous in vitro studies have demonstrated that the transverse magnetization decay curve in various tissues is not adequately described by a single exponentially decaying function ( 1-20). Thus, simple few-point schemes for calculating transverse relaxation times T2, from multislice, few-echo imaging sequences are problematic. In vitro studies which characterize the transverse decay curve (TDC) as a sum of two or more exponentials have demonstrated an improvement in specificity over simple monoexponential T2 measurements (14-20). They provide one motivation for the development of high-field in vivo imaging methods for sampling TDCs in much greater detail than those currently practiced. Another motivation lies in the desire to reach a more complete understanding of the mechanisms responsible for the observed mul- tiexponential behavior of tissue TDCs than that which currently exists. We have combined 2D-FT imaging methods at high field with detailed sampling of the transverse magnetization decay curve using CPMG imaging sequences. The sequences described below provide one of the greatest samplings of in vivo tissue TDCs from image data sets reported to date. Values of T2 calculated with the imaging methods agree favorably with spectroscopically obtained T2’s in simple liquid phantoms. The ability of the sequences to provide a sampling of in vivo tissue TDCs suitable for biexponential decomposition is demonstrated in both rabbit and humans. 67 0740-3 194/90 $3.00 Copynght 0 1990 by Academic Press, Inc. All nghts of reproduction in any form reserved

Welcome message from author
This document is posted to help you gain knowledge. Please leave a comment to let me know what you think about it! Share it to your friends and learn new things together.
Transcript
MAGNETIC RESONANCE IN MEDICINE 16,67-79 ( 1990)
CPMG Imaging Sequences for High Field in Vivo Transverse Relaxation Studies
R. V. MULKERN, S. T. S. WONG, P. JAKAB, A. R. BLEIER, T. SANDOR, AND F. A. JOLESZ
Department ofRadiology, Brigham and Women ’s Hospital, Boston, Massachusetts 021 I S
Received April 21, 1989; revised November 13, 1989
Two-dimensional Fourier transform Cam-Purcell-Meiboom-Gill ( CPMG ) imaging se- quences were implemented on 1.9-T and 1.5-T imaging systems in order to test their ability to characterize in vivo transverse decay curves (TDCs). Both hard- and soft-pulse CPMG imaging sequences, consisting of up to 128 echoes with echo spacings of approximately 10 ms were developed, implemented, and tested. These sequences provide one of the most detailed samplings of TDCs from image data sets reported to date. Good agreement between image-extracted T2 values and spectroscopically obtained Tz values of NiC12-doped saline solutions was found with both hard- and soft-pulse sequences. In vivo TDCs were extracted from rabbit and human image data sets. For several tissues, biexponential TDC fits provided considerable improvement over monoexponential fits and the sensitivity of the fitting parameters to positive baseline offsets was examined. With the time coverage of the relax- ation decay curves available from these sequences, the TDCs from white matter in humans appear largely monoexponential while those from cortical grey matter demonstrate biex- ponential behavior. 0 1990 Academic F’ress, Inc.
INTRODUCTION
Numerous in vitro studies have demonstrated that the transverse magnetization decay curve in various tissues is not adequately described by a single exponentially decaying function ( 1-20). Thus, simple few-point schemes for calculating transverse relaxation times T2, from multislice, few-echo imaging sequences are problematic.
In vitro studies which characterize the transverse decay curve (TDC) as a sum of two or more exponentials have demonstrated an improvement in specificity over simple monoexponential T2 measurements (14-20). They provide one motivation for the development of high-field in vivo imaging methods for sampling TDCs in much greater detail than those currently practiced. Another motivation lies in the desire to reach a more complete understanding of the mechanisms responsible for the observed mul- tiexponential behavior of tissue TDCs than that which currently exists.
We have combined 2D-FT imaging methods at high field with detailed sampling of the transverse magnetization decay curve using CPMG imaging sequences. The sequences described below provide one of the greatest samplings of in vivo tissue TDCs from image data sets reported to date. Values of T2 calculated with the imaging methods agree favorably with spectroscopically obtained T2’s in simple liquid phantoms. The ability of the sequences to provide a sampling of in vivo tissue TDCs suitable for biexponential decomposition is demonstrated in both rabbit and humans.
67 0740-3 194/90 $3.00 Copynght 0 1990 by Academic Press, Inc. All nghts of reproduction in any form reserved
68 MULKERN ET AL.
MATERIALS AND METHODS
Imaging experiments were performed with a 1.9-T, 30-cm system and a 1.5-T, 60- cm imaging system (IBM/MIT). To increase the separation between gradient coils and primary magnetic field coils, the 30-cm system was equipped with a separate set of gradient coils built around a 15-cm-diameter acrylic form. These consist of a Maxwell pair and two saddle pair Golay coils (21) for the z and x, y gradients, respectively. The 60-cm system is equipped with actively shielded gradient coils. With these ar- rangements, the rapid gradient switching required for reducing echo spacings was not compromised by eddy current problems.
Two types of CPMG imaging sequences were implemented on the 1.9-T system. One consisted of primarily nonselective (hard) pulses. The other consisted entirely of slice selective (soft) pulses.
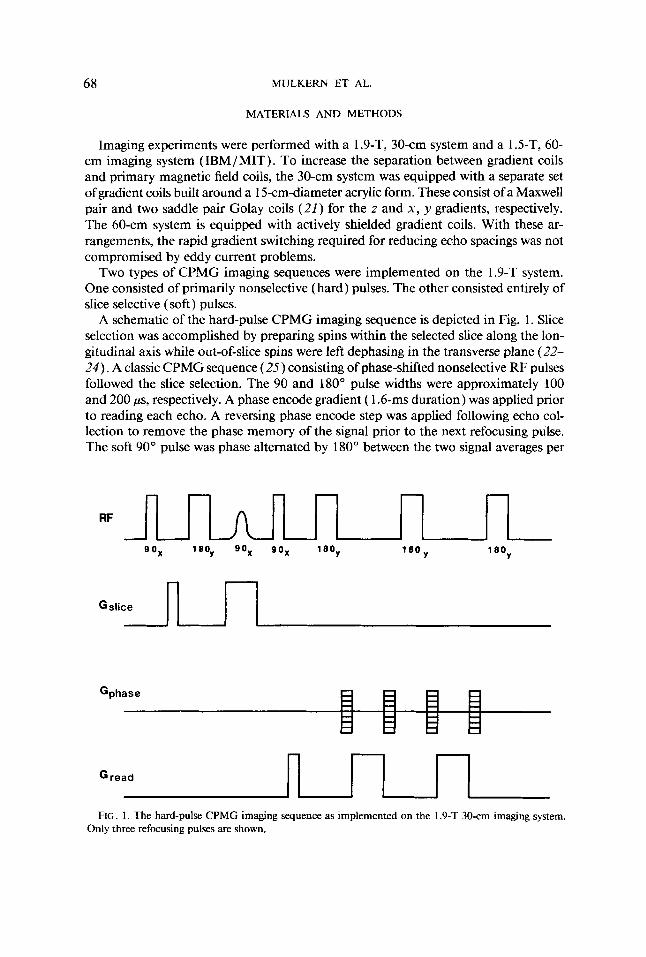
A schematic of the hard-pulse CPMG imaging sequence is depicted in Fig. 1. Slice selection was accomplished by preparing spins within the selected slice along the lon- gitudinal axis while out-of-slice spins were left dephasing in the transverse plane (22- 2 4 ) . A classic CPMG sequence (25) consisting of phase-shifted nonselective RF pulses followed the slice selection. The 90 and 180" pulse widths were approximately 100 and 200 ps, respectively. A phase encode gradient ( 1.6-ms duration) was applied prior to reading each echo. A reversing phase encode step was applied following echo col- lection to remove the phase memory of the signal prior to the next refocusing pulse. The soft 90" pulse was phase alternated by 180" between the two signal averages per
sox 18OY gox 9 o x l 8 O Y l 8 O Y 1 8OY
FIG. 1. The hard-pulse CPMG imaging sequence as implemented on the 1.9-T 30-cm imaging system. Only three refocusing pulses are shown.
CPMG IMAGING SEQUENCES FOR TRANSVERSE RELAXATION STUDIES 69
phase encode in order to minimize out-of-slice signal contribution ( 2 4 ) . The soft- pulse consisted of a three-lobe sinc function convoluted with a cosine envelope (2-ms duration). CPMG imaging sequences with up to 64 echoes with echo spacings between 6 and 13 ms were tested with the hard-pulse CPMG imaging sequence.
Soft-pulse CPMG imaging sequences were implemented on both the 1.5-T system and the 1.9-T system. These consisted of a selective 90" pulse followed by 128 selective 180" pulses phase-shifted 90" from the initial excitation pulse. The soft pulses consisted of the three-lobe sinc functions described above. Minimum echo spacings achieved for the soft-pulse sequences were 9.6 ms. In-plane spatial encoding was performed as in the hard-pulse sequence (Fig. 1 ). Phase cycling of the soft 90" pulse by 180" between the two signal averages per phase encode was also performed in this sequence. This minor modification of the CPMG sequence serves to reduce the effects of imperfect 180" pulses (26). To minimize missettings of the RF flip angles, the stimulated-echo method proposed by Perman et al. (27) was used to set the RF levels of both the 90 and 180" pulses.
Individual echoes from the CPMG imaging sequences were used to produce mag- nitude-calculated reconstructed images on 128 X 128 matrices with standard 2D-FT techniques. Minimum fields of view (FOV) achieved on the 1.9-T system were 72 mm, as compared to 100 mm on the 1.5-T system.
Since each echo of both the hard- and soft-pulse sequences is individually phase encoded, read, and phase "unwrapped," the spins have no phase memory prior to the refocusing pulses. This permits a minor modification of the sequences to be used to generate "snap-shot" images. Namely, the phase encode gradient and its rewrap are incremented for each echo, thus stepping through all 128 phase encoding steps in a single echo train. The method has been called the RARE sequence (Rapid Acquisition Relaxation Enhanced) (28, 29) . Modifying the soft-pulse CPMG imaging sequence to accommodate the RARE phase encoding method permits rapid and accurate slice localization prior to application of the CPMG imaging sequence in which phase encodes are altered between excitations rather than between echoes.
Phantom materials used for T2 studies consisted of NiC12-doped ( Aldrich Chemical Co., Milwaukee, WI) saline solutions. To obtain a phantom with a long T2 value ( T2 > 2000 ms) , a mixture of saline and deuterium oxide ( D20) was prepared. Spectro- scopic T2 measurements of phantoms were made at 10 MHz with an IBM mini- spectrometer (IBM Instruments, Danbury, CT) using a 10-echo CPMG sequence and with hard-pulse CPMG sequences at the imaging field strengths applied in the absence of imaging gradients. The difference between the nonimaging high- and low-field T2 measurements was less than lo%, consistent with the small frequency dependence reported for these materials (30-32). Small ( 1-2 kg) male New Zealand rabbits were anesthetized with ketamine (10 mglkg) and xylazine (40 mglkg) for imaging on the 1.9-T system. Human brain studies on the 1.5-T system were performed on healthy volunteers.
All image data sets were transferred to a Microvax computer (Digital Equipment Corp., Maynard, MA) for image processing. TDCs were extracted from regions of interest ( ROIs) and fit to both mono- and biexponential functions using a maximu& likelihood algorithm ( 5 ) . The biexponential function used for fitting purposes is given by
70 MULKERN ET AL.
S/So = a exp( - t / Tza) + ( 1 - a)exp( -t/ T2b).
Here, S/So is the normalized signal intensity, t is the echo time, a is the fraction of the quickly decaying component, and Tz, and T2b are the transverse relaxation times of the quickly and slowly decaying components, respectively. For both mono- and biexponential TDC fits, the sum of squared residuals divided by the total number of observations was calculated through
6 = ( 1 / N C ( y i - ~ i ) ~ , [21
where yi is the measured signal intensity at echo time t , yi is the value calculated from the best fit, and N is the total number of points used in the calculation. Fits were performed with and without subtracting baseline values obtained from measurements of noise levels outside of the imaged object. This permitted an assessment of the extent to which small positive baseljne offsets influence the parameters of the fits. Typical computational times for completing a biexponential TDC fit on the Microvax were between 1 and 2 min.
RESULTS
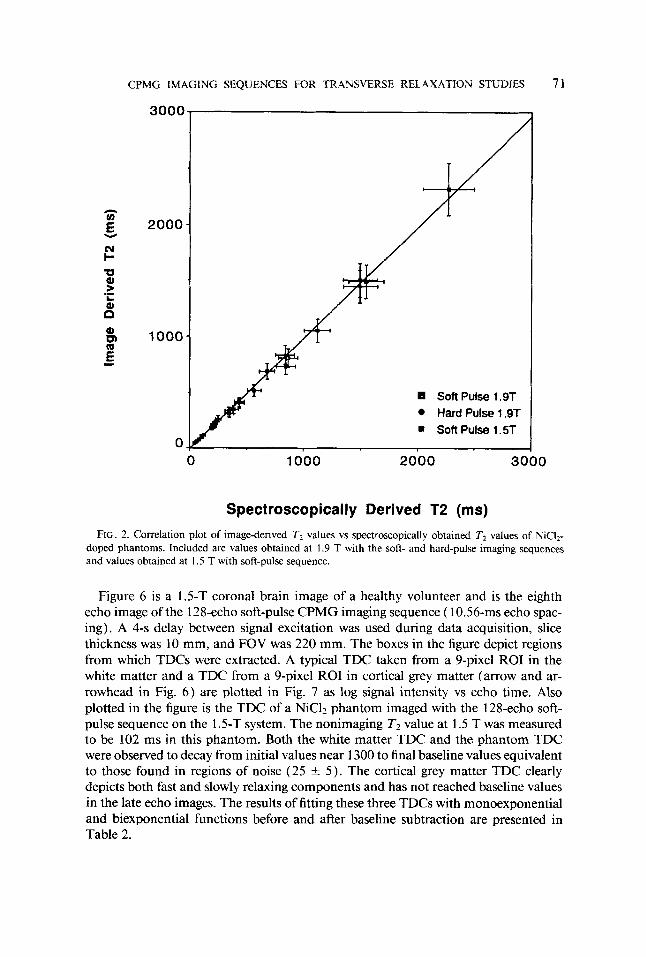
A correlation plot of spectroscopically measured T2 values and image-extracted T2 values of several NiC12 phantoms is depicted in Fig. 2. The figure contains results from both hard- and soft-pulse sequences obtained on the 1.9-T system and results from the soft-pulse sequence obtained with the 1.5-T system. The decay curves from the liquid phantoms were found to be highly monoexponential in that attempts to fit them to biexponential functions led to fractions of the main component a, of over 0.99 with or without the subtraction of baseline values (see below). A linear fit to the entire data set in Fig. 2 yields
T2 (Image derived) = - 14.34 ms + 0.992T2 (Spectroscopic) [31 with a correlation coefficient 0.99.
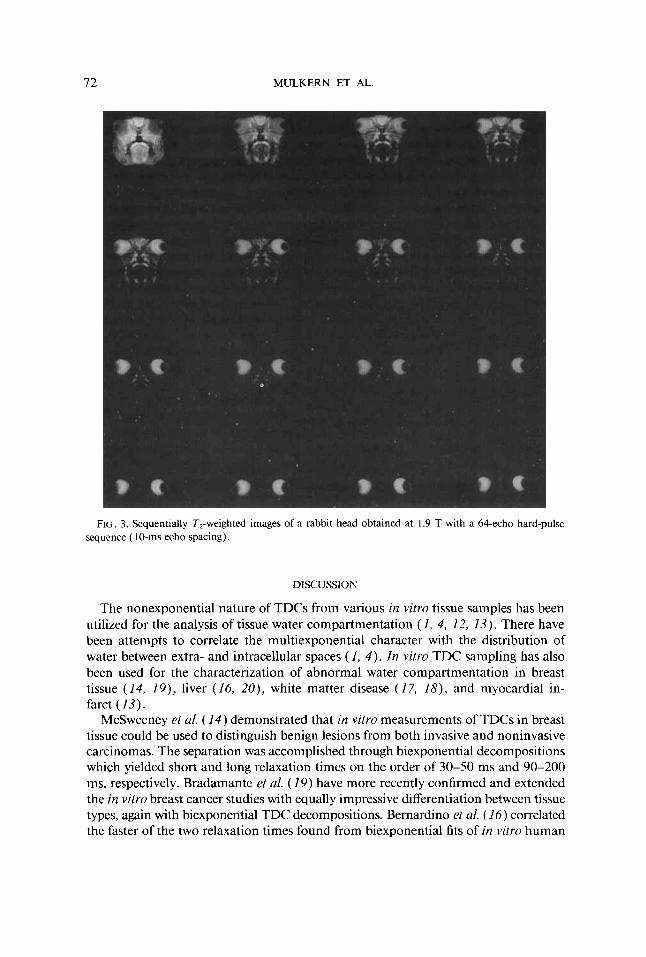
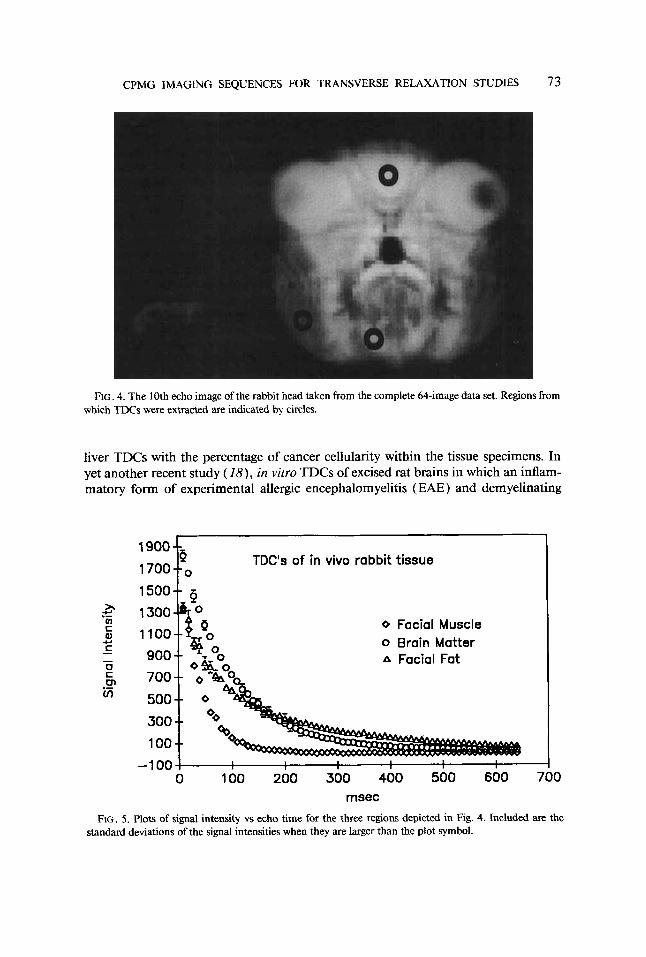
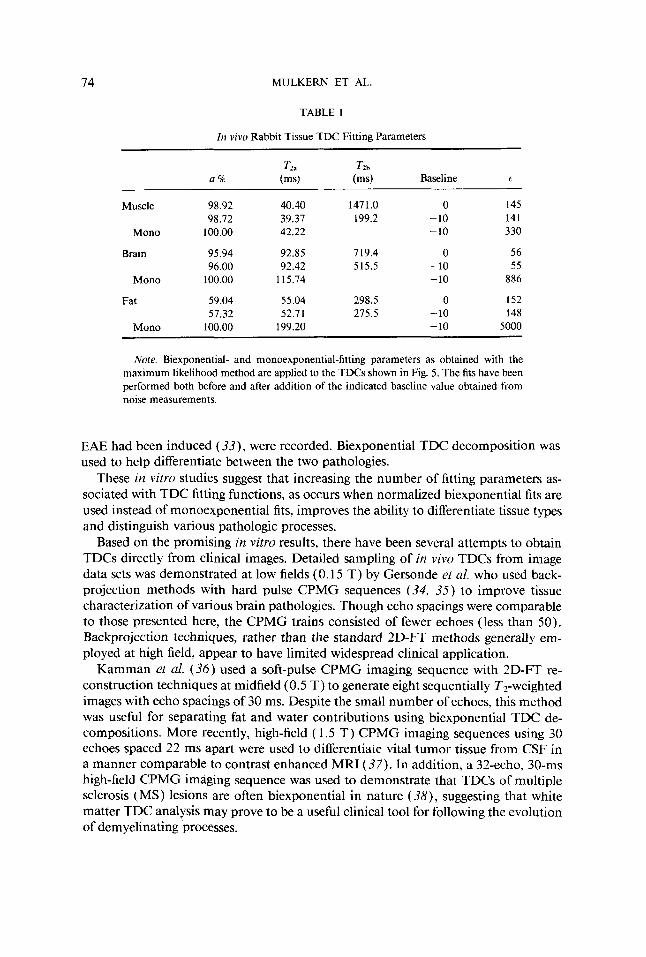
Figure 3 shows sequentially T2-weighted in vivo images of a rabbit head produced with the hard-pulse CPMG imaging sequence. The sequence consisted of 64 echoes with a 10-ms echo spacing. A delay of 4 s between each excitation, a slice thickness of 5 mm, and an FOV of 72 mm were used. The 16 images shown were obtained by averaging consecutive groups of 4 from the complete 64-image data set. Regions from which TDC information was extracted are shown in the 10th echo image of the rabbit head (Fig. 4, circles) and represent brain, fatty tissue, and muscle. Plots of TDCs from these regions are presented in Fig. 5 as signal intensity vs echo time. The signal inten- sities and standard deviations were extracted from 9-pixel ROIs in brain and fatty tissue and from a 27-pixel ROI in the facial muscle. The signal intensity from muscle was found to decay from an initial value near 1300 to values around 10. Regions of noise outside the rabbit head yielded intensity values similar to the final signal intensity from muscle ( 10 k 3 ) . Therefore, the TDCs were fit with biexponential functions before and after a subtraction of 10 from the signal intensities. The data were also fit with monoexponential functions following subtraction of the mean baseline value. Table 1 presents the results of the various fitting procedures performed on the TDCs in Fig. 5.
CPMG IMAGING SEQUENCES FOR TRANSVERSE RELAXATION STUDIES
3000 I
2000
1000
0
Soft Pulse 1.9T Hard Pulse 1.9T Soft Pulse 1.5T
0 1000 2000 3c
Spectroscopically Derived T2 (ms)
71
0
FIG. 2. Correlation plot of image-derived TI values vs spectroscopically obtained T2 values of NiCI2- doped phantoms. Included are values obtained at 1.9 T with the soft- and hard-pulse imaging sequences and values obtained at 1.5 T with soft-pulse sequence.
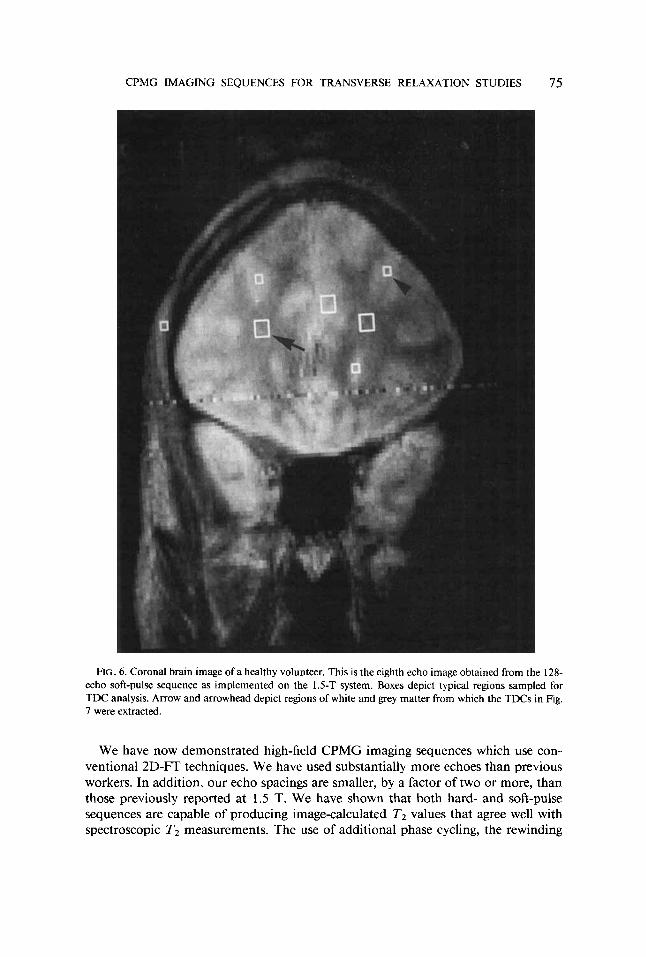
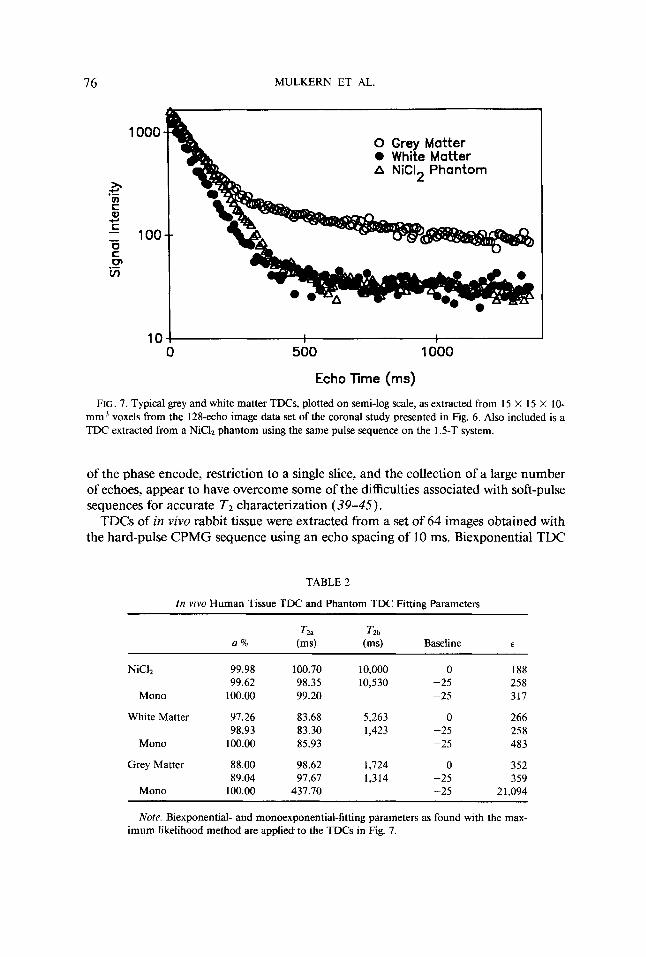
Figure 6 is a 1.5-T coronal brain image of a healthy volunteer and is the eighth echo image of the 128-echo soft-pulse CPMG imaging sequence ( 10.56-ms echo spac- ing). A 4-s delay between signal excitation was used during data acquisition, slice thickness was 10 mm, and FOV was 220 mm. The boxes in the figure depict regions from which TDCs were extracted. A typical TDC taken from a 9-pixel ROI in the white matter and a TDC from a 9-pixel ROI in cortical grey matter (arrow and ar- rowhead in Fig. 6) are plotted in Fig. 7 as log signal intensity vs echo time. Also plotted in the figure is the TDC of a NiC12 phantom imaged with the 128-echo soft- pulse sequence on the 1.5-T system. The nonimaging T2 value at 1.5 T was measured to be 102 ms in this phantom. Both the white matter TDC and the phantom TDC were observed to decay from initial values near 1300 to final baseline values equivalent to those found in regions of noise (25 +- 5 ). The cortical grey matter TDC clearly depicts both fast and slowly relaxing components and has not reached baseline values in the late echo images. The results of fitting these three TDCs with monoexponential and biexponential functions before and after baseline subtraction are presented in Table 2.
72 MULKERN ET AL.
FIG. 3. Sequentially T2-weighted images of a rabbit head obtained at 1.9 T with a 64-echo hard-pulse sequence ( 10-ms echo spacing).
DISCUSSION
The nonexponential nature of TDCs from various in vitro tissue samples has been utilized for the analysis of tissue water compartmentation ( 1, 4, 12, 13) . There have been attempts to correlate the multiexponential character with the distribution of water between extra- and intracellular spaces ( I , 4) . In vitro TDC sampling has also been used for the characterization of abnormal water compartmentation in breast tissue (14, 19) , liver (16, 20), white matter disease (17, 18) , and myocardial in- farct ( 13) .
McSweeney et al. ( 14) demonstrated that in vitro measurements of TDCs in breast tissue could be used to distinguish benign lesions from both invasive and noninvasive carcinomas. The separation was accomplished through biexponential decompositions which yielded short and long relaxation times on the order of 30-50 ms and 90-200 ms, respectively. Bradamante et af. ( 1 9 ) have more recently confirmed and extended the in vitro breast cancer studies with equally impressive differentiation between tissue types, again with biexponential TDC decompositions. Bernardino et af. ( 16) correlated the faster of the two relaxation times found from biexponential fits of in vitro human
CPMG IMAGING SEQUENCES FOR TRANSVERSE RELAXATION STUDIES 73
FIG. 4. The 10th echo image of the rabbit head taken from the complete 64-image data set. Regions from which TDCs were extracted are indicated by circles.
liver TDCs with the percentage of cancer cellularity within the tissue specimens. In yet another recent study (18), in vitro TDCs of excised rat brains in which an inflam- matory form of experimental allergic encephalomyelitis ( EAE) and demyelinating
1900
1 7 0 0 ~ o TDC's of in vivo rabbit tissue
0 Facial Muscle o Brain Matter A Facial Fat
0 100 200 300 400 500 600 700 msec
FIG. 5. Plots of signal intensity vs echo time for the three regions depicted in Fig. 4. Included are the standard deviations of the signal intensities when they are larger than the plot symbol.
74 MULKERN ET AL.
TABLE 1
In vivo Rabbit Tissue TDC Fitting Parameters
~ ~~
Muscle 98.92 98.72
Mono 100.00
Brain 95.94 96.00
Mono 100.00
Fat 59.04 57.32
Mono 100.00
40.40 1471.0 39.37 199.2 42.22
92.85 719.4 92.42 515.5
115.74
55.04 298.5 52.7 I 275.5
199.20
0 145 -10 141 -10 330
0 56 -10 5 5 -10 886
0 I52 -10 148 -10 5000
Note. Biexponential- and monoexponential-fitting parameters as obtained with the maximum likelihood method are applied to the TDCs shown in Fig. 5. The fits have been performed both before and after addition of the indicated baseline value obtained from noise measurements.
EAE had been induced ( 3 3 ) , were recorded. Biexponential TDC decomposition was used to help differentiate between the two pathologies.
These in vitro studies suggest that increasing the number of fitting parameters as- sociated with TDC fitting functions, as occurs when normalized biexponential fits are used instead of monoexponential fits, improves the ability to differentiate tissue types and distinguish various pathologic processes.
Based on the promising in vitro results, there have been several attempts to obtain TDCs directly from clinical images. Detailed sampling of in vivo TDCs from image data sets was demonstrated at low fields (0.15 T ) by Gersonde et al. who used back- projection methods with hard pulse CPMG sequences (34 , 35) to improve tissue characterization of various brain pathologies. Though echo spacings were comparable to those presented here, the CPMG trains consisted of fewer echoes (less than 50). Backprojection techniques, rather than the standard 2D-FT methods generally em- ployed at high field, appear to have limited widespread clinical application.
Kamman et al. (36) used a soft-pulse CPMG imaging sequence with 2D-FT re- construction techniques at midfield (0.5 T ) to generate eight sequentially T2-weighted images with echo spacings of 30 ms. Despite the small number of echoes, this method was useful for separating fat and water contributions using biexponential TDC de- compositions. More recently, high-field ( 1.5 T) CPMG imaging sequences using 30 echoes spaced 22 ms apart were used to differentiate vital tumor tissue from CSF in a manner comparable to contrast enhanced MRI (37). In addition, a 32-echo, 30-ms high-field CPMG imaging sequence was used to demonstrate that TDCs of multiple sclerosis (MS) lesions are often biexponential in nature (38) , suggesting that white matter TDC analysis may prove to be a useful clinical tool for following the evolution of demyelinating processes.
CPMG IMAGING SEQUENCES FOR TRANSVERSE RELAXATION STUDIES 75
FIG. 6. Coronal brain image of a healthy volunteer. This is the eighth echo image obtained from the 128- echo soft-pulse sequence as implemented on the 1.5-T system. Boxes depict typical regions sampled for TDC analysis. Arrow and arrowhead depict regions of white and grey matter from which the TDCs in Fig. 7 were extracted.
We have now demonstrated high-field CPMG imaging sequences which use con- ventional 2D-FT techniques. We have used substantially more echoes than previous workers. In addition, our echo spacings are smaller, by a factor of two or more, than those previously reported at 1.5 T. We have shown that both hard- and soft-pulse sequences are capable of producing image-calculated T2 values that agree well with spectroscopic T2 measurements. The use of additional phase cycling, the rewinding
76 MULKERN ET AL.
1000 0 Grey Matter 0 White Matter A NiCI2 Phantom
.- b
- - 100
rn c 0 K
0 K rn m
+
.-
10 0 500 1000
Echo Time (ms)
FIG. 7. Typical grey and white matter TDCs, plotted on semi-log scale, as extracted from 15 X 15 X 10- mm3 voxels from the 128-echo image data set of the coronal study presented in Fig. 6. Also included is a TDC extracted from a NiCI2 phantom using the same pulse sequence on the 1.5-T system.
of the phase encode, restriction to a single slice, and the collection of a large number of echoes, appear to have overcome some of the difficulties associated with soft-pulse sequences for accurate T2 characterization (39-45) .
TDCs of in vivo rabbit tissue were extracted from a set of 64 images obtained with the hard-pulse CPMG sequence using an echo spacing of 10 ms. Biexponential TDC
TABLE 2
In vivo Human Tissue TDC and Phantom TDC Fitting Parameters
NiCI2 99.98 100.70 10,000 99.62 98.35 10,530
Mono 100.00 99.20
White Matter 97.26 83.68 5,263 98.93 83.30 1,423
Mono 100.00 85.93
Grey Matter 88.00 98.62 1,724 89.04 91.67 1,314
Mono 100.00 437.70
0 188 -25 258 -25 317
0 266 -25 258 -25 483
0 352 -25 359 -25 2 1,094
Note. Biexponential- and monoexponential-fitting parameters as found with the max- imum IikeIihood method are applied to the TDCs in Fig. 7.
CPMG IMAGING SEQUENCES FOR TRANSVERSE RELAXATION STUDIES 77
decomposition of the muscle TDC reveals that, with or without baseline subtraction, over 98% of the signal decays with a T2a which is in excellent agreement with well- known literature values of 40 ms (6, 46). In addition, T2b, the calculated slowly relaxing T2 component, is observed to be very sensitive to small positive baseline offsets caused by the use of magnitude-calculated images containing only positive noise values. It is evident from the muscle data in Table 1 that the baseline offsets can interfere with accurate measurements of long relaxation times from minor TDC com- ponents, even when these offsets are less than 1% of the initial signal intensities. It is not unrealistic, however, to anticipate biexponential TDC behavior in muscle. In vitro TDC studies of mouse and rabbit muscle (6, 46) have revealed a slowly relaxing component with a T2b similar to that found in our baseline corrected analysis. The percentage of the slowly decaying component ( 1.3%) found in these in vivo studies, however, is smaller than the 5 to 15% reported in the previous in vitro TDC analyses.
The biexponential TDC analyses of the rabbit forebrain reveal a larger slowly de- caying component (4%) than that found in muscle. The calculated TZb value of this component is also seen to be sensitive to the subtraction of a baseline value (Table 1 ), though much less so than that in muscle. In addition, the sum of squared residuals 6 , is nearly 16 times smaller for the biexponential decompositions than that found for the monoexponential decomposition, lending more confidence in the biexponential fit. The 4% slowly relaxing component found in the TDC of the rabbit forebrain is most probably due to interstitial CSF and/or extracellular fluid. However, since water exchange between different compartments influences the observed or “apparent” frac- tions and relaxation times of biexponential TDCs (6, 47, 48), the physiologic correlates of these observed components remain to be clarified.
The TDC from fatty tissue clearly demonstrates biexponential behavior (Table 1 ) in that attempts to fit the data to a monoexponential function (with or without baseline subtraction) lead to much larger values o f t than for the biexponential fits. The result is in agreement with the midfield studies performed by Kamman et a/. (36) who were able to demonstrate biexponential TDC behavior in fat-water mixtures using only 8- echo CPMG imaging sequences.
Table 2 presents results performed with the 128-echo soft-pulse sequence at 1.5 T and demonstrates the applicability of the methods to human brain studies. In addition, the truly monoexponential nature of a TDC from a NiC12-doped saline phantom is clearly depicted in that biexponential decompositions, with or without baseline sub- traction, yielded a second component of less than 1 % with unphysical TZb values greater than 10,000 ms. A biexponential fit to the white matter TDC prior to baseline correction yielded a small (2.7%) slowly decaying component, also with an unrealisti- cally long T2b of 5263 ms. After baseline subtraction, however, this small component was found to have a T2, of 1423 ms. This value is in more reasonable agreement with that which may be expected for interstitial CSF. Given these results, however, and the fact that a monoexponential fit to the TDC does not dramatically increase 6 , it is clear that for normal white matter, as in muscle, the departure of TDC behavior from monoexponentiality is small. In contrast, biexponential decomposition of the cortical grey matter TDC is mandated by the large disparity between initial and final slopes observed in the semi-log TDC plot (Fig. 7) and the huge value of t found when this curve is fit to a monoexponential function (Table 2). The reasonably large percentage
78 MULKERN ET AL.
of the slowly relaxing TDC component ( 1 1 % ) has a baseline-corrected TZb value of 1235 ms. As in the case of the white matter, this is on the order of that expected for interstitial CSF within the sampled voxel. In this regard, we note that CSF TDCs extracted from ROIs within clearly defined ventricular spaces have been found to be monoexponential with T2 values more on the order of 2000 ms (data not shown).
The shorter “CSF-like” TZb values found in the grey and white matter may well be a consequence of water exchange between interstitial and intracellular spaces within the tissue. The simplest model for incorporating such effects into TDC analyses is the two-site exchange model ( 4 7 ) . We have recently demonstrated that, within the frame- work of this model, the manipulation of biexponential TDC components with para- magnetic agents can be used to resolve model parameters, including direct estimates of exchangeable water fractions, compartmental exchange rates, and intrinsic com- partmental relaxation rates ( 4 8 ) . Combining CPMG imaging sequences with para- magnetic manipulation of biexponential tissue TDCs may help to test such exchange models in vivo.
Current efforts in our laboratory include the application of the 128-echo soft-pulse imaging sequence for characterizing multiple sclerosis TDCs in patients. In addition, methods are being developed to perform rapid pixel-by-pixel biexponential TDC de- compositions for displaying images whose contrast directly reflects the biexponential- fitting parameters.
CONCLUSIONS
We have produced 64- and 128-echo image data sets at high field that are capable of generating in vivo transverse magnetization decay curves with a time resolution and coverage sufficient for biexponential TDC analysis. The ability to address currently unresolved questions pertaining to the origin of multiexponential behavior of tissue relaxation in vivo represents an important potential of the demonstrated methods. The application of the sequences in clinical settings may provide a powerful method for improving tissue characterization and diagnostic specificity of MRI.
REFERENCES
1. A. FRANCOIS, L. VAN GERVEN, G. ATASSI, H. EISENDRATH, M. GIELEN, AND R. WILLEM, Mugn.
2. W. T. SOBOL, L. G. CAMERON, W. R. INCH, AND M. M. PINTAR, Biophys. J . 50, 181 ( 1986). 3. W. T. SOBOL AND M. M. PINTAR, Mugn. Reson. Med. 4, 537 ( 1987). 4. Y. MAUSS, D. GRUCKER, D. FORNASIERO, AND J. CHAMBRON, Magn. Reson. Med. 2, 187 ( 1985). 5. T. SANDOR, A. R. BLEIER, P. RUENZEL, D. F. ADAMS, AND F. A. JOLESZ, Mugn. Resun. Imaging 6,
6. B. M. FUNC AND P. S. PUON, Biophys. J. 33,27 ( 1981). 7. H. PEEMOELLER AND M. M. PINTAR, Biophys. J. 28, 339 ( 1979). 8. E. LE RUMEUR, J. DE CERTAINES, P. TOULOUSE, AND P. ROCHCONGAR, Mugn. Re,c.on. Imaging 5,
9. P. S. BELTON, R. R. JACKSON, AND K. B. PACKER, Biochim. Biophys. Acta. 286, 16 ( 1972).
Reson. Med. 7,449 ( 1988).
27 (1988).
267 (1987).
10. C. F. HAZELWOOD, D. C. CHANG, B. L. NICHOLS, AND D. E. WOESSNER, Biophys. J. 14,583 ( 1974). 11. G. D. FULLERTON, I. L. CAMERON, K. HUNTER, AND H. J. FULLERTON, Radiology 155,727 ( 1985). 12. F. A. JOLESZ, A. R. BLEIER, P. W. RUENZEL, T. SANDOR, AND D. F. ADAMS “Soc. Magn. Reson. Med.
Mtg., London, (Abstract),” Vol. 164, 1985.

CPMG IMAGING SEQUENCES FOR TRANSVERSE RELAXATION STUDIES 79
13. K. HUTTL, R. FRIED, L. BOXT, A. R. BLEIER, N. HOLLENBERG, D. F. ADAMS, AND F. A. JOLESZ,
14. M. B. MCSWEENEY, W. C. SMALL, V. CERNY, W. SEWELL, R. W. POWELL, AND J. H. GOLDSTEIN,
15. H. PEEMOELLER, R. K. SHENOY, M. M. PINTAR, D. W. KYDON, AND W. R. INCH, Biophys. J. 38,271
16. M. E. BERNARDINO, W. SMALL, J. GOLDSTEIN, C. W. SEWELL, P. J. SONES, K. GEDGAUDAS-MCCLEES,
17. w. A. STEWART, S. E. BARWICK, K. WHITALL, L. D. HALL, AND D. W. PAN “SOC. Magn. Reson.
18. D. ZAMAROCZY, F. A. JOLESZ, H. J. SCHLUESENER, AND T. SANDOR, Invest. Radiol. (Abstract) 23,
19. S. BRADAMANTE, E. BARCHIESI, S. PILOTTI, AND G. BORASI, Magn. Reson. Med. 8,440 (1988). 20. R. BARTHWAL, M. HOHN-BERLAGE, AND K. GERSONDE, Magn. Reson. Med. 3,863 ( 1986). 21. F. ROMEO AND D. I. HoULT, Magn. Reson. Med. 1,44 (1984). 22. P. R. LUYTEN, A. J. H. MARIEN, B. SIJTSMA, AND J. A. DEN HOLLANDER, J. Magn. Reson. 67, 148
23. W. P. AUE, T. A. CROSS, AND J. SEELIG, J. Magn. Reson. 56, 350 ( 1984). 24. D. J. JENSEN, P. A. NARAYANA, A N D J. L. DELAYRE, Med. Phys. 14,38 (1986). 25. H. CARR AND E. PURCELL, Phys. Rev. 94,630 (1954). 26. M. A. HEMMINGA, P. A. JAGER, AND A. SONNEVELD, J. Magn. Reson. 27, 359 (1977). 27. W. H. PERMAN, M. A. BERNSTEIN, AND J. C. SANDSTROM, Magn. Reson. Med. 9, 16 (1989). 28. J. HENNIG, A. NAUERTH, AND H. FRIEDBURG, Magn. Reson. Med. 3, 823 ( 1986). 29. J. HENNIG AND H. FRIEDBURG, Magn. Reson. Imaging 6, 391 ( 1988). 30. M. D. MITCHELL, H. L. KUNDEL, L. AXEL, AND P. M. JOSEPH, Magn. Reson. Imaging 4,263 ( 1986). 31. K. A. WFT, P. P. FATOUROS, G. D. CLARKE, AND P. R. S. KISHORE, Magn. Reson. Med. 5, 555
32. F. HOWE, Magn. Reson. Imaging 6, 263 ( 1988). 33. H. J. SCHLUESENER, R. A. SOBEL, C. LININGTON, AND H. L. WEINER, J. Immunol. 139,4016 (1987). 34. K. GERSONDE, L. FELSBERG, T. TOLXDORFF, D. RATZEL, AND B. STROBEL, Magn. Reson. Med. 1,
35. K. GERSONDE, T. TOLXDORFF, AND L. FELSBERG, Magn. Reson. Med. 2,390 ( 1985). 36. R. L. KAMMAN, C. J. G. BAKKER, P. VAN DUK, G. P. STOMP, A. P. HEINER, AND H. J. C. BERENDSEN,
37. L. R. SCHAD, G. BRIX, W. SEMMLER, F. GUCKEL, AND W. LORENZ, Magn. Reson. Imaging 7, 357
38. H. B. W. LARSSON, J. FREDERIKSEN, J. PETERSEN, A. NORDENBO, I. ZEEBERG, 0. HENRIKSEN, AND
39. S. MAJUMDAR AND J. C. GORE, Magn. Reson. Med. 4, 120 ( 1987). 40. A. P. CRAWLEY AND R. M. HENKELMAN, Magn. Reson. Med. 4,34 (1987). 41. S. T. S. WONG AND M. S. Roos, Magn. Reson. Med. 5, 358 (1987). 42. B. CONDON, J. PATTERSON, D. WYPER, D. M. HADLEY, A. JENKINS, A. LAWRENCE, AND J. ROWAN,
Invesf. Radiol. (Abstract) 21, 536 (1986).
Radiology 153,741 (1984).
(1982).
J. T. GALAMBOS, J. WENGER, AND W. J. CASARELLA, Amer. J. Roentgenol. 141, 1203 (1983).
Med. Mtg., San Francisco, (Works in Progress Abstract),” 1988.
517 (1988).
(1986).
(1987).
463 (1984).
Magn. Reson. Imaging 5,38 I ( 1987).
(1989).
J. OLESEN, Mugn. Reson. Med. 11, 337 (1989).
Magn. Reson. Imaging 4,449 ( 1986). 43. M. O’DONNEL, J. C. GORE, AND W. J. ADAMS, Med. Phys, 13, 182 ( 1986). 44. J. C. GORE, C. F. POPE, AND H. D. SOSTMAN, Magn. Reson. Imaging 4,25 1 ( 1986). 45. D. G. MITCHELL, S. VINITSKI, D. L. BURK, D. LEVY, AND M. D. RIFKIN, Magn. Reson. Imaging 6,
46. I. K. ADZAMLI, A. R. BLEIER, R. V. MULKERN, T. SANDOR, AND F. A. JOLESZ, Mugn. Reson. Med.
47. J. R. ZIMMERMAN AND W. E. BRITTIN, J. Phys. Chem. 61, 1328 (1957). 48. R. V. MULKERN, A. R. BLEIER, I. K. ADZAMLI, R. G. S. SPENCER, T. SANDOR, AND F. A. JOLESZ,
535 (1988).
11, 172 (1989).
Biophys. J . 55,221 (1989).
Related Documents