Palladium..….………......……...p.27 Rhodium.…….….......……….…p.32 Precious Metals Price Table......p.33 Equities and Metrics Table..p.34-35 Next Scheduled Issue: 10 January 2012 Copyright CPM Group 2012. Not for reproduction or retransmission without written consent of CPM Group. Precious Metals Advisory is published monthly by CPM Group and is distributed via e-mail. The views expressed within are solely those of CPM Group. Such information has not been verified, nor does CPM make any representation as to its accuracy or completeness. Any statements non-factual in nature constitute only current opinions, which are subject to change. While every effort has been made to ensure that the accuracy of the material contained in the reports is correct, CPM Group cannot be held liable for errors or omissions. CPM Group is not soliciting any action based on it. Information contained here should not be relied on as specific investment or market timing advice. At times the principals and associates of CPM Group may have long or short positions in some of the markets mentioned here. Market Data (Data as of 6 December; changes from 8 November) Open Interest 1 oz ∆ oz Nymex/Comex Inventories oz ∆ oz Nymex/Comex Nearby Active Prices % ∆ $∆ Precious Metals Advisory 6 December 2012 Vol. XXV, No. 12 Report Contents Gold 1,701.80 ↓ -1.4% -24.20 Silver 33.11 ↑ 2.7% 0.87 Platinum 1,600.70 ↑ 3.8% 58.20 Palladium 697.05 ↑ 13.5% 82.70 Rhodium* 1,100.00 ↓ -4.3% -50.00 Gold Eligible 8,800,826 ↑ 119,225 8,681,601 Registered 2,602,693 ↑ 15,114 2,587,579 Total 11,403,519 ↑ 134,339 11,269,180 Silver Eligible 105,456,690 ↓ -1,141,470 106,598,160 Registered 39,836,930 ↑ 3,428,100 36,408,830 Total 145,293,620 ↑ 2,286,630 143,006,990 Platinum - Total 207,850 ↑ 9,350 198,500 Palladium - Total 531,100 ↓ -2,000 533,100 DJIA 13,074.0 ↑ 2.1% 263 FT World Stock Index 383.6 ↑ 3.0% 11.07 FT Gold Mines Index 2,777.8 ↓ -11.2% -351.79 CRB Index 297.9 ↑ 2.1% 6.07 T -Bills 0.09% ↑ 5.6% 0.01% ICE Dollar Index 80.24 ↓ -0.7% -0.55 $ / Euro 1.30 ↑ 1.8% $0.023 *Rhodium price is BASF daily settlement price. There is a tremendous amount of uncertainty in the mar- ket regarding the economy and the future for precious metals prices. As a result precious metals investors may wait on the sidelines in December. Many price-moving factors appear already priced into the market, such as de- mand expectations for the PGMs and silver, a continua- tion of the recession in Western Europe, China’s reduced economic growth trajectory, and sovereign debt handling in Europe. The approaching U.S. fiscal cliff may have contributed to precious metals price increases in Novem- ber and may continue to influence prices through the end of the year. Precious metals prices typically move higher in the first few months of the year due to seasonal factors. Overall, however, prices are expected to average modestly lower in 2013 relative to 2012 levels. Investment demand vol- umes for gold and silver are expected to come off further next year, which will be the primary driver behind lower gold and silver prices. Investors are expected to continue to welcome opportunities to buy at price dips. That ten- dency to view dips in prices as buying opportunities could dissipate as the year progresses if sell-offs are not followed by significant rallies, as investors would begin to re-evaluate their longer term bullish sentiments in light of weaker prices. The platinum group metals may trade modestly higher on an annual average basis, with weak fabrication demand limiting the upside and constrained supply keeping prices well supported. The primary concern at present in the precious metals markets is when to expect demand growth to strengthen. In 2010 and 2011, assessing demand was fairly easy – these were recovery years so demand was rising rapidly for cars and electronics containing PGMs and silver and for gold jewelry in the booming Chinese and Indian mar- kets. In 2012, demand expectations for all the precious metals came off. India’s economy slowed and its govern- ment raised import taxes on gold in order to reduce its current account deficit, which weighed on gold jewelry sales. Europe’s auto market contracted, weighing on ex- pectations for PGM demand growth. China’s economic growth slowed, adding further pressure to demand expec- tations. The demand picture in 2012 is expected to spill into 2013, will no material changes to prospects for growth. Precious Metals Prices May Lack Direction in 2013 Prices in 2013…...…......……….....p.1 Price Targets...………....…………p.3 Macroeconomic Indicators………p.5 Gold……...……….……...….…….p.8 Silver………………...…………..p.16 Platinum………………………...p.22 Gold February 27,853,400 ↑ 21,074,800 6,778,600 Total 42,851,800 ↓ -2,187,500 45,039,300 Silver March 426,995,000 ↑ 318,450,000 108,545,000 Total 704,615,000 ↑ 15,535,000 689,080,000 Platinum January 2,724,400 ↓ -79,200 2,803,600 April 344,950 ↑ 154,100 190,850 Total 3,091,700 ↑ 86,450 3,005,250 Palladium March 2,362,200 ↑ 2,074,900 287,300 Total 2,377,100 ↑ 200,700 2,176,400 1 Data as of 5 December; changes from 7 November. Indicators %∆ $∆

Cpm precious metals advisory 2012 12-06
Sep 01, 2014
In depth Analysis on precious metals
Welcome message from author
This document is posted to help you gain knowledge. Please leave a comment to let me know what you think about it! Share it to your friends and learn new things together.
Transcript
Palladium..….………......……...p.27
Rhodium.…….….......……….…p.32
Precious Metals Price Table......p.33
Equities and Metrics Table..p.34-35
Next Scheduled Issue: 10 January 2012
Copyright CPM Group 2012. Not for reproduction or retransmission without written consent of CPM Group. Precious Metals Advisory is published monthly by CPM Group and is distributed via e-mail.
The views expressed within are solely those of CPM Group. Such information has not been verified, nor does CPM make any representation as to its accuracy or completeness. Any statements non-factual
in nature constitute only current opinions, which are subject to change. While every effort has been made to ensure that the accuracy of the material contained in the reports is correct, CPM Group cannot
be held liable for errors or omissions. CPM Group is not soliciting any action based on it. Information contained here should not be relied on as specific investment or market timing advice. At times the
principals and associates of CPM Group may have long or short positions in some of the markets mentioned here.
Market Data (Data as of 6 December; changes from 8 November)
Open Interest1 oz ∆ oz
Nymex/Comex Inventories oz ∆ oz
Nymex/Comex Nearby Active Prices % ∆ $∆
Precious Metals Advisory 6 December 2012 Vol. XXV, No. 12
Report Contents
Gold 1,701.80 ↓ -1.4% -24.20
Silver 33.11 ↑ 2.7% 0.87
Platinum 1,600.70 ↑ 3.8% 58.20
Palladium 697.05 ↑ 13.5% 82.70
Rhodium* 1,100.00 ↓ -4.3% -50.00
Gold
Eligible 8,800,826 ↑ 119,225 8,681,601
Registered 2,602,693 ↑ 15,114 2,587,579
Total 11,403,519 ↑ 134,339 11,269,180
Silver
Eligible 105,456,690 ↓ -1,141,470 106,598,160
Registered 39,836,930 ↑ 3,428,100 36,408,830
Total 145,293,620 ↑ 2,286,630 143,006,990
Platinum - Total 207,850 ↑ 9,350 198,500
Palladium - Total 531,100 ↓ -2,000 533,100
DJIA 13,074.0 ↑ 2.1% 263
FT World Stock Index 383.6 ↑ 3.0% 11.07
FT Gold Mines Index 2,777.8 ↓ -11.2% -351.79
CRB Index 297.9 ↑ 2.1% 6.07
T-Bills 0.09% ↑ 5.6% 0.01%
ICE Dollar Index 80.24 ↓ -0.7% -0.55
$ / Euro 1.30 ↑ 1.8% $0.023
*Rhodium price is BASF daily settlement price.
There is a tremendous amount of uncertainty in the mar-
ket regarding the economy and the future for precious
metals prices. As a result precious metals investors may
wait on the sidelines in December. Many price-moving
factors appear already priced into the market, such as de-
mand expectations for the PGMs and silver, a continua-
tion of the recession in Western Europe, China’s reduced
economic growth trajectory, and sovereign debt handling
in Europe. The approaching U.S. fiscal cliff may have
contributed to precious metals price increases in Novem-
ber and may continue to influence prices through the end
of the year.
Precious metals prices typically move higher in the first
few months of the year due to seasonal factors. Overall,
however, prices are expected to average modestly lower
in 2013 relative to 2012 levels. Investment demand vol-
umes for gold and silver are expected to come off further
next year, which will be the primary driver behind lower
gold and silver prices. Investors are expected to continue
to welcome opportunities to buy at price dips. That ten-
dency to view dips in prices as buying opportunities
could dissipate as the year progresses if sell-offs are not
followed by significant rallies, as investors would begin
to re-evaluate their longer term bullish sentiments in light
of weaker prices. The platinum group metals may trade
modestly higher on an annual average basis, with weak
fabrication demand limiting the upside and constrained
supply keeping prices well supported.
The primary concern at present in the precious metals
markets is when to expect demand growth to strengthen.
In 2010 and 2011, assessing demand was fairly easy –
these were recovery years so demand was rising rapidly
for cars and electronics containing PGMs and silver and
for gold jewelry in the booming Chinese and Indian mar-
kets. In 2012, demand expectations for all the precious
metals came off. India’s economy slowed and its govern-
ment raised import taxes on gold in order to reduce its
current account deficit, which weighed on gold jewelry
sales. Europe’s auto market contracted, weighing on ex-
pectations for PGM demand growth. China’s economic
growth slowed, adding further pressure to demand expec-
tations. The demand picture in 2012 is expected to spill
into 2013, will no material changes to prospects for
growth.
Precious Metals Prices May Lack Direction in 2013
Prices in 2013…...…......……….....p.1
Price Targets...………....…………p.3
Macroeconomic Indicators………p.5
Gold……...……….……...….…….p.8
Silver………………...…………..p.16
Platinum………………………...p.22
Gold
February 27,853,400 ↑ 21,074,800 6,778,600
Total 42,851,800 ↓ -2,187,500 45,039,300
Silver
March 426,995,000 ↑ 318,450,000 108,545,000
Total 704,615,000 ↑ 15,535,000 689,080,000
Platinum
January 2,724,400 ↓ -79,200 2,803,600
April 344,950 ↑ 154,100 190,850
Total 3,091,700 ↑ 86,450 3,005,250
Palladium
March 2,362,200 ↑ 2,074,900 287,300
Total 2,377,100 ↑ 200,700 2,176,400
1Data as of 5 December; changes from 7 November.
Indicators %∆ $∆
6 December 2012 Page 2 Precious Metals Advisory
Commodities Research and Consulting,
Asset Management, and Investment Banking
CPM Group, founded in 1986, is an authoritative commodities research and consulting company. It is independent of all
producers, processors, financial institutions, and other companies having commercial positions in commodities. CPM
Group has extensive experience in commodities research, trading, and finance, equipping the company to provide finan-
cial advice and consulting grounded in hands-on experience.
email: [email protected]
Telephone 212-785-8320
www.cpmgroup.com
The lack of demand upside in 2013, especially through
the first three quarters, is expected to weigh on precious
metals prices. If the European and U.S. economies begin
to pick up later in the year, industrial demand for pre-
cious metals could help to improve price appreciation
prospects.
Precious Metals Prices May Lack Direction in 2013 (cont.)
6 December 2012 Page 3 Precious Metals Advisory
Key
Top of Range
Forecast Average
Bottom of Range
1-Month
Projection
2nd & 3rd Month
Projections
Average
Price Targets Nearby active Comex/Nymex prices. Rhodium prices
are daily BASF prices. All prices are US$/ounce.
SILVER
GOLD
PLATINUM
Continued
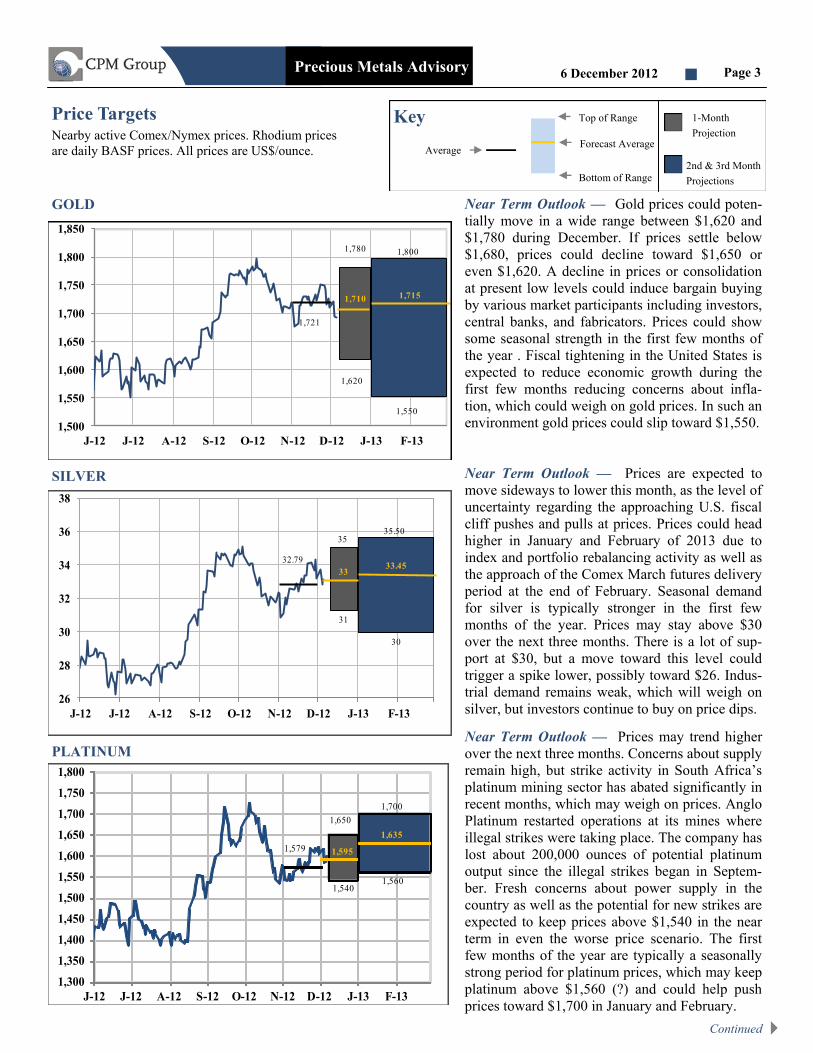
Near Term Outlook — Prices may trend higher
over the next three months. Concerns about supply
remain high, but strike activity in South Africa’s
platinum mining sector has abated significantly in
recent months, which may weigh on prices. Anglo
Platinum restarted operations at its mines where
illegal strikes were taking place. The company has
lost about 200,000 ounces of potential platinum
output since the illegal strikes began in Septem-
ber. Fresh concerns about power supply in the
country as well as the potential for new strikes are
expected to keep prices above $1,540 in the near
term in even the worse price scenario. The first
few months of the year are typically a seasonally
strong period for platinum prices, which may keep
platinum above $1,560 (?) and could help push
prices toward $1,700 in January and February.
26
28
30
32
34
36
38
J-12 J-12 A-12 S-12 O-12 N-12 D-12 J-13 F-13
32.79
33
30
35
33.45
31
35.50
1,300
1,350
1,400
1,450
1,500
1,550
1,600
1,650
1,700
1,750
1,800
J-12 J-12 A-12 S-12 O-12 N-12 D-12 J-13 F-13
1,560
1,650
1,540
1,700
1,635
1,5951,579
Near Term Outlook — Prices are expected to
move sideways to lower this month, as the level of
uncertainty regarding the approaching U.S. fiscal
cliff pushes and pulls at prices. Prices could head
higher in January and February of 2013 due to
index and portfolio rebalancing activity as well as
the approach of the Comex March futures delivery
period at the end of February. Seasonal demand
for silver is typically stronger in the first few
months of the year. Prices may stay above $30
over the next three months. There is a lot of sup-
port at $30, but a move toward this level could
trigger a spike lower, possibly toward $26. Indus-
trial demand remains weak, which will weigh on
silver, but investors continue to buy on price dips.
Near Term Outlook — Gold prices could poten-
tially move in a wide range between $1,620 and
$1,780 during December. If prices settle below
$1,680, prices could decline toward $1,650 or
even $1,620. A decline in prices or consolidation
at present low levels could induce bargain buying
by various market participants including investors,
central banks, and fabricators. Prices could show
some seasonal strength in the first few months of
the year . Fiscal tightening in the United States is
expected to reduce economic growth during the
first few months reducing concerns about infla-
tion, which could weigh on gold prices. In such an
environment gold prices could slip toward $1,550. 1,500
1,550
1,600
1,650
1,700
1,750
1,800
1,850
J-12 J-12 A-12 S-12 O-12 N-12 D-12 J-13 F-13
1,780
1,620
1,550
1,800
1,721
1,710 1,715

6 December 2012 Page 4 Precious Metals Advisory
Key
Top of Range
Forecast Average
Bottom of Range
1-Month
Projection
2nd & 3rd Month
Projections
Average
Price Targets Nearby active Comex/Nymex prices. Rhodium prices
are daily BASF prices. All prices are US$/ounce.
RHODIUM
PALLADIUM Near Term Outlook — Palladium prices could
potentially decline as a result of profit taking and
the possibility of weaker real demand for the
metal in the near to medium term. Prices have
risen sharply in recent weeks, which could result
in investors booking profits in their positions, es-
pecially toward the end of December. There also
is the possibility that fabrication demand for the
metal will soften during the first half of 2013 due
to fiscal tightening in the United States. This
could potentially push prices toward $580. Prices
should find support on the downside because of
the constant possibility of supply disruptions
from South Africa.
Near Term Outlook — Rhodium prices are ex-
pected to remain weak over the next three months.
Rhodium prices are expected to average lower in
December, at $1,105, from November, when
prices averaged $1,142, as some of the supply
constraints supporting prices have eased. Prices
could decline toward $1,000 over the next few
months. Some seasonal price strength could help
buoy prices in January and February. Demand
prospects remain bleak, however, which has been
weighing heavily on rhodium prices since 2011
and may continue to do so. There is scope for fur-
ther declines in rhodium prices, but investors may
view prices below $1,000 or even $1,100 as a tre-
mendous buying opportunity.
450
500
550
600
650
700
750
800
J-12 J-12 A-12 S-12 O-12 N-12 D-12 J-13 F-13
750
610
725
638
580
642650
900
950
1,000
1,050
1,100
1,150
1,200
1,250
1,300
1,350
1,400
J-12 J-12 A-12 S-12 O-12 N-12 D-12 J-13 F-13 M-13
1,150
1,050
1,200
1,000
1,1051,130
1,142

6 December 2012 Page 5 Precious Metals Advisory
Macroeconomic Indicators
2%
3%
4%
5%
6%
7%
8%
9%
10%
11%
12%
05 06 07 08 09 10 11 12 13
Euro zone United States
United Kingdom Japan
Unemployment Rates in Developed Economies
PercentMonthly Data, through October 2012
-40%
-30%
-20%
-10%
0%
10%
20%
30%
40%
95 96 97 98 99 00 01 02 03 04 05 06 07 08 09 10 11 12
Euro zone
United States
United Kingdom
Japan
Industrial Production in Developed Economies
Monthly through October 2012, Year-over-Year Percentage Change
-20%
-10%
0%
10%
20%
30%
95 96 97 98 99 00 01 02 03 04 05 06 07 08 09 10 11 12
Brazil China India
Industrial Production in Developing Economies
Monthly through August 2012, Year-over-Year Percentage Change
-4%
-2%
0%
2%
4%
6%
8%
05 06 07 08 09 10 11 12
Euro zone United Kingdom
Japan United States
Inflation - Developed Countries
Monthly CPI, Year-over-Year Percentage Change, through October 2012
-4%
-2%
0%
2%
4%
6%
8%
10%
12%
14%
16%
18%
20%
05 06 07 08 09 10 11 12
Brazil India
China
Inflation -Developing Countries
Monthly CPI, Year-over-Year Percentage Change, through October 2012
-10
-5
0
5
10
15
Jun-96 Nov-98 Apr-01 Sep-03 Feb-06 Jul-08 Dec-10
USA China
Japan Brazil
India EU
Real Gross Domestic Product
Quarterly Data, Quarter-over-Quarter Percentage Change
Percent
Note: China and India is Quarterly data, with percentage change on a year-over-year basis. Note: U.K. data is through September 2012.
Note: Euro Zone data is through September 2012. Note: Chinese. data is through July 2012.

6 December 2012 Page 6 Precious Metals Advisory
Macroeconomic Indicators (cont)
-3
-1
0
1
3
4
6
7
8
10
11
-10
-5
0
5
10
15
20
25
30
35
40
Nov-81 May-86 Nov-90 May-95 Nov-99 May-04 Nov-08
MZM Money Supply (LHS)
U.S. Inflation (CPI)
MZM Money Supply and U.S. Inflation
Percent Percent
Correlation: negative 0.11
Monthly Data, through September 2012
0.0
0.5
1.0
1.5
2.0
2.5
3.0
Jan-03 Jan-05 Jan-07 Jan-09 Jan-11
Percent
10-Year Nominal Treasury Yield minus 10-Year TIPS Yield
Daily Data, through 4 December 2012
-2.0
-1.0
0.0
1.0
2.0
3.0
4.0
5.0
6.0
J-82 J-85 J-88 J-91 J-94 J-97 J-00 J-03 J-06 J-09 J-12
10-Year Treasury minus Three-Month Treasury
Daily Data, through 4 December 2012
Percent
0.0
1.0
2.0
3.0
4.0
5.0
6.0
7.0
Jan-86 Jan-90 Jan-94 Jan-98 Jan-02 Jan-06 Jan-10
Corporate Baa-rate bond minus Ten-year Treasury
Daily Data, through 4 December 2012
Percent
0
10
20
30
40
50
60
70
80
90
Jan-04 Apr-05 Jul-06 Oct-07 Jan-09 Apr-10 Jul-11 Oct-12
CBOE Volatility Index: VIX
Percent
Daily Data, through 5 December 2012
-
200
400
600
800
1,000
1,200
1,400
1,600
1,800
2,000
60
70
80
90
100
110
120
130
140
150
Jan-73 Oct-78 Jul-84 Apr-90 Jan-96 Oct-01 Jul-07
Trade-Weighted Dollar (LHS) Gold PricesIndex $/Oz
Trade-Weighted Dollar and Gold Prices
Monthly Data, through November 2012

6 December 2012 Page 7 Precious Metals Advisory
U.S. Macroeconomic Indicators
0.0
2.0
4.0
6.0
8.0
10.0
12.0
14.0
16.0
O-49 F-57 J-64 O-71 F-79 J-86 O-93 F-01 J-08
Total U.S. Consumer Debt
Quarterly End of Period Data, through 1 July 2012
Trillion of Dollars
0.0
200.0
400.0
600.0
800.0
1000.0
1200.0
1400.0
J-93 J-95 J-97 J-99 J-01 J-03 J-05 J-07 J-09 J-11
Billions of Dollars
Total Construction Spending
Monthly Data, through October 2012
100
120
140
160
180
200
220
240
260
F-92 J-94 O-96 F-99 J-01 O-03 F-06 J-08 O-10
Manufacturers' New Orders: Durable Goods
Monthly Data, through October 2012
Billion of Dollars
-8.0
-6.0
-4.0
-2.0
0.0
2.0
4.0
6.0
8.0
10.0
J-60 J-66 J-72 J-78 J-84 J-90 J-96 J-02 J-08
Percent
Real Personal Income
Monthly Data, through October 2012
30
35
40
45
50
55
60
65
70
75
F-92 J-94 O-96 F-99 J-01 O-03 F-06 J-08 O-10
New Orders: Nondefense Capital Goods Excluding Aircrafts
Monthly Data, through October 2012
Billion of Dollars
0
500
1000
1500
2000
2500
3000
J-59 J-64 J-69 J-74 J-79 J-84 J-89 J-94 J-99 J-04 J-09
Housing Starts
Monthly Data, through October 2012
Thousands of Units
6 December 2012 Page 8 Precious Metals Advisory
Gold Quarterly Average Price Projections to Q3 2014
$ / Ounce
Gold Outlook
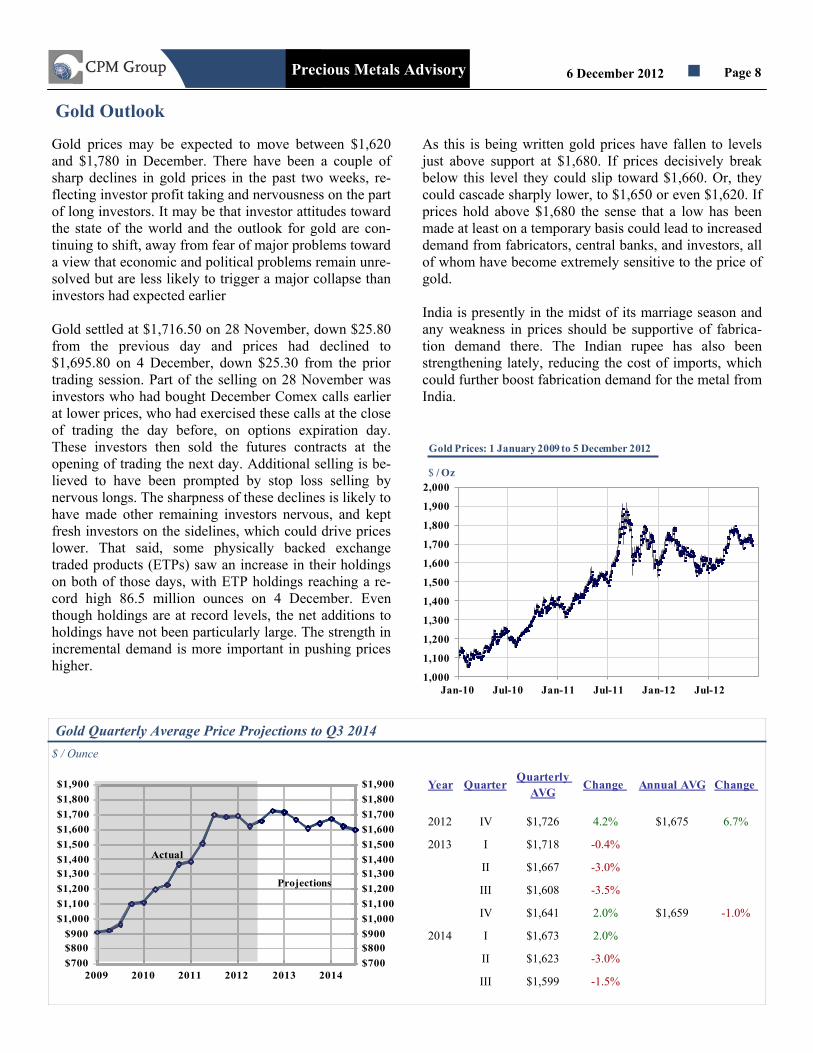
Gold prices may be expected to move between $1,620
and $1,780 in December. There have been a couple of
sharp declines in gold prices in the past two weeks, re-
flecting investor profit taking and nervousness on the part
of long investors. It may be that investor attitudes toward
the state of the world and the outlook for gold are con-
tinuing to shift, away from fear of major problems toward
a view that economic and political problems remain unre-
solved but are less likely to trigger a major collapse than
investors had expected earlier
Gold settled at $1,716.50 on 28 November, down $25.80
from the previous day and prices had declined to
$1,695.80 on 4 December, down $25.30 from the prior
trading session. Part of the selling on 28 November was
investors who had bought December Comex calls earlier
at lower prices, who had exercised these calls at the close
of trading the day before, on options expiration day.
These investors then sold the futures contracts at the
opening of trading the next day. Additional selling is be-
lieved to have been prompted by stop loss selling by
nervous longs. The sharpness of these declines is likely to
have made other remaining investors nervous, and kept
fresh investors on the sidelines, which could drive prices
lower. That said, some physically backed exchange
traded products (ETPs) saw an increase in their holdings
on both of those days, with ETP holdings reaching a re-
cord high 86.5 million ounces on 4 December. Even
though holdings are at record levels, the net additions to
holdings have not been particularly large. The strength in
incremental demand is more important in pushing prices
higher.
As this is being written gold prices have fallen to levels
just above support at $1,680. If prices decisively break
below this level they could slip toward $1,660. Or, they
could cascade sharply lower, to $1,650 or even $1,620. If
prices hold above $1,680 the sense that a low has been
made at least on a temporary basis could lead to increased
demand from fabricators, central banks, and investors, all
of whom have become extremely sensitive to the price of
gold.
India is presently in the midst of its marriage season and
any weakness in prices should be supportive of fabrica-
tion demand there. The Indian rupee has also been
strengthening lately, reducing the cost of imports, which
could further boost fabrication demand for the metal from
India.
$700
$800
$900
$1,000
$1,100
$1,200
$1,300
$1,400
$1,500
$1,600
$1,700
$1,800
$1,900
$700
$800
$900
$1,000
$1,100
$1,200
$1,300
$1,400
$1,500
$1,600
$1,700
$1,800
$1,900
2009 2010 2011 2012 2013 2014
Projections
Actual
Year QuarterQuarterly
AVGChange Annual AVG Change
2012 IV $1,726 4.2% $1,675 6.7%
2013 I $1,718 -0.4%
II $1,667 -3.0%
III $1,608 -3.5%
IV $1,641 2.0% $1,659 -1.0%
2014 I $1,673 2.0%
II $1,623 -3.0%
III $1,599 -1.5%
1,000
1,100
1,200
1,300
1,400
1,500
1,600
1,700
1,800
1,900
2,000
Jan-10 Jul-10 Jan-11 Jul-11 Jan-12 Jul-12
Gold Prices: 1 January 2009 to 5 December 2012
$ / Oz
6 December 2012 Page 9 Precious Metals Advisory
0%
10%
20%
30%
40%
50%
60%
70%
80%
90%
75 78 81 84 87 90 93 96 99 02 05 08 11
Monthly, Through November 2012
Gold Price Volatility
0
10
20
30
40
50
60
70
80
90
100
110
120
0
10
20
30
40
50
60
70
80
90
100
110
120
77 79 81 83 85 87 89 91 93 95 97 99 01 03 05 07 09 11e
Million Ounces
Jewelry, Developing Countries
Dental
Jewelry, Developed
Million Ounces
Annual Total Fabrication Demand
Electronics
Other
Demand from central banks also might be expected to
rise if gold prices soften. During the first 10 months of
2012, central banks had added 10.76 million ounces of
gold to their reported holdings, on a net basis. Some of
the strongest net additions by central banks were seen in
months when prices softened or were at relatively low
levels. Central banks added on a net basis 2.95 million
ounces of gold to their holdings in July, when the price of
gold was at the lower end of its trading range for the year.
This was the highest monthly net additions made by cen-
tral banks during 2012. Central banks were also seen add-
ing 2.3 million ounces of metal to holdings when prices
slipped lower in March 2012.
For a variety of reasons investors remain interested in
owning gold and should be expected to step in as buyers
when prices soften. There is a lot of uncertainty sur-
rounding the handling of the current U.S. fiscal deficit
situation, which if not addressed would trigger automatic
federal spending cuts and tax increases in January 2013
(the fiscal cliff). We expect that the U.S. government will
patch together a relatively superficial agreement at the
11th hour, with most of the proposed tax increases and
budget cuts in the years beyond 2014. However, there are
likely to be some increases in taxes and reductions in
government spending, so the question is how much weak-
ness should be expected in the first half of 2013, regard-
less of the outcome of the political discussions. More im-
portant for the matters at hand, the gold market, along
with broader financial markets and economic conditions
around the world, will be held hostage to a bathetic politi-
cal melodrama over the remainder of December.
In a scenario where the fiscal cliff is averted, market sen-
timent should improve driving gold prices, along with
other markets, higher at the beginning of 2013. Any com-
promise reached on the fiscal deficit issue, which would
be positive for market sentiment, would still hurt eco-
nomic growth, only less than if all of the fiscal tightening
were to occur. As a result of this the present loose mone-
tary policy is expected to remain in place, to offset eco-
nomic weakness arising from any fiscal tightening. This
might provide slight support to gold prices, but probably
would not drive prices significantly higher from current
levels.
In the less likely scenario, where no deal is reached on
how to address the U.S. fiscal situation gold prices should
be expected to decline alongside other assets as investors
move into cash. In such a scenario monetary accommoda-
tion is likely to be increased significantly to support eco-
nomic growth, which could be supportive of gold prices.
Prices
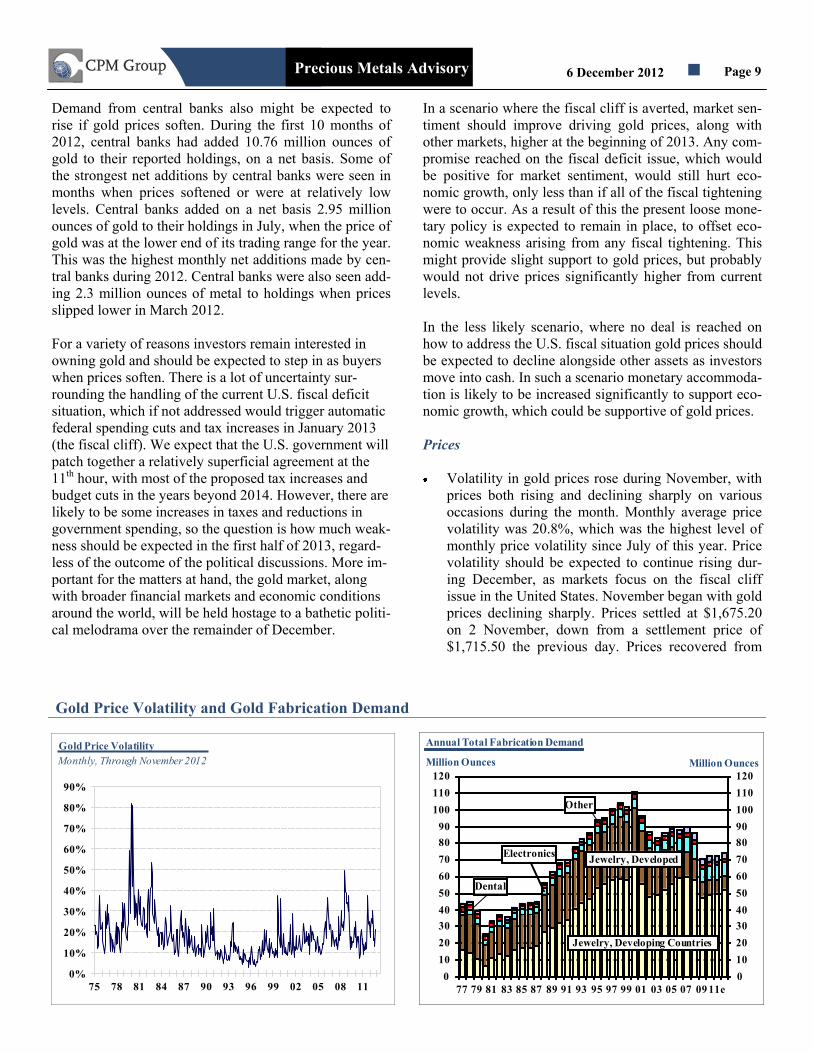
Volatility in gold prices rose during November, with
prices both rising and declining sharply on various
occasions during the month. Monthly average price
volatility was 20.8%, which was the highest level of
monthly price volatility since July of this year. Price
volatility should be expected to continue rising dur-
ing December, as markets focus on the fiscal cliff
issue in the United States. November began with gold
prices declining sharply. Prices settled at $1,675.20
on 2 November, down from a settlement price of
$1,715.50 the previous day. Prices recovered from
Gold Price Volatility and Gold Fabrication Demand

6 December 2012 Page 10 Precious Metals Advisory
this sharp decline over the next two trading session,
reaching an intraday high of $1,720.9 on 6 November
and settling at $1,715 that day. Prices began to soften
toward the end of the month, with the sharpest de-
cline seen on 28 November, when prices settled at
$1,716.50 (around where they were at the beginning
of the month), down $25.80 from the previous day.
The weakness in prices continued into the first few
days of December.
Fabrication Demand
India is presently in the middle of its marriage sea-
son, traditionally a strong gold buying season. The
recent weakness in the price of gold coupled with
some strength in the Indian rupee is likely to help
increase demand for gold from India. The strength in
the Indian rupee helps to reduce the cost of importing
gold. These factors could collectively result in some
strength in gold fabrication demand from India.
Official Transactions
Central banks added on a net basis, 1.61 million
ounces of gold to their holdings in October. Gross
additions to holdings during the month were 1.75
million ounces, and gross reductions were 141,000
ounces.
The central bank of Turkey added 564,000 ounces of
gold to its holdings in October, making it the largest
central bank buyer of gold during the month. The
Turkish central bank’s holdings reached 10.28 mil-
051015202530354045505560657075808590
05
1015202530354045505560657075808590
73 75 77 79 81 83 85 87 89 91 93 95 97 99 01 03 05 07 0911e
Indonesia
Canada
Peru
Australia
United States
Million Ounces Million Ounces
South AfricaOther Market Economies
Total World Mine Production
Transitional EconomiesChinaRussia
940
960
980
1,000
1,020
1,040
1,060
1,080
1,100
1,120
1,140
1,160
940
960
980
1,000
1,020
1,040
1,060
1,080
1,100
1,120
1,140
1,160
80 82 84 86 88 90 92 94 96 98 00 02 04 06 08 10 12p
Million Ounces Million Ounces
Official Sector Gold Reserve Levels
Official Transactions and Supply
-30
-25
-20
-15
-10
-5
0
5
10
15
20
25
30
-30
-25
-20
-15
-10
-5
0
5
10
15
20
25
30
04 05 06 07 08 09 10 11 12
Million Ounces Million Ounces
Gross Additions
Gross Reductions
Net Additions/Reductions
Official Sector Changes In Gold Holdings
2012 Through October
-2.0
-1.0
0.0
1.0
2.0
3.0
4.0
5.0
6.0
7.0
-2.0
-1.0
0.0
1.0
2.0
3.0
4.0
5.0
6.0
7.0
Jan-09 Aug-09 Mar-10 Oct-10 May-11 Dec-11 Jul-12
Gross Additions
Gross Reductions
Net Additions/Reductions
Million Ounces Million Ounces
Official Sector Changes In Gold Holdings in 2009 - October 2012
Excludes China, India and IMF Transactions,

6 December 2012 Page 11 Precious Metals Advisory
lion ounces, a record high, in October. The central
bank of Brazil added 552,000 ounces of gold to its
holdings in October, taking total holdings of gold to
1.69 million ounces. This was the second consecutive
month that the central bank added gold, after making
no additions to holdings between October 2001 and
August 2012. The central bank of Kazakhstan re-
sumed purchasing gold after being a seller of the
metal in September. The central bank purchased
242,000 ounces of gold in October, raising its hold-
ings to a record high 3.6 million ounces.
The Bank of International Settlements’ gold holdings
rose by 371,429 ounces in October. Other central
banks that added gold to their holdings included the
central bank of Russia (13,000 ounces), Mongolia
(1,000 ounces), Greece (1,000 ounces), and Belarus
(2,000 ounces).
The central banks of Germany reduced its holdings
by 135,000 ounces in October to 109.03 million
ounces. This was the second time that Germany re-
duced its holdings this year, with the first reduction
made in June. The central bank of Mexico reduced its
holdings for the sixth consecutive month in October,
taking its total holdings of gold to 4.01 million
ounces. This level of gold holdings is still 600,000
ounces higher than levels at the end of 2011.
Reported net additions to central bank gold holdings
during the first 10 months of the year were 10.76 mil-
lion ounces, driven entirely by an increase in gross
purchases made by central banks. Gross additions to
central bank gold holdings were 11.06 million ounces
during the first 10 months with gross reduction of
290,000 ounces.
Supply
The global production-weighted cash cost for gold
mining continued to rise during the third quarter of
2012 reaching $733/ounce, up from $730/ounce in
the second quarter of 2012 and $662/ounce in the
third quarter of 2011. On average the global gold
mining industry is still enjoying a healthy margin
between cash costs and gold prices. The average
price of gold during the third quarter of 2012 was
$1,654.37. The price of gold has not been rising in
the same fashion as it was in the past few years. This
coupled with continuing increases in cash costs is
squeezing producer margins. During the third quarter
of 2011 the average price of gold was $1,700 and
cash costs were $662/ounce, giving producers an av-
erage margin of $1,038/ounce in that quarter.
Investment Demand
Gold exchange traded product holdings continued to
rise in November. Total holdings reached 86.3 mil-
lion ounces at the end of the month, up 932,050
ounces from 85.4 million ounces at the end of Octo-
ber. Holdings continued to rise during the first few
days of December, reaching a record high 86.5 mil-
lion ounces on 4 December. Even though holdings
are at record levels, the net additions to holdings have
Investment Demand
-4
-2
0
2
4
6
8
-20%
-10%
0%
10%
20%
30%
40%
Jan-07 May-08 Sep-09 Jan-11 May-12
Change in ETF Gold Holdings
Gold Price %Change M-t-M
Million Ounces% Change
Month-end Change in ETF Gold Holdings and % Change in Gold Price
Through November 2012
Note: Data as of 30 November 2012
0
10
20
30
40
50
60
70
80
90
100
-
10
20
30
40
50
60
70
80
90
100
20032004 2005 2006 2007 2008 2009 2010 2011 2012
Japan HDFCReligare SBIQuantum RelianceKotak UTIAUUSA CSGLDECSGLDC CSGOLDSGLD SGLNAGOL GLTRCGL GBEESSprott GermanTurkey SGBSGOLD NYSEJB ETFZKB IAUGLD GLDGBS GOLDCGT CEF
Million OuncesMillion Ounces
Exchange Traded Funds' Physical Gold Holdings

6 December 2012 Page 12 Precious Metals Advisory
not been very strong. The strength in this incremental
demand is more important to price increases.
Investors in exchange traded funds were seen adding
to their holdings when the price of gold was declin-
ing or was relatively depressed. This shows that in-
vestors remain interested in the metal but are also
price sensitive and are reluctant to purchase the metal
when prices rise.
Markets and Inventories
Total open interest in the Comex gold futures con-
tract rose to 49.3 million ounces on 23 November,
from 45.7 million ounces at the end of October. Total
open interest softened over the remainder of Novem-
ber and into the first few days of December. At the
end of November, total open interest was 44.3 mil-
lion ounces and was down to 43.4 million ounces by
4 December.
Open interest in the December Comex contract de-
clined over the course of November as market par-
ticipants either rolled forward or closed out their po-
sitions. Open interest in this contract slipped from
29.7 million ounces at the beginning of November to
462,300 ounces at the end of the month. Open inter-
est in the nearby active February Comex contract was
at 28.6 million ounces on 4 December, down from
29.3 million ounces at the end of November.
Gold delivered via the December Comex contract
totaled 240,100 ounces as of 5 December. Comex
registered inventories rose by 67,830 ounces on 5
December from 2.53 million ounces at the end of
November. Total eligible stocks meanwhile declined
-10
-5
0
5
10
15
20
25
30
35
-10
-5
0
5
10
15
20
25
30
35
A-95 D-96 J-98 M-00O-01 J-03 J-05 S-06 A-08 D-09 A-11
Long
Short
Net Fund Position in Comex
Million OuncesMillion Ounces
Gross Long and Short Positions of Non-Commercial Positions Comex Gold Futures & Options.Weekly Data,through 27November 2012
0
10
20
30
40
50
60
70
0
1
2
3
4
5
6
7
8
9
10
11
12
13
J-06 A-06 A-07 D-07 J-08 M-09O-09M-10 J-11 A-11M-12N-12
O
Eligible Stocks
Registered Stocks
M
Million Ounces Million Ounces
Total Open Interest (Right Scale)
Comex Gold Inventories & Total Open Interest
Daily, Through 5 December 2012
20
25
30
35
40
45
50
55
60
65
70
200
400
600
800
1,000
1,200
1,400
1,600
1,800
2,000
2004 2005 2006 2007 2008 2009 2010 2011 2012
Million Ounces$/Ounce
Gold
Total Open Interest
Gold Price and Total Open Interest
Daily, Through 5 December 2012
-10
-5
0
5
10
15
20
25
30
35
-10
-5
0
5
10
15
20
25
30
35
Jun-06 Apr-07 Mar-08 Jan-09 Nov-09 Oct-10 Aug-11 Jun-12
Money Managers
Other Traders
Net Position
Long
Short
Gross Long and Short Positions of Comex Disaggragated Non-Commercial Positions
Comex Gold Futures and Options. Weekly Data, Through 27 November 2012
Million Ounces Million Ounces
Markets and Inventories

6 December 2012 Page 13 Precious Metals Advisory
Bullion Coins Monthly U.S. Eagle and Buffalo Gold Coin Sales by the U.S. Mint
Month 2010 2011 2012
January 85,000 133,500 140,500
February 84,000 92,500 28,000
March 102,000 111,500 88,500
April 117,000 128,500 29,000
May 260,500 122,500 62,500
June 185,000 67,000 70,000
July 175,000 76,500 34,500
August 57,000 140,000 48,000
September 98,000 104,000 77,000
O ctober 94,000 62,500 70,000
November 112,000 49,500 153,000
December 60,000 86,500
YTD Total June 2012 1,369,500 1,088,000 801,000
% Change YOY -0.6% -20.6% -26.4%
Annual Total 1,429,500 1,174,500 801,000
% Change Previous Year -12.0% -17.8%
0
50
100
150
200
250
300
350
0
50
100
150
200
250
300
350
92 94 96 98 00 02 04 06 08 10 12
Thousand OuncesThousand Ounces
Monthly U.S. Mint Gold Coin Sales to Dealers
by 54,713 ounces to 8.8 million ounces over the same
period of time, which resulted in total Comex inven-
tories rising to 11.4 million ounces on 4 December,
up 13,117 ounces from the end of November.
Net long positions held by large non-commercial
market participants rose during November reaching
21.2 million ounces on 27 November from 19.3 mil-
lion ounces on 30 October. The increase in net long
positions was driven entirely by an increase in gross
long positions, which reached 24.2 million ounces on
27 November from 22.1 million ounces at the end of
October. Gross short positions rose during Novem-
ber, reducing the increase in net long positions, to
3.04 million ounces on 27 November from 2.7 mil-
lion ounces on 30 October.
Clearing activity by member banks of the London
Bullion Market Association declined to 19.9 million
ounces in October on average per day from 22.4 mil-
lion ounces in September. The average value traded
per day declined to $34.7 billion in October from
$39.2 billion in September. The average number of
transfers slipped to 2,453 in October from 2,911 in
September.
0
10
20
30
40
50
60
70
80
90
100
110
120
130
140
0
10
20
30
40
50
60
70
80
90
100
110
120
130
140
50 53 56 59 62 65 68 71 74 77 80 83 86 89 92 95 98 01 04 07 10 13p
Available Supply
Investment Demand
Fabrication Demand
$200
$400
$600
$800
$1,000
$1,200
$1,400
$1,600
$1,800
$2,000
$200
$400
$600
$800
$1,000
$1,200
$1,400
$1,600
$1,800
$2,000
2002 2004 2006 2008 2010 2012 2014
Projections
Actual
Gold Quarterly Average Price Projections
$/Ounce, through Q3 2014
World Gold Supply and Demand
Million Ounces
6 December 2012 Page 14 Precious Metals Advisory
Bullion Coins
U.S. Mint gold coin sales reached 153,000 ounces in
November, the highest level reached since July 2010
when sales had totaled 175,000 ounces. Sales during
the first 11 months of 2012 totaled 801,000 ounces,
down 26.4% over the same period in 2011. On a year
-on-year basis, sales during November 2012 were up
209%, however.
U.S. Mint American Eagle gold coin sales reached
136,500 ounces during November 2012, the highest
level of sales for these coins since July 2010. Sales of
these coins during the first eleven months of the year
reached 677,000 ounces, down 27.6% from the corre-
sponding period in 2011.
American Buffalo gold coin sales continued to rise in
November reaching 16,500 ounces during the month.
This was up from 8,500 ounces from the same period
in 2011 and up from 11,000 ounces in October 2012.
Sales during the first 11 months of 2012 declined to
124,000 ounces, down 19.2% from the same period
in 2011.
Premiums on both the American Eagle and American
Buffalo gold coins remained mostly flat during No-
vember. This suggests that the market was well sup-
plied and could potentially result in softening in de-
mand from dealers in December.

6 December 2012 Page 15 Precious Metals Advisory
Million Ounces
Gold Statistical Position
*Million Ounces; Source: CPM Group; Notes: There may be discrepancies in totals and percent changes due to rounding; Net official sales are indicated by negative numbers; The price
is the Comex nearby active settlement, 2012 Through 11 October. Longer term projections are available in CPM Group's Gold Supply, Demand, and Price: 10-Year Projections report; e
-- estimates; p -- projections; NM -- Not meaningful; December 5, 2012
Supply 2007 2008 2009 2010 2011 2012p 2013p
Mine Production
China 8.7 9.1 10.1 11.0 11.6 12.3 13.0
Australia 7.9 6.9 7.2 8.4 8.3 8.1 8.4
United States 7.7 7.5 7.2 7.4 7.6 7.2 7.4
South Africa 8.2 7.1 6.6 6.2 6.0 5.3 5.1
Peru 5.5 5.8 5.9 5.3 5.3 5.4 5.5
Indonesia 3.7 2.1 4.0 3.4 2.5 1.8 2.0
Canada 3.3 3.1 3.1 2.9 3.2 3.2 3.1
Other Market Economies 20.4 21.5 23.1 24.6 25.0 26.0 28.0
Total 65.3 62.9 67.1 69.2 69.4 69.3 72.6
% Change Year Ago -0.7% -3.6% 6.6% 3.1% 0.3% -0.2% 4.8%
Secondary Supply 33.8 39.8 41.2 40.3 40.6 40.7 38.3
% Change Year Ago 22.5% 17.8% 3.7% -2.1% 0.5% 0.3% -6.0%
Transitional Economy
Sales 11.3 12.0 10.5 9.7 9.0 7.5 7.0
% Change Year Ago 9.7% 6.2% - -7.6% - - -
Total Supply 110.3 114.7 118.8 119.2 119.0 117.6 118.1
% Change Year Ago 6.5% 4.0% 3.6% 0.3% -0.2% -1.2% 0.4%
Fabrication Demand
Industrial Demand
Electronics 9.1 9.1 7.9 8.5 8.5 8.4 8.6
Dental/Medical 2.5 2.4 2.2 2.2 2.1 2.1 2.1
Other 3.9 4.6 4.1 4.1 4.7 4.8 4.9
Total 15.4 16.1 14.2 14.8 15.3 15.3 15.6
% Change Year Ago 15.6% 4.2% -11.9% 4.6% 3.1% 0.0% 1.8%
Jewelry
Developed Countries 14.9 12.4 9.4 8.7 8.4 8.2 8.1
Developing Countries 60.0 58.4 48.0 49.6 49.1 51.0 53.8
Total 74.9 70.8 57.3 58.3 57.5 59.2 61.8
% Change Year Ago -0.8% -5.5% -19.0% 1.7% -1.4% 3.0% 4.5%
Total Fabrication Demand 90.4 86.9 71.4 73.1 72.7 74.5 77.4
% Change Year Ago 1.7% -3.9% -17.8% 2.4% -0.5% 2.4% 3.9%
Stock Demand
Total Official Transactions -16.0 0.2 16.8 10.1 12.7 11.0 9.0
% Change Year Ago 37.2% NM NM -39.9% 25.9% -13.6% -18.2%
Net Private Investment
Official Coins 4.4 5.0 6.0 6.3 4.5 4.1 3.6
Bullion 28.8 18.1 20.1 24.7 26.0 25.4 25.6
Medallions 2.8 4.5 4.5 5.0 3.0 2.7 2.4
Total 36.0 27.6 30.6 36.0 33.5 32.1 31.7
% Change Year Ago 36.5% -23.3% 10.7% 17.8% -6.9% -4.1% -1.4%
Total Stock Demand 20.0 27.8 47.4 46.1 46.3 43.1 40.7
% Change Year Ago 36.0% 39.3% 70.4% -2.7% 0.3% -6.7% -5.6%
Total Demand
(Fabrication Plus Stock Change) 110.3 114.7 118.8 119.2 119.0 117.6 118.1
Price Per Ounce YTD
High $842.70 $1,004.30 $1,218.30 $1,421.40 $1,889.70 $1,796.50
Low 606.90 705.00 807.30 1,052.80 1,318.40 1536.60
Average 700.11 872.82 974.70 1,228.63 1,572.00 1669.27
% Change Year Ago 15.4% 24.7% 11.7% 26.1% 27.9% 6.5%

6 December 2012 Page 16 Precious Metals Advisory
Silver Quarterly Average Price Projections to Q3 2014
$ / Ounce
Silver Outlook
Silver prices rose last month, after trending lower in Oc-
tober. The roll of the December contract into the March
and forward month contracts helped boost prices. This
coupled with seasonal demand for the metal ahead of Di-
wali, contributed to the 11.3% trough-to-peak increase in
settlement prices between 2 and 29 November.
Silver prices have been trending lower since April of last
year. Each price rally has ended at lower highs. Intraday
peaks went from $49.82 in April 2011 to $44.09 in Au-
gust 2011 to $37.48 in February 2012 to $35.45 in Octo-
ber 2012 to the most recent peak of $34.35 on 29 Novem-
ber. Price support throughout this period has been firmly
positioned at $26.25. Going forward CPM Group expects
further declines in silver prices, driven by continued
weakness in industrial demand and rising supply. These
future declines, however, may be limited. Over the past
year, despite a broad decline in the price of the metal,
investors have remained relatively interested in silver as a
form of investment. Investors have purchased a net of
40.6 million ounces of silver exchange traded products
(ETPs), more than reversing the 24.4 million ounces of
silver ETPs sold during 2011. Last month, the U.S. Mint
witnessed a spike in November bullion coin sales, selling
3.2 million ounces of silver Eagle bullion coins, up
128.3% from last November, to authorized dealers. Also,
net long positions held by non-commercial Comex mar-
ket participants in silver futures and options have been
increasing since July and open interest in Comex silver
futures rose above levels seen in April of last year when
prices peaked last month.
Even though investment demand has been positive this
year thus far, 2012 pales in comparison to 2011. Trading
volumes in the Comex silver futures market are down
about 30%, clearing volumes in the London interbank
market are 20% lower this year than last year, silver Ea-
gle bullion sales are down 15% year-to-date, and silver
ETP net purchases are the lowest seen since 2005
(excluding 2011 when investors sold a net of 24.4 million
ounces of silver ETPs). CPM Group is projecting invest-
ment demand for silver to fall to 124.3 million ounces in
2012 from 133.2 million ounces last year. A further de-
cline in investment demand to 102.0 million ounces in
projected for 2013 while prices may come off by 8%
from 2012 levels.
Silver prices are projected to move sideways to lower this
month amid reduced trading activity during the holiday
season in the Western hemisphere. Investor concerns
about the fiscal cliff so far have appeared immaterial to
the silver market. It seems investor views about the ap-
Year QuarterQuarterly
AVGChange Annual AVG Change
2012 IV $32.72 9.7% $31.32 -6.0%
2013 I $29.47 0.9%
II $30.08 -8.0%
III $32.99 -4.0%
IV $33.28 3.0% $30.89 -1.3%
2014 I $30.62 4.0%
II $29.40 -1.0%
III $30.28 -6.0%
$8
$12
$16
$20
$24
$28
$32
$36
$40
$44
$48
$8
$12
$16
$20
$24
$28
$32
$36
$40
$44
$48
2009 2010 2011 2012 2013
Projections
Actual
8
12
16
20
24
28
32
36
40
44
48
52
Jan-10 Jul-10 Jan-11 Jul-11 Jan-12 Jul-12
Silver Prices: 1 January 2010 to 5 December 2012
$ / Oz

6 December 2012 Page 17 Precious Metals Advisory
and Australian output is up 19.1% so far this year.
Chilean and Bolivian output both declined strongly
this year relative to 2011.
Approximately 25 new silver-producing mines began
production this year so far, four of which are primary
silver mines. The largest mine by annual silver ca-
pacity is Aurcana’s Shafter mine in the United States,
which started production in the first half of the year.
The second largest was Mawson West’s Dikulushi
mine in the Democratic Republic of Congo. These 25
mines will add around 15.0 million ounces to silver
mine production capacity once fully ramped up.
Fabrication Demand
Net imports of silver in China fell to 5.7 million
ounces in October, down from 6.2 million ounces in
Silver Prices
0%
10%
20%
30%
40%
50%
60%
70%
80%
90%
100%
75 78 81 84 87 90 93 96 99 02 05 08 11
Monthly, Through November 2012
Silver Price Volatility
proaching fiscal cliff are mixed, resulting in no net im-
pact on price direction. Prices may rise in January and
February, ahead of the March contract delivery period at
the end of February and due to portfolio rebalancing.
Prices are expected to trade above $30 and below $35.50
over the next three months.
Prices
Silver prices trended higher in November. Continu-
ing a decline that began in October, silver prices fell
during the first three days of the month. Silver traded
to an intraday low of $30.66 on 5 November, the
lowest price since the first half of September. Prices
began to rise thereafter, touching an intraday peak of
$34.40 on 29 November, a 12.2% increase from the 5
November intraday trough. Silver settled at $33.20
on 3 November, down 3.3% from the previous day.
Prices averaged $32.82 last month, down 1.1% from
the previous month, despite rising prices.
Silver price volatility rose last month to 29.0% from
19.0% in October. This was the highest monthly
volatility rate since June.
Supply
Silver mine production fell to 68.1 million ounces in
September from 69.2 million ounces the previous
month, according to the World Bureau of Metal Sta-
tistics. Silver output from mines rose to 608.5 million
ounces this year through September, up 8.3% from
562.0 million ounces in the same period in 2011.
Output in Mexico, China, Peru, and Australia rose
during the first nine months of the year relative to
2011. Chinese silver mine production is up 37.1%
Silver Supply
World Silver Mine Production
Million Troy Ounces
% ∆
2011 2012
Mexico 113.1 122.5 8.3%
China 77.9 106.9 37.1%
Peru 81.0 83.4 3.0%
Australia 40.0 47.6 19.1%
Chile 31.3 27.2 -13.1%
Bolivia 29.3 26.4 -9.8%
Subtotal 372.6 414.0 11.1%
Other Countries 189.4 194.5 2.7%
Total 562.0 608.5 8.3%
Source: WBMS
Note: Russia, the sixth largest silver-producing country, was
excluded due to lack of comparable data.
Jan- Sept
55
57
59
61
63
65
67
69
71
Apr-10 Aug-10 Dec-10 Apr-11 Aug-11 Dec-11 Apr-12 Aug-12
Monthly Silver Mine ProductionThrough September 2012
Mln Oz

6 December 2012 Page 18 Precious Metals Advisory
September and 6.1 million ounces in October 2011.
Gross imports were lower and gross exports were
higher last month relative to September.
Demand for silver in India for Diwali and the wed-
ding season benefited from high gold prices last
month, but overall demand may have been flat to
lower year-on-year. Gold and silver sales in cities
appeared positive, but rural areas posted weak de-
mand, mostly due to the delay of harvesting. Adverse
monsoon weather delayed harvesting activities by
approximately a month. This limited the buying ca-
pacity of farmers, which make up about 70% of In-
dia’s work force.
Investment Demand
Silver exchange traded product holdings increased by
1.1% of 6.7 million ounces last month from 601.4
million ounces at the end of October. Holdings rose
to a monthly peak of 612.2 million ounces on 15 No-
vember, just shy of the record high of 615.1 million
ounces reached on 25 April 2011. Holdings declined
Silver Investment Demand
Note: CEF-Central Fund of Canada traded on the Toronto Stock Exchange. SLV-iShares Silver
Trust traded on the American Stock Exchange. ZKB-Zurich Cantonal traded on the Swiss Exchange.
ETF-ETF Securities traded on the London Stock Exchange and Australian Securities Exchange, and
New York Stock Exchange. Julius Baer traded on the Swiss Exchange. SIVR-ETF Securities traded
on the New York Stock Exchange. MSL-ETF Securities traded on the Australian Stock Exchange.
GLTR—ETF Securities traded on NYSE. WITE—ETF Securities traded on NYSE. SSLN—iShares
ETP traded on the London Stock Exchange. SSLV—Source ETP traded on the London Stock Ex-
change. Silver Mitsubishi—Mitsubishi’s silver ETP traded at the Tokyo Stock Exchange.
Silver Demand
-25
-20
-15
-10
-5
0
5
10
15
20
25
-25
-20
-15
-10
-5
0
5
10
15
20
25
J-05 S-05 M-06 J-07 S-07 M-08 J-09 S-09 M-10 J-11 S-11 M-12
Gross Imports
Gross Exports
Net Trade
Monthly, Through October 2012
Chinese Silver Imports and Exports
0
100
200
300
400
500
600
700
02 07 08 09 10 11 12
Japan SSLV
SSLN WITE
GLTR PSLV
SVR.UN SBT.U
Julius Baer SIVR
MSL PHAG
SLV
CEF
ZKB
Silver Exchange Traded Product HoldingsThrough 30 November 2012
Mln Oz
-15%
-10%
-5%
0%
5%
10%
15%
2005m01 2006m04 2007m07 2008m10 2010m01 2011m04 2012m07
Production-Weighted World Industrial ProductionPercentage Change from a Year Ago, Through September 2012
Source: CPB Netherlands Bureau for Economic Policy Analysis
Silver ETP Holdings
Data as of 30 November, Changes from 31 October
Month-end Holdings % ∆ Ounce ∆
CEF 76,964,103 - 0.0% 0
SLV iShares 314,448,448 ↓ -1.4% -4,589,504
ETF - ETFS 28,649,144 ↑ 2.6% 733,212
ZKB Silver 88,742,680 ↑ 1.6% 1,367,048
Silver MSL 2,267,399 ↓ -1.3% -30,852
SIVR - ETFS 18,417,787 ↓ -0.6% -103,618
Julius Baer S ilver 17,222,990 ↑ 3.1% 515,000
GLTR - ETFS 3,143,830 ↓ 0.0% 0
WITE - ETFS 3,347,751 ↓ -2.8% -95,306
PSLV 49,287,863 ↑ 21.8% 8,814,961
SVR 2,335,561 ↑ 2.3% 52,647
SBT 740,423 ↓ -0.1% -1,052
SSLN -iShares 487,905 ↓ 0.0% -230
SSLV 319,641 ↑ 64.6% 125,468
Silver Mitsubishi 1,652,548 ↓ -6.9% -122,173
Total 608,028,073 ↑ 1.1% 6,665,602
YTD Net Additions to Total ETF Holdings* ↑ 7.2% 40,596,837
*YTD data through 30 November. Percentage change is from end of
previous year.

6 December 2012 Page 19 Precious Metals Advisory
thereafter, to 608.0 million ounces on 30 November.
Silver ETP holdings are up 7.2%, or 40.6 million
ounces, this year so far.
Coins
The U.S. Mint delivered 3.2 million ounces of silver
Eagle bullion coins to authorized dealers in Novem-
ber, up 128.3% from 1.4 million ounces delivered in
November 2011. Coins sales by the U.S. Mint are
down 15.5% so far this year from the same period in
2011.
Markets and Inventories
Open interest in Comex silver futures rose from
696.2 million ounces on 31 October to 774.4 million
ounces on 23 November, an 11.2% increase. Open
interest in Comex silver futures has been increasing
since December of last year. The 23 November peak
was higher than the April 2011 peak of 764.7 million
ounces. Open interest came off after 23 November,
falling to 722.1 million ounces on 3 December.
Open interest in the most active nearby March con-
tract was 446.1 million ounces on 30 November. This
was 3.1 times the amount of metal stored in Comex
warehouses.
Daily trading volumes of Comex silver futures aver-
aged 326.7 million ounces in November, 71.7%
higher than the daily average rate of 190.1 million
ounces in October.
Large non-commercial market participants’ net long
positions increased 11.7% from 192.9 million ounces
on 30 October to 215.5 million ounces on 27 Novem-
ber, according to CFTC data. Net long positions held
by these market participants have been trending
higher since the beginning of July. Gross long posi-
tions rose by 26.1 million ounces while gross short
positions increased 3.5 million ounces during the pe-
riod.
The daily average number of ounces transferred in
the London interbank market during October was
98.1 million ounces, down from 124.3 million ounces
in the previous month. The daily value of ounces
transferred averaged $3.26 billion, down from $4.18
billion in September and the number of transfers fell
to 757 from 967 in the previous month.
Bullion Coins
0.0
0.5
1.0
1.5
2.0
2.5
3.0
3.5
4.0
4.5
5.0
5.5
6.0
6.5
0.0
0.5
1.0
1.5
2.0
2.5
3.0
3.5
4.0
4.5
5.0
5.5
6.0
6.5
92 9394 95 96 97
U.S. Mint Silver Coin Sales
Million Ozs Million Ozs
0
100
200
300
400
500
600
700
800
900
1,000
0
100
200
300
400
500
600
700
800
900
1,000
J-06 O-06 A-07 M-08 M-09 D-09 S-10 J-11 M-12
O
Registered Stocks
M
Total Open Interest
Comex Silver Inventories & Total Open InterestDaily, Through 5 December 2012
Mln Ozs Mln Ozs
Eligible Stocks
Monthly U.S. Eagle Silver Coin Sales by the U.S. Mint
Month 2010 2011 2012
January 3,592,500 6,422,000 6,107,000
February 2,050,000 3,240,000 1,490,000
March 3,381,000 2,767,000 2,542,000
April 2,507,500 2,819,000 1,520,000
May 3,636,500 3,653,500 2,875,000
June 3,001,000 3,402,000 2,858,000
July 2,981,000 2,968,000 2,278,000
August 2,451,000 3,679,500 2,870,000
September 1,880,000 4,460,500 3,255,000
O ctober 3,150,000 3,064,000 3,153,000
November 4,260,000 1,384,000 3,159,500
December 1,772,000 2,009,000
YTD Total June 2012 18,168,500 37,859,500 32,107,500
% Change YOY 351.4% 108.4% -15.2%
Annual Total 34,662,500 39,868,500 32,107,500
% Change Previous Year 48.1% 15.0%
Silver Markets

6 December 2012 Page 20 Precious Metals Advisory
Silver Quarterly Average Price Projections
$/Ounce, through Q3 2014
0
100
200
300
400
500
600
700
800
900
1,000
0
4
8
12
16
20
24
28
32
36
40
44
48
52
03 04 05 06 07 08 09 10 11 12 13
$/Ounces
Silver Prices and Open Interest
Million Ounces
Daily, Through 5 December 2012
Total Open Interest
Prices (Left Scale)
$2
$6
$10
$14
$18
$22
$26
$30
$34
$38
$42
$46
$2
$6
$10
$14
$18
$22
$26
$30
$34
$38
$42
$46
1999 2002 2005 2008 2011 2014
Projections
Actual
200
300
400
500
600
700
800
900
1,000
1,100
200
300
400
500
600
700
800
900
1,000
1,100
60 63 66 68 72 75 78 81 84 87 90 93 96 99 02 05 08 11
Supply
Fabrication Demand
-200
-150
-100
-50
0
50
100
150
200
250
300
350
400
-200
-150
-100
-50
0
50
100
150
200
250
300
350
400
A-95 M-97 J-99 A-01 S-03 N-05 D-07 J-10 F-12
Long
Short
Net Fund Position in Comex
Mln Ozs
Gross Long and Short Positions of Non-Commercial Positions Comex Silver Futures and Options. Weekly Data, Through 27 November 2012
Mln Ozs
-800
-700
-600
-500
-400
-300
-200
-100
0
100
200
300
400
-800
-700
-600
-500
-400
-300
-200
-100
0
100
200
300
400
A-95 M-97 J-99 A-01 S-03 N-05 D-07 J-10 F-12
Mln Ozs
Long
Short
Net Position
Gross Long and Short Positions of Commercial PositionsComex Silver Futures and Options. Weekly Data, Through 27 November 2012
Mln Ozs
-200
-100
0
100
200
300
400
-200
-100
0
100
200
300
400
Jun-06 Apr-07 Feb-08 Dec-08 Oct-09 Aug-10 Jun-11 Apr-12
Money Managers
Other Traders
Net Position
Gross Long and Short Positions of Comex Disaggragated Non-Commercial PositionsComex Silver Futures and Options. Weekly Data, Through 27 November 2012
Mln Ozs Mln Ozs
Long
Short
Silver Markets
World Silver Supply and Demand

6 December 2012 Page 21 Precious Metals Advisory
Million Ounces
Silver Statistical Position
*Million Ounces; Notes: Totals may not equal the sum of categories due to rounding. Mine production in Poland, Bulgaria, Romania, Hungary, the Czech Republic, and Slovakia is included in "other" mine
production; Photography, jewelry and silverware, electronics, and 'other' industrial use reflects demand in Europe, the United States, and Japan.; These sectors include Canada from 1979, Mexico from 1982,
Hong Kong from 1985, Thailand from 1986, India from 1987, Australia, Brazil, Peru, Colombia, Argentina, Chile, Korea, Pakistan, and Bangladesh from 1989, and Taiwan from 1990; Demand excludes the
transitional economies, except for imports.; The price is the Comex nearby active settlement, percent change from year earlier period. 2012 through 6 December. There may be discrepancies due to rounding; p
- projections; NM - Not meaningful; Source: CPM Group 6 December 2012.
Supply 2007 2008 2009 2010 2011 2012p 2013p
Mine Production
Mexico 99.5 104.1 114.3 128.6 152.8 160.9 161.3
United States 39.0 40.2 39.9 40.8 36.0 34.3 35.4
Peru 112.3 118.5 126.1 116.9 109.8 109.0 111.4
Canada 27.7 24.3 20.3 19.2 18.4 17.8 18.8
Australia 60.5 61.9 52.5 60.4 55.5 57.0 58.2
China 97.9 96.3 107.9 112.5 128.6 135.4 142.7
Other 190.2 189.6 212.8 207.8 212.6 208.5 217.4
Total 627.1 634.8 673.8 686.2 713.6 722.9 745.1
% Change Year Ago 5.0% 1.2% 6.1% 1.9% 4.0% 1.3% 3.1%
Secondary Supply
Old Scrap 242.2 251.5 249.9 262.8 270.8 263.0 255.0
Coin Melt 5.0 4.0 4.0 2.0 1.5 3.0 3.0
Other Supply 0 1 2 3 4 5 6
Indian Scrap 16.1 17.5 21.7 15.7 4.8 13.8 10.0
Total 263.3 273.0 275.6 280.5 277.1 279.8 268.0
% Change Year Ago -1.9% 3.7% 1.0% 1.8% -1.2% 1.0% -4.2%
Other Supply
Government Disposals 8.0 0 0 3.8 2.4 0 0
Net Exports from
Transitional Economies 5 3 1 2 2 2 2
Total 13 3 1 5.8 4.4 2 2
% Change Year Ago -45.8% -76.9% -66.7% 480.0% -23.5% -55.0%
Total Supply 903.4 910.8 950.4 972.5 995.1 1,004.7 1,015.1
% Change Year Ago 1.5% 0.8% 4.3% 2.3% 2.3% 1.0% 1.0%
Fabrication Demand
Photography 161.5 133.5 119.4 110.9 102.6 96.8 93.1
Jewelry & Silverware 284.7 278.9 276.5 286.5 290.9 296.1 308.0
Electronics and Batteries 195.9 204.3 201.1 212.8 221.8 234.4 248.4
Solar Panels 6.3 15.5 22.6 48.6 59.8 60.2 64.0
Other Uses 212.3 213.5 176.4 178.3 178.8 183.2 189.5
Other Countries 8.2 9.7 7.5 6.5 8.0 9.7 10.0
Net Imports into the
Transitional Economies
Total Fabrication Demand 869.0 855.3 803.6 843.5 861.9 880.4 913.0
% Change Year Ago 1.3% -1.6% -6.1% 5.0% 2.2% 2.1% 2.6%
Net Surplus or Deficit 34.4 55.5 146.8 129.0 133.2 124.4 102.0
Addenda
Coinage 29.2 54.4 66.2 82.5 98.7 79.7 70.9
Price Per Ounce YTD
High $15.55 $20.79 $19.33 $30.94 $48.58 $37.14
Low 11.50 8.79 10.44 14.83 26.81 26.25
Average 13.45 14.97 14.67 20.31 35.29 31.15
% Change Year Ago 15.9% 11.3% -2.0% 38.4% 73.8% -12.8%
6 December 2012 Page 22 Precious Metals Advisory
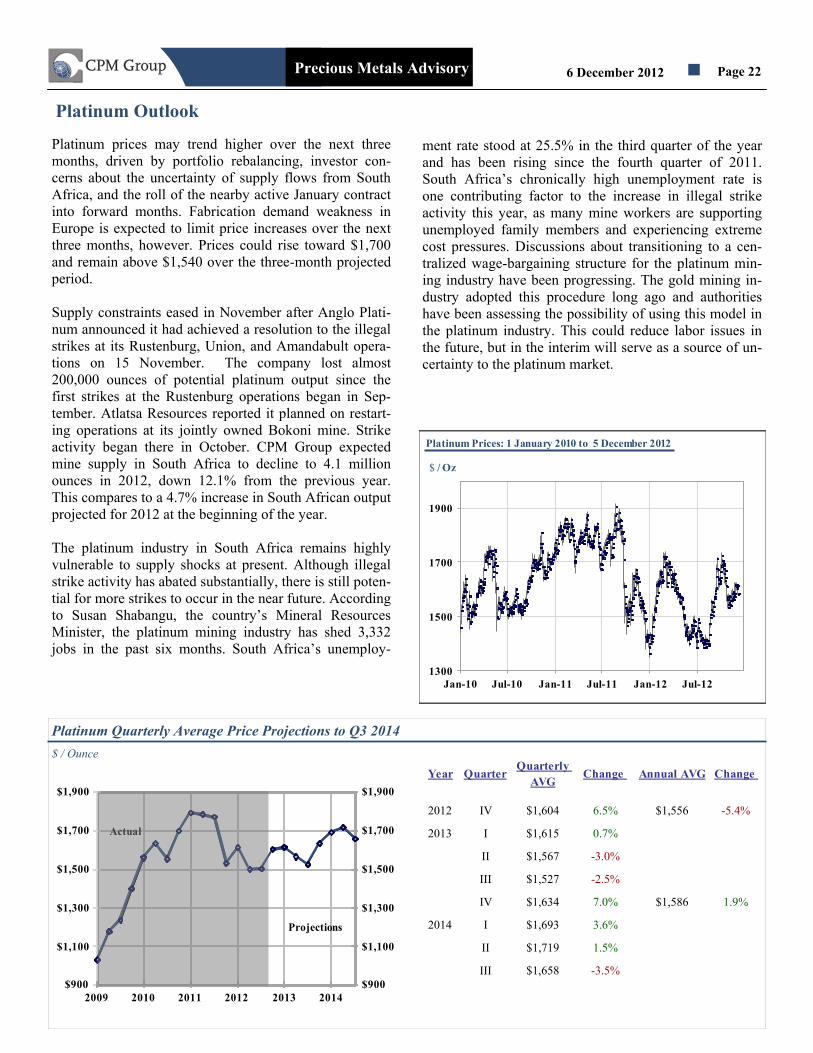
Platinum Outlook
Platinum prices may trend higher over the next three
months, driven by portfolio rebalancing, investor con-
cerns about the uncertainty of supply flows from South
Africa, and the roll of the nearby active January contract
into forward months. Fabrication demand weakness in
Europe is expected to limit price increases over the next
three months, however. Prices could rise toward $1,700
and remain above $1,540 over the three-month projected
period.
Supply constraints eased in November after Anglo Plati-
num announced it had achieved a resolution to the illegal
strikes at its Rustenburg, Union, and Amandabult opera-
tions on 15 November. The company lost almost
200,000 ounces of potential platinum output since the
first strikes at the Rustenburg operations began in Sep-
tember. Atlatsa Resources reported it planned on restart-
ing operations at its jointly owned Bokoni mine. Strike
activity began there in October. CPM Group expected
mine supply in South Africa to decline to 4.1 million
ounces in 2012, down 12.1% from the previous year.
This compares to a 4.7% increase in South African output
projected for 2012 at the beginning of the year.
The platinum industry in South Africa remains highly
vulnerable to supply shocks at present. Although illegal
strike activity has abated substantially, there is still poten-
tial for more strikes to occur in the near future. According
to Susan Shabangu, the country’s Mineral Resources
Minister, the platinum mining industry has shed 3,332
jobs in the past six months. South Africa’s unemploy-
ment rate stood at 25.5% in the third quarter of the year
and has been rising since the fourth quarter of 2011.
South Africa’s chronically high unemployment rate is
one contributing factor to the increase in illegal strike
activity this year, as many mine workers are supporting
unemployed family members and experiencing extreme
cost pressures. Discussions about transitioning to a cen-
tralized wage-bargaining structure for the platinum min-
ing industry have been progressing. The gold mining in-
dustry adopted this procedure long ago and authorities
have been assessing the possibility of using this model in
the platinum industry. This could reduce labor issues in
the future, but in the interim will serve as a source of un-
certainty to the platinum market.
1300
1500
1700
1900
Jan-10 Jul-10 Jan-11 Jul-11 Jan-12 Jul-12
Platinum Prices: 1 January 2010 to 5 December 2012
$ / Oz
Platinum Quarterly Average Price Projections to Q3 2014
$ / Ounce
$900
$1,100
$1,300
$1,500
$1,700
$1,900
$900
$1,100
$1,300
$1,500
$1,700
$1,900
2009 2010 2011 2012 2013 2014
Projections
Actual
Year QuarterQuarterly
AVGChange Annual AVG Change
2012 IV $1,604 6.5% $1,556 -5.4%
2013 I $1,615 0.7%
II $1,567 -3.0%
III $1,527 -2.5%
IV $1,634 7.0% $1,586 1.9%
2014 I $1,693 3.6%
II $1,719 1.5%
III $1,658 -3.5%

6 December 2012 Page 23 Precious Metals Advisory
In addition to wage issues, fresh concerns about the sup-
ply of electricity surfaced last month. Eskom, the main
utility provider in the country, reported that its supply/
demand balance of electricity was extremely narrow due
to unplanned outages. This fresh uncertainty may be sup-
portive of prices over the next few weeks.
Prices
Prices trended higher last month, from an intraday
low of $1,534.50 on 7 November to an intraday high
of $1,626.60 on 23 November, a 6.0% increase. Plati-
num traded sideways after 23 November, mostly be-
tween $1,580 and $1,625. Prices averaged $1,579.40
for the month, down 3.5% from the previous month.
The monthly volatility rate fell to 15.7% in Novem-
ber from 19.7% the previous month. This was lower
than the 24.9% rate in November of last year and was
the lowest monthly rate since July of 2011.
Supply
Anglo Platinum restarted operations on 15 November
at its Rustenburg mines, where an illegal strike had
halted mining activities since 13 September, and its
Union and Amandelbult operations, where strike ac-
tion began in early October. These operations ac-
count nearly 60% of the company’s South African
platinum production capacity and roughly 30% of
total South African platinum production capacity. In
the company’s 15 November press release, Anglo
Platinum reported it had lost 191,359 ounces of po-
tential output during the strike, which is about 4.1%
of South African platinum output in 2011. Workers
accepted Anglo’s wage offer, which increased
monthly base salaries by 400 South African rand and
included a one off allowance payable upon returning
to work. CPM Group estimates that Anglo Platinum’s
output could be around 12% lower in 2012 from the
previous year.
Impala Platinum reported results for the quarter
ended 30 September last month. The company pro-
duced 454,000 refined ounces of platinum during the
quarter, up 17.0% from 388,000 ounces produced in
the same quarter in 2011. The company decided to
defer its phase 2 expansion plants at Zimplats to 2015
as part of its capital preservation measures. Cash
costs at Impala mines increased by around 15%, due
to poor mining quality at its Rustenburg operations,
wage pressures, and adverse exchange rates.
The strike that began at the Bokoni mine, jointly
owned by Atlatsa Resources and Anglo Platinum, on
1 October may have ended or will come to an end
soon. Atlatsa reported in its 3 December press release
that it was currently in the process of “re-hiring
workers with the view to re-commencing operations
as soon as possible.” The Bokoni mine is one of the
highest cost mines in the industry and only produces
about 100,000 ounces of platinum a year.
Renewed concerns about South Africa’s power sup-
ply surfaced in the first week of December. Eskom,
the main power provider in the country, reported it
only had about 2% of excess supply of electricity.
The narrow margin was attributed to unplanned out-
ages. About four years ago, the country experienced
rolling blackouts due to an electricity shortage. These
blackouts halted PGM mining operations and contrib-
uted to the PGM price spikes of 2008.
Platinum Prices
0%
10%
20%
30%
40%
50%
60%
70%
80%
90%
100%
75 79 83 87 91 95 99 03 07 11
Monthly, Through November 2012
Platinum Price Volatility
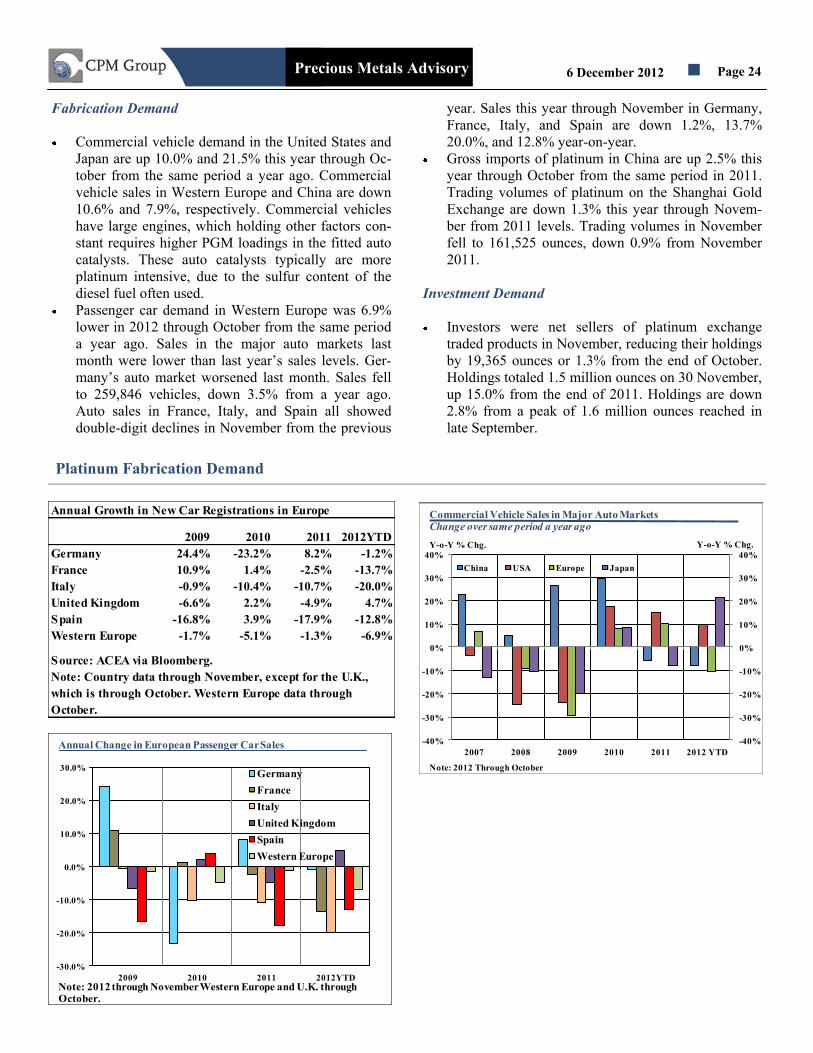
6 December 2012 Page 24 Precious Metals Advisory
Fabrication Demand
Commercial vehicle demand in the United States and
Japan are up 10.0% and 21.5% this year through Oc-
tober from the same period a year ago. Commercial
vehicle sales in Western Europe and China are down
10.6% and 7.9%, respectively. Commercial vehicles
have large engines, which holding other factors con-
stant requires higher PGM loadings in the fitted auto
catalysts. These auto catalysts typically are more
platinum intensive, due to the sulfur content of the
diesel fuel often used.
Passenger car demand in Western Europe was 6.9%
lower in 2012 through October from the same period
a year ago. Sales in the major auto markets last
month were lower than last year’s sales levels. Ger-
many’s auto market worsened last month. Sales fell
to 259,846 vehicles, down 3.5% from a year ago.
Auto sales in France, Italy, and Spain all showed
double-digit declines in November from the previous
year. Sales this year through November in Germany,
France, Italy, and Spain are down 1.2%, 13.7%
20.0%, and 12.8% year-on-year.
Gross imports of platinum in China are up 2.5% this
year through October from the same period in 2011.
Trading volumes of platinum on the Shanghai Gold
Exchange are down 1.3% this year through Novem-
ber from 2011 levels. Trading volumes in November
fell to 161,525 ounces, down 0.9% from November
2011.
Investment Demand
Investors were net sellers of platinum exchange
traded products in November, reducing their holdings
by 19,365 ounces or 1.3% from the end of October.
Holdings totaled 1.5 million ounces on 30 November,
up 15.0% from the end of 2011. Holdings are down
2.8% from a peak of 1.6 million ounces reached in
late September.
Platinum Fabrication Demand
-40%
-30%
-20%
-10%
0%
10%
20%
30%
40%
-40%
-30%
-20%
-10%
0%
10%
20%
30%
40%
2007 2008 2009 2010 2011 2012 YTD
China USA Europe Japan
Y-o-Y % Chg. Y-o-Y % Chg.
Commercial Vehicle Sales in Major Auto MarketsChange over same period a year ago
Note: 2012 Through October
Annual Growth in New Car Registrations in Europe
2009 2010 2011 2012YTD
Germany 24.4% -23.2% 8.2% -1.2%
France 10.9% 1.4% -2.5% -13.7%
Italy -0.9% -10.4% -10.7% -20.0%
United Kingdom -6.6% 2.2% -4.9% 4.7%
Spain -16.8% 3.9% -17.9% -12.8%
Western Europe -1.7% -5.1% -1.3% -6.9%
Source: ACEA via Bloomberg.
Note: Country data through November, except for the U.K.,
which is through October. Western Europe data through
October.
-30.0%
-20.0%
-10.0%
0.0%
10.0%
20.0%
30.0%
2009 2010 2011 2012YTD
Germany
France
Italy
United Kingdom
Spain
Western Europe
Annual Change in European Passenger Car Sales
Note: 2012 through November Western Europe and U.K. throughOctober.

6 December 2012 Page 25 Precious Metals Advisory
Platinum Investment Demand
Note: PHPT-ETF Securities’ platinum ETF traded on the London Stock Exchange. ZKB-Zurich
Cantonal's platinum ETF traded. PPLT-ETF Securities’ platinum ETF traded on the New York
Stock Exchange. Julius Baer’s platinum ETF traded on the Swiss Exchange. MSL-Metals Securities
Australia platinum ETF. GLTR-ETF Securities’ Precious Metals Basket ETF traded on the New
York Stock Exchange. WITE-ETF Securities’ white metals basket ETF traded on the New York
Stock Exchange. SPLT-iShares platinum ETC traded on the London Stock Exchange. SPPT-
Source’s platinum ETP traded on the London Stock Exchange. Tokyo-Mitsubishi’s Japanese
Platinum ETC.
0.0
0.2
0.4
0.6
0.8
1.0
1.2
1.4
1.6
1.8
0.0
0.2
0.4
0.6
0.8
1.0
1.2
1.4
1.6
1.8
20-Apr-07 20-Apr-08 20-Apr-09 20-Apr-10 20-Apr-11 20-Apr-12
SPPT - LSE Source
SPLT-LSE iShares
WITE-NYSE ETFS
GLTR-NYSE ETFS
Julius Baer Platinum
MSL ASX
Tokyo Mitsubishi
Platinum Exchange Traded Product HoldingsDaily, through 30 November 2012
Mln Oz Mln Oz
PHPT LSE
ZKB Platinum
PPLT NYSE
Markets & Inventories
Open interest in Nymex platinum futures fell from
3.06 million ounces on 31 October to a monthly low
of 2.98 million ounces on 20 November. Open inter-
est began rising thereafter, touching 3.10 million
ounces on 3 December.
Open interest in the nearby active January contract
trended lower last month, from 2.87 million ounces at
the end of October to 2.73 million ounces on 4 De-
cember, a 5.0% decrease.
Daily trading volumes of Nymex platinum futures
fell to 416,259 ounces in November from 460,122
ounces in October.
Large non-commercial Nymex market participants
raised their net long positions in platinum futures by
466,400 ounces between 30 October and 27 Novem-
ber, a 52.2% increase. Gross long positions increased
by 21% and gross short positions decreased by 42.5%
during the period.
Platinum ETF Holdings
Data as of 30 November 2012, Changes from 31 October
Month-end Holdings % ∆ Ounce ∆
PPLT ETF Securities 491,581 ↓ -1.0% -5,058
Platinum ZKB 353,395 ↓ 0.0% -161
Platinum Julius Baer 105,670 ↓ -0.2% -250
PHPT ETFS 518,384 ↑ 2.1% 11,002
GLTR - ETFS 8,471 ↑ 2.7% 225
WITE - ETFS 7,319 ─ 0.0% 0
Platinum MSL 5,108 ↑ 2.7% 136
SPLT iShares 3,279 ↓ 0.0% -1
SPPT Source 14,677 ─ 0.0% 0
Japan Mitsubishi 15,882 ─ 0.0% 0
Total 1,523,766 ↓ -1.3% -19,365
YTD Net Additions to Total ETF Holdings* ↑ 15.0% 198,302
*YTD Holdings as of 30 November 2012. Percentage change is
0.0
0.5
1.0
1.5
2.0
2.5
3.0
3.5
0
500
1,000
1,500
2,000
2,500
3,000
D-02 F-04 A-05 J-06 S-07 N-08 J-10 M-11 M-12
Open Interest
Nymex Stocks
Prices (Left scale)
Platinum Prices, Total Open Interest, and Nymex Inventories
Daily, Through 5 December 2012
$ / Oz Mln Ozs
-1,200
-900
-600
-300
0
300
600
900
1,200
1,500
1,800
2,100
2,400
2,700
-1,200
-900
-600
-300
0
300
600
900
1,200
1,500
1,800
2,100
2,400
2,700
A-95 M-97 J-99 D-01 J-04 F-06 A-08 M-10 J-12
Long
Short
Net Fund Position in Nymex
'000 Ozs
Gross Long and Short Positions of Non-Commercial Positions Platinum Futures & Options. Weekly Data, Through 30 October 2012
'000 Ozs
Platinum Markets

6 December 2012 Page 26 Precious Metals Advisory
Platinum Statistical Position
World Platinum Supply and Demand Balance
Thou. Ounces
Platinum Quarterly Average Price Projections
$/Ounce, through Q3 2014
$200
$600
$1,000
$1,400
$1,800
$2,200
$2,600
$200
$600
$1,000
$1,400
$1,800
$2,200
$2,600
1999 2002 2005 2008 2011 2014
Projections
Actual
*Thousand Troy Ounces; Notes: Excludes transitional economies, except as noted. Secondary production statistics exclude toll-refined material; Prices are settlement prices for the nearby
active contract on the New York Mercantile Exchange. 2012 through 6 December. Changes in market inventories are year-end. *Changes in 1997 market inventories exclude U.S. Industry
stocks since the U.S. Bureau of Mines ceased publication of U.S. Industry stock level data in the third quarter of 1997; As of 2006 Inventories includes changes in ETF holdings; There may
be discrepancies due to rounding; NA -- not available; e -- estimates; p -- projections; Sources: U.S. Bureau of Mines, Statistics Canada, trade sources, CPM Group; 6 December 2012.
0
1,000
2,000
3,000
4,000
5,000
6,000
7,000
8,000
9,000
0
1,000
2,000
3,000
4,000
5,000
6,000
7,000
8,000
9,000
1977 1981 1985 1989 1993 1997 2001 2005 2009 2013p
Total Supply
Total Demand
Platinum Statistical Position
Supply 2007 2008 2009 2010e 2011 2012p 2013p
Mine Production
South Africa 5,039 4,778 4,537 4,684 4,695 4,128 4,581
Russia 935 800 804 834 811 803 823
Canada 206 235 144 96 247 257 270
United States 128 119 126 113 122 118 119
Other 363 369 403 457 510 519 530
Total 6,672 6,301 6,014 6,184 6,385 5,826 6,322
% Change Year Ago -5.1% -5.6% -4.6% 2.8% 3.3% -8.8% 8.5%
Secondary Supply
Total 920 1,000 750 964 988 998 1,038
% Change Year Ago 13.6% 8.7% -25.0% 28.5% 2.5% 1.0% 4.0%
Total Supply 7,592 7,301 6,764 7,147 7,373 6,824 7,360
% Change Year Ago -3.2% -3.8% -7.4% 5.7% 3.2% -7.4% 7.9%
Fabrication Demand
Auto 4,195 3,785 2,740 3,081 3,173 3,285 3,341
Jewelry 1,772 1,698 2,283 1,926 1,946 1,974 2,038
Other 1,877 1,975 1,959 2,196 2,196 2,240 2,298
Total Demand 7,844 7,457 6,982 7,202 7,315 7,499 7,677
% Change Year Ago 0.3% -4.9% -6.4% 3.2% 1.6% 2.5% 2.4%
Net Surplus or Deficit -252 -157 -218 -55 58 -675 -316
Price Per Ounce YTD
High $1,549.30 $2,276.10 $1,506.30 $1,809.60 $1,905.70 $1,725.10
Low $1,112.00 $787.20 $922.20 $1,460.00 $1,363.40 $1,386.40
Average $1,314.46 $1,579.31 $1,214.50 $1,614.22 $1,722.39 $1,552.35
% Change Year Ago 14.6% 20.1% -23.1% 32.9% 6.7% -12.3%

6 December 2012 Page 27 Precious Metals Advisory
Palladium Quarterly Average Price Projections to Q3 2014
$ / Ounce
Palladium Outlook
Palladium has price supportive mine supply fundamentals
but the fabrication demand fundamentals could weaken
over the next few months, which could weigh on prices.
The illegal labor strikes at South African mines have
been resolved, for the most part, but there are still several
country related risks, such as poor infrastructure and gov-
ernment policies that could hamper mine supply in the
future. Since none of these factors is an active issue at
present these problems are expected to be more price sup-
portive than factors that result in pushing higher the price
of palladium.
On the fabrication demand side, there has been strength
in demand from two of palladium’s largest uses, auto
catalysts and semiconductors. Much of the demand
growth in both of these areas has been driven by stronger
growth from the United States. Fabrication demand is
likely to be hurt in the first half of next year as the U.S.
undergoes fiscal tightening. Irrespective of how U.S.
politicians handle the fiscal cliff situation, there will be a
negative impact on the economy. If the fiscal cliff is
averted, the scenario we assign the greatest probability,
the negative impact of the fiscal tightening will be less
than if no decision is made on how to handle the situa-
tion, a scenario we consider to be unlikely. Additionally,
the U.S. auto market is beginning to show signs of an
increase in inventory levels for some models, despite the
strong growth in demand for auto in the U.S. market this
year. This could weigh on future palladium demand.
On the downside, palladium prices could potentially de-
cline toward $600 or even $580 if fabrication demand
becomes a concern and investors liquidate their positions.
Prices are unlikely to decline below these levels because
of the price supportive mine supply fundamentals. On the
upside prices could rise toward $725. If prices break past
this level prices are could find resistance at $750. Prices
are likely to rise to these levels in the event that the fiscal
cliff is averted. In such a scenario, all asset prices could
potentially see at least an initial increase in value.
350
400
450
500
550
600
650
700
750
800
850
900
Jan-10 Jul-10 Jan-11 Jul-11 Jan-12 Jul-12
Palladium Prices: 1 January 2009 to 5 December 2012
$ / Oz
Palladium Prices
$0
$100
$200
$300
$400
$500
$600
$700
$800
$900
$0
$100
$200
$300
$400
$500
$600
$700
$800
$900
2009 2010 2011 2012 2013 2014
Projections
Actual
Year QuarterQuarterly
AVGChange Annual AVG Change
2012 IV $640 4.1% $642 -12.6%
2013 I $632 -1.3%
II $638 1.0%
III $625 -2.0%
IV $678 8.5% $643 0.2%
2014 I $722 6.4%
II $738 2.2%
III $710 -3.7%

6 December 2012 Page 28 Precious Metals Advisory
Prices
Palladium prices rose by around 13% during Novem-
ber. Prices settled at $686.25 on 30 November, up
from $609.80 on 31 October. Palladium prices settled
higher on more days than it settled lower, during No-
vember. The roll of the then nearby active December
Nymex contract, coupled with an increase in invest-
ment demand helped to drive palladium prices
higher. In November, palladium prices retraced all of
the losses that it suffered between the last week of
September and the end of October.
Supply
Strikes at South Africa’s platinum group metal mines
were resolved for the most part during November.
There are several structural problems with South Af-
rica’s mining industry, however, which should con-
tinue to threaten supply and should underpin palla-
dium prices.
Fabrication Demand
Monthly U.S. light-duty vehicle sales continued to
rise in November reaching 1.13 million, up 14.8%
from the corresponding period in 2011. For the first
11 months of 2012, U.S. light-duty vehicle sales to-
taled 13.08 million, up 13.8% or 1.6 million vehicles
over the same period in 2011. Availability of cheap
and relatively easy financing has been the primary
driver of demand during 2012. Demand in November
also is said to be helped by the destruction of cars
due to Superstorm Sandy. It is estimated that around
0%
10%
20%
30%
40%
50%
60%
70%
80%
90%
100%
77 79 81 83 85 87 89 91 93 95 97 99 01 03 05 07 09 11 13
Monthly, Through November 2012
Palladium Price Volatility
Palladium Price Volatility and Fabrication Demand
-
200
400
600
800
1,000
1,200
1,400
1,600
Jan Feb Mar Apr May Jun Jul Aug Sep Oct Nov Dec
2010 2011 2012
Thousand Vehicles
U.S. Vehicle Sales
Monthly Data, Through November 2012
1,000
1,100
1,200
1,300
1,400
1,500
1,600
1,700
1,800
1,900
2,000
Jan Feb Mar Apr May Jun Jul Aug Sep Oct Nov Dec
2010 2011 2012
Chinese Vehicle Sales Monthly ,Through October 2012
Thousand Vehicles
-40.0%
-30.0%
-20.0%
-10.0%
0.0%
10.0%
20.0%
30.0%
40.0%
50.0%
60.0%
2009 2010 2011 2012 YTD
Brazil Russia
India China
Annual Percentage Change in Auto Sales
Source: Bloomberg. Note: 2012 data through September. Brazil through October.

6 December 2012 Page 29 Precious Metals Advisory
Investment Demand
Palladium exchange traded product (ETP) holdings
rose at the beginning of November, rising to 1.91
million ounces on 5 November. Holdings slipped
lower over the next few days reaching a low of 1.862
million ounces on 15 November. Holdings rose over
the remainder of November, rising back to levels
near those seen at the beginning of the month. On 30
November, palladium ETP holdings had reached 1.89
million ounces.
Investor holdings in palladium ETPs had continued
to rise into the first few days of December, with hold-
ings reaching around 1.9 million ounces on 5 Decem-
ber.
Markets & Inventories
Total open interest in the Nymex palladium contract
rose during November. Total open interest rose from
2.07 million ounces at the end of October to 2.3 mil-
lion ounces at the end of November. The increase in
total open interest gained momentum toward the end
of the month, rising to a high of 2.35 million ounces
on 29 November from 2.16 million ounces on 21 No-
vember. Total open interest continued to rise into the
first few days of December. On 3 December, total
open interest was at 2.36 million ounces.
Open interest in the December Nymex contract de-
clined over the course of November as market par-
ticipants either rolled forward or closed out their po-
sitions. Open interest in this contract slipped from
1.89 million ounces at the beginning of November to
Note: PHPD-ETF Palladium traded on the London Stock Exchange. ZKB-Zurich Cantonal's
palladium ETF traded. PALL—ETFS Palladium traded on the New York Stock Exchange . Metals
Securities Australia . Julius Baer’s palladium ETF traded on the Swiss Exchange. Precious Metals
Basket ETF traded on the New York Stock Exchange. WITE-ETF Securities’ white metals basket
ETF traded on the New York Stock Exchange. SPDM-iShares’ palladium ETC traded on the
London Stock Exchange. SPAL-Source’s palladium ETC traded on the London Stock Exchange.
Mitsubishi is palladium ETP traded on Tokyo Stock Exchange.
Palladium Investment Demand
250,000 vehicles were lost to the storm.
One area of concern with regard to future demand for
palladium is that there is a significant build up in the
inventory of certain vehicles despite the increase in
demand.
According to the Semiconductor Industry Associa-
tion, global semiconductor sales in October rose to
$25.2 billion, up 1.7% from the prior month. Year-to-
date sales through October 2012 were down 3.7%
from the corresponding period in 2011.
0.0
0.5
1.0
1.5
2.0
2.5
0.0
0.5
1.0
1.5
2.0
2.5
2007 2008 2009 2010 2011 2012
Mitsubishi
SPAL
SPDM
WITE
GLTR
Julius Baer
MSL ASX
PHPD LSE
ZKB
PALL NYSE
Palladium ETP HoldingsThrough November 2012
Mln Oz Mln Oz
Source: ETP issuer websites, Bloomberg
Palladium ETP Holdings
Data as of 30 November Changes from 30 October
Month-end Holdings % ∆ Ounce ∆
PALL ETF Securities 712,675 ↓ -5.6% -39,819
Palladium ZKB - SIX 355,276 ↓ 0.0% -161
Palladium Julius Baer 133,923 ↑ 1.0% 1,400
PHPD ETF Securities 550,721 ↑ 6.6% 36,587
GLTR - ETFS 12,633 ↑ 2.3% 292
WITE - ETFS 5,875 ─ 0.0% 0
Palladium MSL - ASX 3,812 ↑ 2.8% 106
SPDM iShares 6,348 ↓ 0.0% -2
SPAL Source 102,982 ↑ 1.5% 1,509
Mitsubishi 12,539 ─ 0.0% 0
Total 1,896,784 ↓ 0.0% -86
YTD Net Additions to Total ETF Holdings* 191,994
*As of 30 November
-600
-400
-200
0
200
400
600
800
1,000
1,200
-600
-400
-200
0
200
400
600
800
1,000
1,200
2007 2008 2009 2010 2011 2012 YTD
Thousand Ounces Thousand Ounces
Net Sales/Purchases of Palladium ETPs

6 December 2012 Page 30 Precious Metals Advisory
Palladium Markets
0.0
0.5
1.0
1.5
2.0
2.5
3.0
100
200
300
400
500
600
700
800
900
D-02 S-03 J-04M-05M-06J-07 N-07 S-08 J-09 A-10F-11 D-11O-12
Nymex Stocks
Palladium Prices, Total Open Interest, and Nymex Inventories
Daily, Through 5 December 2012$ / Oz Mln Ozs
Open Interest
Prices (Left scale)
84,400 ounces at the end of the month. Based on the
increase in total open interest over this time it is most
likely that market participants rolled their positions
into future months. Open interest in the nearby active
March Comex contract was at 2.3 million ounces on
4 December, up from 2.2 million ounces at the end of
November.
Palladium delivered via the December Nymex con-
tract totaled 77,600 ounces as of 5 December. Nymex
registered inventories were unchanged at 531,100
ounces during the first 5 days of the December.
Net long positions held by large non-commercial
market participants rose to 1.36 million ounces on 27
November, the highest level that net long positions
have been at since August 2011. On 2 August 2011,
net long positions had reached 1.72 million ounces.
The increase in net long positions, which were at
892,900 ounces at the end of October, was driven by
a combination of an increase in gross long positions
and a decline in gross short positions. Gross long po-
sitions reached 1.61 million ounces on 27 November,
the highest level since 2 August 2011 when they
were at 1.9 million ounces. Gross shorts also declined
during November, slipping to 252,700 ounces on 27
November from 439,500 ounces at the end of Octo-
ber.
-1,000
-800
-600
-400
-200
0
200
400
600
800
1,000
1,200
1,400
1,600
1,800
2,000
-1,000
-800
-600
-400
-200
0
200
400
600
800
1,000
1,200
1,400
1,600
1,800
2,000
A-95 S-96 M-98 A-99 O-02 M-04 A-05 J-07 J-08 D-09 M-11 O-12
Long
Net Position in Nymex
Short
'000 Ozs
Gross Long and Short Positions of Non-Commercial Positions Nymex Palladium Futures &Options. Weekly Data, Through 27 November 2012
'000 Ozs

6 December 2012 Page 31 Precious Metals Advisory
Palladium Statistical Position
World Palladium Supply and Demand Balance
Thou. Ounces
Palladium Quarterly Average Price Projections
$/Ounce, through Q3 2014
$100
$200
$300
$400
$500
$600
$700
$800
$900
$1,000
$1,100
$100
$200
$300
$400
$500
$600
$700
$800
$900
$1,000
$1,100
1999 2002 2005 2008 2011 2014
Projections
Actual
*Thousand Troy Ounces; Notes: Excludes transitional economies, except as noted. Secondary production statistics exclude toll-refined material. Prices are settlement prices for the active
0
1,000
2,000
3,000
4,000
5,000
6,000
7,000
8,000
9,000
10,000
0
1,000
2,000
3,000
4,000
5,000
6,000
7,000
8,000
9,000
10,000
1976 1981 1986 1991 1996 2001 2006 2011e
Total Supply
Total Demand
Supply 2007 2008 2009 2010 2011e 2012p 2013p
Mine Production
Russia 3,120 2,737 2,686 2,732 2,714 2,671 2,698
South Africa 2,630 2,447 2,443 2,616 2,638 2,348 2,612
Canada 550 513 229 250 503 539 603
United States 423 394 418 382 407 395 397
Others 539 442 550 571 615 630 632
Total 7,262 6,533 6,326 6,551 6,876 6,583 6,941
% Change Year Ago -2.0% -10.0% -3.2% 3.5% 5.0% -4.3% 5.4%
Secondary Supply
Total 1,508 1,585 1,347 1,664 1,730 1,791 1,881
% Change Year Ago 7.2% 5.1% -15.0% 23.5% 4.0% 3.5% 5.0%
Total Supply 8,770 8,118 7,673 8,214 8,607 8,374 8,822
% Change Year Ago -0.5% -7.4% -5.5% 7.1% 4.8% -2.7% 5.4%
Fabrication Demand
Electronics 1,200 1,125 1,095 1,179 1,207 1,243 1,284
Automotive 4,545 4,252 3,960 4,656 4,919 5,338 5,688
Dental 776 775 782 784 782 783 779
Other 1,241 1,285 1,206 1,152 1,137 1,133 1,178
Total Demand 7,762 7,437 7,043 7,771 8,045 8,497 8,929
% Change Year Ago 2.1% -4.2% -5.3% 10.3% 3.5% 5.6% 5.1%
Net Surplus or Deficit 1,007 681 631 444 561 -123 -108
Price Per Ounce YTD
High $389.50 $600.00 $410.00 $804.90 $857.70 $719.75
Low $315.20 $160.30 $176.10 $380.05 $564.15 $561.60
Average $358.28 $352.98 $266.75 $529.11 $733.85 $640.31
% Change Year Ago 10.8% -1.5% -24.4% 98.4% 38.7% -13.5%

6 December 2012 Page 32 Precious Metals Advisory
Rhodium Quarterly Average Price Projections to Q3 2014
$ / Ounce
Rhodium
$0
$500
$1,000
$1,500
$2,000
$2,500
$3,000
$0
$500
$1,000
$1,500
$2,000
$2,500
$3,000
2009 2010 2011 2012 2013 2014
Projections
Actual
0
200
400
600
800
1,000
1,200
1,400
0
200
400
600
800
1,000
1,200
1,400
1976 1981 1986 1991 1996 2001 2006 2011
Thousand Ounces Thousand Ounces
Demand
Supply
Rhodium Supply and Demand
$0
$1,000
$2,000
$3,000
$4,000
$5,000
$6,000
$7,000
$8,000
$9,000
$10,000
$0
$1,000
$2,000
$3,000
$4,000
$5,000
$6,000
$7,000
$8,000
$9,000
$10,000
72 75 78 81 84 87 90 93 96 99 02 05 08 11
$/Oz $/Oz
The Price of RhodiumMonthly Average NY Dealer Price, Through November 2012
Year QuarterQuarterly
AVGChange Annual AVG Change
2012 IV $1,145 -2.0% $1,276 -25.9%
2013 I $1,120 -2.2%
II $1,193 6.5%
III $1,300 9.0%
IV $1,404 8.0% $1,254 -1.7%
2014 I $1,460 4.0%
II $1,387 -5.0%
III $1,360 -2.0%
0
10,000
20,000
30,000
40,000
50,000
60,000
0
10,000
20,000
30,000
40,000
50,000
60,000
May-11 Sep-11 Jan-12 May-12 Sep-12
Rhodium Exchange Traded Product HoldingsDaily, Through 1 December 2012
Ounces Ounces
Note: Metal is stored in the United Kingdom and is the combined holdings of the ETC's two primary listings, the db Physical Rhodium ETC (EUR) traded on the
Xetra and Borse Italiano and the db Physical Rhodium ETC traded on the LSE.
Source: db, Bloomberg

6 December 2012 Page 33 Precious Metals Advisory
Precious Metal Price Table
Quarterly
%
Quarterly
%
Quarterly
%
Quarterly
%
Quarterly
%
Price Change Price Change Price Change Price Change Price Change
2003 I $353 8.8% $4.67 3.1% $654 11.8% $245 -13.6% $608 -11.4%
II $348 -1.4% $4.60 -1.5% $640 -2.1% $171 -30.1% $509 -16.4%
III $364 4.7% $5.02 9.1% $693 8.3% $193 12.8% $497 -2.4%
IV $393 8.0% $5.30 5.5% $766 10.5% $203 5.0% $476 -4.2%
2004 I $409 4.1% $6.72 26.8% $864 12.9% $245 20.6% $598 25.7%
II $394 -3.8% $6.26 -6.8% $830 -4.0% $259 5.9% $773 29.2%
III $403 2.3% $6.51 4.0% $837 0.8% $218 -16.1% $1,030 33.3%
IV $435 8.1% $7.27 11.8% $850 1.6% $210 -3.5% $1,210 17.5%
2005 I $428 -1.6% $7.00 -3.7% $865 1.8% $191 -9.0% $1,448 19.7%
II $429 0.2% $7.17 2.4% $873 0.9% $193 0.9% $1,567 8.2%
III $441 2.8% $7.10 -1.0% $899 3.0% $189 -1.8% $2,058 31.3%
IV $487 10.5% $8.11 14.2% $962 6.9% $243 28.6% $2,795 35.8%
2006 I $556 14.3% $9.74 20.1% $1,042 8.4% $295 21.2% $3,355 20.0%
II $630 13.2% $12.26 25.9% $1,189 14.0% $350 18.6% $4,655 38.7%
III $623 -1.2% $11.72 -4.5% $1,223 2.9% $326 -6.7% $4,531 -2.7%
IV $608 -2.3% $12.68 8.2% $1,130 -7.6% $325 -0.5% $4,896 8.1%
2007 I $652 7.2% $13.36 5.4% $1,198 6.0% $347 6.9% $5,762 17.7%
II $671 2.8% $13.37 0.1% $1,298 8.4% $372 7.1% $5,990 4.0%
III $684 2.0% $12.80 -4.3% $1,301 0.2% $352 -5.5% $6,006 0.3%
IV $794 16.0% $14.33 12.0% $1,457 12.0% $365 3.9% $6,463 7.6%
2008 I $928 17.0% $11.79 -17.8% $1,889 29.6% $451 23.5% $8,069 24.9%
II $898 -3.2% $17.20 45.9% $2,037 7.9% $449 -0.5% $9,275 14.9%
III $870 -3.2% $14.97 -13.0% $1,532 -24.8% $328 -27.0% $6,277 -32.3%
IV $795 -8.6% $10.18 -32.0% $871 -43.2% $192 -41.4% $1,424 -77.3%
2009 I $910 14.5% $12.64 24.1% $1,030 18.3% $201 4.4% $1,060 -25.6%
II $924 1.5% $13.75 8.9% $1,179 14.4% $236 17.6% $1,283 21.0%
III $962 4.1% $14.77 0.4% $1,239 5.2% $276 16.8% $1,523 18.7%
IV $1,101 14.4% $17.58 19.0% $1,400 13.0% $351 27.5% $2,045 34.3%
2010 I $1,110 0.9% $16.92 -3.7% $1,562 11.6% $441 25.4% $2,440 19.3%
II $1,197 7.9% $18.36 8.5% $1,634 4.6% $496 12.5% $2,592 6.2%
III $1,228 2.5% $19.00 3.5% $1,556 -4.8% $496 0.1% $2,204 -15.0%
IV $1,369 11.5% $25.59 34.7% $1,701 9.3% $679 36.8% $2,329 5.7%
2011 I $1,386 1.2% $31.74 24.0% $1,797 5.6% $793 16.8% $2,436 4.6%
II $1,507 8.7% $38.42 21.1% $1,788 -0.5% $761 -4.0% $2,179 -10.6%
III $1,700 12.8% $38.86 1.1% $1,774 -0.7% $755 -0.8% $1,894 -13.1%
IV $1,686 -0.8% $31.84 -18.0% $1,534 -13.5% $631 -16.3% $1,588 -16.1%
2012p I $1,693 0.4% $32.72 2.8% $1,613 5.1% $685 8.5% $1,462 -8.0%
II $1,622 -4.2% $29.47 -10.0% $1,503 -6.9% $629 -8.1% $1,328 -9.2%
III $1,657 2.1% $30.08 2.1% $1,505 0.2% $615 -2.3% $1,168 -12.0%
IV $1,726 4.2% $32.99 9.7% $1,604 6.5% $640 4.1% $1,145 -2.0%
2013p I $1,718 -0.4% $33.28 0.9% $1,615 0.7% $632 -1.3% $1,120 -2.2%
II $1,667 -3.0% $30.62 -8.0% $1,567 -3.0% $638 1.0% $1,193 6.5%
III $1,608 -3.5% $29.40 -4.0% $1,527 -2.5% $625 -2.0% $1,300 9.0%
IV $1,641 2.0% $30.28 3.0% $1,634 7.0% $678 8.5% $1,404 8.0%
2014p I $1,673 2.0% $31.49 4.0% $1,693 3.6% $722 6.4% $1,460 4.0%
II $1,623 -3.0% $31.17 -1.0% $1,719 1.5% $738 2.2% $1,387 -5.0%
III $1,599 -1.5% $29.30 -6.0% $1,658 -3.5% $710 -3.7% $1,360 -2.0%
Rhodium
Yr Q
Gold Silver Platinum Palladium
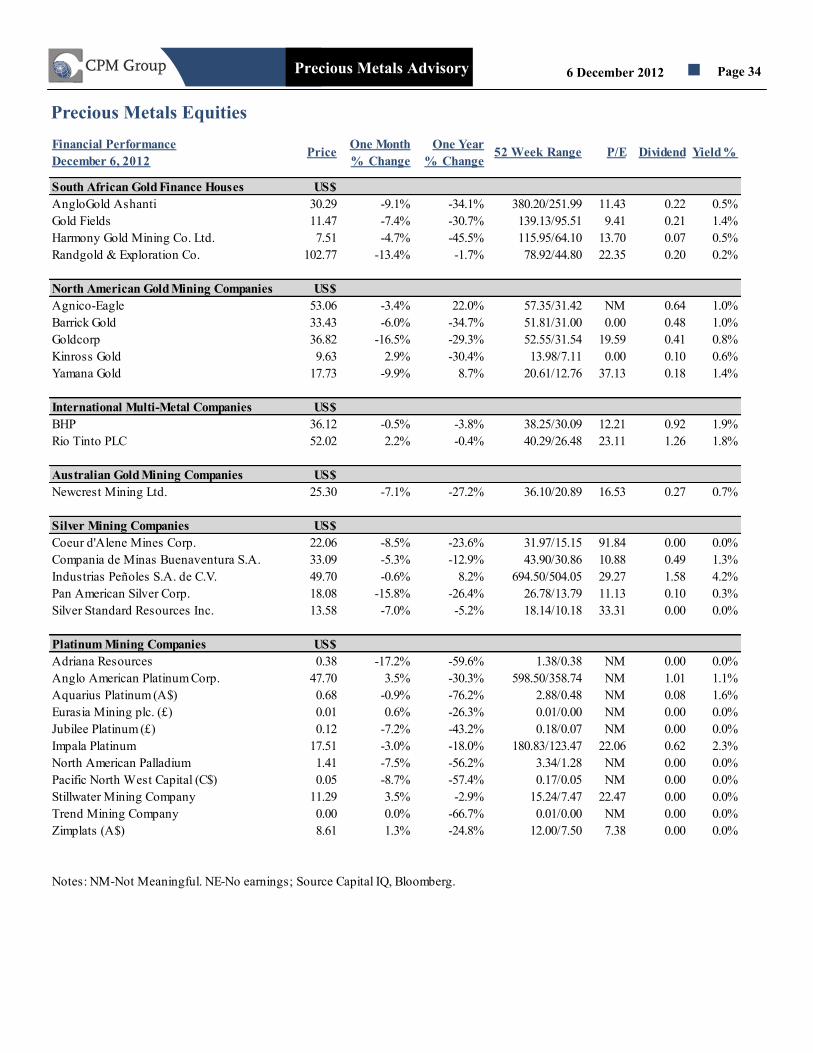
6 December 2012 Page 34 Precious Metals Advisory
Precious Metals Equities
Financial Performance
December 6, 2012Price
One Month
% Change
One Year
% Change52 Week Range P/E Dividend Yield %
South African Gold Finance Houses US$
AngloGold Ashanti 30.29 -9.1% -34.1% 380.20/251.99 11.43 0.22 0.5%
Gold Fields 11.47 -7.4% -30.7% 139.13/95.51 9.41 0.21 1.4%
Harmony Gold Mining Co. Ltd. 7.51 -4.7% -45.5% 115.95/64.10 13.70 0.07 0.5%
Randgold & Exploration Co. 102.77 -13.4% -1.7% 78.92/44.80 22.35 0.20 0.2%
North American Gold Mining Companies US$
Agnico-Eagle 53.06 -3.4% 22.0% 57.35/31.42 NM 0.64 1.0%
Barrick Gold 33.43 -6.0% -34.7% 51.81/31.00 0.00 0.48 1.0%
Goldcorp 36.82 -16.5% -29.3% 52.55/31.54 19.59 0.41 0.8%
Kinross Gold 9.63 2.9% -30.4% 13.98/7.11 0.00 0.10 0.6%
Yamana Gold 17.73 -9.9% 8.7% 20.61/12.76 37.13 0.18 1.4%
International Multi-Metal Companies US$
BHP 36.12 -0.5% -3.8% 38.25/30.09 12.21 0.92 1.9%
Rio Tinto PLC 52.02 2.2% -0.4% 40.29/26.48 23.11 1.26 1.8%
Australian Gold Mining Companies US$
Newcrest Mining Ltd. 25.30 -7.1% -27.2% 36.10/20.89 16.53 0.27 0.7%
Silver Mining Companies US$
Coeur d'Alene Mines Corp. 22.06 -8.5% -23.6% 31.97/15.15 91.84 0.00 0.0%
Compania de Minas Buenaventura S.A. 33.09 -5.3% -12.9% 43.90/30.86 10.88 0.49 1.3%
Industrias Peñoles S.A. de C.V. 49.70 -0.6% 8.2% 694.50/504.05 29.27 1.58 4.2%
Pan American Silver Corp. 18.08 -15.8% -26.4% 26.78/13.79 11.13 0.10 0.3%
Silver Standard Resources Inc. 13.58 -7.0% -5.2% 18.14/10.18 33.31 0.00 0.0%
Platinum Mining Companies US$
Adriana Resources 0.38 -17.2% -59.6% 1.38/0.38 NM 0.00 0.0%
Anglo American Platinum Corp. 47.70 3.5% -30.3% 598.50/358.74 NM 1.01 1.1%
Aquarius Platinum (A$) 0.68 -0.9% -76.2% 2.88/0.48 NM 0.08 1.6%
Eurasia Mining plc. (£) 0.01 0.6% -26.3% 0.01/0.00 NM 0.00 0.0%
Jubilee Platinum (£) 0.12 -7.2% -43.2% 0.18/0.07 NM 0.00 0.0%
Impala Platinum 17.51 -3.0% -18.0% 180.83/123.47 22.06 0.62 2.3%
North American Palladium 1.41 -7.5% -56.2% 3.34/1.28 NM 0.00 0.0%
Pacific North West Capital (C$) 0.05 -8.7% -57.4% 0.17/0.05 NM 0.00 0.0%
Stillwater Mining Company 11.29 3.5% -2.9% 15.24/7.47 22.47 0.00 0.0%
Trend Mining Company 0.00 0.0% -66.7% 0.01/0.00 NM 0.00 0.0%
Zimplats (A$) 8.61 1.3% -24.8% 12.00/7.50 7.38 0.00 0.0%
Notes: NM-Not Meaningful. NE-No earnings; Source Capital IQ, Bloomberg.
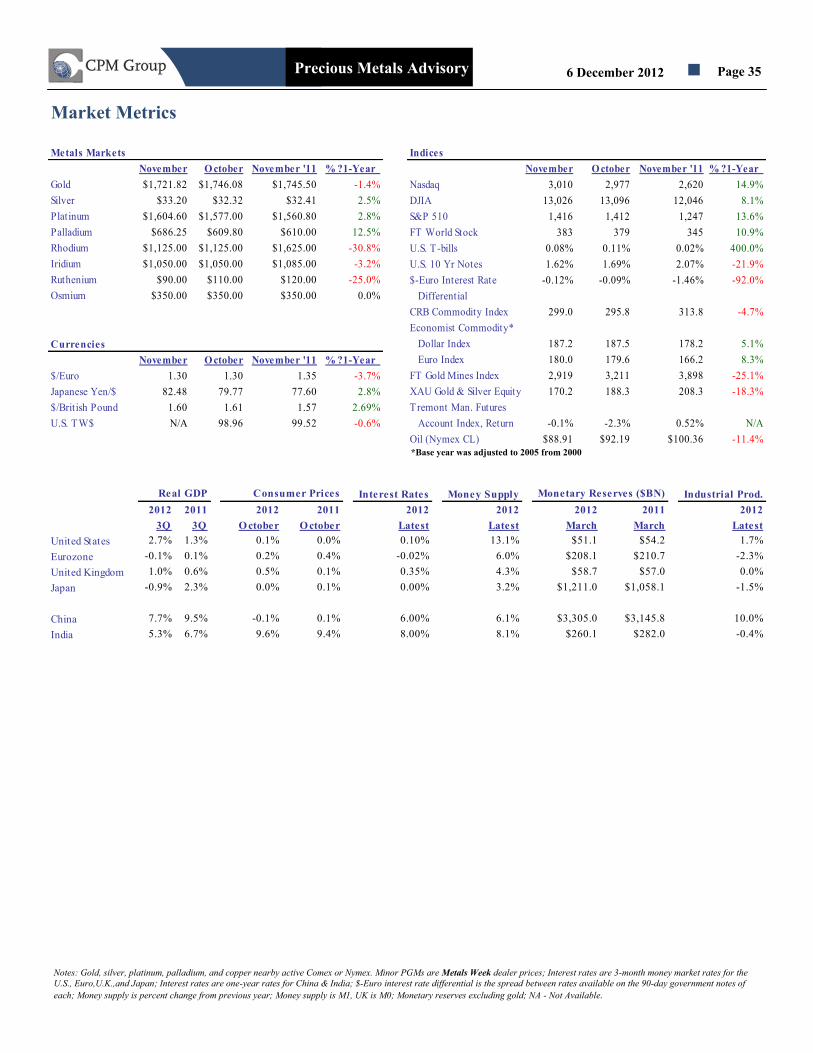
6 December 2012 Page 35 Precious Metals Advisory
Market Metrics
Notes: Gold, silver, platinum, palladium, and copper nearby active Comex or Nymex. Minor PGMs are Metals Week dealer prices; Interest rates are 3-month money market rates for the
U.S., Euro,U.K.,and Japan; Interest rates are one-year rates for China & India; $-Euro interest rate differential is the spread between rates available on the 90-day government notes of
each; Money supply is percent change from previous year; Money supply is M1, UK is M0; Monetary reserves excluding gold; NA - Not Available.
Metals Markets
November O ctober November '11 % ?1-Year
Gold $1,721.82 $1,746.08 $1,745.50 -1.4%
Silver $33.20 $32.32 $32.41 2.5%
Platinum $1,604.60 $1,577.00 $1,560.80 2.8%
Palladium $686.25 $609.80 $610.00 12.5%
Rhodium $1,125.00 $1,125.00 $1,625.00 -30.8%
Iridium $1,050.00 $1,050.00 $1,085.00 -3.2%
Ruthenium $90.00 $110.00 $120.00 -25.0%
Osmium $350.00 $350.00 $350.00 0.0%
Currencies
November October November '11 % ?1-Year
$/Euro 1.30 1.30 1.35 -3.7%
Japanese Yen/$ 82.48 79.77 77.60 2.8%
$/British Pound 1.60 1.61 1.57 2.69%
U.S. TW$ N/A 98.96 99.52 -0.6%
Interest Rates Money Supply Industrial Prod.
2012 2011 2012 2011 2012 2012 2012 2011 2012
3Q 3Q October O ctober Latest Latest March March Latest
United States 2.7% 1.3% 0.1% 0.0% 0.10% 13.1% $51.1 $54.2 1.7%
Eurozone -0.1% 0.1% 0.2% 0.4% -0.02% 6.0% $208.1 $210.7 -2.3%
United Kingdom 1.0% 0.6% 0.5% 0.1% 0.35% 4.3% $58.7 $57.0 0.0%
Japan -0.9% 2.3% 0.0% 0.1% 0.00% 3.2% $1,211.0 $1,058.1 -1.5%
China 7.7% 9.5% -0.1% 0.1% 6.00% 6.1% $3,305.0 $3,145.8 10.0%
India 5.3% 6.7% 9.6% 9.4% 8.00% 8.1% $260.1 $282.0 -0.4%
Monetary Reserves ($BN)Consumer PricesReal GDP
Indices
November O ctober November '11 % ?1-Year
Nasdaq 3,010 2,977 2,620 14.9%
DJIA 13,026 13,096 12,046 8.1%
S&P 510 1,416 1,412 1,247 13.6%
FT World Stock 383 379 345 10.9%
U.S. T-bills 0.08% 0.11% 0.02% 400.0%
U.S. 10 Yr Notes 1.62% 1.69% 2.07% -21.9%
$-Euro Interest Rate -0.12% -0.09% -1.46% -92.0%
Differential
CRB Commodity Index 299.0 295.8 313.8 -4.7%
Economist Commodity*
Dollar Index 187.2 187.5 178.2 5.1%
Euro Index 180.0 179.6 166.2 8.3%
FT Gold Mines Index 2,919 3,211 3,898 -25.1%
XAU Gold & Silver Equity 170.2 188.3 208.3 -18.3%
Tremont Man. Futures
Account Index, Return -0.1% -2.3% 0.52% N/A
Oil (Nymex CL) $88.91 $92.19 $100.36 -11.4%
*Base year was adjusted to 2005 from 2000
Related Documents