Cow or Goat? Population pressure and livestock keeping in Burundi Sam Desiere 1 , Sanctus Niragira, Marijke D’Haese 1 , Wytse Vellema 1* Department of Agricultural economics, Ghent University, Belgium *Presenting author: [email protected] Abstract Livestock contributes significantly to peoples’ livelihoods in developing countries. Yet, most studies focus on dairy cattle, overlooking the fact that many smallholder farmers in mixed-cropping systems prefer to keep goats, sheep, pigs or poultry rather than cattle. For this paper we applied a multivariate probit model to a unique dataset from a national, representative, agricultural survey in Burundi, to estimate the determinants of livestock keeping. We found that wealthier households keep more livestock, but that population density and access to markets are also key determinants. Moreover, in densely populated regions, even the wealthiest households prefer smaller animals to cattle, as the pressure on land is high and access to pastures is limited. This has important policy implications as it raises questions as to whether the focus on dairy cattle, which has been adopted in most NGO and governmental development programs in Sub-Saharan Africa, is justified. Keywords: livestock, cattle, smallholders, agricultural policy, Burundi

Welcome message from author
This document is posted to help you gain knowledge. Please leave a comment to let me know what you think about it! Share it to your friends and learn new things together.
Transcript
Cow or Goat? Population pressure and livestock keeping in Burundi Sam Desiere1, Sanctus Niragira, Marijke D’Haese1, Wytse Vellema1*
Department of Agricultural economics, Ghent University, Belgium
*Presenting author: [email protected]
Abstract
Livestock contributes significantly to peoples’ livelihoods in developing countries. Yet, most studies
focus on dairy cattle, overlooking the fact that many smallholder farmers in mixed-cropping systems
prefer to keep goats, sheep, pigs or poultry rather than cattle. For this paper we applied a multivariate
probit model to a unique dataset from a national, representative, agricultural survey in Burundi, to
estimate the determinants of livestock keeping. We found that wealthier households keep more
livestock, but that population density and access to markets are also key determinants. Moreover, in
densely populated regions, even the wealthiest households prefer smaller animals to cattle, as the
pressure on land is high and access to pastures is limited. This has important policy implications as it
raises questions as to whether the focus on dairy cattle, which has been adopted in most NGO and
governmental development programs in Sub-Saharan Africa, is justified.
Keywords: livestock, cattle, smallholders, agricultural policy, Burundi

1. Introduction
Livestock contributes significantly to the livelihoods of many smallholder farmers in developing
countries. The many benefits of livestock keeping in these agrarian societies are well-known and
well-documented. Apart from producing eggs, milk and/or meat, livestock plays an important role
as a saving, financing and insurance device, provides manure and draught power and is a display
of status (Herrero, Thornton, Gerber, & Reid, 2009; Moll, 2005; Randolph et al., 2007). Many
studies have emphasized the important role of livestock as a way to accumulate wealth and to
insure against risk in societies where the credit markets do not function well (Dercon, 1998; Doran,
Low, & Kemp, 1979; Turner & Williams, 2002).
The majority of work in the socio-economic literature on livestock keeping focuses on
cattle. This is understandable when studying pastoralist societies, where cattle is the main source
of wealth and income. Yet, even studies in regions where mixed farming systems predominate,
such as Sub-Saharan Africa, focus mainly on (dairy) cattle and largely neglect the role of smaller
animals (De Vries, 2008; Dolberg, 2001; Lammers, Carlson, Zdorkowski, & Honeyman, 2009).
This bias towards cattle also exists in government and NGO programs which frequently contain
cattle donation or crossbreeding components, but rarely encourage the keeping of small livestock.
Many studies and policies implicitly assume that cattle rearing is more profitable than keeping
smaller animals. A similar assumption is conveyed in the concept of the ‘livestock ladder’ which
assumes that households start by investing in small stock and gradually, as they acquire wealth,
invest in cattle (Maass et al., 2013; Perry, 2002; Todd, 1998). The implicit assumption is that the
only (or main) reason why farmers do not invest in cattle is that they lack the resources to do so.
This leads to programs that focus on donating cattle, or setting up micro-credit programs in order
to acquire cattle. Yet, rational households are likely to consider the profitability of any investment
in livestock before making such an investment. We argue that the expected return on livestock is
likely to depend on local environmental conditions, such as population density, rainfall and market
access. For instance, goats are less demanding than cattle in terms of forage because they digest
roughage more efficiently and can survive on marginal lands (C Devendra, 2007). Households in
densely populated regions might therefore prefer to keep goats instead of cattle, since the pressure
on land in such areas is high and access to forage is limited. We can also expect market access to
play a key role, as livestock, and especially cattle, are mainly reared to sell on local markets. For
example, a study in Ethiopia found that 75% of cattle production occurred within a distance of 5
hours’ travel time to the main markets, while sheep and goat production was less centered around
these main markets (Tilahun & Schmidt, 2012).
In this paper, we provide evidence to support the argument that, even if households have
the necessary means to invest in cattle, they consider the profitability of the investment beforehand.
Based on a unique dataset from Burundi, we show that, besides wealth, population density and
market access are important determinants in the choice between investing in cattle, ruminants or
small livestock, such as poultry or guinea pigs. This has important policy implications. It raises
questions about current rural development strategies that focus on dairy cattle and suggests that
encouraging keeping smaller animals, which are more suited to local, adverse conditions, might
be more cost-effective in densely populated regions in Sub-Saharan Africa in general, and more
particularly in Burundi.
In the next section we briefly describe the role of livestock in the agricultural system of
Burundi. We then describe our dataset, discuss its weaknesses and strengths and provide more
details about the secondary datasets, for rainfall and population densities, which played a key role
in our study. Before presenting the results we discuss the methodology, which uses a multivariate
probit model. In the conclusions we highlight some important policy recommendations.
2. Livestock in Burundi
Cattle keeping has been an important activity for a long time in Burundi. In pre-colonial times, the
status of different tribes and kingdoms was measured in terms of the size of their herds of Ankole
cattle, which symbolized power and wealth (Ndumu et al., 2008). In more recent times, cattle has
remained an important symbol distinguishing Tutsi from Hutu. Tutsi, who were wealthier
pastoralists, migrated with their herds to Burundi from the north in the fifteenth and sixteenth

centuries, while Hutu, probably from central Africa, were poorer farmers (Maguire, 1995; Uvin,
1999). Goats, sheep, pigs, poultry, rabbits and guinea pigs were introduced into their farming
systems later. The ease of caring for these animals, their size, and rapid reproduction, along with
the declining availability of fodder and grazing lands mean that small livestock are now the most
important animals on small farms. In addition, it is easy to market them and they provide meat for
household consumption whenever needed.
Cattle populations in Burundi are mainly dominated by pure breeds of Ankole/Zebu cattle
or crosses with seven breeds: Ankole, Ayrshire, Brown Swiss, Friesian, Guernsey, Montbeliard
and Sahiwal (Hatungumukama, Hornick, & Detilleux, 2007). The Ankole breed accounts for more
than 90% of the cattle population of Burundi, but it is difficult to determine the degree of crossing
(Ndumu et al., 2008). Traditionally, this variety was treated as sacred by farmers and the cows
were kept for milk production and rarely for their meat (Wurzinger et al., 2006). The Ankole is the
result of natural selection and is able to survive and reproduce under stressful conditions. It is
tolerant to ticks and has a high resistance against theileriosis (a common cattle disease locally).
Moreover, it can withstand severe drought and survive on low-quality feed (Ndumu et al., 2008).
However, its milk productivity (1.8 l/day) is low (Grimaud, Mpairwe, Chalimbaud, Messad, &
Faye, 2007).
Cattle play an important economic and social role in Burundian society. Milk and meat are
an important part of the Burundian diet but there is a shortage of both items so they are generally
only available to the wealthiest households. In addition, the skins of cattle are used to manufacture
leather goods and the horns are used to make traditional musical instruments (Idono). Given the
shortage and high price of chemical fertilizers, livestock is considered to be the most efficient way
to maintain fertility on the doubled-cropped plots (Cochet, 1996). Typically, half of the manure is
recovered in nocturnal animal holdings where the dung is collected each morning and later
transported and ploughed into the fields. Cattle are also the principal form of capital accumulation
and are sold when larger expenses need to be covered (Cochet, 2004), for example in September
when school fees need to be paid. Cattle also provide a farmer with social prestige and economic

power over poorer farmers with few or no livestock who are obliged to exchange their labor for
cows (ubugabire) and/or their produce, such as dung and milk. Finally, the cow also plays a role
in building social networks through dowry practices, although this custom is currently diminishing
due to decreasing cattle stocks.
The reduction, degradation and overexploitation of natural pastures are major impediments
on cattle rearing in Burundi (Hatungumukama et al., 2007). In densely populated areas the natural
communal pastures have almost completely disappeared. In other areas the pastures are gradually
shifting to more marginalized land with poor soils. Many farmers try to overcome the limited
access to animal feed and biomass, but zero-grazing systems remain very rare in Burundi.
Nevertheless, rational management of pastures, forage installation and the use of agricultural
residues can help farmers to partially overcome the deficit of animal feed. During the dry season,
from July to August, when feed is a critical constraint, cattle is fed on conserved fodder (silage
and hay) (Maass, Musale, Chiuri, Gassner, & Peters, 2012). However, there is competition for this
biomass, which is also often used as organic fertilizer. For instance, cereal stems and banana leaves
are also used for mulching coffee and crop residues from legumes are buried during plowing or
composted to fertilize the fields. Meanwhile, the low revenue of smallholder farmers means they
cannot afford commercial feed concentrates, which are very rare in Burundi. As a result most
livestock is left on poor pastures and receives limited or no feed supplements.
The reduction in feed availability has greatly reduced cattle stocks in recent decades.
Compere and Huhn (1975) identified 756,000 cattle in 1968, a figure that decreased to 479,000 in
1987 and 346,341 in 1996 (République du Burundi, 1997).This decline in cattle numbers was
largely due to the reduction and loss of natural pastures that came about as a result of population
growth. Cattle has been progressively abandoned in favor of small stock, better adapted to the
available pasture (Hatungumukama et al., 2007). The civil war that started in 1993 accelerated the
decrease of the dairy cattle population. Many animals were sold and slaughtered due to the general
insecurity, and the theft and pillage of livestock that were rife at the time. Some farmers migrated
with their herds to neighboring countries (Bundervoet, 2010). Recently, new livestock
rehabilitation programs have tried to revitalize the sector by encouraging households to return to
(or take up) cattle rearing (République du Burundi, 2011).
The availability of data about livestock in Burundi is still very limited. A few studies have
been carried out on livestock selling prices, marketing channels, consumers, and the different
factors that influence livestock markets. In general, the marketing system is very complex,
involving farmers, traders, wholesalers, butchers and retailers. Livestock products can be found at
many local markets and there are specific livestock markets where live animals are sold. These
livestock markets are held in every province and the sellers often have to travel long distances to
get to them. Most markets are held once a week and specialize in specific animals. In contrast with
cattle, small stock is often also traded within villages.
Against this background this paper seeks to compare the roles of smaller livestock and
cattle. We investigate the determinants behind investing in livestock and hypothesize that local,
environmental constraints play a role. As explained above, high population densities, in some areas
more than 600 persons/km², are a particular challenge to livestock keeping in Burundi.
3. Material and methods
3.1. Empirical framework
Households in Burundi can choose to invest in different groups of animals. We distinguish three
groups of livestock: cattle (TLU1= 0.70), sheep, goats and pigs (TLU below 0.2) and small
livestock such as chickens, rabbits, guinea pigs and ducks (TLU=0.01). These investment choices
are not mutually exclusive: many households keep more than one type of livestock. These choices
will depend on both the profitability of the investment and the household’s wealth. Consequently,
we hypothesize that even if a household is sufficiently wealthy to acquire livestock, it will only do
so if it sees this as a profitable investment. Hence, our model consists of three binary choices, 𝑦𝑖𝑗
1
Tropical Livestock Unit
(investment in cattle, ruminants/pigs and small livestock) which are determined by the local
environment, 𝐸𝑖, and by households’ wealth, 𝑋𝑖.
𝑦𝑖𝑗 = 1 𝑖𝑓 𝛼𝐸𝑖 + 𝛽𝑋𝑖 + 𝜖𝑖𝑗 > 0 (𝑗 = 1,2,3)
0, 𝑜𝑡ℎ𝑒𝑟𝑤𝑖𝑠𝑒
Where 𝑖 indicates the household, 𝑗 the choice variable and (𝜖1𝜖2𝜖3) represents the distribution of
the errors and follows the trivariate standard normal distribution, 𝑁(0, 𝛴), with Σ being the
covariance of the error terms.
It is likely that the errors will be correlated because of omitted or unobservable variables
that contribute to explaining different investment choices. For instance, a household that is faced
with an unexpected adverse shock might decide to sell all its livestock. In consequence, estimating
the three equations separately with probit or logit models would result in inefficient estimations
that would not capture the interdependencies between the equations. To avoid this the three
equations were simultaneously estimated, using a multivariate probit model. This approach is quite
similar to the well-known Seemingly Unrelated Regression (SUR) models, the only difference
being that the dependent variable is binary, rather than continuous (Greene, 2003). However, the
estimations are computationally complex and require multidimensional integration. We followed
the approach proposed by Cappellari and Jenkins (2003), based on the popular Geweke–
Hajivassiliou–Keane (GHK) simulator, which has been implemented in the statistical software,
Stata, by the same authors.
The multivariate probit model only allowed us to model the three binary choices related to
investment in livestock, but could not take into consideration the possibility that a household might
decide to buy several cows, goats or chickens. At first sight, this could be considered a weakness
in our approach but, as we will show in the descriptive analysis, few households keep more than
one cow, and even the number of goats and chickens is limited. In addition, our estimations will
be less susceptible to measurement error because it is unlikely that the households incorrectly
report keeping livestock (a question with yes/no-response), whereas the number of animals (open
question with a continuous range) might be more prone to measurement error, especially for
smaller animals.
To check for robustness, the analyses were repeated with ‘hurdle models’ which take into
consideration the number of animals kept by households. These count models consist of two parts:
the first part uses a logit or probit model to explain the decision to invest in livestock, while the
second part uses a binomial count model to explain the number of animals kept by households
(Loeys, Moerkerke, De Smet, & Buysse, 2012). The results of these tests were consistent with
those from the multivariate probit model (and, while not reported on here, are available upon
request).
In order to evaluate the importance of profitability on the decision over whether or not to
invest in livestock, we needed variables that determine the profitability of cattle rearing in a
particular context, that are not directly controlled by the household. We considered population
density, rainfall and access to markets as the most important exogenous variables influencing the
profitability of cattle rearing. A high population density increases the pressure on land and thus
reduces the availability of communal land for grazing and fodder production. Malnourished
animals are likely to be less profitable because of lower milk production, slow weight gain, a
slower rate of reproduction and a higher risk of premature death. Cattle are more vulnerable to
adverse local conditions than other livestock (C Devendra, 2007). Consequently, a higher human
population density is likely to reduce the probability of investing in cattle. Similarly, we also
expected regions with low rainfall or recurrent droughts to have less cattle than regions with
adequate rainfall. Finally, since cattle are primarily raised to be sold, we also expected access to
markets to influence profitability. We use two proxies for market access: the distance between the
nearest provincial road and the village (more or less than 5km) and the distance of the farm from
the capital.
Burundi contains 11 agro-ecological zones, ranging from plains to mountains (République
du Burundi, 2013). The differences between these regions might partially explain the profitability
of livestock rearing and we therefore included regional dummies in the model. Hence, we
examined whether differences in population density, rainfall and distance to the capital within
these regions influence livestock keeping.
We expected wealthier households to keep more livestock in general, and cattle in
particular, for two reasons. First, because nearly all households in Burundi face credit constraints2,
and only the richer households will be able to make the lump-sum investment required to buy cattle
(Dercon & Krishnan, 1996). Second, richer households are more likely to need a saving device
because they are more likely to regularly make profits and there are limited alternative investment
opportunities. Land markets, for instance, are poorly developed and the buying, selling or leasing
of land is exceptional, and not a viable alternative to investing in cattle. We use land as the main
proxy for wealth, because land is the most important asset in Burundi, mostly handed down from
father to son. Burundi’s cultivated land has been carefully measured with GPS and is likely to be
less prone to measurement error than total agricultural production, an obvious alternative choice
as a proxy for wealth. The main disadvantage of using land as a proxy is that land ownership might
have a direct impact on the profitability of cattle rearing, since households with more land might
use it for grazing or to produce fodder. However, it is, difficult to come up with a good proxy for
wealth that is not correlated with the profitability of livestock keeping. As a second indicator of
wealth, we included a variable of whether the households had bought fertilizer in the previous
year. Fertilizers are rather expensive in Burundi and only richer households can afford them
(République du Burundi, 2013). We used a third indicator of wealth: a variable that indicated the
gender of the household head. Female household heads are generally widows and considerably
poorer, due to the absence of a male breadwinner. Finally, two more household characteristics are
also included in the regression: the age of the household head and the size of the household.
2
Less than 10% of the households in our sample reported having taken out a loan in the three years prior to the survey.
3.2. Data
We used data from a national representative agricultural survey of 2560 households conducted in
2011/2012 by the Statistical Office and the Ministry of Agriculture of Burundi, which was
financially supported by the Belgian Technical Cooperation and the World Bank. This was the
first nationally representative agricultural survey in Burundi since the 1970s. Its main purpose was
to update agricultural statistics and to provide reliable production figures at the provincial level.
A two-stage stratified design was adopted to randomly select households. First, 20 sectors3
were randomly selected within each of the 16 rural provinces4. Within each sector, all the
households were enumerated and 8 households were randomly selected to participate in the survey.
Details of the sampling procedure can be found in a government report on this agricultural survey
(République du Burundi, 2013).
The survey contained 14 sections with questions related to agricultural production and the
socio-economic status of the household. Detailed information was collected on the number of
animals kept, sold, bought and consumed during the previous year. Unfortunately, no information
was collected on the production of milk or eggs, nor on the inputs required to feed the animals or
expenses for veterinary services. Eight households were discarded from the dataset due to missing
variables.
We complemented this dataset with secondary sources detailing population density and
rainfall. A national population census was conducted in 2008 by the Government of Burundi,
which enabled us to calculate population density at the communal level (République du Burundi,
2010). Our sample consisted of 126 communes. The disaggregation of population density at
communal levels allowed us to examine whether differences in population densities within regions
have an influence on households’ livestock investment decisions. The IGEBU, the Geographical
3
The sectors, known as Zones Dénombrements (ZD), represent relatively small geographical administrative units that include several villages.
ZDs in predominately urban areas were excluded from the survey. 4
The province of Bujumbura Mairie was excluded because it is dominated by the capital Bujumbura and can be considered an urban region.
Institute of Burundi, collects rainfall data but only at the provincial level, as Burundi has only a
few weather stations.
4. Results
4.1. Descriptive statistics
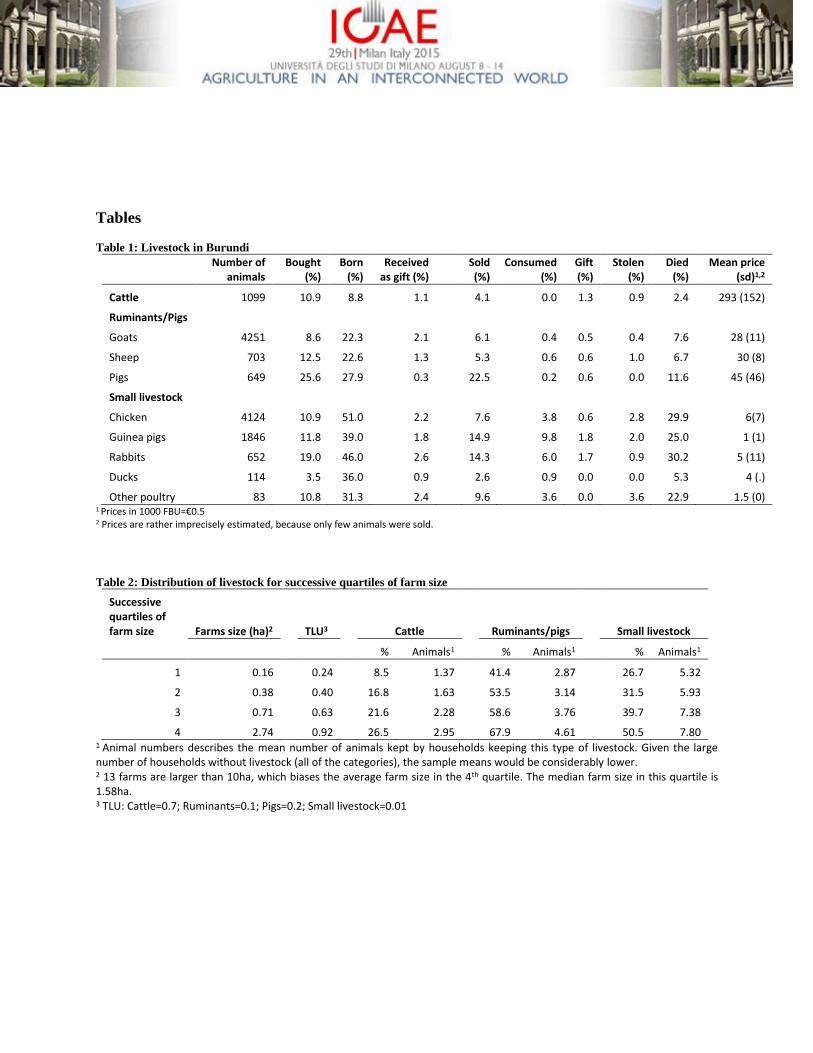
Table 1 shows the total number of animals kept by households at the time of the interviews. Goats
were clearly the most popular form of livestock, followed by chickens, guinea pigs and cattle. In
general, very few animals were consumed. For instance, none of the households reported having
slaughtered and consumed a cow in the previous year and only 10% of the total stock of guinea
pigs was slaughtered. However, the death rate among most animals was rather high and the
households might have consumed these animals, although we have no evidence for this. More
animals are sold than domestically consumed, which confirms that livestock is primarily
considered as an investment and is not intended for household consumption. The two most
important reasons for selling livestock mentioned during the interviews were the urgent need to
take care of a family member and to buy food in times of shortages. This confirms the hypothesis
that cattle is an instrument for saving and insurance. Very few animals were given away as gifts,
which suggests that livestock now plays a less important ceremonial role in Burundi than in the
past. Trade in livestock seems to be relatively rare for most animals. Only between 5% and 10%
of total stock changed hands in the previous year.
Table 1 also shows the average price that households received when selling livestock. Note
that these prices are relatively imprecisely estimated because only few animals were sold but the
prices were verified as realistic by key-informants. Cattle are more than eight times as expensive
as sheep, goats and pigs, which in turn are nearly five times more expensive than chickens or
rabbits. The average price was 293,000 FBU ($200) per cow, which is a considerable amount in
relation to the average per capita income, which is estimated at around $600 per capita at
purchasing power parities (IMF, 2013).

In the next analysis we group livestock into three categories: cattle, ruminants/pigs (which
includes sheep, goats and pigs) and small livestock (which includes poultry, rabbits and guinea
pigs). This simplifies the analyses, but is in line with FAO recommendations which attribute
similar weights to these animals when calculating Tropical Livestock Units (Chilonda & Otte,
2006). In addition, as shown in table 1, livestock in each of these categories attracted a similar
market price.
Table 2 shows the distribution of livestock for successive quartiles of farm size. The
median farm size is 0.51 ha and the average size of the 25% poorest households’ farms (first
quartile) is less than 0.2 ha. This is extremely small by global standards, but in line with
neighboring countries, such as Rwanda (Ali & Deininger, 2014). It confirms the extremely high
pressure on land. As expected, the likelihood of keeping livestock clearly increases with farm size.
Ruminants, in particular goats, are the most common livestock type, kept by more than 50% of
households, followed by small livestock and cattle. The likelihood of keeping animals and the
number of animals kept also increases with farm size. Hence, richer households are not only more
likely than poorer households to keep livestock, but also to keep more animals. However, even the
wealthiest households tend to have relatively few animals. For instance, the richest households
with cattle keep, on average, less than 3 animals. Even the numbers of small livestock are limited:
households that keep small livestock (mostly poultry and guinea pigs) have between 5 and 8
animals on average.
4.2. Multivariate probit model
The results of the multivariate probit model explaining households’ decisions to invest in cattle,
ruminants and small livestock are shown in table 3. As explained in the methodological section,
we made a distinction between the variables that are a proxy for wealth and those that determine
the profitability of the investment. However, interpreting the estimated coefficient of the probit
models is not always straightforward. To facilitate their interpretation and gauge the impact of the

explanatory variables on investments in livestock, the model was used to predict the probabilities
of keeping livestock as functions of variables of interests, presented in figures 1 to 3.
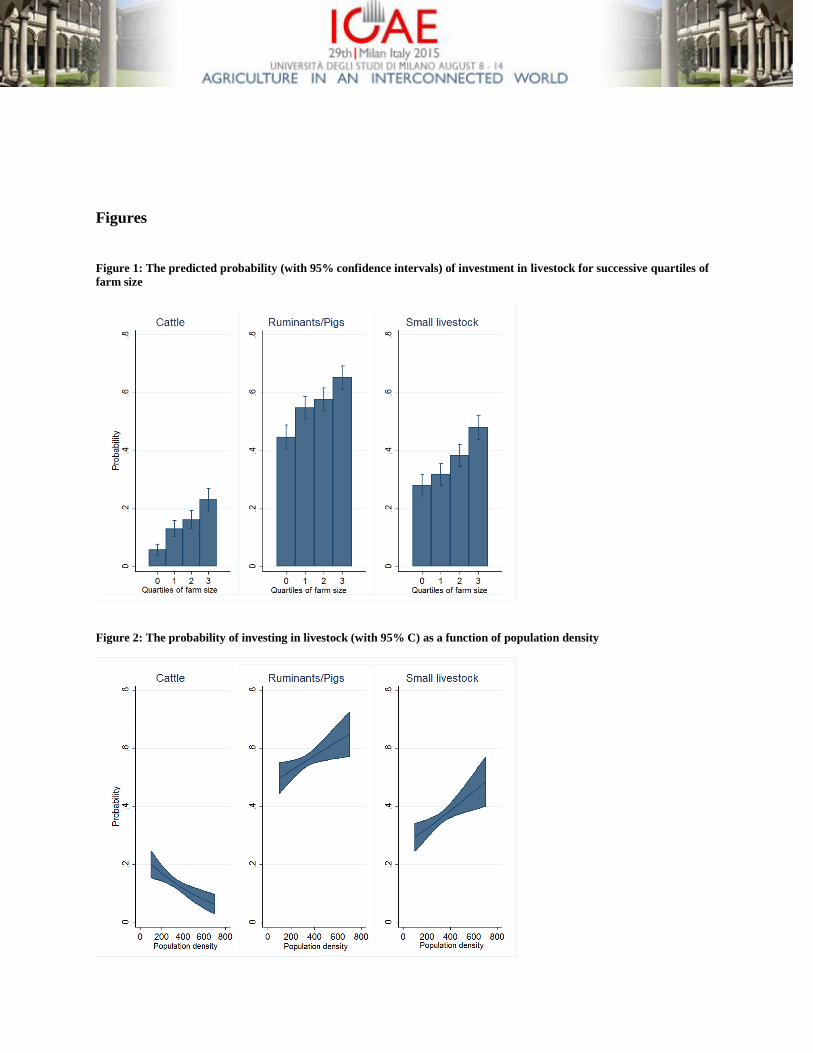
Overall, the model confirms that wealthier households, those with more land or the ability
to access fertilizers are more likely to keep livestock and female headed households are less likely
to own livestock. However, as can be seen from figure 1, the probability of keeping livestock does
not increase linearly for successive quartiles of farm size. For instance, households in the second
quartile are no more likely to keep small livestock than households in the first quartile. Hence,
there are other factors, besides wealth, that explain livestock investments.
The multivariate probit model shows that population density plays an important role in
livestock investment decisions (figure 2). In villages with a high population density households
are significantly less likely to keep cattle. The probability of keeping cattle is 17% when the
population density is 300 persons/km², but decreases to 6% when the population density is 600
persons/km². This suggests that households are concerned about the returns on their investment
and do not just buy cattle because they have the means to do so. Surprisingly, the probability of
investing in ruminants and small livestock increases significantly with population density. This
suggests that households in high population density areas that have available capital still want to
invest in livestock, but prefer to invest in ruminants or small livestock. We assume this is because
in these areas, investing in cattle is not sufficiently profitable or too risky due to shortages of
grazing land. It is common knowledge that cattle are more vulnerable to poor quality feed than
ruminants and small livestock (C. Devendra, 1999), which can be used as a substitute for cattle in
densely populated regions.
Total yearly rainfall positively affects the likelihood of keeping cattle, but has little effect
on investments in ruminants or small livestock. However, its effect is limited as the likelihood of
investing in cattle only increases by two percentage points between a region with a yearly rainfall
of 1100 mm² and one with 900 mm² (results not shown, but available on request). As noted, we
only have data about rainfall at the provincial level and the lack of variation in this variable might
explain why this variable appears to have a limited effect on decisions to invest in livestock. On
the other hand, only a few regions in Burundi experience long periods of droughts and it seems
more likely that rainfall is not a critical constraint on livestock rearing (Bisou, Ndayirukiye,
Ndayishimiye, & Sirven, 1991).
The model suggests that market access also influences livestock investment decisions. The
distance of the household to the capital shows a large and significant negative correlation with
keeping cattle, and a smaller positive correlation with keeping small livestock. Figure 3 shows that
some 20% of households within 50 km of the capital keep cattle but less than 3% of those 150 km
away do so. This is a very strong correlation, especially given that few households sell their cattle
directly in the capital, but tend to sell them to intermediaries at local markets. Given the market
structure, we consider that this correlation is too large to be completely attributed to the beneficial
impact of better market access. Part of the effect might be attributed to the excellent agro-
ecological conditions for cattle rearing around the capital. Although regional dummies are included
in the model, these may not completely capture the concentration of cattle around the capital. To
test whether the effect of distance is non-linear, we also included the squared distance in the
multivariate probit model, but the estimated coefficient was small and insignificant. A second
potential explanation is the civil war that ravaged Burundi from 1994 to 2002. However, it is well-
documented that the civil war was more severe around the capital (Bundervoet, 2010; Voors et al.,
2012) than in the provinces. If recovery from the civil war was still playing a role we would expect
to find less livestock around the capital than in the provinces further away from the capital. This
is clearly not the case.
The second proxy for market access, the distance from the village to the closest provincial
road, confirms that market access is an important aspect in the decision to invest in livestock.
Households less than 5km from a provincial road are more likely to keep cattle, but less likely to
invest in small livestock or ruminants. This again suggests that ruminants and small livestock are
an alternative for cattle.
The multivariate probit model was used to estimate the correlations between the error terms
of the three investment decisions. As expected, the three error terms are significantly positively
correlated. This confirms that a multivariate probit model is more appropriate for estimating the
three investment decisions than three separately estimated probit models. The positive correlations
also show that a household with one type of livestock is more likely to keep another type of
livestock. Remarkably, the correlation of the error terms between investing in ruminants or small
livestock is significantly higher than the correlation between the other error components. This
might suggest that investing in ruminants is a close substitute for investing in small livestock,
while investing in cattle is mainly driven by other factors.
5. Conclusion
This study explains that wealth (measured in terms of land) is not the only factor influencing cattle
rearing in Burundi. Even relatively wealthy farmers in densely populated regions are unlikely to
keep cattle and prefer to keep smaller animals such as sheep, goats, pigs or even smaller livestock,
which are less vulnerable to feed shortages and poor quality feed. Similarly, poor market access
also reduces investment in cattle, which are primarily reared to be sold on the market. This suggests
the need to refine the concept of the livestock ladder. While it is true that the poorest households
invest in small livestock rather than cattle, wealthier households only invest in cattle if the expected
return on this investment is sufficiently large.
Our results have important policy implications. While we could not directly calculate the
returns on investment in livestock, it seems that cattle are not always the most productive
investment and investments in ruminants or small livestock, particularly in densely populated
regions can be more attractive. Yet, policy makers in Burundi, and in Sub-Saharan African as a
whole, primarily focus on developing the dairy sector and seem to neglect other forms of livestock.
For instance, Burundi’s 2012-2017 agricultural investment plan aims to distribute 200,000 cows
to smallholder farmers, but does not set targets for any other type of livestock (République du
Burundi, 2011, 2014). Given the role that smaller animals can play in alleviating poverty and food
insecurity, their tendency to be better adapted to local conditions and their lower cost in
comparison to cattle, it may be worthwhile for the government of Burundi and NGOs working in
the country to rethink their strategy towards the livestock sector and to focus more on smaller
animals.
6. References
Ali, D. A., & Deininger, K. (2014). Is there a farm-size productivity relationship in African agriculture? Evidence from Rwanda World Bank: policy research working paper 6770. Washington, DC.
Géographie du Burundi (1991). Bundervoet, T. (2010). Assets, activity choices, and civil war: evidence from Burundi. World Development,
38(7), 955-965. Cappellari, L., & Jenkins, S. P. (2003). Multivariate probit regression using simulated maximum likelihood.
The Stata Journal, 3(3), 278-294. Chilonda, P., & Otte, J. (2006). Indicators to monitor trends in livestock production at national, regional
and international levels. Livestock Research for Rural Development, 18(8), 117. Cochet, H. (1996). Farming management of biomass and sustainable development in Burundi. Cahiers des
Sciences Humaines, 32. Cochet, H. (2004). Agrarian dynamics, population growth and resource management: the case of Burundi.
GeoJournal, 60(2), 111-122. Compere, R., & Huhn, J. E. (1975). Etude globale des des possibilités de l'élevage au Burundi, première
partie Bujumbura. De Vries, J. (2008). Goats for the poor: Some keys to successful promotion of goat production among the
poor. Small Ruminant Research, 77(2), 221-224. Dercon, S. (1998). Wealth, risk and activity choice: cattle in Western Tanzania. Journal of Development
Economics, 55(1), 1-42. Dercon, S., & Krishnan, P. (1996). Income portfolios in rural Ethiopia and Tanzania: choices and constraints.
The Journal of Development Studies, 32(6), 850-875. Devendra, C. (1999). Goats: challenges for increased productivity and improved livelihoods. Outlook on
AGRICULTURE, 28(4), 215-226. Devendra, C. (2007). Small ruminants in Asia; Contribution to food security, poverty alleviation and
opportunities for productivity enhancement. Paper presented at the Proceeding of international workshop on small ruminant production and development in South East Asia.
Dolberg, F. (2001). A livestock development approach that contributes to poverty alleviation and widespread improvement of nutrition among the poor. Livestock Research for Rural Development, 13(5), 2001.
Doran, M. H., Low, A. R. C., & Kemp, R. L. (1979). Cattle as a store of wealth in Swaziland: implications for livestock development and overgrazing in Eastern and Southern Africa. American Journal of Agricultural Economics, 61(1), 41-47.
Greene, W. H. (2003). Econometric analysis, 5th: Prentice Hall. Grimaud, P., Mpairwe, D., Chalimbaud, J., Messad, S., & Faye, B. (2007). The place of Sanga cattle in dairy
production in Uganda. Tropical animal health and production, 39(3), 217-227.
Hatungumukama, G., Hornick, J. L., & Detilleux, J. (2007). Aspects zootechniques de l’élevage bovin laitier au Burundi : présent et futur. Annales de médecine vétérinaire(151 (3)), 15.
Herrero, M., Thornton, P. K., Gerber, P., & Reid, R. S. (2009). Livestock, livelihoods and the environment: understanding the trade-offs. Current Opinion in Environmental Sustainability, 1(2), 111-120.
IMF. (2013). World Economic Outlook. Retrieved 21 juin 2014 Lammers, P. J., Carlson, S. L., Zdorkowski, G. A., & Honeyman, M. S. (2009). Reducing food insecurity in
developing countries through meat production: the potential of the guinea pig (Cavia porcellus). Renewable Agriculture and Food Systems, 24(02), 155-162.
Loeys, T., Moerkerke, B., De Smet, O., & Buysse, A. (2012). The analysis of zero‐inflated count data: Beyond zero‐inflated Poisson regression. British Journal of Mathematical and Statistical Psychology, 65(1), 163-180.
Maass, B. L., Chiuri, W. L., Zozo, R., Katunga-Musale, D., Metre, T. K., & Birachi, E. (2013). Using the ‘livestock ladder’ as a means for poor crop–livestock farmers to exit poverty in Sud Kivu province, eastern DR Congo. Agro-ecological Intensification of Agricultural Systems in the African Highlands, 145.
Maass, B. L., Musale, D. K., Chiuri, W. L., Gassner, A., & Peters, M. (2012). Challenges and opportunities for smallholder livestock production in post-conflict South Kivu, eastern DR Congo. Tropical animal health and production, 44(6), 1221-1232.
Maguire, L. (1995). Power ethnicized: the pursuit of protection and participation in Rwanda and Burundi. The Buffalo Journal of International Law, 2, 49.
Moll, H. A. J. (2005). Costs and benefits of livestock systems and the role of market and nonmarket relationships. Agricultural Economics, 32(2), 181-193.
Ndumu, D., Baumung, R., Hanotte, O., Wurzinger, M., Okeyo, M., Jianlin, H., Solkner, J. (2008). Genetic and morphological characterisation of the Ankole Longhorn cattle in the African Great Lakes region. Genetics selection evolution, 40(5), 467-490.
Perry, B. D. (2002). Investing in animal health research to alleviate poverty. Nairobi, Kenya: International Livestock Research Institute (ILRI).
Randolph, T. F., Schelling, E., Grace, D., Nicholson, C. F., Leroy, J. L., Cole, D. C., Ruel, M. (2007). Invited review: Role of livestock in human nutrition and health for poverty reduction in developing countries. Journal of animal science, 85(11), 2788-2800.
République du Burundi. (1997). Cellule de réalisation de l'étude de développement de l'élevage - 1997: étude du plan directeur de l'élevage. Bujumbura.
République du Burundi. (2010). Décret N 100/55 avril 2010 portant publication des résultats définitifs du troisième recensement général de la population et de l'habitat de 2008. Bujumbura.
République du Burundi. (2011). Plan national d'investissement agricole (PNIA): 2012-2017. Bujumbura. République du Burundi. (2013). Enquête nationale agricole du Burundi: 2011-2012. Bujumbura. République du Burundi. (2014). Premier colloque sur les états généraux du secteur de l'élevage au Burundi
(17-21 juin 2013). Bujumbura. Tilahun, H., & Schmidt, E. (2012). Spatial analysis of livestock production patterns in Ethiopia Ethipioa
Strategy Support Program (ESSP) II: Working Paper 44. Addis Ababa, Ethiopia: International Food and Policy Research Institute (IFPRI).
Todd, H. (1998). Women climbing out of poverty through credit; or what do cows have to do with it. Livestock Research for Rural Development, 10(3), 1-10.
Turner, M. D., & Williams, T. O. (2002). Livestock market dynamics and local vulnerabilities in the Sahel. World Development, 30(4), 683-705.
Uvin, P. (1999). Ethnicity and power in Burundi and Rwanda: Different paths to mass violence. Comparative politics, 253-271.
Voors, M. J., Nillesen, E. E. M., Verwimp, P., Bulte, E. H., Lensink, R., & Van Soest, D. P. (2012). Violent conflict and behavior: a field experiment in Burundi. The American Economic Review, 102(2), 941-964.
Wurzinger, M., Ndumu, D., Baumung, R., Drucker, A., Okeyo, A. M., Semambo, D. K., Sölkner, J. (2006). Comparison of production systems and selection criteria of Ankole cattle by breeders in Burundi, Rwanda, Tanzania and Uganda. Tropical animal health and production, 38(7-8), 571-581.
Tables
Table 1: Livestock in Burundi
Number of
animals Bought
(%) Born
(%) Received
as gift (%) Sold (%)
Consumed (%)
Gift (%)
Stolen (%)
Died (%)
Mean price (sd)1,2
Cattle 1099 10.9 8.8 1.1 4.1 0.0 1.3 0.9 2.4 293 (152)
Ruminants/Pigs
Goats 4251 8.6 22.3 2.1 6.1 0.4 0.5 0.4 7.6 28 (11)
Sheep 703 12.5 22.6 1.3 5.3 0.6 0.6 1.0 6.7 30 (8)
Pigs 649 25.6 27.9 0.3 22.5 0.2 0.6 0.0 11.6 45 (46)
Small livestock
Chicken 4124 10.9 51.0 2.2 7.6 3.8 0.6 2.8 29.9 6(7)
Guinea pigs 1846 11.8 39.0 1.8 14.9 9.8 1.8 2.0 25.0 1 (1)
Rabbits 652 19.0 46.0 2.6 14.3 6.0 1.7 0.9 30.2 5 (11)
Ducks 114 3.5 36.0 0.9 2.6 0.9 0.0 0.0 5.3 4 (.)
Other poultry 83 10.8 31.3 2.4 9.6 3.6 0.0 3.6 22.9 1.5 (0) 1 Prices in 1000 FBU=€0.5 2 Prices are rather imprecisely estimated, because only few animals were sold.
Table 2: Distribution of livestock for successive quartiles of farm size
Successive quartiles of farm size Farms size (ha)2 TLU3 Cattle Ruminants/pigs Small livestock
% Animals1 % Animals1 % Animals1
1 0.16 0.24 8.5 1.37 41.4 2.87 26.7 5.32
2 0.38 0.40 16.8 1.63 53.5 3.14 31.5 5.93
3 0.71 0.63 21.6 2.28 58.6 3.76 39.7 7.38
4 2.74 0.92 26.5 2.95 67.9 4.61 50.5 7.80 1 Animal numbers describes the mean number of animals kept by households keeping this type of livestock. Given the large number of households without livestock (all of the categories), the sample means would be considerably lower. 2 13 farms are larger than 10ha, which biases the average farm size in the 4th quartile. The median farm size in this quartile is 1.58ha. 3 TLU: Cattle=0.7; Ruminants=0.1; Pigs=0.2; Small livestock=0.01
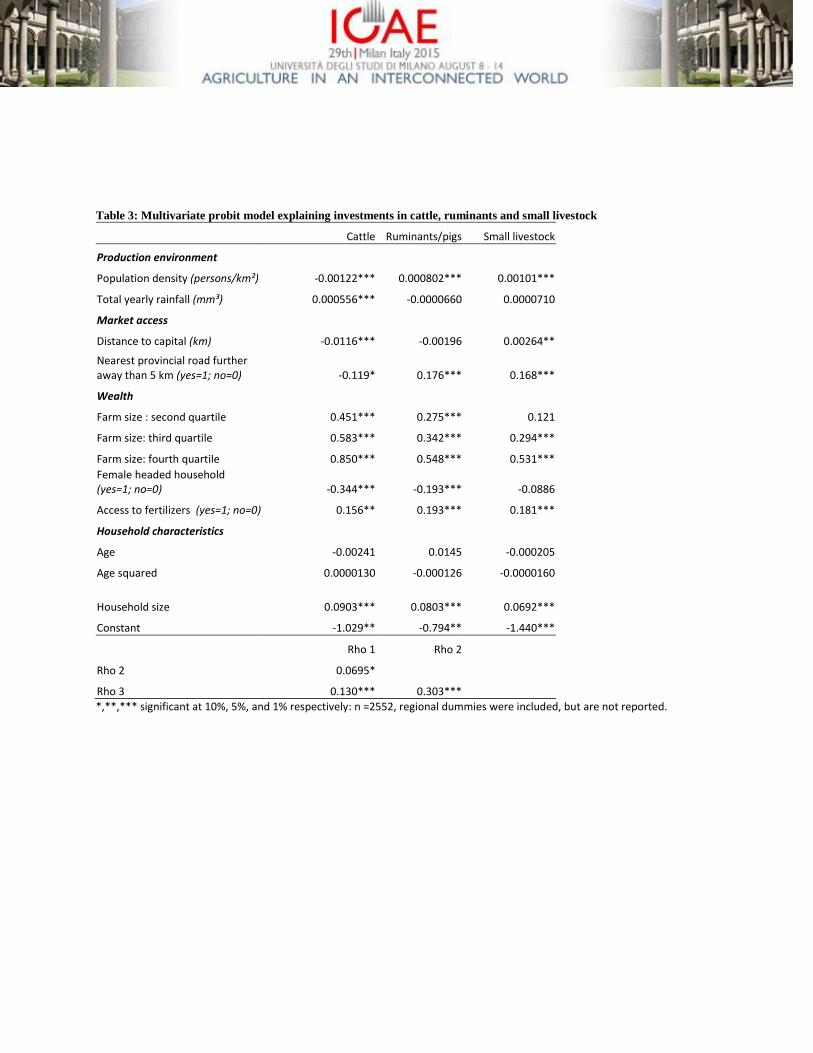
Table 3: Multivariate probit model explaining investments in cattle, ruminants and small livestock
Cattle Ruminants/pigs Small livestock
Production environment
Population density (persons/km²) -0.00122*** 0.000802*** 0.00101***
Total yearly rainfall (mm³) 0.000556*** -0.0000660 0.0000710
Market access
Distance to capital (km) -0.0116*** -0.00196 0.00264**
Nearest provincial road further away than 5 km (yes=1; no=0) -0.119* 0.176*** 0.168***
Wealth
Farm size : second quartile 0.451*** 0.275*** 0.121
Farm size: third quartile 0.583*** 0.342*** 0.294***
Farm size: fourth quartile 0.850*** 0.548*** 0.531***
Female headed household (yes=1; no=0) -0.344*** -0.193*** -0.0886
Access to fertilizers (yes=1; no=0) 0.156** 0.193*** 0.181***
Household characteristics
Age -0.00241 0.0145 -0.000205
Age squared 0.0000130 -0.000126 -0.0000160
Household size 0.0903*** 0.0803*** 0.0692***
Constant -1.029** -0.794** -1.440***
Rho 1 Rho 2
Rho 2 0.0695*
Rho 3 0.130*** 0.303***
*,**,*** significant at 10%, 5%, and 1% respectively: n =2552, regional dummies were included, but are not reported.
Figures
Figure 1: The predicted probability (with 95% confidence intervals) of investment in livestock for successive quartiles of
farm size
Figure 2: The probability of investing in livestock (with 95% C) as a function of population density
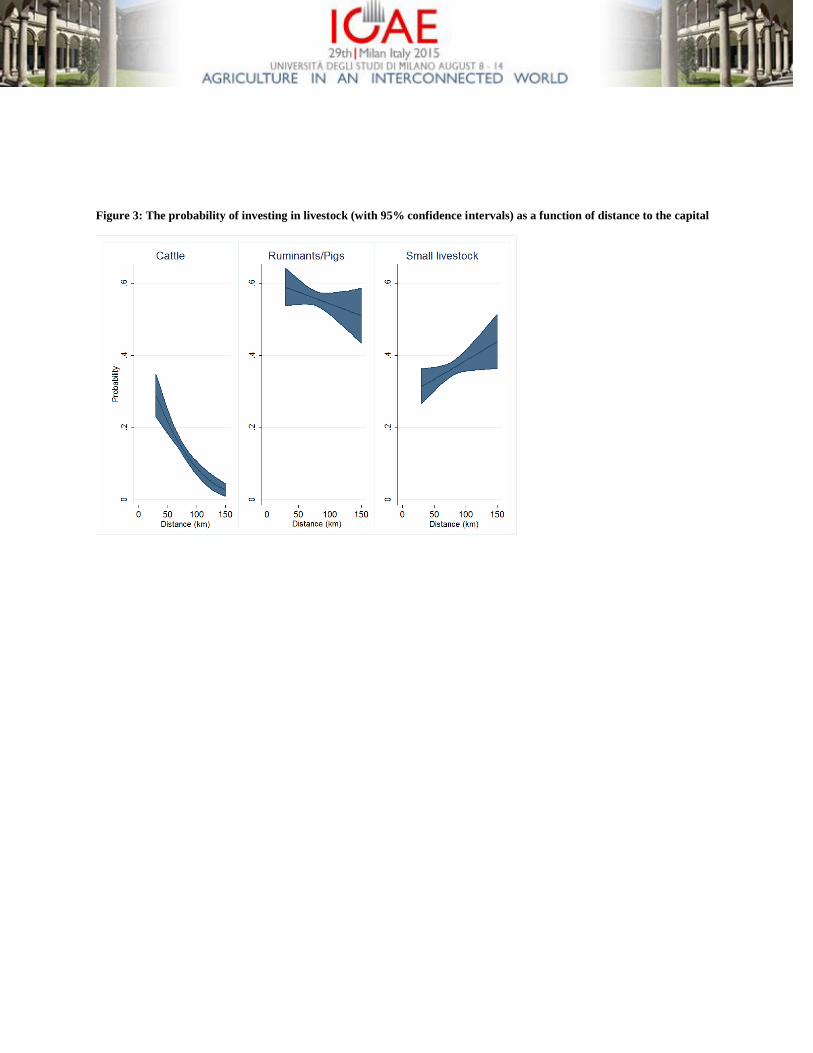
Figure 3: The probability of investing in livestock (with 95% confidence intervals) as a function of distance to the capital
Related Documents