COVID-19 UPDATE Updated: 10/4, 755 10/4, 479 0 2,000 7/16 7/23 7/30 8/6 8/13 8/20 8/27 9/3 9/10 9/17 9/24 10/1 10/8 10/15 10/22 10/29 11/5 11/12 11/19 11/26 12/3 12/10 12/17 12/24 All Hospitalized Patients with Confirmed COVID-19 2 Includes Kansas + KCMO Metro Hospitals 2020 2021 Kansas Hospital Summary – HHS Protect 1 Date Reported*: 10/2-10/5/21 Hospitalized COVID Patients Hospital Reported COVID Death s*** District Hospitals Reporting Percentage of Hospitals reporting Confirmed Hospitalize d COVID Patients (all) Confirmed Hospitalized COVID Pediatric Patients Hospitalized Confirmed or Suspected COVID Patients ICU Beds with Suspected or Confirmed COVID patients KC** 34 100% 384 14 572 122 10 NC 13 100% 32 0 34 7 0 NE 20 95% 76 0 116 35 2 NW 16 89% 26 0 16 2 0 SC 30 94% 151 3 227 67 3 SE 11 100% 14 0 21 4 0 SW 18 100% 39 1 28 11 0 Kansas Only 121 484 5 556 177 6 *The most recent day of reporting for each facility within these dates. 1.HHS Protect statistics are based on self-reported entries to the HHS Teletracking system . The Hospitals Reporting indicates the number of facilities reporting at least one data point for the day 2.HHS Protect statistics from prior weekdays reporting. Displayed counts represent the sum of hospitalizations as submitted for the day as available in HHS Protect. Daily numbers may increase over time as hospitals submit current data. Please direct questions regarding this dashboard to Sally Othmer October 6, 2021 Hospitals Reporting 94 % 10/4, 20 10/4, 3 0 50 7/16 7/23 7/30 8/6 8/13 8/20 8/27 9/3 9/10 9/17 9/24 10/1 10/8 10/15 10/22 10/29 11/5 11/12 11/19 11/26 12/3 12/10 12/17 12/24 Pediatric Hospitalized Patients with Confirmed COVID-19 2 Includes Kansas + KCMO Metro Hospitals 2020 2021 Sources and references: Table represents one day of reporting between 10/2 and 10/5/21. *The table represents counts from hospitals based on their most recent entry available through HHS Protect. The graph below represents the sum of hospitalizations as submitted for that day. **KC Metro includes data submitted by hospitals in Kansas and Missouri within the Kansas City Metro area counties: Johnson, Leavenworth, Miami, Wyandotte in Kansas and Bates, Cass, Clay, Clinton, Jackson, Lafayette and Ray in Missouri. NE District does not include KC Metro counties. A map of the KHA districts is available at the KHA website . ***Reported COVID Deaths - Number of patients with suspected or laboratory- confirmed COVID-19 who died on the previous calendar day of reporting in the hospital and hospital ED.

Welcome message from author
This document is posted to help you gain knowledge. Please leave a comment to let me know what you think about it! Share it to your friends and learn new things together.
Transcript

COVID-19 UPDATE Updated:
10/4, 755
10/4, 479
0
2,000
7/16 7/23 7/30 8/6 8/13 8/20 8/27 9/3 9/10 9/17 9/24 10/1 10/8 10/15 10/22 10/29 11/5 11/12 11/19 11/26 12/3 12/10 12/17 12/24
All Hospitalized Patients with Confirmed COVID-192
Includes Kansas + KCMO Metro Hospitals
2020 2021
Kansas Hospital Summary – HHS Protect1
Date Reported*: 10/2-10/5/21 Hospitalized COVID Patients
Hospital Reported
COVID Deaths***
DistrictHospitals Reporting
Percentage of Hospitals
reporting
Confirmed Hospitalize
d COVID Patients
(all)
Confirmed Hospitalized
COVID Pediatric Patients
Hospitalized Confirmed or
Suspected COVID
Patients
ICU Beds with Suspected or
Confirmed COVID patients
KC** 34 100% 384 14 572 122 10
NC 13 100% 32 0 34 7 0
NE 20 95% 76 0 116 35 2
NW 16 89% 26 0 16 2 0
SC 30 94% 151 3 227 67 3
SE 11 100% 14 0 21 4 0
SW 18 100% 39 1 28 11 0Kansas
Only121 484 5 556 177 6
*The most recent day of reporting for each facility within these dates.
1.HHS Protect statistics are based on self-reported entries to the HHS Teletracking system . The Hospitals Reporting indicates the number of facilities reporting at least one data point for the day2.HHS Protect statistics from prior weekdays reporting. Displayed counts represent the sum of hospitalizations as submitted for the day as available in HHS Protect. Daily numbers may increase over time as hospitals submit current data. Please direct questions regarding this dashboard to Sally Othmer
October 6, 2021
Hospitals Reporting94%
10/4, 20
10/4, 3
0
50
7/16 7/23 7/30 8/6 8/13 8/20 8/27 9/3 9/10 9/17 9/24 10/1 10/8 10/15 10/22 10/29 11/5 11/12 11/19 11/26 12/3 12/10 12/17 12/24
Pediatric Hospitalized Patients with Confirmed COVID-192
Includes Kansas + KCMO Metro Hospitals
2020 2021
Sources and references:Table represents one day of reporting between 10/2 and 10/5/21.*The table represents counts from hospitals based on their most recent entry available through HHS Protect. The graph below represents the sum of hospitalizations as submitted for that day.
**KC Metro includes data submitted by hospitals in Kansas and Missouri within the Kansas City Metro area counties: Johnson, Leavenworth, Miami, Wyandotte in Kansas and Bates, Cass, Clay, Clinton, Jackson, Lafayette and Ray in Missouri. NE District does not include KC Metro counties. A map of the KHA districts is available at the KHA website.
***Reported COVID Deaths - Number of patients with suspected or laboratory-confirmed COVID-19 who died on the previous calendar day of reporting in the hospital and hospital ED.

COVID-19 UPDATE Updated:
26%
28%
35%19%
43%
14%24%
7,589
10,170
17,010
19,369 19,203
14,264
17,742
14,76615,120
12,74414,385
15,223
11,371
9,105
6,3985,9794,120
2,120 2,023 1,395 1,627 1,223 1,129977 1,089
2,6783,464
5,2046,418
7,587
8,453
8,93110,850
13,874
10,846
8,2357,003
6,497
55 80 128 111 177 176 262 312 254 234 286 328 220 143 177 408 218 203 92 35 44 32 19 12 17 17 21 30 24 14 13 23 25 11 17 10 30 22 29 39 71 99 79 46 112 35 118 43 38
Weekly New Cases
COVID-19 Related Deaths
17 11 49 20 26 16
-1
28 29 26 40 61 74 105 149 199 225
372289
219 220 228
5/1
2
5/1
9
5/2
6
6/2
6/9
6/1
6
6/2
3
6/3
0
7/7
7/1
4
7/2
1
7/2
8
8/4
8/1
1
8/1
8
8/2
5
9/1
9/8
9/1
5
9/2
2
9/2
9
10
/6
Northwest
47 20 24 31 37 40 30 64 49 86 116239 249 251 274 329
463582
493 416 370 331
5/1
2
5/1
9
5/2
6
6/2
6/9
6/1
6
6/2
3
6/3
0
7/7
7/1
4
7/2
1
7/2
8
8/4
8/1
1
8/1
8
8/2
5
9/1
9/8
9/1
5
9/2
2
9/2
9
10
/6
North Central
627 749 545 327 550 504 366 598 8991,6501,960
2,9363,6204,021
4,6054,3925,111
6,082
4,5913,371
2,8072,474
Northeast
39 47 116194
87 68 26 38 47 55 69154 226 267
378 416569 621
457366 319 383
5/1
2
5/1
9
5/2
6
6/2
6/9
6/1
6
6/2
3
6/3
0
7/7
7/1
4
7/2
1
7/2
8
8/4
8/1
1
8/1
8
8/2
5
9/1
9/8
9/1
5
9/2
2
9/2
9
10
/6
Southwest
443 383 364 202 202 198 178 235 212 468 729 1,0791,5502,2052,2762,762
3,5945,151
4,3243,4082,9682,718
5/1
2
5/1
9
5/2
6
6/2
6/9
6/1
6
6/2
3
6/3
0
7/7
7/1
4
7/2
1
7/2
8
8/4
8/1
1
8/1
8
8/2
5
9/1
9/8
9/1
5
9/2
2
9/2
9
10
/6
South Central
50 43 31 29 75 88 75 126 244 393550
735 699 738 771 833 8881,066
692455 319 363
5/1
2
5/1
9
5/2
6
6/2
6/9
6/1
6
6/2
3
6/3
0
7/7
7/1
4
7/2
1
7/2
8
8/4
8/1
1
8/1
8
8/2
5
9/1
9/8
9/1
5
9/2
2
9/2
9
10
/6
Southeast
20%4%
14%12%
11% 8%
7%
COVID-19 New Cases By KHA Region3
3. A case is defined by a person who tested positive for the novel coronavirus (SARs-CoV-s), which causes Coronavirus Disease 2019 (COVID-19). Confirmed and probable cases are reported in this dashboard. A probable case is defined as a person with a)presumptive lab evidence (serology) with COVID-19 symptoms or epi-linked to a confirmed case, or b) no lab testing with COVID-19 symptoms and epi-linked to a confirmed case. - Last updated today– Based on statistics from KDHE for Kansas residentsData Source: . KDHE data updated Monday, Wednesday, and Friday https://www.coronavirus.kdheks.gov/160/COVID-19-in-Kansas
October 6, 2021
3a. Please note, any decrease in deaths is attributed to the review of death certificates. Deaths initially reported to KDHE/Local Health Departments as COVID-19 related, were identified during the review process as not having COVID-19 as the main cause or contributing cause of death. This is a normal process that occurs.
Kansas Weekly New COVID-19 Cases3 and Related Deaths3a
Deaths calculated from cumulative totals reported by KDHE

COVID-19 UPDATE Updated: October 6, 2021
Monthly Regional Vaccination Administration8,9 and New COVID-19 Infections
1,707
1,136
1,833
2,919
1,495
84 79321
1,050 1,193
135
Region Population Vaccinated
44%
0%
10%
20%
30%
40%
50%
0
500
1,000
1,500
2,000
2,500
3,000
3,500
May-21 Jun-21 Jul-21 Aug-21 Sep-21 Oct-21
NW
3,160
2,256
3,035
3,878
2,045
137 182589
1,4671,974
218
Region Population Vaccinated
54%
0%
10%
20%
30%
40%
50%
60%
0
500
1,000
1,500
2,000
2,500
3,000
3,500
4,000
4,500
May-21 Jun-21 Jul-21 Aug-21 Sep-21 Oct-21
NC
64,025
34,13342,149
47,655
25,652
2,618 2,1308,613
20,581 17,7701,555
Region Population Vaccinated
54%
0%
10%
20%
30%
40%
50%
60%
0
10,000
20,000
30,000
40,000
50,000
60,000
70,000
May-21 Jun-21 Jul-21 Aug-21 Sep-21 Oct-21
NE
3,512
2,793
3,866
6,186
3,628
292 323 398
1,783 1,875
271
Region Population Vaccinated
49%
0%
10%
20%
30%
40%
50%
60%
0
1,000
2,000
3,000
4,000
5,000
6,000
7,000
May-21 Jun-21 Jul-21 Aug-21 Sep-21 Oct-21
SW
27,488
15,514
21,623
31,239
14,863
1,578 1,0282,918
11,957
16,855
1,714
Region Population Vaccinated
49%
0%
10%
20%
30%
40%
50%
60%
0
5,000
10,000
15,000
20,000
25,000
30,000
35,000
May-21 Jun-21 Jul-21 Aug-21 Sep-21 Oct-21
SC
3,427
2,486
5,4295,923
2,694
158 367
2,130
3,721
2,659
236
Region Population Vaccinated
43%
0%
10%
20%
30%
40%
50%
0
1,000
2,000
3,000
4,000
5,000
6,000
7,000
May-21 Jun-21 Jul-21 Aug-21 Sep-21 Oct-21
SE
Note: October vaccine administration counts were not available at the time of this publication.
COVID-19 UPDATE Updated:
Notes:6. KDHE data updated MWF https://www.coronavirus.kdheks.gov/160/COVID-19-in-Kansas7. Combined KDHE COVID data and US Census Data8. KDHE data https://www.kansasvaccine.gov/158/Data , 9. CDC data https://covid.cdc.gov/covid-data-tracker/#vaccinations , updated daily
October 6, 2021
County COVID-19 Vaccines Administered as a Percentage of County Population8
1,597,678
1,309,538
54.8%45.0%
0.0%
10.0%
20.0%
30.0%
40.0%
50.0%
60.0%
70.0%
80.0%
90.0%
100.0%
0
200,000
400,000
600,000
800,000
1,000,000
1,200,000
1,400,000
1,600,000
1,800,000
First Dose Completed Vaccine
Kansas COVID-19 Vaccination Administration8
Counts and Percentage of KS Population
215,737,487
186,060,14665.0%
56.0%
0.0%
10.0%
20.0%
30.0%
40.0%
50.0%
60.0%
70.0%
80.0%
90.0%
100.0%
170,000,000
175,000,000
180,000,000
185,000,000
190,000,000
195,000,000
200,000,000
205,000,000
210,000,000
215,000,000
220,000,000
First Dose Completed Vaccine
US COVID-19 Vaccination Administration9
Counts and Percentage of US Population
US and Kansas Vaccination Administration8,9

COVID-19 UPDATE Updated:
3. A case is defined by a person who tested positive for the novel coronavirus (SARs-CoV-s), which causes Coronavirus Disease 2019 (COVID-19). Confirmed and probable cases are reported in this dashboard. A probable case is defined as a person with a)presumptive lab evidence (serology) with COVID-19 symptoms or epi-linked to a confirmed case, or b) no lab testing with COVID-19 symptoms and epi-linked to a confirmed case. - Last updated today– Based on statistics from KDHE for Kansas residentsData Source: . KDHE data updated Monday, Wednesday, and Friday https://www.coronavirus.kdheks.gov/160/COVID-19-in-Kansas
October 6, 2021
3a. Please note, any decrease in deaths is attributed to the review of death certificates. Deaths initially reported to KDHE/Local Health Departments as COVID-19 related, were identified during the review process as not having COVID-19 as the main cause or contributing cause of death. This is a normal process that occurs.
COVID-19 Kansas Statewide Case Summary – KDHE6
Cases* New CasesTotal
HospitalizationsStatewide
DeathsNegative
Tests
415,431 2,312 14,086 6,106 1,350,246
COVID-19 Cases by Region1
NC NE NW SC SE SW
18,135 198,765 14,875 129,250 28,947 25,459
90 Days – New County COVID-19 Cases per 1,000 County Population6,7
Mar Apr May Jun Jul Aug Sep Oct Nov Dec Jan Feb
2020 9 120 79 62 88 88 232 351 531 1,180 1,038 956
2021 178 69 94 80 99 302 467 82
0
200
400
600
800
1,000
1,200 COVID Deaths of Kansas Residents 6,3a
Monthly Year to Year Comparisonthru Oct 6, 2021
COVID-19 UPDATE Updated:
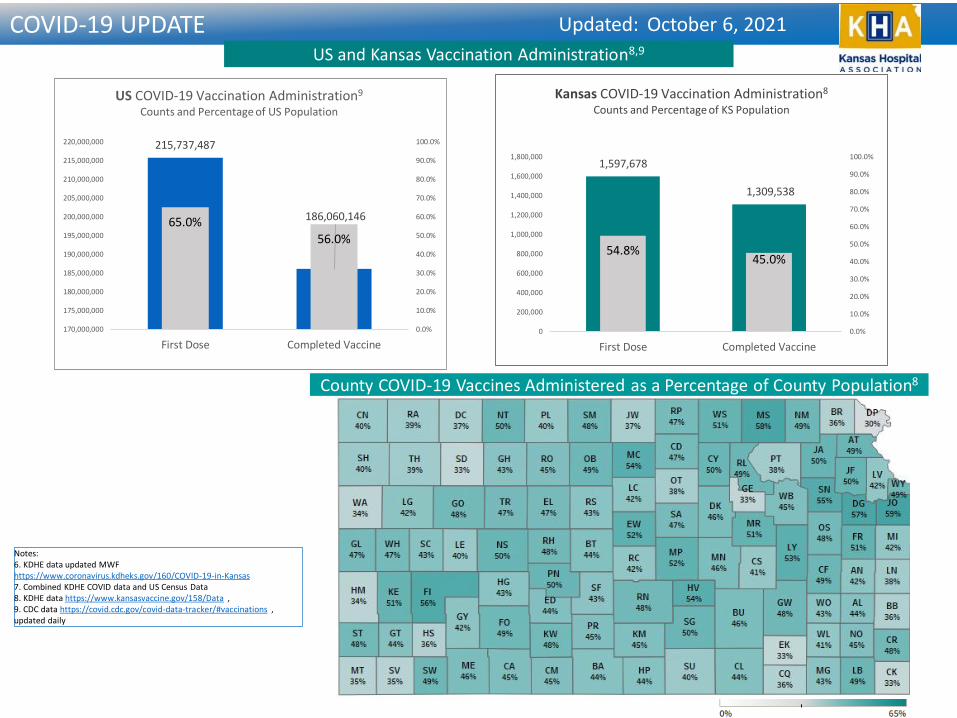
COVID-19 Data Submission to TeleTracking as of May 27, 2021
COVID-19 Reporting Information Resources
• COVID-19 Guidance for Hospital Reporting and FAQs Updated May 27, 2021• Interim Final Rule, CMS-3401-IFC; Requirements and Enforcement Process for Reporting COVID-19 Data Elements• Hospital Mandatory Reporting Workflow• Instructions for Reporting Weekend Data on Monday• Slide Deck from HHS Hospital Reporting Webinar• Q&As from HHS Training Webinars
Please contact Sally Othmer – [email protected] with questions
October 6, 2021
For assistance with WebIZ, please reach out to [email protected] or call 877-296-0464
For assistance with Vaccine Data Submission, please reach out to [email protected]
Vaccine ReportingKHA Resources
Related Documents