AUGUST 2020 India Survey Snapshot: Wave-5 ― July 20-Aug 02 COVID-19 Consumer Sentiment Research

Welcome message from author
This document is posted to help you gain knowledge. Please leave a comment to let me know what you think about it! Share it to your friends and learn new things together.
Transcript

AUGUST 2020
India Survey Snapshot: Wave-5 ― July 20-Aug 02
COVID-19 Consumer Sentiment Research

Copyrig
ht
© 2
020
by B
ost
on C
onsu
ltin
g G
roup. All
rig
hts
rese
rved.
1
Context forthis document
This COVID-19 consumer sentiment research is based on a global survey
which is currently covered in both developed and emerging markets. It
is fielded in waves to provide a longitudinal view of consumer
sentiments about the coronavirus pandemic, and changes in consumer
consumption behavior
This document is focused on Wave 5 in India, which was fielded from
July 20th- Aug 02nd, 2020; covering ~3,000 respondents across Metros
and Tier 1/2/3/4 cities. The following is not an exhaustive analysis of
that study, but rather a first-read of its results
This study assesses the overall changes in behavior across a large set
of categories (~50) and daily lifestyle. It also tracks overall consumer
sentiment towards the COVID-19 virus
India—Wave 5—Aug, 2020 India

2 Copyrig
ht
© 2
020
by B
ost
on C
onsu
ltin
g G
roup. All
rig
hts
rese
rved.
Survey:Wave 4
Surveys conducted to track the impact of COVID on consumer sentiment & behavior
24/3: Nationwide lockdown for 21
days
14/4: Lockdown extended till 3rd
May
81,970
182,143
332,424
585,493
936,181
1,855,745
9-A
pr
19-A
pr
31-M
ay
26-A
pr
28-M
ay
3-A
pr
31-M
ar
28-M
ar
11-J
ul
20-J
ul
10-A
pr
16-A
pr
28-J
ul
4-J
un
21-M
ar
1-J
ul
24-M
ar
22-M
ar
4-J
ul
23-M
ar
25-M
ar
2-M
ay
30-A
pr
26-M
ar
20-A
pr
29-M
ar
27-M
ar
30-M
ar
1-A
pr
25-A
pr
14-A
pr
9-J
ul
2-A
pr
23-A
pr
29-J
ul
5-A
pr
2-J
un
4-A
pr
5-J
ul
6-A
pr
7-A
pr
8-A
pr
10-J
un
11-A
pr
12-A
pr
3-M
ay
13-A
pr
15-A
pr
17-A
pr
18-A
pr
21-A
pr
28-A
pr
3-A
ug
3-J
ul
27-A
pr
22-A
pr
24-A
pr
29-A
pr
1-M
ay
4-M
ay
5-M
ay
6-M
ay
7-M
ay
8-M
ay
9-M
ay
10-M
ay
11-M
ay
12-M
ay
13-M
ay
14-M
ay
26-J
un
15-M
ay
16-M
ay
17-M
ay
18-M
ay
19-M
ay
20-M
ay
21-M
ay
22-M
ay
23-M
ay
24-M
ay
25-M
ay
26-M
ay
27-M
ay
29-M
ay
30-M
ay
1-J
un
3-J
un
16-J
ul
5-J
un
6-J
un
7-J
un
8-J
un
9-J
un
27-J
ul
11-J
un
25-J
ul
12-J
un
14-J
un
15-J
un
16-J
un
17-J
un
13-J
un
19-J
un
20-J
un
7-J
ul
21-J
un
12-J
ul
22-J
un
23-J
un
24-J
un
25-J
un
27-J
un
28-J
un
29-J
un
30-J
un
2-J
ul
6-J
ul
8-J
ul
18-J
un
13-J
ul
14-J
ul
15-J
ul
17-J
ul
2-A
ug
18-J
ul
19-J
ul
21-J
ul
22-J
ul
23-J
ul
24-J
ul
26-J
ul
30-J
ul
31-J
ul
1-A
ug
4-A
ug
10-J
ul
Survey:Wave 1
Survey:Wave 2
Wave 5: Offline face to face survey conducted across urban India. Wave 4 : Online survey SEC AB respondents in Metro-Tier 4 towns & Telephonic survey conducted among SEC ABCDE in Tier 2-4Wave 1 to 3: Online survey conducted among SEC AB respondents in Metro-Tier 4 towns. Note: Wave 1: Mar 23-26 (N=2,106), Wave 2: Apr 17-20 (N=2,324), Wave 3: Apr 30-May 03 (N=1,327), Wave 4: May 18-23 (N=3,276), Wave 5: 20th Jul – 02nd Aug'20 (N=3,000)Source: Ministry of Health & Family welfare (Data updated as on 05 Aug)
01/5: Lockdown extended till 17th
May, with relaxations
17/5: Lockdown extended till 31st May, with more relaxations
Survey 4: Expanded
coverage to include SEC C/D/E, small
towns
08/6: Unlock 1, exit from lockdown
Survey:Wave 3
Survey:Wave 5
30/6: Unlock 2, exit from lockdown
20th Jul – 02nd Aug'20
India—Wave 5—Aug, 2020 India

3 Copyrig
ht
© 2
020
by B
ost
on C
onsu
ltin
g G
roup. All
rig
hts
rese
rved.
Consumer sentiments
How are consumers feeling?
Consumer behavior
How has their behavior actually
changed during COVID?
Understanding the impact of pandemic on...

4 Copyrig
ht
© 2
020
by B
ost
on C
onsu
ltin
g G
roup. All
rig
hts
rese
rved.
Consumer behavior
How has their behavior actually
changed during COVID?
Understanding the impact of pandemic on...Consumer sentiments
Consumer sentiments
How are consumers feeling?

5 Copyrig
ht
© 2
020
by B
ost
on C
onsu
ltin
g G
roup. All
rig
hts
rese
rved.
Consumer sentiment beginning to get better even though the pandemic has continued to worsen
Note: Question text: “How much do you agree with each of the following statements about the coronavirus?" Note: Representative of Metro tier 2 (towns with 5L+ population), SEC AB populationSources: BCG COVID-19 Consumer Sentiment Survey, Wave 1: Mar 23-26 (N=2,106), Wave 2: Apr 17-20 (N=2,324), Wave 3: Apr 30-May 03 (N=1,327), Wave 4: May 18-23 (N=3,276), Wave 5: 20th Jul – 02nd Aug'20 (N=3,000)
125,101
1,483,156
83 83 82
8987
Aug
Wave 5
May
Wave 3
March
Wave 1
April
Wave 2
May end
Wave 4
Change in Daily lifestyle:
I am maintaining social distance
and working from home (%)
125,101
1,483,156
8684 85 86
76
May
Wave 3
March
Wave 1
April
Wave 2
Aug
Wave 5
May end
Wave 4
Health concerns:
I feel the world is in a serious
danger due to coronavirus (%)
Income outlook:
I expect my income to decline in
next 6 months (%)
125,101
1,483,156
46
54 54
50
44
Aug
Wave 5
May end
Wave 4
March
Wave 1
April
Wave 2
May
Wave 3
125,101
1,483,156
4447 46 45
40
April
Wave 2
Aug
Wave 5
March
Wave 1
May
Wave 3
May end
Wave 4
Spends outlook:
I expect my spends to decline in
next 6 months (%)
Total no. of confirmed cases
India—Wave 5—Aug, 2020 India

6 Copyrig
ht
© 2
020
by B
ost
on C
onsu
ltin
g G
roup. All
rig
hts
rese
rved.
Question text: “You mentioned that you are aware of a global virus outbreak. What comes to mind when you think about the virus? Please list 3-5 words or phrases.” Similar responses categorized together for visual simplicity. Note: Representative of urban India Source: BCG COVID-19 Consumer Sentiment Survey March 23-26rd, May 18-23 2020, Wave 5: 20th Jul – 02nd Aug'20 (N=2,106, 3,276 & N = 3,000 respectively)
'Cautious living' emerging as the new theme
Wear masks
Lockdown
Recession
Stay home
Sanitizer
No vaccineWash hands
Avoid travel Fear
Cleanliness
Income loss
Improve Immunity
Job insecurity
Financial crisis
Away from crowds
Pandemic
Quarantine
Isolation
Reduce expenses
Follow rules
Savings
Wave 1: March 23-26th Wave 3: Apr 30th –03rd May Wave 5: Jul 20th – 02nd Aug
Avoid travel
Recession
Living with virus
Job insecurity
Cleanliness
Income loss
Economic crisis
Build Immunity
Cautious
Follow rules
Savings
Sanitizer
Be strong
Unlock
Wear Masks
No vaccine
Hope
Back to work
Vigilant
Recovery
Reduce expenses
Opening upChina
Elderly
Pandemic
Avoid Travel
Spread
Contagious
China
Economic Crisis
Fear
Cure
Concern
Wash hands
Death
Sick
Cautious
Self-quarantine
Global
Outbreak
Recession
Dangerous
Stay Home
Health & Economic concerns central to sentiment in March..
… which shifted to anxieties about personal finances in April…
… with resilience and caution emerging themes in August
Stock
markets
Death
Self-reliance
Cases increasingShare marketStay Home
No hospital beds
New Associations
India—Wave 5—Aug, 2020 India

7 Copyrig
ht
© 2
020
by B
ost
on C
onsu
ltin
g G
roup. All
rig
hts
rese
rved.
Revival stronger among lower income segments and lower tier cities
23%
23%
52%
41%
City Tier
Affluent/
Elite
Struggler/
Next billion
Expected change in income in next 6 months
Metro/Tier1
Tier 2/3/4
% expecting income lower than before covid
% expecting income higher than before covid
Income segments
28%
19%
15%
44%
54%
65%
Aspirer
21%
18%
55%
59%
Wave 4
May 18th –23r d
Wave 5
20th Jul – 02nd Aug'20
Wave 4
May 18th –23r d
Wave 5
20th Jul – 02nd Aug'20
30%
24%
20%
38%
39%
50%
-6%
-15%
-15%
-18%
-3%
Question text: “How do you expect your overall available household spends to change in the Next 6 months as compared to before covid?" Note: Income classification based on HH income: Next billion +Struggler: < upto 5L; Aspirers: 5L-10L; Affluent+: 10L+. Representative of all Urban India. Note: Town classification based on population: Large towns: 10L+ population, Small towns: 50k-10L population. Source: BCG COVID-19 Consumer Sentiment Survey May 18-23 2020, 20th Jul – 02nd Aug'20 (N=3,276 & N = 3,000 respectively)
India—Wave 5—Aug, 2020 India

8 Copyrig
ht
© 2
020
by B
ost
on C
onsu
ltin
g G
roup. All
rig
hts
rese
rved.
Spending sentiment has improved across categories
80%
60%
40%
20%
0%
10% 20% 30% 40% 50% 60%
Wave 4 (May 18th – 23rd)
Wave 5 (Jul 20th –02nd Aug)
Note: Question text: “How do you expect your spend to change in the next 6 months across the following areas?”Note: Representative of all Urban IndiaSource: BCG COVID-19 Consumer Sentiment Survey May 18-23 2020, Jul 20-02 Aug,2020 (N=3,276 & N = 3,000 respectively)
80%
60%
40%
20%
0%
10% 20% 30% 40% 50% 60%
Each dot represents a category
Average (planning to
increase spends): 27%
Average (planning to
decrease spends): 46%
Average (planning to
increase spends): 30%
Average (planning to
decrease spends): 29%
% c
onsu
mers
pla
nnin
g t
o s
pend le
ss v
s pre
-covi
d
% consumers planning to spend more vs pre-covid
% c
onsu
mers
pla
nnin
g t
o s
pend le
ss v
s pre
-covi
d
% consumers planning to spend more vs pre-covid
India—Wave 5—Aug, 2020 India

9 Copyrig
ht
© 2
020
by B
ost
on C
onsu
ltin
g G
roup. All
rig
hts
rese
rved.
Strong positive movement in packaged foods, personal care, food delivery, apparels
Note: Question text: “How do you expect your spend to change in the next 6 months across the follow ing areas?”. Note: Repr esentative of all Ur ban IndiaCategories w ith Top 2 Box > 35% (5% more than average) classified as winning categories, Bottom 2 Box > 34% (5% more than average) classified as losing categoriesSour ce: BCG COVID-19 Consumer Sentiment Survey May 18-23 2020, Jul 20-02 Aug,2020 (N=3,276 & N = 3,000 r espectively)
Wave
4 -
(May
18
th–2
3rd)
Daily essentials• Fresh foods
• Staples
At-home entertainment• Mobile services
• DTH services
• Home Wifi connection
• Paid OTT subscr iption
Education Insurance
Health & Insurance• Preventive diagnostics/ tests
• Vitamins, herbs, supplements
• First-aid
• Medical procedures
• Insurance
• Prescr iption medicines/ Non-
prescr iption medicines
Neutral
Losers
Winner
Travel & Transport• Vacation/ leisure travel
• Business travel
• Public transport
OOH entertainment• Spas, theme parks,
concerts
• Restaurants
• Movies at cinema hall
Automobiles• Scooters/bikes
• Cars
Fashion• Fashion accessor ies
• Luxury brands/products
Consumer durables & electronics• Non-mobile consumer electronics
Home improvement• Home construction/ renovations
• Home furnishings and décor
Other• Tobacco & smoking supplies
• Alcohol
• Toys and games
Packaged food & beverages
Household care products
Personal care products
Baby Food
Losers Neutral Winners
Mobile devices
Home Rent/ purchase
Wave 5 - (July 20th – Aug 2nd)
Cosmetics, makeup
Food delivery
Apparel, footwear
Personal care, HH care, packaged f&b and
baby food witness a shift from Neutral to
Winner category
Cosmetics, Food delivery and Apparel witness a
shift from Loser to Neutral category
India—Wave 5—Aug, 2020 India

10 Copyrig
ht
© 2
020
by B
ost
on C
onsu
ltin
g G
roup. All
rig
hts
rese
rved.
20
40
60
80
March
(Wave 1)
May
(Wave 3)
Aug
(Wave 5)
20
40
60
80
March
(Wave 1)
May
(Wave 3)
Aug
(Wave 5)
Winner categories | Essentials, health and insurance witness a growth in positive sentiment
20
40
60
80
Aug
(Wave 5)
March
(Wave 1)
May
(Wave 3)
20
40
60
80
March
(Wave 1)
May
(Wave 3)
Aug
(Wave 5)
Staples
HH care
Personal care
Packaged food & bevs
Mobile servicesWifi connection
Paid OTTInsurance Education
Preventive health test
Health supplements
Daily essentials At-home entertainment Insurance & Education Health & wellness
% consumers likely to increase spends % consumers likely to increase spends % consumers likely to increase spends % consumers likely to increase spends
Change in spends in next six months
Note: Question text: “How do you expect your spend to change in the next 6 months across the following areas?” Note: Representative of Metro tier 2 (towns with 5L+ population), SEC AB populationCategories with Top 2 Box > (5% more than average) classified as winning categories, Bottom 2 Box > (5% more than average) classified as losing categoriesSource: BCG COVID-19 Consumer Sentiment Survey March 23-26 2020, April 30-May 03 2020, Jul 20-02 Aug,2020 (N = 2,106, 1,327 & 3,000 respectively)
India—Wave 5—Aug, 2020 India

11 Copyrig
ht
© 2
020
by B
ost
on C
onsu
ltin
g G
roup. All
rig
hts
rese
rved.
20
40
60
80
Aug
(Wave 5)
May
(Wave 3)
March
(Wave 1)
20
40
60
80
Aug
(Wave 5)
March
(Wave 1)
May
(Wave 3)
Loser categories | Decline in negative sentiment for Auto, electronics while Travel & OOH entertainment continue to remain negative
20
40
60
80
March
(Wave 1)
May
(Wave 3)
Aug
(Wave 5)
20
40
60
80
March
(Wave 1)
May
(Wave 3)
Aug
(Wave 5)
Business travel Public transport
Theme parks, concerts
Movies at cinema hall
RestaurantsHandbags and accessories
Tobacco
Alcohol Consumer electronicsScooters/bikes
Cars
Travel & Transport
Out-of-home entertainment
Discretionary spendsAuto & consumer
electronics
% consumers likely to decrease spends % consumers likely to decrease spends % consumers likely to decrease spends % consumers likely to decrease spends
Change in spends in next six months
Note: Question text: “How do you expect your spend to change in the next 6 months across the following areas?” Note: Representative of Metro tier 2 (towns with 5L+ population), SEC AB populationCategories with Top 2 Box > (5% more than average) classified as winning categories, Bottom 2 Box > (5% more than average) classified as losing categoriesSource: BCG COVID-19 Consumer Sentiment Survey March 23-26 2020, April 30-May 03 2020, Jul 20-02 Aug,2020 (N = 2,106, 1,327 & 3,000 respectively)
India—Wave 5—Aug, 2020 India

12 Copyrig
ht
© 2
020
by B
ost
on C
onsu
ltin
g G
roup. All
rig
hts
rese
rved.
Recovery observed across different activities; higher for regular activities
19
Wave 4 Wave 5Wave 5
25
26
Wave 4Wave 5
40
Wave 4
5
6
37
19
Wave 4
13
26
Wave 4
19
11
Wave 4 Wave 4Wave 5
16
15
Wave 5 Wave 5 Wave 4 Wave 5
16
Wave 5
24
66
7357
16
17
Wave 4 Wave 5
53 51
72
22
38
10 13
37
23
33
634
15
Reduced level vs. pre-covid
Same level as pre-covid
Type of
activitiesGoing to local
shops for essentials
Going to
office/ workplace
Going to friends'/
acquaintance's home
Going to local
shops for non-essentials
Ordering
food delivery
Doing
outstation travel for work
Doing local
travel(Buses, auto,
Ola, Uber)
Visiting
Shopping malls
Going for
Dine-out
EntertainmentTravel / Local
travel
Regular activities(Essentials)
N/a N/a N/a N/a
N/a Activity restricted due to lockdown
% consumers who have done the activity in last 1 month1
Question text: “Which of the following activities have you done in last 1 month", How frequently have you engaged in following activities in last 1 month"1. Among those who did activities before lockdown Note: Representative of all Urban IndiaSource: BCG COVID-19 Consumer Sentiment Survey May 18-23 2020, Jul 20-02 Aug,2020 (N=3,276 & N = 3,000 respectively)
N/a N/a N/a
Regular activities(Non-Essentials)
Wave 4: May 18-23rd
Wave 5: Jul 20-02nd Aug
India—Wave 5—Aug, 2020 India

13 Copyrig
ht
© 2
020
by B
ost
on C
onsu
ltin
g G
roup. All
rig
hts
rese
rved.
Impact on lifestyle much lesser in smaller towns
Wave 4 Wave 4
14
Wave 5Wave 5 Wave 4 Wave 5 Wave 4Wave 4 Wave 4Wave 5Wave 5
16
Wave 4 Wave 5 Wave 4 Wave 5 Wave 5
9
46 47
60
0
31
0
25
35
18 42
5753
78
40
23
32
926
20
24
23
33
27
21
10
1119
16
1832
25
28
25
36
26
14
10
1316
Same level as pre-covid Reduced level vs. pre-covid
Type of
activitiesGoing to local
shops for essentials
Going to
office/ workplace
Ordering
food delivery
Doing local
travel(Buses, auto,
Ola, Uber)
Question text: “Which of the following activities have you done in last 1 month", How frequently have you engaged in following activities in last 1 month"1. Among those who did activities before lockdown Note: Representative of all Urban India. Note: Town classification based on population: Large towns: 10L+ population, Small towns: 50k-10L population. Source: BCG COVID-19 Consumer Sentiment Survey May 18-23 2020, Jul 20-02 Aug,2020 (N=3,276 & N = 3,000 respectively)
Wave 4: May 18-23rd
Wave 5: Jul 20-02nd Aug
Going to local
shops for essentials
Going to
office/ workplace
Ordering
food delivery
Doing local
travel(Buses, auto,
Ola, Uber)
Small towns(Tier 2/3/4)
Large towns(Metro, Tier 1)
N/a N/a
N/a Activity restricted due to lockdown
% consumers who have done the activity in last 1 month1
India—Wave 5—Aug, 2020 India

14 Copyrig
ht
© 2
020
by B
ost
on C
onsu
ltin
g G
roup. All
rig
hts
rese
rved.
Safety measures essential to instill confidence among consumers
TravelDine out
Shopping local stores
Local travel
% c
onsu
mers
Question text: "Which of the following measures will make you comfortable to return regularly to following", Note: Representative of all Urban IndiaSource: BCG COVID-19 Consumer Sentiment Survey Jul 20-02 Aug,2020 (N = 3,000)
Hotelstay
Visitmalls
Movietheatre
Factors which will instill confidence among
consumers to restart activitiesConsumer speak
Local trains are crowded and I
don’t think sanitization is being
done. Will wait for vaccine
before I start travelling again
I use Swiggy, but order only from
places certified as hygienic & which
give temperature updates of staff
We are missing shopping, but will go to Malls only when ensure staff is taking necessary precautions and maintain social distancing
11% 13% 9% 11% 14% 14% 12%
44%32%
30% 32% 32% 34% 38%
30%37% 52% 44%
47% 42% 43%
15% 18%9% 12% 9%7% 7%
Only Govt restrictions eased
Govt restrictions eased + Adequate safety measures
Others
Govt restrictions eased + Vaccine invention/ No. of cases going down
India—Wave 5—Aug, 2020 India

15 Copyrig
ht
© 2
020
by B
ost
on C
onsu
ltin
g G
roup. All
rig
hts
rese
rved.
Consumer sentiments
How are consumers feeling?
Understanding the impact of pandemic on...Consumer behavior
Consumer behavior
How has their behavior actually
changed during COVID?

16 Copyrig
ht
© 2
020
by B
ost
on C
onsu
ltin
g G
roup. All
rig
hts
rese
rved.
E-comm acceleration: Significant increase in new user adoption, # of categories bought as well as share of spends
Rise in first time
online shoppers
Increase in # of categories
purchased online
Increase in
share of online spends
1.2x 45%Wave 5Pre-covid
4.45.8
Increase in # of ecommerce buyers (current users indexed to pre-covid users)
1.4x
% of pre COVID online buyers who
increased online purchasesIncrease in # of categories
bought online (per person)
I was going to buy groceries. During
checkout I noticed good offers on
Shampoos & Soaps, so added them too
Earlier we went to malls once & buy
everything for the month. But carrying it
back was a challenge. I have started using
Big Basket for monthly purchases
I purchased 2-3 items first and it was
delivered in 2 days without any hassle.
Started ordering all grocery items
online now
8/10 times used to buy vegetables from
street vendors. I heard that these stalls
can spread infection, so mostly buying
online now
Most items were not available in store
near my house. Social distancing was
also not maintained, so decided to buy
from Amazon
All online companies were assuring
safety measures taken in their
warehouse & staff, they seemed most
reliable to me
E-com
accelera
tion

Copyrig
ht
© 2
020
by B
ost
on C
onsu
ltin
g G
roup. All
rig
hts
rese
rved.
17
1.29x
1.27x
1.56x
1.43x
1.32x
1.38x
1.22x
1.33x
1.18x
1.12x
% new users satisfied with
purchase experience1
Question text: "What is the online purchase behavior for following categories that you have purchased in last 3-4 months", "In the next 6 months, how likely are you to continue buying", "experience of buying the following categories online for the first time"1. Among new users, scores for Very high willingness/ satisfaction. Note: Representative of all Urban India Source: BCG COVID-19 Consumer Sentiment Survey Jul 20-02 Aug,2020 (N = 3,000)
48% 30%
81% 52%
74% 46%
65% 40%
66% 59%
58% 32%
71% 58%
41% 31%
44% 34%
72% 53%
Significant new user adoption of digital purchase across categories…
…willingness to continue varies
Increase in # of ecommerce buyers (current users indexed to pre-covid users)
Fresh foods
Staples
Packaged food &
beverages
Household care
products
Personal care
products
Non-prescription
medications
Vitamins,
supplements
Cosmetics
Apparel/ Fashion
Electronics
Essentials:
Food
Essentials :
Non -Food
Health &
Fitness
Discretionary
expenses
New users across categories Future likelihood
% new users wiling to
continue in future1
E-com
accelera
tion

Copyrig
ht
© 2
020
by B
ost
on C
onsu
ltin
g G
roup. All
rig
hts
rese
rved.
18
Shift towards online spending across all categories among existing online shoppers
Question text: "Since lockdown, how the share of online spends changed on each of the following categories"Note: Representative of all Urban India. Source: BCG COVID-19 Consumer Sentiment Survey Jul 20-02 Aug,2020 (N = 3,000)
27%
29%
29%
24%
26%
22%
32%
25%
27%
28%
21%
22%
26%
28%
31%
32%
23%
41%
41%
40%
52%
49%
45%
48%
43%
46%
45%
34%
32%
32%
% consumers
Change in online spends in past 3-4
months among existing online shoppers
Increased in past 3-4months Decreased in past 3-4monthsSame as before
Fresh foods
Staples
Packaged food &
beverages
Household care
products
Personal care
products
Non-prescription
medications
Vitamins,
supplements
Cosmetics
Apparel/ Fashion
Electronics
Essentials:
Food
Essentials :
Non -Food
Health &
Fitness
Discretionary
expenses
45%
% online buyers
who increased
their online
spends
E-com
accelera
tion

19 Copyrig
ht
© 2
020
by B
ost
on C
onsu
ltin
g G
roup. All
rig
hts
rese
rved.
Made in India: Rise in conscious purchase of made in India products; prominent in food and personal care categories
% category buyers who consciously bought Made in
India products in past 3 months
These days there are lot of organic and ayurvedic options
coming from India. These products are healthy & safe for me
Indian food items are regarded as healthy…
Main thing is that Indian products are priced properly. Started
using Aashirvaad recently - it's good quality & I have faith in
that company
…and great value for money
36%
Consciously increased
purchase in Past 3 months
Same as before Consciously decreased
purchase in Past 3 months
51%
13%
Question text: "since the outbreak, which of the following best describes the change in your purchase behavior" "purchase behavior regarding Made in India products for following categories that you have purchased in last 3-4 months" . Note: Representative of all Urban IndiaSource: BCG COVID-19 Consumer Sentiment Survey Jul 20-02 Aug,2020 (N = 3,000)
…mostly in food & personal care categories36% consumers consciously bought 'Made in India'
products in past 3 months…
% respondents
Rise of Made in
India
32
29
21
19
12
12
10
9
8
Staples
Toys & games
HH care
Durables
Pack food &
Beverages
Mobile phones
Personal care
Kitchen
appliances
Home Décor
Essential:
Food
Essential:
Non food
Electronics
& gadgets

Copyrig
ht
© 2
020
by B
ost
on C
onsu
ltin
g G
roup. All
rig
hts
rese
rved.
20
Home
remedies
1.14x
Healthier
staples
Organic food Fitness
equipment
at home
Health/
Fitness apps
Nutritional
supplements
1.24x
Exercise/
Walk/Jog
Appliances
to cook
healthy food
Health
consultation
1.51x
1.31x 1.28x1.17x
1.24x1.17x 1.14x
Question text: "Change in purchase behavior for following wellness products/services since imposition of lockdown", Note: Representative of all Urban India Source: BCG COVID-19 Consumer Sentiment Survey Jul 20-02 Aug,2020 (N = 3,000)
Increase in the # of users(no of current users indexed to pre COVID users)
Healthy foodsHealth related
activities
1.3x Any healthy food
Health & wellness: Adoption of healthy food stronger than fitness activities
Rise in
health &
wellness
1.2x Any health related
activity
Increase in no. of new users
I have a made a routine of having Hot
water, Lemon & Honey in morning &
Haldi Doodh before sleep. They are
critical for improving immunity & keep
us safe from this infection
Our family has started having Vitamin C tablets
everyday. It improves immunity; we will keep
having it until Covid has not gone away
Used to think Organic food is only for
people on diet. Now realize organic food
is for everybody - It is pure & healthy
I make Kadah with Giloi, Haldi, Adrak, Ajwain,
Kali Mirchi, Laung to help improve immunity –
It gives us mental peace also since they are
good items & proven over generations
Adoption of health food & activities in past 3-4 months

21 Copyrig
ht
© 2
020
by B
ost
on C
onsu
ltin
g G
roup. All
rig
hts
rese
rved.
16 16 18 2014
2733
49 52
61 58 55 55 68
6057
39 32
23 26 27 2518 13 9 12 16
Household
care
Vitamins,
supplements
Staples Packaged F&B Personal
care
ApparelCosmetics,
make up
Non mobile
electronics
Mobile devices
Trade up
No Change
Trade down
Daily essentials Discretionary spends
Trading up:
Buying more expensive brands or higher
variant of same brand
Trading down:
Buying cheaper brands or lower variant of
same brand
No Change:
Buying the same brand
Trade up/ down: Trade up in essentials; while strong trade down across multiple discretionary categories
Change in brand choice in last 3-4 months vs pre-Covid
Trading up in essentials
Question text: In the past 3-4 months, how has the quantity & choice of your brands for these categories changed?Note: Representative of all Urban India Source: BCG COVID-19 Consumer Sentiment Survey Jul 20-02 Aug,2020 (N = 3,000)
Used Chakki Atta before but was not sure of safety precautions, shifted to
branded even though it is expensive
We used Phenyl before, but started using Lyzol to ensure full disinfection
Started using Saffola which is good for heart & health so don't mind paying
extra
Don’t need very expensive Shirts as meetings are all
online now. Started buying cheaper options
There was a price difference of 4K in Samsung & MI
with same features. Why spend extra for brand name?
I only used premium cosmetic brands, but since I am
at home only, using regular ones
Consumerspeak

22 Copyrig
ht
© 2
020
by B
ost
on C
onsu
ltin
g G
roup. All
rig
hts
rese
rved.
Question text: "Which statement best describes your usage behavior since the Lockdown?"Note: Representative of Urban India population Source: BCG COVID-19 Consumer Sentiment Survey Jul 20-02 Aug,2020 (N = 3,000)
Free OTT
1.16x 1.16x
YouTube Paid OTT Social media Debit/credit
cards
Video calls Online
fitness
classes
Online
educational
classes
Online
hobby
classes
Online
shopping
(Essentials)
Online
doctor
consult
Digital
wallets
Online
banking
1.14x 1.14x 1.18x 1.20x1.40x1.34x
1.14x
1.37x 1.42x1.27x 1.20x
Digital adoption: Significant adoption across digital activities, even traditionally offline activities like education
Digital media
Digital Payments
Digitallearning
SocialDigital
services
Rise in digital
adoption
Increase in the # of users
(Users since lockdown indexed to pre COVID users)
During lockdown, I had so much
free time so I subscribed to Hotstar
and Zee 5Consumer speak
All my outdoor exercises had
stopped but I wanted to stay fit. I
subscribed to online classes from
Cult
I didn’t want to handle cash to
avoid infection & started using
Gpay. It has reward points also
Adoption of digital activities since past 3-4 months
23 Copyrig
ht
© 2
020
by B
ost
on C
onsu
ltin
g G
roup. All
rig
hts
rese
rved.
2.5
0.0
0.5
Struggler Next billion Aspirer
1.0
2.0
1.5
Affluent Elite
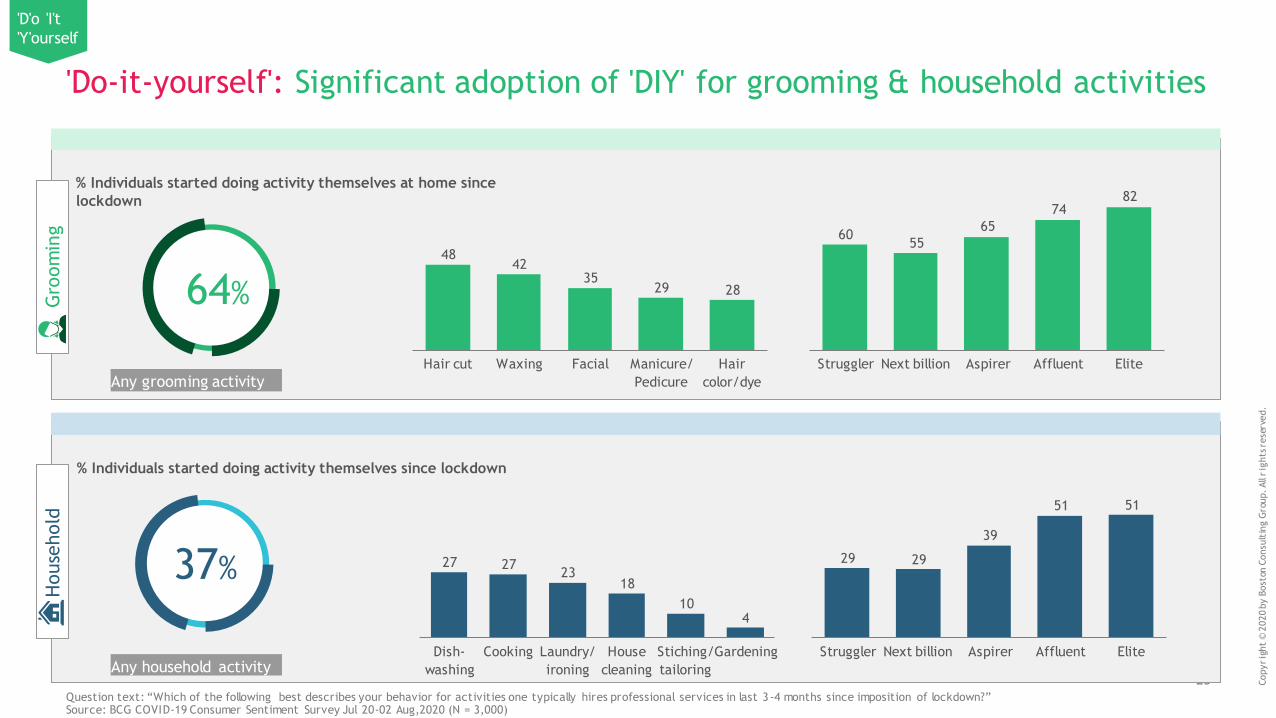
'Do-it-yourself': Significant adoption of 'DIY' for grooming & household activities
Any grooming activity
Gro
om
ing
% Individuals started doing activity themselves at home since
lockdown
4842
3529 28
Hair cut FacialWaxing Manicure/
Pedicure
Hair
color/dye
64%
Any household activity
House
hold
% Individuals started doing activity themselves since lockdown
37%
Question text: “Which of the following best describes your behavior for activities one typically hires professional services in last 3 -4 months since imposition of lockdown?” Source: BCG COVID-19 Consumer Sentiment Survey Jul 20-02 Aug,2020 (N = 3,000)
'D'o 'I't
'Y'ourself
27 2723
18
104
GardeningCookingDish-
washing
Laundry/
ironing
House
cleaning
Stiching/
tailoring
6055
65
7482
AffluentStruggler Next billion EliteAspirer
29 29
39
51 51
AspirerNext billionStruggler Affluent Elite

24 Copyrig
ht
© 2
020
by B
ost
on C
onsu
ltin
g G
roup. All
rig
hts
rese
rved.
Please reach out to the team for latest data and insights
Expert Consultants Knowledge Team
Kanika SanghiAssociate Director & Partner
Ankur JainAssociate Director
Nivedita BalajiAssociate Director
Isha ChawlaConsultant
Shriram Ramesh Consultant
Sidharth KapilSenior Associate
Ranjan AroraKnowledge Expert,
Team Manager
Prashant SrivashSr. Knowledge Analyst
Aditi BathiaLead Knowledge Analyst
Mitesh GoradiaSr. Knowledge Analyst
Abhaykaran KhuranaSr. Knowledge Analyst
Email us at: [email protected]

25 Copyrig
ht
© 2
020
by B
ost
on C
onsu
ltin
g G
roup. All
rig
hts
rese
rved.
The situation surrounding COVID-19 is dynamic and rapidly evolving, on a daily basis.
Although we have taken great care prior to producing this COVID-19 Consumer Sentiment
Research, it represents BCG’s view at a particular point in time. COVID-19 Consumer
Sentiment Research is not intended to: (i) constitute medical or safety advice, nor be a
substitute for the same; nor (ii) be seen as a formal endorsement or recommendation of a
particular response. As such you are advised to make your own assessment as to the
appropriate course of action to take, using COVID-19 Consumer Sentiment Research as
guidance. Please carefully consider local laws and guidance in your area, particularly the
most recent advice issued by your local (and national) health authorities, before making
any decision.

26
The services and materials provided by Boston Consulting Group (BCG) are subject to BCG's Standard Terms
(a copy of which is available upon request) or such other agreement as may have been previously executed by BCG.
BCG does not provide legal, accounting, or tax advice. The Client is responsible for obtaining independent advice
concerning these matters. This advice may affect the guidance given by BCG. Further, BCG has made no undertaking
to update these materials after the date hereof, notwithstanding that such information may become outdated
or inaccurate.
The materials contained in this presentation are designed for the sole use by the board of directors or senior
management of the Client and solely for the limited purposes described in the presentation. The materials shall not be
copied or given to any person or entity other than the Client (“Third Party”) without the prior written consent of BCG.
These materials serve only as the focus for discussion; they are incomplete without the accompanying oral commentary
and may not be relied on as a stand-alone document. Further, Third Parties may not, and it is unreasonable for any
Third Party to, rely on these materials for any purpose whatsoever. To the fullest extent permitted by law (and except
to the extent otherwise agreed in a signed writing by BCG), BCG shall have no liability whatsoever to any Third Party,
and any Third Party hereby waives any rights and claims it may have at any time against BCG with regard to the
services, this presentation, or other materials, including the accuracy or completeness thereof. Receipt and review of
this document shall be deemed agreement with and consideration for the foregoing.
BCG does not provide fairness opinions or valuations of market transactions, and these materials should not be relied on
or construed as such. Further, the financial evaluations, projected market and financial information, and conclusions
contained in these materials are based upon standard valuation methodologies, are not definitive forecasts, and are not
guaranteed by BCG. BCG has used public and/or confidential data and assumptions provided to BCG by the Client.
BCG has not independently verified the data and assumptions used in these analyses. Changes in the underlying data or
operating assumptions will clearly impact the analyses and conclusions.
Copyrig
ht
© 2
020
by B
ost
on C
onsu
ltin
g G
roup. All
rig
hts
rese
rved.

bcg.com
Related Documents