COVID-19 BUSINESS IMPACT SURVEY WAVE 8 September 18, 2020

Welcome message from author
This document is posted to help you gain knowledge. Please leave a comment to let me know what you think about it! Share it to your friends and learn new things together.
Transcript

COVID-19 BUSINESS IMPACT SURVEY WAVE 8
September 18, 2020
TABLE OF CONTENTS• Executive Summary• Demographics• Economic Sentiment• Business Impacts• Status of Office Buildings
• Likelihood of Traveling
• Methodology
• Statistical Notes• Appendix
© 2020 ACEC RESEARCH INSTITUTE. ALL RIGHTS RESERVED. 2
EXECUTIVE SUMMARY
3© 2020 ACEC RESEARCH INSTITUTE. ALL RIGHTS RESERVED.

DEMOGRAPHICS• The geographic location of respondents’ organizations are statistically similar to all
previous waves.• Throughout all waves, roughly half of firms report fewer than 50 FTEs. The percentage of
firms falling into higher FTE ranges has also remained constant.• The median number of FTEs in Wave 8 is 31 compared to 29 in Wave 7, 26 in Wave 6, 25 in
Waves 5 and 4, 26.5 in Wave 3 and 23 in the first two waves.• Compared with previous Waves, there are significantly fewer firms in Wave 8 with 11 to 25 FTEs
(19% vs. 22%). There are significantly more firms with 51 to 200 FTEs (26% to 22%).• The largest organization in Wave 8 has 9,500 FTEs. This figure has fluctuated between 11,000
and 7,500 throughout the series.
4© ACEC RESEARCH INSTITUTE. ALL RIGHTS RESERVED.

ECONOMIC SENTIMENT• Although the vast majority of firms (75%) still feel the condition of the US Economy is
worse compared to March 1, sentiment is improving slightly. In addition, most firms report their finances and cash flow are the same or better than before the Pandemic and better than in Wave 7 (late May).
• Firms with 25 or fewer FTEs are more likely than other firms to say their cash flow (35%) is worse today, however, their views are also improving compared to previous surveys.
• Pessimism about a quick rebound continues to grow, even six months after the Pandemic began.
• Fewer firms are optimistic about a “return to normal” within six months compared to previous waves (19% now vs. 23% in Wave 7 and 37% in Wave 5).
• Conversely, a plurality of firms still feel it will take another 12 to 18 months (46% vs. 47% in Wave 7) to return to normal.
5© 2020 ACEC RESEARCH INSTITUTE. ALL RIGHTS RESERVED.

BUSINESS IMPACTS• Signaling a slightly improving situation, fewer firms plan to take additional cost cutting actions
in the next 90 days compared to the last survey (66% compared to 73% in Wave 7).• Firms with 201 to 500 FTE are more likely to lay-off/eliminate staff positions (28%) than others.• Firms with more than 500 FTEs are much more likely to say they will reduce their physical office
space (29%) than others.• While 31% of firms say their backlog has increased since the beginning of March, 47% say their
backlog has decreased indicating the industry as a whole has been more negatively impacted than positively impacted by the Pandemic.
• Firms with 51 to 200 FTE are more likely to say their backlog has decreased (52%) compared to others, while firms with more than 500 FTE are more likely to say their backlog has increased (47%).
• The backlog of projects varies widely among firms. While 29% say they have less than 3 months of backlog, 30% have 7 to 12 months of backlog and 13% have more than 12 months. Larger firms have larger backlogs than smaller firms.
• Nearly six out of ten firms (58%) indicate they have experienced Pandemic-related work stoppages. Larger firms are more likely to be affected by stoppages than smaller firms possibly due to their larger client base.
• More firms report work stoppages in commercial (35%) and transportation (35%) markets than other markets. In general, larger firms are more likely to have experienced work stoppages in more markets than smaller firms.
6© 2020 ACEC RESEARCH INSTITUTE. ALL RIGHTS RESERVED.

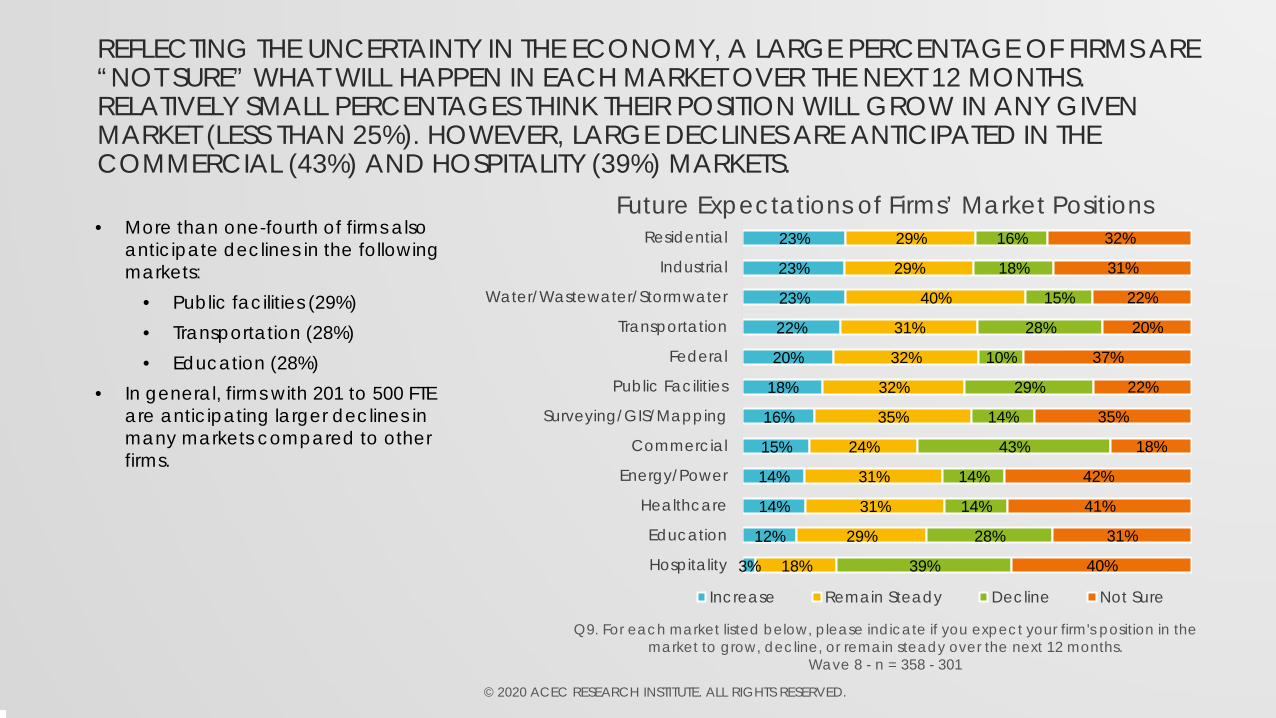
BUSINESS IMPACTS (CONT’D)• Reflecting the uncertainty in the economy, a large percentage of firms are “not sure”
what will happen in each market over the next 12 months. Relatively small percentages think their position will grow in any given market (less than 25%). However, large declines are anticipated in the commercial (43%) and hospitality (39%) markets.
• More than one-fourth of firms also anticipate declines in the following markets:• Public facilities (29%)• Transportation (28%)• Education (28%)
• In general, firms with 201 to 500 FTE are anticipating larger declines in many markets compared to other firms.
7© 2020 ACEC RESEARCH INSTITUTE. ALL RIGHTS RESERVED.

STATUS OF OFFICE BUILDINGS• The median number of office building locations for a firm is two. However, the number of
locations is highly dependent upon firm size.• Median number of office building locations by firm size:
• 0 to 25 FTE – 1• 26 to 50 FTE – 2• 51 to 200 FTE – 4• 201 to 500 FTE – 14• 501+ FTE – 32
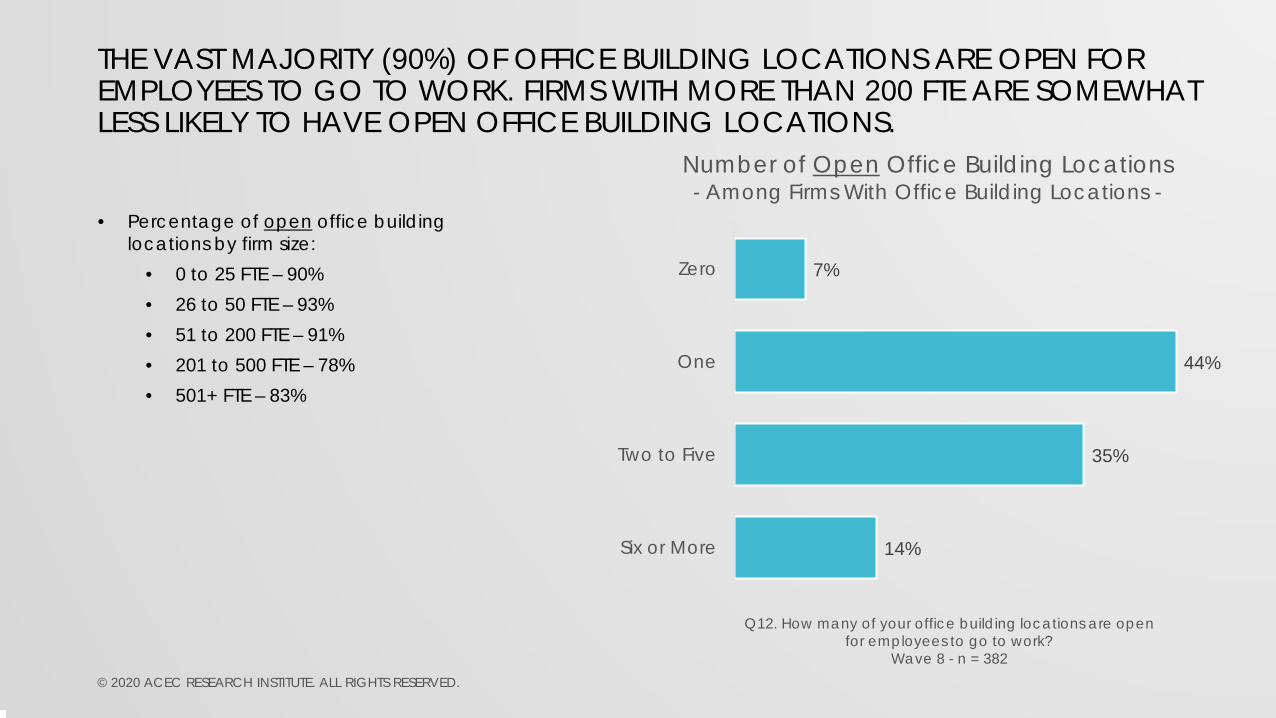
• The vast majority (90%) of office building locations are open for employees to go to work. Firms with more than 200 FTE are somewhat less likely to have open office building locations.
• Percentage of open office building locations by firm size:• 0 to 25 FTE – 90%• 26 to 50 FTE – 93%• 51 to 200 FTE – 91%• 201 to 500 FTE – 78%• 501+ FTE – 83%
8© 2020 ACEC RESEARCH INSTITUTE. ALL RIGHTS RESERVED.

STATUS OF OFFICE BUILDINGS (CONT’D)• Despite the vast majority of office buildings being open, an average of 56% of
employees are working in these buildings. Larger firms are less likely to have employees working in office buildings.
• Percentage of employees working in open office building locations by firm size:• 0 to 25 FTE – 67%• 26 to 50 FTE – 62%• 51 to 200 FTE – 43%• 201 to 500 FTE – 44%• 501+ FTE – 21%
• Among firms with more than one office building location, 71% indicate that HQ makes all decisions regarding the operation of all locations.
• Few firms (7%) have opened office building locations and then closed them again. However, it is much more common among firms with more than 200 FTE (25%).
• Most firms (74%) are being “very flexible” when it comes to accommodating remote working for various reasons. Another 19% say they are being “flexible”. More firms with more than 200 FTE report being “very flexible” (86%).
9© 2020 ACEC RESEARCH INSTITUTE. ALL RIGHTS RESERVED.
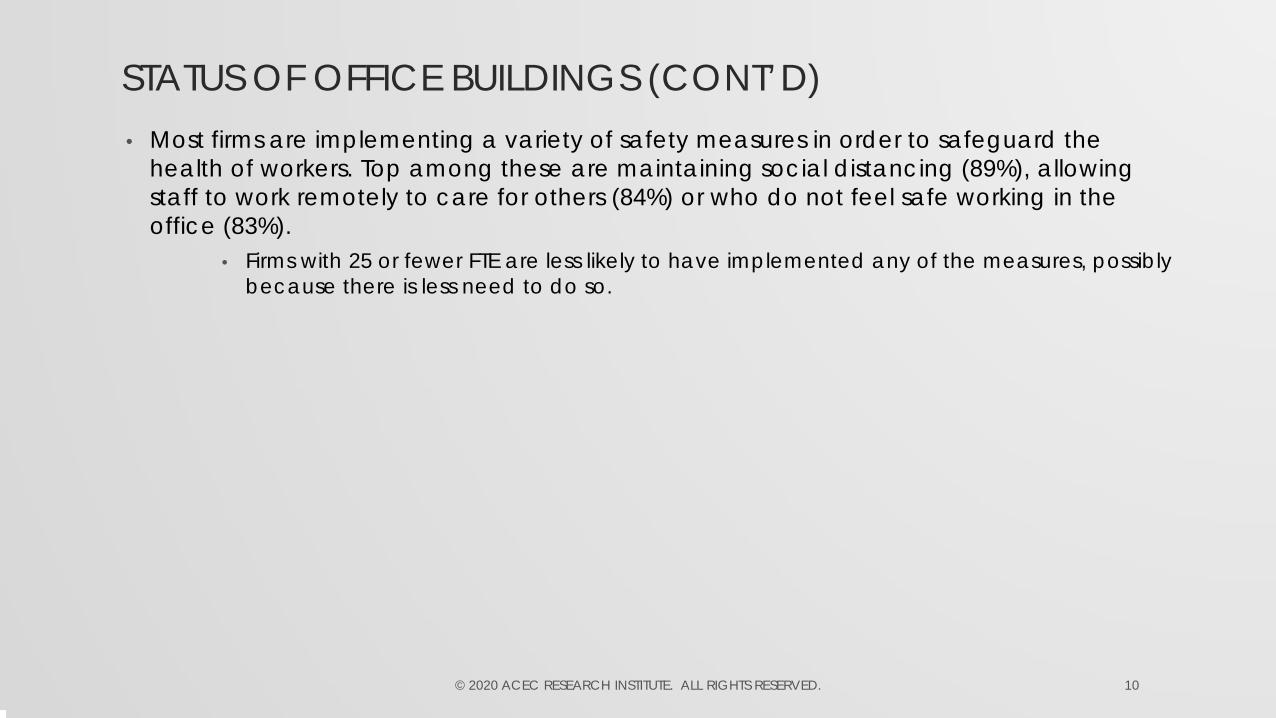
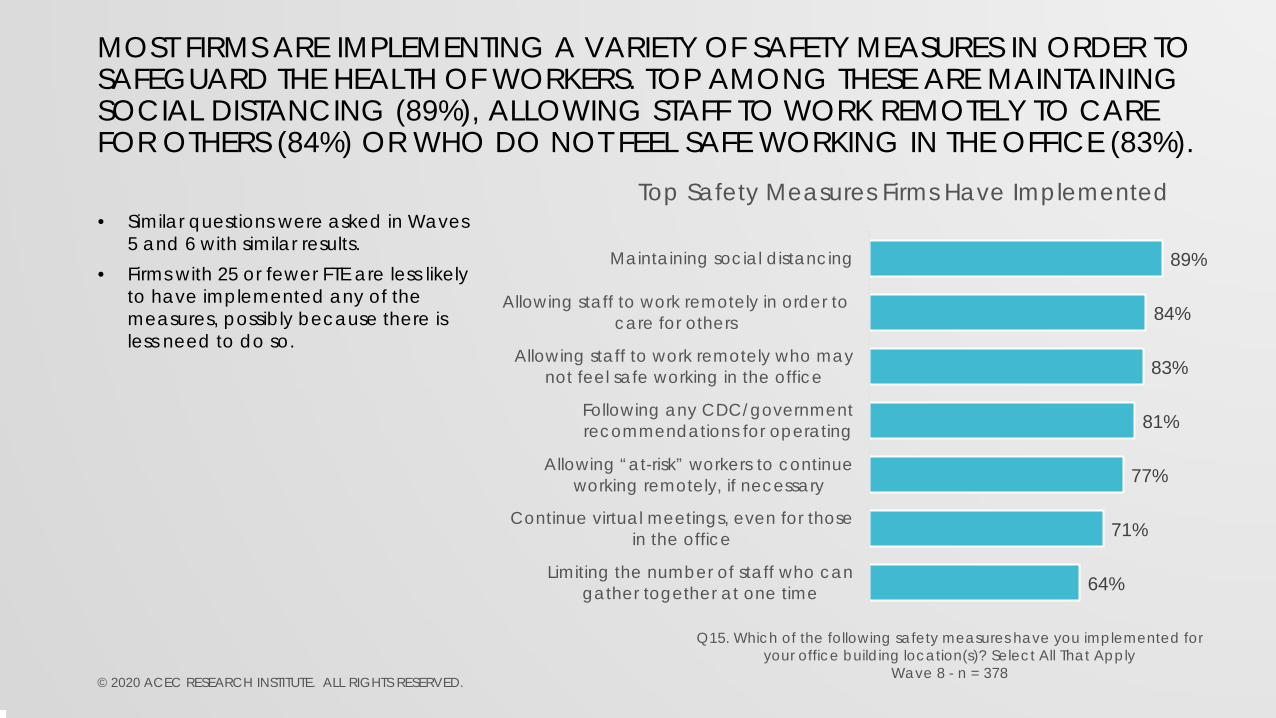
STATUS OF OFFICE BUILDINGS (CONT’D)• Most firms are implementing a variety of safety measures in order to safeguard the
health of workers. Top among these are maintaining social distancing (89%), allowing staff to work remotely to care for others (84%) or who do not feel safe working in the office (83%).
• Firms with 25 or fewer FTE are less likely to have implemented any of the measures, possibly because there is less need to do so.
10© 2020 ACEC RESEARCH INSTITUTE. ALL RIGHTS RESERVED.

LIKELIHOOD OF TRAVELING• The percentage of firms that will allow air travel has remained the same since Wave 7.
However, the percentage who will not allow air travel to meetings has increased. The one exception is for meetings with 10 or fewer attendees, which has stayed the same.
• As with air travel, the percentage of firms that will NOT allow travel by car has increasedsince Wave 7. The one exception is for meetings with 10 or fewer attendees. However, unlike air travel, fewer firms indicate they will allow travel by car compared to Wave 7.
• Slightly more firms are likely to allow air travel to meet with clients in the next six months than in Wave 7 (64% vs. 60%). However, likelihood of allowing travel to meet with clients by car has remained steady (84% vs. 83%).
• Although there are no statistically significant differences by firm size when allowing travel by car to in-person client meetings, there are differences when considering air travel. Smaller firms are less likely to allow air travel to client meetings than larger firms:
• 0 to 25 FTEs = 56% “Definitely/Probably Will• 26 to 50 FTEs = 71%• 51 to 200 FTEs = 65%• 201 to 500 FTEs = 74%• 501 or more FTEs = 88%
11© 2020 ACEC RESEARCH INSTITUTE. ALL RIGHTS RESERVED.
DEMOGRAPHICS
12© 2020 ACEC RESEARCH INSTITUTE. ALL RIGHTS RESERVED.

© 2020 ACEC RESEARCH INSTITUTE. ALL RIGHTS RESERVED. 13
4%
7%
15%
7%
19%
6%
14%
11%
16%
5%
7%
16%
7%
18%
4%
13%
13%
17%
4%
7%
17%
6%
19%
5%
14%
13%
15%
4%
8%
16%
7%
19%
3%
11%
14%
18%
New England
Middle Atlantic
East North Central
West North Central
South Atlantic
East South Central
West South Central
Mountain
Pacific
Census RegionWave 5Wave 6Wave 7Wave 8
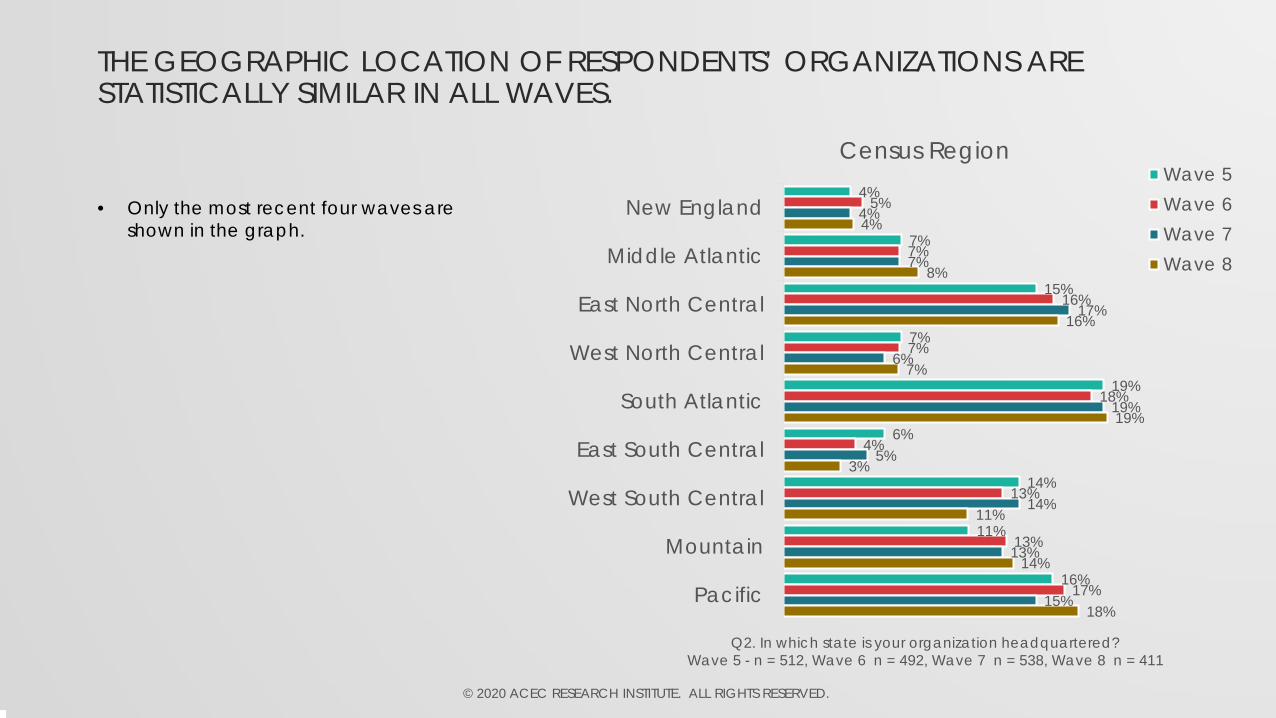
THE GEOGRAPHIC LOCATION OF RESPONDENTS’ ORGANIZATIONS ARE STATISTICALLY SIMILAR IN ALL WAVES.
© 2020 ACEC RESEARCH INSTITUTE. ALL RIGHTS RESERVED.
Q2. In which state is your organization headquartered?Wave 5 - n = 512, Wave 6 n = 492, Wave 7 n = 538, Wave 8 n = 411
• Only the most recent four waves are shown in the graph.

THROUGHOUT ALL WAVES, ROUGHLY HALF OF FIRMS REPORT FEWER THAN 50FTES. THE PERCENTAGE OF FIRMS FALLING INTO HIGHER FTE RANGES HAS ALSO REMAINED CONSTANT.
28%
22%
18%
22%
6%
4%
27%
23%
20%
22%
6%
3%
25%
22%
19%
22%
7%
4%
27%
19%
19%
26%
5%
4%
0 to 10
11 to 25
26 to 50
51 to 200
201 to 500
501 or more
Number of FTEs at Organization
Wave 5Wave 6Wave 7Wave 8
© 2020 ACEC RESEARCH INSTITUTE. ALL RIGHTS RESERVED.
• Only the most recent four waves are shown in the graph.
• The median number of FTEs in Wave 8 is 31 compared to 29 in Wave 7, 26 in Wave 6, 25 in Waves 5 and 4, 26.5 in Wave 3 and 23 in the first two waves.
• Compared with previous Waves, there are significantly fewer firms in Wave 8 with 11 to 25 FTEs (19% vs. 22%). There are significantly more firms with 51 to 200 FTEs (26% to 22%).
• The largest organization in Wave 8 has 9,500 FTEs. This figure has fluctuated between 11,000 and 7,500 throughout the series.
• Throughout this report all questions are reported by firm size and statistically significant differences are noted. Q3. Including yourself, how many full-time equivalent employees (FTEs) do
you have? If you are not sure, please provide your best estimate.Wave 5 - n = 512, Wave 6 n = 492, Wave 7 n = 538, Wave 8 n = 411

ECONOMIC SENTIMENT
16© 2020 ACEC RESEARCH INSTITUTE. ALL RIGHTS RESERVED.

4%
6%
11%
12%
14%
20%
22%
32%
13%
23%
26%
33%
9%12%
7%
13%
42%
42%
41%
36%
37%
38%
40%
40%
87%
82%
82%
75%
44%
37%
37%
32%
45%
38%
34%
27%
U.S. economy - Wave 5Wave 6Wave 7Wave 8
Firm’s overall finances - Wave 5Wave 6Wave 7Wave 8
Firm’s cash flow - Wave 5Wave 6Wave 7Wave 8
Economic Sentiment Today Compared to March 1
Better Same Worse
ALTHOUGH THE VAST MAJORITY OF FIRMS (75%) STILL FEEL THE CONDITION OF THE US ECONOMY IS WORSE COMPARED TO MARCH 1, SENTIMENT IS IMPROVING SLIGHTLY. IN ADDITION, MOST FIRMS REPORT THEIR FINANCES AND CASH FLOW ARE THE SAME OR BETTER THAN PRE-PANDEMIC AND BETTER THAN IN WAVE 7 (LATE MAY).
© 2020 ACEC RESEARCH INSTITUTE. ALL RIGHTS RESERVED.
• Only the most recent four waves are shown in the graph.
• As has been the case in previous waves, there is one statistically significant difference by firm size:
• Firms with 25 or fewer FTEs are more likely than other firms to say their cash flow (35%) is worse today, however, their views are also improving compared to previous surveys.
Q4. Compared to March 1, how do you feel about each of the following today?“Not sure” responses omitted from calculations
Wave 5 - n = 510 – 504, Wave 6 - n = 492 – 491, Wave 7 - n = 536 – 535, Wave 8 - n = 411 – 409
12%
25%
16%
11%
8%
2%
5%
16%
6%
9%
18%
21%
15%
8%
4%
6%
15%
5%
6%
17%
29%
18%
7%
4%
6%
7%
5%
3%
16%
29%
17%
4%
4%
10%
11%
6%
3 months from now
6 months from now
12 months from now
18 months from now
24 months from now
More than 24 months from now
Never
Not sure
It’s already the same now
Anticipation of Business Returning to Normal*
Wave 5Wave 6Wave 7Wave 8
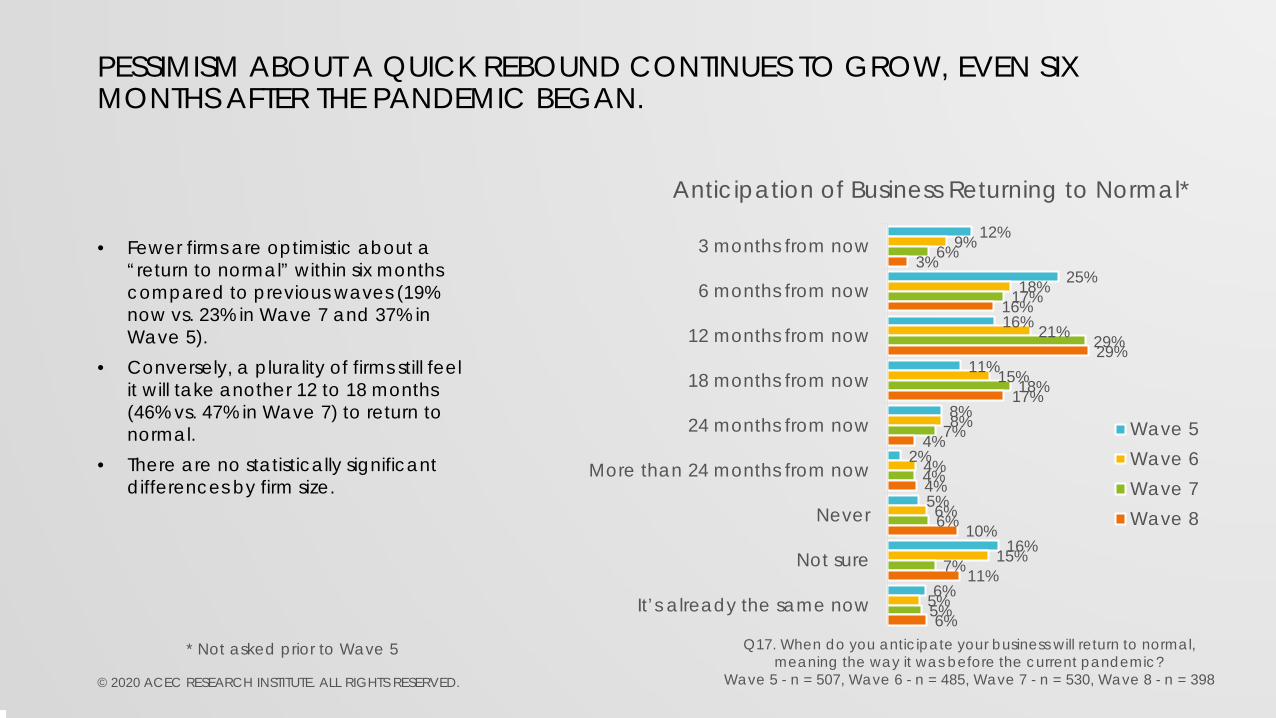
PESSIMISM ABOUT A QUICK REBOUND CONTINUES TO GROW, EVEN SIX MONTHS AFTER THE PANDEMIC BEGAN.
© 2020 ACEC RESEARCH INSTITUTE. ALL RIGHTS RESERVED.
Q17. When do you anticipate your business will return to normal, meaning the way it was before the current pandemic?
Wave 5 - n = 507, Wave 6 - n = 485, Wave 7 - n = 530, Wave 8 - n = 398
• Fewer firms are optimistic about a “return to normal” within six months compared to previous waves (19% now vs. 23% in Wave 7 and 37% in Wave 5).
• Conversely, a plurality of firms still feel it will take another 12 to 18 months (46% vs. 47% in Wave 7) to return to normal.
• There are no statistically significant differences by firm size.
* Not asked prior to Wave 5
BUSINESS IMPACTS
19© 2020 ACEC RESEARCH INSTITUTE. ALL RIGHTS RESERVED.
33%
26%
17%
17%
15%
13%
11%
10%
10%
10%
8%
7%
34%
Speed up collection of accounts receivable
Freeze non-essential purchases
Freeze salary/pay increases
Suspend or eliminate bonuses/incentives
Lay-off/eliminate staff positions
Reduce executive salaries/pay
Implement a hiring freeze
Reduce employees’/contractors’ hours worked
Reduce physical office space
Take out/leverage Line of Credit
Furlough staff positions
Lay-off/eliminate contractor/temporary positions
None of the above/Does not apply
Additional Cost Cutting/Cash Management Actions Anticipated in Next 90 Days*
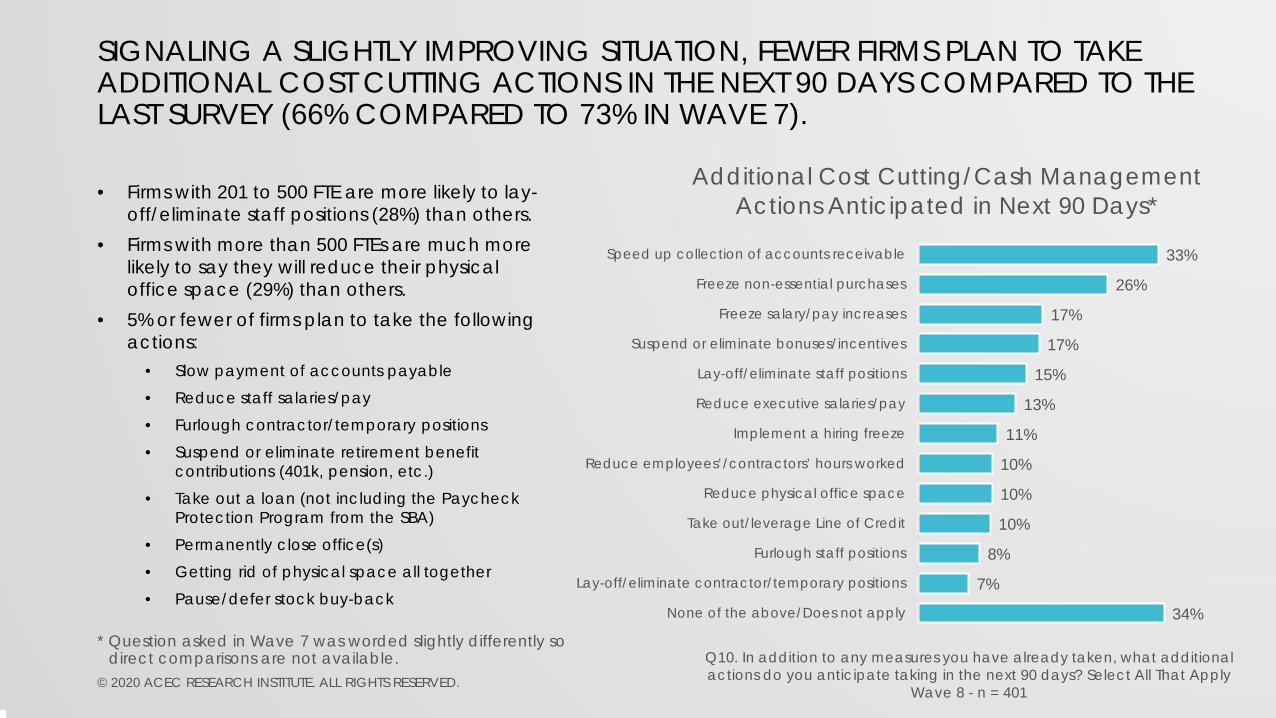
SIGNALING A SLIGHTLY IMPROVING SITUATION, FEWER FIRMS PLAN TO TAKE ADDITIONAL COST CUTTING ACTIONS IN THE NEXT 90 DAYS COMPARED TO THE LAST SURVEY (66% COMPARED TO 73% IN WAVE 7).
© 2020 ACEC RESEARCH INSTITUTE. ALL RIGHTS RESERVED.
Q10. In addition to any measures you have already taken, what additional actions do you anticipate taking in the next 90 days? Select All That Apply
Wave 8 - n = 401
• Firms with 201 to 500 FTE are more likely to lay-off/eliminate staff positions (28%) than others.
• Firms with more than 500 FTEs are much more likely to say they will reduce their physical office space (29%) than others.
• 5% or fewer of firms plan to take the following actions:
• Slow payment of accounts payable• Reduce staff salaries/pay• Furlough contractor/temporary positions• Suspend or eliminate retirement benefit
contributions (401k, pension, etc.)• Take out a loan (not including the Paycheck
Protection Program from the SBA)• Permanently close office(s)• Getting rid of physical space all together• Pause/defer stock buy-back
* Question asked in Wave 7 was worded slightly differently so direct comparisons are not available.

8%
23%
23%
30%
17%
Increased a lot
Increased a little
Stayed about the same
Decreased a little
Decreased a lot
Backlog Status
WHILE 31% OF FIRMS SAY THEIR BACKLOG HAS INCREASED SINCE THE BEGINNING OF MARCH, 47% SAY THEIR BACKLOG HAS DECREASED INDICATING THE INDUSTRY AS A WHOLE HAS BEEN MORE NEGATIVELY IMPACTED THAN POSITIVELY IMPACTED BY THE PANDEMIC.
© 2020 ACEC RESEARCH INSTITUTE. ALL RIGHTS RESERVED.
Q5. Since the beginning of the pandemic in March, has your backlog increased, decreased or stayed about the same?
Wave 8 - n = 410
• Firms with 51 to 200 FTE are more likely to say their backlog has decreased (52%) compared to others, while firms with more than 500 FTE are more likely to say their backlog has increased (47%).

29%
28%
30%
13%
3 months or less
4 to 6 months
7 to 12 months
More than 12 months
Months of BacklogMedian = 6 Months
THE BACKLOG OF PROJECTS VARIES WIDELY AMONG FIRMS. WHILE 29% SAYTHEY HAVE LESS THAN 3 MONTHS OF BACKLOG, 30% HAVE 7 TO 12 MONTHSOF BACKLOG AND 13% HAVE MORE THAN 12 MONTHS. LARGER FIRMS HAVE LARGER BACKLOGS THAN SMALLER FIRMS.
© 2020 ACEC RESEARCH INSTITUTE. ALL RIGHTS RESERVED.
Q6. Assuming your firm wins no new projects, how many months of backlog does your firm have?
Wave 8 - n = 405
• Backlog increases as the size of firms increase. The median backlog (in months) by firm size is:
• 0 to 25 FTE – 3.5• 26 to 50 FTE – 8• 51 to 200 FTE – 8• 201 to 500 FTE – 11• 501+ FTE – 10

58%
39%
2%
Yes
No
Not sure
Incidence of Pandemic-Related Work Stoppages
NEARLY SIX OUT OF TEN FIRMS (58%) INDICATE THEY HAVE EXPERIENCEDPANDEMIC-RELATED WORK STOPPAGES. LARGER FIRMS ARE MORE LIKELY TOBE AFFECTED BY STOPPAGES THAN SMALLER FIRMS POSSIBLY DUE TO THEIR LARGER CLIENT BASE.
© 2020 ACEC RESEARCH INSTITUTE. ALL RIGHTS RESERVED.
Q7. Have you been asked to stop work on any projects due to the Covid-19 pandemic?Wave 8 - n = 409
• Work stoppage incidence by firm size:• 0 to 25 FTE – 48%• 26 to 50 FTE – 50%• 51 to 200 FTE – 72%• 201 to 500 FTE – 84%• 501+ FTE – 88%

35%35%
24%20%19%
17%17%
14%13%
11%10%
7%9%
CommercialTransportation
Public FacilitiesResidentialHospitality
Water/Wastewater/StormwaterEducation
IndustrialHealthcare
Surveying/GIS/MappingEnergy/Power
FederalOther
Markets Affected by Work Stoppages- Among Firms Experiencing Stoppages -
MORE FIRMS REPORT WORK STOPPAGES IN COMMERCIAL (35%) AND TRANSPORTATION (35%) MARKETS THAN OTHER MARKETS.
© 2020 ACEC RESEARCH INSTITUTE. ALL RIGHTS RESERVED.
Q8. In which of the following markets have you had projects cancelled or put on hold due to the COVID-19 pandemic? Select All That Apply
Wave 8 - n = 237
• In general, larger firms are more likely to have experienced work stoppages in more markets than smaller firms. For example, 26% of firms with 25 or fewer FTEs experienced a work stoppage in transportation compared to 63% of firms with 201 to 500 FTE.
• The “other” markets mentioned are mostly aviation-related.
3%
12%
14%
14%
15%
16%
18%
20%
22%
23%
23%
23%
18%
29%
31%
31%
24%
35%
32%
32%
31%
40%
29%
29%
39%
28%
14%
14%
43%
14%
29%
10%
28%
15%
18%
16%
40%
31%
41%
42%
18%
35%
22%
37%
20%
22%
31%
32%
Hospitality
Education
Healthcare
Energy/Power
Commercial
Surveying/GIS/Mapping
Public Facilities
Federal
Transportation
Water/Wastewater/Stormwater
Industrial
Residential
Future Expectations of Firms’ Market Positions
Increase Remain Steady Decline Not Sure
Q9. For each market listed below, please indicate if you expect your firm's position in the market to grow, decline, or remain steady over the next 12 months.
Wave 8 - n = 358 - 301
REFLECTING THE UNCERTAINTY IN THE ECONOMY, A LARGE PERCENTAGE OF FIRMS ARE “NOT SURE” WHAT WILL HAPPEN IN EACH MARKET OVER THE NEXT 12 MONTHS. RELATIVELY SMALL PERCENTAGES THINK THEIR POSITION WILL GROW IN ANY GIVEN MARKET (LESS THAN 25%). HOWEVER, LARGE DECLINES ARE ANTICIPATED IN THE COMMERCIAL (43%) AND HOSPITALITY (39%) MARKETS.
© 2020 ACEC RESEARCH INSTITUTE. ALL RIGHTS RESERVED.
• More than one-fourth of firms also anticipate declines in the following markets:
• Public facilities (29%)• Transportation (28%)• Education (28%)
• In general, firms with 201 to 500 FTE are anticipating larger declines in many markets compared to other firms.

STATUS OF OFFICE BUILDINGS
26© 2020 ACEC RESEARCH INSTITUTE. ALL RIGHTS RESERVED.

5%
44%
35%
16%
None
One
Two to Five
Six or More
Number of Office Building LocationsMedian = 2
THE MEDIAN NUMBER OF OFFICE BUILDING LOCATIONS FOR A FIRM IS TWO. HOWEVER, THE NUMBER OF LOCATIONS IS HIGHLY DEPENDENT UPON FIRM SIZE.
© 2020 ACEC RESEARCH INSTITUTE. ALL RIGHTS RESERVED.
Q11. How many office building locations does your firm currently have in the US? If your firm only operates from residential locations, please enter “0”.
Wave 8 - n = 402
• Median number of office building locations by firm size:
• 0 to 25 FTE – 1• 26 to 50 FTE – 2• 51 to 200 FTE – 4• 201 to 500 FTE – 14• 501+ FTE – 32
7%
44%
35%
14%
Zero
One
Two to Five
Six or More
Number of Open Office Building Locations- Among Firms With Office Building Locations -
THE VAST MAJORITY (90%) OF OFFICE BUILDING LOCATIONS ARE OPEN FOR EMPLOYEES TO GO TO WORK. FIRMS WITH MORE THAN 200 FTE ARE SOMEWHAT LESS LIKELY TO HAVE OPEN OFFICE BUILDING LOCATIONS.
© 2020 ACEC RESEARCH INSTITUTE. ALL RIGHTS RESERVED.
Q12. How many of your office building locations are open for employees to go to work?
Wave 8 - n = 382
• Percentage of open office building locations by firm size:
• 0 to 25 FTE – 90%• 26 to 50 FTE – 93%• 51 to 200 FTE – 91%• 201 to 500 FTE – 78%• 501+ FTE – 83%

34%
17%
10%
39%
25% or less
26% to 50%
51% to 75%
76% to 100%
Percentage of Employees Working in Office Building Locations
Average = 56%- Among Firms With Open Office Building Locations -
DESPITE THE VAST MAJORITY OF OFFICE BUILDINGS BEING OPEN, AN AVERAGE OF 56% OF EMPLOYEES ARE WORKING IN THESE BUILDINGS. LARGER FIRMS ARE LESS LIKELY TO HAVE EMPLOYEES WORKING IN OFFICE BUILDINGS.
© 2020 ACEC RESEARCH INSTITUTE. ALL RIGHTS RESERVED.
Q13. What percentage of your employees are working from your open office building location(s)?
Wave 8 - n = 355
• Percentage of employees working in openoffice building locations by firm size:
• 0 to 25 FTE – 67%• 26 to 50 FTE – 62%• 51 to 200 FTE – 43%• 201 to 500 FTE – 44%• 501+ FTE – 21%

71%
16%
13%
HQ makes all decisions andpolicies regarding operations
Each branch makes its owndecisions and policiesregarding operations
Other
Making Decisions About Office Building Locations- Among Firms With More Than One Office Building -
AMONG FIRMS WITH MORE THAN ONE OFFICE BUILDING LOCATION, 71% INDICATE THAT HQ MAKES ALL DECISIONS REGARDING THE OPERATION OF ALL LOCATIONS.
© 2020 ACEC RESEARCH INSTITUTE. ALL RIGHTS RESERVED.
Q14. Are decisions and policies regarding the operation of each branch location being made by HQ or at the branch level?
Wave 8 - n = 205
• “Other” responses provided indicate that HQ and branches make operating decisions in consultation together. This is more common among firms with at least 201 FTE.

7%
93%
Yes
No
Incidence of Opening and Re-Closing Office Building Locations
- Among Firms With Office Building Location(s) -
FEW FIRMS (7%) HAVE OPENED OFFICE BUILDING LOCATIONS AND THEN CLOSED THEM AGAIN. HOWEVER, IT IS MUCH MORE COMMON AMONG FIRMS WITH MORE THAN 200 FTE.
© 2020 ACEC RESEARCH INSTITUTE. ALL RIGHTS RESERVED.
Q16. Have you opened any office building locations for staff to work and then had to close the office again?
Wave 8 - n = 379
• Incidence of opening and re-closing office building locations by firm size:
• 0 to 25 FTE – 5%• 26 to 50 FTE – 3%• 51 to 200 FTE – 6%• 201 to 500 FTE – 26%• 501+ FTE – 24%

74%
19%
6%
1%
0%
Very flexible
Flexible
Somewhat flexible
Not very flexible
Not at all flexible
Flexibility of Accommodating Remote Working- Among Firms With Office Building Location(s) -
MOST FIRMS (74%) ARE BEING “VERY FLEXIBLE” WHEN IT COMES TO ACCOMMODATING REMOTE WORKING FOR VARIOUS REASONS. ANOTHER 19% SAY THEY ARE BEING “FLEXIBLE”. FIRMS WITH MORE THAN 200 FTE REPORT BEING THE MOST FLEXIBLE.
© 2020 ACEC RESEARCH INSTITUTE. ALL RIGHTS RESERVED.
Q17. How flexible are you being with staff working remotely due to a personal health situation, children in school at home, childcare, elder
care, mass transit, etc.?Wave 8 - n = 378
• Percentage of firms being “very flexible” by firm size:
• 0 to 25 FTE – 73%• 26 to 50 FTE – 71%• 51 to 200 FTE – 75%• 201 to 500 FTE – 84%• 501+ FTE – 88%
89%
84%
83%
81%
77%
71%
64%
Maintaining social distancing
Allowing staff to work remotely in order tocare for others
Allowing staff to work remotely who maynot feel safe working in the office
Following any CDC/governmentrecommendations for operating
Allowing “at-risk” workers to continue working remotely, if necessary
Continue virtual meetings, even for thosein the office
Limiting the number of staff who cangather together at one time
Top Safety Measures Firms Have Implemented
MOST FIRMS ARE IMPLEMENTING A VARIETY OF SAFETY MEASURES IN ORDER TO SAFEGUARD THE HEALTH OF WORKERS. TOP AMONG THESE ARE MAINTAININGSOCIAL DISTANCING (89%), ALLOWING STAFF TO WORK REMOTELY TO CAREFOR OTHERS (84%) OR WHO DO NOT FEEL SAFE WORKING IN THE OFFICE (83%).
© 2020 ACEC RESEARCH INSTITUTE. ALL RIGHTS RESERVED.
Q15. Which of the following safety measures have you implemented for your office building location(s)? Select All That Apply
Wave 8 - n = 378
• Similar questions were asked in Waves 5 and 6 with similar results.
• Firms with 25 or fewer FTE are less likely to have implemented any of the measures, possibly because there is less need to do so.
48%
46%
35%
32%
25%
25%
11%
Having some staff work remotely andsome staff work in the office
Deep cleaning the office on adaily/weekly basis
Closing the office again if anyone testspositive for COVID-19
Taking the temperature of workers beforethey enter the office each day
Rotating staff who come to the office sothat everyone has some time in the office
Closing the office again if anyonedevelops COVID-19 symptoms
Testing staff for exposure to COVID-19before allowing them to work in the office
Other Safety Measures Firms Have Implemented
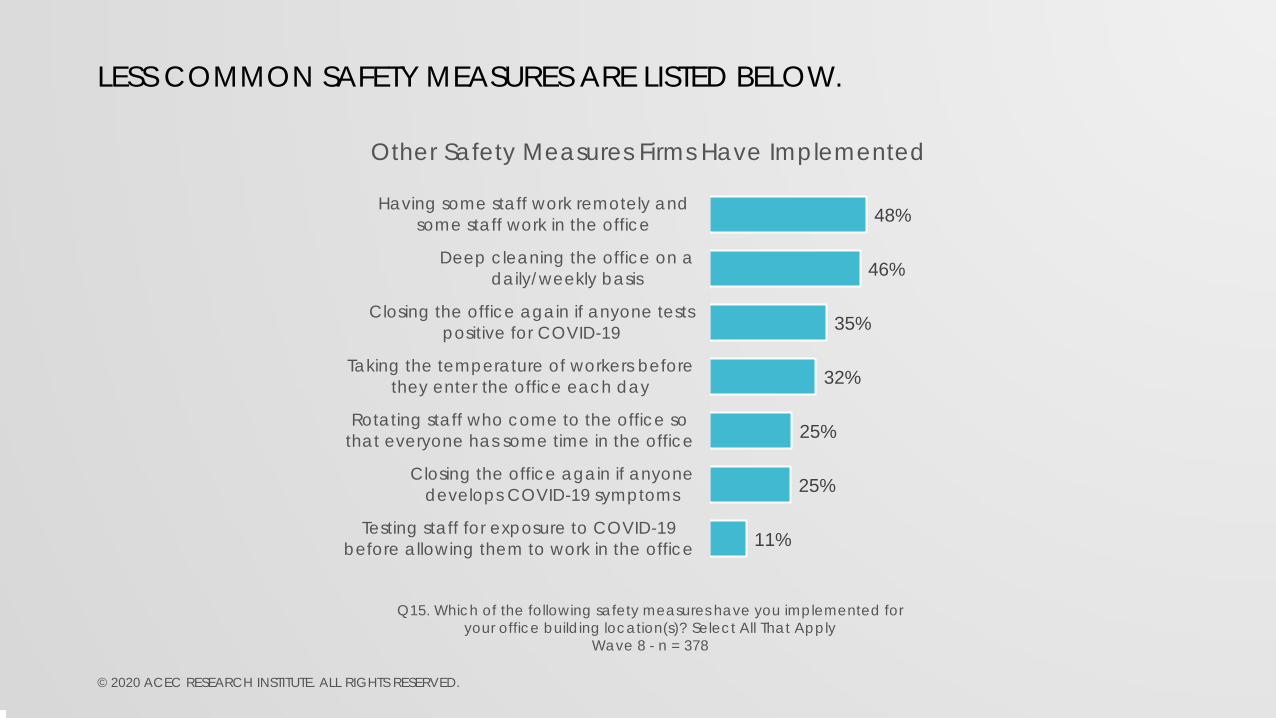
LESS COMMON SAFETY MEASURES ARE LISTED BELOW.
© 2020 ACEC RESEARCH INSTITUTE. ALL RIGHTS RESERVED.
Q15. Which of the following safety measures have you implemented for your office building location(s)? Select All That Apply
Wave 8 - n = 378

LIKELIHOOD OF TRAVELING
35© 2020 ACEC RESEARCH INSTITUTE. ALL RIGHTS RESERVED.

31%
32%
49%
44%
62%
58%
72%
66%
77%
71%
26%
23%
23%
26%
20%
22%
14%
19%
11%
17%
43%
45%
29%
30%
18%
20%
13%
14%
12%
12%
Wave 8
With 10 or fewer attendees - Wave 7
Wave 8
With between 11 and 20 attendees - Wave 7
Wave 8
With between 21 and 50 attendees - Wave 7
Wave 8
With between 51 and 100 attendees - Wave 7
Wave 8
With more than 100 attendees - Wave 7
Likelihood of Allowing Air Travel in Next Six Months to Conferences / Meetings / Events
Definitely/Probably Will NOT Might/Might Not Definitely/Probably Will
Q18. How likely is your firm to allow the following types of air travel in the next six months?
Wave 7 - n = 513 – 517, Wave 8 - n = 392 - 390
THE PERCENTAGE OF FIRMS THAT WILL ALLOW AIR TRAVEL HAS REMAINED THE SAME SINCE WAVE 7. HOWEVER, THE PERCENTAGE WHO WILL NOT ALLOW AIR TRAVEL TO MEETINGS HAS INCREASED. THE ONE EXCEPTION IS FOR MEETINGS WITH 10 OR FEWER ATTENDEES.
© 2020 ACEC RESEARCH INSTITUTE. ALL RIGHTS RESERVED.
• There are no meaningful, statistically significant differences by firm size.

13%
12%
30%
24%
51%
43%
63%
55%
67%
60%
25%
20%
28%
27%
23%
26%
16%
23%
15%
21%
62%
68%
42%
49%
26%
31%
21%
22%
18%
20%
Wave 8
With 10 or fewer attendees - Wave 7
Wave 8
With between 11 and 20 attendees - Wave 7
Wave 8
With between 21 and 50 attendees - Wave 7
Wave 8
With between 51 and 100 attendees - Wave 7
Wave 8
With more than 100 attendees - Wave 7
Likelihood of Allowing Car Travel in Next Six Months to Conferences / Meetings / Events
Definitely/Probably Will NOT Might/Might Not Definitely/Probably Will
Q19. How likely is your firm to allow the following types of travel by car in the next six months?
Wave 7 - n = 511 – 518, Wave 7 - n = 387 - 384
AS WITH AIR TRAVEL, THE PERCENTAGE OF FIRMS THAT WILL NOT ALLOW TRAVEL BY CAR HAS INCREASED SINCE WAVE 7. THE ONE EXCEPTION IS FOR MEETINGS WITH 10 OR FEWER ATTENDEES. HOWEVER, UNLIKE AIR TRAVEL, FEWER FIRMS INDICATE THEY WILL ALLOW TRAVEL BY CAR COMPARED TO WAVE 7.
© 2020 ACEC RESEARCH INSTITUTE. ALL RIGHTS RESERVED.
• There are no meaningful, statistically significant differences by firm size.

4%
4%
19%
22%
12%
13%
18%
18%
84%
83%
64%
60%
Wave 8
By Car - Wave 7
Wave 8
By Air - Wave 7
Likelihood of Allowing Travel in Next Six Months to Meet With a Client
Definitely/Probably Will NOT Might/Might Not Definitely/Probably Will
Q18/19. How likely is your firm to allow the following types of air travel / travel by car in the next six months?Wave 7 - n = 516 – 519, Wave 8 - n = 393 - 387
SLIGHTLY MORE FIRMS ARE LIKELY TO ALLOW AIR TRAVEL TO MEET WITH CLIENTS IN THE NEXT SIX MONTHS THAN IN WAVE 7 (64% VS. 60%). HOWEVER, LIKELIHOOD OF ALLOWING TRAVEL TO MEET WITH CLIENTS BY CAR HAS REMAINED STEADY (84% VS. 83%).
© 2020 ACEC RESEARCH INSTITUTE. ALL RIGHTS RESERVED.
• Although there are no statistically significant differences by firm size when allowing travel by car to in-person client meetings, there are differences when considering air travel. Smaller firms are less likely to allow air travel to client meetings than larger firms:
• 0 to 25 FTEs = 56% “Definitely/Probably Will
• 26 to 50 FTEs = 71%• 51 to 200 FTEs = 65%• 201 to 500 FTEs = 74%• 501 or more FTEs = 88%

METHODOLOGY – WAVE 1• The Institute for Association and Nonprofit Research (IFANR) invited individuals from
among the database list of member companies provided by the American Council of Engineering Companies (ACEC) to participate in this survey. One invitation was sent per member company.• Data collection occurred on March 17 and 18, 2020.• A total of 3,456 invitations were emailed, although 294 bounced and 17 opted-out,
resulting in a total of 3,145 potential respondents. • Individuals who did not respond to the first email were sent one follow-up reminder. • In all, 794 individuals responded to the email invitations for an overall response rate of
25%.• Individuals could respond using a laptop/desktop computer, tablet or smartphone; 12%
of respondents completed the survey using a mobile device.• Throughout the report for Wave 1 meaningful, statistically significant differences are
noted by geographic region.
39© 2020 ACEC RESEARCH INSTITUTE. ALL RIGHTS RESERVED.

METHODOLOGY – WAVE 2• The Institute for Association and Nonprofit Research (IFANR) invited individuals from
among the database list of member companies provided by the American Council of Engineering Companies (ACEC) to participate in this survey. One invitation was sent per member company.• Data collection occurred on March 24 and 25, 2020.• A total of 3,438 invitations were emailed, although 298 bounced and 20 opted-out,
resulting in a total of 3,120 potential respondents. • Individuals who did not respond to the first email were sent one follow-up reminder. • In all, 738 individuals responded to the email invitations for an overall response rate of
24%.• Individuals could respond using a laptop/desktop computer, tablet or smartphone; 11%
of respondents completed the survey using a mobile device.• Throughout this report meaningful, statistically significant differences are noted by
number of FTEs.
40© 2020 ACEC RESEARCH INSTITUTE. ALL RIGHTS RESERVED.

METHODOLOGY – WAVE 3• The Institute for Association and Nonprofit Research (IFANR) invited individuals from
among the database list of member companies provided by the American Council of Engineering Companies (ACEC) to participate in this survey. One invitation was sent per member company.• Data collection occurred on March 31 and April 1, 2020.• A total of 3,417 invitations were emailed, although 298 bounced and 9 opted-out,
resulting in a total of 3,110 potential respondents. • Individuals who did not respond to the first email were sent one follow-up reminder. • In all, 610 individuals responded to the email invitations for an overall response rate of
20%.• Individuals could respond using a laptop/desktop computer, tablet or smartphone; 10%
of respondents completed the survey using a mobile device.• Throughout this report meaningful, statistically significant differences are noted by
number of FTEs.
41© 2020 ACEC RESEARCH INSTITUTE. ALL RIGHTS RESERVED.

METHODOLOGY – WAVE 4• The Institute for Association and Nonprofit Research (IFANR) invited individuals from
among the database list of member companies provided by the American Council of Engineering Companies (ACEC) to participate in this survey. One invitation was sent per member company.• Data collection occurred on April 7 and 8, 2020.• A total of 3,407 invitations were emailed, although 291 bounced and 9 opted-out,
resulting in a total of 3,107 potential respondents. • Individuals who did not respond to the first email were sent one follow-up reminder. • In all, 566 individuals responded to the email invitations for an overall response rate of
18%.• Individuals could respond using a laptop/desktop computer, tablet or smartphone; 10%
of respondents completed the survey using a mobile device.• Throughout this report meaningful, statistically significant differences are noted by
number of FTEs.
42© 2020 ACEC RESEARCH INSTITUTE. ALL RIGHTS RESERVED.

METHODOLOGY – WAVE 5• The Institute for Association and Nonprofit Research (IFANR) invited individuals from
among the database list of member companies provided by the American Council of Engineering Companies (ACEC) to participate in this survey. One invitation was sent per member company.• Data collection occurred on April 21 and 22, 2020.• A total of 3,395 invitations were emailed, although 301 bounced and 11 opted-out,
resulting in a total of 3,083 potential respondents. • Individuals who did not respond to the first email were sent one follow-up reminder. • In all, 512 individuals responded to the email invitations for an overall response rate of
17%.• Individuals could respond using a laptop/desktop computer, tablet or smartphone; 9%
of respondents completed the survey using a mobile device.• Throughout this report meaningful, statistically significant differences are noted by
number of FTEs.
43© 2020 ACEC RESEARCH INSTITUTE. ALL RIGHTS RESERVED.
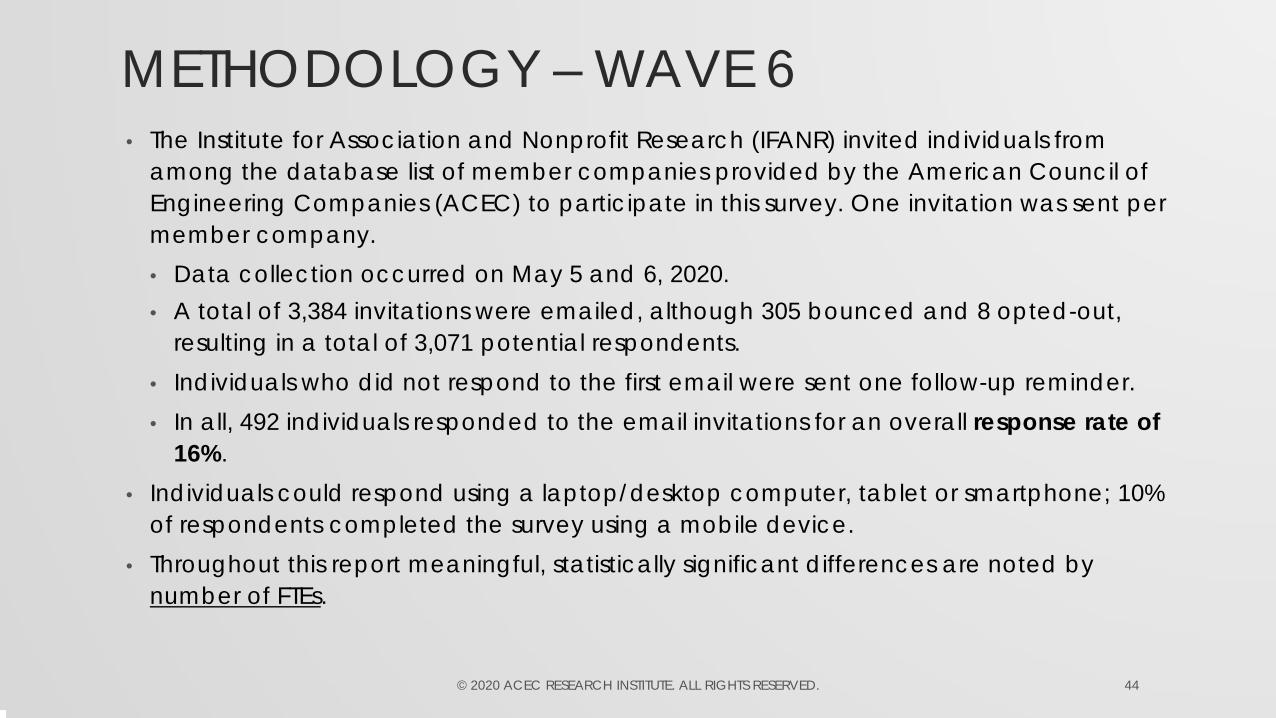
METHODOLOGY – WAVE 6• The Institute for Association and Nonprofit Research (IFANR) invited individuals from
among the database list of member companies provided by the American Council of Engineering Companies (ACEC) to participate in this survey. One invitation was sent per member company.• Data collection occurred on May 5 and 6, 2020.• A total of 3,384 invitations were emailed, although 305 bounced and 8 opted-out,
resulting in a total of 3,071 potential respondents. • Individuals who did not respond to the first email were sent one follow-up reminder. • In all, 492 individuals responded to the email invitations for an overall response rate of
16%.• Individuals could respond using a laptop/desktop computer, tablet or smartphone; 10%
of respondents completed the survey using a mobile device.• Throughout this report meaningful, statistically significant differences are noted by
number of FTEs.
44© 2020 ACEC RESEARCH INSTITUTE. ALL RIGHTS RESERVED.
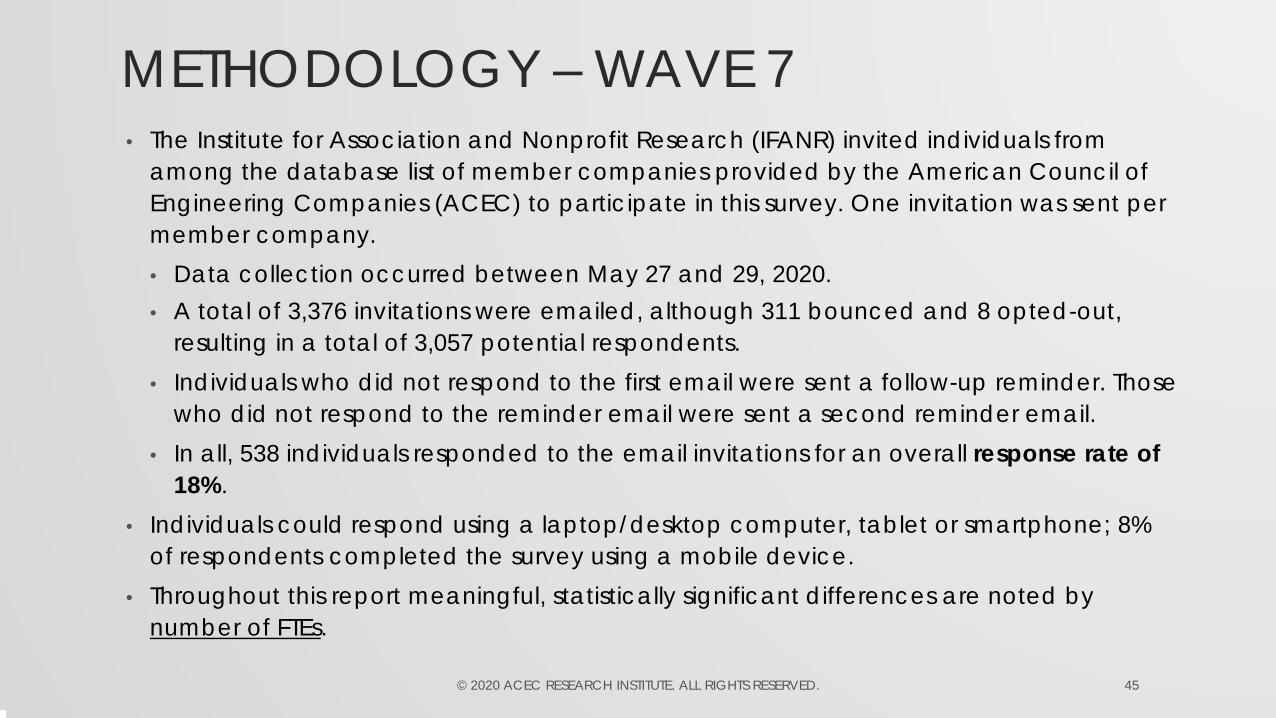
METHODOLOGY – WAVE 7• The Institute for Association and Nonprofit Research (IFANR) invited individuals from
among the database list of member companies provided by the American Council of Engineering Companies (ACEC) to participate in this survey. One invitation was sent per member company.• Data collection occurred between May 27 and 29, 2020.• A total of 3,376 invitations were emailed, although 311 bounced and 8 opted-out,
resulting in a total of 3,057 potential respondents. • Individuals who did not respond to the first email were sent a follow-up reminder. Those
who did not respond to the reminder email were sent a second reminder email. • In all, 538 individuals responded to the email invitations for an overall response rate of
18%.• Individuals could respond using a laptop/desktop computer, tablet or smartphone; 8%
of respondents completed the survey using a mobile device.• Throughout this report meaningful, statistically significant differences are noted by
number of FTEs.
45© 2020 ACEC RESEARCH INSTITUTE. ALL RIGHTS RESERVED.

METHODOLOGY – WAVE 8• The Institute for Association and Nonprofit Research (IFANR) invited individuals from
among the database list of member companies provided by the American Council of Engineering Companies (ACEC) to participate in this survey. One invitation was sent per member company.• Data collection occurred between September 15 and 17, 2020.• A total of 3,388 invitations were emailed, although 297 bounced and 13 opted-out,
resulting in a total of 3,078 potential respondents. • Individuals who did not respond to the first email were sent a follow-up reminder. Those
who did not respond to the reminder email were sent a second reminder email. • In all, 411 individuals responded to the email invitations for an overall response rate of
13%.• Individuals could respond using a laptop/desktop computer, tablet or smartphone; 8%
of respondents completed the survey using a mobile device.• Throughout this report meaningful, statistically significant differences are noted by
number of FTEs.
46© 2020 ACEC RESEARCH INSTITUTE. ALL RIGHTS RESERVED.
STATISTICAL NOTES• Statistically significant differences are evaluated at a 95% confidence interval (for a
description of tests used, please see the Appendix).• There is no margin of sampling error as this was a census of all individuals in the ACEC
database.• Although every effort was taken to minimize survey bias, there is no way to completely
eliminate all sources of potential bias. Sources of potential bias include, but are not limited to, the following:• Non-response bias• Confounding bias• Question wording bias• Question order bias• Habituation• Sponsor bias• Confirmation bias
© 2020 ACEC RESEARCH INSTITUTE. ALL RIGHTS RESERVED.

APPENDIX
© 2020 ACEC RESEARCH INSTITUTE. ALL RIGHTS RESERVED.

TESTS OF SIGNIFICANCE FOR MEANSF-test When the mean is displayed for a row variable, MarketSight first runs an Analysis of Variance (ANOVA) using an F-test. Doing so tests the hypothesis that the means of multiple normally distributed populations, all having the same variance, are equal.
MarketSight tests whether or not the row variable’s means are equal to one another for all columns in the crosstab. Rejecting the test hypothesis implies that at least one of the column means is significantly different from the others.
Fisher's Least Significant Difference (LSD) test If the statistics option to ”Correct for Type I errors in all comparisons” is disabled, MarketSight will run Fisher’s LSD test for both Pairwise tests and Contrast tests of means. MarketSight only runs Fisher’s LSD test if the ANOVA F-test first rejects the null hypothesis that all column means are equal to one another.
Fisher’s LSD test is a relatively powerful test because it uses the pooled variance estimate from the F-test, thus taking advantage of the increased sample size of all columns in the crosstab. Pooling the variance is valid because MarketSight explicitly tests for equality of variance among all columns prior to running the associated F-test.
Although the test is more powerful than either the Tukey HSD or Scheffé tests, it is more susceptible to Type I error when running multiple simultaneous tests.
© 2020 ACEC RESEARCH INSTITUTE. ALL RIGHTS RESERVED.

TESTS OF SIGNIFICANCE FOR MEANS (CONT’D)Scheffé test If the statistics option to ”Correct for Type I errors in all comparisons” is enabled, MarketSight will run the Scheffé test for Contrast tests of means. MarketSight only runs the Scheffé test if the ANOVA F-test first rejects the null hypothesis that all column means are equal to one another.
The Scheffé test is a conservative test for running multiple Contrast tests of Means which controls the overall Type I error rate for all possible contrasts based on the selected Confidence Level.
Tukey-Kramer tests MarketSight will run Tukey-Kramer test for Pairwise tests of means. MarketSight only runs Tukey-Kramer test if the ANOVA F-test first rejects the null hypothesis that all column means are equal to one another.
Tukey-Kramer test is a conservative test for running multiple Pairwise comparisons of Means. It controls the overall Type I error rate across a number of related Pairwise tests based on the selected Confidence Level.
© 2020 ACEC RESEARCH INSTITUTE. ALL RIGHTS RESERVED.

TESTS OF SIGNIFICANCE FOR PROPORTIONSChi-squared When a Row Variable displays the Column % or Count option for individual Values, MarketSight runs a Chi-squared test. This test examines whether there is a relationship between the Column Variable(s) and the Row Variable.
Chi-squared tests involve a comparison of ”actual” cell counts to ”expected” cell counts in a crosstab.
The expected count for each cell is derived from a Row Variable’s actual counts as follows: multiply the cell's row total by its column total, then divide by the sum total of all observations.
If the actual cell counts for one or more cells differ materially from their expected counts, the Chi-squared test may produce a statistically significant result which implies there is a relationship between the Column Variable(s) and the Row Variable.
A modified version of a Chi-Squared test is run for Multiple Response Variables.
© 2020 ACEC RESEARCH INSTITUTE. ALL RIGHTS RESERVED.

TESTS OF SIGNIFICANCE FOR PROPORTIONS (CONT’D)Fisher's Exact For 2x2 crosstabs with small sample sizes, the Chi-squared test may be unreliable. Therefore, MarketSight runs an alternate test, Fisher’s Exact Test, if more than 20% of the cells in a 2x2 crosstab have an expected cell count less than 5, or if any cells in a 2x2 cross-tab have an expected cell count less than 1.
Fisher’s Exact Test calculates the true probability of observing a particular set of actual cell counts in a 2 x 2 crosstab, assuming that row and column totals are held constant.
Fisher's Exact Test is not run for Multiple Response Variables.
z-test MarketSight runs Z-tests for both Contrast and Pairwise tests of Column Proportions. A Z-test is used to test for a difference between two column proportions. The column proportions involved in the test are the cell counts divided by their respective column totals.
A Z-test is only run when the cells being compared have actual counts greater or equal to 5 and the column sample size minus the actual cell counts is greater than or equal to 5. If these data sufficiency conditions are not met, MarketSight runs Fisher’s Exact Test instead.
A modified version of a Z-test is run for Multiple Response Variables.
© 2020 ACEC RESEARCH INSTITUTE. ALL RIGHTS RESERVED.

RESEARCH CONDUCTED BY
Joseph BatesResearch ConsultantACEC Research Institute
53© 2020 ACEC RESEARCH INSTITUTE. ALL RIGHTS RESERVED.
Related Documents