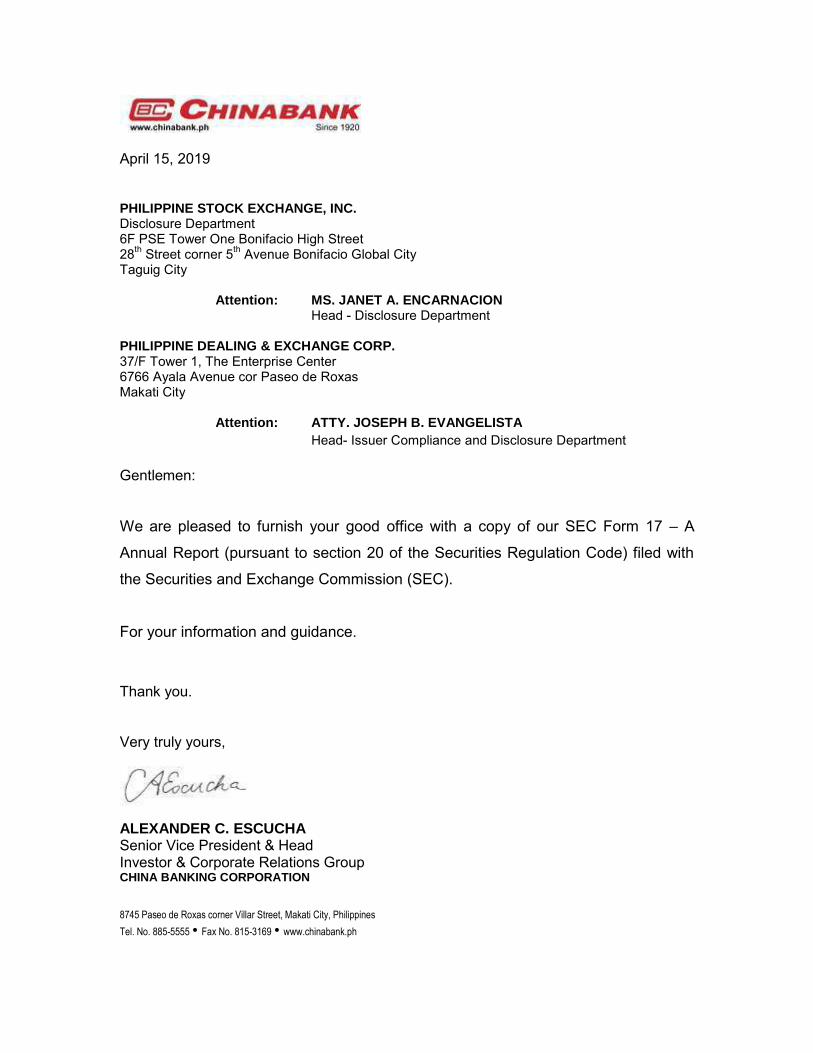
April 15, 2019 PHILIPPINE STOCK EXCHANGE, INC. Disclosure Department 6F PSE Tower One Bonifacio High Street 28 th Street corner 5 th Avenue Bonifacio Global City Taguig City Attention: MS. JANET A. ENCARNACION Head - Disclosure Department PHILIPPINE DEALING & EXCHANGE CORP. 37/F Tower 1, The Enterprise Center 6766 Ayala Avenue cor Paseo de Roxas Makati City Attention: ATTY. JOSEPH B. EVANGELISTA Head- Issuer Compliance and Disclosure Department Gentlemen: We are pleased to furnish your good office with a copy of our SEC Form 17 – A Annual Report (pursuant to section 20 of the Securities Regulation Code) filed with the Securities and Exchange Commission (SEC). For your information and guidance. Thank you. Very truly yours, ALEXANDER C. ESCUCHA Senior Vice President & Head Investor & Corporate Relations Group CHINA BANKING CORPORATION 8745 Paseo de Roxas corner Villar Street, Makati City, Philippines Tel. No. 885-5555 • Fax No. 815-3169 • www.chinabank.ph

Welcome message from author
This document is posted to help you gain knowledge. Please leave a comment to let me know what you think about it! Share it to your friends and learn new things together.
Transcript
April 15, 2019 PHILIPPINE STOCK EXCHANGE, INC. Disclosure Department 6F PSE Tower One Bonifacio High Street 28th Street corner 5th Avenue Bonifacio Global City Taguig City Attention: MS. JANET A. ENCARNACION
Head - Disclosure Department PHILIPPINE DEALING & EXCHANGE CORP. 37/F Tower 1, The Enterprise Center 6766 Ayala Avenue cor Paseo de Roxas Makati City Attention: ATTY. JOSEPH B. EVANGELISTA
Head- Issuer Compliance and Disclosure Department Gentlemen: We are pleased to furnish your good office with a copy of our SEC Form 17 – A
Annual Report (pursuant to section 20 of the Securities Regulation Code) filed with
the Securities and Exchange Commission (SEC).
For your information and guidance.
Thank you. Very truly yours,
ALEXANDER C. ESCUCHA Senior Vice President & Head Investor & Corporate Relations Group CHINA BANKING CORPORATION 8745 Paseo de Roxas corner Villar Street, Makati City, Philippines
Tel. No. 885-5555 • Fax No. 815-3169 • www.chinabank.ph
----------------------------------------------
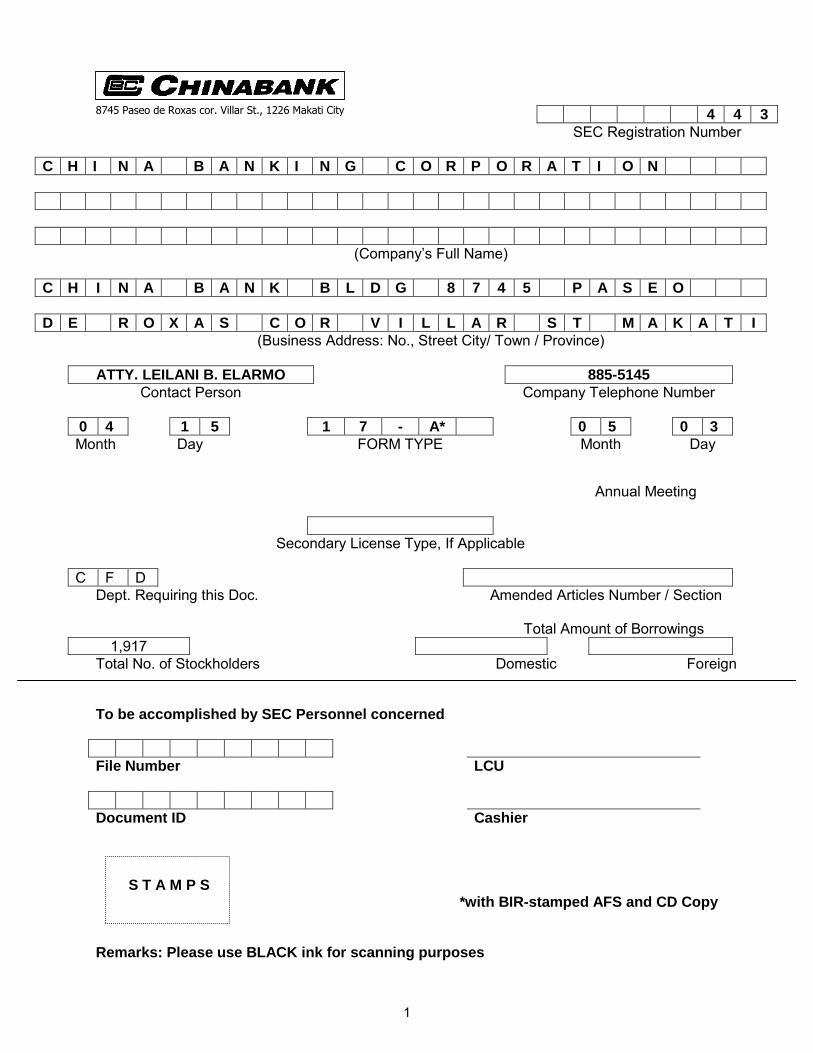
4 4 3
SEC Registration Number
C H I N A B A N K I N G C O R P O R A T I O N
(Company‘s Full Name)
C H I N A B A N K B L D G 8 7 4 5 P A S E O
D E R O X A S C O R V I L L A R S T M A K A T I
(Business Address: No., Street City/ Town / Province)
ATTY. LEILANI B. ELARMO 885-5145
Contact Person Company Telephone Number
0 4 1 5 1 7 - A* 0 5 0 3
Month Day FORM TYPE
Month Day
Annual Meeting
Secondary License Type, If Applicable
C F D Dept. Requiring this Doc. Amended Articles Number / Section Total Amount of Borrowings
1,917 Total No. of Stockholders Domestic Foreign To be accomplished by SEC Personnel concerned
File Number LCU Document ID Cashier S T A M P S *with BIR-stamped AFS and CD Copy Remarks: Please use BLACK ink for scanning purposes
8745 Paseo de Roxas cor. Villar St., 1226 Makati City
1
2
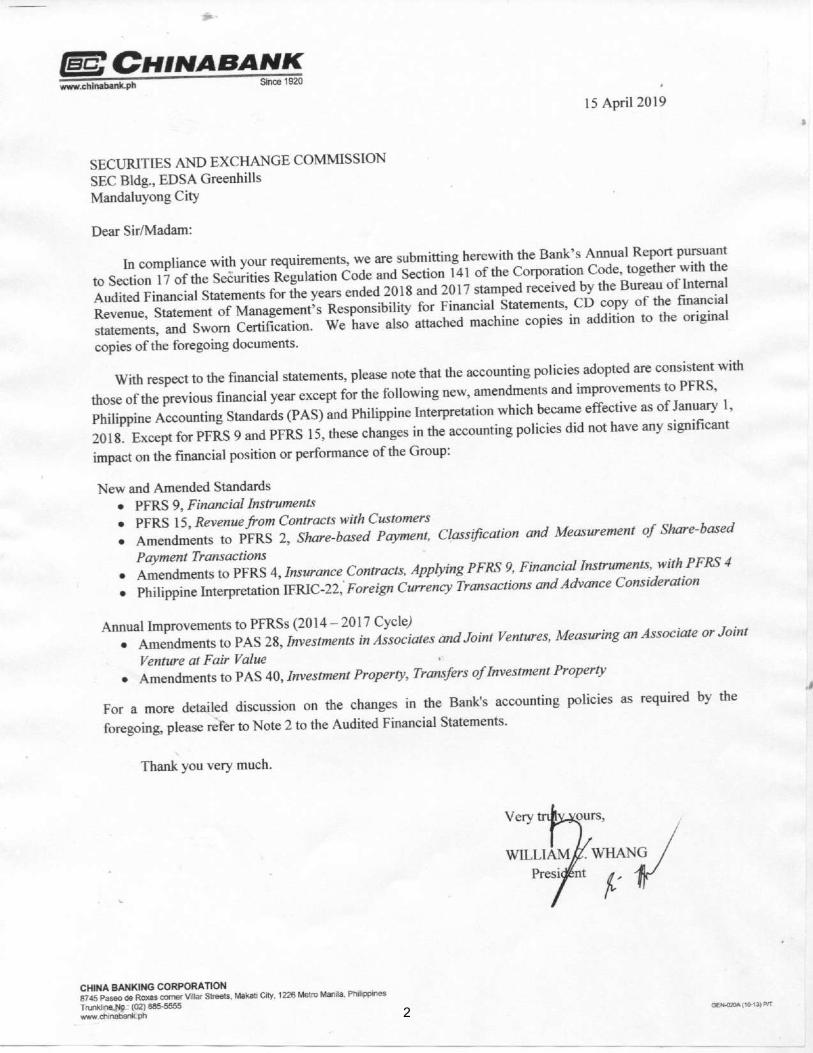
SECURITIES AND EXCHANGE COMMISSION SEC FORM 17-A
ANNUAL REPORT PURSUANT TO SECTION 17
OF THE SECURITIES REGULATION CODE AND SECTION 141 OF THE CORPORATION CODE OF THE PHILIPPINES
1. For the fiscal year ended December 31, 2018 2. SEC Identification Number: 443
3. BIR Tax Identification Code: 000-444-210-000
4. Name of issuer as specified in its charter: China Banking Corporation
5. Province, country or other jurisdiction of incorporation or organization: Philippines
6. Industry Classification Code: (SEC use only)
7. Address of principal office: China Bank Building, 8745 Paseo de Roxas Postal Code: 1226
cor. Villar St., Makati City
8. Issuer‘s telephone number, including area code: (632) 885-5555
9. Securities registered pursuant to Sections 8 and 12 of the SRC or Sections 4 and 8 of the RSA:
Title of Each Class Number of Shares Outstanding
Common 2,685,899,812
10. Are any or all of these securities listed in a Stock Exchange? Yes [] No [ ]
The above common shares are listed in the Philippine Stock Exchange. 11. Check whether the issuer:
(a) has filed all reports required to be filed by Section 17 of the SRC and SRC Rule 17.1 thereunder or Section 11 of the RSA and RSA Rule 11 (a) - 1 thereunder, and Sections 26 and 141 of The Corporation Code of the Philippines during the preceding twelve (12) months (or for such shorter period that the registrant was required to file such reports):
Yes [] No [ ]
(b) has been subject to such filing requirements for the past ninety (90) days: Yes [] No [ ] 12. Aggregate market value of the voting stock held by non-affiliates: P42.42 Billion (as of December 31, 2018) 13. Portions of the Bank‘s 2018 Annual Report to Stockholders are incorporated by reference in Parts I & II of
this report.
3
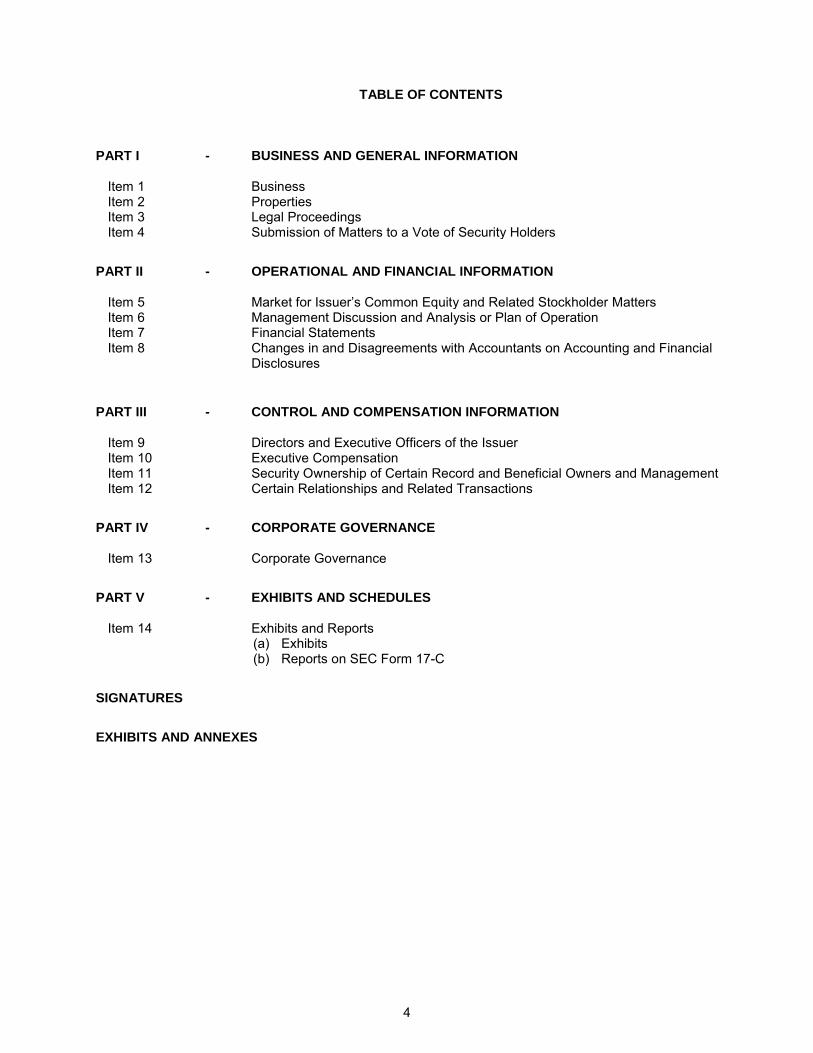
TABLE OF CONTENTS
PART I - BUSINESS AND GENERAL INFORMATION
Item 1 Business Item 2 Properties Item 3 Legal Proceedings Item 4 Submission of Matters to a Vote of Security Holders
PART II - OPERATIONAL AND FINANCIAL INFORMATION
Item 5 Market for Issuer‘s Common Equity and Related Stockholder Matters Item 6 Management Discussion and Analysis or Plan of Operation Item 7 Financial Statements Item 8 Changes in and Disagreements with Accountants on Accounting and Financial
Disclosures
PART III - CONTROL AND COMPENSATION INFORMATION
Item 9 Directors and Executive Officers of the Issuer Item 10 Executive Compensation Item 11 Security Ownership of Certain Record and Beneficial Owners and Management Item 12 Certain Relationships and Related Transactions
PART IV - CORPORATE GOVERNANCE
Item 13 Corporate Governance
PART V - EXHIBITS AND SCHEDULES
Item 14 Exhibits and Reports (a) Exhibits (b) Reports on SEC Form 17-C
SIGNATURES
EXHIBITS AND ANNEXES
4
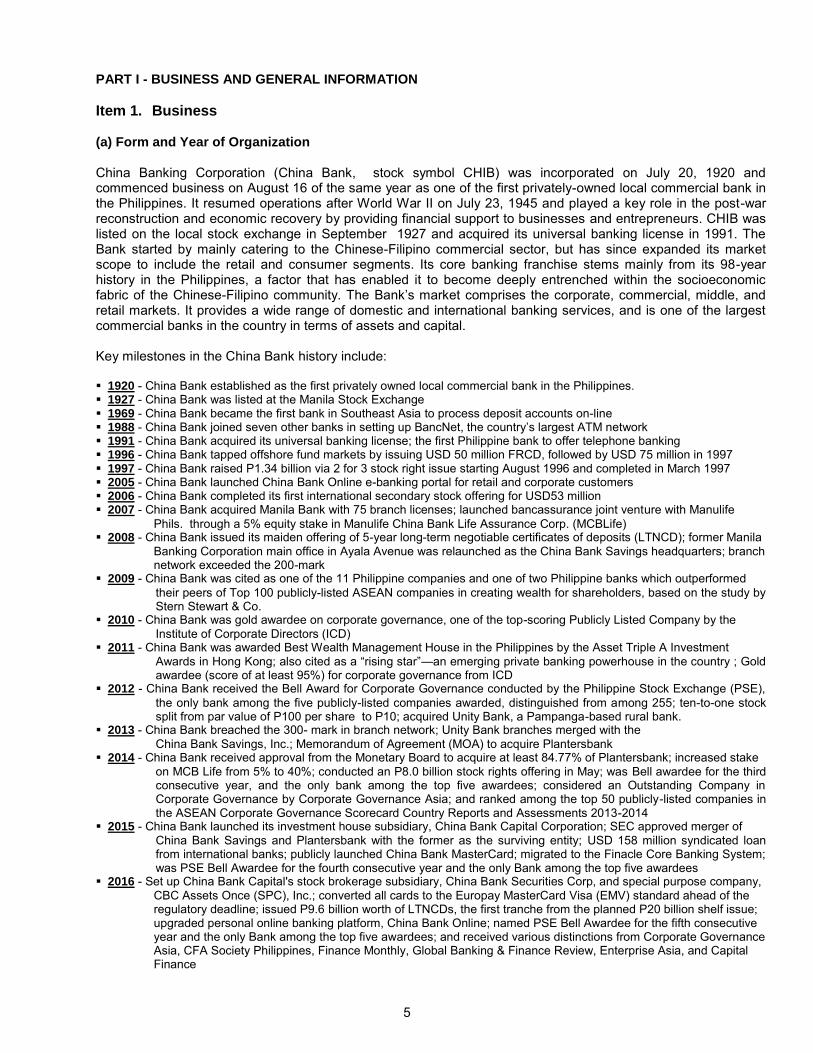
PART I - BUSINESS AND GENERAL INFORMATION Item 1. Business (a) Form and Year of Organization China Banking Corporation (China Bank, stock symbol CHIB) was incorporated on July 20, 1920 and commenced business on August 16 of the same year as one of the first privately-owned local commercial bank in the Philippines. It resumed operations after World War II on July 23, 1945 and played a key role in the post-war reconstruction and economic recovery by providing financial support to businesses and entrepreneurs. CHIB was listed on the local stock exchange in September 1927 and acquired its universal banking license in 1991. The Bank started by mainly catering to the Chinese-Filipino commercial sector, but has since expanded its market scope to include the retail and consumer segments. Its core banking franchise stems mainly from its 98-year history in the Philippines, a factor that has enabled it to become deeply entrenched within the socioeconomic fabric of the Chinese-Filipino community. The Bank‘s market comprises the corporate, commercial, middle, and retail markets. It provides a wide range of domestic and international banking services, and is one of the largest commercial banks in the country in terms of assets and capital. Key milestones in the China Bank history include: 1920 - China Bank established as the first privately owned local commercial bank in the Philippines. 1927 - China Bank was listed at the Manila Stock Exchange 1969 - China Bank became the first bank in Southeast Asia to process deposit accounts on-line 1988 - China Bank joined seven other banks in setting up BancNet, the country‘s largest ATM network 1991 - China Bank acquired its universal banking license; the first Philippine bank to offer telephone banking 1996 - China Bank tapped offshore fund markets by issuing USD 50 million FRCD, followed by USD 75 million in 1997 1997 - China Bank raised P1.34 billion via 2 for 3 stock right issue starting August 1996 and completed in March 1997 2005 - China Bank launched China Bank Online e-banking portal for retail and corporate customers 2006 - China Bank completed its first international secondary stock offering for USD53 million 2007 - China Bank acquired Manila Bank with 75 branch licenses; launched bancassurance joint venture with Manulife
Phils. through a 5% equity stake in Manulife China Bank Life Assurance Corp. (MCBLife) 2008 - China Bank issued its maiden offering of 5-year long-term negotiable certificates of deposits (LTNCD); former Manila
Banking Corporation main office in Ayala Avenue was relaunched as the China Bank Savings headquarters; branch network exceeded the 200-mark
2009 - China Bank was cited as one of the 11 Philippine companies and one of two Philippine banks which outperformed their peers of Top 100 publicly-listed ASEAN companies in creating wealth for shareholders, based on the study by Stern Stewart & Co.
2010 - China Bank was gold awardee on corporate governance, one of the top-scoring Publicly Listed Company by the Institute of Corporate Directors (ICD)
2011 - China Bank was awarded Best Wealth Management House in the Philippines by the Asset Triple A Investment Awards in Hong Kong; also cited as a ―rising star‖—an emerging private banking powerhouse in the country ; Gold awardee (score of at least 95%) for corporate governance from ICD
2012 - China Bank received the Bell Award for Corporate Governance conducted by the Philippine Stock Exchange (PSE), the only bank among the five publicly-listed companies awarded, distinguished from among 255; ten-to-one stock split from par value of P100 per share to P10; acquired Unity Bank, a Pampanga-based rural bank.
2013 - China Bank breached the 300- mark in branch network; Unity Bank branches merged with the China Bank Savings, Inc.; Memorandum of Agreement (MOA) to acquire Plantersbank
2014 - China Bank received approval from the Monetary Board to acquire at least 84.77% of Plantersbank; increased stake on MCB Life from 5% to 40%; conducted an P8.0 billion stock rights offering in May; was Bell awardee for the third consecutive year, and the only bank among the top five awardees; considered an Outstanding Company in Corporate Governance by Corporate Governance Asia; and ranked among the top 50 publicly-listed companies in the ASEAN Corporate Governance Scorecard Country Reports and Assessments 2013-2014
2015 - China Bank launched its investment house subsidiary, China Bank Capital Corporation; SEC approved merger of China Bank Savings and Plantersbank with the former as the surviving entity; USD 158 million syndicated loan from international banks; publicly launched China Bank MasterCard; migrated to the Finacle Core Banking System; was PSE Bell Awardee for the fourth consecutive year and the only Bank among the top five awardees
2016 - Set up China Bank Capital's stock brokerage subsidiary, China Bank Securities Corp, and special purpose company, CBC Assets Once (SPC), Inc.; converted all cards to the Europay MasterCard Visa (EMV) standard ahead of the regulatory deadline; issued P9.6 billion worth of LTNCDs, the first tranche from the planned P20 billion shelf issue; upgraded personal online banking platform, China Bank Online; named PSE Bell Awardee for the fifth consecutive year and the only Bank among the top five awardees; and received various distinctions from Corporate Governance Asia, CFA Society Philippines, Finance Monthly, Global Banking & Finance Review, Enterprise Asia, and Capital Finance
5
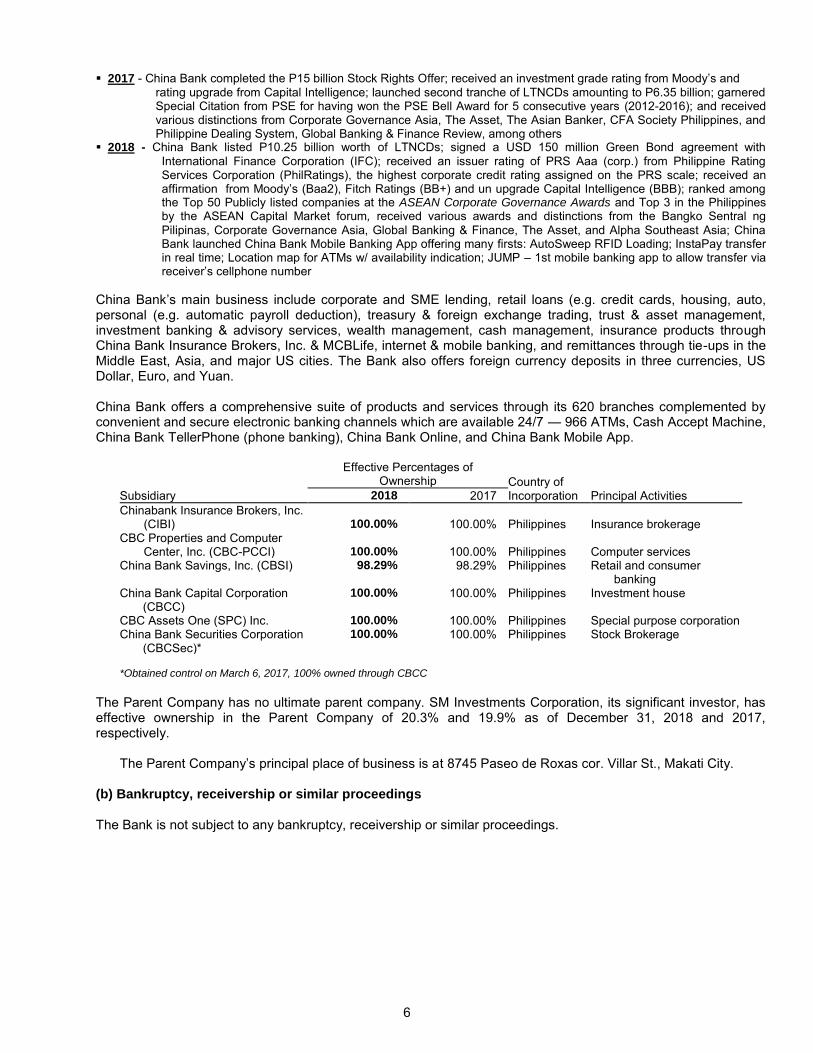
2017 - China Bank completed the P15 billion Stock Rights Offer; received an investment grade rating from Moody‘s and rating upgrade from Capital Intelligence; launched second tranche of LTNCDs amounting to P6.35 billion; garnered Special Citation from PSE for having won the PSE Bell Award for 5 consecutive years (2012-2016); and received various distinctions from Corporate Governance Asia, The Asset, The Asian Banker, CFA Society Philippines, and Philippine Dealing System, Global Banking & Finance Review, among others
2018 - China Bank listed P10.25 billion worth of LTNCDs; signed a USD 150 million Green Bond agreement with International Finance Corporation (IFC); received an issuer rating of PRS Aaa (corp.) from Philippine Rating Services Corporation (PhilRatings), the highest corporate credit rating assigned on the PRS scale; received an affirmation from Moody‘s (Baa2), Fitch Ratings (BB+) and un upgrade Capital Intelligence (BBB); ranked among the Top 50 Publicly listed companies at the ASEAN Corporate Governance Awards and Top 3 in the Philippines by the ASEAN Capital Market forum, received various awards and distinctions from the Bangko Sentral ng Pilipinas, Corporate Governance Asia, Global Banking & Finance, The Asset, and Alpha Southeast Asia; China Bank launched China Bank Mobile Banking App offering many firsts: AutoSweep RFID Loading; InstaPay transfer in real time; Location map for ATMs w/ availability indication; JUMP – 1st mobile banking app to allow transfer via receiver‘s cellphone number
China Bank‘s main business include corporate and SME lending, retail loans (e.g. credit cards, housing, auto, personal (e.g. automatic payroll deduction), treasury & foreign exchange trading, trust & asset management, investment banking & advisory services, wealth management, cash management, insurance products through China Bank Insurance Brokers, Inc. & MCBLife, internet & mobile banking, and remittances through tie-ups in the Middle East, Asia, and major US cities. The Bank also offers foreign currency deposits in three currencies, US Dollar, Euro, and Yuan. China Bank offers a comprehensive suite of products and services through its 620 branches complemented by convenient and secure electronic banking channels which are available 24/7 — 966 ATMs, Cash Accept Machine, China Bank TellerPhone (phone banking), China Bank Online, and China Bank Mobile App.
Subsidiary
Effective Percentages of Ownership Country of
Incorporation Principal Activities 2018 2017 Chinabank Insurance Brokers, Inc.
(CIBI)
100.00%
100.00% Philippines
Insurance brokerage
CBC Properties and Computer Center, Inc. (CBC-PCCI)
100.00%
100.00%
Philippines
Computer services
China Bank Savings, Inc. (CBSI) 98.29% 98.29% Philippines Retail and consumer banking
China Bank Capital Corporation (CBCC)
100.00% 100.00% Philippines Investment house
CBC Assets One (SPC) Inc. 100.00% 100.00% Philippines Special purpose corporation China Bank Securities Corporation
(CBCSec)* 100.00% 100.00% Philippines Stock Brokerage
*Obtained control on March 6, 2017, 100% owned through CBCC
The Parent Company has no ultimate parent company. SM Investments Corporation, its significant investor, has effective ownership in the Parent Company of 20.3% and 19.9% as of December 31, 2018 and 2017, respectively.
The Parent Company‘s principal place of business is at 8745 Paseo de Roxas cor. Villar St., Makati City.
(b) Bankruptcy, receivership or similar proceedings The Bank is not subject to any bankruptcy, receivership or similar proceedings.
6
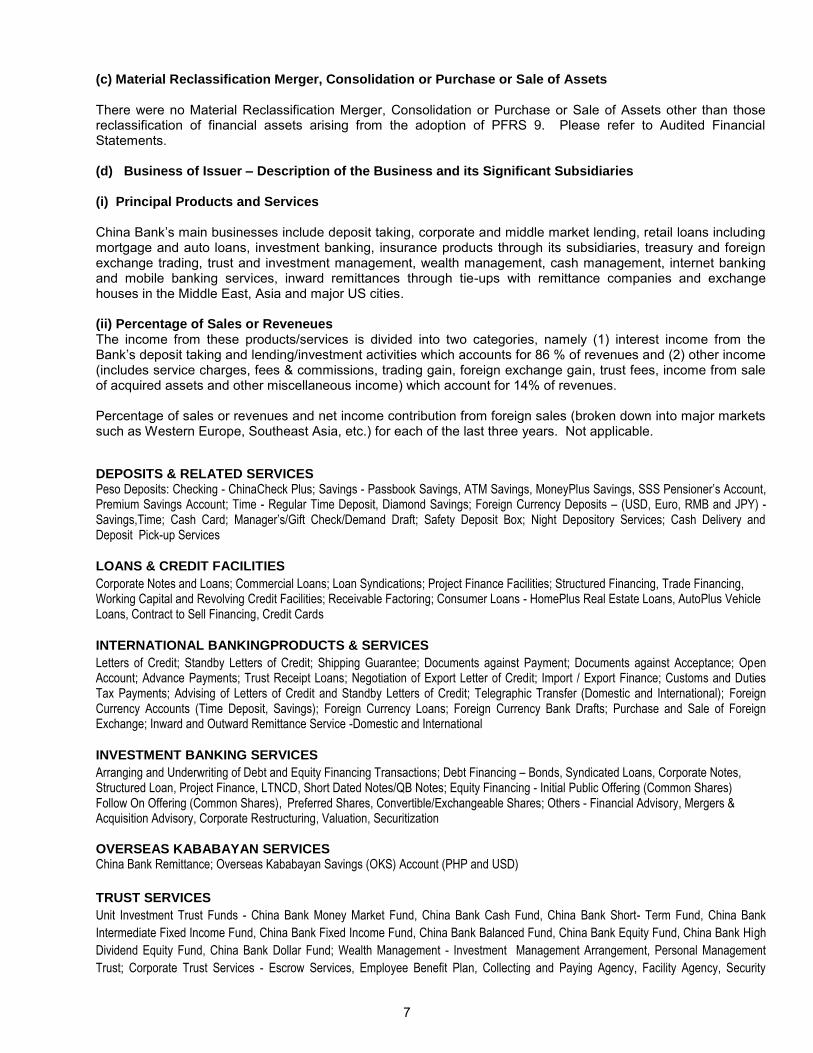
(c) Material Reclassification Merger, Consolidation or Purchase or Sale of Assets There were no Material Reclassification Merger, Consolidation or Purchase or Sale of Assets other than those reclassification of financial assets arising from the adoption of PFRS 9. Please refer to Audited Financial Statements. (d) Business of Issuer – Description of the Business and its Significant Subsidiaries (i) Principal Products and Services China Bank‘s main businesses include deposit taking, corporate and middle market lending, retail loans including mortgage and auto loans, investment banking, insurance products through its subsidiaries, treasury and foreign exchange trading, trust and investment management, wealth management, cash management, internet banking and mobile banking services, inward remittances through tie-ups with remittance companies and exchange houses in the Middle East, Asia and major US cities. (ii) Percentage of Sales or Reveneues The income from these products/services is divided into two categories, namely (1) interest income from the Bank‘s deposit taking and lending/investment activities which accounts for 86 % of revenues and (2) other income (includes service charges, fees & commissions, trading gain, foreign exchange gain, trust fees, income from sale of acquired assets and other miscellaneous income) which account for 14% of revenues. Percentage of sales or revenues and net income contribution from foreign sales (broken down into major markets such as Western Europe, Southeast Asia, etc.) for each of the last three years. Not applicable.
DEPOSITS & RELATED SERVICES Peso Deposits: Checking - ChinaCheck Plus; Savings - Passbook Savings, ATM Savings, MoneyPlus Savings, SSS Pensioner’s Account, Premium Savings Account; Time - Regular Time Deposit, Diamond Savings; Foreign Currency Deposits – (USD, Euro, RMB and JPY) - Savings,Time; Cash Card; Manager’s/Gift Check/Demand Draft; Safety Deposit Box; Night Depository Services; Cash Delivery and Deposit Pick-up Services LOANS & CREDIT FACILITIES
Corporate Notes and Loans; Commercial Loans; Loan Syndications; Project Finance Facilities; Structured Financing, Trade Financing, Working Capital and Revolving Credit Facilities; Receivable Factoring; Consumer Loans - HomePlus Real Estate Loans, AutoPlus Vehicle Loans, Contract to Sell Financing, Credit Cards
INTERNATIONAL BANKINGPRODUCTS & SERVICES
Letters of Credit; Standby Letters of Credit; Shipping Guarantee; Documents against Payment; Documents against Acceptance; Open Account; Advance Payments; Trust Receipt Loans; Negotiation of Export Letter of Credit; Import / Export Finance; Customs and Duties Tax Payments; Advising of Letters of Credit and Standby Letters of Credit; Telegraphic Transfer (Domestic and International); Foreign Currency Accounts (Time Deposit, Savings); Foreign Currency Loans; Foreign Currency Bank Drafts; Purchase and Sale of Foreign Exchange; Inward and Outward Remittance Service -Domestic and International INVESTMENT BANKING SERVICES
Arranging and Underwriting of Debt and Equity Financing Transactions; Debt Financing – Bonds, Syndicated Loans, Corporate Notes, Structured Loan, Project Finance, LTNCD, Short Dated Notes/QB Notes; Equity Financing - Initial Public Offering (Common Shares) Follow On Offering (Common Shares), Preferred Shares, Convertible/Exchangeable Shares; Others - Financial Advisory, Mergers & Acquisition Advisory, Corporate Restructuring, Valuation, Securitization OVERSEAS KABABAYAN SERVICES China Bank Remittance; Overseas Kababayan Savings (OKS) Account (PHP and USD)
TRUST SERVICES
Unit Investment Trust Funds - China Bank Money Market Fund, China Bank Cash Fund, China Bank Short- Term Fund, China Bank
Intermediate Fixed Income Fund, China Bank Fixed Income Fund, China Bank Balanced Fund, China Bank Equity Fund, China Bank High
Dividend Equity Fund, China Bank Dollar Fund; Wealth Management - Investment Management Arrangement, Personal Management
Trust; Corporate Trust Services - Escrow Services, Employee Benefit Plan, Collecting and Paying Agency, Facility Agency, Security
7
Trusteeship and Paying Agency
TREASURY SERVICES
Peso-Denominated Government and Corporate Bond Issues and Perpetual Notes; Dollar-Denominated Government and Corporate Bond Issues and Perpetual Notes; LTNCD; Treasury Certificate of Deposit; Promissory Notes; Foreign Exchange - Spot, Forward and Swaps Derivatives - Interest Rate and Cross Currency Swaps
INSURANCE PRODUCTS Bancassurance: Protection - Base Protect Plus; Education - MCBL Invest; Wealth - Platinum Invest Elite, MCBL Enrich Max, MCBL Affluence Income; Retirement - MCBL Enrich, MCBL Invest; Group Life Insurance - Group Yearly Renewable Term, Group Personal Accident, Group Credit Life Non-Life Insurance: Fire Insurance – Residential (Condominium Insurance), Commercial (Industrial All- Risk Insurance, Commercial All- Risk Insurance), Trust Receipts; Motor Car Insurance - Individual, Fleet Program; Marine Insurance - Hull Insurance, Cargo Insurance; Engineering Insurance - Contractors ALL-Risk Insurance, Electronic Equipment Insurance, Erectors All- Risk Insurance, Machinery Breakdown Insurance, Equipment Floater; Liability Insurance - Comprehensive General Liability Insurance, Product Liability Insurance, Professional Indemnity Insurance, Directors and Officers Liability Insurance; Crime Insurance - Money, Security & Payroll Insurance, Fidelity Insurance, Cyber Crime Insurance, Kidnap and Ransom Insurance; Bonds: Surety Bonds - Bidder Bond, Surety / Downpayment Bond, Performance Bond, Warranty Bond, Heirs Bond; Fidelity Bonds; Employee Benefit - Group Personal Accident Insurance, Group Life Insurance, HMO, Travel Insurance
PAYMENT & SETTLEMENT SERVICES
Electronic Banking Channels: China Bank Automated Teller Machine (ATM); China Bank TellerPhone; China Bank Online; China Bank Mobile Banking App; Cash Accept Machine; Point-of-Sale (POS)
CASH MANAGEMENT SOLUTIONS Basic Services: Balance Inquiry and Transaction Reporting, Intra & Inter-bank Transfer of Funds to Own &/or Third Party Account(s), Buy &/or Sell Foreign Currency, Sure Sweep, Bills Payment Self-Service Functionalities: Account Portfolio, Transaction History, Forgotten Credentials, Bank Certificate, Checkbook Reorder, Stop Payment Order Liquidity Management Via China Bank Online Corporate: Sure Sweep - Funds Consolidation (many to one account), Funds Distribution (one to many accounts); Corporate Inter-Bank Fund Transfer Receivables Management: Automatic Debit Arrangement (ADA), Check Depot, Bills Pay Plus, Check Pay Solution, Collection, Arrangement Report (via China Bank Online Corporate) Payables Management: Direct Debit Arrangement, Auto Credit Arrangement (ACA), Check Writing Services - Check Write Plus Software, Check Write Plus Outsourcing, Payroll Services – Payroll, China Pay Software, Payroll Processing POS Solutions: China Debit POS, POS Cash Out Trade and Settlement Solutions: Electronic Invoicing & Payment Solution, SCCP Broker’s Solution Government Payments and Collections: Easy Tax Filing and Payment Solution, BIR eTax Payments, eGov Payments - Social Security System (SSS); Philippine Health Insurance Corporation (PhilHealth); Pag-IBIG, SSS Sickness, Maternity, and Employee Compensation (SSS SMEC) CHINA BANK SECURITIES Stock Brokerage Securities and Investment Research (iii) Distribution Methods of Products and Services: China Bank‘s products and services are made available across multiple distribution and delivery channels: 620 branch network (of which 458 are China Bank branches, 162 ChinaBank Savings branches; 966 ATM network (623 in-branch and 343 off-site ATMs nationwide; founding member of the BancNet consortium, access to more than 15,000 ATMs nationwide of BancNet networks; online banking (through the Bank‘s e-portal www.chinabank.ph); China Bank EZPay Kiosk (tax payment); TellerPhone (phone banking) and Mobile Banking. Its head office is located at 8745 Paseo de Roxas corner Villar Streets, Makati City. Metro Manila Branches
8
1. MAKATI MAIN BRANCH (Head Office) - CBC Bldg., 8745 Paseo de Roxas cor. Villar Sts., Makati City*** 2. BINONDO BUSINESS CENTER - CBC Bldg., Dasmariñas cor. Juan Luna Sts. Binondo, Manila* 3. 999 MALL BRANCH (formerly TUTUBAN CENTER BRANCH) – Unit 3D-5 & 3D-7 999 Shopping Mall, Bldg. 2, Recto – Soler Sts.,
Binondo, Manila* 4. A. BONIFACIO - MAUBAN BRANCH - G/F Urban Oasis Residences, 423-431., A. Bonifacio Ave., Brgy. San Jose, QC* 5. ALABANG HILLS BRANCH - G/F RBC-MDC Corporate Center, Don Jesus Blvd., Alabang Hills Village, Brgy. Cupang,
Muntinlupa City* 6. ALVARADO BRANCH - HS Commercial Tower, 854 Alvarado St. Binondo, Manila 7. ANONAS BRANCH – Anonas corner Marang Streets, Brgy. Quirino, Project 2, Quezon City* 8. ANTIPOLO CITY BRANCH - G/F Budget Lane Arcade, No. 6, Provincial Road, Brgy. San Jose, Antipolo City, Rizal* 9. ANTIPOLO - SUMULONG HIGHWAY BRANCH - No. 219 Sumulong Highway, Bgry. Mambugan, Antipolo City, Rizal* 10. ANTIPOLO CITY-TAKTAK BRANCH - Sumulong Highway corner Taktak Road, Brgy. Dela Paz, Antipolo City, Rizal* 11. ARANETA AVE. BRANCH - Philippine Whithasco Bldg., 420 Araneta Ave., cor. Bayani St., Quezon City* 12. ARNAIZ AVE. BRANCH – United Life Assurance Building, A. Arnaiz Ave. (Pasay Road), Makati City* 13. ARRANQUE BRANCH – Don Felipe Bldg., 675 Tomas Mapua St., Brgy. 301 Sta. Cruz, Manila* 14. ASUNCION BRANCH – Units G6 & G7 Chinatown Steel Towers, 531 Asuncion St., San Nicolas, Manila* 15. AURORA BLVD. – NEW MANILA BRANCH - Aurora Blvd., Brgy. Valencia, Quezon City* 16. AYALA-ALABANG BRANCH - CBC Bldg., Acacia Ave., Madrigal Business Park, Ayala Alabang, Muntinlupa City* 17. AYALA AVE. – AMORSOLO BRANCH - G/F Teleperformance Bldg., Ayala Ave., Legaspi Village, Makati City* 18. AYALA - COLUMNS BRANCH – G/F The Columns Tower 3, Ayala Ave cor. Sen. Gil Puyat Ave., Brgy. Bel-Air., Makati City* 19. BACLARAN - FB HARRISON BRANCH- BAGPI Main Bldg., 2935 Ortigas St. near cor. F.B. Harrison St., Pasay City* 20. BALINTAWAK - BONIFACIO BRANCH - 657 A. Bonifacio Ave., Balintawak, Quezon City* 21. BALUT BRANCH - North Bay Shopping Center, Honorio Lopez Boulevard, Balut, Tondo, Manila* 22. BANAWE BRANCH – CBC Bldg., 680 Banawe Ave., Sta.Mesa Heights, District I, Quezon City* 23. BANAWE - CALAMBA BRANCH - G/F One Banawe Complex Bldg., #119 Banawe St. cor Calamba St., Brgy. Sto. Domingo, QC* 24. BEL - AIR BRANCH - 2/F Saville Bldg., 8728 Paseo de Roxas, Makati City* 25. BEL - AIR – JUPITER BRANCH – Buendia Car Exchange, Jupiter Street, Makati City* 26. BETTER LIVING SUBD. BRANCH – 128 Doña Soledad Ave., Better Living, Brgy. Don Bosco, Parañaque City* 27. BF HOMES BRANCH - Aguirre cor. El Grande Aves., United BF Homes, Parañaque City* 28. BF HOMES - AGUIRRE BRANCH – Margarita Centre, Aguirre Ave. cor. Elsie Gaches St., BF Homes, Parañaque City* 29. BF RESORT VILLAGE BRANCH - BF Resort Drive cor. Gloria Diaz St., BF Resort Village, Talon Dos, Las Piñas City* 30. BGC - ICON PLAZA BRANCH - G/F Icon Plaza Bldg., 25th cor 5th Sts. Bonifacio South, Fort Bonifacio Global City, Taguig City* 31. BGC - ONE WORLD PLACE BRANCH - G/F One World Place, 32nd Avenue, Fort Bonifacio Global City, Taguig City* 32. BGC - WORLD PLAZA BRANCH- G/F World Plaza, L4B5 E-Square Information Technology Park, Crescent Park West, 5th Avenue,
Bonifacio Global City, Taguig City * 33. BGC – W TOWER - G/F W Tower, 39th St., North Bonifacio Triangle, Fort Bonifacio Global City, Taguig City,1634* 34. BINANGONAN BRANCH - National Highway, Bo. Tagpos, Binangonan, Rizal* 35. BLUMENTRITT BRANCH - 1777-1781 Cavite cor. Leonor Rivera St., Blumentritt, Sta. Cruz, Manila* 36. BO. KAPITOLYO BRANCH - G/F P&E Bldg., 12 United cor. First Sts., Bo. Kapitolyo, Pasig City* 37. BONNY SERRANO BRANCH – G/F Greenhills Garden Square, 297 Col. Bonny Serrano Ave., Bagong Lipunan ng Crame, QC* 38. CAINTA BRANCH - CBC Bldg, F.P. Felix Ave., Brgy. San Isidro, Cainta, Rizal* 39. CAINTA - POBLACION BRANCH- A. Bonifacio Ave., Poblacion, Brgy. Sto. Domingo, Cainta, Rizal* 40. CAPITOL HILLS BRANCH - G/F Design Pro Bldg., Capitol Hills, Old Balara, Quezon City* 41. CENTURY CITY – KNIGHTS BRIDGE BRANCH - Unit 17 & 18 Knightsbridge Residences, Century City, Kalayaan Ave. Makati City* 42. CIRCUIT MAKATI BRANCH – Level 3, Ayala Mall, Circuit Makati, Hippodromo St., Brgy. Carmona, Makati City* 43. COMMONWEALTH AVE. BRANCH - LGF Ever Gotesco Mall, Commonwealth Ave. cor. Don Antonio Road, QC* 44. COMMONWEALTH AVE. EXTENSION – CASA MILAN BRANCH- ALX Center Building, Commonwealth Ave. Ext., Brgy. North
Fairview, Quezon City* 45. CONGRESSIONAL AVENUE BRANCH – G/F Unit C, The Arete Square, Congressional Ave., Project 8, Quezon City* 46. CONGRESSIONAL AVE. EXTENSION – MIRA NILA BRANCH - CBC Building, #71 Lot 28 Blk 2 Mira Nila Homes,
Congressional Ave. Ext., Quezon City* 47. CORINTHIAN HILLS BRANCH - G/F The Clubhouse, Corinthian Hills, Temple Drive, Brgy. Ugong Norte, Quezon City* 48. CUBAO - ARANETA BRANCH – Level 2, Ali Mall, Araneta Center, Cubao, Quezon City* 49. CUBAO - AURORA BRANCH - 911 Aurora Boulevard Extension cor. Miami St., Cubao, Quezon City 50. CUBAO - P. TUAZON BRANCH - No. 287 P. Tuazon Ave. near corner 18th Avenue, Brgy. San Roque, Cubao, Quezon City* 51. CULIAT- TANDANG SORA BRANCH - G/F Royal Midway Plaza, No. 419, Tandang Sora Ave. Brgy. Culiat, 1128 QC* 52. D. TUAZON BRANCH - 148 D. Tuazon St., Brgy. Lourdes, Sta. Mesa Heights, Quezon City* 53. DAMAR VILLAGE BRANCH – The Clubhouse, Damar Loop, Damar Village, Quezon City* 54. DASMARIÑAS VILLAGE BRANCH – 2283 Pasong Tamo Ext. cor. Lumbang St., Makati City*
9
55. DEL MONTE AVENUE BRANCH – No. 497 Del Monte Ave., Brgy. Manresa, Quezon City* 56. DEL MONTE - MATUTUM BRANCH – No. 202 Del Monte Ave. near cor. Matutum St., Brgy. St. Peter, Quezon City* 57. DILIMAN – MATALINO BRANCH – J&L Building, #23 Matalino Street, Brgy. Central, Diliman, Quezon City* 58. DIVISORIA - STA. ELENA BRANCH - Unit G22 New Divisoria Condominium Ctr., 632 Sta. Elena St., Binondo, Manila 59. DON ANTONIO BRANCH - G/F Royale Place, Don Antonio Ave., Old Balara, Quezon City* 60. EASTWOOD CITY BRANCH – Unit D, Techno Plaza One, Eastwood City Cyberpark, E. Rodriguez Jr. Ave., (C-5) Bagumbayan, QC* 61. EDSA - KALOOKAN BRANCH - No. 531 EDSA near cor. Biglang Awa St., Kalookan City* 62. EDSA - PHILAM BRANCH - 917 EDSA, Brgy. Philam, Quezon City* 63. EDSA - TIMOG AVE. BRANCH - G/F Richwell Corporate Center, 102 Timog Ave., Brgy. Sacred Heart, Quezon City* 64. ELCANO BRANCH – G/F Elcano Tower, Elcano St., San Nicolas, Manila 65. E. RODRIGUEZ - ACROPOLIS BRANCH - G/F Suncrest Building, 82 E. Rodriguez Jr. Ave., Bagumbayan, Quezon City* 66. E. RODRIGUEZ - CORDILLERA BRANCH - 291 E. Rodriguez Sr. Blvd., Brgy. Doña Josefa, Quezon City* 67. E. RODRIGUEZ - HILLCREST BRANCH – No. 402 E. Rodriguez Sr. Blvd., Cubao, Quezon City* 68. E. RODRIGUEZ SR. BLVD. BRANCH - CBC Bldg., #286 E. Rodriguez Sr. Blvd., Brgy. Damayang Lagi, Quezon City* 69. ERMITA BRANCH – G/F Ma. Natividad Bldg., #470 T. M. Kalaw cor. Cortada Sts., Brgy. 666, Ermita, Manila* 70. ESPAÑA BRANCH - España cor. Valencia Sts., Sampaloc, Manila* 71. EVANGELISTA BRANCH – 1748 AMV Building, Evangelista cor. Gen Estrella Sts., Bangkal, Makati City* 72. EXAMINER BRANCH - No. 1525 Quezon Ave. cor. Examiner St., West Triangle, Quezon City* 73. FAIRVIEW BRANCH - G/F Angelenix House, Commonwealth Ave. cor. Camaro Sts., Fairview Park Subdivision, Fairview, QC* 74. FAIRVIEW TERRACES BRANCH - LGF Fairview Terraces, Quirino Hiway cor. Maligaya Drive, Brgy. Pasong Putik, Novaliches, QC* 75. FILINVEST CORPORATE CITY BRANCH - G/F Wilcon Depot, Alabang- Zapote Rd cor. Bridgeway Ave., Filinvest Corp City,
Alabang, Muntinlupa City* 76. FILINVEST CORP. CITY – COMMERCENTER BRANCH - G/F Commercenter Bldg., Commerce Ave. cor. Filinvest Ave., Filinvest
Corp City, Alabang, Muntinlupa City 77. FILINVEST CORP. CITY - NORTHGATE BRANCH - G/F Aeon Centre Building, Northgate Cyberzone, Filinvest Corporate City,
Alabang, Muntinlupa City* 78. FIVE E - COM CENTER BRANCH - G/F Five E-com Center, Harbor Drive, MOA Complex, Pasay City* 79. FORT BONIFACIO GLOBAL CITY BRANCH – G/F Marajo Tower, 26th St. cor. 4th Avenue, Fort Bonifacio Global City, Taguig City* 80. GEN. LUIS - KATIPUNAN-CBC Building, Gen. Luis St. corner Katipunan SB Road, Brgy. Nagkaisang Nayon, Novaliches, QC* 81. GIL PUYAT AVENUE BRANCH - Mitsu Bldg., No. 65 Sen. Gil Puyat Ave., Brgy. Palanan, Makati City* 82. GIL PUYAT - ELIZABETH PLACE BRANCH - G/F Elizabeth Place Condominium, 322 H.V. Dela Costa St., Brgy. Bel-Air, Makati City* 83. GIL PUYAT - REPOSO BRANCH - 331 Sen. Gil Puyat Ave., Brgy. Bel-Air, Makati City* 84. GREENBELT 1 BRANCH - G/F Greenbelt 1, Legaspi St. near cor. Paseo de Roxas, San Lorenzo, Makati City* 85. GREENHILLS BRANCH - G/F Gift Gate Bldg., Greenhills Shopping Center, San Juan City, Metro Manila** 86. GREENHILLS – ANNAPOLIS BRANCH – Mercedes 1 Condominium, Annapolis St., Greenhills, San Juan City* 87. GREENHILLS - CONNECTICUT BRANCH - 101 Missouri Square Bldg., Missouri cor. Connecticut St., Northeast Greenhills,
San Juan City* 88. GREENHILLS - ORTIGAS BRANCH – CBC Bldg., 14 Ortigas Ave. Greenhills, San Juan City, Metro Manila* 89. HEROES HILLS BRANCH – Quezon Ave. cor. J. Abad Santos St., Heroes Hills, Brgy. Sta. Cruz, Quezon City* 90. HOLY SPIRIT DRIVE BRANCH - CBC Building Lot 18 Block 6 Holy Spirit Drive, Don Antonio Heights, Brgy. Holy Spirit, Quezon City* 91. ILAYA BRANCH - #947 APL-YSL Bldg., Ilaya, Tondo, Manila 92. INTRAMUROS BRANCH - Sitio Grande, No. 409 A. Soriano Ave., Intramuros, Manila* 93. J. ABAD SANTOS AVENUE BRANCH - 2159 J. Abad Santos Ave. cor. Batangas St., Tondo, Manila* 94. J. ABAD SANTOS AVE. – QUIRICADA BRANCH - #1714 J. Abad Santos Ave. near corner Quiricada Street, Brgy. 252,
Tondo, Manila* 95. JUAN LUNA BRANCH – G/F Aclem Bldg., 501 Juan Luna St., Binondo, Manila* 96. KALAYAAN AVE. BRANCH – G/F PPS Bldg., Kalayaan Ave., Quezon City* 97. KALOOKAN - 8TH AVE.BRANCH - No. 279 Rizal Ave. cor, 8th Ave., Grace Park, Kalookan City* 98. KALOOKAN - 10TH AVE. BRANCH - No. 275 10th Ave. corner 3rd Street, Grace Park, Kalookan City* 99. KALOOKAN BRANCH - CBC Bldg., 167 Rizal Ave. Extension, Grace Park, Kalookan City* 100. KALOOKAN - CAMARIN BRANCH – L8B4 La Forteza Subd., Brgy. 175, Camarin, Kalookan City* 101. KALOOKAN - MONUMENTO BRANCH – CBC Bldg., 779 McArthur Highway, District 2, Brgy. 78. Kalookan City* 102. KAMIAS BRANCH – G/F CRM Bldg., 116 Kamias Road cor. Kasing-Kasing St., Quezon City* 103. KAMUNING BRANCH - SKY47 Bldg., #47 Kamuning Road, Quezon City* 104. KARUHATAN BRANCH – No. 253-B McArthur Highway cor, Bizotte St., Karuhatan, Valenzuela City* 105. KATIPUNAN AVE. – LOYOLA HEIGHTS BRANCH – GF Elizabeth Hall Bldg., Katipunan Ave., Loyola Heights, QC* 106. KATIPUNAN AVE.- ST. IGNATIUS BRANCH – CBC Bldg., No. 121 Katipunan Ave., Brgy. St. Ignatius, Quezon City* 107. LAGRO BRANCH - CBC Building, Lot 32 Blk 125, Quirino Highway, Greater Lagro, Quezon City* 108. LAS PIÑAS BRANCH - CBC Bldg., Alabang-Zapote Road cor. Aries St., Pamplona Park Subd., Las Piñas City*
10
109. LAS PIÑAS - MANUELA BRANCH – CBC Bldg., Alabang-Zapote Road cor. Philamlife Ave., Pamplona Dos, Las Piñas City* 110. LAS PIÑAS - MARCOS ALVAREZ BRANCH - Metro Towne Center, 2020 Marcos Alvarez Ave., Talon V, Moonwalk, Las Piñas City* 111. LAS PIÑAS – NAGA ROAD BRANCH - Lot 3, Naga Road, Pulanglupa2, Las Piñas City* 112. LAVEZARES BRANCH - 412 Lavezares Street, San Nicolas, Manila* 113. LEGASPI VILLAGE - AIM BRANCH - G/F Cacho-Gonzales Bldg, 101 Aguirre cor. Trasierra Sts., Legaspi Vill., Makati City* 114. LEGASPI VILLAGE - AMORSOLO BRANCH - G/F CAP Bldg., Herrera cor. Amorsolo Sts., Legaspi Village, Makati City* 115. LEGASPI VILLAGE - C. PALANCA BRANCH - Suite A, G/F Basic Petroleum Bldg., 104 C. Palanca Jr. St.,
Legaspi Village, Makati City* 116. LEGASPI VILLAGE – ESTEBAN BRANCH - G/F PPI Bldg., No. 109 Esteban St., Legaspi Village, Makati City* 117. LEGASPI VILLAGE - PEREA BRANCH - G/F Greenbelt Mansion, 106 Perea St., Legaspi Village, Makati City* 118. LEGASPI VILLAGE - SALCEDO BRANCH - G/F Fedman Suites, 199 Salcedo St., Legaspi Village, Makati City* 119. M. DELA FUENTE – TRABAJO MARKET BRANCH – #771 M. Dela Fuente St., Sampaloc, Manila* 120. MACAPAGAL AVE. – ASEANA SQUARE BRANCH - Aseana Square (Caltex Area), D. Macapagal Ave., Aseana City, Brgy. Tambo,
Parañaque City* 121. MACAPAGAL AVE. – BIOPOLIS BRANCH - G/F The Biopolis, Central Business Park, 1-A Diosdado Macapagal Avenue,
Pasay City* 122. MACAPAGAL AVE. – DOUBLE DRAGON BRANCH – G/F Phase 1, DD Meridian Park Plaza, Macapagal Ave. cor. EDSA Ext.,
Pasay City* 123. MAGALLANES VILLAGE BRANCH – G/F DHI Bldg., No. 2 Lapu-Lapu Ave. cor. EDSA, Magallanes Village, Magallanes, Makati City* 124. MAKATI AVENUE BRANCH - G/F CBC Bldg., Makati Ave. cor. Hercules St., Bel-Air Village, Brgy. Bel-Air, Makati City* 125. MAKATI – COMEMBO BRANCH – F & V Bldg., No. 46 JP Rizal Ext., Brgy. Comembo, Makati City* 126. MAKATI - JP RIZAL BRANCH – GF Casa Catalina Bldg., JP Rizal corner Honradez Streets, Brgy. Olympia, Makati City* 127. MAKATI - KALAYAAN AVE. BRANCH - Kalayaan Avenue,, Makati City* 128. MALABON - CONCEPCION BRANCH - Gen. Luna cor. Paez Sts., Concepcion, Malabon City* 129. MALABON - GOV. PASCUAL BRANCH – CBC Bldg., Gov. Pascual Ave., Brgy. Acacia, Malabon City* 130. MALABON - POTRERO BRANCH - CBC Bldg., McArthur Highway, Potrero, Malabon* 131. MALANDAY BRANCH - CBC Bldg. McArthur Highway, Malanday, Valenzuela City* 132. MANDALUYONG - BONI AVE. BRANCH - G/F VOS Bldg. Boni Ave. cor. San Rafael St., Plain View, Mandaluyong City* 133. MANDALUYONG BONI – SAN ROQUE BRANCH - #768 Bonifacio Ave. cor. San Roque St., Brgy. Barangka Ilaya,
Mandaluyong City* 134. MANDALUYONG - D. GUEVARA BRANCH - Libertad Plaza, #19 Domingo Guevara St., Highway Hills, Mandaluyong City* 135. MANDALUYONG - PIONEER BRANCH - UG-05 Globe Telecom Plaza Tower I, Pioneer St., Brgy. Ilaya, Mandaluyong City* 136. MANILA - MACEDA BRANCH – M. Daguman Bldg., A. Maceda St., Sampaloc Manila* 137. MARIKINA - FAIRLANE BRANCH – G/F E & L Patricio Bldg., No. 809 J.P. Rizal Ave., Concepcion Uno, Marikina City* 138. MARIKINA - GIL FERNANDO BRANCH - Block 9 Lot 14 Gil Fernando Ave., Marikina City* 139. MARIKINA - SSS VILLAGE BRANCH - Lilac corner Rainbow Sts., Rancho Estate IV, Concepcion Dos, Marikina City* 140. MARIKINA - STA. ELENA BRANCH - 250 J.P. Rizal St., Sta. Elena, Marikina City* 141. MASANGKAY BRANCH - 959-961 G. Masangkay St., Binondo, Manila* 142. MASANGKAY - LUZON BRANCH – 1192 G. Masangkay St., Tondo, Manila* 143. MAYON BRANCH – 480 Mayon St., Sta. Mesa Heights, Quezon City * 144. MINDANAO AVE. BRANCH - G/F LJC Building, 189 Mindanao Ave., Bahay Toro, Quezon City* 145. MUNTINLUPA - PUTATAN BRANCH - G/F Teknikos Bldg., National Highway, Brgy. Putatan, Muntinlupa City* 146. N. DOMINGO BRANCH – G/F The Main Place, No.1 Pinaglabanan cor. N. Domingo Sts., San Juan City* 147. NAVOTAS BRANCH - No. 500 M. Naval St. near cor. Lacson St. Brgy. North Bay Blvd. North (NBBN), Navotas City* 148. NOVALICHES - GULOD BRANCH – 858 Krystle Building, Quirino Highway, Gulod, Novaliches, Quezon City* 149. NOVALICHES - SANGANDAAN BRANCH – CBC Bldg., Quirino Highway cor. Tandang Sora Ave., Brgy. Sangandaan,
Novaliches, QC* 150. NOVALICHES - STA. MONICA BRANCH - G/F E & V Bldg., Quirino Highway corner Dumalay St., Novaliches, Quezon City* 151. NOVALICHES - TALIPAPA BRANCH - 528 Copengco Bldg., Quirino Highway, Talipapa, Novaliches, Quezon City* 152. NOVALICHES - ZABARTE – G/F C.I. Bldg 1151 Quirino Highway cor. Zabarte Road, Brgy. Kaligayahan, Novaliches, Quezon City* 153. NUEVA BRANCH – Unit Nos. 557 & 559 G/F Ayson Bldg., Yuchengco St., Binondo, Manila* 154. ONGPIN BRANCH - G/F Se Jo Tong Bldg., 814 & 816 Ongpin St., Brgy. 297, Sta. Cruz, Manila* 155. OROQUIETA BRANCH – No. 1225 Oroquieta St., Sta. Cruz, Manila* 156. ORTIGAS - ADB AVE. BRANCH - LGF Cityland Mega Plaza Bldg., ADB Ave. cor. Garnet Road, Ortigas Center,
Brgy. San Antonio, Pasig City* 157. ORTIGAS AVE. EXT. - RIVERSIDE BRANCH – Unit 2-3 Riverside Arcade, Ortigas Ave Ext. cor. Riverside Drive,
Brgy. Sta. Lucia, Pasig City* 158. ORTIGAS CENTER BRANCH - Unit 101 Parc Chateau Condominium Onyx cor. Sapphire Sts, Ortigas Center, Pasig City* 159. ORTIGAS COMPLEX BRANCH - G/F Padilla Bldg., F. Ortigas Jr. Road, Ortigas Center, Brgy. San Antonio, Pasig City*
11
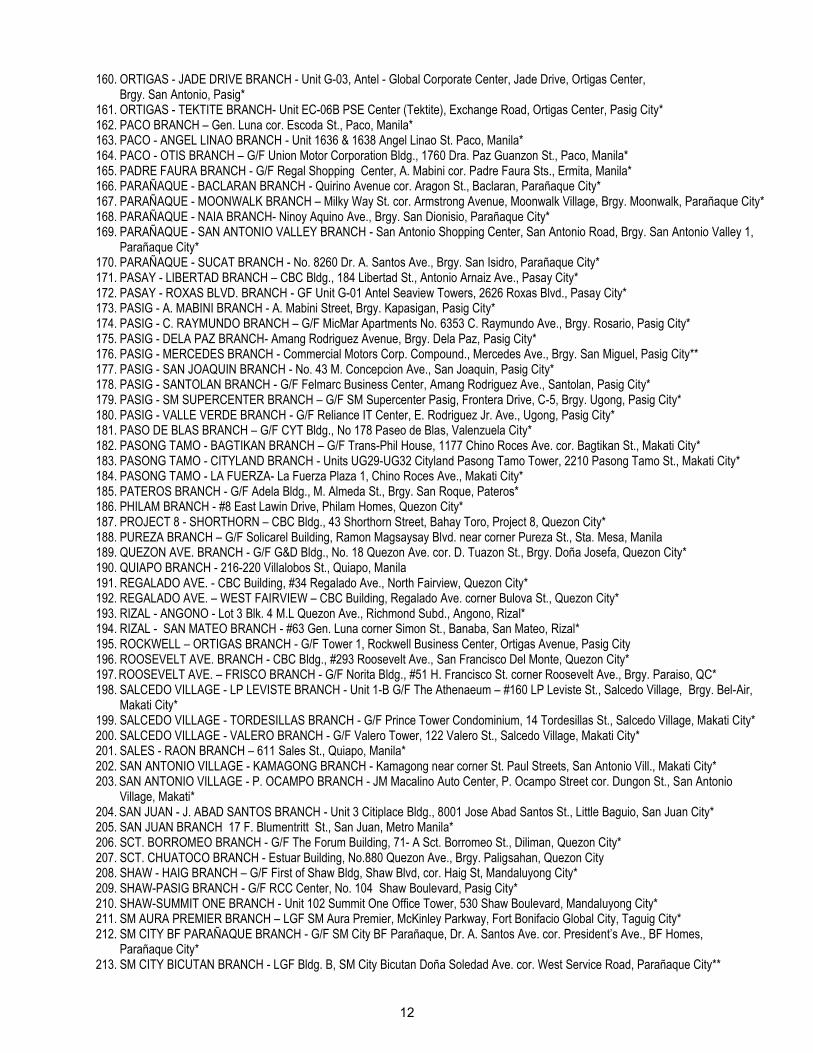
160. ORTIGAS - JADE DRIVE BRANCH - Unit G-03, Antel - Global Corporate Center, Jade Drive, Ortigas Center, Brgy. San Antonio, Pasig*
161. ORTIGAS - TEKTITE BRANCH- Unit EC-06B PSE Center (Tektite), Exchange Road, Ortigas Center, Pasig City* 162. PACO BRANCH – Gen. Luna cor. Escoda St., Paco, Manila* 163. PACO - ANGEL LINAO BRANCH - Unit 1636 & 1638 Angel Linao St. Paco, Manila* 164. PACO - OTIS BRANCH – G/F Union Motor Corporation Bldg., 1760 Dra. Paz Guanzon St., Paco, Manila* 165. PADRE FAURA BRANCH - G/F Regal Shopping Center, A. Mabini cor. Padre Faura Sts., Ermita, Manila* 166. PARAÑAQUE - BACLARAN BRANCH - Quirino Avenue cor. Aragon St., Baclaran, Parañaque City* 167. PARAÑAQUE - MOONWALK BRANCH – Milky Way St. cor. Armstrong Avenue, Moonwalk Village, Brgy. Moonwalk, Parañaque City* 168. PARAÑAQUE - NAIA BRANCH- Ninoy Aquino Ave., Brgy. San Dionisio, Parañaque City* 169. PARAÑAQUE - SAN ANTONIO VALLEY BRANCH - San Antonio Shopping Center, San Antonio Road, Brgy. San Antonio Valley 1,
Parañaque City* 170. PARAÑAQUE - SUCAT BRANCH - No. 8260 Dr. A. Santos Ave., Brgy. San Isidro, Parañaque City* 171. PASAY - LIBERTAD BRANCH – CBC Bldg., 184 Libertad St., Antonio Arnaiz Ave., Pasay City* 172. PASAY - ROXAS BLVD. BRANCH - GF Unit G-01 Antel Seaview Towers, 2626 Roxas Blvd., Pasay City* 173. PASIG - A. MABINI BRANCH - A. Mabini Street, Brgy. Kapasigan, Pasig City* 174. PASIG - C. RAYMUNDO BRANCH – G/F MicMar Apartments No. 6353 C. Raymundo Ave., Brgy. Rosario, Pasig City* 175. PASIG - DELA PAZ BRANCH- Amang Rodriguez Avenue, Brgy. Dela Paz, Pasig City* 176. PASIG - MERCEDES BRANCH - Commercial Motors Corp. Compound., Mercedes Ave., Brgy. San Miguel, Pasig City** 177. PASIG - SAN JOAQUIN BRANCH - No. 43 M. Concepcion Ave., San Joaquin, Pasig City* 178. PASIG - SANTOLAN BRANCH - G/F Felmarc Business Center, Amang Rodriguez Ave., Santolan, Pasig City* 179. PASIG - SM SUPERCENTER BRANCH – G/F SM Supercenter Pasig, Frontera Drive, C-5, Brgy. Ugong, Pasig City* 180. PASIG - VALLE VERDE BRANCH - G/F Reliance IT Center, E. Rodriguez Jr. Ave., Ugong, Pasig City* 181. PASO DE BLAS BRANCH – G/F CYT Bldg., No 178 Paseo de Blas, Valenzuela City* 182. PASONG TAMO - BAGTIKAN BRANCH – G/F Trans-Phil House, 1177 Chino Roces Ave. cor. Bagtikan St., Makati City* 183. PASONG TAMO - CITYLAND BRANCH - Units UG29-UG32 Cityland Pasong Tamo Tower, 2210 Pasong Tamo St., Makati City* 184. PASONG TAMO - LA FUERZA- La Fuerza Plaza 1, Chino Roces Ave., Makati City* 185. PATEROS BRANCH - G/F Adela Bldg., M. Almeda St., Brgy. San Roque, Pateros* 186. PHILAM BRANCH - #8 East Lawin Drive, Philam Homes, Quezon City* 187. PROJECT 8 - SHORTHORN – CBC Bldg., 43 Shorthorn Street, Bahay Toro, Project 8, Quezon City* 188. PUREZA BRANCH – G/F Solicarel Building, Ramon Magsaysay Blvd. near corner Pureza St., Sta. Mesa, Manila 189. QUEZON AVE. BRANCH - G/F G&D Bldg., No. 18 Quezon Ave. cor. D. Tuazon St., Brgy. Doña Josefa, Quezon City* 190. QUIAPO BRANCH - 216-220 Villalobos St., Quiapo, Manila 191. REGALADO AVE. - CBC Building, #34 Regalado Ave., North Fairview, Quezon City* 192. REGALADO AVE. – WEST FAIRVIEW – CBC Building, Regalado Ave. corner Bulova St., Quezon City* 193. RIZAL - ANGONO - Lot 3 Blk. 4 M.L Quezon Ave., Richmond Subd., Angono, Rizal* 194. RIZAL - SAN MATEO BRANCH - #63 Gen. Luna corner Simon St., Banaba, San Mateo, Rizal* 195. ROCKWELL – ORTIGAS BRANCH - G/F Tower 1, Rockwell Business Center, Ortigas Avenue, Pasig City 196. ROOSEVELT AVE. BRANCH - CBC Bldg., #293 Roosevelt Ave., San Francisco Del Monte, Quezon City* 197. ROOSEVELT AVE. – FRISCO BRANCH - G/F Norita Bldg., #51 H. Francisco St. corner Roosevelt Ave., Brgy. Paraiso, QC* 198. SALCEDO VILLAGE - LP LEVISTE BRANCH - Unit 1-B G/F The Athenaeum – #160 LP Leviste St., Salcedo Village, Brgy. Bel-Air,
Makati City* 199. SALCEDO VILLAGE - TORDESILLAS BRANCH - G/F Prince Tower Condominium, 14 Tordesillas St., Salcedo Village, Makati City* 200. SALCEDO VILLAGE - VALERO BRANCH - G/F Valero Tower, 122 Valero St., Salcedo Village, Makati City* 201. SALES - RAON BRANCH – 611 Sales St., Quiapo, Manila* 202. SAN ANTONIO VILLAGE - KAMAGONG BRANCH - Kamagong near corner St. Paul Streets, San Antonio Vill., Makati City* 203. SAN ANTONIO VILLAGE - P. OCAMPO BRANCH - JM Macalino Auto Center, P. Ocampo Street cor. Dungon St., San Antonio
Village, Makati* 204. SAN JUAN - J. ABAD SANTOS BRANCH - Unit 3 Citiplace Bldg., 8001 Jose Abad Santos St., Little Baguio, San Juan City* 205. SAN JUAN BRANCH 17 F. Blumentritt St., San Juan, Metro Manila* 206. SCT. BORROMEO BRANCH - G/F The Forum Building, 71- A Sct. Borromeo St., Diliman, Quezon City* 207. SCT. CHUATOCO BRANCH - Estuar Building, No.880 Quezon Ave., Brgy. Paligsahan, Quezon City 208. SHAW - HAIG BRANCH – G/F First of Shaw Bldg, Shaw Blvd, cor. Haig St, Mandaluyong City* 209. SHAW-PASIG BRANCH - G/F RCC Center, No. 104 Shaw Boulevard, Pasig City* 210. SHAW-SUMMIT ONE BRANCH - Unit 102 Summit One Office Tower, 530 Shaw Boulevard, Mandaluyong City* 211. SM AURA PREMIER BRANCH – LGF SM Aura Premier, McKinley Parkway, Fort Bonifacio Global City, Taguig City* 212. SM CITY BF PARAÑAQUE BRANCH - G/F SM City BF Parañaque, Dr. A. Santos Ave. cor. President’s Ave., BF Homes,
Parañaque City* 213. SM CITY BICUTAN BRANCH - LGF Bldg. B, SM City Bicutan Doña Soledad Ave. cor. West Service Road, Parañaque City**
12
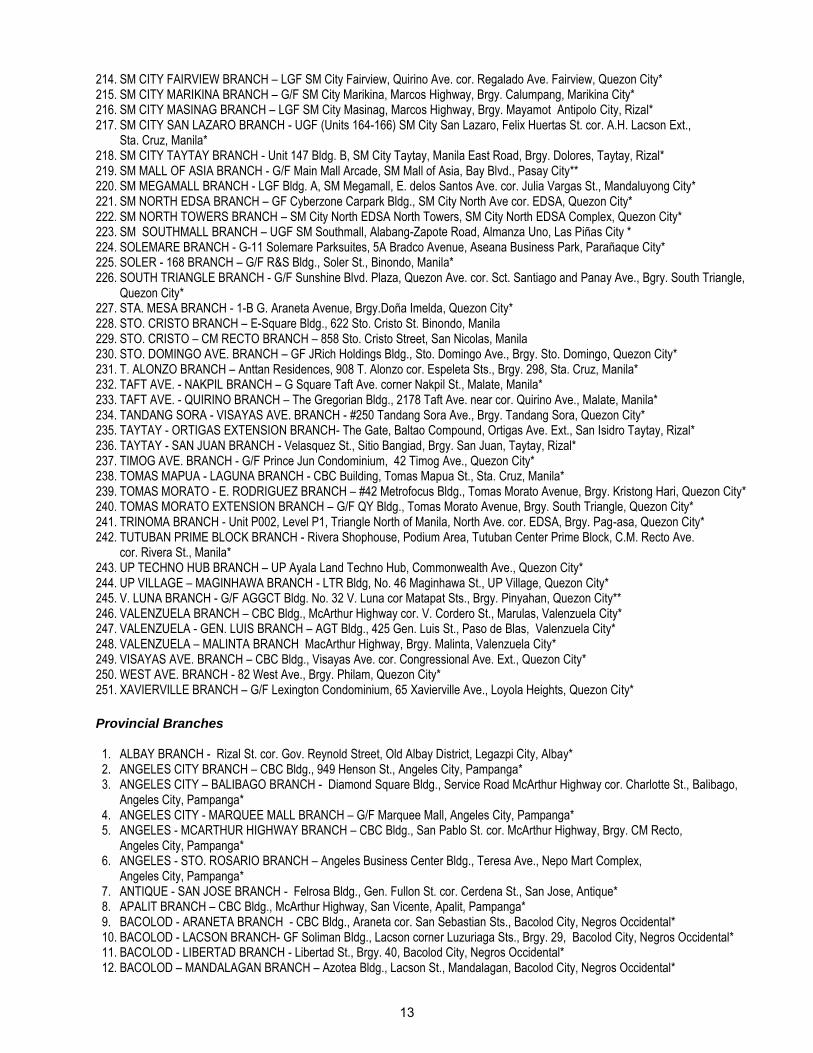
214. SM CITY FAIRVIEW BRANCH – LGF SM City Fairview, Quirino Ave. cor. Regalado Ave. Fairview, Quezon City* 215. SM CITY MARIKINA BRANCH – G/F SM City Marikina, Marcos Highway, Brgy. Calumpang, Marikina City* 216. SM CITY MASINAG BRANCH – LGF SM City Masinag, Marcos Highway, Brgy. Mayamot Antipolo City, Rizal* 217. SM CITY SAN LAZARO BRANCH - UGF (Units 164-166) SM City San Lazaro, Felix Huertas St. cor. A.H. Lacson Ext.,
Sta. Cruz, Manila* 218. SM CITY TAYTAY BRANCH - Unit 147 Bldg. B, SM City Taytay, Manila East Road, Brgy. Dolores, Taytay, Rizal* 219. SM MALL OF ASIA BRANCH - G/F Main Mall Arcade, SM Mall of Asia, Bay Blvd., Pasay City** 220. SM MEGAMALL BRANCH - LGF Bldg. A, SM Megamall, E. delos Santos Ave. cor. Julia Vargas St., Mandaluyong City* 221. SM NORTH EDSA BRANCH – GF Cyberzone Carpark Bldg., SM City North Ave cor. EDSA, Quezon City* 222. SM NORTH TOWERS BRANCH – SM City North EDSA North Towers, SM City North EDSA Complex, Quezon City* 223. SM SOUTHMALL BRANCH – UGF SM Southmall, Alabang-Zapote Road, Almanza Uno, Las Piñas City * 224. SOLEMARE BRANCH - G-11 Solemare Parksuites, 5A Bradco Avenue, Aseana Business Park, Parañaque City* 225. SOLER - 168 BRANCH – G/F R&S Bldg., Soler St., Binondo, Manila* 226. SOUTH TRIANGLE BRANCH - G/F Sunshine Blvd. Plaza, Quezon Ave. cor. Sct. Santiago and Panay Ave., Bgry. South Triangle,
Quezon City* 227. STA. MESA BRANCH - 1-B G. Araneta Avenue, Brgy.Doña Imelda, Quezon City* 228. STO. CRISTO BRANCH – E-Square Bldg., 622 Sto. Cristo St. Binondo, Manila 229. STO. CRISTO – CM RECTO BRANCH – 858 Sto. Cristo Street, San Nicolas, Manila 230. STO. DOMINGO AVE. BRANCH – GF JRich Holdings Bldg., Sto. Domingo Ave., Brgy. Sto. Domingo, Quezon City* 231. T. ALONZO BRANCH – Anttan Residences, 908 T. Alonzo cor. Espeleta Sts., Brgy. 298, Sta. Cruz, Manila* 232. TAFT AVE. - NAKPIL BRANCH – G Square Taft Ave. corner Nakpil St., Malate, Manila* 233. TAFT AVE. - QUIRINO BRANCH – The Gregorian Bldg., 2178 Taft Ave. near cor. Quirino Ave., Malate, Manila* 234. TANDANG SORA - VISAYAS AVE. BRANCH - #250 Tandang Sora Ave., Brgy. Tandang Sora, Quezon City* 235. TAYTAY - ORTIGAS EXTENSION BRANCH- The Gate, Baltao Compound, Ortigas Ave. Ext., San Isidro Taytay, Rizal* 236. TAYTAY - SAN JUAN BRANCH - Velasquez St., Sitio Bangiad, Brgy. San Juan, Taytay, Rizal* 237. TIMOG AVE. BRANCH - G/F Prince Jun Condominium, 42 Timog Ave., Quezon City* 238. TOMAS MAPUA - LAGUNA BRANCH - CBC Building, Tomas Mapua St., Sta. Cruz, Manila* 239. TOMAS MORATO - E. RODRIGUEZ BRANCH – #42 Metrofocus Bldg., Tomas Morato Avenue, Brgy. Kristong Hari, Quezon City* 240. TOMAS MORATO EXTENSION BRANCH – G/F QY Bldg., Tomas Morato Avenue, Brgy. South Triangle, Quezon City* 241. TRINOMA BRANCH - Unit P002, Level P1, Triangle North of Manila, North Ave. cor. EDSA, Brgy. Pag-asa, Quezon City* 242. TUTUBAN PRIME BLOCK BRANCH - Rivera Shophouse, Podium Area, Tutuban Center Prime Block, C.M. Recto Ave.
cor. Rivera St., Manila* 243. UP TECHNO HUB BRANCH – UP Ayala Land Techno Hub, Commonwealth Ave., Quezon City* 244. UP VILLAGE – MAGINHAWA BRANCH - LTR Bldg, No. 46 Maginhawa St., UP Village, Quezon City* 245. V. LUNA BRANCH - G/F AGGCT Bldg. No. 32 V. Luna cor Matapat Sts., Brgy. Pinyahan, Quezon City** 246. VALENZUELA BRANCH – CBC Bldg., McArthur Highway cor. V. Cordero St., Marulas, Valenzuela City* 247. VALENZUELA - GEN. LUIS BRANCH – AGT Bldg., 425 Gen. Luis St., Paso de Blas, Valenzuela City* 248. VALENZUELA – MALINTA BRANCH MacArthur Highway, Brgy. Malinta, Valenzuela City* 249. VISAYAS AVE. BRANCH – CBC Bldg., Visayas Ave. cor. Congressional Ave. Ext., Quezon City* 250. WEST AVE. BRANCH - 82 West Ave., Brgy. Philam, Quezon City* 251. XAVIERVILLE BRANCH – G/F Lexington Condominium, 65 Xavierville Ave., Loyola Heights, Quezon City*
Provincial Branches
1. ALBAY BRANCH - Rizal St. cor. Gov. Reynold Street, Old Albay District, Legazpi City, Albay* 2. ANGELES CITY BRANCH – CBC Bldg., 949 Henson St., Angeles City, Pampanga* 3. ANGELES CITY – BALIBAGO BRANCH - Diamond Square Bldg., Service Road McArthur Highway cor. Charlotte St., Balibago,
Angeles City, Pampanga* 4. ANGELES CITY - MARQUEE MALL BRANCH – G/F Marquee Mall, Angeles City, Pampanga* 5. ANGELES - MCARTHUR HIGHWAY BRANCH – CBC Bldg., San Pablo St. cor. McArthur Highway, Brgy. CM Recto, Angeles City, Pampanga* 6. ANGELES - STO. ROSARIO BRANCH – Angeles Business Center Bldg., Teresa Ave., Nepo Mart Complex,
Angeles City, Pampanga* 7. ANTIQUE - SAN JOSE BRANCH - Felrosa Bldg., Gen. Fullon St. cor. Cerdena St., San Jose, Antique* 8. APALIT BRANCH – CBC Bldg., McArthur Highway, San Vicente, Apalit, Pampanga* 9. BACOLOD - ARANETA BRANCH - CBC Bldg., Araneta cor. San Sebastian Sts., Bacolod City, Negros Occidental* 10. BACOLOD - LACSON BRANCH- GF Soliman Bldg., Lacson corner Luzuriaga Sts., Brgy. 29, Bacolod City, Negros Occidental* 11. BACOLOD - LIBERTAD BRANCH - Libertad St., Brgy. 40, Bacolod City, Negros Occidental* 12. BACOLOD – MANDALAGAN BRANCH – Azotea Bldg., Lacson St., Mandalagan, Bacolod City, Negros Occidental*
13
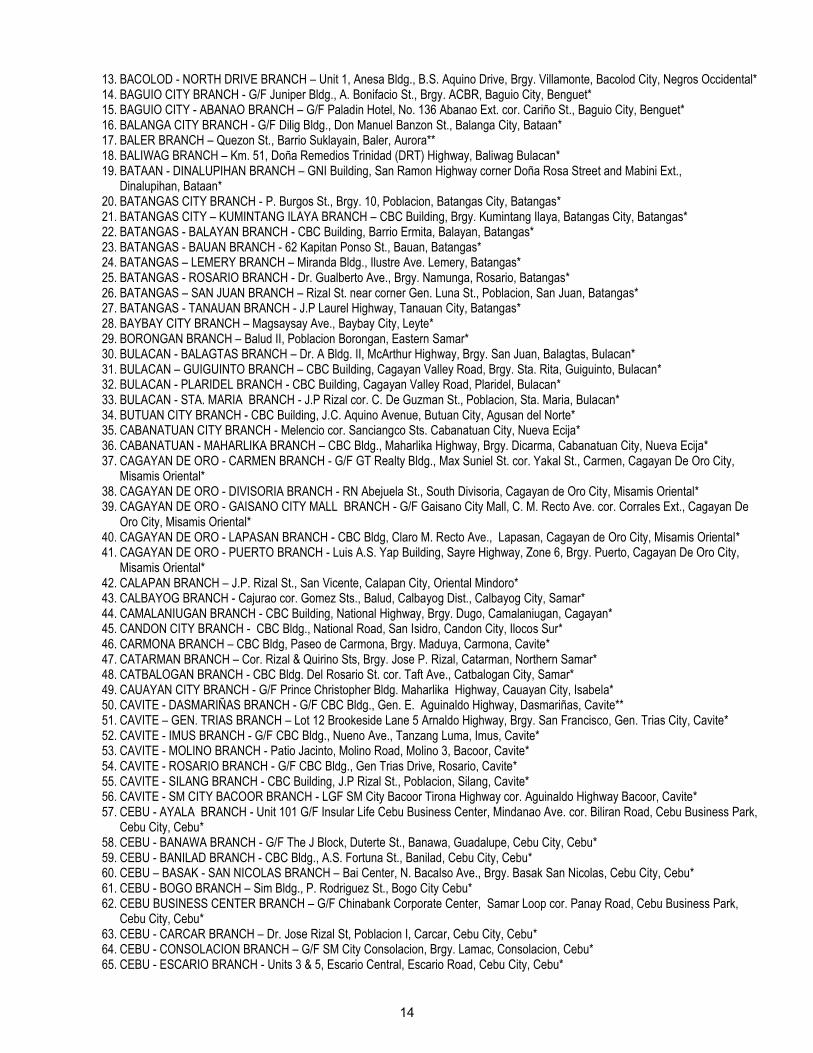
13. BACOLOD - NORTH DRIVE BRANCH – Unit 1, Anesa Bldg., B.S. Aquino Drive, Brgy. Villamonte, Bacolod City, Negros Occidental* 14. BAGUIO CITY BRANCH - G/F Juniper Bldg., A. Bonifacio St., Brgy. ACBR, Baguio City, Benguet* 15. BAGUIO CITY - ABANAO BRANCH – G/F Paladin Hotel, No. 136 Abanao Ext. cor. Cariño St., Baguio City, Benguet* 16. BALANGA CITY BRANCH - G/F Dilig Bldg., Don Manuel Banzon St., Balanga City, Bataan* 17. BALER BRANCH – Quezon St., Barrio Suklayain, Baler, Aurora** 18. BALIWAG BRANCH – Km. 51, Doña Remedios Trinidad (DRT) Highway, Baliwag Bulacan* 19. BATAAN - DINALUPIHAN BRANCH – GNI Building, San Ramon Highway corner Doña Rosa Street and Mabini Ext.,
Dinalupihan, Bataan* 20. BATANGAS CITY BRANCH - P. Burgos St., Brgy. 10, Poblacion, Batangas City, Batangas* 21. BATANGAS CITY – KUMINTANG ILAYA BRANCH – CBC Building, Brgy. Kumintang Ilaya, Batangas City, Batangas* 22. BATANGAS - BALAYAN BRANCH - CBC Building, Barrio Ermita, Balayan, Batangas* 23. BATANGAS - BAUAN BRANCH - 62 Kapitan Ponso St., Bauan, Batangas* 24. BATANGAS – LEMERY BRANCH – Miranda Bldg., Ilustre Ave. Lemery, Batangas* 25. BATANGAS - ROSARIO BRANCH - Dr. Gualberto Ave., Brgy. Namunga, Rosario, Batangas* 26. BATANGAS – SAN JUAN BRANCH – Rizal St. near corner Gen. Luna St., Poblacion, San Juan, Batangas* 27. BATANGAS - TANAUAN BRANCH - J.P Laurel Highway, Tanauan City, Batangas* 28. BAYBAY CITY BRANCH – Magsaysay Ave., Baybay City, Leyte* 29. BORONGAN BRANCH – Balud II, Poblacion Borongan, Eastern Samar* 30. BULACAN - BALAGTAS BRANCH – Dr. A Bldg. II, McArthur Highway, Brgy. San Juan, Balagtas, Bulacan* 31. BULACAN – GUIGUINTO BRANCH – CBC Building, Cagayan Valley Road, Brgy. Sta. Rita, Guiguinto, Bulacan* 32. BULACAN - PLARIDEL BRANCH - CBC Building, Cagayan Valley Road, Plaridel, Bulacan* 33. BULACAN - STA. MARIA BRANCH - J.P Rizal cor. C. De Guzman St., Poblacion, Sta. Maria, Bulacan* 34. BUTUAN CITY BRANCH - CBC Building, J.C. Aquino Avenue, Butuan City, Agusan del Norte* 35. CABANATUAN CITY BRANCH - Melencio cor. Sanciangco Sts. Cabanatuan City, Nueva Ecija* 36. CABANATUAN - MAHARLIKA BRANCH – CBC Bldg., Maharlika Highway, Brgy. Dicarma, Cabanatuan City, Nueva Ecija* 37. CAGAYAN DE ORO - CARMEN BRANCH - G/F GT Realty Bldg., Max Suniel St. cor. Yakal St., Carmen, Cagayan De Oro City, Misamis Oriental* 38. CAGAYAN DE ORO - DIVISORIA BRANCH - RN Abejuela St., South Divisoria, Cagayan de Oro City, Misamis Oriental* 39. CAGAYAN DE ORO - GAISANO CITY MALL BRANCH - G/F Gaisano City Mall, C. M. Recto Ave. cor. Corrales Ext., Cagayan De
Oro City, Misamis Oriental* 40. CAGAYAN DE ORO - LAPASAN BRANCH - CBC Bldg, Claro M. Recto Ave., Lapasan, Cagayan de Oro City, Misamis Oriental* 41. CAGAYAN DE ORO - PUERTO BRANCH - Luis A.S. Yap Building, Sayre Highway, Zone 6, Brgy. Puerto, Cagayan De Oro City,
Misamis Oriental* 42. CALAPAN BRANCH – J.P. Rizal St., San Vicente, Calapan City, Oriental Mindoro* 43. CALBAYOG BRANCH - Cajurao cor. Gomez Sts., Balud, Calbayog Dist., Calbayog City, Samar* 44. CAMALANIUGAN BRANCH - CBC Building, National Highway, Brgy. Dugo, Camalaniugan, Cagayan* 45. CANDON CITY BRANCH - CBC Bldg., National Road, San Isidro, Candon City, Ilocos Sur* 46. CARMONA BRANCH – CBC Bldg, Paseo de Carmona, Brgy. Maduya, Carmona, Cavite* 47. CATARMAN BRANCH – Cor. Rizal & Quirino Sts, Brgy. Jose P. Rizal, Catarman, Northern Samar* 48. CATBALOGAN BRANCH - CBC Bldg. Del Rosario St. cor. Taft Ave., Catbalogan City, Samar* 49. CAUAYAN CITY BRANCH - G/F Prince Christopher Bldg. Maharlika Highway, Cauayan City, Isabela* 50. CAVITE - DASMARIÑAS BRANCH - G/F CBC Bldg., Gen. E. Aguinaldo Highway, Dasmariñas, Cavite** 51. CAVITE – GEN. TRIAS BRANCH – Lot 12 Brookeside Lane 5 Arnaldo Highway, Brgy. San Francisco, Gen. Trias City, Cavite* 52. CAVITE - IMUS BRANCH - G/F CBC Bldg., Nueno Ave., Tanzang Luma, Imus, Cavite* 53. CAVITE - MOLINO BRANCH - Patio Jacinto, Molino Road, Molino 3, Bacoor, Cavite* 54. CAVITE - ROSARIO BRANCH - G/F CBC Bldg., Gen Trias Drive, Rosario, Cavite* 55. CAVITE - SILANG BRANCH - CBC Building, J.P Rizal St., Poblacion, Silang, Cavite* 56. CAVITE - SM CITY BACOOR BRANCH - LGF SM City Bacoor Tirona Highway cor. Aguinaldo Highway Bacoor, Cavite* 57. CEBU - AYALA BRANCH - Unit 101 G/F Insular Life Cebu Business Center, Mindanao Ave. cor. Biliran Road, Cebu Business Park,
Cebu City, Cebu* 58. CEBU - BANAWA BRANCH - G/F The J Block, Duterte St., Banawa, Guadalupe, Cebu City, Cebu* 59. CEBU - BANILAD BRANCH - CBC Bldg., A.S. Fortuna St., Banilad, Cebu City, Cebu* 60. CEBU – BASAK - SAN NICOLAS BRANCH – Bai Center, N. Bacalso Ave., Brgy. Basak San Nicolas, Cebu City, Cebu* 61. CEBU - BOGO BRANCH – Sim Bldg., P. Rodriguez St., Bogo City Cebu* 62. CEBU BUSINESS CENTER BRANCH – G/F Chinabank Corporate Center, Samar Loop cor. Panay Road, Cebu Business Park, Cebu City, Cebu* 63. CEBU - CARCAR BRANCH – Dr. Jose Rizal St, Poblacion I, Carcar, Cebu City, Cebu* 64. CEBU - CONSOLACION BRANCH – G/F SM City Consolacion, Brgy. Lamac, Consolacion, Cebu* 65. CEBU - ESCARIO BRANCH - Units 3 & 5, Escario Central, Escario Road, Cebu City, Cebu*
14
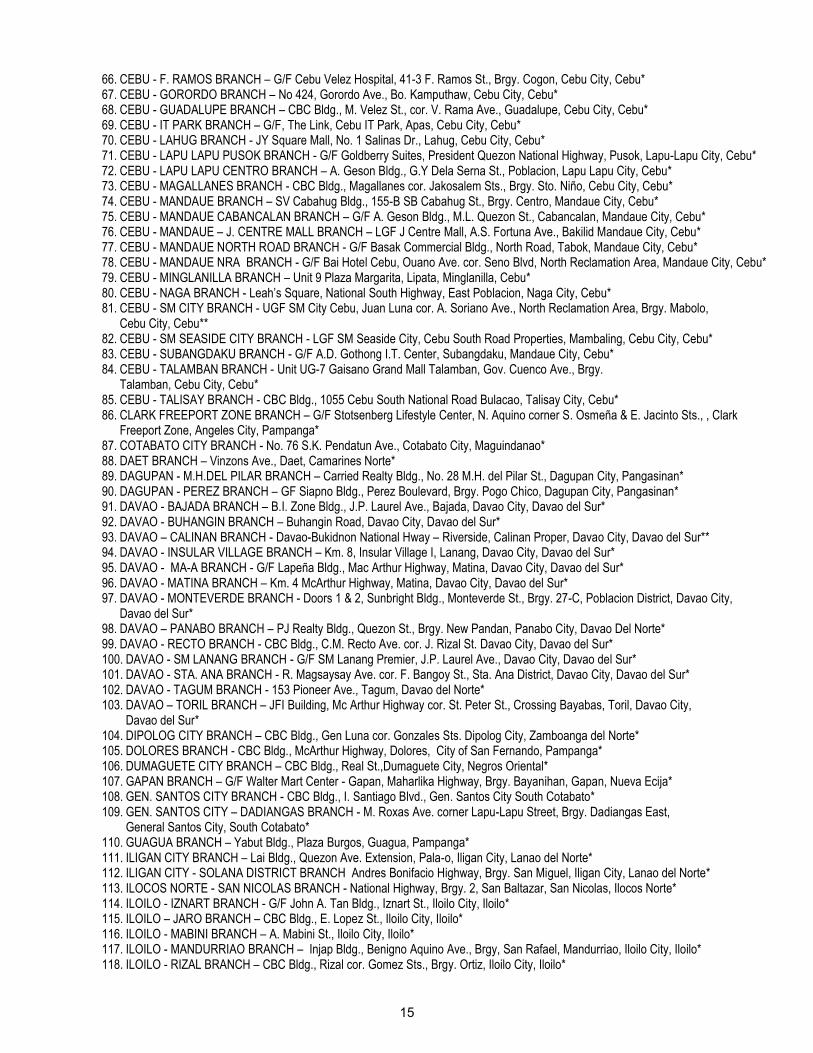
66. CEBU - F. RAMOS BRANCH – G/F Cebu Velez Hospital, 41-3 F. Ramos St., Brgy. Cogon, Cebu City, Cebu* 67. CEBU - GORORDO BRANCH – No 424, Gorordo Ave., Bo. Kamputhaw, Cebu City, Cebu* 68. CEBU - GUADALUPE BRANCH – CBC Bldg., M. Velez St., cor. V. Rama Ave., Guadalupe, Cebu City, Cebu* 69. CEBU - IT PARK BRANCH – G/F, The Link, Cebu IT Park, Apas, Cebu City, Cebu* 70. CEBU - LAHUG BRANCH - JY Square Mall, No. 1 Salinas Dr., Lahug, Cebu City, Cebu* 71. CEBU - LAPU LAPU PUSOK BRANCH - G/F Goldberry Suites, President Quezon National Highway, Pusok, Lapu-Lapu City, Cebu* 72. CEBU - LAPU LAPU CENTRO BRANCH – A. Geson Bldg., G.Y Dela Serna St., Poblacion, Lapu Lapu City, Cebu* 73. CEBU - MAGALLANES BRANCH - CBC Bldg., Magallanes cor. Jakosalem Sts., Brgy. Sto. Niño, Cebu City, Cebu* 74. CEBU - MANDAUE BRANCH – SV Cabahug Bldg., 155-B SB Cabahug St., Brgy. Centro, Mandaue City, Cebu* 75. CEBU - MANDAUE CABANCALAN BRANCH – G/F A. Geson Bldg., M.L. Quezon St., Cabancalan, Mandaue City, Cebu* 76. CEBU - MANDAUE – J. CENTRE MALL BRANCH – LGF J Centre Mall, A.S. Fortuna Ave., Bakilid Mandaue City, Cebu* 77. CEBU - MANDAUE NORTH ROAD BRANCH - G/F Basak Commercial Bldg., North Road, Tabok, Mandaue City, Cebu* 78. CEBU - MANDAUE NRA BRANCH - G/F Bai Hotel Cebu, Ouano Ave. cor. Seno Blvd, North Reclamation Area, Mandaue City, Cebu* 79. CEBU - MINGLANILLA BRANCH – Unit 9 Plaza Margarita, Lipata, Minglanilla, Cebu* 80. CEBU - NAGA BRANCH - Leah’s Square, National South Highway, East Poblacion, Naga City, Cebu* 81. CEBU - SM CITY BRANCH - UGF SM City Cebu, Juan Luna cor. A. Soriano Ave., North Reclamation Area, Brgy. Mabolo, Cebu City, Cebu** 82. CEBU - SM SEASIDE CITY BRANCH - LGF SM Seaside City, Cebu South Road Properties, Mambaling, Cebu City, Cebu* 83. CEBU - SUBANGDAKU BRANCH - G/F A.D. Gothong I.T. Center, Subangdaku, Mandaue City, Cebu* 84. CEBU - TALAMBAN BRANCH - Unit UG-7 Gaisano Grand Mall Talamban, Gov. Cuenco Ave., Brgy. Talamban, Cebu City, Cebu* 85. CEBU - TALISAY BRANCH - CBC Bldg., 1055 Cebu South National Road Bulacao, Talisay City, Cebu* 86. CLARK FREEPORT ZONE BRANCH – G/F Stotsenberg Lifestyle Center, N. Aquino corner S. Osmeña & E. Jacinto Sts., , Clark
Freeport Zone, Angeles City, Pampanga* 87. COTABATO CITY BRANCH - No. 76 S.K. Pendatun Ave., Cotabato City, Maguindanao* 88. DAET BRANCH – Vinzons Ave., Daet, Camarines Norte* 89. DAGUPAN - M.H.DEL PILAR BRANCH – Carried Realty Bldg., No. 28 M.H. del Pilar St., Dagupan City, Pangasinan* 90. DAGUPAN - PEREZ BRANCH – GF Siapno Bldg., Perez Boulevard, Brgy. Pogo Chico, Dagupan City, Pangasinan* 91. DAVAO - BAJADA BRANCH – B.I. Zone Bldg., J.P. Laurel Ave., Bajada, Davao City, Davao del Sur* 92. DAVAO - BUHANGIN BRANCH – Buhangin Road, Davao City, Davao del Sur* 93. DAVAO – CALINAN BRANCH - Davao-Bukidnon National Hway – Riverside, Calinan Proper, Davao City, Davao del Sur** 94. DAVAO - INSULAR VILLAGE BRANCH – Km. 8, Insular Village I, Lanang, Davao City, Davao del Sur* 95. DAVAO - MA-A BRANCH - G/F Lapeña Bldg., Mac Arthur Highway, Matina, Davao City, Davao del Sur* 96. DAVAO - MATINA BRANCH – Km. 4 McArthur Highway, Matina, Davao City, Davao del Sur* 97. DAVAO - MONTEVERDE BRANCH - Doors 1 & 2, Sunbright Bldg., Monteverde St., Brgy. 27-C, Poblacion District, Davao City,
Davao del Sur* 98. DAVAO – PANABO BRANCH – PJ Realty Bldg., Quezon St., Brgy. New Pandan, Panabo City, Davao Del Norte* 99. DAVAO - RECTO BRANCH - CBC Bldg., C.M. Recto Ave. cor. J. Rizal St. Davao City, Davao del Sur* 100. DAVAO - SM LANANG BRANCH - G/F SM Lanang Premier, J.P. Laurel Ave., Davao City, Davao del Sur* 101. DAVAO - STA. ANA BRANCH - R. Magsaysay Ave. cor. F. Bangoy St., Sta. Ana District, Davao City, Davao del Sur* 102. DAVAO - TAGUM BRANCH - 153 Pioneer Ave., Tagum, Davao del Norte* 103. DAVAO – TORIL BRANCH – JFI Building, Mc Arthur Highway cor. St. Peter St., Crossing Bayabas, Toril, Davao City,
Davao del Sur* 104. DIPOLOG CITY BRANCH – CBC Bldg., Gen Luna cor. Gonzales Sts. Dipolog City, Zamboanga del Norte* 105. DOLORES BRANCH - CBC Bldg., McArthur Highway, Dolores, City of San Fernando, Pampanga* 106. DUMAGUETE CITY BRANCH – CBC Bldg., Real St.,Dumaguete City, Negros Oriental* 107. GAPAN BRANCH – G/F Walter Mart Center - Gapan, Maharlika Highway, Brgy. Bayanihan, Gapan, Nueva Ecija* 108. GEN. SANTOS CITY BRANCH - CBC Bldg., I. Santiago Blvd., Gen. Santos City South Cotabato* 109. GEN. SANTOS CITY – DADIANGAS BRANCH - M. Roxas Ave. corner Lapu-Lapu Street, Brgy. Dadiangas East, General Santos City, South Cotabato* 110. GUAGUA BRANCH – Yabut Bldg., Plaza Burgos, Guagua, Pampanga* 111. ILIGAN CITY BRANCH – Lai Bldg., Quezon Ave. Extension, Pala-o, Iligan City, Lanao del Norte* 112. ILIGAN CITY - SOLANA DISTRICT BRANCH Andres Bonifacio Highway, Brgy. San Miguel, Iligan City, Lanao del Norte* 113. ILOCOS NORTE - SAN NICOLAS BRANCH - National Highway, Brgy. 2, San Baltazar, San Nicolas, Ilocos Norte* 114. ILOILO - IZNART BRANCH - G/F John A. Tan Bldg., Iznart St., Iloilo City, Iloilo* 115. ILOILO – JARO BRANCH – CBC Bldg., E. Lopez St., Iloilo City, Iloilo* 116. ILOILO - MABINI BRANCH – A. Mabini St., Iloilo City, Iloilo* 117. ILOILO - MANDURRIAO BRANCH – Injap Bldg., Benigno Aquino Ave., Brgy, San Rafael, Mandurriao, Iloilo City, Iloilo* 118. ILOILO - RIZAL BRANCH – CBC Bldg., Rizal cor. Gomez Sts., Brgy. Ortiz, Iloilo City, Iloilo*
15
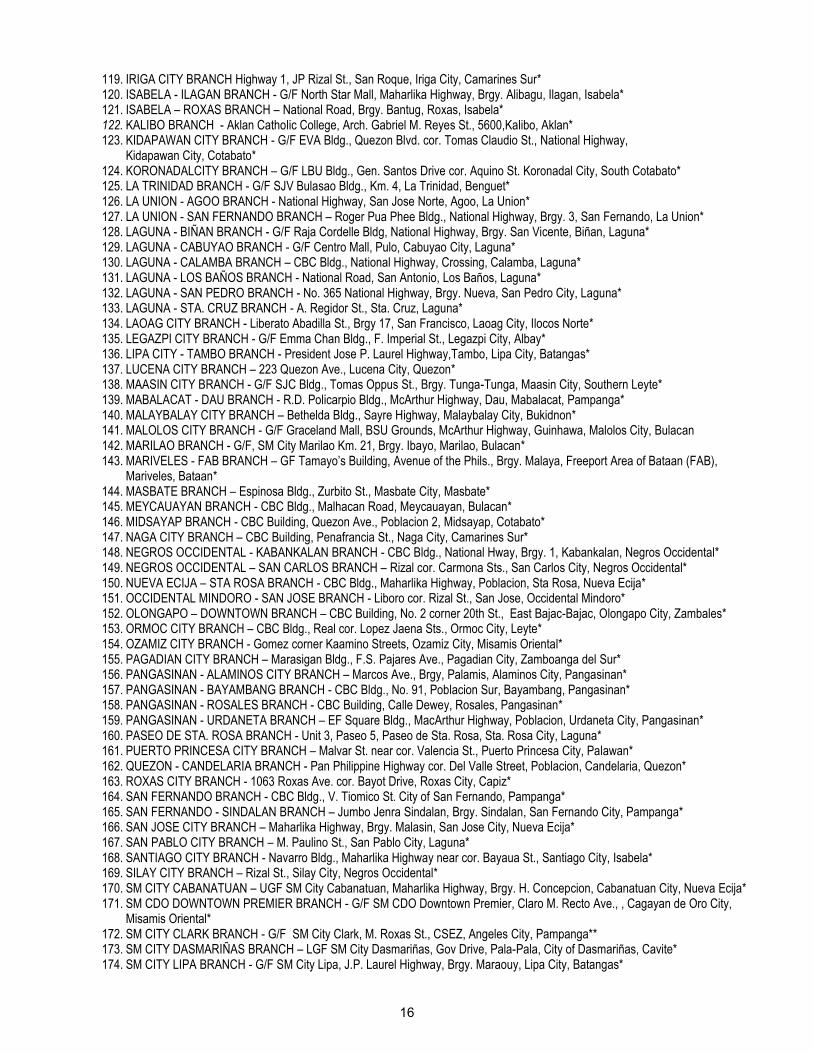
119. IRIGA CITY BRANCH Highway 1, JP Rizal St., San Roque, Iriga City, Camarines Sur* 120. ISABELA - ILAGAN BRANCH - G/F North Star Mall, Maharlika Highway, Brgy. Alibagu, Ilagan, Isabela* 121. ISABELA – ROXAS BRANCH – National Road, Brgy. Bantug, Roxas, Isabela* 122. KALIBO BRANCH - Aklan Catholic College, Arch. Gabriel M. Reyes St., 5600,Kalibo, Aklan* 123. KIDAPAWAN CITY BRANCH - G/F EVA Bldg., Quezon Blvd. cor. Tomas Claudio St., National Highway, Kidapawan City, Cotabato* 124. KORONADALCITY BRANCH – G/F LBU Bldg., Gen. Santos Drive cor. Aquino St. Koronadal City, South Cotabato* 125. LA TRINIDAD BRANCH - G/F SJV Bulasao Bldg., Km. 4, La Trinidad, Benguet* 126. LA UNION - AGOO BRANCH - National Highway, San Jose Norte, Agoo, La Union* 127. LA UNION - SAN FERNANDO BRANCH – Roger Pua Phee Bldg., National Highway, Brgy. 3, San Fernando, La Union* 128. LAGUNA - BIÑAN BRANCH - G/F Raja Cordelle Bldg, National Highway, Brgy. San Vicente, Biñan, Laguna* 129. LAGUNA - CABUYAO BRANCH - G/F Centro Mall, Pulo, Cabuyao City, Laguna* 130. LAGUNA - CALAMBA BRANCH – CBC Bldg., National Highway, Crossing, Calamba, Laguna* 131. LAGUNA - LOS BAÑOS BRANCH - National Road, San Antonio, Los Baños, Laguna* 132. LAGUNA - SAN PEDRO BRANCH - No. 365 National Highway, Brgy. Nueva, San Pedro City, Laguna* 133. LAGUNA - STA. CRUZ BRANCH - A. Regidor St., Sta. Cruz, Laguna* 134. LAOAG CITY BRANCH - Liberato Abadilla St., Brgy 17, San Francisco, Laoag City, Ilocos Norte* 135. LEGAZPI CITY BRANCH - G/F Emma Chan Bldg., F. Imperial St., Legazpi City, Albay* 136. LIPA CITY - TAMBO BRANCH - President Jose P. Laurel Highway,Tambo, Lipa City, Batangas* 137. LUCENA CITY BRANCH – 223 Quezon Ave., Lucena City, Quezon* 138. MAASIN CITY BRANCH - G/F SJC Bldg., Tomas Oppus St., Brgy. Tunga-Tunga, Maasin City, Southern Leyte* 139. MABALACAT - DAU BRANCH - R.D. Policarpio Bldg., McArthur Highway, Dau, Mabalacat, Pampanga* 140. MALAYBALAY CITY BRANCH – Bethelda Bldg., Sayre Highway, Malaybalay City, Bukidnon* 141. MALOLOS CITY BRANCH - G/F Graceland Mall, BSU Grounds, McArthur Highway, Guinhawa, Malolos City, Bulacan 142. MARILAO BRANCH - G/F, SM City Marilao Km. 21, Brgy. Ibayo, Marilao, Bulacan* 143. MARIVELES - FAB BRANCH – GF Tamayo’s Building, Avenue of the Phils., Brgy. Malaya, Freeport Area of Bataan (FAB), Mariveles, Bataan* 144. MASBATE BRANCH – Espinosa Bldg., Zurbito St., Masbate City, Masbate* 145. MEYCAUAYAN BRANCH - CBC Bldg., Malhacan Road, Meycauayan, Bulacan* 146. MIDSAYAP BRANCH - CBC Building, Quezon Ave., Poblacion 2, Midsayap, Cotabato* 147. NAGA CITY BRANCH – CBC Building, Penafrancia St., Naga City, Camarines Sur* 148. NEGROS OCCIDENTAL - KABANKALAN BRANCH - CBC Bldg., National Hway, Brgy. 1, Kabankalan, Negros Occidental* 149. NEGROS OCCIDENTAL – SAN CARLOS BRANCH – Rizal cor. Carmona Sts., San Carlos City, Negros Occidental* 150. NUEVA ECIJA – STA ROSA BRANCH - CBC Bldg., Maharlika Highway, Poblacion, Sta Rosa, Nueva Ecija* 151. OCCIDENTAL MINDORO - SAN JOSE BRANCH - Liboro cor. Rizal St., San Jose, Occidental Mindoro* 152. OLONGAPO – DOWNTOWN BRANCH – CBC Building, No. 2 corner 20th St., East Bajac-Bajac, Olongapo City, Zambales* 153. ORMOC CITY BRANCH – CBC Bldg., Real cor. Lopez Jaena Sts., Ormoc City, Leyte* 154. OZAMIZ CITY BRANCH - Gomez corner Kaamino Streets, Ozamiz City, Misamis Oriental* 155. PAGADIAN CITY BRANCH – Marasigan Bldg., F.S. Pajares Ave., Pagadian City, Zamboanga del Sur* 156. PANGASINAN - ALAMINOS CITY BRANCH – Marcos Ave., Brgy, Palamis, Alaminos City, Pangasinan* 157. PANGASINAN - BAYAMBANG BRANCH - CBC Bldg., No. 91, Poblacion Sur, Bayambang, Pangasinan* 158. PANGASINAN - ROSALES BRANCH - CBC Building, Calle Dewey, Rosales, Pangasinan* 159. PANGASINAN - URDANETA BRANCH – EF Square Bldg., MacArthur Highway, Poblacion, Urdaneta City, Pangasinan* 160. PASEO DE STA. ROSA BRANCH - Unit 3, Paseo 5, Paseo de Sta. Rosa, Sta. Rosa City, Laguna* 161. PUERTO PRINCESA CITY BRANCH – Malvar St. near cor. Valencia St., Puerto Princesa City, Palawan* 162. QUEZON - CANDELARIA BRANCH - Pan Philippine Highway cor. Del Valle Street, Poblacion, Candelaria, Quezon* 163. ROXAS CITY BRANCH - 1063 Roxas Ave. cor. Bayot Drive, Roxas City, Capiz* 164. SAN FERNANDO BRANCH - CBC Bldg., V. Tiomico St. City of San Fernando, Pampanga* 165. SAN FERNANDO - SINDALAN BRANCH – Jumbo Jenra Sindalan, Brgy. Sindalan, San Fernando City, Pampanga* 166. SAN JOSE CITY BRANCH – Maharlika Highway, Brgy. Malasin, San Jose City, Nueva Ecija* 167. SAN PABLO CITY BRANCH – M. Paulino St., San Pablo City, Laguna* 168. SANTIAGO CITY BRANCH - Navarro Bldg., Maharlika Highway near cor. Bayaua St., Santiago City, Isabela* 169. SILAY CITY BRANCH – Rizal St., Silay City, Negros Occidental* 170. SM CITY CABANATUAN – UGF SM City Cabanatuan, Maharlika Highway, Brgy. H. Concepcion, Cabanatuan City, Nueva Ecija* 171. SM CDO DOWNTOWN PREMIER BRANCH - G/F SM CDO Downtown Premier, Claro M. Recto Ave., , Cagayan de Oro City, Misamis Oriental* 172. SM CITY CLARK BRANCH - G/F SM City Clark, M. Roxas St., CSEZ, Angeles City, Pampanga** 173. SM CITY DASMARIÑAS BRANCH – LGF SM City Dasmariñas, Gov Drive, Pala-Pala, City of Dasmariñas, Cavite* 174. SM CITY LIPA BRANCH - G/F SM City Lipa, J.P. Laurel Highway, Brgy. Maraouy, Lipa City, Batangas*
16
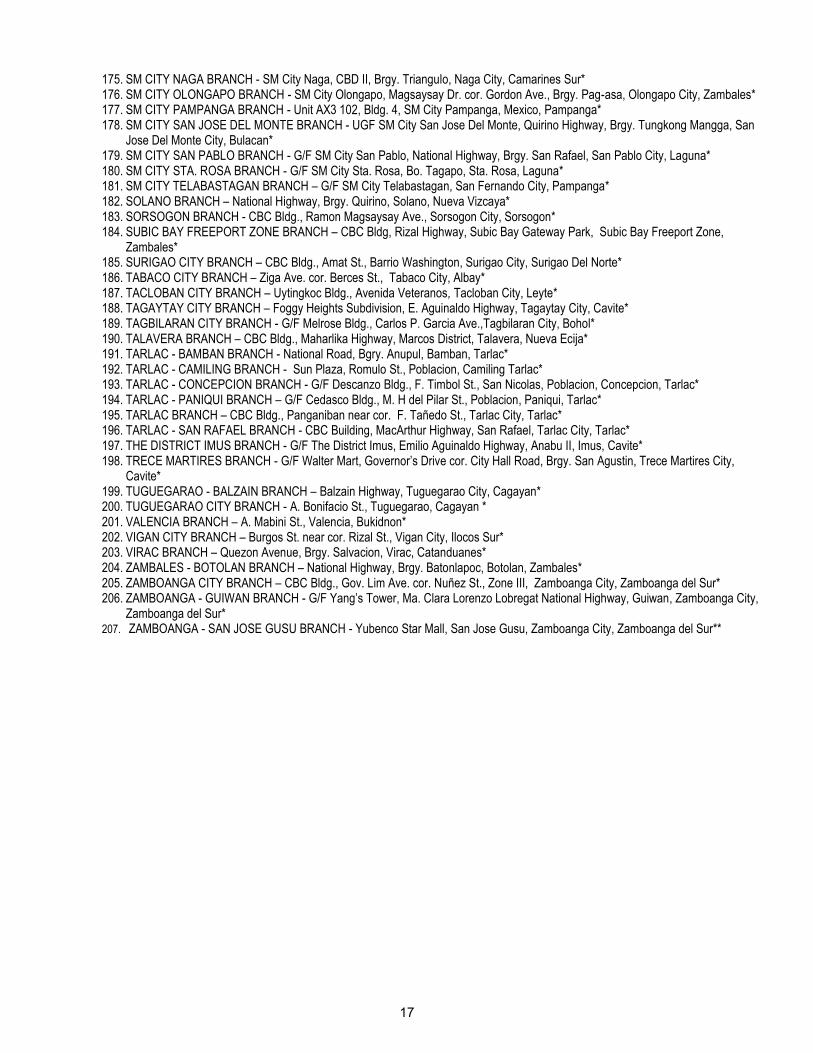
175. SM CITY NAGA BRANCH - SM City Naga, CBD II, Brgy. Triangulo, Naga City, Camarines Sur* 176. SM CITY OLONGAPO BRANCH - SM City Olongapo, Magsaysay Dr. cor. Gordon Ave., Brgy. Pag-asa, Olongapo City, Zambales* 177. SM CITY PAMPANGA BRANCH - Unit AX3 102, Bldg. 4, SM City Pampanga, Mexico, Pampanga* 178. SM CITY SAN JOSE DEL MONTE BRANCH - UGF SM City San Jose Del Monte, Quirino Highway, Brgy. Tungkong Mangga, San
Jose Del Monte City, Bulacan* 179. SM CITY SAN PABLO BRANCH - G/F SM City San Pablo, National Highway, Brgy. San Rafael, San Pablo City, Laguna* 180. SM CITY STA. ROSA BRANCH - G/F SM City Sta. Rosa, Bo. Tagapo, Sta. Rosa, Laguna* 181. SM CITY TELABASTAGAN BRANCH – G/F SM City Telabastagan, San Fernando City, Pampanga* 182. SOLANO BRANCH – National Highway, Brgy. Quirino, Solano, Nueva Vizcaya* 183. SORSOGON BRANCH - CBC Bldg., Ramon Magsaysay Ave., Sorsogon City, Sorsogon* 184. SUBIC BAY FREEPORT ZONE BRANCH – CBC Bldg, Rizal Highway, Subic Bay Gateway Park, Subic Bay Freeport Zone,
Zambales* 185. SURIGAO CITY BRANCH – CBC Bldg., Amat St., Barrio Washington, Surigao City, Surigao Del Norte* 186. TABACO CITY BRANCH – Ziga Ave. cor. Berces St., Tabaco City, Albay* 187. TACLOBAN CITY BRANCH – Uytingkoc Bldg., Avenida Veteranos, Tacloban City, Leyte* 188. TAGAYTAY CITY BRANCH – Foggy Heights Subdivision, E. Aguinaldo Highway, Tagaytay City, Cavite* 189. TAGBILARAN CITY BRANCH - G/F Melrose Bldg., Carlos P. Garcia Ave.,Tagbilaran City, Bohol* 190. TALAVERA BRANCH – CBC Bldg., Maharlika Highway, Marcos District, Talavera, Nueva Ecija* 191. TARLAC - BAMBAN BRANCH - National Road, Bgry. Anupul, Bamban, Tarlac* 192. TARLAC - CAMILING BRANCH - Sun Plaza, Romulo St., Poblacion, Camiling Tarlac* 193. TARLAC - CONCEPCION BRANCH - G/F Descanzo Bldg., F. Timbol St., San Nicolas, Poblacion, Concepcion, Tarlac* 194. TARLAC - PANIQUI BRANCH – G/F Cedasco Bldg., M. H del Pilar St., Poblacion, Paniqui, Tarlac* 195. TARLAC BRANCH – CBC Bldg., Panganiban near cor. F. Tañedo St., Tarlac City, Tarlac* 196. TARLAC - SAN RAFAEL BRANCH - CBC Building, MacArthur Highway, San Rafael, Tarlac City, Tarlac* 197. THE DISTRICT IMUS BRANCH - G/F The District Imus, Emilio Aguinaldo Highway, Anabu II, Imus, Cavite* 198. TRECE MARTIRES BRANCH - G/F Walter Mart, Governor’s Drive cor. City Hall Road, Brgy. San Agustin, Trece Martires City,
Cavite* 199. TUGUEGARAO - BALZAIN BRANCH – Balzain Highway, Tuguegarao City, Cagayan* 200. TUGUEGARAO CITY BRANCH - A. Bonifacio St., Tuguegarao, Cagayan * 201. VALENCIA BRANCH – A. Mabini St., Valencia, Bukidnon* 202. VIGAN CITY BRANCH – Burgos St. near cor. Rizal St., Vigan City, Ilocos Sur* 203. VIRAC BRANCH – Quezon Avenue, Brgy. Salvacion, Virac, Catanduanes* 204. ZAMBALES - BOTOLAN BRANCH – National Highway, Brgy. Batonlapoc, Botolan, Zambales* 205. ZAMBOANGA CITY BRANCH – CBC Bldg., Gov. Lim Ave. cor. Nuñez St., Zone III, Zamboanga City, Zamboanga del Sur* 206. ZAMBOANGA - GUIWAN BRANCH - G/F Yang’s Tower, Ma. Clara Lorenzo Lobregat National Highway, Guiwan, Zamboanga City,
Zamboanga del Sur* 207. ZAMBOANGA - SAN JOSE GUSU BRANCH - Yubenco Star Mall, San Jose Gusu, Zamboanga City, Zamboanga del Sur**
17
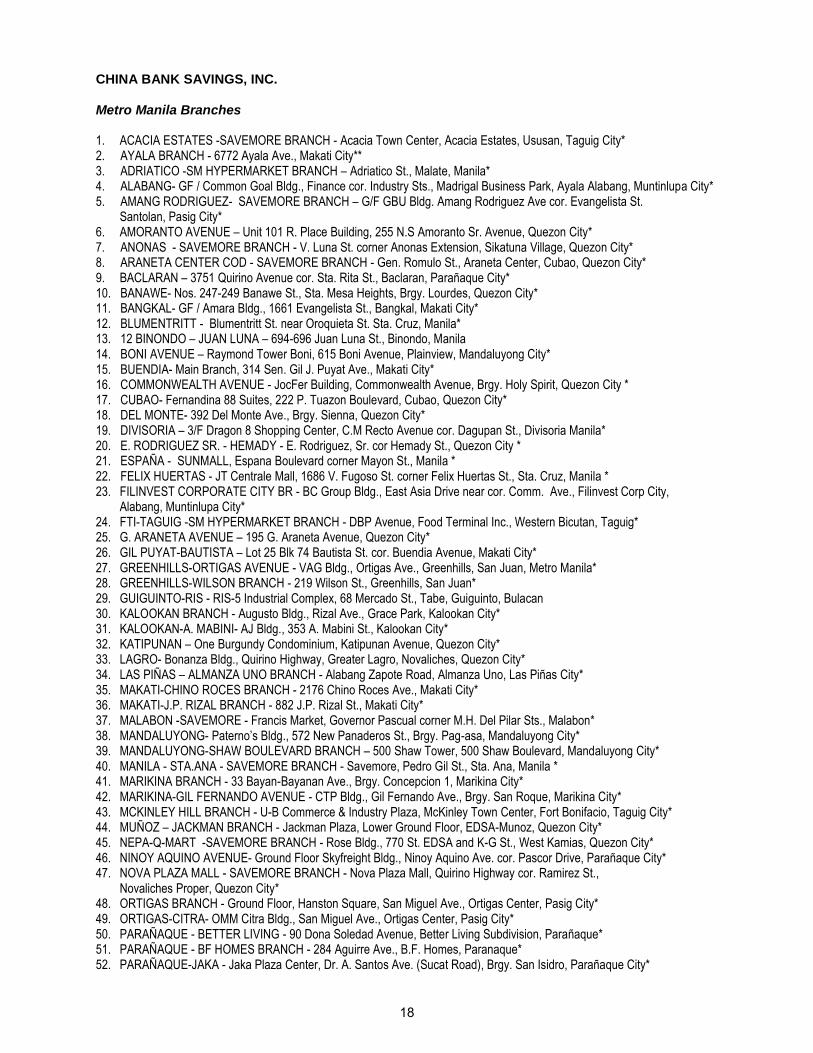
CHINA BANK SAVINGS, INC. Metro Manila Branches 1. ACACIA ESTATES -SAVEMORE BRANCH - Acacia Town Center, Acacia Estates, Ususan, Taguig City* 2. AYALA BRANCH - 6772 Ayala Ave., Makati City** 3. ADRIATICO -SM HYPERMARKET BRANCH – Adriatico St., Malate, Manila* 4. ALABANG- GF / Common Goal Bldg., Finance cor. Industry Sts., Madrigal Business Park, Ayala Alabang, Muntinlupa City* 5. AMANG RODRIGUEZ- SAVEMORE BRANCH – G/F GBU Bldg. Amang Rodriguez Ave cor. Evangelista St.
Santolan, Pasig City* 6. AMORANTO AVENUE – Unit 101 R. Place Building, 255 N.S Amoranto Sr. Avenue, Quezon City* 7. ANONAS - SAVEMORE BRANCH - V. Luna St. corner Anonas Extension, Sikatuna Village, Quezon City* 8. ARANETA CENTER COD - SAVEMORE BRANCH - Gen. Romulo St., Araneta Center, Cubao, Quezon City* 9. BACLARAN – 3751 Quirino Avenue cor. Sta. Rita St., Baclaran, Parañaque City* 10. BANAWE- Nos. 247-249 Banawe St., Sta. Mesa Heights, Brgy. Lourdes, Quezon City* 11. BANGKAL- GF / Amara Bldg., 1661 Evangelista St., Bangkal, Makati City* 12. BLUMENTRITT - Blumentritt St. near Oroquieta St. Sta. Cruz, Manila* 13. 12 BINONDO – JUAN LUNA – 694-696 Juan Luna St., Binondo, Manila 14. BONI AVENUE – Raymond Tower Boni, 615 Boni Avenue, Plainview, Mandaluyong City* 15. BUENDIA- Main Branch, 314 Sen. Gil J. Puyat Ave., Makati City* 16. COMMONWEALTH AVENUE - JocFer Building, Commonwealth Avenue, Brgy. Holy Spirit, Quezon City * 17. CUBAO- Fernandina 88 Suites, 222 P. Tuazon Boulevard, Cubao, Quezon City* 18. DEL MONTE- 392 Del Monte Ave., Brgy. Sienna, Quezon City* 19. DIVISORIA – 3/F Dragon 8 Shopping Center, C.M Recto Avenue cor. Dagupan St., Divisoria Manila* 20. E. RODRIGUEZ SR. - HEMADY - E. Rodriguez, Sr. cor Hemady St., Quezon City * 21. ESPAÑA - SUNMALL, Espana Boulevard corner Mayon St., Manila * 22. FELIX HUERTAS - JT Centrale Mall, 1686 V. Fugoso St. corner Felix Huertas St., Sta. Cruz, Manila * 23. FILINVEST CORPORATE CITY BR - BC Group Bldg., East Asia Drive near cor. Comm. Ave., Filinvest Corp City,
Alabang, Muntinlupa City* 24. FTI-TAGUIG -SM HYPERMARKET BRANCH - DBP Avenue, Food Terminal Inc., Western Bicutan, Taguig* 25. G. ARANETA AVENUE – 195 G. Araneta Avenue, Quezon City* 26. GIL PUYAT-BAUTISTA – Lot 25 Blk 74 Bautista St. cor. Buendia Avenue, Makati City* 27. GREENHILLS-ORTIGAS AVENUE - VAG Bldg., Ortigas Ave., Greenhills, San Juan, Metro Manila* 28. GREENHILLS-WILSON BRANCH - 219 Wilson St., Greenhills, San Juan* 29. GUIGUINTO-RIS - RIS-5 Industrial Complex, 68 Mercado St., Tabe, Guiguinto, Bulacan 30. KALOOKAN BRANCH - Augusto Bldg., Rizal Ave., Grace Park, Kalookan City* 31. KALOOKAN-A. MABINI- AJ Bldg., 353 A. Mabini St., Kalookan City* 32. KATIPUNAN – One Burgundy Condominium, Katipunan Avenue, Quezon City* 33. LAGRO- Bonanza Bldg., Quirino Highway, Greater Lagro, Novaliches, Quezon City* 34. LAS PIÑAS – ALMANZA UNO BRANCH - Alabang Zapote Road, Almanza Uno, Las Piñas City* 35. MAKATI-CHINO ROCES BRANCH - 2176 Chino Roces Ave., Makati City* 36. MAKATI-J.P. RIZAL BRANCH - 882 J.P. Rizal St., Makati City* 37. MALABON -SAVEMORE - Francis Market, Governor Pascual corner M.H. Del Pilar Sts., Malabon* 38. MANDALUYONG- Paterno’s Bldg., 572 New Panaderos St., Brgy. Pag-asa, Mandaluyong City* 39. MANDALUYONG-SHAW BOULEVARD BRANCH – 500 Shaw Tower, 500 Shaw Boulevard, Mandaluyong City* 40. MANILA - STA.ANA - SAVEMORE BRANCH - Savemore, Pedro Gil St., Sta. Ana, Manila * 41. MARIKINA BRANCH - 33 Bayan-Bayanan Ave., Brgy. Concepcion 1, Marikina City* 42. MARIKINA-GIL FERNANDO AVENUE - CTP Bldg., Gil Fernando Ave., Brgy. San Roque, Marikina City* 43. MCKINLEY HILL BRANCH - U-B Commerce & Industry Plaza, McKinley Town Center, Fort Bonifacio, Taguig City* 44. MUÑOZ – JACKMAN BRANCH - Jackman Plaza, Lower Ground Floor, EDSA-Munoz, Quezon City* 45. NEPA-Q-MART -SAVEMORE BRANCH - Rose Bldg., 770 St. EDSA and K-G St., West Kamias, Quezon City* 46. NINOY AQUINO AVENUE- Ground Floor Skyfreight Bldg., Ninoy Aquino Ave. cor. Pascor Drive, Parañaque City* 47. NOVA PLAZA MALL - SAVEMORE BRANCH - Nova Plaza Mall, Quirino Highway cor. Ramirez St.,
Novaliches Proper, Quezon City* 48. ORTIGAS BRANCH - Ground Floor, Hanston Square, San Miguel Ave., Ortigas Center, Pasig City* 49. ORTIGAS-CITRA- OMM Citra Bldg., San Miguel Ave., Ortigas Center, Pasig City* 50. PARAÑAQUE - BETTER LIVING - 90 Dona Soledad Avenue, Better Living Subdivision, Parañaque* 51. PARAÑAQUE - BF HOMES BRANCH - 284 Aguirre Ave., B.F. Homes, Paranaque* 52. PARAÑAQUE-JAKA - Jaka Plaza Center, Dr. A. Santos Ave. (Sucat Road), Brgy. San Isidro, Parañaque City*
18
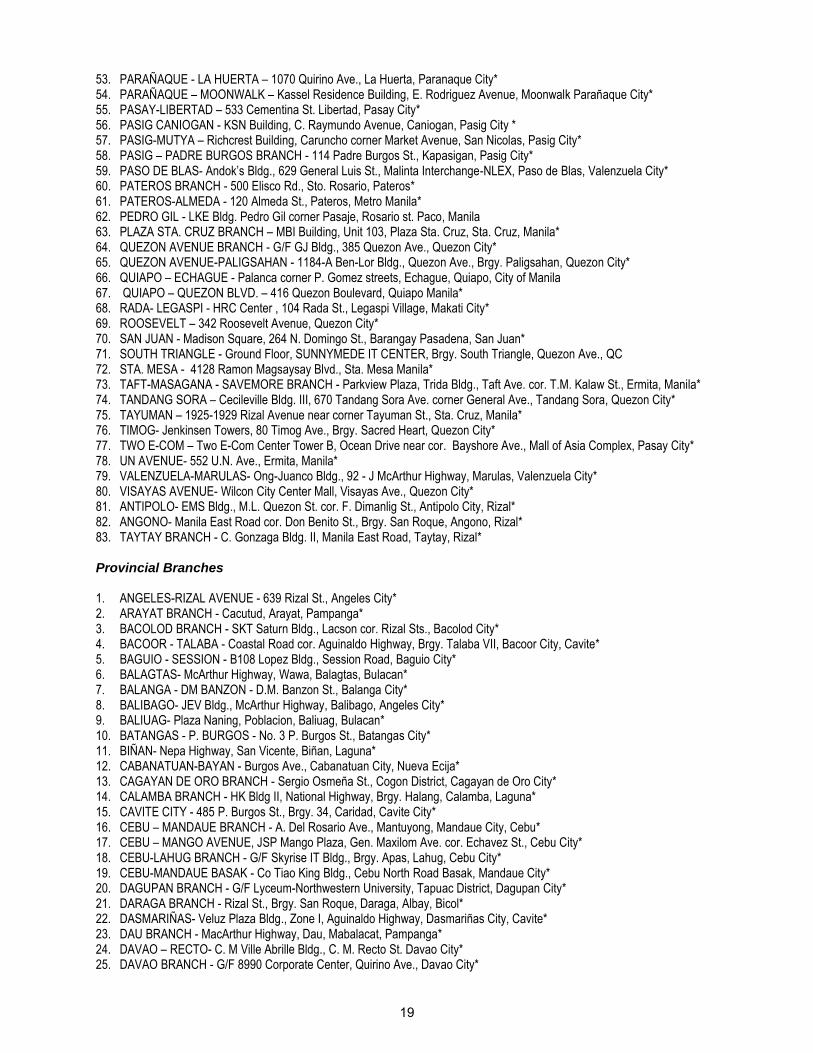
53. PARAÑAQUE - LA HUERTA – 1070 Quirino Ave., La Huerta, Paranaque City* 54. PARAÑAQUE – MOONWALK – Kassel Residence Building, E. Rodriguez Avenue, Moonwalk Parañaque City* 55. PASAY-LIBERTAD – 533 Cementina St. Libertad, Pasay City* 56. PASIG CANIOGAN - KSN Building, C. Raymundo Avenue, Caniogan, Pasig City * 57. PASIG-MUTYA – Richcrest Building, Caruncho corner Market Avenue, San Nicolas, Pasig City* 58. PASIG – PADRE BURGOS BRANCH - 114 Padre Burgos St., Kapasigan, Pasig City* 59. PASO DE BLAS- Andok’s Bldg., 629 General Luis St., Malinta Interchange-NLEX, Paso de Blas, Valenzuela City* 60. PATEROS BRANCH - 500 Elisco Rd., Sto. Rosario, Pateros* 61. PATEROS-ALMEDA - 120 Almeda St., Pateros, Metro Manila* 62. PEDRO GIL - LKE Bldg. Pedro Gil corner Pasaje, Rosario st. Paco, Manila 63. PLAZA STA. CRUZ BRANCH – MBI Building, Unit 103, Plaza Sta. Cruz, Sta. Cruz, Manila* 64. QUEZON AVENUE BRANCH - G/F GJ Bldg., 385 Quezon Ave., Quezon City* 65. QUEZON AVENUE-PALIGSAHAN - 1184-A Ben-Lor Bldg., Quezon Ave., Brgy. Paligsahan, Quezon City* 66. QUIAPO – ECHAGUE - Palanca corner P. Gomez streets, Echague, Quiapo, City of Manila 67. QUIAPO – QUEZON BLVD. – 416 Quezon Boulevard, Quiapo Manila* 68. RADA- LEGASPI - HRC Center , 104 Rada St., Legaspi Village, Makati City* 69. ROOSEVELT – 342 Roosevelt Avenue, Quezon City* 70. SAN JUAN - Madison Square, 264 N. Domingo St., Barangay Pasadena, San Juan* 71. SOUTH TRIANGLE - Ground Floor, SUNNYMEDE IT CENTER, Brgy. South Triangle, Quezon Ave., QC 72. STA. MESA - 4128 Ramon Magsaysay Blvd., Sta. Mesa Manila* 73. TAFT-MASAGANA - SAVEMORE BRANCH - Parkview Plaza, Trida Bldg., Taft Ave. cor. T.M. Kalaw St., Ermita, Manila* 74. TANDANG SORA – Cecileville Bldg. III, 670 Tandang Sora Ave. corner General Ave., Tandang Sora, Quezon City* 75. TAYUMAN – 1925-1929 Rizal Avenue near corner Tayuman St., Sta. Cruz, Manila* 76. TIMOG- Jenkinsen Towers, 80 Timog Ave., Brgy. Sacred Heart, Quezon City* 77. TWO E-COM – Two E-Com Center Tower B, Ocean Drive near cor. Bayshore Ave., Mall of Asia Complex, Pasay City* 78. UN AVENUE- 552 U.N. Ave., Ermita, Manila* 79. VALENZUELA-MARULAS- Ong-Juanco Bldg., 92 - J McArthur Highway, Marulas, Valenzuela City* 80. VISAYAS AVENUE- Wilcon City Center Mall, Visayas Ave., Quezon City* 81. ANTIPOLO- EMS Bldg., M.L. Quezon St. cor. F. Dimanlig St., Antipolo City, Rizal* 82. ANGONO- Manila East Road cor. Don Benito St., Brgy. San Roque, Angono, Rizal* 83. TAYTAY BRANCH - C. Gonzaga Bldg. II, Manila East Road, Taytay, Rizal* Provincial Branches 1. ANGELES-RIZAL AVENUE - 639 Rizal St., Angeles City* 2. ARAYAT BRANCH - Cacutud, Arayat, Pampanga* 3. BACOLOD BRANCH - SKT Saturn Bldg., Lacson cor. Rizal Sts., Bacolod City* 4. BACOOR - TALABA - Coastal Road cor. Aguinaldo Highway, Brgy. Talaba VII, Bacoor City, Cavite* 5. BAGUIO - SESSION - B108 Lopez Bldg., Session Road, Baguio City* 6. BALAGTAS- McArthur Highway, Wawa, Balagtas, Bulacan* 7. BALANGA - DM BANZON - D.M. Banzon St., Balanga City* 8. BALIBAGO- JEV Bldg., McArthur Highway, Balibago, Angeles City* 9. BALIUAG- Plaza Naning, Poblacion, Baliuag, Bulacan* 10. BATANGAS - P. BURGOS - No. 3 P. Burgos St., Batangas City* 11. BIÑAN- Nepa Highway, San Vicente, Biñan, Laguna* 12. CABANATUAN-BAYAN - Burgos Ave., Cabanatuan City, Nueva Ecija* 13. CAGAYAN DE ORO BRANCH - Sergio Osmeña St., Cogon District, Cagayan de Oro City* 14. CALAMBA BRANCH - HK Bldg II, National Highway, Brgy. Halang, Calamba, Laguna* 15. CAVITE CITY - 485 P. Burgos St., Brgy. 34, Caridad, Cavite City* 16. CEBU – MANDAUE BRANCH - A. Del Rosario Ave., Mantuyong, Mandaue City, Cebu* 17. CEBU – MANGO AVENUE, JSP Mango Plaza, Gen. Maxilom Ave. cor. Echavez St., Cebu City* 18. CEBU-LAHUG BRANCH - G/F Skyrise IT Bldg., Brgy. Apas, Lahug, Cebu City* 19. CEBU-MANDAUE BASAK - Co Tiao King Bldg., Cebu North Road Basak, Mandaue City* 20. DAGUPAN BRANCH - G/F Lyceum-Northwestern University, Tapuac District, Dagupan City* 21. DARAGA BRANCH - Rizal St., Brgy. San Roque, Daraga, Albay, Bicol* 22. DASMARIÑAS- Veluz Plaza Bldg., Zone I, Aguinaldo Highway, Dasmariñas City, Cavite* 23. DAU BRANCH - MacArthur Highway, Dau, Mabalacat, Pampanga* 24. DAVAO – RECTO- C. M Ville Abrille Bldg., C. M. Recto St. Davao City* 25. DAVAO BRANCH - G/F 8990 Corporate Center, Quirino Ave., Davao City*
19
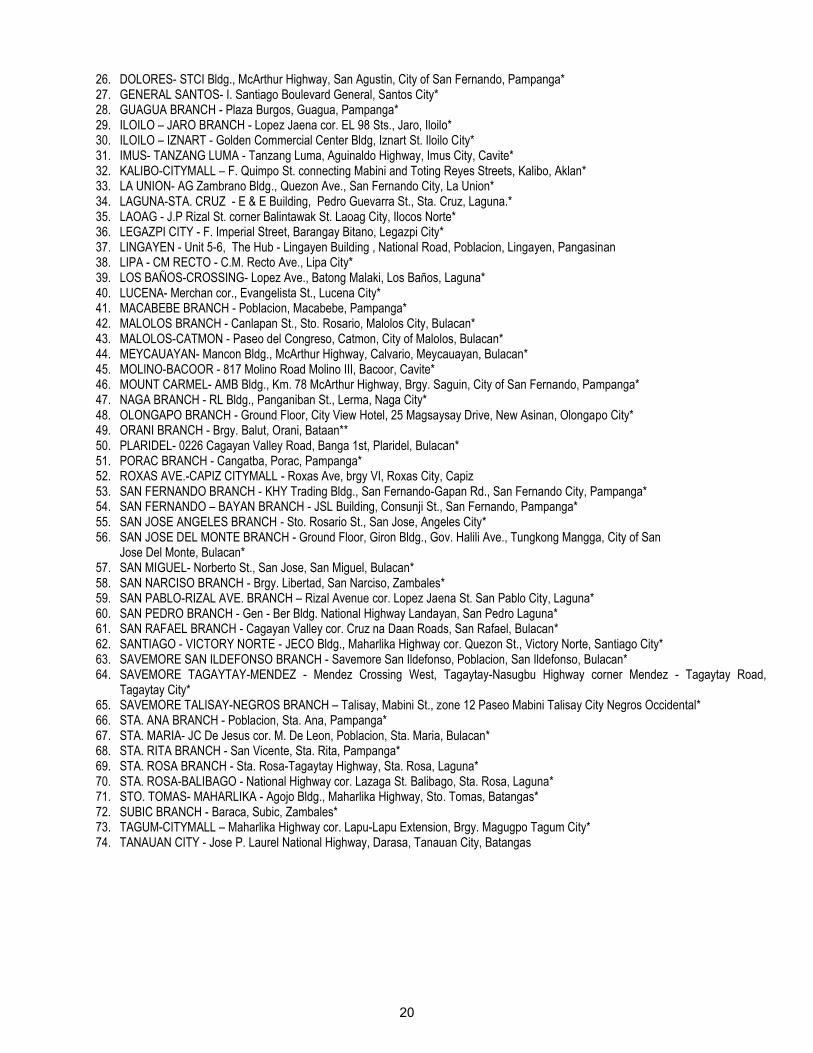
26. DOLORES- STCI Bldg., McArthur Highway, San Agustin, City of San Fernando, Pampanga* 27. GENERAL SANTOS- I. Santiago Boulevard General, Santos City* 28. GUAGUA BRANCH - Plaza Burgos, Guagua, Pampanga* 29. ILOILO – JARO BRANCH - Lopez Jaena cor. EL 98 Sts., Jaro, Iloilo* 30. ILOILO – IZNART - Golden Commercial Center Bldg, Iznart St. Iloilo City* 31. IMUS- TANZANG LUMA - Tanzang Luma, Aguinaldo Highway, Imus City, Cavite* 32. KALIBO-CITYMALL – F. Quimpo St. connecting Mabini and Toting Reyes Streets, Kalibo, Aklan* 33. LA UNION- AG Zambrano Bldg., Quezon Ave., San Fernando City, La Union* 34. LAGUNA-STA. CRUZ - E & E Building, Pedro Guevarra St., Sta. Cruz, Laguna.* 35. LAOAG - J.P Rizal St. corner Balintawak St. Laoag City, Ilocos Norte* 36. LEGAZPI CITY - F. Imperial Street, Barangay Bitano, Legazpi City* 37. LINGAYEN - Unit 5-6, The Hub - Lingayen Building , National Road, Poblacion, Lingayen, Pangasinan 38. LIPA - CM RECTO - C.M. Recto Ave., Lipa City* 39. LOS BAÑOS-CROSSING- Lopez Ave., Batong Malaki, Los Baños, Laguna* 40. LUCENA- Merchan cor., Evangelista St., Lucena City* 41. MACABEBE BRANCH - Poblacion, Macabebe, Pampanga* 42. MALOLOS BRANCH - Canlapan St., Sto. Rosario, Malolos City, Bulacan* 43. MALOLOS-CATMON - Paseo del Congreso, Catmon, City of Malolos, Bulacan* 44. MEYCAUAYAN- Mancon Bldg., McArthur Highway, Calvario, Meycauayan, Bulacan* 45. MOLINO-BACOOR - 817 Molino Road Molino III, Bacoor, Cavite* 46. MOUNT CARMEL- AMB Bldg., Km. 78 McArthur Highway, Brgy. Saguin, City of San Fernando, Pampanga* 47. NAGA BRANCH - RL Bldg., Panganiban St., Lerma, Naga City* 48. OLONGAPO BRANCH - Ground Floor, City View Hotel, 25 Magsaysay Drive, New Asinan, Olongapo City* 49. ORANI BRANCH - Brgy. Balut, Orani, Bataan** 50. PLARIDEL- 0226 Cagayan Valley Road, Banga 1st, Plaridel, Bulacan* 51. PORAC BRANCH - Cangatba, Porac, Pampanga* 52. ROXAS AVE.-CAPIZ CITYMALL - Roxas Ave, brgy VI, Roxas City, Capiz 53. SAN FERNANDO BRANCH - KHY Trading Bldg., San Fernando-Gapan Rd., San Fernando City, Pampanga* 54. SAN FERNANDO – BAYAN BRANCH - JSL Building, Consunji St., San Fernando, Pampanga* 55. SAN JOSE ANGELES BRANCH - Sto. Rosario St., San Jose, Angeles City* 56. SAN JOSE DEL MONTE BRANCH - Ground Floor, Giron Bldg., Gov. Halili Ave., Tungkong Mangga, City of San
Jose Del Monte, Bulacan* 57. SAN MIGUEL- Norberto St., San Jose, San Miguel, Bulacan* 58. SAN NARCISO BRANCH - Brgy. Libertad, San Narciso, Zambales* 59. SAN PABLO-RIZAL AVE. BRANCH – Rizal Avenue cor. Lopez Jaena St. San Pablo City, Laguna* 60. SAN PEDRO BRANCH - Gen - Ber Bldg. National Highway Landayan, San Pedro Laguna* 61. SAN RAFAEL BRANCH - Cagayan Valley cor. Cruz na Daan Roads, San Rafael, Bulacan* 62. SANTIAGO - VICTORY NORTE - JECO Bldg., Maharlika Highway cor. Quezon St., Victory Norte, Santiago City* 63. SAVEMORE SAN ILDEFONSO BRANCH - Savemore San Ildefonso, Poblacion, San Ildefonso, Bulacan* 64. SAVEMORE TAGAYTAY-MENDEZ - Mendez Crossing West, Tagaytay-Nasugbu Highway corner Mendez - Tagaytay Road,
Tagaytay City* 65. SAVEMORE TALISAY-NEGROS BRANCH – Talisay, Mabini St., zone 12 Paseo Mabini Talisay City Negros Occidental* 66. STA. ANA BRANCH - Poblacion, Sta. Ana, Pampanga* 67. STA. MARIA- JC De Jesus cor. M. De Leon, Poblacion, Sta. Maria, Bulacan* 68. STA. RITA BRANCH - San Vicente, Sta. Rita, Pampanga* 69. STA. ROSA BRANCH - Sta. Rosa-Tagaytay Highway, Sta. Rosa, Laguna* 70. STA. ROSA-BALIBAGO - National Highway cor. Lazaga St. Balibago, Sta. Rosa, Laguna* 71. STO. TOMAS- MAHARLIKA - Agojo Bldg., Maharlika Highway, Sto. Tomas, Batangas* 72. SUBIC BRANCH - Baraca, Subic, Zambales* 73. TAGUM-CITYMALL – Maharlika Highway cor. Lapu-Lapu Extension, Brgy. Magugpo Tagum City* 74. TANAUAN CITY - Jose P. Laurel National Highway, Darasa, Tanauan City, Batangas
20
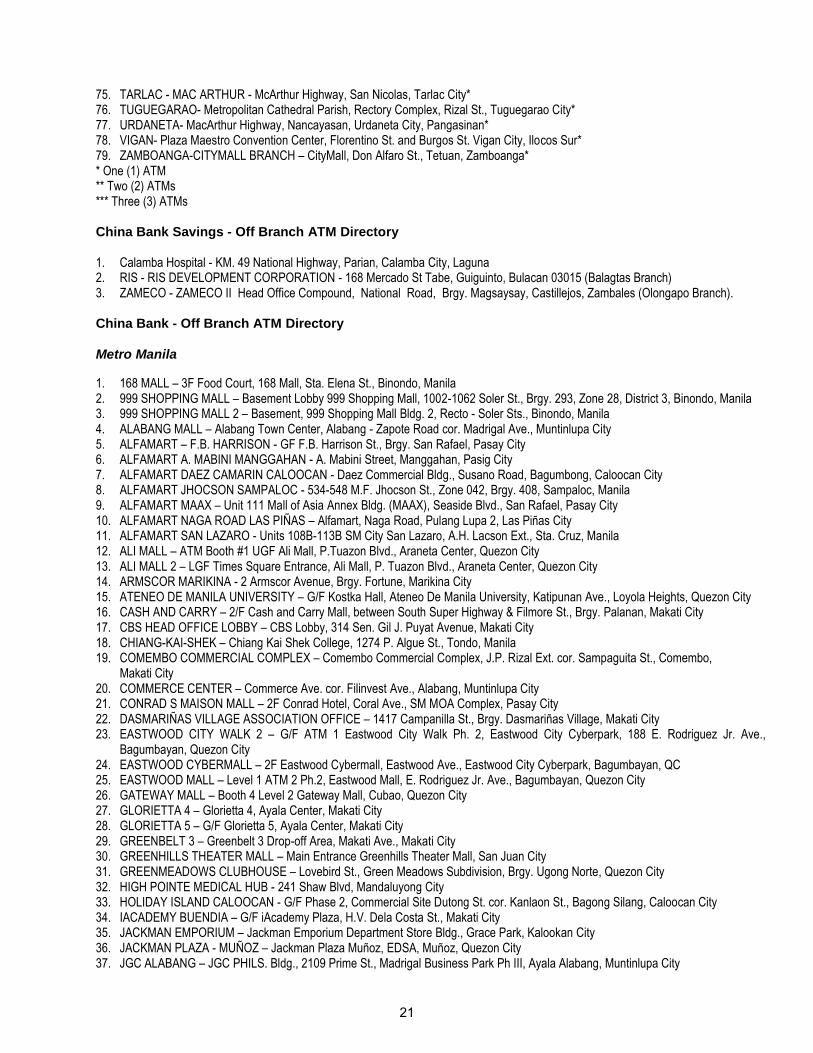
75. TARLAC - MAC ARTHUR - McArthur Highway, San Nicolas, Tarlac City* 76. TUGUEGARAO- Metropolitan Cathedral Parish, Rectory Complex, Rizal St., Tuguegarao City* 77. URDANETA- MacArthur Highway, Nancayasan, Urdaneta City, Pangasinan* 78. VIGAN- Plaza Maestro Convention Center, Florentino St. and Burgos St. Vigan City, Ilocos Sur* 79. ZAMBOANGA-CITYMALL BRANCH – CityMall, Don Alfaro St., Tetuan, Zamboanga* * One (1) ATM ** Two (2) ATMs *** Three (3) ATMs China Bank Savings - Off Branch ATM Directory 1. Calamba Hospital - KM. 49 National Highway, Parian, Calamba City, Laguna 2. RIS - RIS DEVELOPMENT CORPORATION - 168 Mercado St Tabe, Guiguinto, Bulacan 03015 (Balagtas Branch) 3. ZAMECO - ZAMECO II Head Office Compound, National Road, Brgy. Magsaysay, Castillejos, Zambales (Olongapo Branch). China Bank - Off Branch ATM Directory Metro Manila 1. 168 MALL – 3F Food Court, 168 Mall, Sta. Elena St., Binondo, Manila 2. 999 SHOPPING MALL – Basement Lobby 999 Shopping Mall, 1002-1062 Soler St., Brgy. 293, Zone 28, District 3, Binondo, Manila 3. 999 SHOPPING MALL 2 – Basement, 999 Shopping Mall Bldg. 2, Recto - Soler Sts., Binondo, Manila 4. ALABANG MALL – Alabang Town Center, Alabang - Zapote Road cor. Madrigal Ave., Muntinlupa City 5. ALFAMART – F.B. HARRISON - GF F.B. Harrison St., Brgy. San Rafael, Pasay City 6. ALFAMART A. MABINI MANGGAHAN - A. Mabini Street, Manggahan, Pasig City 7. ALFAMART DAEZ CAMARIN CALOOCAN - Daez Commercial Bldg., Susano Road, Bagumbong, Caloocan City 8. ALFAMART JHOCSON SAMPALOC - 534-548 M.F. Jhocson St., Zone 042, Brgy. 408, Sampaloc, Manila 9. ALFAMART MAAX – Unit 111 Mall of Asia Annex Bldg. (MAAX), Seaside Blvd., San Rafael, Pasay City 10. ALFAMART NAGA ROAD LAS PIÑAS – Alfamart, Naga Road, Pulang Lupa 2, Las Piñas City 11. ALFAMART SAN LAZARO - Units 108B-113B SM City San Lazaro, A.H. Lacson Ext., Sta. Cruz, Manila 12. ALI MALL – ATM Booth #1 UGF Ali Mall, P.Tuazon Blvd., Araneta Center, Quezon City 13. ALI MALL 2 – LGF Times Square Entrance, Ali Mall, P. Tuazon Blvd., Araneta Center, Quezon City 14. ARMSCOR MARIKINA - 2 Armscor Avenue, Brgy. Fortune, Marikina City 15. ATENEO DE MANILA UNIVERSITY – G/F Kostka Hall, Ateneo De Manila University, Katipunan Ave., Loyola Heights, Quezon City 16. CASH AND CARRY – 2/F Cash and Carry Mall, between South Super Highway & Filmore St., Brgy. Palanan, Makati City 17. CBS HEAD OFFICE LOBBY – CBS Lobby, 314 Sen. Gil J. Puyat Avenue, Makati City 18. CHIANG-KAI-SHEK – Chiang Kai Shek College, 1274 P. Algue St., Tondo, Manila 19. COMEMBO COMMERCIAL COMPLEX – Comembo Commercial Complex, J.P. Rizal Ext. cor. Sampaguita St., Comembo,
Makati City 20. COMMERCE CENTER – Commerce Ave. cor. Filinvest Ave., Alabang, Muntinlupa City 21. CONRAD S MAISON MALL – 2F Conrad Hotel, Coral Ave., SM MOA Complex, Pasay City 22. DASMARIÑAS VILLAGE ASSOCIATION OFFICE – 1417 Campanilla St., Brgy. Dasmariñas Village, Makati City 23. EASTWOOD CITY WALK 2 – G/F ATM 1 Eastwood City Walk Ph. 2, Eastwood City Cyberpark, 188 E. Rodriguez Jr. Ave.,
Bagumbayan, Quezon City 24. EASTWOOD CYBERMALL – 2F Eastwood Cybermall, Eastwood Ave., Eastwood City Cyberpark, Bagumbayan, QC 25. EASTWOOD MALL – Level 1 ATM 2 Ph.2, Eastwood Mall, E. Rodriguez Jr. Ave., Bagumbayan, Quezon City 26. GATEWAY MALL – Booth 4 Level 2 Gateway Mall, Cubao, Quezon City 27. GLORIETTA 4 – Glorietta 4, Ayala Center, Makati City 28. GLORIETTA 5 – G/F Glorietta 5, Ayala Center, Makati City 29. GREENBELT 3 – Greenbelt 3 Drop-off Area, Makati Ave., Makati City 30. GREENHILLS THEATER MALL – Main Entrance Greenhills Theater Mall, San Juan City 31. GREENMEADOWS CLUBHOUSE – Lovebird St., Green Meadows Subdivision, Brgy. Ugong Norte, Quezon City 32. HIGH POINTE MEDICAL HUB - 241 Shaw Blvd, Mandaluyong City 33. HOLIDAY ISLAND CALOOCAN - G/F Phase 2, Commercial Site Dutong St. cor. Kanlaon St., Bagong Silang, Caloocan City 34. IACADEMY BUENDIA – G/F iAcademy Plaza, H.V. Dela Costa St., Makati City 35. JACKMAN EMPORIUM – Jackman Emporium Department Store Bldg., Grace Park, Kalookan City 36. JACKMAN PLAZA - MUÑOZ – Jackman Plaza Muñoz, EDSA, Muñoz, Quezon City 37. JGC ALABANG – JGC PHILS. Bldg., 2109 Prime St., Madrigal Business Park Ph III, Ayala Alabang, Muntinlupa City
21
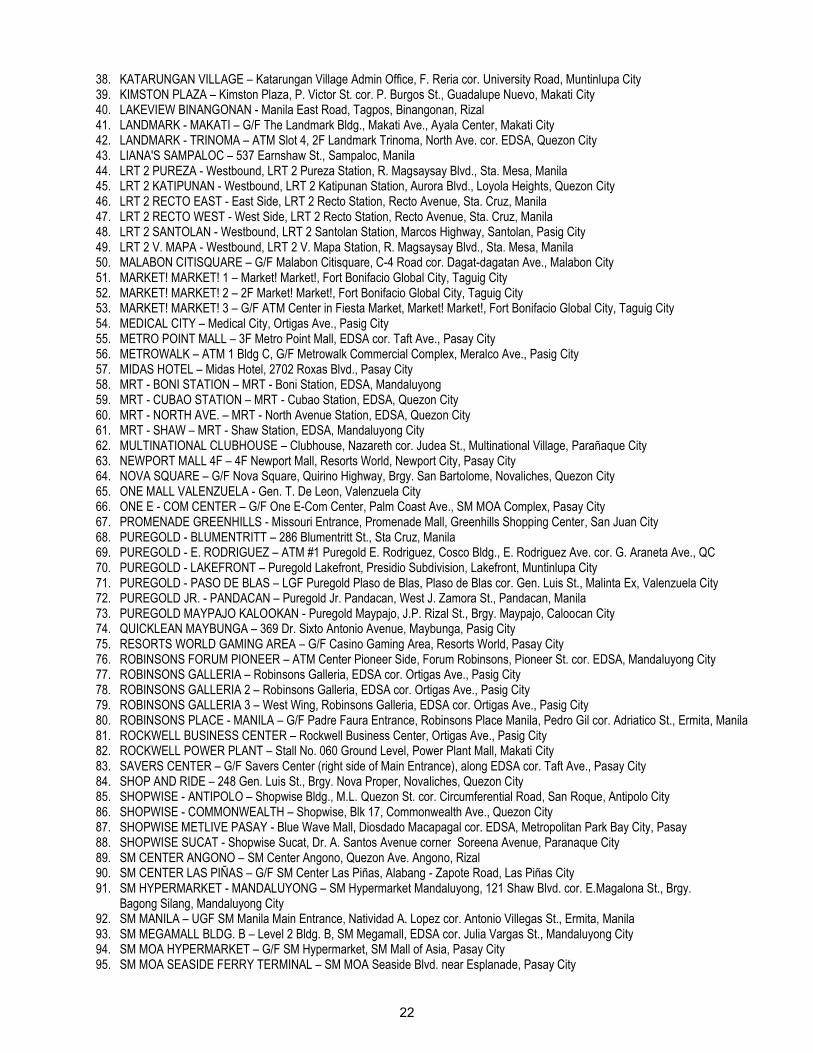
38. KATARUNGAN VILLAGE – Katarungan Village Admin Office, F. Reria cor. University Road, Muntinlupa City 39. KIMSTON PLAZA – Kimston Plaza, P. Victor St. cor. P. Burgos St., Guadalupe Nuevo, Makati City 40. LAKEVIEW BINANGONAN - Manila East Road, Tagpos, Binangonan, Rizal 41. LANDMARK - MAKATI – G/F The Landmark Bldg., Makati Ave., Ayala Center, Makati City 42. LANDMARK - TRINOMA – ATM Slot 4, 2F Landmark Trinoma, North Ave. cor. EDSA, Quezon City 43. LIANA'S SAMPALOC – 537 Earnshaw St., Sampaloc, Manila 44. LRT 2 PUREZA - Westbound, LRT 2 Pureza Station, R. Magsaysay Blvd., Sta. Mesa, Manila 45. LRT 2 KATIPUNAN - Westbound, LRT 2 Katipunan Station, Aurora Blvd., Loyola Heights, Quezon City 46. LRT 2 RECTO EAST - East Side, LRT 2 Recto Station, Recto Avenue, Sta. Cruz, Manila 47. LRT 2 RECTO WEST - West Side, LRT 2 Recto Station, Recto Avenue, Sta. Cruz, Manila 48. LRT 2 SANTOLAN - Westbound, LRT 2 Santolan Station, Marcos Highway, Santolan, Pasig City 49. LRT 2 V. MAPA - Westbound, LRT 2 V. Mapa Station, R. Magsaysay Blvd., Sta. Mesa, Manila 50. MALABON CITISQUARE – G/F Malabon Citisquare, C-4 Road cor. Dagat-dagatan Ave., Malabon City 51. MARKET! MARKET! 1 – Market! Market!, Fort Bonifacio Global City, Taguig City 52. MARKET! MARKET! 2 – 2F Market! Market!, Fort Bonifacio Global City, Taguig City 53. MARKET! MARKET! 3 – G/F ATM Center in Fiesta Market, Market! Market!, Fort Bonifacio Global City, Taguig City 54. MEDICAL CITY – Medical City, Ortigas Ave., Pasig City 55. METRO POINT MALL – 3F Metro Point Mall, EDSA cor. Taft Ave., Pasay City 56. METROWALK – ATM 1 Bldg C, G/F Metrowalk Commercial Complex, Meralco Ave., Pasig City 57. MIDAS HOTEL – Midas Hotel, 2702 Roxas Blvd., Pasay City 58. MRT - BONI STATION – MRT - Boni Station, EDSA, Mandaluyong 59. MRT - CUBAO STATION – MRT - Cubao Station, EDSA, Quezon City 60. MRT - NORTH AVE. – MRT - North Avenue Station, EDSA, Quezon City 61. MRT - SHAW – MRT - Shaw Station, EDSA, Mandaluyong City 62. MULTINATIONAL CLUBHOUSE – Clubhouse, Nazareth cor. Judea St., Multinational Village, Parañaque City 63. NEWPORT MALL 4F – 4F Newport Mall, Resorts World, Newport City, Pasay City 64. NOVA SQUARE – G/F Nova Square, Quirino Highway, Brgy. San Bartolome, Novaliches, Quezon City 65. ONE MALL VALENZUELA - Gen. T. De Leon, Valenzuela City 66. ONE E - COM CENTER – G/F One E-Com Center, Palm Coast Ave., SM MOA Complex, Pasay City 67. PROMENADE GREENHILLS - Missouri Entrance, Promenade Mall, Greenhills Shopping Center, San Juan City 68. PUREGOLD - BLUMENTRITT – 286 Blumentritt St., Sta Cruz, Manila 69. PUREGOLD - E. RODRIGUEZ – ATM #1 Puregold E. Rodriguez, Cosco Bldg., E. Rodriguez Ave. cor. G. Araneta Ave., QC 70. PUREGOLD - LAKEFRONT – Puregold Lakefront, Presidio Subdivision, Lakefront, Muntinlupa City 71. PUREGOLD - PASO DE BLAS – LGF Puregold Plaso de Blas, Plaso de Blas cor. Gen. Luis St., Malinta Ex, Valenzuela City 72. PUREGOLD JR. - PANDACAN – Puregold Jr. Pandacan, West J. Zamora St., Pandacan, Manila 73. PUREGOLD MAYPAJO KALOOKAN - Puregold Maypajo, J.P. Rizal St., Brgy. Maypajo, Caloocan City 74. QUICKLEAN MAYBUNGA – 369 Dr. Sixto Antonio Avenue, Maybunga, Pasig City 75. RESORTS WORLD GAMING AREA – G/F Casino Gaming Area, Resorts World, Pasay City 76. ROBINSONS FORUM PIONEER – ATM Center Pioneer Side, Forum Robinsons, Pioneer St. cor. EDSA, Mandaluyong City 77. ROBINSONS GALLERIA – Robinsons Galleria, EDSA cor. Ortigas Ave., Pasig City 78. ROBINSONS GALLERIA 2 – Robinsons Galleria, EDSA cor. Ortigas Ave., Pasig City 79. ROBINSONS GALLERIA 3 – West Wing, Robinsons Galleria, EDSA cor. Ortigas Ave., Pasig City 80. ROBINSONS PLACE - MANILA – G/F Padre Faura Entrance, Robinsons Place Manila, Pedro Gil cor. Adriatico St., Ermita, Manila 81. ROCKWELL BUSINESS CENTER – Rockwell Business Center, Ortigas Ave., Pasig City 82. ROCKWELL POWER PLANT – Stall No. 060 Ground Level, Power Plant Mall, Makati City 83. SAVERS CENTER – G/F Savers Center (right side of Main Entrance), along EDSA cor. Taft Ave., Pasay City 84. SHOP AND RIDE – 248 Gen. Luis St., Brgy. Nova Proper, Novaliches, Quezon City 85. SHOPWISE - ANTIPOLO – Shopwise Bldg., M.L. Quezon St. cor. Circumferential Road, San Roque, Antipolo City 86. SHOPWISE - COMMONWEALTH – Shopwise, Blk 17, Commonwealth Ave., Quezon City 87. SHOPWISE METLIVE PASAY - Blue Wave Mall, Diosdado Macapagal cor. EDSA, Metropolitan Park Bay City, Pasay 88. SHOPWISE SUCAT - Shopwise Sucat, Dr. A. Santos Avenue corner Soreena Avenue, Paranaque City 89. SM CENTER ANGONO – SM Center Angono, Quezon Ave. Angono, Rizal 90. SM CENTER LAS PIÑAS – G/F SM Center Las Piñas, Alabang - Zapote Road, Las Piñas City 91. SM HYPERMARKET - MANDALUYONG – SM Hypermarket Mandaluyong, 121 Shaw Blvd. cor. E.Magalona St., Brgy.
Bagong Silang, Mandaluyong City 92. SM MANILA – UGF SM Manila Main Entrance, Natividad A. Lopez cor. Antonio Villegas St., Ermita, Manila 93. SM MEGAMALL BLDG. B – Level 2 Bldg. B, SM Megamall, EDSA cor. Julia Vargas St., Mandaluyong City 94. SM MOA HYPERMARKET – G/F SM Hypermarket, SM Mall of Asia, Pasay City 95. SM MOA SEASIDE FERRY TERMINAL – SM MOA Seaside Blvd. near Esplanade, Pasay City
22
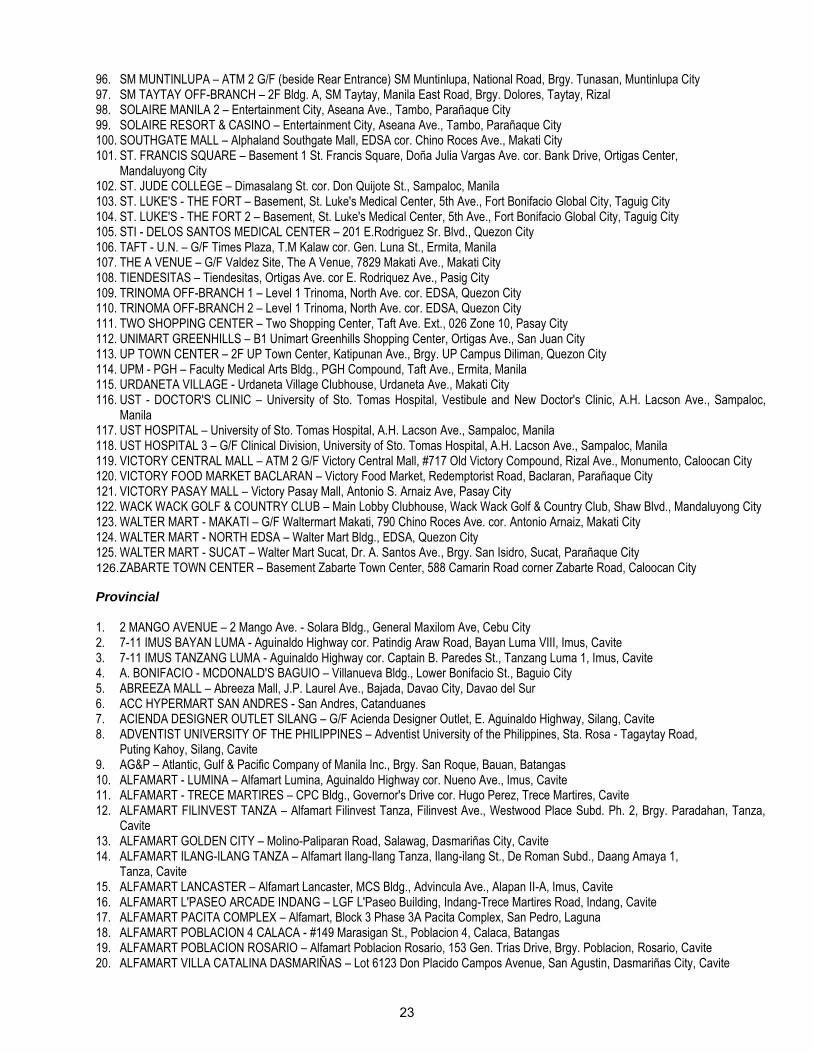
96. SM MUNTINLUPA – ATM 2 G/F (beside Rear Entrance) SM Muntinlupa, National Road, Brgy. Tunasan, Muntinlupa City 97. SM TAYTAY OFF-BRANCH – 2F Bldg. A, SM Taytay, Manila East Road, Brgy. Dolores, Taytay, Rizal 98. SOLAIRE MANILA 2 – Entertainment City, Aseana Ave., Tambo, Parañaque City 99. SOLAIRE RESORT & CASINO – Entertainment City, Aseana Ave., Tambo, Parañaque City 100. SOUTHGATE MALL – Alphaland Southgate Mall, EDSA cor. Chino Roces Ave., Makati City 101. ST. FRANCIS SQUARE – Basement 1 St. Francis Square, Doña Julia Vargas Ave. cor. Bank Drive, Ortigas Center,
Mandaluyong City 102. ST. JUDE COLLEGE – Dimasalang St. cor. Don Quijote St., Sampaloc, Manila 103. ST. LUKE'S - THE FORT – Basement, St. Luke's Medical Center, 5th Ave., Fort Bonifacio Global City, Taguig City 104. ST. LUKE'S - THE FORT 2 – Basement, St. Luke's Medical Center, 5th Ave., Fort Bonifacio Global City, Taguig City 105. STI - DELOS SANTOS MEDICAL CENTER – 201 E.Rodriguez Sr. Blvd., Quezon City 106. TAFT - U.N. – G/F Times Plaza, T.M Kalaw cor. Gen. Luna St., Ermita, Manila 107. THE A VENUE – G/F Valdez Site, The A Venue, 7829 Makati Ave., Makati City 108. TIENDESITAS – Tiendesitas, Ortigas Ave. cor E. Rodriquez Ave., Pasig City 109. TRINOMA OFF-BRANCH 1 – Level 1 Trinoma, North Ave. cor. EDSA, Quezon City 110. TRINOMA OFF-BRANCH 2 – Level 1 Trinoma, North Ave. cor. EDSA, Quezon City 111. TWO SHOPPING CENTER – Two Shopping Center, Taft Ave. Ext., 026 Zone 10, Pasay City 112. UNIMART GREENHILLS – B1 Unimart Greenhills Shopping Center, Ortigas Ave., San Juan City 113. UP TOWN CENTER – 2F UP Town Center, Katipunan Ave., Brgy. UP Campus Diliman, Quezon City 114. UPM - PGH – Faculty Medical Arts Bldg., PGH Compound, Taft Ave., Ermita, Manila 115. URDANETA VILLAGE - Urdaneta Village Clubhouse, Urdaneta Ave., Makati City 116. UST - DOCTOR'S CLINIC – University of Sto. Tomas Hospital, Vestibule and New Doctor's Clinic, A.H. Lacson Ave., Sampaloc,
Manila 117. UST HOSPITAL – University of Sto. Tomas Hospital, A.H. Lacson Ave., Sampaloc, Manila 118. UST HOSPITAL 3 – G/F Clinical Division, University of Sto. Tomas Hospital, A.H. Lacson Ave., Sampaloc, Manila 119. VICTORY CENTRAL MALL – ATM 2 G/F Victory Central Mall, #717 Old Victory Compound, Rizal Ave., Monumento, Caloocan City 120. VICTORY FOOD MARKET BACLARAN – Victory Food Market, Redemptorist Road, Baclaran, Parañaque City 121. VICTORY PASAY MALL – Victory Pasay Mall, Antonio S. Arnaiz Ave, Pasay City 122. WACK WACK GOLF & COUNTRY CLUB – Main Lobby Clubhouse, Wack Wack Golf & Country Club, Shaw Blvd., Mandaluyong City 123. WALTER MART - MAKATI – G/F Waltermart Makati, 790 Chino Roces Ave. cor. Antonio Arnaiz, Makati City 124. WALTER MART - NORTH EDSA – Walter Mart Bldg., EDSA, Quezon City 125. WALTER MART - SUCAT – Walter Mart Sucat, Dr. A. Santos Ave., Brgy. San Isidro, Sucat, Parañaque City 126. ZABARTE TOWN CENTER – Basement Zabarte Town Center, 588 Camarin Road corner Zabarte Road, Caloocan City
Provincial 1. 2 MANGO AVENUE – 2 Mango Ave. - Solara Bldg., General Maxilom Ave, Cebu City 2. 7-11 IMUS BAYAN LUMA - Aguinaldo Highway cor. Patindig Araw Road, Bayan Luma VIII, Imus, Cavite 3. 7-11 IMUS TANZANG LUMA - Aguinaldo Highway cor. Captain B. Paredes St., Tanzang Luma 1, Imus, Cavite 4. A. BONIFACIO - MCDONALD'S BAGUIO – Villanueva Bldg., Lower Bonifacio St., Baguio City 5. ABREEZA MALL – Abreeza Mall, J.P. Laurel Ave., Bajada, Davao City, Davao del Sur 6. ACC HYPERMART SAN ANDRES - San Andres, Catanduanes 7. ACIENDA DESIGNER OUTLET SILANG – G/F Acienda Designer Outlet, E. Aguinaldo Highway, Silang, Cavite 8. ADVENTIST UNIVERSITY OF THE PHILIPPINES – Adventist University of the Philippines, Sta. Rosa - Tagaytay Road,
Puting Kahoy, Silang, Cavite 9. AG&P – Atlantic, Gulf & Pacific Company of Manila Inc., Brgy. San Roque, Bauan, Batangas 10. ALFAMART - LUMINA – Alfamart Lumina, Aguinaldo Highway cor. Nueno Ave., Imus, Cavite 11. ALFAMART - TRECE MARTIRES – CPC Bldg., Governor's Drive cor. Hugo Perez, Trece Martires, Cavite 12. ALFAMART FILINVEST TANZA – Alfamart Filinvest Tanza, Filinvest Ave., Westwood Place Subd. Ph. 2, Brgy. Paradahan, Tanza,
Cavite 13. ALFAMART GOLDEN CITY – Molino-Paliparan Road, Salawag, Dasmariñas City, Cavite 14. ALFAMART ILANG-ILANG TANZA – Alfamart Ilang-Ilang Tanza, Ilang-ilang St., De Roman Subd., Daang Amaya 1,
Tanza, Cavite 15. ALFAMART LANCASTER – Alfamart Lancaster, MCS Bldg., Advincula Ave., Alapan II-A, Imus, Cavite 16. ALFAMART L'PASEO ARCADE INDANG – LGF L'Paseo Building, Indang-Trece Martires Road, Indang, Cavite 17. ALFAMART PACITA COMPLEX – Alfamart, Block 3 Phase 3A Pacita Complex, San Pedro, Laguna 18. ALFAMART POBLACION 4 CALACA - #149 Marasigan St., Poblacion 4, Calaca, Batangas 19. ALFAMART POBLACION ROSARIO – Alfamart Poblacion Rosario, 153 Gen. Trias Drive, Brgy. Poblacion, Rosario, Cavite 20. ALFAMART VILLA CATALINA DASMARIÑAS – Lot 6123 Don Placido Campos Avenue, San Agustin, Dasmariñas City, Cavite
23
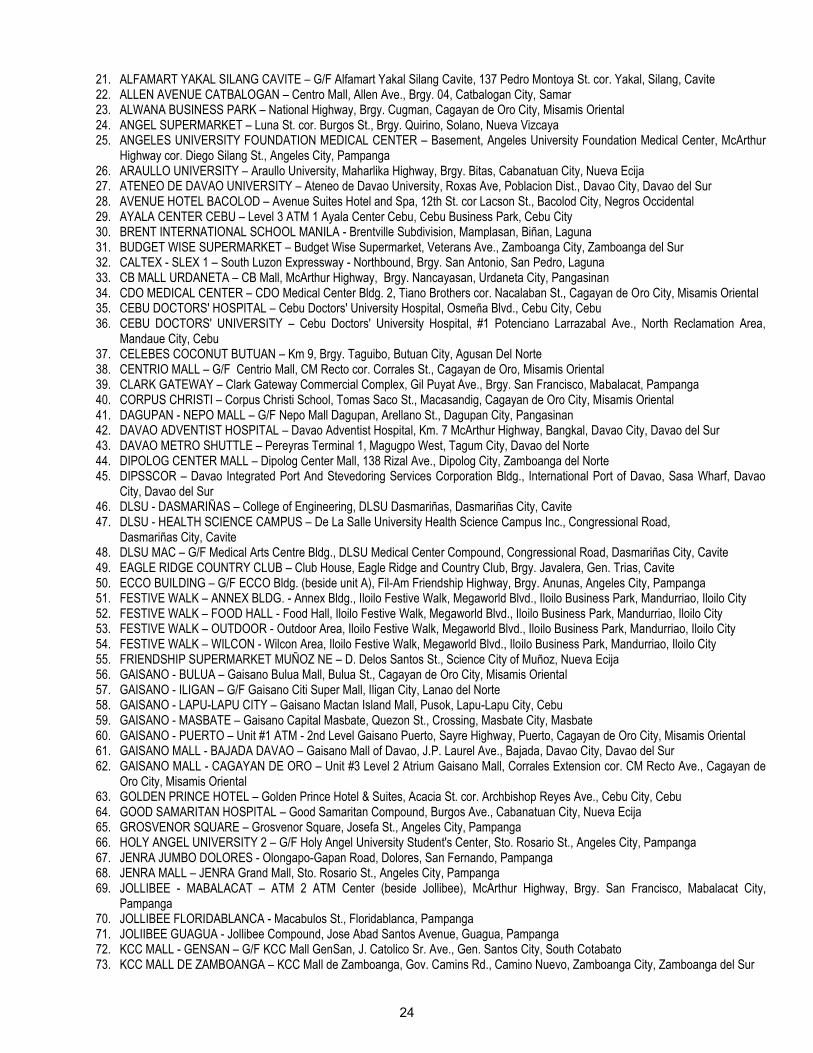
21. ALFAMART YAKAL SILANG CAVITE – G/F Alfamart Yakal Silang Cavite, 137 Pedro Montoya St. cor. Yakal, Silang, Cavite 22. ALLEN AVENUE CATBALOGAN – Centro Mall, Allen Ave., Brgy. 04, Catbalogan City, Samar 23. ALWANA BUSINESS PARK – National Highway, Brgy. Cugman, Cagayan de Oro City, Misamis Oriental 24. ANGEL SUPERMARKET – Luna St. cor. Burgos St., Brgy. Quirino, Solano, Nueva Vizcaya 25. ANGELES UNIVERSITY FOUNDATION MEDICAL CENTER – Basement, Angeles University Foundation Medical Center, McArthur
Highway cor. Diego Silang St., Angeles City, Pampanga 26. ARAULLO UNIVERSITY – Araullo University, Maharlika Highway, Brgy. Bitas, Cabanatuan City, Nueva Ecija 27. ATENEO DE DAVAO UNIVERSITY – Ateneo de Davao University, Roxas Ave, Poblacion Dist., Davao City, Davao del Sur 28. AVENUE HOTEL BACOLOD – Avenue Suites Hotel and Spa, 12th St. cor Lacson St., Bacolod City, Negros Occidental 29. AYALA CENTER CEBU – Level 3 ATM 1 Ayala Center Cebu, Cebu Business Park, Cebu City 30. BRENT INTERNATIONAL SCHOOL MANILA - Brentville Subdivision, Mamplasan, Biñan, Laguna 31. BUDGET WISE SUPERMARKET – Budget Wise Supermarket, Veterans Ave., Zamboanga City, Zamboanga del Sur 32. CALTEX - SLEX 1 – South Luzon Expressway - Northbound, Brgy. San Antonio, San Pedro, Laguna 33. CB MALL URDANETA – CB Mall, McArthur Highway, Brgy. Nancayasan, Urdaneta City, Pangasinan 34. CDO MEDICAL CENTER – CDO Medical Center Bldg. 2, Tiano Brothers cor. Nacalaban St., Cagayan de Oro City, Misamis Oriental 35. CEBU DOCTORS' HOSPITAL – Cebu Doctors' University Hospital, Osmeña Blvd., Cebu City, Cebu 36. CEBU DOCTORS' UNIVERSITY – Cebu Doctors' University Hospital, #1 Potenciano Larrazabal Ave., North Reclamation Area,
Mandaue City, Cebu 37. CELEBES COCONUT BUTUAN – Km 9, Brgy. Taguibo, Butuan City, Agusan Del Norte 38. CENTRIO MALL – G/F Centrio Mall, CM Recto cor. Corrales St., Cagayan de Oro, Misamis Oriental 39. CLARK GATEWAY – Clark Gateway Commercial Complex, Gil Puyat Ave., Brgy. San Francisco, Mabalacat, Pampanga 40. CORPUS CHRISTI – Corpus Christi School, Tomas Saco St., Macasandig, Cagayan de Oro City, Misamis Oriental 41. DAGUPAN - NEPO MALL – G/F Nepo Mall Dagupan, Arellano St., Dagupan City, Pangasinan 42. DAVAO ADVENTIST HOSPITAL – Davao Adventist Hospital, Km. 7 McArthur Highway, Bangkal, Davao City, Davao del Sur 43. DAVAO METRO SHUTTLE – Pereyras Terminal 1, Magugpo West, Tagum City, Davao del Norte 44. DIPOLOG CENTER MALL – Dipolog Center Mall, 138 Rizal Ave., Dipolog City, Zamboanga del Norte 45. DIPSSCOR – Davao Integrated Port And Stevedoring Services Corporation Bldg., International Port of Davao, Sasa Wharf, Davao
City, Davao del Sur 46. DLSU - DASMARIÑAS – College of Engineering, DLSU Dasmariñas, Dasmariñas City, Cavite 47. DLSU - HEALTH SCIENCE CAMPUS – De La Salle University Health Science Campus Inc., Congressional Road,
Dasmariñas City, Cavite 48. DLSU MAC – G/F Medical Arts Centre Bldg., DLSU Medical Center Compound, Congressional Road, Dasmariñas City, Cavite 49. EAGLE RIDGE COUNTRY CLUB – Club House, Eagle Ridge and Country Club, Brgy. Javalera, Gen. Trias, Cavite 50. ECCO BUILDING – G/F ECCO Bldg. (beside unit A), Fil-Am Friendship Highway, Brgy. Anunas, Angeles City, Pampanga 51. FESTIVE WALK – ANNEX BLDG. - Annex Bldg., Iloilo Festive Walk, Megaworld Blvd., Iloilo Business Park, Mandurriao, Iloilo City 52. FESTIVE WALK – FOOD HALL - Food Hall, Iloilo Festive Walk, Megaworld Blvd., Iloilo Business Park, Mandurriao, Iloilo City 53. FESTIVE WALK – OUTDOOR - Outdoor Area, Iloilo Festive Walk, Megaworld Blvd., Iloilo Business Park, Mandurriao, Iloilo City 54. FESTIVE WALK – WILCON - Wilcon Area, Iloilo Festive Walk, Megaworld Blvd., Iloilo Business Park, Mandurriao, Iloilo City 55. FRIENDSHIP SUPERMARKET MUÑOZ NE – D. Delos Santos St., Science City of Muñoz, Nueva Ecija 56. GAISANO - BULUA – Gaisano Bulua Mall, Bulua St., Cagayan de Oro City, Misamis Oriental 57. GAISANO - ILIGAN – G/F Gaisano Citi Super Mall, Iligan City, Lanao del Norte 58. GAISANO - LAPU-LAPU CITY – Gaisano Mactan Island Mall, Pusok, Lapu-Lapu City, Cebu 59. GAISANO - MASBATE – Gaisano Capital Masbate, Quezon St., Crossing, Masbate City, Masbate 60. GAISANO - PUERTO – Unit #1 ATM - 2nd Level Gaisano Puerto, Sayre Highway, Puerto, Cagayan de Oro City, Misamis Oriental 61. GAISANO MALL - BAJADA DAVAO – Gaisano Mall of Davao, J.P. Laurel Ave., Bajada, Davao City, Davao del Sur 62. GAISANO MALL - CAGAYAN DE ORO – Unit #3 Level 2 Atrium Gaisano Mall, Corrales Extension cor. CM Recto Ave., Cagayan de
Oro City, Misamis Oriental 63. GOLDEN PRINCE HOTEL – Golden Prince Hotel & Suites, Acacia St. cor. Archbishop Reyes Ave., Cebu City, Cebu 64. GOOD SAMARITAN HOSPITAL – Good Samaritan Compound, Burgos Ave., Cabanatuan City, Nueva Ecija 65. GROSVENOR SQUARE – Grosvenor Square, Josefa St., Angeles City, Pampanga 66. HOLY ANGEL UNIVERSITY 2 – G/F Holy Angel University Student's Center, Sto. Rosario St., Angeles City, Pampanga 67. JENRA JUMBO DOLORES - Olongapo-Gapan Road, Dolores, San Fernando, Pampanga 68. JENRA MALL – JENRA Grand Mall, Sto. Rosario St., Angeles City, Pampanga 69. JOLLIBEE - MABALACAT – ATM 2 ATM Center (beside Jollibee), McArthur Highway, Brgy. San Francisco, Mabalacat City,
Pampanga 70. JOLLIBEE FLORIDABLANCA - Macabulos St., Floridablanca, Pampanga 71. JOLIIBEE GUAGUA - Jollibee Compound, Jose Abad Santos Avenue, Guagua, Pampanga 72. KCC MALL - GENSAN – G/F KCC Mall GenSan, J. Catolico Sr. Ave., Gen. Santos City, South Cotabato 73. KCC MALL DE ZAMBOANGA – KCC Mall de Zamboanga, Gov. Camins Rd., Camino Nuevo, Zamboanga City, Zamboanga del Sur
24
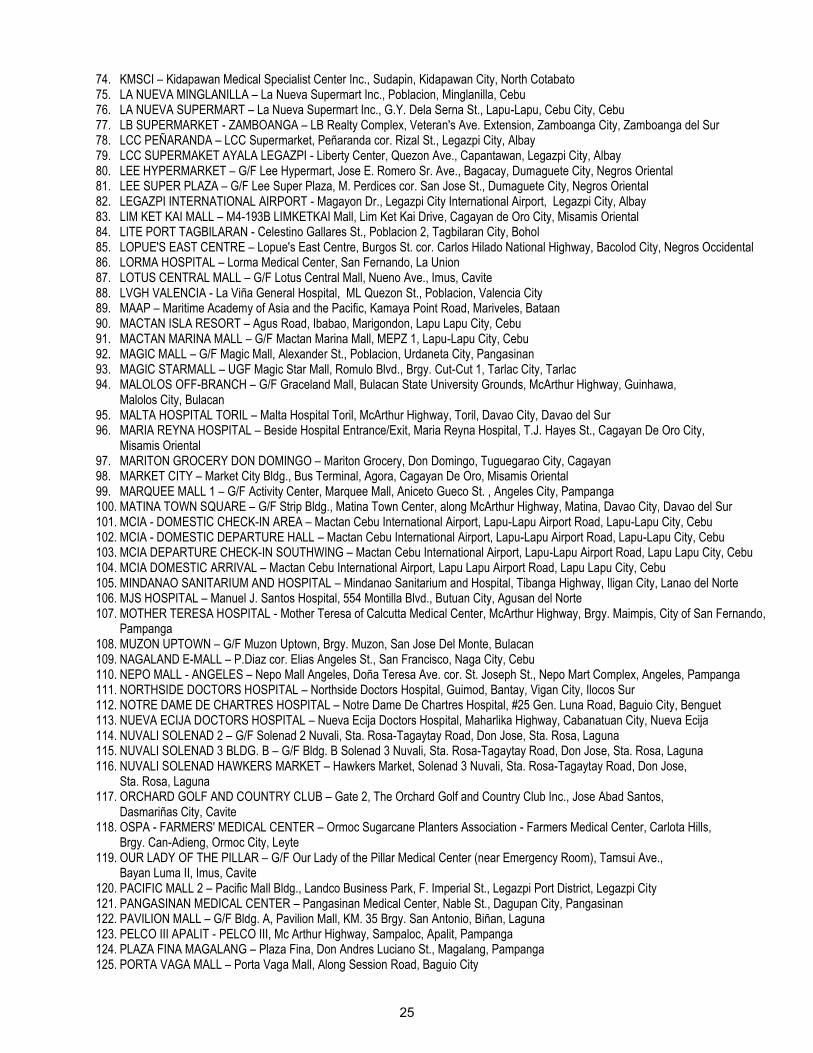
74. KMSCI – Kidapawan Medical Specialist Center Inc., Sudapin, Kidapawan City, North Cotabato 75. LA NUEVA MINGLANILLA – La Nueva Supermart Inc., Poblacion, Minglanilla, Cebu 76. LA NUEVA SUPERMART – La Nueva Supermart Inc., G.Y. Dela Serna St., Lapu-Lapu, Cebu City, Cebu 77. LB SUPERMARKET - ZAMBOANGA – LB Realty Complex, Veteran's Ave. Extension, Zamboanga City, Zamboanga del Sur 78. LCC PEÑARANDA – LCC Supermarket, Peñaranda cor. Rizal St., Legazpi City, Albay 79. LCC SUPERMAKET AYALA LEGAZPI - Liberty Center, Quezon Ave., Capantawan, Legazpi City, Albay 80. LEE HYPERMARKET – G/F Lee Hypermart, Jose E. Romero Sr. Ave., Bagacay, Dumaguete City, Negros Oriental 81. LEE SUPER PLAZA – G/F Lee Super Plaza, M. Perdices cor. San Jose St., Dumaguete City, Negros Oriental 82. LEGAZPI INTERNATIONAL AIRPORT - Magayon Dr., Legazpi City International Airport, Legazpi City, Albay 83. LIM KET KAI MALL – M4-193B LIMKETKAI Mall, Lim Ket Kai Drive, Cagayan de Oro City, Misamis Oriental 84. LITE PORT TAGBILARAN - Celestino Gallares St., Poblacion 2, Tagbilaran City, Bohol 85. LOPUE'S EAST CENTRE – Lopue's East Centre, Burgos St. cor. Carlos Hilado National Highway, Bacolod City, Negros Occidental 86. LORMA HOSPITAL – Lorma Medical Center, San Fernando, La Union 87. LOTUS CENTRAL MALL – G/F Lotus Central Mall, Nueno Ave., Imus, Cavite 88. LVGH VALENCIA - La Viña General Hospital, ML Quezon St., Poblacion, Valencia City 89. MAAP – Maritime Academy of Asia and the Pacific, Kamaya Point Road, Mariveles, Bataan 90. MACTAN ISLA RESORT – Agus Road, Ibabao, Marigondon, Lapu Lapu City, Cebu 91. MACTAN MARINA MALL – G/F Mactan Marina Mall, MEPZ 1, Lapu-Lapu City, Cebu 92. MAGIC MALL – G/F Magic Mall, Alexander St., Poblacion, Urdaneta City, Pangasinan 93. MAGIC STARMALL – UGF Magic Star Mall, Romulo Blvd., Brgy. Cut-Cut 1, Tarlac City, Tarlac 94. MALOLOS OFF-BRANCH – G/F Graceland Mall, Bulacan State University Grounds, McArthur Highway, Guinhawa,
Malolos City, Bulacan 95. MALTA HOSPITAL TORIL – Malta Hospital Toril, McArthur Highway, Toril, Davao City, Davao del Sur 96. MARIA REYNA HOSPITAL – Beside Hospital Entrance/Exit, Maria Reyna Hospital, T.J. Hayes St., Cagayan De Oro City,
Misamis Oriental 97. MARITON GROCERY DON DOMINGO – Mariton Grocery, Don Domingo, Tuguegarao City, Cagayan 98. MARKET CITY – Market City Bldg., Bus Terminal, Agora, Cagayan De Oro, Misamis Oriental 99. MARQUEE MALL 1 – G/F Activity Center, Marquee Mall, Aniceto Gueco St. , Angeles City, Pampanga 100. MATINA TOWN SQUARE – G/F Strip Bldg., Matina Town Center, along McArthur Highway, Matina, Davao City, Davao del Sur 101. MCIA - DOMESTIC CHECK-IN AREA – Mactan Cebu International Airport, Lapu-Lapu Airport Road, Lapu-Lapu City, Cebu 102. MCIA - DOMESTIC DEPARTURE HALL – Mactan Cebu International Airport, Lapu-Lapu Airport Road, Lapu-Lapu City, Cebu 103. MCIA DEPARTURE CHECK-IN SOUTHWING – Mactan Cebu International Airport, Lapu-Lapu Airport Road, Lapu Lapu City, Cebu 104. MCIA DOMESTIC ARRIVAL – Mactan Cebu International Airport, Lapu Lapu Airport Road, Lapu Lapu City, Cebu 105. MINDANAO SANITARIUM AND HOSPITAL – Mindanao Sanitarium and Hospital, Tibanga Highway, Iligan City, Lanao del Norte 106. MJS HOSPITAL – Manuel J. Santos Hospital, 554 Montilla Blvd., Butuan City, Agusan del Norte 107. MOTHER TERESA HOSPITAL - Mother Teresa of Calcutta Medical Center, McArthur Highway, Brgy. Maimpis, City of San Fernando,
Pampanga 108. MUZON UPTOWN – G/F Muzon Uptown, Brgy. Muzon, San Jose Del Monte, Bulacan 109. NAGALAND E-MALL – P.Diaz cor. Elias Angeles St., San Francisco, Naga City, Cebu 110. NEPO MALL - ANGELES – Nepo Mall Angeles, Doña Teresa Ave. cor. St. Joseph St., Nepo Mart Complex, Angeles, Pampanga 111. NORTHSIDE DOCTORS HOSPITAL – Northside Doctors Hospital, Guimod, Bantay, Vigan City, Ilocos Sur 112. NOTRE DAME DE CHARTRES HOSPITAL – Notre Dame De Chartres Hospital, #25 Gen. Luna Road, Baguio City, Benguet 113. NUEVA ECIJA DOCTORS HOSPITAL – Nueva Ecija Doctors Hospital, Maharlika Highway, Cabanatuan City, Nueva Ecija 114. NUVALI SOLENAD 2 – G/F Solenad 2 Nuvali, Sta. Rosa-Tagaytay Road, Don Jose, Sta. Rosa, Laguna 115. NUVALI SOLENAD 3 BLDG. B – G/F Bldg. B Solenad 3 Nuvali, Sta. Rosa-Tagaytay Road, Don Jose, Sta. Rosa, Laguna 116. NUVALI SOLENAD HAWKERS MARKET – Hawkers Market, Solenad 3 Nuvali, Sta. Rosa-Tagaytay Road, Don Jose,
Sta. Rosa, Laguna 117. ORCHARD GOLF AND COUNTRY CLUB – Gate 2, The Orchard Golf and Country Club Inc., Jose Abad Santos,
Dasmariñas City, Cavite 118. OSPA - FARMERS' MEDICAL CENTER – Ormoc Sugarcane Planters Association - Farmers Medical Center, Carlota Hills,
Brgy. Can-Adieng, Ormoc City, Leyte 119. OUR LADY OF THE PILLAR – G/F Our Lady of the Pillar Medical Center (near Emergency Room), Tamsui Ave.,
Bayan Luma II, Imus, Cavite 120. PACIFIC MALL 2 – Pacific Mall Bldg., Landco Business Park, F. Imperial St., Legazpi Port District, Legazpi City 121. PANGASINAN MEDICAL CENTER – Pangasinan Medical Center, Nable St., Dagupan City, Pangasinan 122. PAVILION MALL – G/F Bldg. A, Pavilion Mall, KM. 35 Brgy. San Antonio, Biñan, Laguna 123. PELCO III APALIT - PELCO III, Mc Arthur Highway, Sampaloc, Apalit, Pampanga 124. PLAZA FINA MAGALANG – Plaza Fina, Don Andres Luciano St., Magalang, Pampanga 125. PORTA VAGA MALL – Porta Vaga Mall, Along Session Road, Baguio City
25
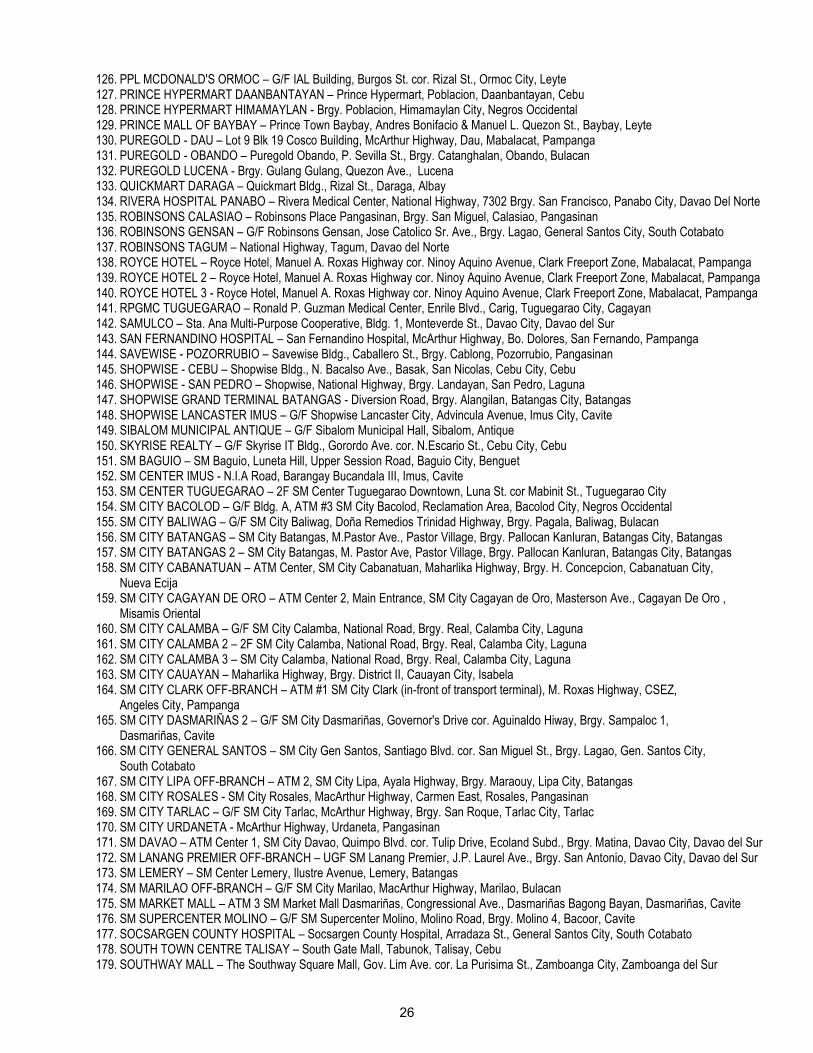
126. PPL MCDONALD'S ORMOC – G/F IAL Building, Burgos St. cor. Rizal St., Ormoc City, Leyte 127. PRINCE HYPERMART DAANBANTAYAN – Prince Hypermart, Poblacion, Daanbantayan, Cebu 128. PRINCE HYPERMART HIMAMAYLAN - Brgy. Poblacion, Himamaylan City, Negros Occidental 129. PRINCE MALL OF BAYBAY – Prince Town Baybay, Andres Bonifacio & Manuel L. Quezon St., Baybay, Leyte 130. PUREGOLD - DAU – Lot 9 Blk 19 Cosco Building, McArthur Highway, Dau, Mabalacat, Pampanga 131. PUREGOLD - OBANDO – Puregold Obando, P. Sevilla St., Brgy. Catanghalan, Obando, Bulacan 132. PUREGOLD LUCENA - Brgy. Gulang Gulang, Quezon Ave., Lucena 133. QUICKMART DARAGA – Quickmart Bldg., Rizal St., Daraga, Albay 134. RIVERA HOSPITAL PANABO – Rivera Medical Center, National Highway, 7302 Brgy. San Francisco, Panabo City, Davao Del Norte 135. ROBINSONS CALASIAO – Robinsons Place Pangasinan, Brgy. San Miguel, Calasiao, Pangasinan 136. ROBINSONS GENSAN – G/F Robinsons Gensan, Jose Catolico Sr. Ave., Brgy. Lagao, General Santos City, South Cotabato 137. ROBINSONS TAGUM – National Highway, Tagum, Davao del Norte 138. ROYCE HOTEL – Royce Hotel, Manuel A. Roxas Highway cor. Ninoy Aquino Avenue, Clark Freeport Zone, Mabalacat, Pampanga 139. ROYCE HOTEL 2 – Royce Hotel, Manuel A. Roxas Highway cor. Ninoy Aquino Avenue, Clark Freeport Zone, Mabalacat, Pampanga 140. ROYCE HOTEL 3 - Royce Hotel, Manuel A. Roxas Highway cor. Ninoy Aquino Avenue, Clark Freeport Zone, Mabalacat, Pampanga 141. RPGMC TUGUEGARAO – Ronald P. Guzman Medical Center, Enrile Blvd., Carig, Tuguegarao City, Cagayan 142. SAMULCO – Sta. Ana Multi-Purpose Cooperative, Bldg. 1, Monteverde St., Davao City, Davao del Sur 143. SAN FERNANDINO HOSPITAL – San Fernandino Hospital, McArthur Highway, Bo. Dolores, San Fernando, Pampanga 144. SAVEWISE - POZORRUBIO – Savewise Bldg., Caballero St., Brgy. Cablong, Pozorrubio, Pangasinan 145. SHOPWISE - CEBU – Shopwise Bldg., N. Bacalso Ave., Basak, San Nicolas, Cebu City, Cebu 146. SHOPWISE - SAN PEDRO – Shopwise, National Highway, Brgy. Landayan, San Pedro, Laguna 147. SHOPWISE GRAND TERMINAL BATANGAS - Diversion Road, Brgy. Alangilan, Batangas City, Batangas 148. SHOPWISE LANCASTER IMUS – G/F Shopwise Lancaster City, Advincula Avenue, Imus City, Cavite 149. SIBALOM MUNICIPAL ANTIQUE – G/F Sibalom Municipal Hall, Sibalom, Antique 150. SKYRISE REALTY – G/F Skyrise IT Bldg., Gorordo Ave. cor. N.Escario St., Cebu City, Cebu 151. SM BAGUIO – SM Baguio, Luneta Hill, Upper Session Road, Baguio City, Benguet 152. SM CENTER IMUS - N.I.A Road, Barangay Bucandala III, Imus, Cavite 153. SM CENTER TUGUEGARAO – 2F SM Center Tuguegarao Downtown, Luna St. cor Mabinit St., Tuguegarao City 154. SM CITY BACOLOD – G/F Bldg. A, ATM #3 SM City Bacolod, Reclamation Area, Bacolod City, Negros Occidental 155. SM CITY BALIWAG – G/F SM City Baliwag, Doña Remedios Trinidad Highway, Brgy. Pagala, Baliwag, Bulacan 156. SM CITY BATANGAS – SM City Batangas, M.Pastor Ave., Pastor Village, Brgy. Pallocan Kanluran, Batangas City, Batangas 157. SM CITY BATANGAS 2 – SM City Batangas, M. Pastor Ave, Pastor Village, Brgy. Pallocan Kanluran, Batangas City, Batangas 158. SM CITY CABANATUAN – ATM Center, SM City Cabanatuan, Maharlika Highway, Brgy. H. Concepcion, Cabanatuan City,
Nueva Ecija 159. SM CITY CAGAYAN DE ORO – ATM Center 2, Main Entrance, SM City Cagayan de Oro, Masterson Ave., Cagayan De Oro ,
Misamis Oriental 160. SM CITY CALAMBA – G/F SM City Calamba, National Road, Brgy. Real, Calamba City, Laguna 161. SM CITY CALAMBA 2 – 2F SM City Calamba, National Road, Brgy. Real, Calamba City, Laguna 162. SM CITY CALAMBA 3 – SM City Calamba, National Road, Brgy. Real, Calamba City, Laguna 163. SM CITY CAUAYAN – Maharlika Highway, Brgy. District II, Cauayan City, Isabela 164. SM CITY CLARK OFF-BRANCH – ATM #1 SM City Clark (in-front of transport terminal), M. Roxas Highway, CSEZ,
Angeles City, Pampanga 165. SM CITY DASMARIÑAS 2 – G/F SM City Dasmariñas, Governor's Drive cor. Aguinaldo Hiway, Brgy. Sampaloc 1,
Dasmariñas, Cavite 166. SM CITY GENERAL SANTOS – SM City Gen Santos, Santiago Blvd. cor. San Miguel St., Brgy. Lagao, Gen. Santos City,
South Cotabato 167. SM CITY LIPA OFF-BRANCH – ATM 2, SM City Lipa, Ayala Highway, Brgy. Maraouy, Lipa City, Batangas 168. SM CITY ROSALES - SM City Rosales, MacArthur Highway, Carmen East, Rosales, Pangasinan 169. SM CITY TARLAC – G/F SM City Tarlac, McArthur Highway, Brgy. San Roque, Tarlac City, Tarlac 170. SM CITY URDANETA - McArthur Highway, Urdaneta, Pangasinan 171. SM DAVAO – ATM Center 1, SM City Davao, Quimpo Blvd. cor. Tulip Drive, Ecoland Subd., Brgy. Matina, Davao City, Davao del Sur 172. SM LANANG PREMIER OFF-BRANCH – UGF SM Lanang Premier, J.P. Laurel Ave., Brgy. San Antonio, Davao City, Davao del Sur 173. SM LEMERY – SM Center Lemery, Ilustre Avenue, Lemery, Batangas 174. SM MARILAO OFF-BRANCH – G/F SM City Marilao, MacArthur Highway, Marilao, Bulacan 175. SM MARKET MALL – ATM 3 SM Market Mall Dasmariñas, Congressional Ave., Dasmariñas Bagong Bayan, Dasmariñas, Cavite 176. SM SUPERCENTER MOLINO – G/F SM Supercenter Molino, Molino Road, Brgy. Molino 4, Bacoor, Cavite 177. SOCSARGEN COUNTY HOSPITAL – Socsargen County Hospital, Arradaza St., General Santos City, South Cotabato 178. SOUTH TOWN CENTRE TALISAY – South Gate Mall, Tabunok, Talisay, Cebu 179. SOUTHWAY MALL – The Southway Square Mall, Gov. Lim Ave. cor. La Purisima St., Zamboanga City, Zamboanga del Sur
26
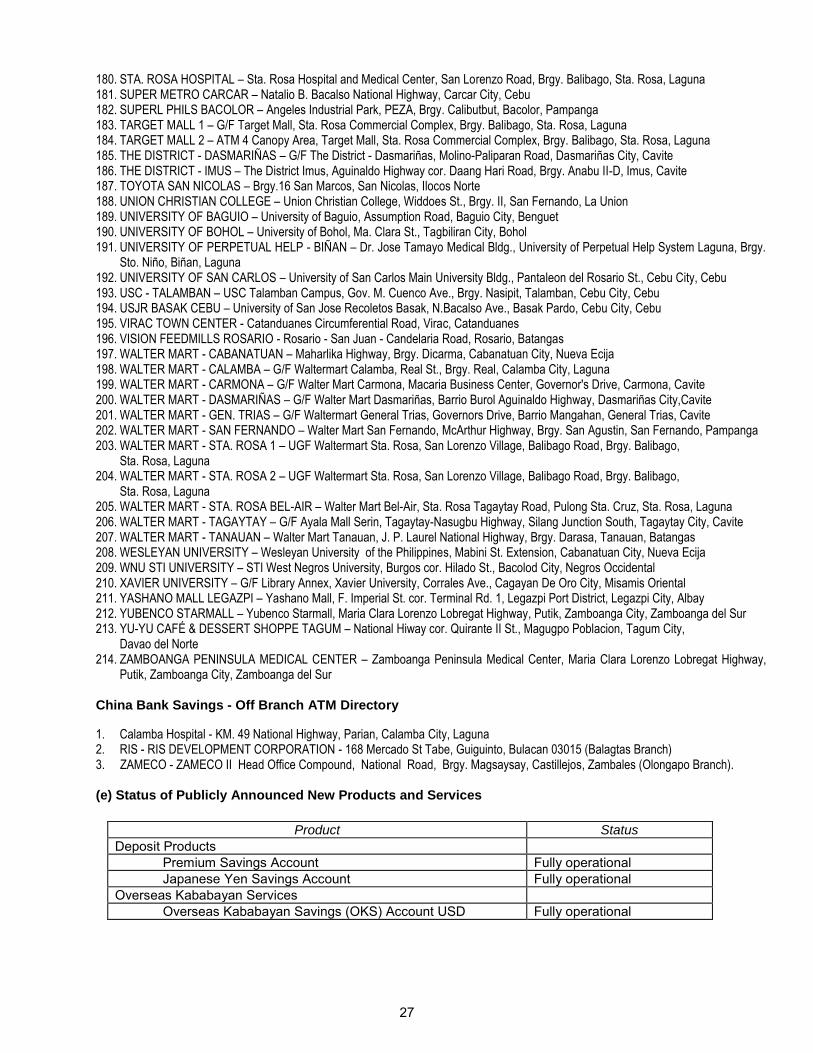
180. STA. ROSA HOSPITAL – Sta. Rosa Hospital and Medical Center, San Lorenzo Road, Brgy. Balibago, Sta. Rosa, Laguna 181. SUPER METRO CARCAR – Natalio B. Bacalso National Highway, Carcar City, Cebu 182. SUPERL PHILS BACOLOR – Angeles Industrial Park, PEZA, Brgy. Calibutbut, Bacolor, Pampanga 183. TARGET MALL 1 – G/F Target Mall, Sta. Rosa Commercial Complex, Brgy. Balibago, Sta. Rosa, Laguna 184. TARGET MALL 2 – ATM 4 Canopy Area, Target Mall, Sta. Rosa Commercial Complex, Brgy. Balibago, Sta. Rosa, Laguna 185. THE DISTRICT - DASMARIÑAS – G/F The District - Dasmariñas, Molino-Paliparan Road, Dasmariñas City, Cavite 186. THE DISTRICT - IMUS – The District Imus, Aguinaldo Highway cor. Daang Hari Road, Brgy. Anabu II-D, Imus, Cavite 187. TOYOTA SAN NICOLAS – Brgy.16 San Marcos, San Nicolas, Ilocos Norte 188. UNION CHRISTIAN COLLEGE – Union Christian College, Widdoes St., Brgy. II, San Fernando, La Union 189. UNIVERSITY OF BAGUIO – University of Baguio, Assumption Road, Baguio City, Benguet 190. UNIVERSITY OF BOHOL – University of Bohol, Ma. Clara St., Tagbiliran City, Bohol 191. UNIVERSITY OF PERPETUAL HELP - BIÑAN – Dr. Jose Tamayo Medical Bldg., University of Perpetual Help System Laguna, Brgy.
Sto. Niño, Biñan, Laguna 192. UNIVERSITY OF SAN CARLOS – University of San Carlos Main University Bldg., Pantaleon del Rosario St., Cebu City, Cebu 193. USC - TALAMBAN – USC Talamban Campus, Gov. M. Cuenco Ave., Brgy. Nasipit, Talamban, Cebu City, Cebu 194. USJR BASAK CEBU – University of San Jose Recoletos Basak, N.Bacalso Ave., Basak Pardo, Cebu City, Cebu 195. VIRAC TOWN CENTER - Catanduanes Circumferential Road, Virac, Catanduanes 196. VISION FEEDMILLS ROSARIO - Rosario - San Juan - Candelaria Road, Rosario, Batangas 197. WALTER MART - CABANATUAN – Maharlika Highway, Brgy. Dicarma, Cabanatuan City, Nueva Ecija 198. WALTER MART - CALAMBA – G/F Waltermart Calamba, Real St., Brgy. Real, Calamba City, Laguna 199. WALTER MART - CARMONA – G/F Walter Mart Carmona, Macaria Business Center, Governor's Drive, Carmona, Cavite 200. WALTER MART - DASMARIÑAS – G/F Walter Mart Dasmariñas, Barrio Burol Aguinaldo Highway, Dasmariñas City,Cavite 201. WALTER MART - GEN. TRIAS – G/F Waltermart General Trias, Governors Drive, Barrio Mangahan, General Trias, Cavite 202. WALTER MART - SAN FERNANDO – Walter Mart San Fernando, McArthur Highway, Brgy. San Agustin, San Fernando, Pampanga 203. WALTER MART - STA. ROSA 1 – UGF Waltermart Sta. Rosa, San Lorenzo Village, Balibago Road, Brgy. Balibago,
Sta. Rosa, Laguna 204. WALTER MART - STA. ROSA 2 – UGF Waltermart Sta. Rosa, San Lorenzo Village, Balibago Road, Brgy. Balibago,
Sta. Rosa, Laguna 205. WALTER MART - STA. ROSA BEL-AIR – Walter Mart Bel-Air, Sta. Rosa Tagaytay Road, Pulong Sta. Cruz, Sta. Rosa, Laguna 206. WALTER MART - TAGAYTAY – G/F Ayala Mall Serin, Tagaytay-Nasugbu Highway, Silang Junction South, Tagaytay City, Cavite 207. WALTER MART - TANAUAN – Walter Mart Tanauan, J. P. Laurel National Highway, Brgy. Darasa, Tanauan, Batangas 208. WESLEYAN UNIVERSITY – Wesleyan University of the Philippines, Mabini St. Extension, Cabanatuan City, Nueva Ecija 209. WNU STI UNIVERSITY – STI West Negros University, Burgos cor. Hilado St., Bacolod City, Negros Occidental 210. XAVIER UNIVERSITY – G/F Library Annex, Xavier University, Corrales Ave., Cagayan De Oro City, Misamis Oriental 211. YASHANO MALL LEGAZPI – Yashano Mall, F. Imperial St. cor. Terminal Rd. 1, Legazpi Port District, Legazpi City, Albay 212. YUBENCO STARMALL – Yubenco Starmall, Maria Clara Lorenzo Lobregat Highway, Putik, Zamboanga City, Zamboanga del Sur 213. YU-YU CAFÉ & DESSERT SHOPPE TAGUM – National Hiway cor. Quirante II St., Magugpo Poblacion, Tagum City,
Davao del Norte 214. ZAMBOANGA PENINSULA MEDICAL CENTER – Zamboanga Peninsula Medical Center, Maria Clara Lorenzo Lobregat Highway,
Putik, Zamboanga City, Zamboanga del Sur China Bank Savings - Off Branch ATM Directory 1. Calamba Hospital - KM. 49 National Highway, Parian, Calamba City, Laguna 2. RIS - RIS DEVELOPMENT CORPORATION - 168 Mercado St Tabe, Guiguinto, Bulacan 03015 (Balagtas Branch) 3. ZAMECO - ZAMECO II Head Office Compound, National Road, Brgy. Magsaysay, Castillejos, Zambales (Olongapo Branch). (e) Status of Publicly Announced New Products and Services
Product Status
Deposit Products Premium Savings Account Fully operational Japanese Yen Savings Account Fully operational
Overseas Kababayan Services Overseas Kababayan Savings (OKS) Account USD Fully operational
27
(f) Competition The UK/B & TB industries remained profitable despite the uptick in market rates, with aggregate net income up by 7% to P176 billion in 2018. Major banks raised fresh funds to support growth in their core businesses. The industry also saw the roll out of digital transformation initiatives such as fully-digital branches and blockchain technology. The combined assets of the UK/B & TB industries expanded by 11.6% (+P1.7 trillion) to P16.7 trillion. Based on its published statement of condition (SOC), China Bank recorded the second largest nominal growth in resources of P117 billion or 16% to P864 billion among mid-tier banks, next to PNB‘s P144 billion increment. Industry deposits grew 8.9% to P12.6 trillion, while gross loans expanded by P1.2 trillion (+14.7%) to P9.3 trillion. This resulted in an increase in loans-to-deposits ratio to 78% from 74% last year. Gross non-performing loans increased by 17.5% to P161 billion, resulting in an uptick in Gross NPL ratio to 1.73% from 1.69% and a decline in NPL coverage ratio to 108% from 126% as the growth in the allowance for credit losses was flat during the period. More than half of the P240 billion funds raised during the year were allotted to working capital and lending. Combined equity of the UK/B & TB industries went up by 17.9% or P307 billion to P2 trillion. UK/B industry CAR as of September 2018 likewise improved to 15.19% on a solo basis and 15.75% on a consolidated basis. As of January 2019, there were 45 universal and commercial domestic banks – 17 private domestic banks, 23 foreign bank branches, three government banks, and two foreign bank subsidiaries. Despite the drive towards an integrated ASEAN market, local players would continue to maintain their foothold in the domestic market even with the entry of regional players. (g) Transactions with and/or dependence on related parties In the ordinary course of business, the Bank has loans and other transactions with its subsidiaries and affiliates, and with certain directors, officers, stockholders and their related interest (DOSRI). These loans and other transactions are in accordance with the Bank's policy should be reviewed by the Related Party Transaction Committee to ensure that they are conducted at arm's length basis at fair market prices and upon terms not less favorable to Bank than those offered to others and in compliance with all regulatory requirements. Related party transactions are presented to the stockholders during the annual stockholders' meeting for ratification. (h) Trademarks, Licenses, Franchises, etc. China Bank is operating under a universal banking license obtained in 1991. Over the years, China Bank has registered its corporate brand, slogan and product trademarks with the Intellectual Property Office (IPO) of the Philippines – Bureau of Trademarks, as follows:
China Bank - Your Success Is Our Business China Bank Check Write Plus Outsourcing China Bank - More Than Your Banker, The Right
Partner China Bank Check Write Plus Software
China Bank Treasury Investments Logo China Bank Payroll Processing China Bank GS Fund Logo China Bank Check Depot China Bank Online Logo China Bank Sure Sweep & Device China Bank Diamond Savings Account China Bank Sure Collect & Device China Bank Dollar Fund Logo China Bank Bills Pay Plus China Check Plus and Device China Bank Corporate IBFT China Bank HomePlus Logo China Bank ACA Auto-Credit Arrangement China Bank AutoPlus Logo China Bank ADA Auto-Debit Arrangement China Bank Platinum China Bank China Pay Payroll Software China Bank Prime China Bank EGOV China Bank World China Bank Corporate Bills Payment China Bank Money Plus China Bank Escrow Agency Service POEA China Bank Cash Management China Bank Check Write Plus Outsourcing China Bank Check Write Plus China Bank Check Write Plus Software
All the Bank‘s trademark registrations are valid for 10 years with expiration dates varying from 2020 to 2025. The Bank closely monitors the expiry and renewal dates of these trademark names to protect the Bank‘s brand equity.
28
(i) Sources and Availability of raw materials and the names of principal suppliers. Not applicable.
(j) Disclose how dependent the business is upon a single customer or a few customers. Not applicable.
(k) Need for any government approval of principal products or services. The Bank secures regulatory approval of all its products and services, as required. (l) Effect of existing or probable governmental regulations on the business. The Bank strictly complied with the Bangko Sentral ng Pilipinas (BSP) requirements in terms of reserves, liquidity position, capital adequacy, limits on loan exposure, cap on foreign exchange holdings, provision for losses, anti-money laundering provisions and other reportorial requirements. (m) Amount spent on research and development activities
(In‘000) 2018 2017 2016
Education & Training 50,839 51,031 47,411 Advertising Expenses 32,729 54,759 53,716 Technology 892,431 913,049 809,065
(n) Cost and effect of compliance with environmental laws. Not applicable. (o) Total number of employees Below is the breakdown of the manpower complement in 2018 as well as the projected headcount for 2019:
2019 2018
Officers Staff TOTAL Officers Staff TOTAL
Marketing 1,986 334 2,320 1,663 279 1,942 Operations 1,150 4,715 5,865 946 4,523 5,469 Support 735 1,438 2,173 623 1,144 1,767 Technical 303 383 686 232 242 474 Grand Total 4,174 6,870 11,044 3,464 6,188 9,652
The CBC Employees Association (CBCEA) members have an existing Collective Bargaining Agreement with the Bank for the period 01 August 2017 to 31 July 2020.
(p) Risk Management We recognize that the business of banking necessarily entails risk, and that proper risk mitigation, not outright risk avoidance, is the key to long-term success. Our risk management principle centers on determining how much risk we are willing to bear for a given return, deciding if the risks represent viable opportunities, and finding intelligent approaches to managing risks. Our corporate governance structure keeps pace with the changing risks that China Bank faces and will be facing in the coming years with a dynamic risk management program that calls for the continuing reassessment of risks and controls and the timely reporting of these risks to the Board. As mandated under existing regulations, the Board is responsible for the approval and oversight of the implementation of risk management policies. The Board has delegated this function to the Risk Oversight Committee (ROC) which includes among others, the development of various risk strategies and principles, control guidelines policies and procedures, implementation of risk measurement tools, monitoring of key risk indicators, and the imposition and monitoring of risk limits. The ROC regularly reviews China Bank‘s risk profile and the effectiveness of risk management systems. Moreover, internal auditors test and evaluate our risk management program to determine effectiveness and communicate the results to the Board and the Audit Committee.
29
The Risk Management Group (RMG), headed by our chief risk officer, First Vice President II Ananias S. Cornelio III, is responsible for executing the risk management function and the guidelines set by the ROC, including the identification and evaluation on a continuous basis of all considerable risks to the business, and challenging business lines on all aspects of risks arising from the Bank‘s activities. RMG continues to strengthen China Bank‘s risk management framework to effectively assess, manage, and monitor risks across a broad range of activities. Through a strong collaboration between RMG and Financial Control, and the engagement of Moody‘s Analytics, the smooth transition to the Bank‘s adoption of PFRS 9 was assured. Foundation for the Bank‘s adoption of the Basel III framework on liquidity risk management has been prepared. On Information Technology, emphasis was given on cybersecurity and core system testing on disaster preparedness was completed. Market and Liquidity Risk The objective of our market risk policies is to obtain the best balance of risk and return while meeting our stakeholders‘ requirements. Meanwhile, our liquidity risk policies center on maintaining adequate liquidity at all times to be in a position to meet all obligations as they fall due. To measure market risk exposures, we use Historical Simulation Value-at-Risk (VaR) approach for all treasury traded instruments, including fixed income bonds, foreign exchange swaps and forwards, interest rate swaps, and equity securities. Market risk exposures are measured and monitored through reports from the Market Risk Management System implemented in 2016 to enhance risk measurement and automate daily reporting. Liquidity and interest rate risk exposures are measured and monitored through the Maximum Cumulative Outflow (MCO) and Earnings-at-Risk (EaR) reports from the Asset and Liability Management (ALM) system. The ALM system was implemented in 2013 and upgraded in 2016 to a new version with modules for calculating liquidity ratios. Market risk, interest rate risk, and liquidity risk exposures are adequately managed through a risk management framework comprising of limits, triggers, monitoring and reporting process that is in accordance with the risk appetite of the Board. Since 2014, our Internal Audit has been independently validating the internal risk measurement models – VaR, EaR and MCO – on an annual basis. The latest validation results concluded that these internal risk measurement models are appropriate for the measurement of its market, interest rate, and liquidity risks, respectively. On stress testing, an Integrated Stress Testing framework (IST) is in place in addition to the silo stress tests. The IST complements the Internal Models Approach which is the basis for ICAAP capital charge under normal environment. The IST framework allows the Bank to evaluate its overall vulnerabilities on specific events or crisis and gauge its ability to withstand stress events. RMG continues to enhance its processes and metrics to support these objectives. Credit Risk Our policies for managing credit risk are determined at the business level with specific procedures for different risk environments and business goals. Risk limits and thresholds have been established to monitor and manage credit risk from individual and counterparties and/or group of counterparties, and industry sectors. Periodic assessments are also conducted to review the creditworthiness of our counterparties. We have an existing Internal Credit Risk Rating System (ICRRS) to measure in a consistent manner the credit risk for corporate borrowers with total assets, total facilities, or total exposures amounting to P15 million and above. For retail and small and medium entities and individual loan accounts, we have a credit scoring system, the Borrower Credit Score (BCS). There is also an existing application scorecard for consumer loans (auto loans, housing loans, credit card).
30
In addition, the Board approved a Sovereign Risk Rating Model in 2016 to assess the strength of the country rated with reference to its economic fundamentals, fiscal policy, institutional strength, and vulnerability to extreme events. In 2014, RMG engaged Moody‘s Analytics for the quantitative and qualitative validation of the internal CRRS, which was followed by the model recalibration in 2015. In 2016, with the assistance of Teradata as our technology provider, RMG completed the statistical validation of the BCS using the same methodology applied to the validation of the corporate risk rating model. A validation of the recalibrated ICRRS and BCS models were performed by RMG in 2017 and 2018. Operational, Business Continuity Management (BCM) and Information Technology (IT) Risk The Bank has established an Operational Risk Management Framework which forms part of its enterprise-wide risk management system. It outlines the policies, processes and procedures and the tools introduced to implement an effective operational risk management system covering all the business and operating units of the Bank as well as its subsidiaries. Among the tools that are already in place that provides the Bank with the ability to identify and assess material operational risks include the Risk & Control Self-Assessment (RCSA) and the Key Risk Indicators (KRI). Both financial and non-financial impacts of operational risk are captured for this purpose. Specific to Information Technology, the Bank has established a robust IT Risk Management Framework anchored on its business strategy, capabilities, and risk appetite. The IT Risk Management practices of the Bank is governed by the standards and operating principles provided in BSP Circular No. 808 (Guidelines on IT Risk Management) and BSP Circular No. 982 (Enhanced Guidelines on Information Security Management). The IT risk assessment process serves as the main tool of the Bank in identifying vulnerabilities and determining the effectiveness of IT controls. Recognizing the major disruptions that extreme events may cause to the Bank‘s operations, an extensive Business Continuity Management (BCM) program was developed as an integral part of its operational risk management system. The BCM was designed to enable the Bank to immediately resume critical operations and minimize adverse effect to the business of a major disruption. Included in the program are the resiliency strategies, recovery procedures and facilities, business continuity and crisis management plans. Tests and simulation exercises are regularly performed in varying degrees. In addition, the Bank‘s recognition of the evolving cyber-threat landscape prompted the development of a Cyber Resilience Framework. The framework is a supplement to the Bank‘s Information Security Management System (ISMS) & BCM program which provides the details related to the preparations and measures needed to protect the Bank‘s disaster recovery infrastructure against cyber-attacks. Trust Risk We manage our trust risk based on the regulations specified in BSP Circular 766 or the Guidelines in Strengthening Corporate Governance and Risk Management Practices on Trust, Other Fiduciary Business, and Investment Management Activities. RMG continues to strengthen China Bank‘s risk management practices on Trust by enhancing the policies, processes, and procedures for market risk, liquidity risk, credit risk, operational risk and compliance risks specific to our Trust business. Legal, strategic, and reputational risks were also incorporated in the Trust Risk Management Guidelines. In 2018, additional risk metric, Management Action Trigger for Private Bonds was implemented and MAT framework for UITF were updated. (q) Additional requirements as to certain issues or issuers. Not Applicable
(i) Debt Issues (ii) Investment Company Securities
31
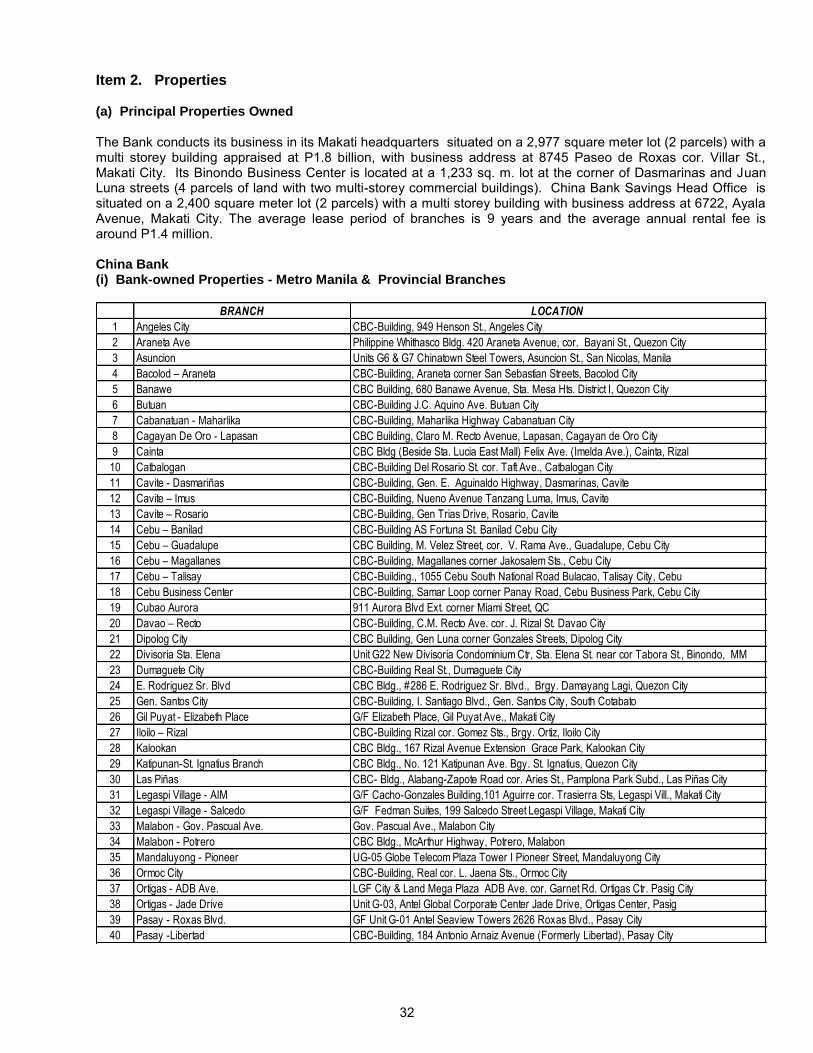
Item 2. Properties (a) Principal Properties Owned The Bank conducts its business in its Makati headquarters situated on a 2,977 square meter lot (2 parcels) with a multi storey building appraised at P1.8 billion, with business address at 8745 Paseo de Roxas cor. Villar St., Makati City. Its Binondo Business Center is located at a 1,233 sq. m. lot at the corner of Dasmarinas and Juan Luna streets (4 parcels of land with two multi-storey commercial buildings). China Bank Savings Head Office is situated on a 2,400 square meter lot (2 parcels) with a multi storey building with business address at 6722, Ayala Avenue, Makati City. The average lease period of branches is 9 years and the average annual rental fee is around P1.4 million.
China Bank (i) Bank-owned Properties - Metro Manila & Provincial Branches
BRANCH
1 Angeles City CBC-Building, 949 Henson St., Angeles City
2 Araneta Ave Philippine Whithasco Bldg. 420 Araneta Avenue, cor. Bayani St., Quezon City
3 Asuncion Units G6 & G7 Chinatown Steel Towers, Asuncion St., San Nicolas, Manila
4 Bacolod – Araneta CBC-Building, Araneta corner San Sebastian Streets, Bacolod City
5 Banawe CBC Building, 680 Banawe Avenue, Sta. Mesa Hts. District I, Quezon City
6 Butuan CBC-Building J.C. Aquino Ave. Butuan City
7 Cabanatuan - Maharlika CBC-Building, Maharlika Highway Cabanatuan City
8 Cagayan De Oro - Lapasan CBC Building, Claro M. Recto Avenue, Lapasan, Cagayan de Oro City
9 Cainta CBC Bldg (Beside Sta. Lucia East Mall) Felix Ave. (Imelda Ave.), Cainta, Rizal
10 Catbalogan CBC-Building Del Rosario St. cor. Taft Ave., Catbalogan City
11 Cavite - Dasmariñas CBC-Building, Gen. E. Aguinaldo Highway, Dasmarinas, Cavite
12 Cavite – Imus CBC-Building, Nueno Avenue Tanzang Luma, Imus, Cavite
13 Cavite – Rosario CBC-Building, Gen Trias Drive, Rosario, Cavite
14 Cebu – Banilad CBC-Building AS Fortuna St. Banilad Cebu City
15 Cebu – Guadalupe CBC Building, M. Velez Street, cor. V. Rama Ave., Guadalupe, Cebu City
16 Cebu – Magallanes CBC-Building, Magallanes corner Jakosalem Sts., Cebu City
17 Cebu – Talisay CBC-Building., 1055 Cebu South National Road Bulacao, Talisay City, Cebu
18 Cebu Business Center CBC-Building, Samar Loop corner Panay Road, Cebu Business Park, Cebu City
19 Cubao Aurora 911 Aurora Blvd Ext. corner Miami Street, QC
20 Davao – Recto CBC-Building, C.M. Recto Ave. cor. J. Rizal St. Davao City
21 Dipolog City CBC Building, Gen Luna corner Gonzales Streets, Dipolog City
22 Divisoria Sta. Elena Unit G22 New Divisoria Condominium Ctr, Sta. Elena St. near cor Tabora St., Binondo, MM
23 Dumaguete City CBC-Building Real St., Dumaguete City
24 E. Rodriguez Sr. Blvd CBC Bldg., #286 E. Rodriguez Sr. Blvd., Brgy. Damayang Lagi, Quezon City
25 Gen. Santos City CBC-Building, I. Santiago Blvd., Gen. Santos City, South Cotabato
26 Gil Puyat - Elizabeth Place G/F Elizabeth Place, Gil Puyat Ave., Makati City
27 Iloilo – Rizal CBC-Building Rizal cor. Gomez Sts., Brgy. Ortiz, Iloilo City
28 Kalookan CBC Bldg., 167 Rizal Avenue Extension Grace Park, Kalookan City
29 Katipunan-St. Ignatius Branch CBC Bldg., No. 121 Katipunan Ave. Bgy. St. Ignatius, Quezon City
30 Las Piñas CBC- Bldg., Alabang-Zapote Road cor. Aries St., Pamplona Park Subd., Las Piñas City
31 Legaspi Village - AIM G/F Cacho-Gonzales Building,101 Aguirre cor. Trasierra Sts, Legaspi Vill., Makati City
32 Legaspi Village - Salcedo G/F Fedman Suites, 199 Salcedo Street Legaspi Village, Makati City
33 Malabon - Gov. Pascual Ave. Gov. Pascual Ave., Malabon City
34 Malabon - Potrero CBC Bldg., McArthur Highway, Potrero, Malabon
35 Mandaluyong - Pioneer UG-05 Globe Telecom Plaza Tower I Pioneer Street, Mandaluyong City
36 Ormoc City CBC-Building, Real cor. L. Jaena Sts., Ormoc City
37 Ortigas - ADB Ave. LGF City & Land Mega Plaza ADB Ave. cor. Garnet Rd. Ortigas Ctr. Pasig City
38 Ortigas - Jade Drive Unit G-03, Antel Global Corporate Center Jade Drive, Ortigas Center, Pasig
39 Pasay - Roxas Blvd. GF Unit G-01 Antel Seaview Towers 2626 Roxas Blvd., Pasay City
40 Pasay -Libertad CBC-Building, 184 Antonio Arnaiz Avenue (Formerly Libertad), Pasay City
LOCATION
32
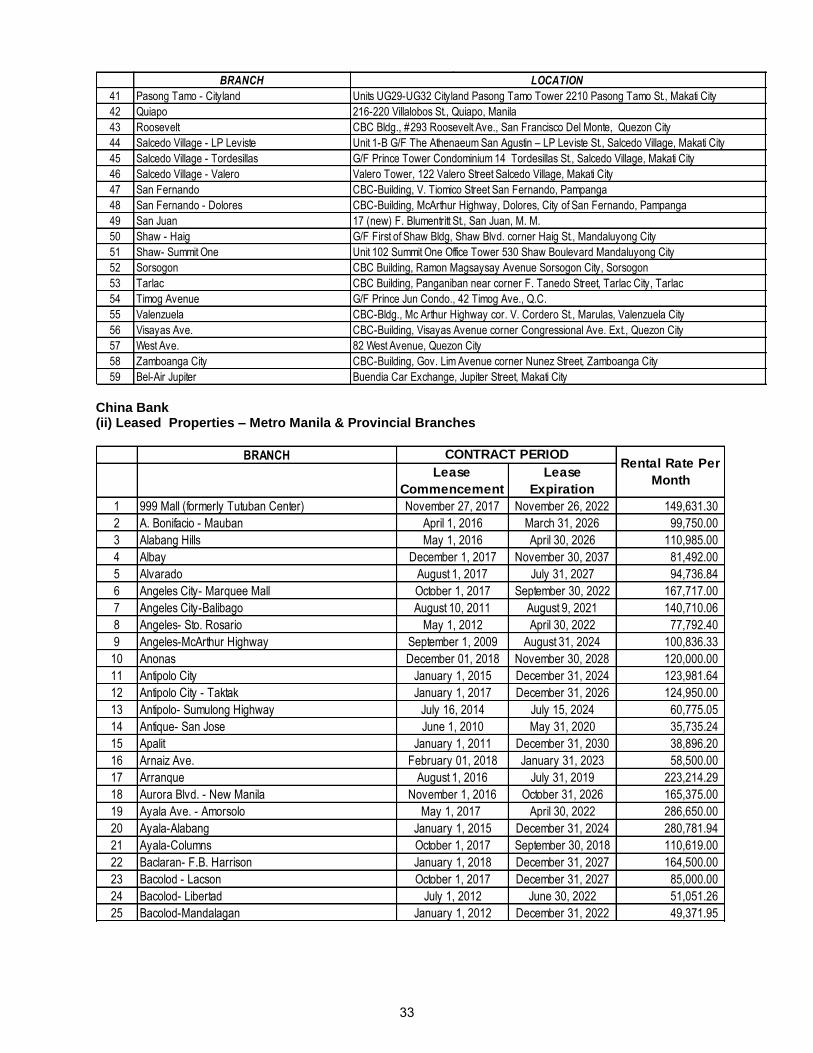
BRANCH
41 Pasong Tamo - Cityland Units UG29-UG32 Cityland Pasong Tamo Tower 2210 Pasong Tamo St., Makati City
42 Quiapo 216-220 Villalobos St., Quiapo, Manila
43 Roosevelt CBC Bldg., #293 Roosevelt Ave., San Francisco Del Monte, Quezon City
44 Salcedo Village - LP Leviste Unit 1-B G/F The Athenaeum San Agustin – LP Leviste St., Salcedo Village, Makati City
45 Salcedo Village - Tordesillas G/F Prince Tower Condominium 14 Tordesillas St., Salcedo Village, Makati City
46 Salcedo Village - Valero Valero Tower, 122 Valero Street Salcedo Village, Makati City
47 San Fernando CBC-Building, V. Tiomico Street San Fernando, Pampanga
48 San Fernando - Dolores CBC-Building, McArthur Highway, Dolores, City of San Fernando, Pampanga
49 San Juan 17 (new) F. Blumentritt St., San Juan, M. M.
50 Shaw - Haig G/F First of Shaw Bldg, Shaw Blvd. corner Haig St., Mandaluyong City
51 Shaw- Summit One Unit 102 Summit One Office Tower 530 Shaw Boulevard Mandaluyong City
52 Sorsogon CBC Building, Ramon Magsaysay Avenue Sorsogon City, Sorsogon
53 Tarlac CBC Building, Panganiban near corner F. Tanedo Street, Tarlac City, Tarlac
54 Timog Avenue G/F Prince Jun Condo., 42 Timog Ave., Q.C.
55 Valenzuela CBC-Bldg., Mc Arthur Highway cor. V. Cordero St., Marulas, Valenzuela City
56 Visayas Ave. CBC-Building, Visayas Avenue corner Congressional Ave. Ext., Quezon City
57 West Ave. 82 West Avenue, Quezon City
58 Zamboanga City CBC-Building, Gov. Lim Avenue corner Nunez Street, Zamboanga City
59 Bel-Air Jupiter Buendia Car Exchange, Jupiter Street, Makati City
LOCATION
China Bank (ii) Leased Properties – Metro Manila & Provincial Branches
BRANCH
Lease
Commencement
Lease
Expiration
1 999 Mall (formerly Tutuban Center) November 27, 2017 November 26, 2022 149,631.30
2 A. Bonifacio - Mauban April 1, 2016 March 31, 2026 99,750.00
3 Alabang Hills May 1, 2016 April 30, 2026 110,985.00
4 Albay December 1, 2017 November 30, 2037 81,492.00
5 Alvarado August 1, 2017 July 31, 2027 94,736.84
6 Angeles City- Marquee Mall October 1, 2017 September 30, 2022 167,717.00
7 Angeles City-Balibago August 10, 2011 August 9, 2021 140,710.06
8 Angeles- Sto. Rosario May 1, 2012 April 30, 2022 77,792.40
9 Angeles-McArthur Highway September 1, 2009 August 31, 2024 100,836.33
10 Anonas December 01, 2018 November 30, 2028 120,000.00
11 Antipolo City January 1, 2015 December 31, 2024 123,981.64
12 Antipolo City - Taktak January 1, 2017 December 31, 2026 124,950.00
13 Antipolo- Sumulong Highway July 16, 2014 July 15, 2024 60,775.05
14 Antique- San Jose June 1, 2010 May 31, 2020 35,735.24
15 Apalit January 1, 2011 December 31, 2030 38,896.20
16 Arnaiz Ave. February 01, 2018 January 31, 2023 58,500.00
17 Arranque August 1, 2016 July 31, 2019 223,214.29
18 Aurora Blvd. - New Manila November 1, 2016 October 31, 2026 165,375.00
19 Ayala Ave. - Amorsolo May 1, 2017 April 30, 2022 286,650.00
20 Ayala-Alabang January 1, 2015 December 31, 2024 280,781.94
21 Ayala-Columns October 1, 2017 September 30, 2018 110,619.00
22 Baclaran- F.B. Harrison January 1, 2018 December 31, 2027 164,500.00
23 Bacolod - Lacson October 1, 2017 December 31, 2027 85,000.00
24 Bacolod- Libertad July 1, 2012 June 30, 2022 51,051.26
25 Bacolod-Mandalagan January 1, 2012 December 31, 2022 49,371.95
CONTRACT PERIODRental Rate Per
Month
33
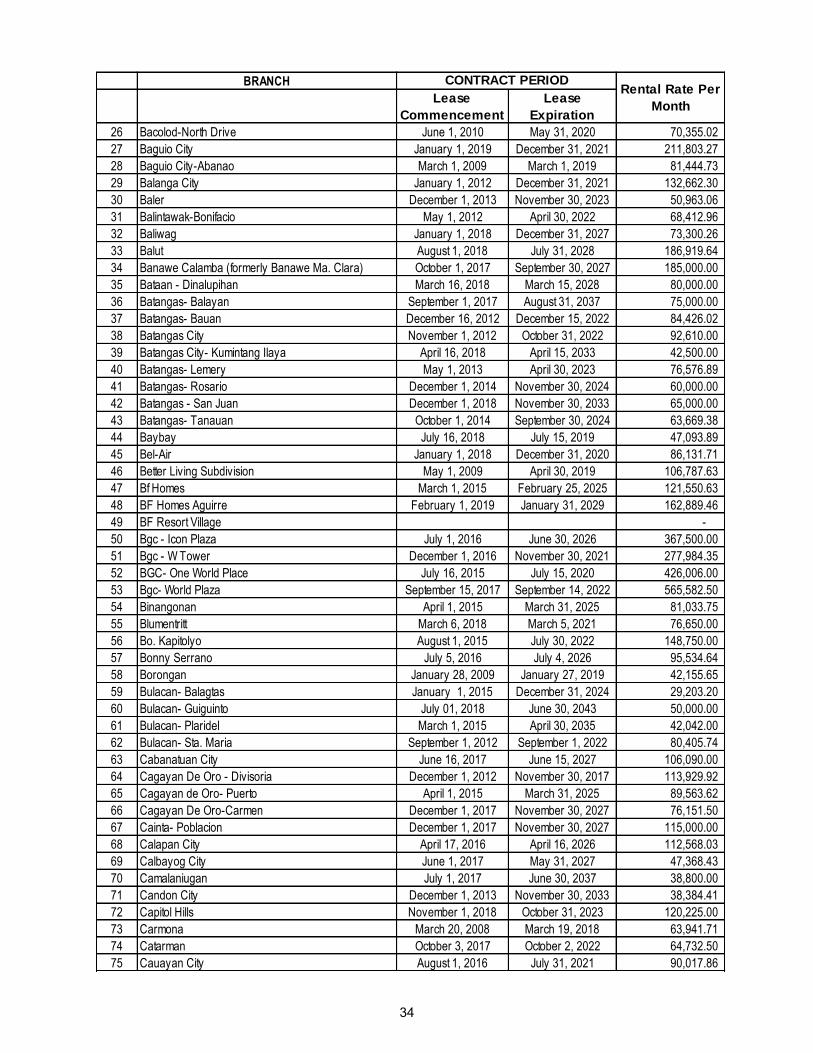
BRANCH
Lease
Commencement
Lease
Expiration
26 Bacolod-North Drive June 1, 2010 May 31, 2020 70,355.02
27 Baguio City January 1, 2019 December 31, 2021 211,803.27
28 Baguio City-Abanao March 1, 2009 March 1, 2019 81,444.73
29 Balanga City January 1, 2012 December 31, 2021 132,662.30
30 Baler December 1, 2013 November 30, 2023 50,963.06
31 Balintawak-Bonifacio May 1, 2012 April 30, 2022 68,412.96
32 Baliwag January 1, 2018 December 31, 2027 73,300.26
33 Balut August 1, 2018 July 31, 2028 186,919.64
34 Banawe Calamba (formerly Banawe Ma. Clara) October 1, 2017 September 30, 2027 185,000.00
35 Bataan - Dinalupihan March 16, 2018 March 15, 2028 80,000.00
36 Batangas- Balayan September 1, 2017 August 31, 2037 75,000.00
37 Batangas- Bauan December 16, 2012 December 15, 2022 84,426.02
38 Batangas City November 1, 2012 October 31, 2022 92,610.00
39 Batangas City- Kumintang Ilaya April 16, 2018 April 15, 2033 42,500.00
40 Batangas- Lemery May 1, 2013 April 30, 2023 76,576.89
41 Batangas- Rosario December 1, 2014 November 30, 2024 60,000.00
42 Batangas - San Juan December 1, 2018 November 30, 2033 65,000.00
43 Batangas- Tanauan October 1, 2014 September 30, 2024 63,669.38
44 Baybay July 16, 2018 July 15, 2019 47,093.89
45 Bel-Air January 1, 2018 December 31, 2020 86,131.71
46 Better Living Subdivision May 1, 2009 April 30, 2019 106,787.63
47 Bf Homes March 1, 2015 February 25, 2025 121,550.63
48 BF Homes Aguirre February 1, 2019 January 31, 2029 162,889.46
49 BF Resort Village -
50 Bgc - Icon Plaza July 1, 2016 June 30, 2026 367,500.00
51 Bgc - W Tower December 1, 2016 November 30, 2021 277,984.35
52 BGC- One World Place July 16, 2015 July 15, 2020 426,006.00
53 Bgc- World Plaza September 15, 2017 September 14, 2022 565,582.50
54 Binangonan April 1, 2015 March 31, 2025 81,033.75
55 Blumentritt March 6, 2018 March 5, 2021 76,650.00
56 Bo. Kapitolyo August 1, 2015 July 30, 2022 148,750.00
57 Bonny Serrano July 5, 2016 July 4, 2026 95,534.64
58 Borongan January 28, 2009 January 27, 2019 42,155.65
59 Bulacan- Balagtas January 1, 2015 December 31, 2024 29,203.20
60 Bulacan- Guiguinto July 01, 2018 June 30, 2043 50,000.00
61 Bulacan- Plaridel March 1, 2015 April 30, 2035 42,042.00
62 Bulacan- Sta. Maria September 1, 2012 September 1, 2022 80,405.74
63 Cabanatuan City June 16, 2017 June 15, 2027 106,090.00
64 Cagayan De Oro - Divisoria December 1, 2012 November 30, 2017 113,929.92
65 Cagayan de Oro- Puerto April 1, 2015 March 31, 2025 89,563.62
66 Cagayan De Oro-Carmen December 1, 2017 November 30, 2027 76,151.50
67 Cainta- Poblacion December 1, 2017 November 30, 2027 115,000.00
68 Calapan City April 17, 2016 April 16, 2026 112,568.03
69 Calbayog City June 1, 2017 May 31, 2027 47,368.43
70 Camalaniugan July 1, 2017 June 30, 2037 38,800.00
71 Candon City December 1, 2013 November 30, 2033 38,384.41
72 Capitol Hills November 1, 2018 October 31, 2023 120,225.00
73 Carmona March 20, 2008 March 19, 2018 63,941.71
74 Catarman October 3, 2017 October 2, 2022 64,732.50
75 Cauayan City August 1, 2016 July 31, 2021 90,017.86
CONTRACT PERIODRental Rate Per
Month
34
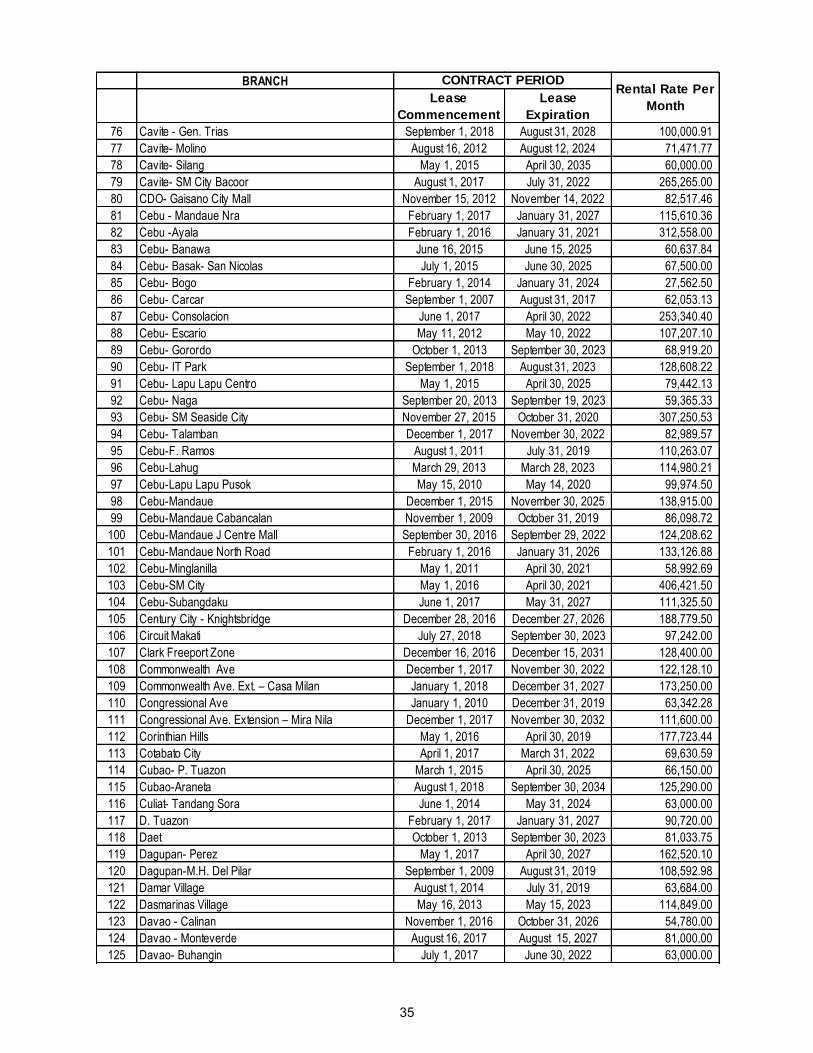
BRANCH
Lease
Commencement
Lease
Expiration
76 Cavite - Gen. Trias September 1, 2018 August 31, 2028 100,000.91
77 Cavite- Molino August 16, 2012 August 12, 2024 71,471.77
78 Cavite- Silang May 1, 2015 April 30, 2035 60,000.00
79 Cavite- SM City Bacoor August 1, 2017 July 31, 2022 265,265.00
80 CDO- Gaisano City Mall November 15, 2012 November 14, 2022 82,517.46
81 Cebu - Mandaue Nra February 1, 2017 January 31, 2027 115,610.36
82 Cebu -Ayala February 1, 2016 January 31, 2021 312,558.00
83 Cebu- Banawa June 16, 2015 June 15, 2025 60,637.84
84 Cebu- Basak- San Nicolas July 1, 2015 June 30, 2025 67,500.00
85 Cebu- Bogo February 1, 2014 January 31, 2024 27,562.50
86 Cebu- Carcar September 1, 2007 August 31, 2017 62,053.13
87 Cebu- Consolacion June 1, 2017 April 30, 2022 253,340.40
88 Cebu- Escario May 11, 2012 May 10, 2022 107,207.10
89 Cebu- Gorordo October 1, 2013 September 30, 2023 68,919.20
90 Cebu- IT Park September 1, 2018 August 31, 2023 128,608.22
91 Cebu- Lapu Lapu Centro May 1, 2015 April 30, 2025 79,442.13
92 Cebu- Naga September 20, 2013 September 19, 2023 59,365.33
93 Cebu- SM Seaside City November 27, 2015 October 31, 2020 307,250.53
94 Cebu- Talamban December 1, 2017 November 30, 2022 82,989.57
95 Cebu-F. Ramos August 1, 2011 July 31, 2019 110,263.07
96 Cebu-Lahug March 29, 2013 March 28, 2023 114,980.21
97 Cebu-Lapu Lapu Pusok May 15, 2010 May 14, 2020 99,974.50
98 Cebu-Mandaue December 1, 2015 November 30, 2025 138,915.00
99 Cebu-Mandaue Cabancalan November 1, 2009 October 31, 2019 86,098.72
100 Cebu-Mandaue J Centre Mall September 30, 2016 September 29, 2022 124,208.62
101 Cebu-Mandaue North Road February 1, 2016 January 31, 2026 133,126.88
102 Cebu-Minglanilla May 1, 2011 April 30, 2021 58,992.69
103 Cebu-SM City May 1, 2016 April 30, 2021 406,421.50
104 Cebu-Subangdaku June 1, 2017 May 31, 2027 111,325.50
105 Century City - Knightsbridge December 28, 2016 December 27, 2026 188,779.50
106 Circuit Makati July 27, 2018 September 30, 2023 97,242.00
107 Clark Freeport Zone December 16, 2016 December 15, 2031 128,400.00
108 Commonwealth Ave December 1, 2017 November 30, 2022 122,128.10
109 Commonwealth Ave. Ext. – Casa Milan January 1, 2018 December 31, 2027 173,250.00
110 Congressional Ave January 1, 2010 December 31, 2019 63,342.28
111 Congressional Ave. Extension – Mira Nila December 1, 2017 November 30, 2032 111,600.00
112 Corinthian Hills May 1, 2016 April 30, 2019 177,723.44
113 Cotabato City April 1, 2017 March 31, 2022 69,630.59
114 Cubao- P. Tuazon March 1, 2015 April 30, 2025 66,150.00
115 Cubao-Araneta August 1, 2018 September 30, 2034 125,290.00
116 Culiat- Tandang Sora June 1, 2014 May 31, 2024 63,000.00
117 D. Tuazon February 1, 2017 January 31, 2027 90,720.00
118 Daet October 1, 2013 September 30, 2023 81,033.75
119 Dagupan- Perez May 1, 2017 April 30, 2027 162,520.10
120 Dagupan-M.H. Del Pilar September 1, 2009 August 31, 2019 108,592.98
121 Damar Village August 1, 2014 July 31, 2019 63,684.00
122 Dasmarinas Village May 16, 2013 May 15, 2023 114,849.00
123 Davao - Calinan November 1, 2016 October 31, 2026 54,780.00
124 Davao - Monteverde August 16, 2017 August 15, 2027 81,000.00
125 Davao- Buhangin July 1, 2017 June 30, 2022 63,000.00
CONTRACT PERIODRental Rate Per
Month
35
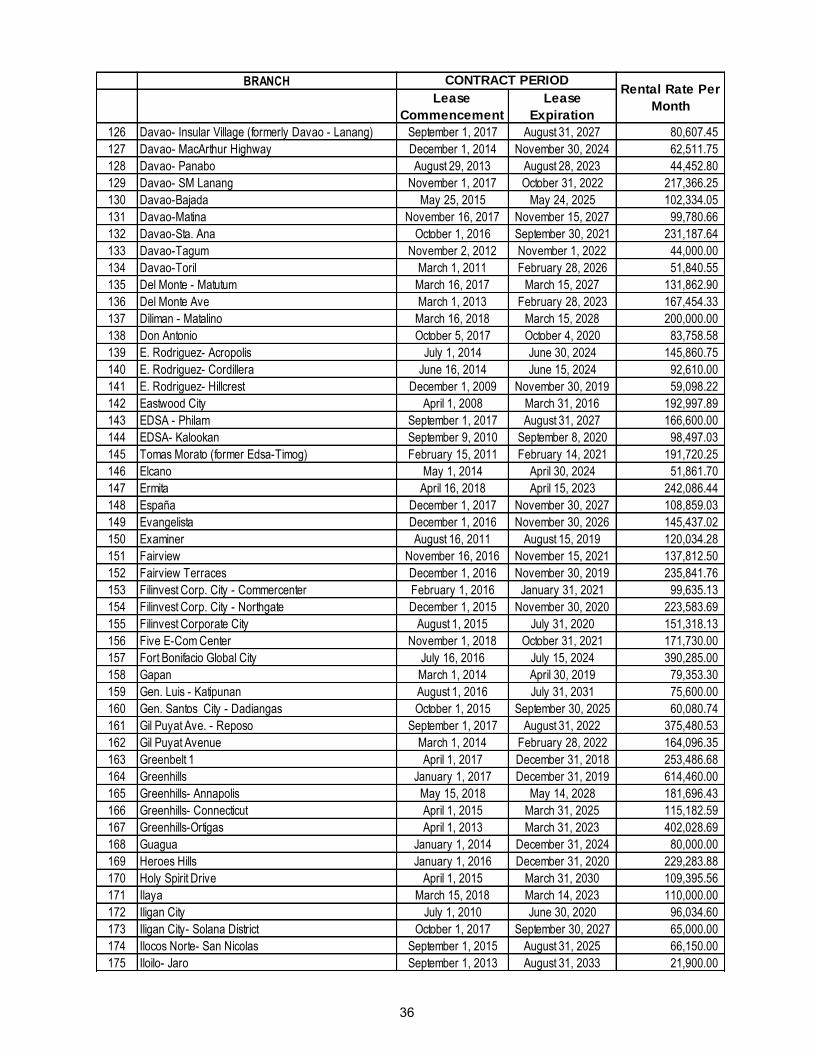
BRANCH
Lease
Commencement
Lease
Expiration
126 Davao- Insular Village (formerly Davao - Lanang) September 1, 2017 August 31, 2027 80,607.45
127 Davao- MacArthur Highway December 1, 2014 November 30, 2024 62,511.75
128 Davao- Panabo August 29, 2013 August 28, 2023 44,452.80
129 Davao- SM Lanang November 1, 2017 October 31, 2022 217,366.25
130 Davao-Bajada May 25, 2015 May 24, 2025 102,334.05
131 Davao-Matina November 16, 2017 November 15, 2027 99,780.66
132 Davao-Sta. Ana October 1, 2016 September 30, 2021 231,187.64
133 Davao-Tagum November 2, 2012 November 1, 2022 44,000.00
134 Davao-Toril March 1, 2011 February 28, 2026 51,840.55
135 Del Monte - Matutum March 16, 2017 March 15, 2027 131,862.90
136 Del Monte Ave March 1, 2013 February 28, 2023 167,454.33
137 Diliman - Matalino March 16, 2018 March 15, 2028 200,000.00
138 Don Antonio October 5, 2017 October 4, 2020 83,758.58
139 E. Rodriguez- Acropolis July 1, 2014 June 30, 2024 145,860.75
140 E. Rodriguez- Cordillera June 16, 2014 June 15, 2024 92,610.00
141 E. Rodriguez- Hillcrest December 1, 2009 November 30, 2019 59,098.22
142 Eastwood City April 1, 2008 March 31, 2016 192,997.89
143 EDSA - Philam September 1, 2017 August 31, 2027 166,600.00
144 EDSA- Kalookan September 9, 2010 September 8, 2020 98,497.03
145 Tomas Morato (former Edsa-Timog) February 15, 2011 February 14, 2021 191,720.25
146 Elcano May 1, 2014 April 30, 2024 51,861.70
147 Ermita April 16, 2018 April 15, 2023 242,086.44
148 España December 1, 2017 November 30, 2027 108,859.03
149 Evangelista December 1, 2016 November 30, 2026 145,437.02
150 Examiner August 16, 2011 August 15, 2019 120,034.28
151 Fairview November 16, 2016 November 15, 2021 137,812.50
152 Fairview Terraces December 1, 2016 November 30, 2019 235,841.76
153 Filinvest Corp. City - Commercenter February 1, 2016 January 31, 2021 99,635.13
154 Filinvest Corp. City - Northgate December 1, 2015 November 30, 2020 223,583.69
155 Filinvest Corporate City August 1, 2015 July 31, 2020 151,318.13
156 Five E-Com Center November 1, 2018 October 31, 2021 171,730.00
157 Fort Bonifacio Global City July 16, 2016 July 15, 2024 390,285.00
158 Gapan March 1, 2014 April 30, 2019 79,353.30
159 Gen. Luis - Katipunan August 1, 2016 July 31, 2031 75,600.00
160 Gen. Santos City - Dadiangas October 1, 2015 September 30, 2025 60,080.74
161 Gil Puyat Ave. - Reposo September 1, 2017 August 31, 2022 375,480.53
162 Gil Puyat Avenue March 1, 2014 February 28, 2022 164,096.35
163 Greenbelt 1 April 1, 2017 December 31, 2018 253,486.68
164 Greenhills January 1, 2017 December 31, 2019 614,460.00
165 Greenhills- Annapolis May 15, 2018 May 14, 2028 181,696.43
166 Greenhills- Connecticut April 1, 2015 March 31, 2025 115,182.59
167 Greenhills-Ortigas April 1, 2013 March 31, 2023 402,028.69
168 Guagua January 1, 2014 December 31, 2024 80,000.00
169 Heroes Hills January 1, 2016 December 31, 2020 229,283.88
170 Holy Spirit Drive April 1, 2015 March 31, 2030 109,395.56
171 Ilaya March 15, 2018 March 14, 2023 110,000.00
172 Iligan City July 1, 2010 June 30, 2020 96,034.60
173 Iligan City- Solana District October 1, 2017 September 30, 2027 65,000.00
174 Ilocos Norte- San Nicolas September 1, 2015 August 31, 2025 66,150.00
175 Iloilo- Jaro September 1, 2013 August 31, 2033 21,900.00
CONTRACT PERIODRental Rate Per
Month
36
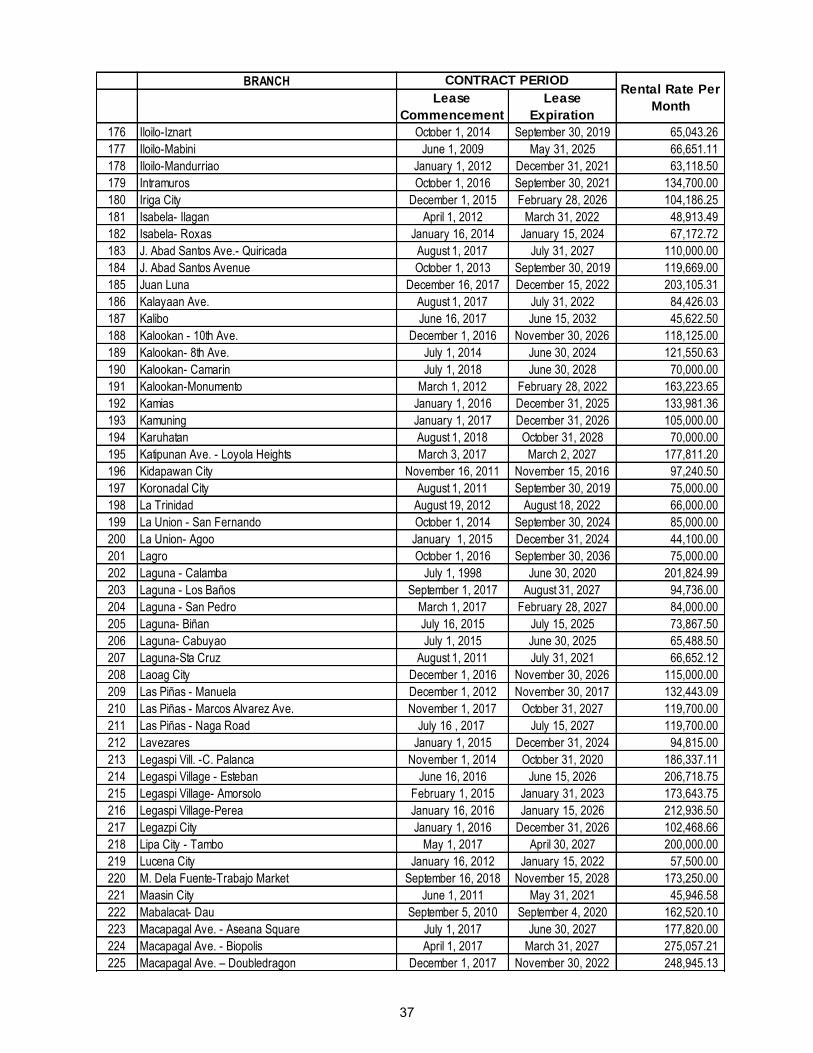
BRANCH
Lease
Commencement
Lease
Expiration
176 Iloilo-Iznart October 1, 2014 September 30, 2019 65,043.26
177 Iloilo-Mabini June 1, 2009 May 31, 2025 66,651.11
178 Iloilo-Mandurriao January 1, 2012 December 31, 2021 63,118.50
179 Intramuros October 1, 2016 September 30, 2021 134,700.00
180 Iriga City December 1, 2015 February 28, 2026 104,186.25
181 Isabela- Ilagan April 1, 2012 March 31, 2022 48,913.49
182 Isabela- Roxas January 16, 2014 January 15, 2024 67,172.72
183 J. Abad Santos Ave.- Quiricada August 1, 2017 July 31, 2027 110,000.00
184 J. Abad Santos Avenue October 1, 2013 September 30, 2019 119,669.00
185 Juan Luna December 16, 2017 December 15, 2022 203,105.31
186 Kalayaan Ave. August 1, 2017 July 31, 2022 84,426.03
187 Kalibo June 16, 2017 June 15, 2032 45,622.50
188 Kalookan - 10th Ave. December 1, 2016 November 30, 2026 118,125.00
189 Kalookan- 8th Ave. July 1, 2014 June 30, 2024 121,550.63
190 Kalookan- Camarin July 1, 2018 June 30, 2028 70,000.00
191 Kalookan-Monumento March 1, 2012 February 28, 2022 163,223.65
192 Kamias January 1, 2016 December 31, 2025 133,981.36
193 Kamuning January 1, 2017 December 31, 2026 105,000.00
194 Karuhatan August 1, 2018 October 31, 2028 70,000.00
195 Katipunan Ave. - Loyola Heights March 3, 2017 March 2, 2027 177,811.20
196 Kidapawan City November 16, 2011 November 15, 2016 97,240.50
197 Koronadal City August 1, 2011 September 30, 2019 75,000.00
198 La Trinidad August 19, 2012 August 18, 2022 66,000.00
199 La Union - San Fernando October 1, 2014 September 30, 2024 85,000.00
200 La Union- Agoo January 1, 2015 December 31, 2024 44,100.00
201 Lagro October 1, 2016 September 30, 2036 75,000.00
202 Laguna - Calamba July 1, 1998 June 30, 2020 201,824.99
203 Laguna - Los Baños September 1, 2017 August 31, 2027 94,736.00
204 Laguna - San Pedro March 1, 2017 February 28, 2027 84,000.00
205 Laguna- Biñan July 16, 2015 July 15, 2025 73,867.50
206 Laguna- Cabuyao July 1, 2015 June 30, 2025 65,488.50
207 Laguna-Sta Cruz August 1, 2011 July 31, 2021 66,652.12
208 Laoag City December 1, 2016 November 30, 2026 115,000.00
209 Las Piñas - Manuela December 1, 2012 November 30, 2017 132,443.09
210 Las Piñas - Marcos Alvarez Ave. November 1, 2017 October 31, 2027 119,700.00
211 Las Piñas - Naga Road July 16 , 2017 July 15, 2027 119,700.00
212 Lavezares January 1, 2015 December 31, 2024 94,815.00
213 Legaspi Vill. -C. Palanca November 1, 2014 October 31, 2020 186,337.11
214 Legaspi Village - Esteban June 16, 2016 June 15, 2026 206,718.75
215 Legaspi Village- Amorsolo February 1, 2015 January 31, 2023 173,643.75
216 Legaspi Village-Perea January 16, 2016 January 15, 2026 212,936.50
217 Legazpi City January 1, 2016 December 31, 2026 102,468.66
218 Lipa City - Tambo May 1, 2017 April 30, 2027 200,000.00
219 Lucena City January 16, 2012 January 15, 2022 57,500.00
220 M. Dela Fuente-Trabajo Market September 16, 2018 November 15, 2028 173,250.00
221 Maasin City June 1, 2011 May 31, 2021 45,946.58
222 Mabalacat- Dau September 5, 2010 September 4, 2020 162,520.10
223 Macapagal Ave. - Aseana Square July 1, 2017 June 30, 2027 177,820.00
224 Macapagal Ave. - Biopolis April 1, 2017 March 31, 2027 275,057.21
225 Macapagal Ave. – Doubledragon December 1, 2017 November 30, 2022 248,945.13
CONTRACT PERIODRental Rate Per
Month
37
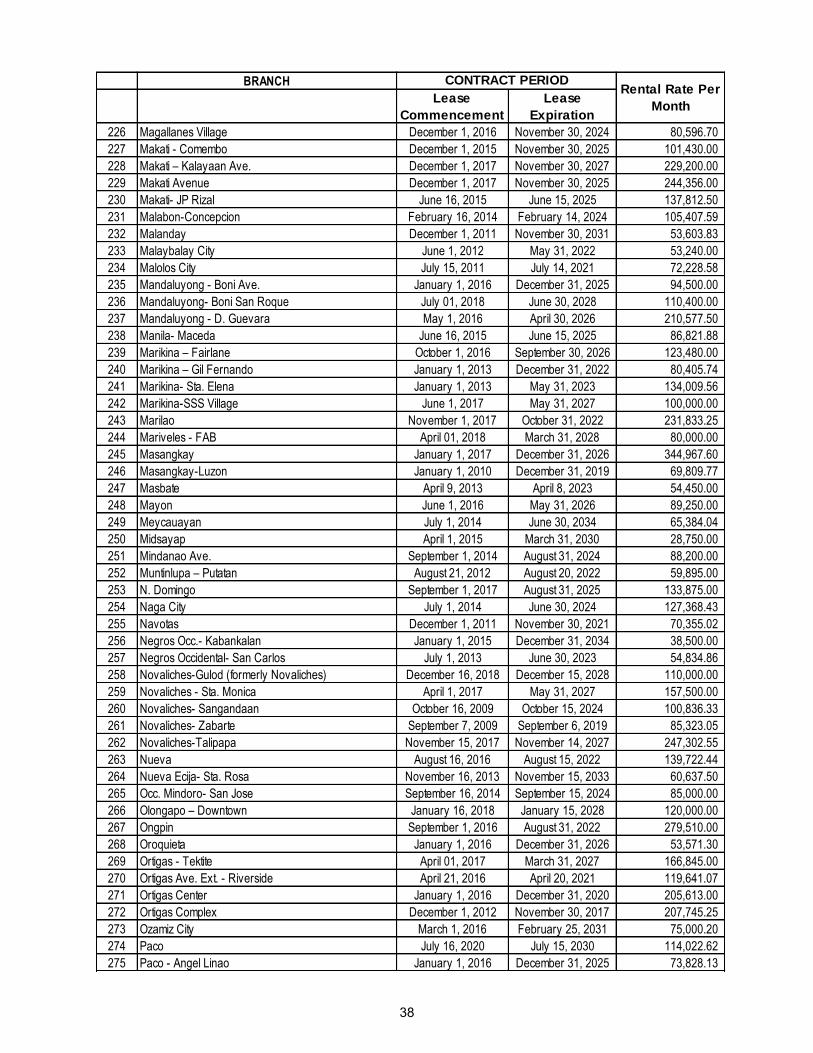
BRANCH
Lease
Commencement
Lease
Expiration
226 Magallanes Village December 1, 2016 November 30, 2024 80,596.70
227 Makati - Comembo December 1, 2015 November 30, 2025 101,430.00
228 Makati – Kalayaan Ave. December 1, 2017 November 30, 2027 229,200.00
229 Makati Avenue December 1, 2017 November 30, 2025 244,356.00
230 Makati- JP Rizal June 16, 2015 June 15, 2025 137,812.50
231 Malabon-Concepcion February 16, 2014 February 14, 2024 105,407.59
232 Malanday December 1, 2011 November 30, 2031 53,603.83
233 Malaybalay City June 1, 2012 May 31, 2022 53,240.00
234 Malolos City July 15, 2011 July 14, 2021 72,228.58
235 Mandaluyong - Boni Ave. January 1, 2016 December 31, 2025 94,500.00
236 Mandaluyong- Boni San Roque July 01, 2018 June 30, 2028 110,400.00
237 Mandaluyong - D. Guevara May 1, 2016 April 30, 2026 210,577.50
238 Manila- Maceda June 16, 2015 June 15, 2025 86,821.88
239 Marikina – Fairlane October 1, 2016 September 30, 2026 123,480.00
240 Marikina – Gil Fernando January 1, 2013 December 31, 2022 80,405.74
241 Marikina- Sta. Elena January 1, 2013 May 31, 2023 134,009.56
242 Marikina-SSS Village June 1, 2017 May 31, 2027 100,000.00
243 Marilao November 1, 2017 October 31, 2022 231,833.25
244 Mariveles - FAB April 01, 2018 March 31, 2028 80,000.00
245 Masangkay January 1, 2017 December 31, 2026 344,967.60
246 Masangkay-Luzon January 1, 2010 December 31, 2019 69,809.77
247 Masbate April 9, 2013 April 8, 2023 54,450.00
248 Mayon June 1, 2016 May 31, 2026 89,250.00
249 Meycauayan July 1, 2014 June 30, 2034 65,384.04
250 Midsayap April 1, 2015 March 31, 2030 28,750.00
251 Mindanao Ave. September 1, 2014 August 31, 2024 88,200.00
252 Muntinlupa – Putatan August 21, 2012 August 20, 2022 59,895.00
253 N. Domingo September 1, 2017 August 31, 2025 133,875.00
254 Naga City July 1, 2014 June 30, 2024 127,368.43
255 Navotas December 1, 2011 November 30, 2021 70,355.02
256 Negros Occ.- Kabankalan January 1, 2015 December 31, 2034 38,500.00
257 Negros Occidental- San Carlos July 1, 2013 June 30, 2023 54,834.86
258 Novaliches-Gulod (formerly Novaliches) December 16, 2018 December 15, 2028 110,000.00
259 Novaliches - Sta. Monica April 1, 2017 May 31, 2027 157,500.00
260 Novaliches- Sangandaan October 16, 2009 October 15, 2024 100,836.33
261 Novaliches- Zabarte September 7, 2009 September 6, 2019 85,323.05
262 Novaliches-Talipapa November 15, 2017 November 14, 2027 247,302.55
263 Nueva August 16, 2016 August 15, 2022 139,722.44
264 Nueva Ecija- Sta. Rosa November 16, 2013 November 15, 2033 60,637.50
265 Occ. Mindoro- San Jose September 16, 2014 September 15, 2024 85,000.00
266 Olongapo – Downtown January 16, 2018 January 15, 2028 120,000.00
267 Ongpin September 1, 2016 August 31, 2022 279,510.00
268 Oroquieta January 1, 2016 December 31, 2026 53,571.30
269 Ortigas - Tektite April 01, 2017 March 31, 2027 166,845.00
270 Ortigas Ave. Ext. - Riverside April 21, 2016 April 20, 2021 119,641.07
271 Ortigas Center January 1, 2016 December 31, 2020 205,613.00
272 Ortigas Complex December 1, 2012 November 30, 2017 207,745.25
273 Ozamiz City March 1, 2016 February 25, 2031 75,000.20
274 Paco July 16, 2020 July 15, 2030 114,022.62
275 Paco - Angel Linao January 1, 2016 December 31, 2025 73,828.13
CONTRACT PERIODRental Rate Per
Month
38
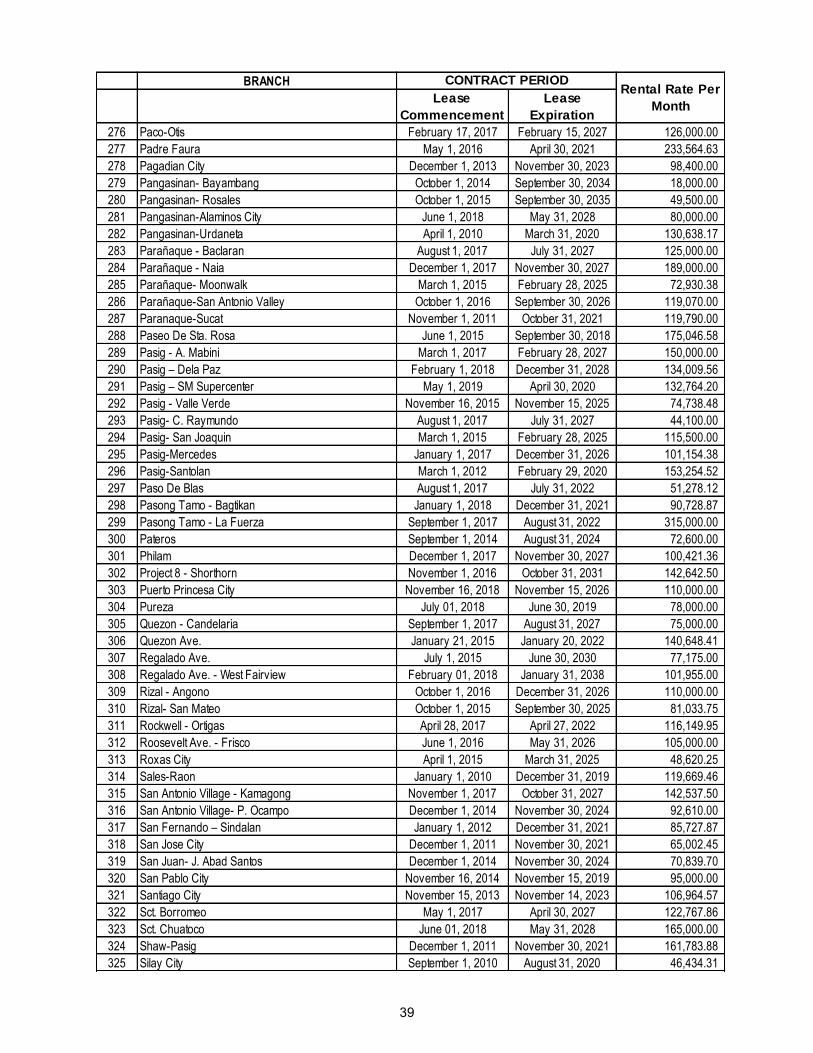
BRANCH
Lease
Commencement
Lease
Expiration
276 Paco-Otis February 17, 2017 February 15, 2027 126,000.00
277 Padre Faura May 1, 2016 April 30, 2021 233,564.63
278 Pagadian City December 1, 2013 November 30, 2023 98,400.00
279 Pangasinan- Bayambang October 1, 2014 September 30, 2034 18,000.00
280 Pangasinan- Rosales October 1, 2015 September 30, 2035 49,500.00
281 Pangasinan-Alaminos City June 1, 2018 May 31, 2028 80,000.00
282 Pangasinan-Urdaneta April 1, 2010 March 31, 2020 130,638.17
283 Parañaque - Baclaran August 1, 2017 July 31, 2027 125,000.00
284 Parañaque - Naia December 1, 2017 November 30, 2027 189,000.00
285 Parañaque- Moonwalk March 1, 2015 February 28, 2025 72,930.38
286 Parañaque-San Antonio Valley October 1, 2016 September 30, 2026 119,070.00
287 Paranaque-Sucat November 1, 2011 October 31, 2021 119,790.00
288 Paseo De Sta. Rosa June 1, 2015 September 30, 2018 175,046.58
289 Pasig - A. Mabini March 1, 2017 February 28, 2027 150,000.00
290 Pasig – Dela Paz February 1, 2018 December 31, 2028 134,009.56
291 Pasig – SM Supercenter May 1, 2019 April 30, 2020 132,764.20
292 Pasig - Valle Verde November 16, 2015 November 15, 2025 74,738.48
293 Pasig- C. Raymundo August 1, 2017 July 31, 2027 44,100.00
294 Pasig- San Joaquin March 1, 2015 February 28, 2025 115,500.00
295 Pasig-Mercedes January 1, 2017 December 31, 2026 101,154.38
296 Pasig-Santolan March 1, 2012 February 29, 2020 153,254.52
297 Paso De Blas August 1, 2017 July 31, 2022 51,278.12
298 Pasong Tamo - Bagtikan January 1, 2018 December 31, 2021 90,728.87
299 Pasong Tamo - La Fuerza September 1, 2017 August 31, 2022 315,000.00
300 Pateros September 1, 2014 August 31, 2024 72,600.00
301 Philam December 1, 2017 November 30, 2027 100,421.36
302 Project 8 - Shorthorn November 1, 2016 October 31, 2031 142,642.50
303 Puerto Princesa City November 16, 2018 November 15, 2026 110,000.00
304 Pureza July 01, 2018 June 30, 2019 78,000.00
305 Quezon - Candelaria September 1, 2017 August 31, 2027 75,000.00
306 Quezon Ave. January 21, 2015 January 20, 2022 140,648.41
307 Regalado Ave. July 1, 2015 June 30, 2030 77,175.00
308 Regalado Ave. - West Fairview February 01, 2018 January 31, 2038 101,955.00
309 Rizal - Angono October 1, 2016 December 31, 2026 110,000.00
310 Rizal- San Mateo October 1, 2015 September 30, 2025 81,033.75
311 Rockwell - Ortigas April 28, 2017 April 27, 2022 116,149.95
312 Roosevelt Ave. - Frisco June 1, 2016 May 31, 2026 105,000.00
313 Roxas City April 1, 2015 March 31, 2025 48,620.25
314 Sales-Raon January 1, 2010 December 31, 2019 119,669.46
315 San Antonio Village - Kamagong November 1, 2017 October 31, 2027 142,537.50
316 San Antonio Village- P. Ocampo December 1, 2014 November 30, 2024 92,610.00
317 San Fernando – Sindalan January 1, 2012 December 31, 2021 85,727.87
318 San Jose City December 1, 2011 November 30, 2021 65,002.45
319 San Juan- J. Abad Santos December 1, 2014 November 30, 2024 70,839.70
320 San Pablo City November 16, 2014 November 15, 2019 95,000.00
321 Santiago City November 15, 2013 November 14, 2023 106,964.57
322 Sct. Borromeo May 1, 2017 April 30, 2027 122,767.86
323 Sct. Chuatoco June 01, 2018 May 31, 2028 165,000.00
324 Shaw-Pasig December 1, 2011 November 30, 2021 161,783.88
325 Silay City September 1, 2010 August 31, 2020 46,434.31
CONTRACT PERIODRental Rate Per
Month
39
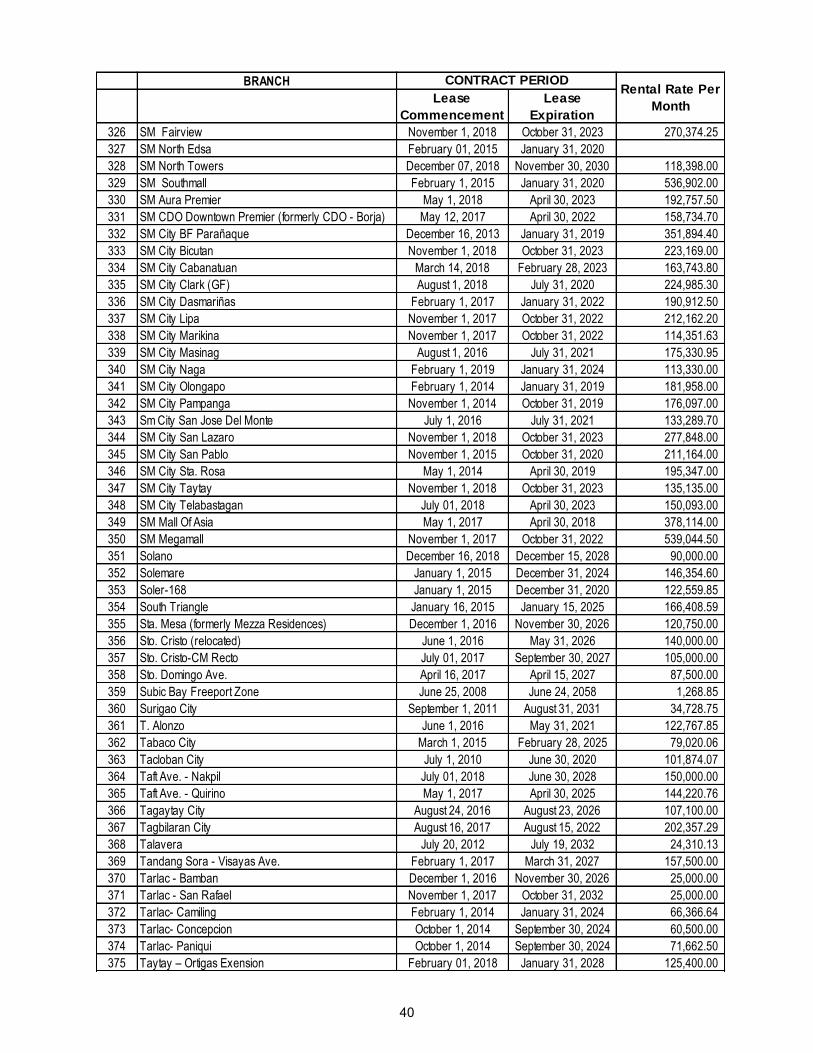
BRANCH
Lease
Commencement
Lease
Expiration
326 SM Fairview November 1, 2018 October 31, 2023 270,374.25
327 SM North Edsa February 01, 2015 January 31, 2020
328 SM North Towers December 07, 2018 November 30, 2030 118,398.00
329 SM Southmall February 1, 2015 January 31, 2020 536,902.00
330 SM Aura Premier May 1, 2018 April 30, 2023 192,757.50
331 SM CDO Downtown Premier (formerly CDO - Borja) May 12, 2017 April 30, 2022 158,734.70
332 SM City BF Parañaque December 16, 2013 January 31, 2019 351,894.40
333 SM City Bicutan November 1, 2018 October 31, 2023 223,169.00
334 SM City Cabanatuan March 14, 2018 February 28, 2023 163,743.80
335 SM City Clark (GF) August 1, 2018 July 31, 2020 224,985.30
336 SM City Dasmariñas February 1, 2017 January 31, 2022 190,912.50
337 SM City Lipa November 1, 2017 October 31, 2022 212,162.20
338 SM City Marikina November 1, 2017 October 31, 2022 114,351.63
339 SM City Masinag August 1, 2016 July 31, 2021 175,330.95
340 SM City Naga February 1, 2019 January 31, 2024 113,330.00
341 SM City Olongapo February 1, 2014 January 31, 2019 181,958.00
342 SM City Pampanga November 1, 2014 October 31, 2019 176,097.00
343 Sm City San Jose Del Monte July 1, 2016 July 31, 2021 133,289.70
344 SM City San Lazaro November 1, 2018 October 31, 2023 277,848.00
345 SM City San Pablo November 1, 2015 October 31, 2020 211,164.00
346 SM City Sta. Rosa May 1, 2014 April 30, 2019 195,347.00
347 SM City Taytay November 1, 2018 October 31, 2023 135,135.00
348 SM City Telabastagan July 01, 2018 April 30, 2023 150,093.00
349 SM Mall Of Asia May 1, 2017 April 30, 2018 378,114.00
350 SM Megamall November 1, 2017 October 31, 2022 539,044.50
351 Solano December 16, 2018 December 15, 2028 90,000.00
352 Solemare January 1, 2015 December 31, 2024 146,354.60
353 Soler-168 January 1, 2015 December 31, 2020 122,559.85
354 South Triangle January 16, 2015 January 15, 2025 166,408.59
355 Sta. Mesa (formerly Mezza Residences) December 1, 2016 November 30, 2026 120,750.00
356 Sto. Cristo (relocated) June 1, 2016 May 31, 2026 140,000.00
357 Sto. Cristo-CM Recto July 01, 2017 September 30, 2027 105,000.00
358 Sto. Domingo Ave. April 16, 2017 April 15, 2027 87,500.00
359 Subic Bay Freeport Zone June 25, 2008 June 24, 2058 1,268.85
360 Surigao City September 1, 2011 August 31, 2031 34,728.75
361 T. Alonzo June 1, 2016 May 31, 2021 122,767.85
362 Tabaco City March 1, 2015 February 28, 2025 79,020.06
363 Tacloban City July 1, 2010 June 30, 2020 101,874.07
364 Taft Ave. - Nakpil July 01, 2018 June 30, 2028 150,000.00
365 Taft Ave. - Quirino May 1, 2017 April 30, 2025 144,220.76
366 Tagaytay City August 24, 2016 August 23, 2026 107,100.00
367 Tagbilaran City August 16, 2017 August 15, 2022 202,357.29
368 Talavera July 20, 2012 July 19, 2032 24,310.13
369 Tandang Sora - Visayas Ave. February 1, 2017 March 31, 2027 157,500.00
370 Tarlac - Bamban December 1, 2016 November 30, 2026 25,000.00
371 Tarlac - San Rafael November 1, 2017 October 31, 2032 25,000.00
372 Tarlac- Camiling February 1, 2014 January 31, 2024 66,366.64
373 Tarlac- Concepcion October 1, 2014 September 30, 2024 60,500.00
374 Tarlac- Paniqui October 1, 2014 September 30, 2024 71,662.50
375 Taytay – Ortigas Exension February 01, 2018 January 31, 2028 125,400.00
CONTRACT PERIODRental Rate Per
Month
40
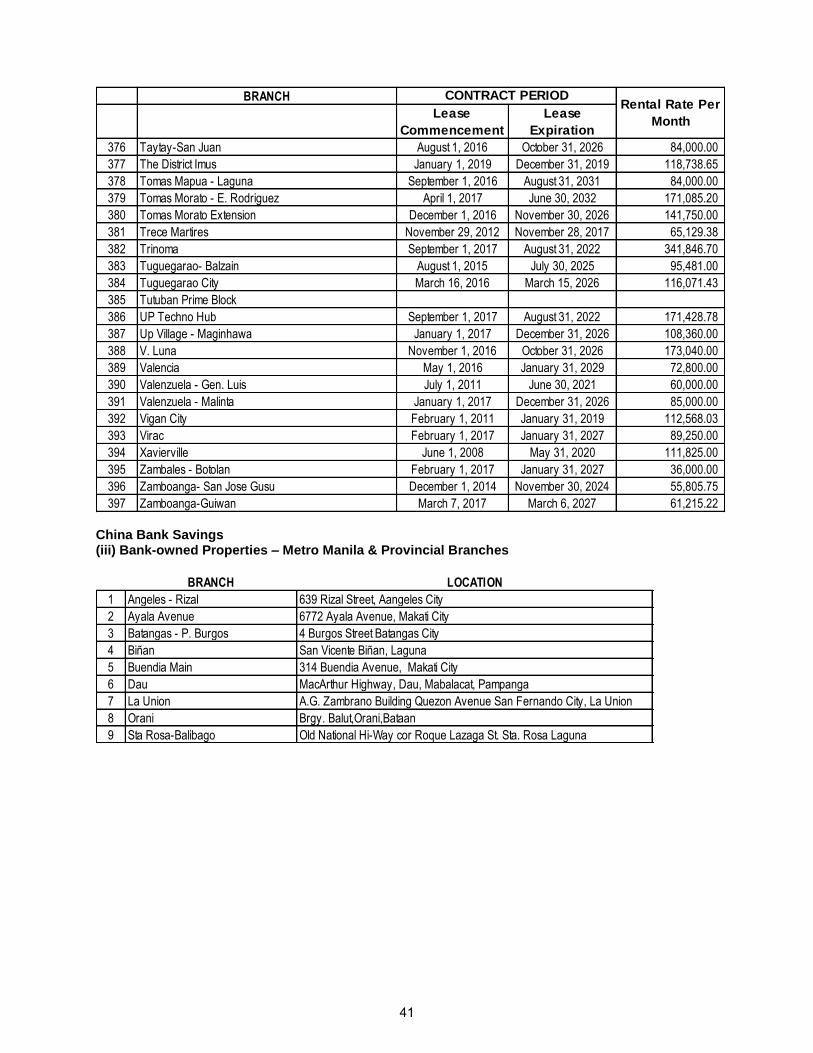
BRANCH
Lease
Commencement
Lease
Expiration
376 Taytay-San Juan August 1, 2016 October 31, 2026 84,000.00
377 The District Imus January 1, 2019 December 31, 2019 118,738.65
378 Tomas Mapua - Laguna September 1, 2016 August 31, 2031 84,000.00
379 Tomas Morato - E. Rodriguez April 1, 2017 June 30, 2032 171,085.20
380 Tomas Morato Extension December 1, 2016 November 30, 2026 141,750.00
381 Trece Martires November 29, 2012 November 28, 2017 65,129.38
382 Trinoma September 1, 2017 August 31, 2022 341,846.70
383 Tuguegarao- Balzain August 1, 2015 July 30, 2025 95,481.00
384 Tuguegarao City March 16, 2016 March 15, 2026 116,071.43
385 Tutuban Prime Block
386 UP Techno Hub September 1, 2017 August 31, 2022 171,428.78
387 Up Village - Maginhawa January 1, 2017 December 31, 2026 108,360.00
388 V. Luna November 1, 2016 October 31, 2026 173,040.00
389 Valencia May 1, 2016 January 31, 2029 72,800.00
390 Valenzuela - Gen. Luis July 1, 2011 June 30, 2021 60,000.00
391 Valenzuela - Malinta January 1, 2017 December 31, 2026 85,000.00
392 Vigan City February 1, 2011 January 31, 2019 112,568.03
393 Virac February 1, 2017 January 31, 2027 89,250.00
394 Xavierville June 1, 2008 May 31, 2020 111,825.00
395 Zambales - Botolan February 1, 2017 January 31, 2027 36,000.00
396 Zamboanga- San Jose Gusu December 1, 2014 November 30, 2024 55,805.75
397 Zamboanga-Guiwan March 7, 2017 March 6, 2027 61,215.22
CONTRACT PERIODRental Rate Per
Month
China Bank Savings (iii) Bank-owned Properties – Metro Manila & Provincial Branches
BRANCH LOCATION
1 Angeles - Rizal 639 Rizal Street, Aangeles City
2 Ayala Avenue 6772 Ayala Avenue, Makati City
3 Batangas - P. Burgos 4 Burgos Street Batangas City
4 Biñan San Vicente Biñan, Laguna
5 Buendia Main 314 Buendia Avenue, Makati City
6 Dau MacArthur Highway, Dau, Mabalacat, Pampanga
7 La Union A.G. Zambrano Building Quezon Avenue San Fernando City, La Union
8 Orani Brgy. Balut,Orani,Bataan
9 Sta Rosa-Balibago Old National Hi-Way cor Roque Lazaga St. Sta. Rosa Laguna
41
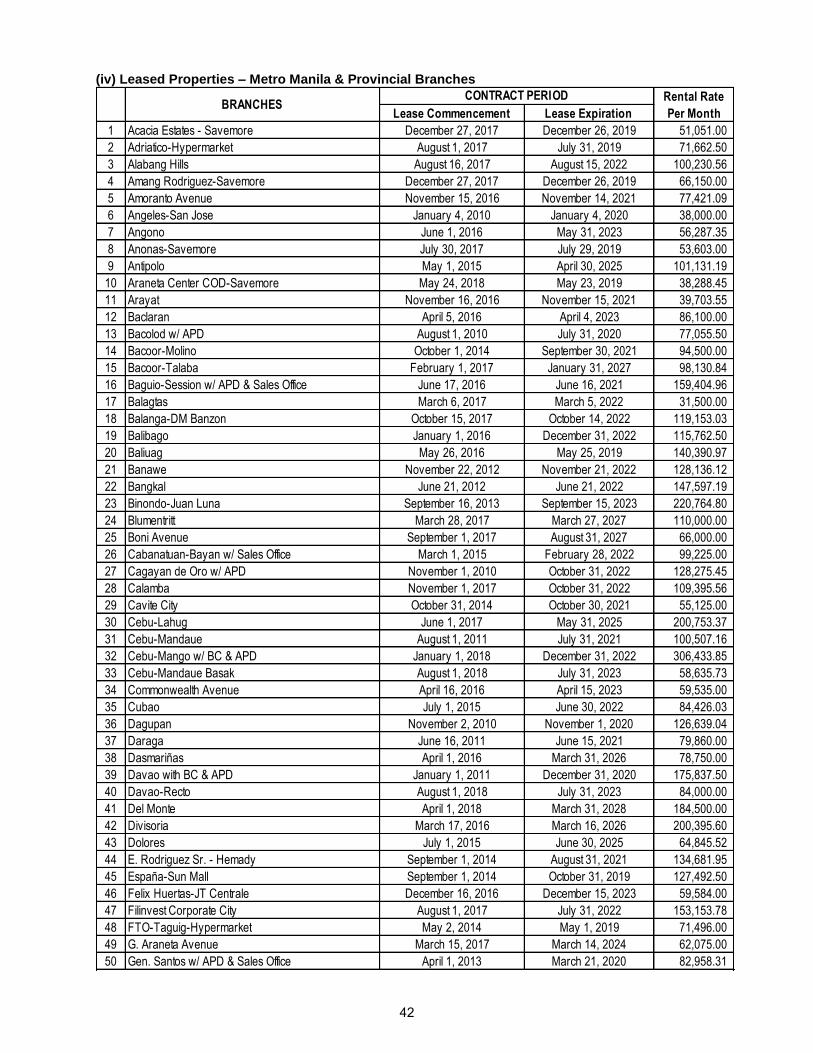
(iv) Leased Properties – Metro Manila & Provincial Branches
Lease Commencement Lease Expiration
1 Acacia Estates - Savemore December 27, 2017 December 26, 2019 51,051.00
2 Adriatico-Hypermarket August 1, 2017 July 31, 2019 71,662.50
3 Alabang Hills August 16, 2017 August 15, 2022 100,230.56
4 Amang Rodriguez-Savemore December 27, 2017 December 26, 2019 66,150.00
5 Amoranto Avenue November 15, 2016 November 14, 2021 77,421.09
6 Angeles-San Jose January 4, 2010 January 4, 2020 38,000.00
7 Angono June 1, 2016 May 31, 2023 56,287.35
8 Anonas-Savemore July 30, 2017 July 29, 2019 53,603.00
9 Antipolo May 1, 2015 April 30, 2025 101,131.19
10 Araneta Center COD-Savemore May 24, 2018 May 23, 2019 38,288.45
11 Arayat November 16, 2016 November 15, 2021 39,703.55
12 Baclaran April 5, 2016 April 4, 2023 86,100.00
13 Bacolod w/ APD August 1, 2010 July 31, 2020 77,055.50
14 Bacoor-Molino October 1, 2014 September 30, 2021 94,500.00
15 Bacoor-Talaba February 1, 2017 January 31, 2027 98,130.84
16 Baguio-Session w/ APD & Sales Office June 17, 2016 June 16, 2021 159,404.96
17 Balagtas March 6, 2017 March 5, 2022 31,500.00
18 Balanga-DM Banzon October 15, 2017 October 14, 2022 119,153.03
19 Balibago January 1, 2016 December 31, 2022 115,762.50
20 Baliuag May 26, 2016 May 25, 2019 140,390.97
21 Banawe November 22, 2012 November 21, 2022 128,136.12
22 Bangkal June 21, 2012 June 21, 2022 147,597.19
23 Binondo-Juan Luna September 16, 2013 September 15, 2023 220,764.80
24 Blumentritt March 28, 2017 March 27, 2027 110,000.00
25 Boni Avenue September 1, 2017 August 31, 2027 66,000.00
26 Cabanatuan-Bayan w/ Sales Office March 1, 2015 February 28, 2022 99,225.00
27 Cagayan de Oro w/ APD November 1, 2010 October 31, 2022 128,275.45
28 Calamba November 1, 2017 October 31, 2022 109,395.56
29 Cavite City October 31, 2014 October 30, 2021 55,125.00
30 Cebu-Lahug June 1, 2017 May 31, 2025 200,753.37
31 Cebu-Mandaue August 1, 2011 July 31, 2021 100,507.16
32 Cebu-Mango w/ BC & APD January 1, 2018 December 31, 2022 306,433.85
33 Cebu-Mandaue Basak August 1, 2018 July 31, 2023 58,635.73
34 Commonwealth Avenue April 16, 2016 April 15, 2023 59,535.00
35 Cubao July 1, 2015 June 30, 2022 84,426.03
36 Dagupan November 2, 2010 November 1, 2020 126,639.04
37 Daraga June 16, 2011 June 15, 2021 79,860.00
38 Dasmariñas April 1, 2016 March 31, 2026 78,750.00
39 Davao with BC & APD January 1, 2011 December 31, 2020 175,837.50
40 Davao-Recto August 1, 2018 July 31, 2023 84,000.00
41 Del Monte April 1, 2018 March 31, 2028 184,500.00
42 Divisoria March 17, 2016 March 16, 2026 200,395.60
43 Dolores July 1, 2015 June 30, 2025 64,845.52
44 E. Rodriguez Sr. - Hemady September 1, 2014 August 31, 2021 134,681.95
45 España-Sun Mall September 1, 2014 October 31, 2019 127,492.50
46 Felix Huertas-JT Centrale December 16, 2016 December 15, 2023 59,584.00
47 Filinvest Corporate City August 1, 2017 July 31, 2022 153,153.78
48 FTO-Taguig-Hypermarket May 2, 2014 May 1, 2019 71,496.00
49 G. Araneta Avenue March 15, 2017 March 14, 2024 62,075.00
50 Gen. Santos w/ APD & Sales Office April 1, 2013 March 21, 2020 82,958.31
Rental Rate
Per Month
CONTRACT PERIODBRANCHES
42
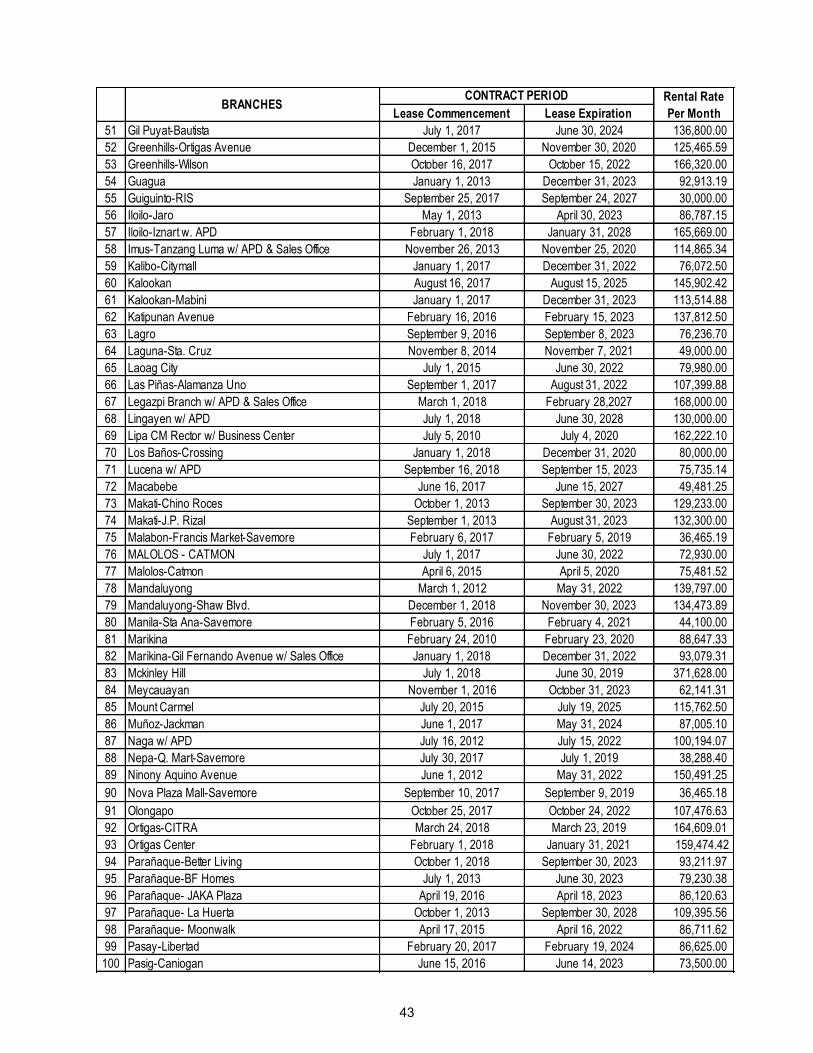
Lease Commencement Lease Expiration
51 Gil Puyat-Bautista July 1, 2017 June 30, 2024 136,800.00
52 Greenhills-Ortigas Avenue December 1, 2015 November 30, 2020 125,465.59
53 Greenhills-Wilson October 16, 2017 October 15, 2022 166,320.00
54 Guagua January 1, 2013 December 31, 2023 92,913.19
55 Guiguinto-RIS September 25, 2017 September 24, 2027 30,000.00
56 Iloilo-Jaro May 1, 2013 April 30, 2023 86,787.15
57 Iloilo-Iznart w. APD February 1, 2018 January 31, 2028 165,669.00
58 Imus-Tanzang Luma w/ APD & Sales Office November 26, 2013 November 25, 2020 114,865.34
59 Kalibo-Citymall January 1, 2017 December 31, 2022 76,072.50
60 Kalookan August 16, 2017 August 15, 2025 145,902.42
61 Kalookan-Mabini January 1, 2017 December 31, 2023 113,514.88
62 Katipunan Avenue February 16, 2016 February 15, 2023 137,812.50
63 Lagro September 9, 2016 September 8, 2023 76,236.70
64 Laguna-Sta. Cruz November 8, 2014 November 7, 2021 49,000.00
65 Laoag City July 1, 2015 June 30, 2022 79,980.00
66 Las Piñas-Alamanza Uno September 1, 2017 August 31, 2022 107,399.88
67 Legazpi Branch w/ APD & Sales Office March 1, 2018 February 28,2027 168,000.00
68 Lingayen w/ APD July 1, 2018 June 30, 2028 130,000.00
69 Lipa CM Rector w/ Business Center July 5, 2010 July 4, 2020 162,222.10
70 Los Baños-Crossing January 1, 2018 December 31, 2020 80,000.00
71 Lucena w/ APD September 16, 2018 September 15, 2023 75,735.14
72 Macabebe June 16, 2017 June 15, 2027 49,481.25
73 Makati-Chino Roces October 1, 2013 September 30, 2023 129,233.00
74 Makati-J.P. Rizal September 1, 2013 August 31, 2023 132,300.00
75 Malabon-Francis Market-Savemore February 6, 2017 February 5, 2019 36,465.19
76 MALOLOS - CATMON July 1, 2017 June 30, 2022 72,930.00
77 Malolos-Catmon April 6, 2015 April 5, 2020 75,481.52
78 Mandaluyong March 1, 2012 May 31, 2022 139,797.00
79 Mandaluyong-Shaw Blvd. December 1, 2018 November 30, 2023 134,473.89
80 Manila-Sta Ana-Savemore February 5, 2016 February 4, 2021 44,100.00
81 Marikina February 24, 2010 February 23, 2020 88,647.33
82 Marikina-Gil Fernando Avenue w/ Sales Office January 1, 2018 December 31, 2022 93,079.31
83 Mckinley Hill July 1, 2018 June 30, 2019 371,628.00
84 Meycauayan November 1, 2016 October 31, 2023 62,141.31
85 Mount Carmel July 20, 2015 July 19, 2025 115,762.50
86 Muñoz-Jackman June 1, 2017 May 31, 2024 87,005.10
87 Naga w/ APD July 16, 2012 July 15, 2022 100,194.07
88 Nepa-Q. Mart-Savemore July 30, 2017 July 1, 2019 38,288.40
89 Ninony Aquino Avenue June 1, 2012 May 31, 2022 150,491.25
90 Nova Plaza Mall-Savemore September 10, 2017 September 9, 2019 36,465.18
91 Olongapo October 25, 2017 October 24, 2022 107,476.63
92 Ortigas-CITRA March 24, 2018 March 23, 2019 164,609.01
93 Ortigas Center February 1, 2018 January 31, 2021 159,474.42
94 Parañaque-Better Living October 1, 2018 September 30, 2023 93,211.97
95 Parañaque-BF Homes July 1, 2013 June 30, 2023 79,230.38
96 Parañaque- JAKA Plaza April 19, 2016 April 18, 2023 86,120.63
97 Parañaque- La Huerta October 1, 2013 September 30, 2028 109,395.56
98 Parañaque- Moonwalk April 17, 2015 April 16, 2022 86,711.62
99 Pasay-Libertad February 20, 2017 February 19, 2024 86,625.00
100 Pasig-Caniogan June 15, 2016 June 14, 2023 73,500.00
BRANCHESCONTRACT PERIOD Rental Rate
Per Month
43
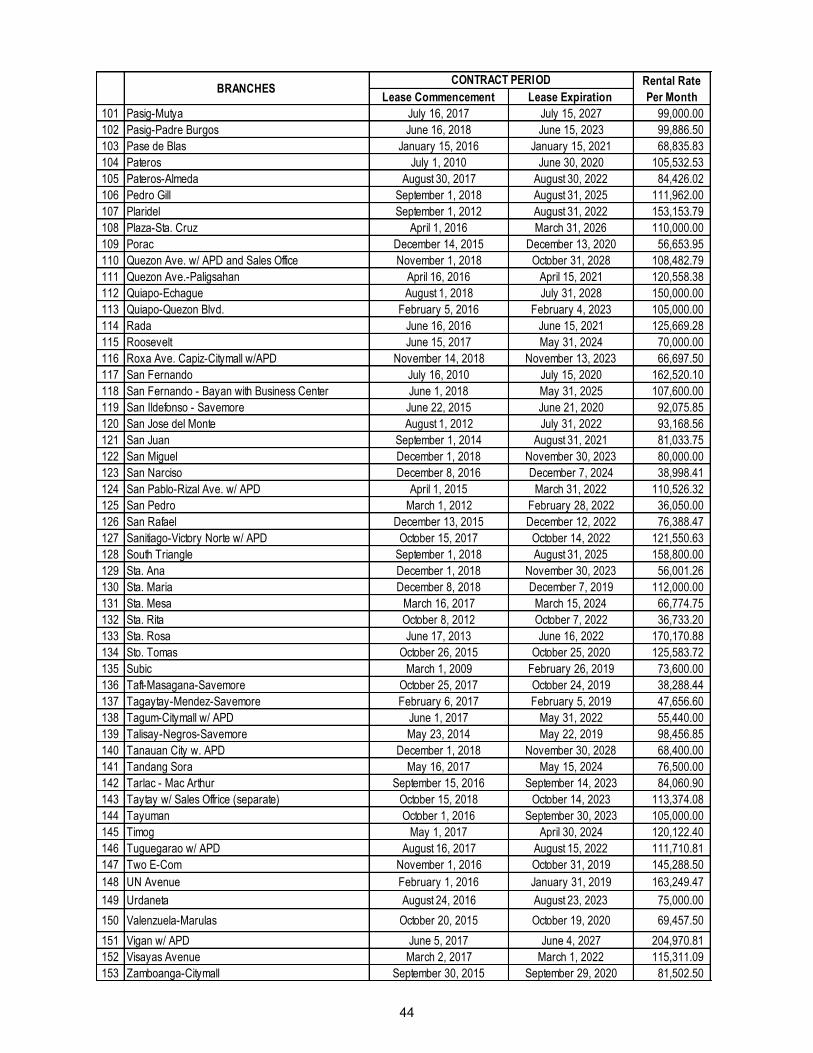
Lease Commencement Lease Expiration
101 Pasig-Mutya July 16, 2017 July 15, 2027 99,000.00
102 Pasig-Padre Burgos June 16, 2018 June 15, 2023 99,886.50
103 Pase de Blas January 15, 2016 January 15, 2021 68,835.83
104 Pateros July 1, 2010 June 30, 2020 105,532.53
105 Pateros-Almeda August 30, 2017 August 30, 2022 84,426.02
106 Pedro Gill September 1, 2018 August 31, 2025 111,962.00
107 Plaridel September 1, 2012 August 31, 2022 153,153.79
108 Plaza-Sta. Cruz April 1, 2016 March 31, 2026 110,000.00
109 Porac December 14, 2015 December 13, 2020 56,653.95
110 Quezon Ave. w/ APD and Sales Office November 1, 2018 October 31, 2028 108,482.79
111 Quezon Ave.-Paligsahan April 16, 2016 April 15, 2021 120,558.38
112 Quiapo-Echague August 1, 2018 July 31, 2028 150,000.00
113 Quiapo-Quezon Blvd. February 5, 2016 February 4, 2023 105,000.00
114 Rada June 16, 2016 June 15, 2021 125,669.28
115 Roosevelt June 15, 2017 May 31, 2024 70,000.00
116 Roxa Ave. Capiz-Citymall w/APD November 14, 2018 November 13, 2023 66,697.50
117 San Fernando July 16, 2010 July 15, 2020 162,520.10
118 San Fernando - Bayan with Business Center June 1, 2018 May 31, 2025 107,600.00
119 San Ildefonso - Savemore June 22, 2015 June 21, 2020 92,075.85
120 San Jose del Monte August 1, 2012 July 31, 2022 93,168.56
121 San Juan September 1, 2014 August 31, 2021 81,033.75
122 San Miguel December 1, 2018 November 30, 2023 80,000.00
123 San Narciso December 8, 2016 December 7, 2024 38,998.41
124 San Pablo-Rizal Ave. w/ APD April 1, 2015 March 31, 2022 110,526.32
125 San Pedro March 1, 2012 February 28, 2022 36,050.00
126 San Rafael December 13, 2015 December 12, 2022 76,388.47
127 Sanitiago-Victory Norte w/ APD October 15, 2017 October 14, 2022 121,550.63
128 South Triangle September 1, 2018 August 31, 2025 158,800.00
129 Sta. Ana December 1, 2018 November 30, 2023 56,001.26
130 Sta. Maria December 8, 2018 December 7, 2019 112,000.00
131 Sta. Mesa March 16, 2017 March 15, 2024 66,774.75
132 Sta. Rita October 8, 2012 October 7, 2022 36,733.20
133 Sta. Rosa June 17, 2013 June 16, 2022 170,170.88
134 Sto. Tomas October 26, 2015 October 25, 2020 125,583.72
135 Subic March 1, 2009 February 26, 2019 73,600.00
136 Taft-Masagana-Savemore October 25, 2017 October 24, 2019 38,288.44
137 Tagaytay-Mendez-Savemore February 6, 2017 February 5, 2019 47,656.60
138 Tagum-Citymall w/ APD June 1, 2017 May 31, 2022 55,440.00
139 Talisay-Negros-Savemore May 23, 2014 May 22, 2019 98,456.85
140 Tanauan City w. APD December 1, 2018 November 30, 2028 68,400.00
141 Tandang Sora May 16, 2017 May 15, 2024 76,500.00
142 Tarlac - Mac Arthur September 15, 2016 September 14, 2023 84,060.90
143 Taytay w/ Sales Offrice (separate) October 15, 2018 October 14, 2023 113,374.08
144 Tayuman October 1, 2016 September 30, 2023 105,000.00
145 Timog May 1, 2017 April 30, 2024 120,122.40
146 Tuguegarao w/ APD August 16, 2017 August 15, 2022 111,710.81
147 Two E-Com November 1, 2016 October 31, 2019 145,288.50
148 UN Avenue February 1, 2016 January 31, 2019 163,249.47
149 Urdaneta August 24, 2016 August 23, 2023 75,000.00
150 Valenzuela-Marulas October 20, 2015 October 19, 2020 69,457.50
151 Vigan w/ APD June 5, 2017 June 4, 2027 204,970.81
152 Visayas Avenue March 2, 2017 March 1, 2022 115,311.09
153 Zamboanga-Citymall September 30, 2015 September 29, 2020 81,502.50
BRANCHESCONTRACT PERIOD Rental Rate
Per Month
44
The head office and other branches of China Bank are well maintained for the benefit of its employees and clients. The Bank embarked in its branch redesign project which not only modernized the look and feel of a China Bank branch but also took the concept a step further by transforming the branch into a customer-friendly, familiar yet efficient venue for delivering and cross-selling the China Bank brand of quality service. (b) Limitations on Properties
Usually, our bank properties which have liens and encumbrances or those which were acquired by virtue of foreclosure sale. These liens mostly are lis pendens and adverse claims, posted by the previous owners- borrowers and they are subsequently cancelled upon termination of the case filed by the latter and upon motion/petition we filed in court. (c) Description of Property the Bank intends to acquire in the next 12 months
The Bank has future plans to acquire properties but no description/location of properties yet at this time. Item 3. Legal Proceedings There are pending cases filed for and against the Bank arising from incidental, ordinary and routine conduct of the banking business. It is the opinion of the management and legal counsel that there are no material pending legal proceedings to which the Bank or any of its subsidiaries or affiliates is a party or of which any of their property is the subject.
Item 4. Submission of Matters to a Vote of Security Holders Except for the matters taken up during the annual stockholders‘ meeting on May 3, 2018, there was no other matter submitted to a vote of security holders during the fiscal year covered by this report.
45
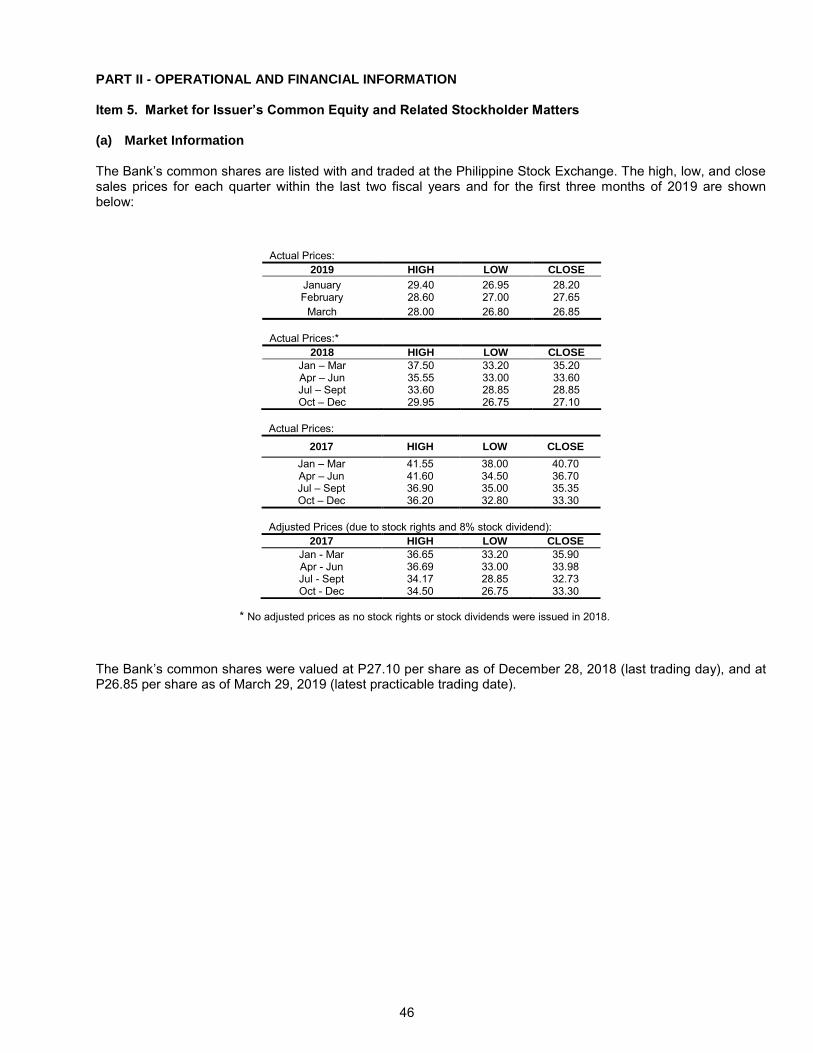
PART II - OPERATIONAL AND FINANCIAL INFORMATION Item 5. Market for Issuer’s Common Equity and Related Stockholder Matters (a) Market Information The Bank‘s common shares are listed with and traded at the Philippine Stock Exchange. The high, low, and close sales prices for each quarter within the last two fiscal years and for the first three months of 2019 are shown below:
* No adjusted prices as no stock rights or stock dividends were issued in 2018.
The Bank‘s common shares were valued at P27.10 per share as of December 28, 2018 (last trading day), and at P26.85 per share as of March 29, 2019 (latest practicable trading date).
Actual Prices:
2019 HIGH LOW CLOSE
January February
29.40 28.60
26.95 27.00
28.20 27.65
March 28.00 26.80 26.85
Actual Prices:*
2018 HIGH LOW CLOSE
Jan – Mar Apr – Jun
37.50 35.55
33.20 33.00
35.20 33.60
Jul – Sept Oct – Dec
33.60 29.95
28.85 26.75
28.85 27.10
Actual Prices:
2017 HIGH LOW CLOSE
Jan – Mar 41.55 38.00 40.70 Apr – Jun 41.60 34.50 36.70 Jul – Sept 36.90 35.00 35.35 Oct – Dec 36.20 32.80 33.30
Adjusted Prices (due to stock rights and 8% stock dividend):
2017 HIGH LOW CLOSE
Jan - Mar 36.65 33.20 35.90 Apr - Jun 36.69 33.00 33.98 Jul - Sept 34.17 28.85 32.73 Oct - Dec 34.50 26.75 33.30
46
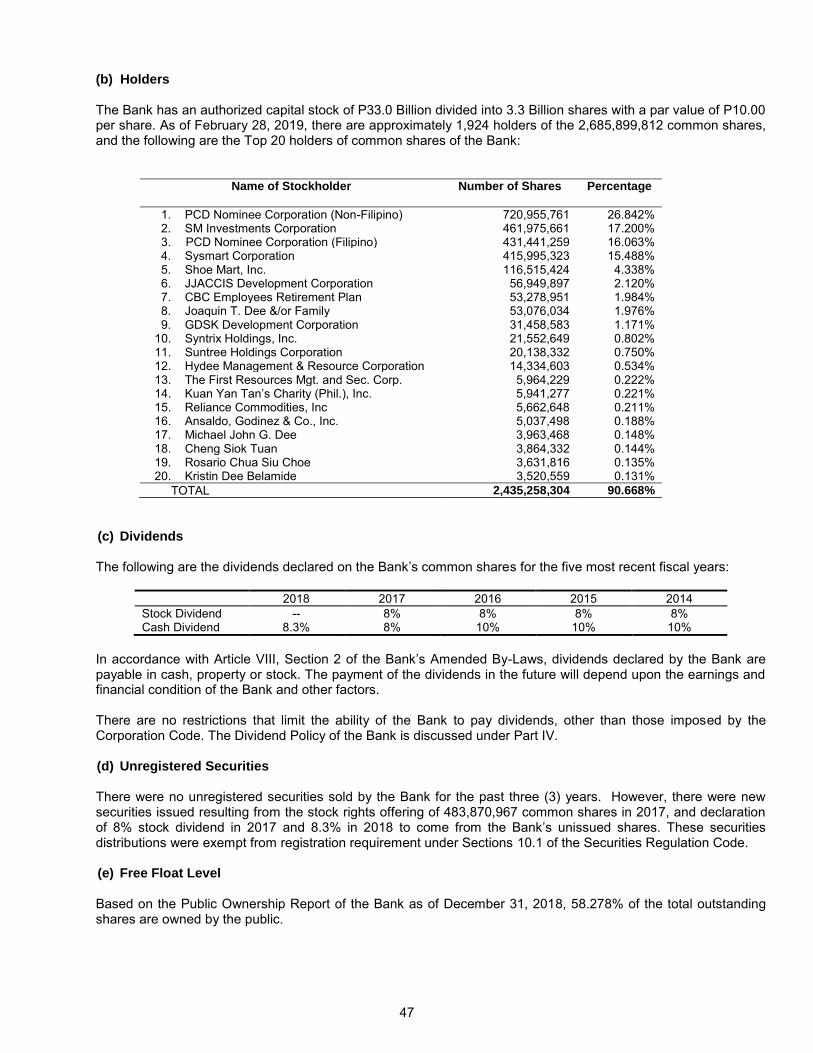
(b) Holders
The Bank has an authorized capital stock of P33.0 Billion divided into 3.3 Billion shares with a par value of P10.00 per share. As of February 28, 2019, there are approximately 1,924 holders of the 2,685,899,812 common shares, and the following are the Top 20 holders of common shares of the Bank:
Name of Stockholder Number of Shares Percentage
1. PCD Nominee Corporation (Non-Filipino) 720,955,761 26.842%
2. SM Investments Corporation 461,975,661 17.200%
3. PCD Nominee Corporation (Filipino) 431,441,259 16.063%
4. Sysmart Corporation 415,995,323 15.488%
5. Shoe Mart, Inc. 116,515,424 4.338%
6. JJACCIS Development Corporation 56,949,897 2.120%
7. CBC Employees Retirement Plan 53,278,951 1.984%
8. Joaquin T. Dee &/or Family 53,076,034 1.976%
9. GDSK Development Corporation 31,458,583 1.171%
10. Syntrix Holdings, Inc. 21,552,649 0.802%
11. Suntree Holdings Corporation 20,138,332 0.750%
12. Hydee Management & Resource Corporation 14,334,603 0.534%
13. The First Resources Mgt. and Sec. Corp. 5,964,229 0.222%
14. Kuan Yan Tan‘s Charity (Phil.), Inc. 5,941,277 0.221%
15. Reliance Commodities, Inc 5,662,648 0.211%
16. Ansaldo, Godinez & Co., Inc. 5,037,498 0.188%
17. Michael John G. Dee 3,963,468 0.148%
18. Cheng Siok Tuan 3,864,332 0.144%
19. Rosario Chua Siu Choe 3,631,816 0.135% 20. Kristin Dee Belamide 3,520,559 0.131%
TOTAL 2,435,258,304 90.668%
(c) Dividends
The following are the dividends declared on the Bank‘s common shares for the five most recent fiscal years:
2018 2017 2016 2015 2014 Stock Dividend -- 8% 8% 8% 8% Cash Dividend 8.3% 8% 10% 10% 10%
In accordance with Article VIII, Section 2 of the Bank‘s Amended By-Laws, dividends declared by the Bank are payable in cash, property or stock. The payment of the dividends in the future will depend upon the earnings and financial condition of the Bank and other factors. There are no restrictions that limit the ability of the Bank to pay dividends, other than those imposed by the Corporation Code. The Dividend Policy of the Bank is discussed under Part IV.
(d) Unregistered Securities
There were no unregistered securities sold by the Bank for the past three (3) years. However, there were new securities issued resulting from the stock rights offering of 483,870,967 common shares in 2017, and declaration of 8% stock dividend in 2017 and 8.3% in 2018 to come from the Bank‘s unissued shares. These securities distributions were exempt from registration requirement under Sections 10.1 of the Securities Regulation Code. (e) Free Float Level Based on the Public Ownership Report of the Bank as of December 31, 2018, 58.278% of the total outstanding shares are owned by the public.
47
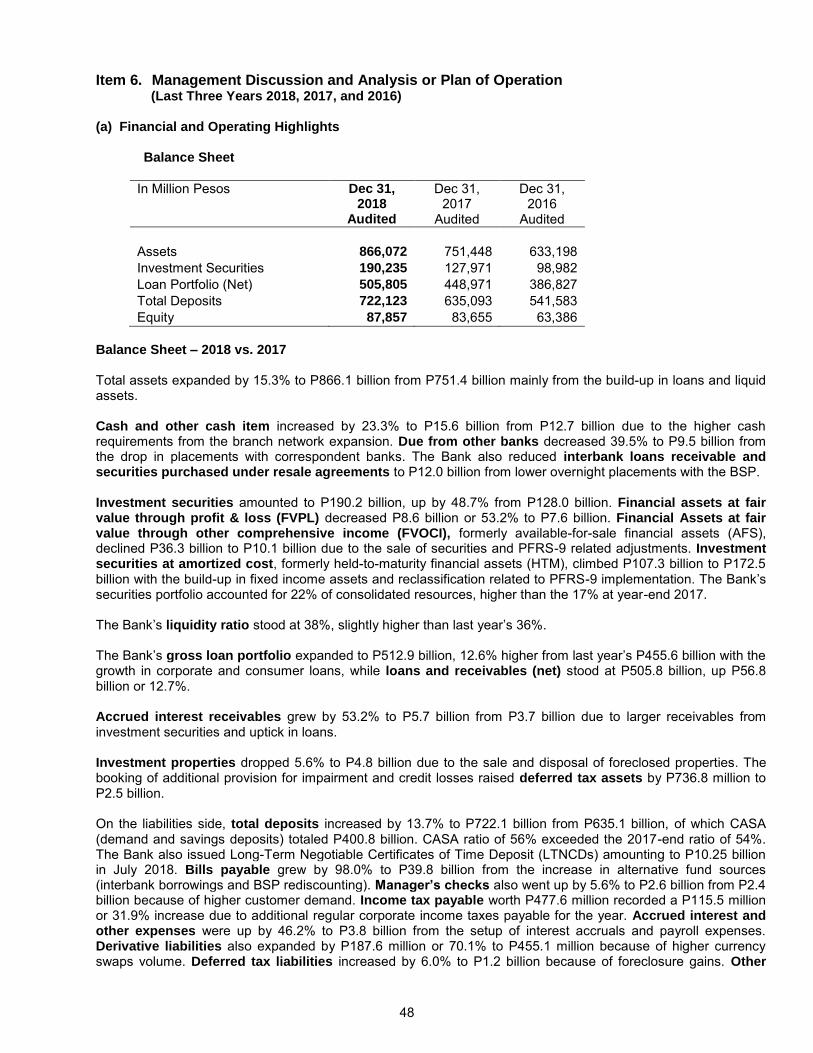
Item 6. Management Discussion and Analysis or Plan of Operation (Last Three Years 2018, 2017, and 2016)
(a) Financial and Operating Highlights
Balance Sheet
In Million Pesos
Dec 31, 2018
Audited
Dec 31, 2017
Audited
Dec 31, 2016
Audited Assets 866,072 751,448 633,198 Investment Securities 190,235 127,971 98,982 Loan Portfolio (Net) 505,805 448,971 386,827 Total Deposits 722,123 635,093 541,583 Equity 87,857 83,655 63,386
Balance Sheet – 2018 vs. 2017 Total assets expanded by 15.3% to P866.1 billion from P751.4 billion mainly from the build-up in loans and liquid assets. Cash and other cash item increased by 23.3% to P15.6 billion from P12.7 billion due to the higher cash requirements from the branch network expansion. Due from other banks decreased 39.5% to P9.5 billion from the drop in placements with correspondent banks. The Bank also reduced interbank loans receivable and securities purchased under resale agreements to P12.0 billion from lower overnight placements with the BSP. Investment securities amounted to P190.2 billion, up by 48.7% from P128.0 billion. Financial assets at fair value through profit & loss (FVPL) decreased P8.6 billion or 53.2% to P7.6 billion. Financial Assets at fair value through other comprehensive income (FVOCI), formerly available-for-sale financial assets (AFS), declined P36.3 billion to P10.1 billion due to the sale of securities and PFRS-9 related adjustments. Investment securities at amortized cost, formerly held-to-maturity financial assets (HTM), climbed P107.3 billion to P172.5 billion with the build-up in fixed income assets and reclassification related to PFRS-9 implementation. The Bank‘s securities portfolio accounted for 22% of consolidated resources, higher than the 17% at year-end 2017. The Bank‘s liquidity ratio stood at 38%, slightly higher than last year‘s 36%. The Bank‘s gross loan portfolio expanded to P512.9 billion, 12.6% higher from last year‘s P455.6 billion with the growth in corporate and consumer loans, while loans and receivables (net) stood at P505.8 billion, up P56.8 billion or 12.7%. Accrued interest receivables grew by 53.2% to P5.7 billion from P3.7 billion due to larger receivables from investment securities and uptick in loans. Investment properties dropped 5.6% to P4.8 billion due to the sale and disposal of foreclosed properties. The booking of additional provision for impairment and credit losses raised deferred tax assets by P736.8 million to P2.5 billion. On the liabilities side, total deposits increased by 13.7% to P722.1 billion from P635.1 billion, of which CASA (demand and savings deposits) totaled P400.8 billion. CASA ratio of 56% exceeded the 2017-end ratio of 54%. The Bank also issued Long-Term Negotiable Certificates of Time Deposit (LTNCDs) amounting to P10.25 billion in July 2018. Bills payable grew by 98.0% to P39.8 billion from the increase in alternative fund sources (interbank borrowings and BSP rediscounting). Manager’s checks also went up by 5.6% to P2.6 billion from P2.4 billion because of higher customer demand. Income tax payable worth P477.6 million recorded a P115.5 million or 31.9% increase due to additional regular corporate income taxes payable for the year. Accrued interest and other expenses were up by 46.2% to P3.8 billion from the setup of interest accruals and payroll expenses. Derivative liabilities also expanded by P187.6 million or 70.1% to P455.1 million because of higher currency swaps volume. Deferred tax liabilities increased by 6.0% to P1.2 billion because of foreclosure gains. Other
48
liabilities increased P2.0 billion to P7.7 billion with the booking of expected credit losses (ECL) on off-balance sheet exposures amounting to P1.6 billion. Total equity reached to P87.9 billion, 5.0% higher than last year‘s P83.7 billion. Surplus reserves went up by P3.1 billion to P4.0 billion from the impact of PFRS-9 adoption. Net unrealized loss on financial assets on FVOCI improved P1.1 billion to (P702.5) million from (P1.8) billion arising from the mark-to-market revaluation of the Bank‘s unsold securities. Remeasurement gain on defined benefit asset registered a P166.7 million or 58.8% decrease to P117.0 million because of actuarial adjustments in the valuations of retirement plans last year. Cumulative translation adjustment fell to (P91.7) million from (P38.7) million due to exchange rate difference. The Bank‘s Common Equity Tier 1 (CET 1) and total CAR were computed at 12.16% and 13.09%, respectively. The difference was accounted by the general loan loss provision limited to 1% of credit risk weighted assets as buffer for potential losses. Balance Sheet – 2017 vs. 2016 Total assets expanded by 18.7% to P751.4 billion from P633.2 billion mainly from the robust growth in liquid assets and core business. Cash and other cash item increased by 5.6% to P12.7 billion from P12.0 billion due to the higher cash requirements from the branch network expansion. Due from Bangko Sentral ng Pilipinas grew by 7.1% to P98.5 billion from P92.0 billion as higher reserves were allotted to cover for the bigger deposit volume. Due from other banks went up by 38.0% to P15.6 billion from the build-up of deposits with correspondent banks. Interbank loans receivable and securities purchased under resale agreements, mainly composed of overnight placements with the BSP, recorded a P15.3 billion increase to P18.8 billion. Investment securities totalled P128.0 billion, up by 29.3% from P99.0 billion, resulting in a higher share to total assets of 17% from 16% in 2016. Financial assets at fair value through profit or loss (FVPL) amounted to P16.2 billion, P8.5 billion larger due to the purchase of tradable securities and investments in shares of stocks. Available-for-sale (AFS) financial assets increased by 37.1% to P46.4 billion from P33.9 billion, while held-to-maturity (HTM) financial assets recorded a P7.9 billion or 13.7% growth to P65.3 billion as the Bank continued to expand its bond holdings. The Bank‘s liquidity ratio stood at 36%, better than last year‘s 34%. The Bank‘s gross loan portfolio (inclusive of UDSCL) grew 15.7% to P455.6 billion from P393.7 billion mainly from higher demand across all customer segments (corporate, commercial, and consumer). Loans and receivables (net) grew by 16.1% to P449.0 billion from P386.8 billion. Accrued interest receivables grew by 23.4% to P3.7 billion from P3.0 billion due to uptick in interest earning assets such as AFS, HTM, and loans. Investment in associates went up by 19.1% or P52.9 million to P329.4 million mainly due to higher contribution from the bancassurance joint venture, Manulife-China Bank Life Assurance Corporation (MCBLife). Bank premises, furniture, fixture, and equipment grew by 5.8% or P379.6 million due to the continued network expansion and technology upgrade. On the other hand, investment properties dropped P277.6 million or 5.2% due to the sale and disposal of foreclosed properties. The booking of additional provision for probable losses raised deferred tax assets by P111.8 million to P1.8 billion. Other assets declined by P677.8 million or 9.8% to P6.2 billion mainly because of lower accounts receivables. On the liabilities side, total deposits increased by 17.3% to P635.1 billion from P541.6 billion mainly from the ongoing branch expansion and more customer acquisition efforts. CASA (checking & savings) were P66.6 billion or 24.1% higher at P343.0 billion, improving the CASA ratio to 54% from 51% in 2016. Bills payable grew by 18.7% to P20.1 billion due to higher foreign currency-denominated borrowings. Manager’s checks also went up by 20.3% to P2.4 billion from P2.0 billion because of higher customer demand. Meanwhile, income tax payable saw a 17.2% or P75.3 million drop to P362.0 million from savings in regular corporate income tax payable for the year. Accrued interest and other expenses were up by 40.7% to P2.6 billion from the setup of accruals and payroll expenses. Derivative liabilities also expanded by P24.3 million or 10.0% to P267.5 million because of the higher volume of currency swaps.
49
Total equity grew to P83.7 billion, 32.0% higher than last year‘s P63.4 billion primarily because of the upturn in capital stock and retained profits. Capital stock rose to P26.8 billion from P20.0 billion mainly from the issuance of 484 million stock rights at par value, as well as the declaration of 8% stock dividends. Likewise, capital paid in excess of par added P10.1 billion to previous year‘s outstanding balance following the completion of the P15-billion stock rights offer. Surplus increased by P3.5 billion or 9.4% to P40.4 billion mainly from retained earnings, net of total cash dividends worth P2.0 billion and stock dividends of P2.0 billion. Net unrealized loss on available-for-sale securities widened to (P1.8) billion from (P1.6) billion because of the mark-to-market revaluation loss on the Bank‘s unsold securities. Remeasurement gain on defined benefit asset registered an 11.7% increase to P283.8 million because of actuarial adjustments to the valuations of retirement plans. Cumulative translation adjustment meanwhile showed a higher negative balance at (P38.7) million from (P22.5) million last year due to the exchange rate differences arising from the conversion of income and expenses related to foreign currency-denominated positions to base currency. The Bank also recognized remeasurement on life insurance reserve of associate amounting to (P12.2) million. The Bank‘s Common Equity Tier 1 (CET 1) and total CAR were computed at 13.47% and 14.22%, respectively. The difference was accounted by the general loan loss provision limited to 1% of credit risk weighted assets as buffer for potential losses.
50
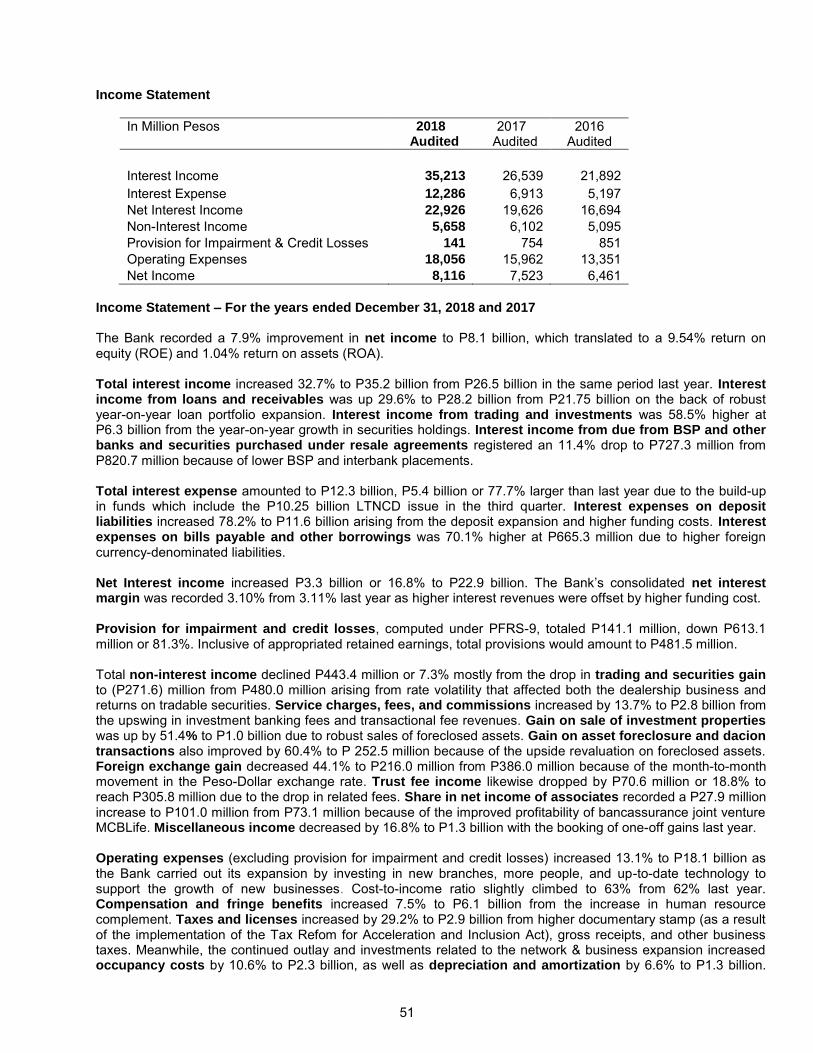
Income Statement
In Million Pesos 2018 Audited
2017 Audited
2016 Audited
Interest Income 35,213 26,539 21,892 Interest Expense 12,286 6,913 5,197 Net Interest Income 22,926 19,626 16,694 Non-Interest Income 5,658 6,102 5,095 Provision for Impairment & Credit Losses 141 754 851 Operating Expenses 18,056 15,962 13,351 Net Income 8,116 7,523 6,461
Income Statement – For the years ended December 31, 2018 and 2017 The Bank recorded a 7.9% improvement in net income to P8.1 billion, which translated to a 9.54% return on equity (ROE) and 1.04% return on assets (ROA). Total interest income increased 32.7% to P35.2 billion from P26.5 billion in the same period last year. Interest income from loans and receivables was up 29.6% to P28.2 billion from P21.75 billion on the back of robust year-on-year loan portfolio expansion. Interest income from trading and investments was 58.5% higher at P6.3 billion from the year-on-year growth in securities holdings. Interest income from due from BSP and other banks and securities purchased under resale agreements registered an 11.4% drop to P727.3 million from P820.7 million because of lower BSP and interbank placements. Total interest expense amounted to P12.3 billion, P5.4 billion or 77.7% larger than last year due to the build-up in funds which include the P10.25 billion LTNCD issue in the third quarter. Interest expenses on deposit liabilities increased 78.2% to P11.6 billion arising from the deposit expansion and higher funding costs. Interest expenses on bills payable and other borrowings was 70.1% higher at P665.3 million due to higher foreign currency-denominated liabilities. Net Interest income increased P3.3 billion or 16.8% to P22.9 billion. The Bank‘s consolidated net interest margin was recorded 3.10% from 3.11% last year as higher interest revenues were offset by higher funding cost. Provision for impairment and credit losses, computed under PFRS-9, totaled P141.1 million, down P613.1 million or 81.3%. Inclusive of appropriated retained earnings, total provisions would amount to P481.5 million. Total non-interest income declined P443.4 million or 7.3% mostly from the drop in trading and securities gain to (P271.6) million from P480.0 million arising from rate volatility that affected both the dealership business and returns on tradable securities. Service charges, fees, and commissions increased by 13.7% to P2.8 billion from the upswing in investment banking fees and transactional fee revenues. Gain on sale of investment properties was up by 51.4% to P1.0 billion due to robust sales of foreclosed assets. Gain on asset foreclosure and dacion transactions also improved by 60.4% to P 252.5 million because of the upside revaluation on foreclosed assets. Foreign exchange gain decreased 44.1% to P216.0 million from P386.0 million because of the month-to-month movement in the Peso-Dollar exchange rate. Trust fee income likewise dropped by P70.6 million or 18.8% to reach P305.8 million due to the drop in related fees. Share in net income of associates recorded a P27.9 million increase to P101.0 million from P73.1 million because of the improved profitability of bancassurance joint venture MCBLife. Miscellaneous income decreased by 16.8% to P1.3 billion with the booking of one-off gains last year. Operating expenses (excluding provision for impairment and credit losses) increased 13.1% to P18.1 billion as the Bank carried out its expansion by investing in new branches, more people, and up-to-date technology to support the growth of new businesses. Cost-to-income ratio slightly climbed to 63% from 62% last year. Compensation and fringe benefits increased 7.5% to P6.1 billion from the increase in human resource complement. Taxes and licenses increased by 29.2% to P2.9 billion from higher documentary stamp (as a result of the implementation of the Tax Refom for Acceleration and Inclusion Act), gross receipts, and other business taxes. Meanwhile, the continued outlay and investments related to the network & business expansion increased occupancy costs by 10.6% to P2.3 billion, as well as depreciation and amortization by 6.6% to P1.3 billion.
51
Insurance, which includes PDIC premium payments, grew 15.9% to P1.7 billion with the expansion in deposits. Professional fees, marketing, and other related services; entertainment, amusement and recreation; and transportation and traveling likewise rose by 12.9%, 32.4%, 27.9% respectively, with the ramp-up in business development and marketing efforts. Also, the Bank‘s repairs and maintenance was 25.8% higher at P131.2 million mainly due to technology upgrade. Miscellaneous expenses went up by 10.0% or P187.1 million primarily from increases in information technology-related expenses, litigation, and transactional costs. Income Statement – For the years ended December 31, 2017 and 2016 The Bank recorded a 16.4% improvement in net income to P7.5 billion for 2017, which translated to a 10.01% return on equity (ROE) and 1.12% return on assets (ROA). Total interest income increased by 21.2% to P26.5 billion from P21.9 billion, largely from the 21.6% uptick in interest income from loans and receivables to P21.8 billion, driven by sustained core business expansion. Interest income from trading and investments was 20.8% higher at P4.0 billion due to higher accrual revenue coming from the larger investment securities portfolio. Interest income from due from BSP and other banks and securities purchased under resale agreements registered a 14.1% increase to P820.7 million from P719.4 million because of higher BSP and interbank placements. Total interest expense amounted to P6.9 billion, up P1.7 billion mainly from increase in interest expense on deposit liabilities by 35.0% to P6.5 billion which was caused by funds build-up. Similarly, interest expense on bills payable and other borrowing grew by P25.1 million or 6.9% to P391.0 million due to the uptick in fund borrowings. Despite the 17.6% improvement in net interest income to P19.6 billion, consolidated net interest margin fell to 3.11% from 3.20% as the full-year impact of rising funding costs tempered topline gains. Provision for impairment and credit losses figured at P754.2 million, P96.4 million or 11.3% lower from prudent credit expansion coupled with the reduction in defaults & soured loans. Total non-interest income improved by 19.8% to P6.1 billion due to higher fees & commissions, significant revenues from the sale of investment properties, and booking of one-off gains. Service charges, fees, and commissions grew by 15.0% to P2.4 billion from the upswing in investment banking fees, credit card commissions, and transactional fee revenues. Foreign exchange gain grew by 21.3% or P67.9 million to P386.0 million because of larger deal volume and month-to-month movement in the Peso-Dollar exchange rate. Trust fee income likewise exceeded previous year‘s gains by P46.1 million or 14.0% and reached P376.3 million with the expansion in assets under management. Gain on sale of investment properties saw a 51.3% improvement to P670.6 million from robust sales of the Bank‘s foreclosed assets. However, gain on asset foreclosure and dacion transactions declined by P15.1 million or 8.7% due to the smaller volume of foreclosed properties. Share in net income of associates recorded a P162.5 million turnaround to P73.1 million from a loss of P89.4 million because of the improved profitability of MCBLife. Miscellaneous income increased by 72.6% to P1.5 billion from the higher recoveries of charged-off assets and recognition of one-off gains. Meanwhile, trading and securities gain dropped to P478.0 million from P918.1 million because of rate volatilities that affected both the dealership business and returns on tradable securities. Operating expenses (excluding provision for impairment and credit losses) rose 19.6% to P16.0 billion as a result of the ongoing business expansion. Compensation and fringe benefits climbed 14.6% to P5.7 billion due to the increase in human resource complement and salary adjustments from the recent collective bargaining agreement. Taxes and licenses increased by 13.2% to P2.3 billion from higher documentary stamp (as a result of the implementation of TRAIN law), gross receipts, and other business taxes. Meanwhile, the continued outlay and investments related to the network & business expansion increased occupancy costs by 15.4% to P2.1 billion, as well as depreciation and amortization by 8.2% to P1.2 billion. In the same manner, insurance, which includes PDIC premium payments, was up 23.8% to P1.4 billion from the deposit expansion. Professional fees, marketing, and other related services; entertainment, amusement and recreation, and transportation and traveling likewise rose by 16.3%, 18.3%, 26.8% respectively, with the ramp-up in business development and marketing efforts. On the other hand, the Bank‘s repairs and maintenance was reduced to P104.3 million from the 15.2% year-on-year drop in repairs. Miscellaneous expenses went up by 73.9% or P793.6 million mainly from the uptick in technology-related expenses and transactional costs.
52

Total Comprehensive Income For the years ended December 31, 2018, 2017, and 2016 The Bank recorded total comprehensive income of P7.4 billion for 2018, a P42.3 million increase from the P7.3 billion recorded last year mainly from improved net income offsetting the higher net unrealized losses on FVOCI and defined benefit asset. Meanwhile, total comprehensive income for 2016 stood at P6.1 billion, up by 20.4% or P1.2 mainly from higher net income and improvement in the fair value of financial assets on FVOCI.
53
(b) Key Performance Indicators
Definition of Ratios Profitability Ratios: Return on Average Equity - Net Income after Income Tax Average Total Equity Return on Average Assets - Net Income after Income Tax Average Total Assets Cost-to-Income Ratio Operating Expenses Less Provision for Impairment and Credit Losses Total Operating Income Net Interest Margin - Net Interest Income Average Interest Earning Assets Liquidity Ratios: Liquid Assets to Total Assets - Total Liquid Assets Total Assets Loans to Deposit Ratio - Loans (Net) Deposit Liabilities
Asset Quality Ratios: Gross NPL Ratio - Gross Non-Performing Loans
Gross Loans Non-Performing Loan (NPL) Cover - Total Allowance for Impairment and Credit Losses on Receivables
from Customers plus Retained Earnings Appropriated Gross Non-Performing Loans Solvency Ratios Debt to Equity Ratio - Total Liabilities Total Equity Asset to Equity Ratio - Total Assets Total Equity Interest Rate Coverage Ratio - Net Income Before Tax and Interest Expense Interest Expense Capital Adequacy Ratios: Capital to Risk Assets Ratio - BSP prescribed formula: CET1 / Tier 1 CAR - CET 1 / Tier 1 Capital Total Risk Weighted Assets Total CAR - Total Qualifying Capital Total Risk Weighted Assets
54
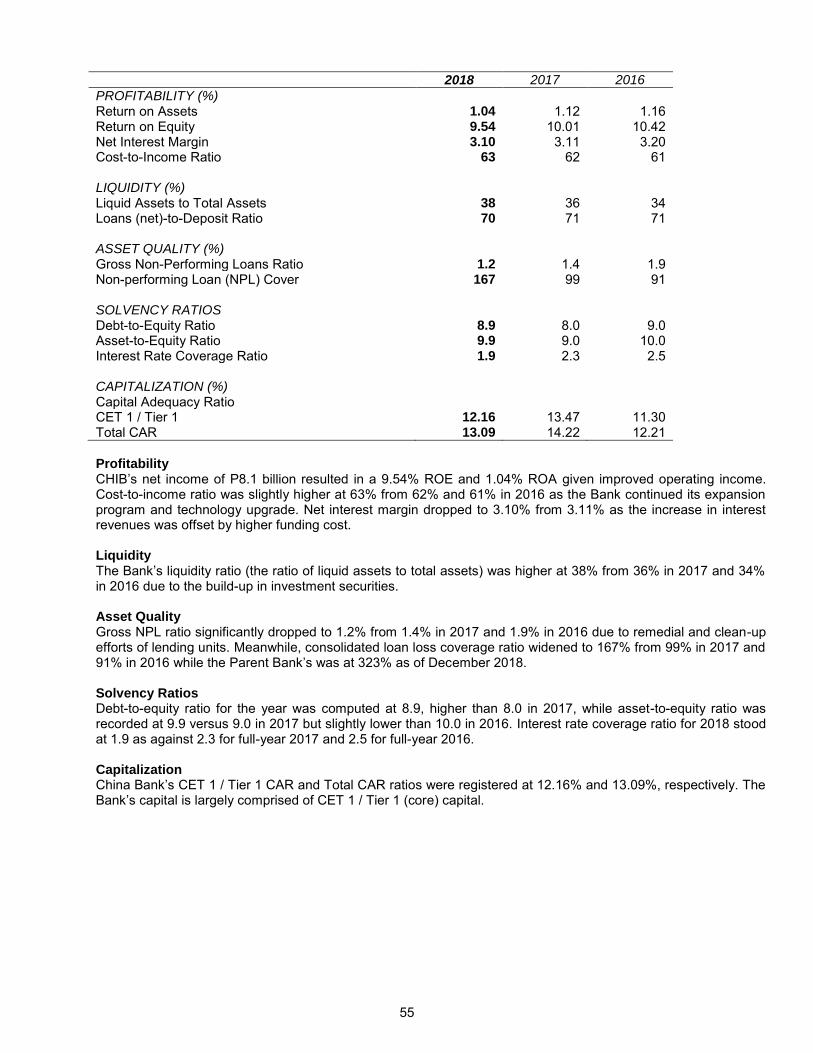
2018 2017 2016
PROFITABILITY (%) Return on Assets 1.04 1.12 1.16 Return on Equity 9.54 10.01 10.42 Net Interest Margin 3.10 3.11 3.20 Cost-to-Income Ratio 63 62 61 LIQUIDITY (%) Liquid Assets to Total Assets 38 36 34 Loans (net)-to-Deposit Ratio 70 71 71 ASSET QUALITY (%) Gross Non-Performing Loans Ratio 1.2 1.4 1.9 Non-performing Loan (NPL) Cover 167 99 91 SOLVENCY RATIOS
Debt-to-Equity Ratio 8.9 8.0 9.0 Asset-to-Equity Ratio 9.9 9.0 10.0 Interest Rate Coverage Ratio 1.9 2.3 2.5 CAPITALIZATION (%) Capital Adequacy Ratio CET 1 / Tier 1 12.16 13.47 11.30 Total CAR 13.09 14.22 12.21 Profitability CHIB‘s net income of P8.1 billion resulted in a 9.54% ROE and 1.04% ROA given improved operating income. Cost-to-income ratio was slightly higher at 63% from 62% and 61% in 2016 as the Bank continued its expansion program and technology upgrade. Net interest margin dropped to 3.10% from 3.11% as the increase in interest revenues was offset by higher funding cost. Liquidity The Bank‘s liquidity ratio (the ratio of liquid assets to total assets) was higher at 38% from 36% in 2017 and 34% in 2016 due to the build-up in investment securities. Asset Quality Gross NPL ratio significantly dropped to 1.2% from 1.4% in 2017 and 1.9% in 2016 due to remedial and clean-up efforts of lending units. Meanwhile, consolidated loan loss coverage ratio widened to 167% from 99% in 2017 and 91% in 2016 while the Parent Bank‘s was at 323% as of December 2018. Solvency Ratios Debt-to-equity ratio for the year was computed at 8.9, higher than 8.0 in 2017, while asset-to-equity ratio was recorded at 9.9 versus 9.0 in 2017 but slightly lower than 10.0 in 2016. Interest rate coverage ratio for 2018 stood at 1.9 as against 2.3 for full-year 2017 and 2.5 for full-year 2016. Capitalization China Bank‘s CET 1 / Tier 1 CAR and Total CAR ratios were registered at 12.16% and 13.09%, respectively. The Bank‘s capital is largely comprised of CET 1 / Tier 1 (core) capital.
55
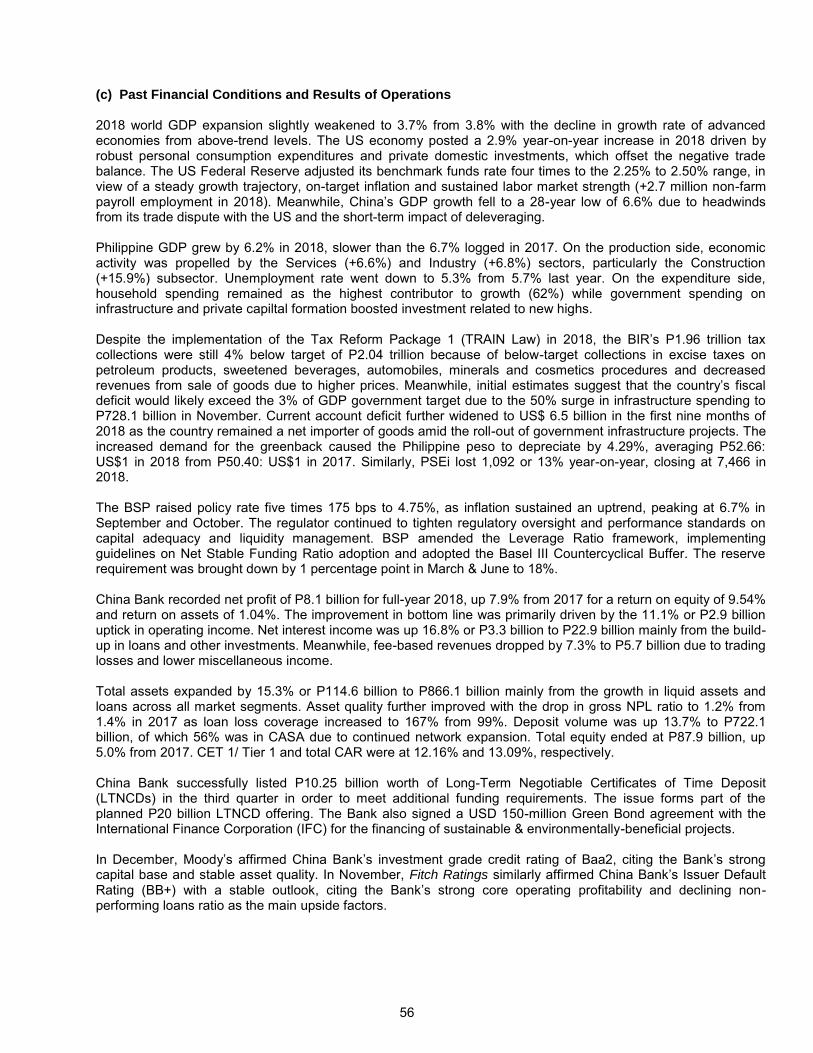
(c) Past Financial Conditions and Results of Operations 2018 world GDP expansion slightly weakened to 3.7% from 3.8% with the decline in growth rate of advanced economies from above-trend levels. The US economy posted a 2.9% year-on-year increase in 2018 driven by robust personal consumption expenditures and private domestic investments, which offset the negative trade balance. The US Federal Reserve adjusted its benchmark funds rate four times to the 2.25% to 2.50% range, in view of a steady growth trajectory, on-target inflation and sustained labor market strength (+2.7 million non-farm payroll employment in 2018). Meanwhile, China‘s GDP growth fell to a 28-year low of 6.6% due to headwinds from its trade dispute with the US and the short-term impact of deleveraging. Philippine GDP grew by 6.2% in 2018, slower than the 6.7% logged in 2017. On the production side, economic activity was propelled by the Services (+6.6%) and Industry (+6.8%) sectors, particularly the Construction (+15.9%) subsector. Unemployment rate went down to 5.3% from 5.7% last year. On the expenditure side, household spending remained as the highest contributor to growth (62%) while government spending on infrastructure and private capiltal formation boosted investment related to new highs. Despite the implementation of the Tax Reform Package 1 (TRAIN Law) in 2018, the BIR‘s P1.96 trillion tax collections were still 4% below target of P2.04 trillion because of below-target collections in excise taxes on petroleum products, sweetened beverages, automobiles, minerals and cosmetics procedures and decreased revenues from sale of goods due to higher prices. Meanwhile, initial estimates suggest that the country‘s fiscal deficit would likely exceed the 3% of GDP government target due to the 50% surge in infrastructure spending to P728.1 billion in November. Current account deficit further widened to US$ 6.5 billion in the first nine months of 2018 as the country remained a net importer of goods amid the roll-out of government infrastructure projects. The increased demand for the greenback caused the Philippine peso to depreciate by 4.29%, averaging P52.66: US$1 in 2018 from P50.40: US$1 in 2017. Similarly, PSEi lost 1,092 or 13% year-on-year, closing at 7,466 in 2018. The BSP raised policy rate five times 175 bps to 4.75%, as inflation sustained an uptrend, peaking at 6.7% in September and October. The regulator continued to tighten regulatory oversight and performance standards on capital adequacy and liquidity management. BSP amended the Leverage Ratio framework, implementing guidelines on Net Stable Funding Ratio adoption and adopted the Basel III Countercyclical Buffer. The reserve requirement was brought down by 1 percentage point in March & June to 18%. China Bank recorded net profit of P8.1 billion for full-year 2018, up 7.9% from 2017 for a return on equity of 9.54% and return on assets of 1.04%. The improvement in bottom line was primarily driven by the 11.1% or P2.9 billion uptick in operating income. Net interest income was up 16.8% or P3.3 billion to P22.9 billion mainly from the build-up in loans and other investments. Meanwhile, fee-based revenues dropped by 7.3% to P5.7 billion due to trading losses and lower miscellaneous income. Total assets expanded by 15.3% or P114.6 billion to P866.1 billion mainly from the growth in liquid assets and loans across all market segments. Asset quality further improved with the drop in gross NPL ratio to 1.2% from 1.4% in 2017 as loan loss coverage increased to 167% from 99%. Deposit volume was up 13.7% to P722.1 billion, of which 56% was in CASA due to continued network expansion. Total equity ended at P87.9 billion, up 5.0% from 2017. CET 1/ Tier 1 and total CAR were at 12.16% and 13.09%, respectively. China Bank successfully listed P10.25 billion worth of Long-Term Negotiable Certificates of Time Deposit (LTNCDs) in the third quarter in order to meet additional funding requirements. The issue forms part of the planned P20 billion LTNCD offering. The Bank also signed a USD 150-million Green Bond agreement with the International Finance Corporation (IFC) for the financing of sustainable & environmentally-beneficial projects. In December, Moody‘s affirmed China Bank‘s investment grade credit rating of Baa2, citing the Bank‘s strong capital base and stable asset quality. In November, Fitch Ratings similarly affirmed China Bank‘s Issuer Default Rating (BB+) with a stable outlook, citing the Bank‘s strong core operating profitability and declining non-performing loans ratio as the main upside factors.
56

The Bank sustained its network expansion efforts by opening of 24 new branches, growing the banking footprint to 620 branches complemented by 966 ATMs. Branch-based marketing programs focused on customer onboarding, deposit generation, and improvement of customer experience in support of core business growth and cross-selling initiatives. The thrust at the retail front was bolstered by the launch of new deposit products. The Bank‘s investment house, China Bank Capital, increased Its presence in the capital markets by participating in several underwriting deals, including Sta. Lucia Land‘s P5-billion corporate notes (sole arranger and bookrunner), SMC Global Power Holding Corp.‘s P15-billion retail bonds (joint issue manager, joint lead underwriter and bookrunner), and Metro Pacific Investment Corporation‘s P20-billion corporate notes (co-arranger), among others. CBCC was recognized Best Debt Capital Markets House at the 2018 Finance Asia Country Awards, as well as Best Bank for Debt Capital Market by the Global Banking & Finance Review. The Asset also awarded CBC the following: Best Local Bond Adviser - Domestic, Best Corporate Bond for Ayala Corporation‘s US$400-million fixed-rate bond, Best Local Currency Bond for Ayala Land Inc.‘s P4.3-billion Short-Dated Notes, and Best Follow-On for Del Monte Pacific‘s US$200-million preferred shares. At the Best Deal & Solution Awards, CBCC was given Best Bond Deal for Retail Investors in Southeast Asia for participation in the Bureau of Treasury‘s P181-billion Retail Treasury Bonds. In 2018, China Bank ranked among the Top 50 Publicly listed companies at the ASEAN Corporate Governance Awards. The Bank was also recognized as Best IR Company and Best IR Professional by Corporate Governance Asia at the 8
th Asian Excellence Awards; as well as Best Bank for Corporate Governance and Best Investor
Relations Bank at the Global Banking & Finance Awards. CHIB was also among the Top 10 Philippine companies in the 2017 ASEAN Corporate Governance Scorecard, having exceeded the score of 100.
57
(d) Future Prospects
The global economy could slow down in 2019 from downside risks posed by inflation and ongoing trade dispute between the US and China. Despite the spillover effects of the fiscal stimulus, US economic growth may fall below the estimated 2.9% for 2018. Meanwhile, China may continue to underperform due to the tighter credit environment and weaker export demand. Central banks are expected to pursue monetary policy tightening but at a more gradual pace given subdued growth prospects and inflation. IMF sees average oil prices to settle just below $60 per barrel in 2019. On the domestic front, economic activity would be mainly supported by the government‘s infrastructure program, May 2019 elections and the recovery in consumer spending as commodity prices normalize. GDP growth is seen to settle below or near the low-end (7%) of the government‘s target as the infrastructure spending further widens the country‘s current account deficit. As a result, Peso is expected to depreciate to as low as P54.00: US$1.00. In February 2019, President Duterte signed into law RA 11211, an amendment to the New Central Bank Act, which raised the BSP‘s capitalization to P200 billion from P50 billion to support the requirements of a growing economy and financial system. It also restored BSP‘s authority to issue debt papers as part of its regular open market operations. On the other hand, major banks have announced plans to raise fresh funds aggregating P466 billion to finance their medium-term growth initiatives. China Bank envisions becoming one of the top-performing financial institutions in terms of profitability and shareholder value over the next five years. To do so, the Bank will focus on four key goals: 1) growth in revenues and size of business; 2) operational excellence; 3) a customer-centric approach to doing business; and 4) higher engagement with the employees. At the forefront of core business expansion is fund build-up, particularly low-cost deposits. In 2019, the Bank will develop client acquisition & retention programs, as well as launch new deposit products and services suited to the needs of the retail and other emerging sectors. As the branch network grows, management will continue to review the organizational structure of distribution channels and recalibrate branch functions in order to accommodate more high-value transactions. The synergy between branches and other sales desks will be tightened to drive internal client sourcing, cross-selling, and leads generation programs, while maintaining prudent credit standards. The Bank‘s consumer business is set to steadily expand and grow its share to the consolidated loan portfolio. Satellite offices dedicated to servicing housing, auto, and personal loans will be set up in selected branches to ramp up relationship-building with new and existing retail clients. This will be complemented by the suite of fee-based products & services, such as non-life insurance, trust, bancassurance, wealth management, and securities brokering, as well as the China Bank credit cards in order to achieve a more comprehensive product coverage. China Bank Savings, on its end, would further build up its Automatic Payroll Deduction (APD) portfolio by widening the geographical footprint of sales offices, increasing visibility in DepEd events, and providing critical marketing & operational support to branches. This includes continuous improvement to the existing loans origination workflow significantly cutting manual processes from application to approval. In line with its goal of becoming a digitally-powered and highly-automated bank by its centennial year, China Bank will streamline key processes related to the rolling growth mandate, cut redundancies, and automate manual procedures even as it institutionalizes inter-departmental service level agreements to generate operational efficiencies and provide superior customer experience. Likewise, the Bank will launch programs to drive up enrollment and utilization rates for all alternative channels like ATMs, Cash Accept Machines, and the internet & mobile banking platform to facilitate efficient but secure banking transactions. China Bank will strengthen its 98-year franchise by building a service-oriented organization with highly-engaged employees to be able to meet the challenges of today‘s competitive banking landscape. China Bank Academy will continue to design and roll-out human capital development programs tailor fitted to the Bank‘s growth directive, digitization roadmap, and its goal of becoming the bank of choice for its clients.
58
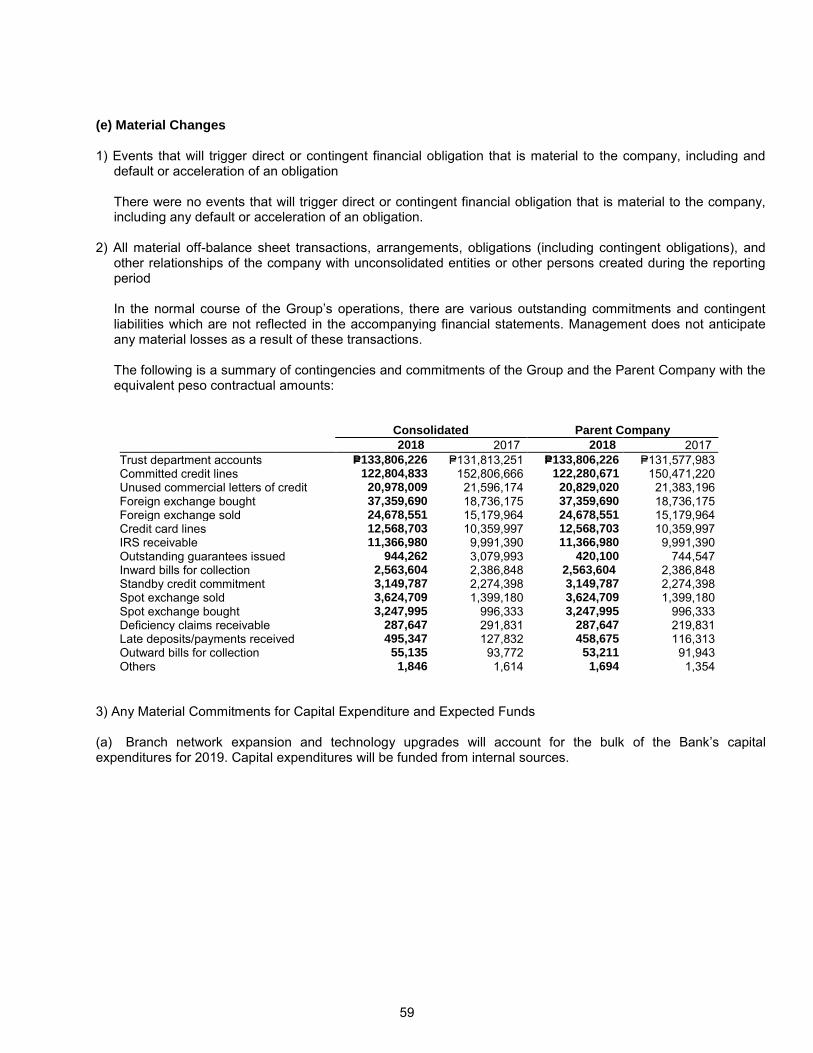
(e) Material Changes 1) Events that will trigger direct or contingent financial obligation that is material to the company, including and
default or acceleration of an obligation There were no events that will trigger direct or contingent financial obligation that is material to the company,
including any default or acceleration of an obligation. 2) All material off-balance sheet transactions, arrangements, obligations (including contingent obligations), and
other relationships of the company with unconsolidated entities or other persons created during the reporting period
In the normal course of the Group‘s operations, there are various outstanding commitments and contingent
liabilities which are not reflected in the accompanying financial statements. Management does not anticipate any material losses as a result of these transactions.
The following is a summary of contingencies and commitments of the Group and the Parent Company with the equivalent peso contractual amounts: Consolidated Parent Company
2018 2017 2018 2017 Trust department accounts P=133,806,226 P=131,813,251 P=133,806,226 P=131,577,983 Committed credit lines 122,804,833 152,806,666 122,280,671 150,471,220 Unused commercial letters of credit 20,978,009 21,596,174 20,829,020 21,383,196 Foreign exchange bought 37,359,690 18,736,175 37,359,690 18,736,175 Foreign exchange sold 24,678,551 15,179,964 24,678,551 15,179,964 Credit card lines 12,568,703 10,359,997 12,568,703 10,359,997 IRS receivable 11,366,980 9,991,390 11,366,980 9,991,390 Outstanding guarantees issued 944,262 3,079,993 420,100 744,547 Inward bills for collection 2,563,604 2,386,848 2,563,604 2,386,848 Standby credit commitment 3,149,787 2,274,398 3,149,787 2,274,398 Spot exchange sold 3,624,709 1,399,180 3,624,709 1,399,180 Spot exchange bought 3,247,995 996,333 3,247,995 996,333 Deficiency claims receivable 287,647 291,831 287,647 219,831 Late deposits/payments received 495,347 127,832 458,675 116,313 Outward bills for collection 55,135 93,772 53,211 91,943 Others 1,846 1,614 1,694 1,354
3) Any Material Commitments for Capital Expenditure and Expected Funds (a) Branch network expansion and technology upgrades will account for the bulk of the Bank‘s capital expenditures for 2019. Capital expenditures will be funded from internal sources.
59
Item 7. Financial Statements
Please refer to the attached Annex A for the Audited Financial Statements for the years 2018 and 2017. SyCip Gorres Velayo & Co. (SGV & Co.) has been the Bank's independent auditor for more than 20 years and is again recommended for appointment at the scheduled annual stockholders' meeting. In compliance with SEC Memorandum Circular No. 8, Series of 2003, and Amendments to SRC Rule 68 on the rotation of external auditors or signing partners of a firm every after five (5) years of engagement, Mr. Ray Francis C. Balagtas was assigned since 2016 as SGV & Co. partner-in-charge for the Bank. None of the Bank's external auditors have resigned during the two (2) most recent fiscal years (2018 and 2017) or any interim period. Representatives of SGV & Co. are expected to be present at the stockholders‘ meeting to respond to any matter that may be pertinently raised during the meeting. Their representative will be given the opportunity to make a statement if they so desire. Fiscal Year Audit and Audit-Related Fees Tax Fees All Other Fees
2018 P7,766,528 --- P6,312,320 2017 P8,192,800 --- P 254,240 Audit and Audit-Related Fees cover services rendered for the performance of the audit or review of the Bank's financial statements including the combined financial statements of Trust Group, and the issuance of comfort letters relative to the Stock Rights and Long Term Negotiable Certificates of Deposits offering. The 2018 and 2017 audit fees were taken up and approved by the Audit Committee at its regular meetings on February 28, 2019 and February 21, 2018, respectively. Tax fees related to the audit of tax accounting and compliance are already incorporated in the year-end audit fees under Audit and Audit-Related Fees category as this is part of the audit process conducted by the external auditors. The Board/Audit Committee likewise discussed, approved, and authorized to engage the services of SGV & Co in non-audit work for the independent review of PFRS 9 Expected Credit Loss Models, independent validation of votes in the annual stockholders‗ meeting and for the compliance certificate issued to the international bank lenders. Payment for these services and seminar fees are included under All Other Fees. The Bank's Audit Committee, which is composed of Messrs. Alberto S. Yao (Chairman), Joaquin T. Dee, and Philip S.L. Tsai, approves the audit fees and fees for non-audit services of external auditors, as emphasized in Article V.12 of the Committee's Charter. SGV & Co. also confirmed that they did not have any disagreement with Management that could be significant to the Bank‘s financial statements or their auditor‘s report. Further, there are no matters that in their professional judgment may reasonably be thought to bear on their independence or that they gave significant consideration to in reaching the conclusion that independence has not been impaired.
Item 8. Changes in and Disagreements with Accountants on Accounting and Financial Disclosures
The financial statements of the Bank for the year ending December 31, 2018 and December 31, 2017 have been audited by SGV & Co./Ernst & Young in accordance with the Philippine Financial Reporting Standards. There were no changes in and disagreements with accountants on accounting and financial disclosures.
60
PART III - CONTROL AND COMPENSATION INFORMATION Item 9. Directors and Executive Officers of the Issuer
(a) Incumbent Directors and Advisor Hans T. Sy, 63, Filipino, is the Chairman of the Board since May 5, 2011. He became a member of the China Bank Board on May 21, 1986, and was elected Vice Chairman in 1989. Chairman Sy also serves in the Boards of other companies listed in the Philippine Stock Exchange (PSE): as Director and Chairman of the Executive Committee in SM Prime Holdings, Inc. and Adviser to the Board of SM Investments Corporation. He holds key positions in several companies within the SM Group. He earned his Bachelor of Science degree in Mechanical Engineering from the De La Salle University. He participates in numerous trainings and seminars, the latest of which is the Corporate Governance training program conducted by the Institute of Corporate Directors (ICD) in November 2018. Gilbert U. Dee, 83, Filipino, is the Vice Chairman of the Board since May 5, 2011. He became a member of China Bank Board on March 6, 1969, and served as Board Chairman from 1989 to 2011. He also serves in other companies not listed in the PSE, namely, as Chairman of the Boards of Union Motor Corporation and China Bank subsidiary CBC Properties and Computer Center, Inc. (CBC-PCCI). He previously held directorship positions in Philippine Pacific Capital Corporation, Philex Mining Corporation, CBC Finance Corporation and Super Industrial Corporation. Vice Chairman Dee is a graduate of Bachelor of Science in Banking from the De La Salle University, and has a Master‘s in Business Administration (MBA) degree in Finance from the University of Southern California. He has had extensive training in banking over the years which include participation in ICD‘s Corporate Governance training program in 2018. William C. Whang, 60, Filipino, is Director and President of the Bank since November 1, 2017. He does not hold any directorship position in any other PSE-listed company apart from China Bank. He also serves in the boards of Bank subsidiaries China Bank Savings, Inc. (CBSI), Chinabank Insurance Brokers, Inc. (CBC-IBI), CBC-PCCI, China Bank Capital Corporation (CBCC), and China Bank Securities Corporation (CBSC). He is actively involved in the boards of BancNet, Inc., Banker‘s Association of the Philippines, Philippine Payments Management Inc., and Manulife China Bank Life Assurance Corporation (MCBLife). He has more than 38 years of banking experience, previously holding key positions in various financial institutions including Metrobank, Republic National Bank of New York, International Exchange Bank, Security Bank, and Sterling Bank of Asia. Director and President Whang is a Bachelor of Science degree holder in Commerce, Major in Business Management, from the De La Salle University. He participated in numerous seminars and conferences such as on corporate governance, Anti-Money Laundering (AML), branch based marketing, quality service management, sales management, and corporate strategy. Peter S. Dee, 77, Filipino, has been on the China Bank Board since April 14, 1977. He is currently independent director of PSE-listed companies City & Land Developers, Inc. and Cityland Development Corporation. He serves in other non-listed companies including China Bank subsidiaries CBC-PCCI and CBC-IBI, Hydee Management & Resources Corporation, Commonwealth Foods, Inc., and GDSK Development Corporation. He was the President and Chief Executive Officer of China Bank from 1985 to 2014, and a director of Sinclair (Phils.) Inc., Can Lacquer, Inc., and CBC Forex Corporation. Director Dee took his Bachelor of Science degree in Commerce at the De La Salle University/University of the East. He attended a Special Banking Course at the American Institute of Banking. He has had extensive trainings which include AML in December 2017 and corporate governance in December 2017 and November 2018. Joaquin T. Dee, 83, Filipino, is a member of the China Bank Board since May 10, 1984. He does not hold directorship position in any PSE-listed company other than China Bank. At present, he is the Director/Chairman of JJACCIS Development Corporation, Director/President of Enterprise Realty Corporation, and Director/Treasurer of Suntree Holdings Corporation. From 1964 to 1994, he served as Vice President for Sales and Administration of Wellington Flour Mills. Director Dee is a Bachelor of Science degree holder in Commerce from the Letran College. He continues to attend in various trainings and seminars related to banking, the most recent of which is the Corporate Governance Training conducted by the ICD in November 2018. Herbert T. Sy, 62, Filipino, was first elected to the China Bank Board on January 7, 1993. Aside from the Bank, he serves in PSE-listed SM Prime Holdings, Inc. as Director, and in various non-listed companies including Supervalue, Inc., Super Shopping Market, Inc., Sondrik, Inc., and Sanford Marketing Corp. as Chairman, and in
61
the National University as Director. He has been involved in companies engaged in food retailing, investment, real estate development and mall operations. Director Sy earned his Bachelor of Science degree in Management at the De La Salle University. He participated in numerous banking-related trainings, including those on corporate governance in 2018 and AML in 2017. Harley T. Sy, 59, Filipino, is China Bank Director since May 24, 2001. He is also an Executive Director of SM Investments Corporation, one of the largest publicly listed companies in the Philippines, and of other non-listed companies in the SM group. A graduate of Bachelor of Science degree in Commerce, Major in Finance, from the De La Salle University, Director Sy has had extensive trainings on enhancing banking skills, including programs on enterprise risk management, Anti-Money Laundering and corporate governance. Alberto S. Yao, 72, Filipino, is the Lead Independent Director of the Bank. He was elected to the China Bank Board on July 7, 2004. He holds directorship in companies not listed in the PSE – as President & CEO of Richwell Philippines, Inc. and Internationale Globale Marques, Inc.; President of Richphil House Incorporated; and Member of` the Philippine Constitution Association. He is also Independent Director in the Bank subsidiaries: CBSI, CBCC, and CBSC. In the past, he was Vice President for Merchandising of Zenco Sales, Inc., Director of Planters Development Bank, President and CEO of Richwell Trading Corporation and Europlay Distributor Co., Inc., and President of Megarich Property Ventures Corporation. A graduate of Bachelor of Science in Business Administration, Minor in Accounting, from the Mapua Institute of Technology, Director Yao participated in various seminars including ICD‘s Corporate Governance Training Program in 2018 and AMLA seminar in 2017. Jose T. Sio, 79, Filipino, was first elected to the China Bank Board on November 7, 2007. He is presently affiliated with the following PSE-listed companies: (1) SM Investments Corporation, as Chairman of the Board; (2) Atlas Consolidated Mining and Development Corporation, as Director; (3) Belle Corporation, as Director; (4) Concrete Aggregates Corporation, as Director; (5) SM Prime Holdings, Inc. as Adviser of Audit Committee/Risk Oversight Committee; (6) BDO Unibank, Inc., as Adviser to the Board; and (7) Premium Leisure Corporation, as Adviser to the Board. Mr. Sio also serves in the boards of companies not listed in the PSE, including OCLP Holdings, Inc., and NLEX Corporation. He is the President of SM Foundation, Inc. In the past, he was a Senior Partner at SyCip Gorres Velayo & Co. (SGV). He was voted as CFO of the Year in 2009 by the Financial Executives of the Philippines (FINEX); and in various years, he was awarded as Best CFO (Philippines) by Hong Kong-based business publications such as Alpha Southeast Asia, Corporate Governance Asia, Finance Asia and The Asset. Director Sio is a Certified Public Accountant and obtained his Bachelor of Science degree in Commerce, major in Accounting, from the University of San Agustin. He obtained his Master‘s degree in Business Administration from the New York University, U.S.A. He participated in various trainings such as on investments, loans and financial instruments, debt and equity financing during the Euromoney Conference in China in 2005, AML in 2017 and Advanced Corporate Governance in 2018. Margarita L. San Juan, 65, Filipino, is an Independent Director of the Bank. On May 4, 2017, she was first elected to the China Bank Board. She does not hold directorship position in any other PSE-listed company. She is currently Independent Director of Bank subsidiaries CBSI, CBCC, and CBC-IBI. She worked with Ayala Investment and Development Corporation, Commercial Bank and Trust Co., and in the Bank‘s Account Management Group as Senior Vice President and Group Head until her retirement in 2012. Director San Juan graduated with a Bachelor of Science degree in Business Administration, Major in Financial Management, from the University of the Philippines, and completed the Advance Bank Management Program from the Asian Institute of Management (AIM). She attended various trainings including development financing, international banking operations, marketing, financial analysis and control, credit and risk management, and the latest on AML in 2017 and corporate governance in 2018. Philip S.L. Tsai, 68, Filipino, was first elected as Independent Director on November 7, 2018 to serve the unexpired term of Mr. Roberto F. Kuan who passed away on September 15, 2018. Aside from the Bank, he does not hold any position in other PSE-listed companies. He currently serves as Independent Director of China Bank subsidiaries CBSI, CBCC and CBC-IBI. He has had more than 35 years of banking experience. He previously held positions in First CBC Capital (Asia) Limited, Midwest Medical Management, Fortune Paper Inc., Chemical Bank New York, Consolidated Can Corp., Plastic Container Packaging, and in the Bank‘s Retail Banking Business until his retirement in 2015. Director Tsai earned his Bachelor of Science degree in Business Administration from the University of the Philippines, and received his Master‘s degree in Business Administration from the Roosevelt University in Chicago, Illinois. He has attended several trainings on corporate governance, bank protection, AML, and branch-based marketing, among others.
62
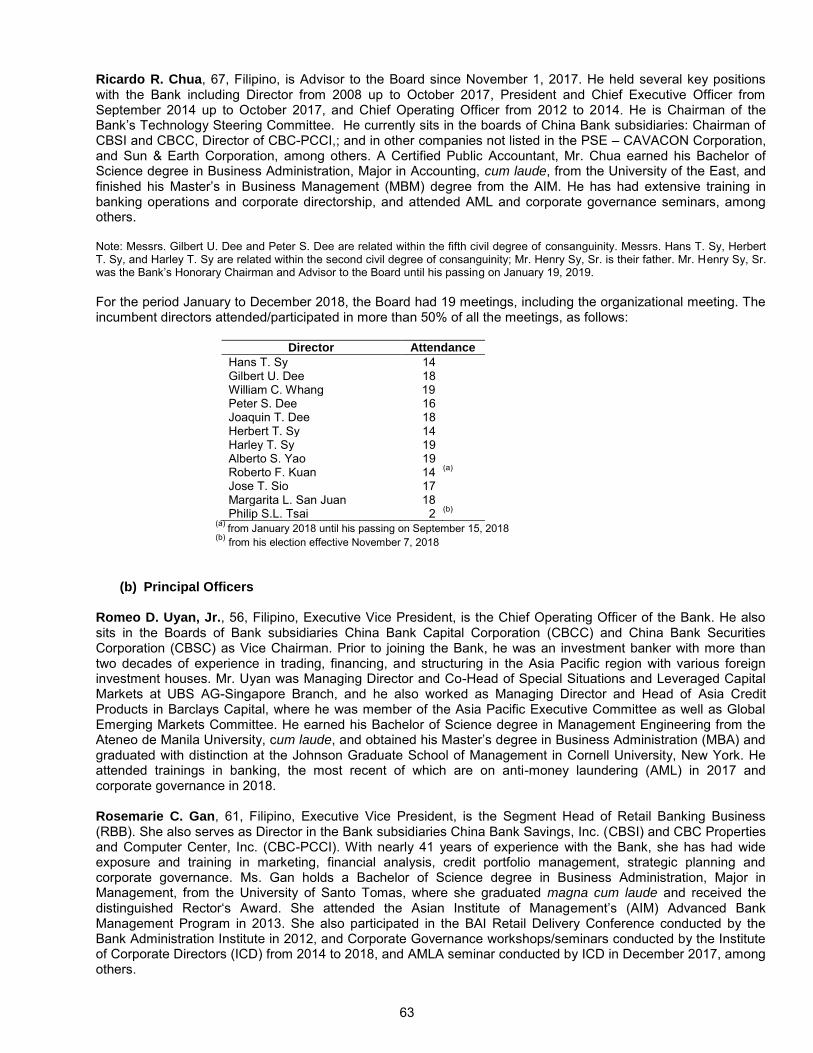
Ricardo R. Chua, 67, Filipino, is Advisor to the Board since November 1, 2017. He held several key positions with the Bank including Director from 2008 up to October 2017, President and Chief Executive Officer from September 2014 up to October 2017, and Chief Operating Officer from 2012 to 2014. He is Chairman of the Bank‘s Technology Steering Committee. He currently sits in the boards of China Bank subsidiaries: Chairman of CBSI and CBCC, Director of CBC-PCCI,; and in other companies not listed in the PSE – CAVACON Corporation, and Sun & Earth Corporation, among others. A Certified Public Accountant, Mr. Chua earned his Bachelor of Science degree in Business Administration, Major in Accounting, cum laude, from the University of the East, and finished his Master‘s in Business Management (MBM) degree from the AIM. He has had extensive training in banking operations and corporate directorship, and attended AML and corporate governance seminars, among others. Note: Messrs. Gilbert U. Dee and Peter S. Dee are related within the fifth civil degree of consanguinity. Messrs. Hans T. Sy, Herbert T. Sy, and Harley T. Sy are related within the second civil degree of consanguinity; Mr. Henry Sy, Sr. is their father. Mr. Henry Sy, Sr. was the Bank‘s Honorary Chairman and Advisor to the Board until his passing on January 19, 2019. For the period January to December 2018, the Board had 19 meetings, including the organizational meeting. The incumbent directors attended/participated in more than 50% of all the meetings, as follows:
Director Attendance
Hans T. Sy 14 Gilbert U. Dee 18 William C. Whang 19
Peter S. Dee 16 Joaquin T. Dee 18 Herbert T. Sy 14 Harley T. Sy 19 Alberto S. Yao 19 Roberto F. Kuan 14 (a) Jose T. Sio 17 Margarita L. San Juan 18 Philip S.L. Tsai 2 (b)
(a) from January 2018 until his passing on September 15, 2018 (b) from his election effective November 7, 2018
(b) Principal Officers
Romeo D. Uyan, Jr., 56, Filipino, Executive Vice President, is the Chief Operating Officer of the Bank. He also sits in the Boards of Bank subsidiaries China Bank Capital Corporation (CBCC) and China Bank Securities Corporation (CBSC) as Vice Chairman. Prior to joining the Bank, he was an investment banker with more than two decades of experience in trading, financing, and structuring in the Asia Pacific region with various foreign investment houses. Mr. Uyan was Managing Director and Co-Head of Special Situations and Leveraged Capital Markets at UBS AG-Singapore Branch, and he also worked as Managing Director and Head of Asia Credit Products in Barclays Capital, where he was member of the Asia Pacific Executive Committee as well as Global Emerging Markets Committee. He earned his Bachelor of Science degree in Management Engineering from the Ateneo de Manila University, cum laude, and obtained his Master‘s degree in Business Administration (MBA) and graduated with distinction at the Johnson Graduate School of Management in Cornell University, New York. He attended trainings in banking, the most recent of which are on anti-money laundering (AML) in 2017 and corporate governance in 2018. Rosemarie C. Gan, 61, Filipino, Executive Vice President, is the Segment Head of Retail Banking Business (RBB). She also serves as Director in the Bank subsidiaries China Bank Savings, Inc. (CBSI) and CBC Properties and Computer Center, Inc. (CBC-PCCI). With nearly 41 years of experience with the Bank, she has had wide exposure and training in marketing, financial analysis, credit portfolio management, strategic planning and corporate governance. Ms. Gan holds a Bachelor of Science degree in Business Administration, Major in Management, from the University of Santo Tomas, where she graduated magna cum laude and received the distinguished Rector‗s Award. She attended the Asian Institute of Management‘s (AIM) Advanced Bank Management Program in 2013. She also participated in the BAI Retail Delivery Conference conducted by the Bank Administration Institute in 2012, and Corporate Governance workshops/seminars conducted by the Institute of Corporate Directors (ICD) from 2014 to 2018, and AMLA seminar conducted by ICD in December 2017, among others.
63
Alberto Emilio V. Ramos, 59, Filipino, Executive Vice President, is Director and President of Bank subsidiary CBSI since his secondment in 2011. At present, he sits in the Boards of Manulife China Bank Life Assurance Corporation (MCBLife) and CBCC. He is also a Trustee/First Vice President of the Chamber of Thrift Banks. Prior to joining the Bank in 2006 as Head of Private Banking Group, he was President of Philam Asset Management, Inc., and worked in key positions in local and international banks, including the Bank of the Philippine Islands and Citytrust Banking Corporation. Mr. Ramos is a graduate of Bachelor of Arts in Political Science and Bachelor of Science in Commerce, Major in Marketing Management, from the De La Salle University. He earned his Master‘s in Business Management (MBM) degree from the AIM and he has a Treasury Professional Certificate from the Bankers Association of the Philippines. He is actively involved in numerous training programs on SME Banking, corporate governance, treasury products, asset-liability management, credit and financial analysis, and strategic marketing planning. Patrick D. Cheng, 56, Filipino, Senior Vice President, is the Chief Finance Officer of the Bank. He also serves in the Bank subsidiaries - in China Bank Insurance Brokers, Inc. (CBC-IBI) as Chairman of the Board, and in CBSI as Director. He also serves in the boards of Manila Overseas Commercial Inc. and SR Holdings Corporation. In the past, he held several key positions at the Philippine Bank of Communications, HSBC Savings Bank (Philippines), HSBC (Philippine Branch), Citicenter Condominium Corp., and Citibank N.A. (Philippine Branch). He was the President and Chief Executive Officer of HSBC Savings Bank (Philippines) from 2008 to 2013 and was also a two-term President of the Chamber of Thrift Banks from 2011 to 2012. A Certified Public Accountant placing 7th in the National Exams, Mr. Cheng graduated magna cum laude from the University of the Philippines with a Bachelor of Science degree in Business Administration and Accountancy. He earned his Master‘s in Management degree, with Distinction, from the Hult International Business School in Cambridge, Massachusetts, and finished the Trust Operations and Investment Management course, also with Distinction, from the Trust Institute of the Philippines. In 2010, he received the Distinguished Alumnus Award from the Virata School of Business of the University of the Philippines – Diliman. He has had extensive training on corporate governance, AML, asset liability management, operational risk, and information security. Alexander C. Escucha, 62, Filipino, Senior Vice President, is the Head of the Investor and Corporate Relations Group. He is also a Director of Bank subsidiary CBSI and Chairman of the UP Visayas Foundation, Inc. Board of Trustees. He is a fellow of the Foundation for Economic Freedom (FEF) and a member of the Shareholders Association of the Philippines (SharePhil). He has served as president of the Philippine Economic Society (PES) and concurrent Chairman of the Federation of ASEAN Economic Associations (FAEA), and president of the Corporate Planning Society of the Philippines (CPSP) and Bank Marketing Association of the Philippines (BMAP). As an international resource person, he chaired the Technology Conferences at the Asian Banker Summit from 2006 to 2016 and chaired its Technology awards from 2007 to 2011. Prior to joining the Bank, he was Vice President of International Corporate Bank (InterBank). Mr. Escucha obtained his Bachelor of Arts degree in Economics, cum laude, from the University of the Philippines and was the G.P. Sicat awardee for Most Outstanding Undergraduate Thesis. Over the years, he participated in various seminars here and abroad – the BSP/IFC Sustainable Finance Forum in February 2018, Moody‘s ASEAN Briefing in June 2018, the CFA Society Training on ETHICS in June 2018, the SEC-PSE Corporate Governance Summit in October 2018, Microsoft CEO Forum, Investment Conferences of CFA Society Philippines and The Asset, GRI Sustainability Summit in October 2018, the Annual conventions of the PES and FAEA in November 2018, and BSP Financial Education Forum and Expo in November 2018 and the UN ARISE Disaster Resilience Summit in December 2018. Lilian Yu, 53, Filipino, Senior Vice President, is the Head of Institutional Banking Group. She also serves as Director in the boards of Bank subsidiaries CBSC and CBCC. Her extensive experience in the financial industry spans the areas of credit, project and structured finance, and debt capital markets. She was an International Consultant for the Asian Development Bank before joining the Bank. She worked for various international financial institutions abroad such as Barclays Capital, ABN Amro Bank, Deutsche Bank and the International Finance Corporation (IFC) of the World Bank Group. A Certified Public Accountant (CPA), Ms. Yu is a graduate of Bachelor of Science in Business Administration and Accountancy, magna cum laude, from the University of the Philippines. She obtained her MBA degree from the Wharton School of the University of Pennsylvania. She was also conferred the Certified Financial Analyst (CFA) designation by the CFA Institute. Benedict L. Chan, 42, Filipino, First Vice President II, is the Bank Treasurer and Head of Treasury Group. He has over 20 years of experience on trading and portfolio management gained from various financial institutions including Trinitus Asset Management, BNP Paribas Singapore, BNP Paribas London, ING Bank Singapore, ING Bank Hongkong, and ING Bank Manila. Mr. Chan is a Bachelor of Science degree holder in Management
64
Engineering from the Ateneo de Manila University. He is also a recipient of Financial Markets Regulatory and Practice Certificate from the Singapore‘s Institute of Banking and Finance in 2013, and has successfully passed the Hongkong Securities Paper Exam 1 conducted by the HK FEC (Hongkong) in 2016. Ananias S. Cornelio III, 43, Filipino, First Vice President II, is the Chief Risk Officer of the Bank. He spent more than 20 years of banking experience, handling risk, treasury or audit functions at Development Bank of the Philippines, Rizal Commercial Banking Corporation, First Metro Investment Corporation, and Solidbank Corporation. Mr. Cornelio graduated with a Bachelor of Science degree in Commerce, with academic distinction, from the San Beda College, and a Master‘s degree in Public Administration, academic scholar, from the National University of Singapore. He has also attended the Bank Management Course from the AIM. He has had extensive trainings on corporate governance, macro prudential supervision and regulatory change, risk management, Basel Standards, fixed income, credit derivatives and structured products, interest rate and currency derivatives, ISDA documentation, and economic forecasting, among others. He has been a panelist/speaker in major events in the region which include The Asian Banker Summit, ASEAN Risk Forum, Risk Minds Asia, and ADB Regional Forum on Financial Asset and Liability, and a resource person/lecturer for the Bankers Institute of the Philippines (BAIPHIL), and the Association of Development Financing Institutions in Asia and the Pacific (ADFIAP). He is presently the Sub-Committee Chairman on Basel Standards Implementation of the Bankers Association of the Philippines. Renato K. De Borja, Jr., 47, Filipino, First Vice President II, is the Head of the Remittance and Cards Business Group. He also serves as Director and Treasurer in the Bank‘s subsidiary CBC-IBI. He has more than 25 years of banking experience, previously holding positions of Director at East West Rural Bank and Green Bank (a Rural Bank), Chief Finance Officer (CFO) at East West Banking Corporation, Citigroup Business Process Solutions and ROHQ, and Metrobank Card Corporation, and different Finance and Accounting roles at Standard Chartered Bank and Far East Bank and Trust Co. Mr. De Borja holds a Bachelor of Science degree in Commerce, Major in Accounting, from the University of Santo Tomas. He obtained his Global Executive MBA from the IE Business School. He is a Certified Public Accountant (CPA) and BAP Certified Treasury Professional for money markets and foreign exchange. He attended various trainings, seminars and workshops on profitability card management, corporate governance, AML, risk management, and other relevant banking subjects. Gerard T. Dee, 55, Filipino, First Vice President II, is the Head of Institutional Banking Group – Commercial Banking Division 2. He previously held various positions at Security Bank Corporation, TA Bank of the Philippines, and Banco de Oro. Mr. Dee obtained his Bachelor of Science degree in Marketing from the De La Salle University and an MBA degree from the New Hampshire College. He is involved in banking-related trainings on core credit, remedial management and relationship marketing, among others. He is related within the first civil degree of consanguinity to Mr. Gilbert U. Dee, Vice Chairman of the Board. Antonio Jose S. Dominguez, 51, Filipino, First Vice President II, is the Head of the Multi-Purpose Loans Division. He has more than 30 years‘ experience in the financial industry primarily in the key areas of Sales Management and Business Development. Most of his experience was gained in HSBC Philippines, under its two management training programs that led to holding various senior roles in Consumer Loans, Cards, Corporate Banking, Global Custody, Retail Banking and Wealth Management. Prior to joining the Bank, he headed the Sales and Marketing Groups of City Savings Bank and Rosehill Memorial Management, Inc. Earlier in his career, he worked in All Asia Capital and Trust Corporation, All Asia Securities Management Corporation, DMT Securities Inc. and AGJ Securities Corporation. His professional training includes various leadership skills, sales management, performance management, and digital marketing. He is a graduate of Bachelor of Science in Commerce, Major in Management, from the Colegio de San Juan de Letran. Delia Marquez, 57, Filipino, First Vice President II, is the Head of the Centralized Operations Group and concurrent Head of Business Process Management Division. In the past, she worked as Auditor at SGV & Co. and Transunion Corporation. A Certified Public Accountant, she obtained her Bachelor of Science degree in Commerce, Major in Accounting, cum laude, from the University of Santo Tomas. She participated in various seminars on corporate governance, Internal Capital Adequacy Assessment Process (ICAAP), risk model validation, Internal Credit Risk Rating System (ICRRS), and Philippine Financial Reporting Standards (PFRS), among others. In 2017, Ms. Marquez participated in The Asian Banker‘s Future of Finance Summit 2017, SAS Management, Inc.‘s Intro to Agile Project Management, GGAPP and PWC Phils.‘s Annual GGAPP Forum on Good Governance, Ethics and Compliance, and ICD‘s Corporate Governance Training Program.
65

Victor O. Martinez, 53, Filipino, First Vice President II, is one of the Division Heads of Corporate Banking at Institutional Banking Group. He has extensive experience in banking and related fields, having worked as Director of Corporate and Institutional Relationships at Australia and New Zealand Banking Group Limited, and held senior management positions in Security Bank Corporation, Saudi British Bank, and Far East Bank. Mr. Martinez graduated with a Bachelor of Science degree in Commerce/Management of Financial Institutions from the De La Salle University, and earned his Master’s of Management degree from the Willamette University in Oregon, USA. He has had training on strategic account planning and management, cash management, credit analysis, treasury products and derivatives, and financial statements analysis, among others. Jose L. Osmeña, Jr., 59, Filipino, First Vice President II, is the Deputy Group Head of RBB. He has been with the Bank for more than 27 years and sits in the board of Bank subsidiary CBSI. Before joining the Bank, he worked at Insular Bank of Asia and America and at Producers Bank. Mr. Osmeña earned his Bachelor of Science degree in Commerce, Major in Accounting, from the University of San Carlos, and took up his Masters of Science degree in Business Administration also from the same university. He attended the AIM’s Advance Bank Management Program. His various trainings include export financing, loan documentation, money market, corporate governance, and AML. Shirley G.K.T. Tan, 63, Filipino, First Vice President II, is the Region Head of RBB - Metro Manila - West Region. She has worked with the Bank for about 40 years. A CPA, Ms. Tan obtained her Bachelor of Science degree in Business Administration, Major in Accounting, from the Philippine School of Business Administration in Manila. She attended trainings and seminars on sales management and leadership skills, among others. Cristina P. Arceo, 50, Filipino, First Vice President, is the Treasury Fixed Income Head. She has more than 25 years of banking and asset management experience, formerly holding officership positions at Philam Asset Management Inc. and Philippine National Bank. Ms. Arceo earned her Bachelor of Science degree in Economics from the University of the Philippines and finished MBA studies from the De La Salle University. She has had trainings on foreign exchange, money and capital markets, interest rate swaps and options, derivatives documentation and portfolio management, among others. She received awards for “Best in Bond Trading” from The Asset for six (6) years. She obtained her CFA charter in 2011 and currently serve as Chairman of the Board of Trustees and President of CFA Society of the Philippines. Layne Y. Arpon, 58, Filipino, First Vice President, is one of the Heads at Institutional Banking Group. She previously worked in various financial institutions including BDO Unibank, The Manila Banking Corporation, Security Banking Corporation, and Land Bank of the Philippines, with exposure in commercial banking, corporate banking, investment banking, credit review and underwriting, project finance and audit. A Certified Public Accountant (CPA), Ms. Arpon is a graduate of Bachelor of Science in Commerce, major in Accounting, from the Far Eastern University. She participated in various trainings on trade finance, core credit, financial analysis, project financing, and credit investigation and property appraisal, among others. Amelia Caridad C. Castelo, 55, First Vice President, is the Head for Enterprise Business Intelligence Division. Before joining the Bank, she worked with United Laboratories, Standard Chartered Bank, HSBC Manila, East West Banking Corporation, and BDO Unibank in roles related to Risk Analytics, Marketing Analytics, and Business Intelligence. Ms. Castelo took up her Bachelor of Science in Statistics from the University of the Philippines – Diliman and went on to take post-graduate units in Industrial Engineering from the same university. She also finished the Executive Program in Data Science and Analytics from the University of California-Berkeley. She attended extensive training on Basel, concentration risk, related party transactions, model validation, control and governance, credit, enterprise and operational risk management, PFRS, financial consumer protection, credit risk management, and AML. Lilibeth R. Cariño, 62, Filipino, First Vice President, is the Head of Consumer Banking Group. She spent her career with the Bank for over 40 years, and had extensive exposure and training in consumer banking, real estate, corporate planning, treasury, credit, project finance, and branch based marketing, among others. Ms. Cariño is a graduate of Bachelor of Science in Statistics from the University of the Philippines, and obtained her MBA studies from the Ateneo Graduate School of Business. She also attended the Asian Development Bank’s seminar on institutional strengthening of financial institution, Allen Management Program’s Professional Management seminar/workshop, and ICD’s training programs on corporate governance and AML. Melissa F. Corpus, 50, Filipino, First Vice President, is the Credit Management Group Head. She has 30 years of experience in banking and finance, having previously worked with Far East Bank and Trust Co., The Hongkong
66
and Shanghai Banking Corporation, and Citibank, N.A. She has gained a wide span of banking exposure in the areas of credit analysis, credit risk management, relationship management (corporate and financial institutions), loan syndications, project finance, credit policy formulation and documentation management. She was an academic scholar at the Ateneo de Manila University where she graduated with a Bachelor of Science in Management degree. Apart from having participated in different trainings on credit, risk management, treasury, derivatives, international trade, property appraisal, and various external regulations, she also completed a comprehensive Executive Training Program at the HSBC Group Management Training College in Bricket Wood, United Kingdom. Angela D. Cruz, 59, Filipino, First Vice President, is the Head of Wealth Management Group. She also currently serves as Director of Wellington Investment and Manufacturing Corporation and has officership positions in Suntree Holdings Corporation and JJACCIS Development Corporation. She held executive positions at Citibank N.A., Far East Bank and Trust Company, and Equitable PCI Bank before joining the Bank. Ms. Cruz obtained her Bachelor of Science degree in Commerce, Major in Management of Financial Institutions, from the De La Salle University. She attended trainings related to banking operations, including Bourse Game, account management, and customer service. She is related within the first civil degree of consanguinity to Director Joaquin T. Dee. Ma. Luz B. Favis, 58, Filipino, First Vice President, is the Head of Asset Quality and Recovery Management Division. She formerly held several positions in Philippine Commercial International Bank (PCIBank) and Planters Development Bank where her exposure was concentrated on account management, commercial lending and credit. She has had extensive training on loan marketing, credit risk management and financial analysis and attended training programs on foreign exchange trading, mergers and acquisitions, bank sales and marketing strategies and real estate management. Ms. Favis holds a Bachelor of Arts degree in Economics from the De La Salle University and obtained her Master‘s degree in Business Management from the AIM. Jerry Ron T. Hao, 38, Filipino, First Vice President, is the Head of Foreign Exchange and Derivatives Division. In the past, he worked with ING Bank and International Exchange Bank. He earned his Bachelor of Science degree in Management Engineering from the Ateneo de Manila University. He completed several trainings on credit derivatives and structured products. Elizabeth C. Say, 60, Filipino, First Vice President, is the Head of the Branches Administration Division of RBB. She has been with the Bank for more than 30 years. Previously, she was internal auditor at Morrison Forwarding Corporation and money market trader at State Investment House, Inc. Ms. Say is a Bachelor of Science degree holder in Commerce, Major in Accounting, from the University of Santo Tomas. She has had trainings on corporate governance, integrated risk management, credit risk management, foreign exchange, loan review and classification and AML, among others. Belenette C. Tan, 54, First Vice President effective March 16, 2019, is the Bank‘s Chief Legal Counsel and Group Head of Legal and Collections. She is also the concurrent Corporate Secretary of Bank subsidiary CBC-IBI. She has been with the Bank for more than 25 years. Before joining the Bank, Atty. Tan worked with Yap, Apostol, Gumaru and Balgua Law Offices. She earned her Bachelor of Laws from the University of Santo Tomas, after taking up Bachelor of Arts in Political Science from the University of the Philippines. She participated in various trainings and seminars, including on the mandatory continuing legal education, AML and various aspects of commercial, criminal, and civil law. Stephen Y. Tan, 52, Filipino, First Vice President, is the Region Head of RBB-Visayas Region. He has more than 30 years of banking experience, having handled various positions at Metropolitan Bank & Trust Co., Far East Bank & Trust Co., Equitable PCI Bank, and International Exchange Bank, before joining the Bank in 2007. A CPA, Mr. Tan is a graduate of Bachelor of Science in Commerce, Major in Accounting, at the University of San Carlos. He completed various trainings on account management strategies and other trainings in banking and other related fields. Manuel M. Te, 64, First Vice President effective March 16, 2019, is the Region Head of RBB – Metro Manila South Region, and also the head of National Marketing Unit. He joined the Bank in 1976 up to 1996 and was rehired in 1997. He has extensive exposure and training on retail banking. Mr. Te graduated with a Bachelor of Science in Commerce degree, major in Accounting, from the University of Mindanao Digos City and went on to take his post-graduate units in the MBA program of the Ateneo de Davao University. He attended trainings on AML, forgery detection, credit management, position planning, branch-based marketing, and Leadership Training under Allen Management, among others.
67
Maria Rosanna Catherina L. Testa, 59, Filipino, First Vice President, is the Head of Human Resources Group. She spent more than 30 years of her career in human resource management. Prior to joining the Bank, she held various positions at Goodyear Phils., Equitable-PCI Bank, Far East Bank and Trust Company, The Manila Banking Corporation, and John Clements Consultants, among others. Ms. Testa earned her Bachelor of Arts degree, major in Business Administration, from the Assumption College, and obtained her Master‘s degree in Business Administration from the Ateneo Business School. She has had various trainings on corporate governance, AML, leadership, and trends and challenges in human resource management. Geoffrey D. Uy, 53, Filipino, First Vice President, is the Head of Market and Liquidity Risk. Before joining the Bank, he held various positions at Citibank - Treasurer, Risk Analytics Head, Funds Management Head, and Corporate Auditor. Mr. Uy is a Bachelor of Science degree holder in Mechanical Engineering from the De La Salle University and earned his MBA from the New Hampshire College. He has had trainings on risk management, ICAAP, and financial derivatives, among others. Marisol M. Teodoro, 57, Filipino, First Vice President, is the Director, President and Chief Executive Officer of Bank subsidiary, CBSC since her secondment in 2017. She previously held positions in other financial institutions such as Security Bank and International Corporate Bank/Union Bank of the Philippines. She took her Bachelor of Science degree in Business Economics and her MBA from the University of the Philippines-Diliman. She also completed various trainings on trust, financial planning, and treasury. Corazon I. Morando, Filipino, is the Vice President and Corporate Secretary of the Bank. She also serves as Consultant on Legal and Corporate Affairs of the SM Group. She is a recipient of ―Asian Company Secretary of the Year‖ award by the Corporate Governance Asia in Hongkong, recognizing her vital role in promoting and upholding corporate governance in the Bank. Atty. Morando was formerly a Director of the Corporate Legal Department of the Securities and Exchange Commission of the Philippines. She earned her Bachelor of Laws degree from the University of the Philippines, and obtained her graduate studies under the MBA-Senior Executive Program from the Ateneo de Manila University. She participates in the continuous development of her competence, attending various trainings which include seminars on non-bank financial intermediaries, AML, and corporate governance, among others. Note 1: All the foregoing officers have been involved in the banking industry for more than five (5) years. Note 2: None of the above-mentioned directors and officers works with the government.
(c) Nominees for election as Directors and Independent Directors
Nominee as Director Person who nominated Nominee as
Independent Director Person who nominated and Relationship with Nominee
Hans T. Sy Sysmart Corporation Alberto S. Yao Lucky Securities, Inc., no relation
Gilbert U. Dee Linda Susan T. Mendoza Margarita L. San Juan Zenaida C. Milan, no relation
William C. Whang George C. Yap Philip S.L. Tsai Alvin A. Quintanilla, no relation
Peter S. Dee Nancy D. Yang Angeline Ann H. Hwang Regina Capital Development Corporation, no relation
Joaquin T. Dee Christopher T. Dee
Herbert T. Sy Sysmart Corporation
Harley T. Sy SM Investments Corporation
Jose T. Sio SM Investments Corporation
All the above-mentioned nominees are incumbent members of the Board except for:
68
Angeline Ann H. Hwang, 68, Filipino, is a nominee for independent director. She currently does not hold directorship position in any PSE-listed company. She is presently President of Wingsan Properties Corporation and Oxleyrise Properties Inc, which are both private family-owned corporations. She has 45 years of experience in Philippine banking, ranging from international trade finance to account management/relationship management for SME and middle market segments as well as branch banking, branch administration and branch expansion. She previously held positions in Philippine Business Bank, Solidbank Corporation, Far East Bank & Trust Company and Bank of the Philippine Islands. Ms. Hwang is a graduate of Bachelor of Science in Business Administration, major in Banking and Finance, from the University of the Philippines. She has had various trainings on International Financing Reporting Standards (IFRS), financing, related party transactions, data privacy, SME, credit risk management, AML and corporate governance.
The Nominations Committee is currently composed of Mr. Philip S.L. Tsai, Mr. Alberto S. Yao and Ms. Margarita L. San Juan.
(d) Involvement in Legal Proceedings To the knowledge and information of the Bank, none of the above-named directors, nominees, and executive officers have been involved in any of the following events during the past five (5) years: (i) any bankruptcy petition filed by or against any business of which such person was a general partner or executive officer either at the time of the bankruptcy or within two (2) years prior to that time; (ii) any conviction by final judgment, including the nature of the offense, in a criminal proceeding, domestic or foreign, or being subject to a pending criminal proceeding, domestic or foreign, excluding traffic violations and other minor offenses; (iii) being subject to any order, judgment, or decree, not subsequently reversed, suspended or vacated, of any court of competent jurisdiction, domestic or foreign, permanently or temporarily enjoining, barring, suspending or otherwise limiting his involvement in any type of business, securities, commodities or banking activities; and (iv) being found by a domestic or foreign court of competent jurisdiction (in a civil action), the Commission or comparable foreign body, or a domestic or foreign exchange or other organized trading market or self-regulatory organization, to have violated a securities or commodities law or regulation and the judgment has not been reversed, suspended, or vacated. For the past five (5) years, the Bank, its affiliates, subsidiaries, directors and officers have not been involved in any legal proceedings that would affect their ability, competence or integrity, and/or would involve a material or substantial portion of their property before any court of law, quasi-judicial body or administrative body in the Philippines or elsewhere, except in the usual routine cases directed against the Bank, arising from the ordinary conduct of its business. All legal proceedings involving the Bank are efficiently and competently attended to and managed by a group of seventeen (17) in-house lawyers who are graduates of reputable law schools in the country. For its external counsels, the Bank retains the services of respected law firms, among which are Medialdea Ata Bello & Suarez Law Offices, ACCRA Law Office, Britanico Sarmiento & Ringler Law Offices, Divina Law Office, and Tagayuna Panopio & Escober Law Firm.
(e) Significant Employees
The Bank highly values its human resources. It expects each employee to do his share in achieving the Bank’s set goals; in return, the Bank has in place policies and programs for the protection and growth of employees.
(f) Family Relationships
Messrs. Hans T. Sy, Herbert T. Sy and Harley T. Sy, all Directors of the Bank, are brothers: Mr. Henry Sy, Sr., is their father. Ms. Angela D. Cruz, First Vice President and Head of Wealth Management Group and Mr. James Christian Dee, Treasurer of CBSI are children of Director Joaquin T. Dee. Mr. Gerard T. Dee, First Vice President II of Institutional Banking Group, is the son of Mr. Gilbert U. Dee, Vice Chairman of the Board. Mr. Patrick Dee Cheng, Senior Vice President and CFO is the nephew of Mr. Gilbert U. Dee, Vice Chairman of the Board
69
Item 10. Executive Compensation
Name
Year
Salary Bonuses & Other
Compensation
TOTAL
Total for the 5 most highly compensated executive officers*
2019 (estimates) 2018 (actual) 2017 (actual)
P50,019,761.00 46,747,440.00 46,539,430.00
P48,732,142.00 40,084,898.00 48,208,445.00
P98,751,903.00 86,832,338.00 94,747,875.00
Total for all officers and directors 2019 (estimates) 2018 (actual) 2017 (actual)
P1,542,156,291.00 1,454,423,412.00 1,239,546,562.00
P890,104,525.00 859,813,381.00 742,856,659.00
P2,432,260,816.00 2,314,236,793.00 1,982,403,221.00
* For year 2018 and 2019: Messrs. Gilbert U. Dee, William C. Whang, Romeo D. Uyan, Jr., and Patrick D. Cheng, and Ms. Rosemarie C, Gan * For year 2017: Messrs. Gilbert U. Dee, Ricardo R. Chua, William C. Whang, Romeo D. Uyan, Jr., Patrick D. Cheng, and Ms. Rosemarie C. Gan Other than those relating to the foregoing figures, there are no actions to be taken as regards any bonus, profit sharing, pension or retirement plan, granting of or extension of any option warrant or right to purchase any securities between the Bank and its directors and officers. The officers receive compensation based on their performance, banking experience, employment status, position and rank in the Bank. On the other hand, the directors are entitled to a per diem of P500.00 for attendance at each meeting of the Board or of any committee and to 4% of the Bank‘s net earnings, in accordance with Article IV, Section 11, and Article VIII, Section 1 (a) of the Bank‘s Amended By-Laws. The directors and officers have no other compensatory arrangement with the Bank.
Item 11. Security Ownership of Certain Record and Beneficial Owners and Management as of February 28, 2019
(a) Record and beneficial owners holding 5% or more of voting securities:
Title of Class
Name, Address of Record Owner & Relationship with Issuer
Name of Beneficial Owner & Relationship with
Record Owner Citizenship
No. of Shares Held
Percentage
Common
PCD Nominee Corporation * 37th Floor Tower I, The Enterprise Center, 6766 Ayala Ave. corner Paseo de Roxas, Makati City Stockholder
Various stockholders/clients Non-Filipino
720,955,761
26.84%
Common
SM Investments Corporation 10th Floor L.V. Locsin Bldg., 6752 Ayala Avenue, Makati City Stockholder
Sy Family PCD Nominee Corporation Stockholders
Filipino
461,975,661
17.20%
Common
PCD Nominee Corporation * 37th Floor Tower I, The Enterprise Center, 6766 Ayala Ave. corner Paseo de Roxas, Makati City Stockholder
Various stockholders/clients
Filipino
431,441,259
16.06%
Common
Sysmart Corporation 10th Floor L.V. Locsin Bldg., 6752 Ayala Avenue, Makati City Stockholder
Henry Sy, Sr. and Family Sycamore Pacific Corporation Stockholders
Filipino
415,995,323
15.49%
70
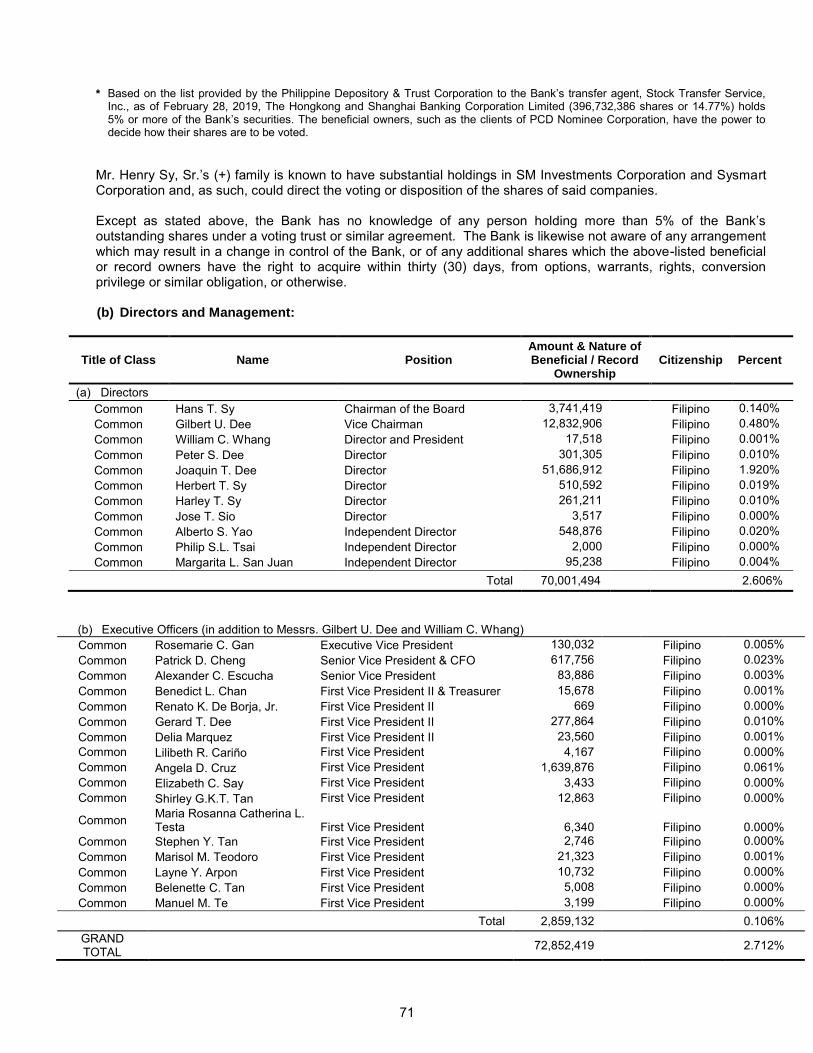
* Based on the list provided by the Philippine Depository & Trust Corporation to the Bank‘s transfer agent, Stock Transfer Service,
Inc., as of February 28, 2019, The Hongkong and Shanghai Banking Corporation Limited (396,732,386 shares or 14.77%) holds 5% or more of the Bank‘s securities. The beneficial owners, such as the clients of PCD Nominee Corporation, have the power to decide how their shares are to be voted.
Mr. Henry Sy, Sr.‘s (+) family is known to have substantial holdings in SM Investments Corporation and Sysmart Corporation and, as such, could direct the voting or disposition of the shares of said companies. Except as stated above, the Bank has no knowledge of any person holding more than 5% of the Bank‘s outstanding shares under a voting trust or similar agreement. The Bank is likewise not aware of any arrangement which may result in a change in control of the Bank, or of any additional shares which the above-listed beneficial or record owners have the right to acquire within thirty (30) days, from options, warrants, rights, conversion privilege or similar obligation, or otherwise. (b) Directors and Management:
Title of Class Name Position Amount & Nature of Beneficial / Record
Ownership Citizenship Percent
(a) Directors Common Hans T. Sy Chairman of the Board 3,741,419 Filipino 0.140%
Common Gilbert U. Dee Vice Chairman 12,832,906 Filipino 0.480%
Common William C. Whang Director and President 17,518 Filipino 0.001%
Common Peter S. Dee Director 301,305 Filipino 0.010%
Common Joaquin T. Dee Director 51,686,912 Filipino 1.920%
Common Herbert T. Sy Director 510,592 Filipino 0.019%
Common Harley T. Sy Director 261,211 Filipino 0.010%
Common Jose T. Sio Director 3,517 Filipino 0.000%
Common Alberto S. Yao Independent Director 548,876 Filipino 0.020%
Common Philip S.L. Tsai Independent Director 2,000 Filipino 0.000%
Common Margarita L. San Juan Independent Director 95,238 Filipino 0.004%
Total 70,001,494 2.606%
(b) Executive Officers (in addition to Messrs. Gilbert U. Dee and William C. Whang) Common Rosemarie C. Gan Executive Vice President 130,032 Filipino 0.005% Common Patrick D. Cheng Senior Vice President & CFO 617,756 Filipino 0.023%
Common Alexander C. Escucha Senior Vice President 83,886 Filipino 0.003%
Common Benedict L. Chan First Vice President II & Treasurer 15,678 Filipino 0.001%
Common Renato K. De Borja, Jr. First Vice President II 669 Filipino 0.000%
Common Gerard T. Dee First Vice President II 277,864 Filipino 0.010%
Common Delia Marquez First Vice President II 23,560 Filipino 0.001%
Common Lilibeth R. Cariño First Vice President 4,167 Filipino 0.000%
Common Angela D. Cruz First Vice President 1,639,876 Filipino 0.061%
Common Elizabeth C. Say First Vice President 3,433 Filipino 0.000%
Common Shirley G.K.T. Tan First Vice President 12,863 Filipino 0.000%
Common Maria Rosanna Catherina L. Testa First Vice President
6,340
Filipino
0.000%
Common Stephen Y. Tan First Vice President 2,746 Filipino 0.000% Common Marisol M. Teodoro First Vice President 21,323 Filipino 0.001% Common Layne Y. Arpon First Vice President 10,732 Filipino 0.000% Common Belenette C. Tan First Vice President 5,008 Filipino 0.000% Common Manuel M. Te First Vice President 3,199 Filipino 0.000%
Total 2,859,132 0.106% GRAND TOTAL 72,852,419 2.712%
71
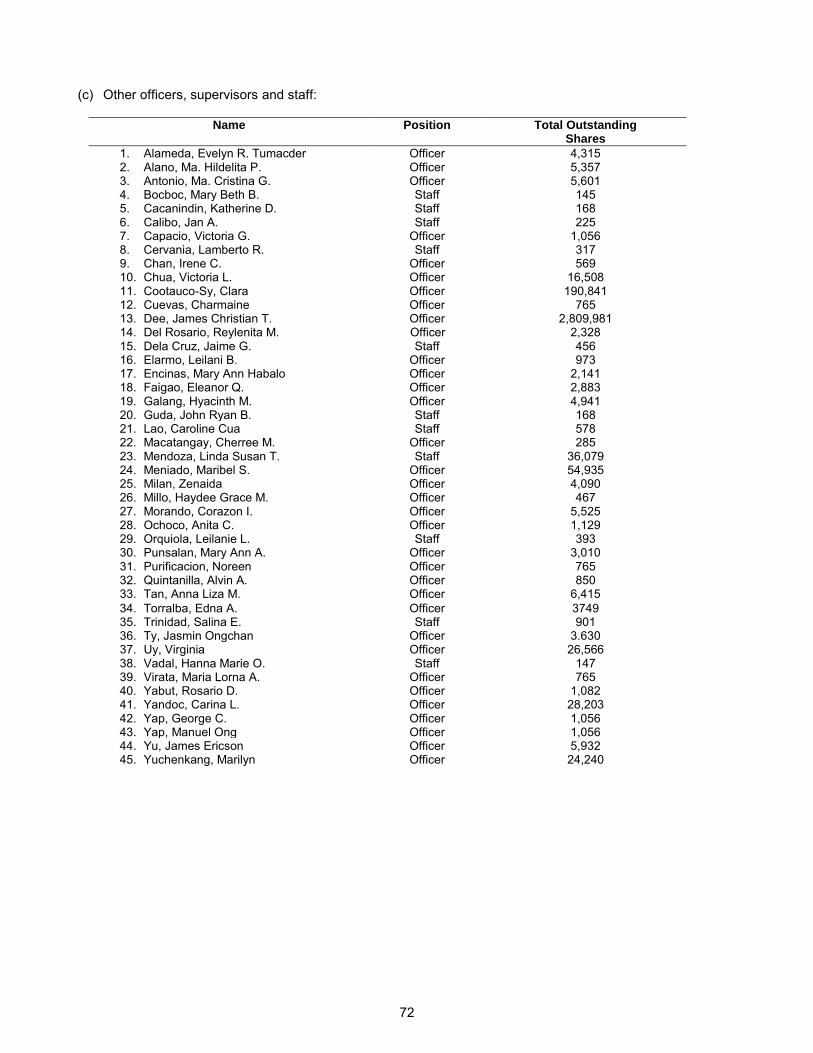
(c) Other officers, supervisors and staff:
Name
Position Total Outstanding
Shares
1. Alameda, Evelyn R. Tumacder Officer 4,315 2. Alano, Ma. Hildelita P. Officer 5,357 3. Antonio, Ma. Cristina G. Officer 5,601 4. Bocboc, Mary Beth B. Staff 145 5. Cacanindin, Katherine D. Staff 168 6. Calibo, Jan A. Staff 225 7. Capacio, Victoria G. Officer 1,056 8. Cervania, Lamberto R. 9. Chan, Irene C.
Staff Officer
317 569
10. Chua, Victoria L. Officer 16,508 11. Cootauco-Sy, Clara Officer 190,841 12. Cuevas, Charmaine Officer 765 13. Dee, James Christian T. Officer 2,809,981 14. Del Rosario, Reylenita M. Officer 2,328 15. Dela Cruz, Jaime G. Staff 456 16. Elarmo, Leilani B. Officer 973 17. Encinas, Mary Ann Habalo Officer 2,141 18. Faigao, Eleanor Q. Officer 2,883 19. Galang, Hyacinth M. Officer 4,941 20. Guda, John Ryan B. Staff 168 21. Lao, Caroline Cua Staff 578 22. Macatangay, Cherree M. Officer 285 23. Mendoza, Linda Susan T. Staff 36,079 24. Meniado, Maribel S. Officer 54,935 25. Milan, Zenaida Officer 4,090 26. Millo, Haydee Grace M. Officer 467 27. Morando, Corazon I. Officer 5,525 28. Ochoco, Anita C. Officer 1,129 29. Orquiola, Leilanie L. Staff 393 30. Punsalan, Mary Ann A. Officer 3,010 31. Purificacion, Noreen Officer 765 32. Quintanilla, Alvin A. Officer 850 33. Tan, Anna Liza M. Officer 6,415 34. Torralba, Edna A. Officer 3749 35. Trinidad, Salina E. Staff 901 36. Ty, Jasmin Ongchan Officer 3.630 37. Uy, Virginia Officer 26,566 38. Vadal, Hanna Marie O. Staff 147 39. Virata, Maria Lorna A. Officer 765 40. Yabut, Rosario D. Officer 1,082 41. Yandoc, Carina L. Officer 28,203 42. Yap, George C. Officer 1,056 43. Yap, Manuel Ong Officer 1,056 44. Yu, James Ericson Officer 5,932 45. Yuchenkang, Marilyn Officer 24,240
72
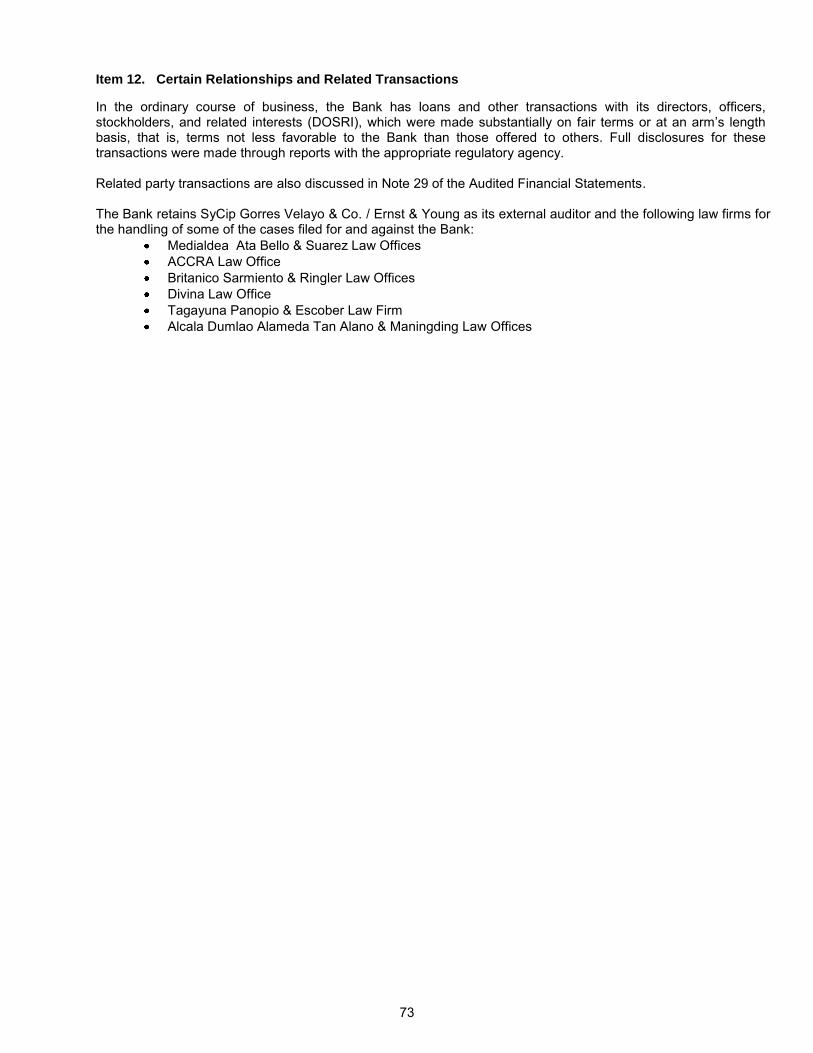
Item 12. Certain Relationships and Related Transactions In the ordinary course of business, the Bank has loans and other transactions with its directors, officers, stockholders, and related interests (DOSRI), which were made substantially on fair terms or at an arm‘s length basis, that is, terms not less favorable to the Bank than those offered to others. Full disclosures for these transactions were made through reports with the appropriate regulatory agency. Related party transactions are also discussed in Note 29 of the Audited Financial Statements. The Bank retains SyCip Gorres Velayo & Co. / Ernst & Young as its external auditor and the following law firms for the handling of some of the cases filed for and against the Bank:
Medialdea Ata Bello & Suarez Law Offices ACCRA Law Office Britanico Sarmiento & Ringler Law Offices Divina Law Office Tagayuna Panopio & Escober Law Firm Alcala Dumlao Alameda Tan Alano & Maningding Law Offices
73
PART IV - CORPORATE GOVERNANCE Item 13. Corporate Governance
Doing Business the Right Way for a Sustainable Banking Guided by the principles of Fairness, Accountability, Transparency and Integrity, China Bank continuously endeavor to improve and uphold the highest standards of corporate governance to remain strongly positioned for value creation and in building a more resilient and sustainable banking future for its customers, employees and other stakeholders. The overall stewardship of the Bank rests on the Board of Directors. The Board upholds these core principles in all financial and business dealings of the Bank. Furthermore, it sets the tone and leads the practice of ethical business conduct, guides the overall corporate philosophy and direction, and carries out oversight responsibility for business and risk strategy, financial soundness, and regulatory compliance. The Board also sets the pace for the Bank‘s current operations and future directions, and ensures that all obligations to stakeholders are met. China Bank believes that good corporate governance is vital to its success and sustainability. It is committed to doing business the right way – in accordance with the law, best practices, and best interest of all stakeholders. Its robust governance, compliance, and risk management system ensure that the Bank has a strong foundation to pursue its goals and deliver its commitments. To further strengthen our position as one of the best governed in the region, we have implemented new initiatives and maintained the best practices:
Updated the Bank‘s Corporate Governance Manual to align with recent rules, regulations and international best practices.
Affirmed the ASEAN Scorecard recommendation that all members of the Corporate Governance, Related Party Transactions (RPT) and Nominations Committee are independent directors (ID), while majority of the members of the Remuneration Committee are IDs.
Enhanced the Board Committee Charters, Board Self-Assessment Forms, RPT Framework and Policy, Insider Trading Policy and Retirement Policy for Directors.
Consolidated and codified the salient provisions of the Corporate Governance Manual into a Code of Ethics for Directors.
Conducted the annual assessment of the Board, Board-level committees and the President. Facilitated the corporate governance training conducted by the Institute of Corporate Directors on China
Bank‘s directors and key officers.
74
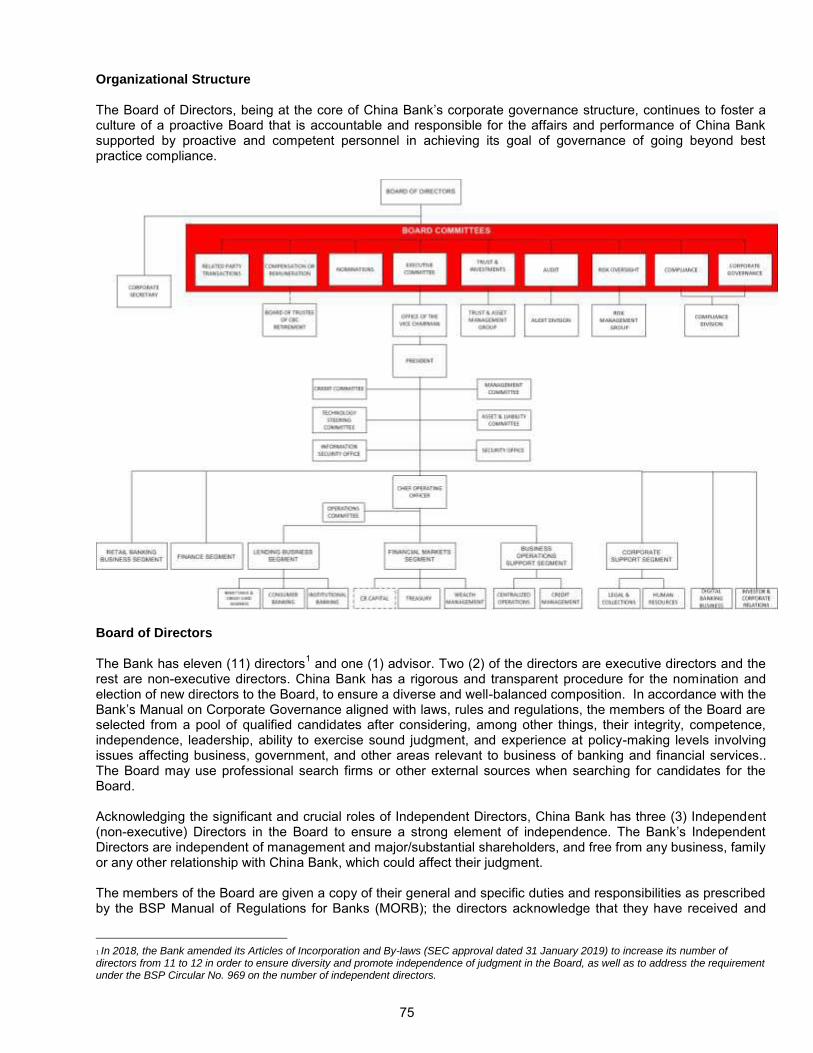
Organizational Structure The Board of Directors, being at the core of China Bank‘s corporate governance structure, continues to foster a culture of a proactive Board that is accountable and responsible for the affairs and performance of China Bank supported by proactive and competent personnel in achieving its goal of governance of going beyond best practice compliance.
Board of Directors The Bank has eleven (11) directors1 and one (1) advisor. Two (2) of the directors are executive directors and the rest are non-executive directors. China Bank has a rigorous and transparent procedure for the nomination and election of new directors to the Board, to ensure a diverse and well-balanced composition. In accordance with the Bank‘s Manual on Corporate Governance aligned with laws, rules and regulations, the members of the Board are selected from a pool of qualified candidates after considering, among other things, their integrity, competence, independence, leadership, ability to exercise sound judgment, and experience at policy-making levels involving issues affecting business, government, and other areas relevant to business of banking and financial services.. The Board may use professional search firms or other external sources when searching for candidates for the Board. Acknowledging the significant and crucial roles of Independent Directors, China Bank has three (3) Independent (non-executive) Directors in the Board to ensure a strong element of independence. The Bank‘s Independent Directors are independent of management and major/substantial shareholders, and free from any business, family or any other relationship with China Bank, which could affect their judgment. The members of the Board are given a copy of their general and specific duties and responsibilities as prescribed by the BSP Manual of Regulations for Banks (MORB); the directors acknowledge that they have received and
1 In 2018, the Bank amended its Articles of Incorporation and By-laws (SEC approval dated 31 January 2019) to increase its number of directors from 11 to 12 in order to ensure diversity and promote independence of judgment in the Board, as well as to address the requirement under the BSP Circular No. 969 on the number of independent directors.
75
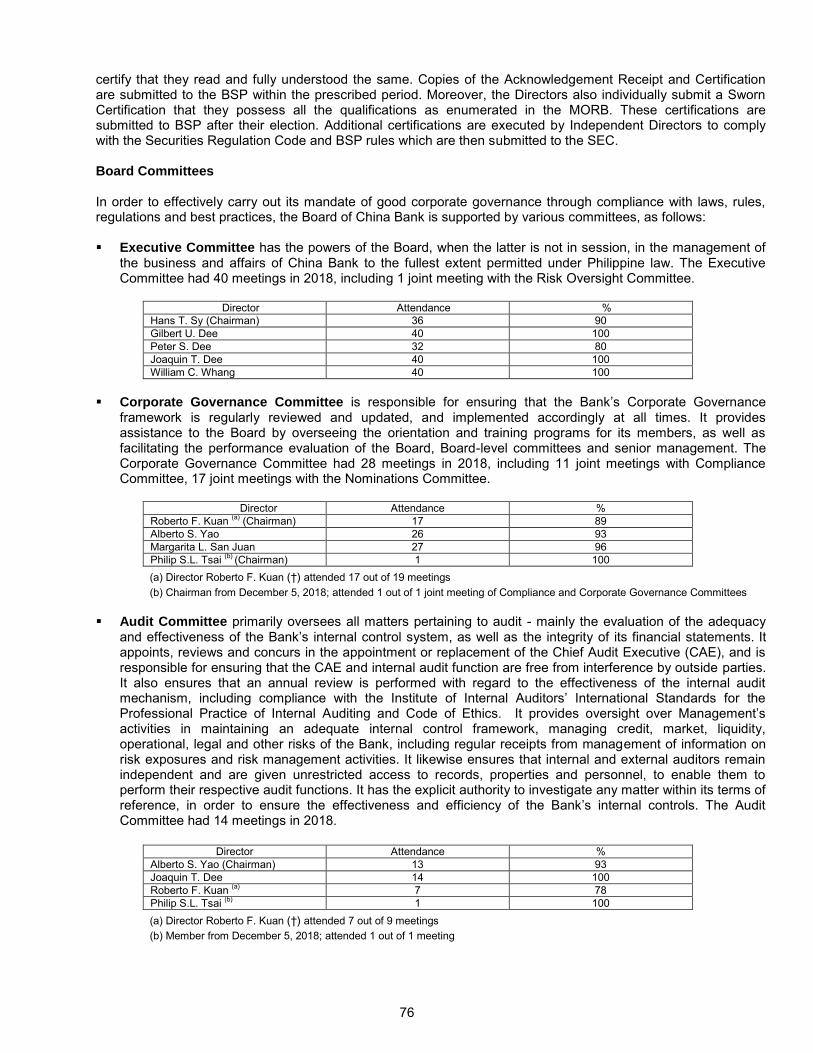
certify that they read and fully understood the same. Copies of the Acknowledgement Receipt and Certification are submitted to the BSP within the prescribed period. Moreover, the Directors also individually submit a Sworn Certification that they possess all the qualifications as enumerated in the MORB. These certifications are submitted to BSP after their election. Additional certifications are executed by Independent Directors to comply with the Securities Regulation Code and BSP rules which are then submitted to the SEC. Board Committees In order to effectively carry out its mandate of good corporate governance through compliance with laws, rules, regulations and best practices, the Board of China Bank is supported by various committees, as follows: Executive Committee has the powers of the Board, when the latter is not in session, in the management of
the business and affairs of China Bank to the fullest extent permitted under Philippine law. The Executive Committee had 40 meetings in 2018, including 1 joint meeting with the Risk Oversight Committee.
Director Attendance % Hans T. Sy (Chairman) 36 90 Gilbert U. Dee 40 100 Peter S. Dee 32 80 Joaquin T. Dee 40 100 William C. Whang 40 100
Corporate Governance Committee is responsible for ensuring that the Bank‘s Corporate Governance
framework is regularly reviewed and updated, and implemented accordingly at all times. It provides assistance to the Board by overseeing the orientation and training programs for its members, as well as facilitating the performance evaluation of the Board, Board-level committees and senior management. The Corporate Governance Committee had 28 meetings in 2018, including 11 joint meetings with Compliance Committee, 17 joint meetings with the Nominations Committee.
Director Attendance % Roberto F. Kuan (a) (Chairman) 17 89 Alberto S. Yao 26 93 Margarita L. San Juan 27 96 Philip S.L. Tsai (b) (Chairman) 1 100
(a) Director Roberto F. Kuan (†) attended 17 out of 19 meetings (b) Chairman from December 5, 2018; attended 1 out of 1 joint meeting of Compliance and Corporate Governance Committees
Audit Committee primarily oversees all matters pertaining to audit - mainly the evaluation of the adequacy and effectiveness of the Bank‘s internal control system, as well as the integrity of its financial statements. It appoints, reviews and concurs in the appointment or replacement of the Chief Audit Executive (CAE), and is responsible for ensuring that the CAE and internal audit function are free from interference by outside parties. It also ensures that an annual review is performed with regard to the effectiveness of the internal audit mechanism, including compliance with the Institute of Internal Auditors‘ International Standards for the Professional Practice of Internal Auditing and Code of Ethics. It provides oversight over Management‘s activities in maintaining an adequate internal control framework, managing credit, market, liquidity, operational, legal and other risks of the Bank, including regular receipts from management of information on risk exposures and risk management activities. It likewise ensures that internal and external auditors remain independent and are given unrestricted access to records, properties and personnel, to enable them to perform their respective audit functions. It has the explicit authority to investigate any matter within its terms of reference, in order to ensure the effectiveness and efficiency of the Bank‘s internal controls. The Audit Committee had 14 meetings in 2018.
Director Attendance %
Alberto S. Yao (Chairman) 13 93 Joaquin T. Dee 14 100 Roberto F. Kuan (a) 7 78 Philip S.L. Tsai (b) 1 100
(a) Director Roberto F. Kuan (†) attended 7 out of 9 meetings (b) Member from December 5, 2018; attended 1 out of 1 meeting
76
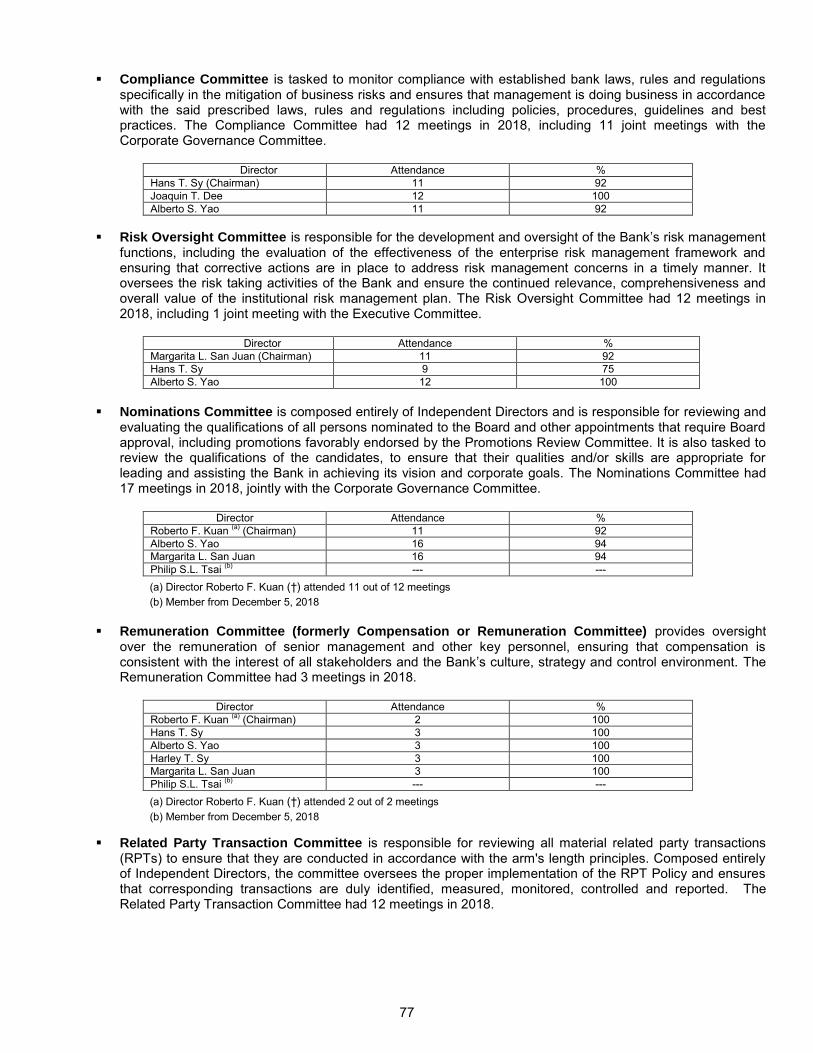
Compliance Committee is tasked to monitor compliance with established bank laws, rules and regulations specifically in the mitigation of business risks and ensures that management is doing business in accordance with the said prescribed laws, rules and regulations including policies, procedures, guidelines and best practices. The Compliance Committee had 12 meetings in 2018, including 11 joint meetings with the Corporate Governance Committee.
Director Attendance % Hans T. Sy (Chairman) 11 92 Joaquin T. Dee 12 100 Alberto S. Yao 11 92
Risk Oversight Committee is responsible for the development and oversight of the Bank’s risk management functions, including the evaluation of the effectiveness of the enterprise risk management framework and ensuring that corrective actions are in place to address risk management concerns in a timely manner. It oversees the risk taking activities of the Bank and ensure the continued relevance, comprehensiveness and overall value of the institutional risk management plan. The Risk Oversight Committee had 12 meetings in 2018, including 1 joint meeting with the Executive Committee.
Director Attendance % Margarita L. San Juan (Chairman) 11 92 Hans T. Sy 9 75 Alberto S. Yao 12 100
Nominations Committee is composed entirely of Independent Directors and is responsible for reviewing and
evaluating the qualifications of all persons nominated to the Board and other appointments that require Board approval, including promotions favorably endorsed by the Promotions Review Committee. It is also tasked to review the qualifications of the candidates, to ensure that their qualities and/or skills are appropriate for leading and assisting the Bank in achieving its vision and corporate goals. The Nominations Committee had 17 meetings in 2018, jointly with the Corporate Governance Committee.
Director Attendance % Roberto F. Kuan (a) (Chairman) 11 92 Alberto S. Yao 16 94 Margarita L. San Juan 16 94 Philip S.L. Tsai (b) --- ---
(a) Director Roberto F. Kuan (†) attended 11 out of 12 meetings (b) Member from December 5, 2018
Remuneration Committee (formerly Compensation or Remuneration Committee) provides oversight
over the remuneration of senior management and other key personnel, ensuring that compensation is consistent with the interest of all stakeholders and the Bank’s culture, strategy and control environment. The Remuneration Committee had 3 meetings in 2018.
Director Attendance % Roberto F. Kuan (a) (Chairman) 2 100 Hans T. Sy 3 100 Alberto S. Yao 3 100 Harley T. Sy 3 100 Margarita L. San Juan 3 100 Philip S.L. Tsai (b) --- ---
(a) Director Roberto F. Kuan (†) attended 2 out of 2 meetings (b) Member from December 5, 2018
Related Party Transaction Committee is responsible for reviewing all material related party transactions (RPTs) to ensure that they are conducted in accordance with the arm's length principles. Composed entirely of Independent Directors, the committee oversees the proper implementation of the RPT Policy and ensures that corresponding transactions are duly identified, measured, monitored, controlled and reported. The Related Party Transaction Committee had 12 meetings in 2018.
77
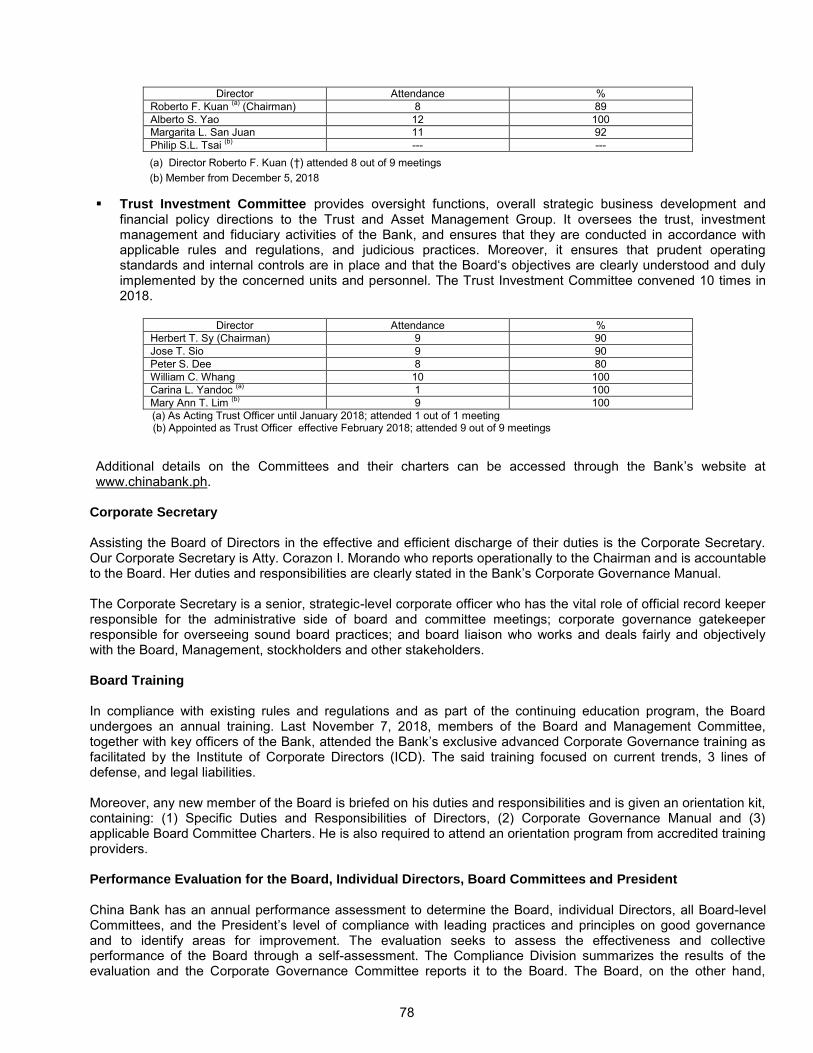
Director Attendance %
Roberto F. Kuan (a) (Chairman) 8 89 Alberto S. Yao 12 100 Margarita L. San Juan 11 92 Philip S.L. Tsai (b) --- ---
(a) Director Roberto F. Kuan (†) attended 8 out of 9 meetings (b) Member from December 5, 2018
Trust Investment Committee provides oversight functions, overall strategic business development and financial policy directions to the Trust and Asset Management Group. It oversees the trust, investment management and fiduciary activities of the Bank, and ensures that they are conducted in accordance with applicable rules and regulations, and judicious practices. Moreover, it ensures that prudent operating standards and internal controls are in place and that the Board‘s objectives are clearly understood and duly implemented by the concerned units and personnel. The Trust Investment Committee convened 10 times in 2018.
Director Attendance % Herbert T. Sy (Chairman) 9 90 Jose T. Sio 9 90 Peter S. Dee 8 80 William C. Whang 10 100 Carina L. Yandoc (a) 1 100 Mary Ann T. Lim (b) 9 100
(a) As Acting Trust Officer until January 2018; attended 1 out of 1 meeting (b) Appointed as Trust Officer effective February 2018; attended 9 out of 9 meetings
Additional details on the Committees and their charters can be accessed through the Bank’s website at www.chinabank.ph.
Corporate Secretary
Assisting the Board of Directors in the effective and efficient discharge of their duties is the Corporate Secretary. Our Corporate Secretary is Atty. Corazon I. Morando who reports operationally to the Chairman and is accountable to the Board. Her duties and responsibilities are clearly stated in the Bank’s Corporate Governance Manual.
The Corporate Secretary is a senior, strategic-level corporate officer who has the vital role of official record keeper responsible for the administrative side of board and committee meetings; corporate governance gatekeeper responsible for overseeing sound board practices; and board liaison who works and deals fairly and objectively with the Board, Management, stockholders and other stakeholders. Board Training In compliance with existing rules and regulations and as part of the continuing education program, the Board undergoes an annual training. Last November 7, 2018, members of the Board and Management Committee, together with key officers of the Bank, attended the Bank’s exclusive advanced Corporate Governance training as facilitated by the Institute of Corporate Directors (ICD). The said training focused on current trends, 3 lines of defense, and legal liabilities. Moreover, any new member of the Board is briefed on his duties and responsibilities and is given an orientation kit, containing: (1) Specific Duties and Responsibilities of Directors, (2) Corporate Governance Manual and (3) applicable Board Committee Charters. He is also required to attend an orientation program from accredited training providers. Performance Evaluation for the Board, Individual Directors, Board Committees and President China Bank has an annual performance assessment to determine the Board, individual Directors, all Board-level Committees, and the President’s level of compliance with leading practices and principles on good governance and to identify areas for improvement. The evaluation seeks to assess the effectiveness and collective performance of the Board through a self-assessment. The Compliance Division summarizes the results of the evaluation and the Corporate Governance Committee reports it to the Board. The Board, on the other hand,
78
reviews the results and evaluates the enhancements needed in order to improve the performance of the Board collectively, the individual directors, and the various committees. Every three (3) years, the assessment shall be validated by an external facilitator.
In 2018, there are no significant deviations and in general, the Bank has fully complied with the provisions and requirements of the Corporate Governance Manual. Compliance System The Compliance Division plays a crucial role in fostering a culture of group-wide compliance in all facets of the Bank, assists the Board in the discharge of its governance function to protect China Bank’s reputation and its stakeholders’ interests, and ensures the Bank’s safety and soundness. In place is a compliance risk management system that is designed specifically to identify and mitigate risks that may erode the franchise value of the Bank. Compliance Division is headed by the Chief Compliance Officer (CCO), Atty. Aileen Paulette S. De Jesus, who reports functionally to the Compliance and the Corporate Governance Committees and administratively to the Bank’s President. The Compliance function is supported by a duly approved Compliance Charter that defines the duties and responsibilities, mandate, independence, and manner on which compliance is implemented. At the helm of this function is the Regulatory Compliance Unit. The Corporate Governance Unit assists the CCO in its governance mandates, while the IT Compliance Unit assists in the IT system support. All units in the Bank have Compliance Coordinators to ensure that all risks associated to the operations and business of the individual units are identified, monitored, and mitigated. To enhance regulatory, compliance and good governance awareness and continuously strengthen the implementation of our compliance culture within the Bank, the Compliance Division: 1. Cascades all recent laws, rules, and regulations to all concerned;
2. Acts as liaison for the Board and Management on regulatory compliance matters, with the regulatory agencies;
3. Provides advisory services, including reviewing proposed China Bank products and services;
4. Reviews and updates the Compliance Manual, Money Laundering and Terrorist Financing Prevention Program
and Corporate Governance Manual annually, to align with recent regulatory requirements;
5. Continuously educates Bank employees about compliance, anti-money laundering, good governance and its benefits, the Bank’s Code of Ethics, and the policy on avoidance of conflict of interest, among others, to ensure that everyone in the institution is in the same direction towards good governance and to develop a culture of trust and integrity and to enable the employees of the Bank to embrace the principles set forth by the Board;
6. Conducts briefings for Compliance Coordinators in the branches and Head Office to raise the level of awareness and understanding of the principles, concepts, and elements of good corporate governance and compliance. The Compliance Coordinators are required to cascade their learnings to their respective areas; and
7. Conducts lectures to all new employees of the Bank for the basic orientation on Compliance System, Anti-Money Laundering (AML), Whistleblowing, and Corporate Governance giving them an overview of the Bank’s Compliance Risk Management System. Compliance Division also conducts lectures during the Junior Executive Development (JED) and Supervisory Development Program (SDP), among others.
79
Governance Policies
Corporate Governance Manual In place is an extensive Corporate Governance Manual that contains the Bank‘s corporate governance policies, structure, principles, as well as the general and specific duties and responsibilities of the Board and the individual directors. The Manual is kept updated to ensure that it is aligned with latest regulatory issuances. To enjoin Bank-wide compliance and for easy access, a copy of the Manual is available in the Bank‘s intranet facility, under the Compliance Office Public Folder. The CCO is primarily tasked to monitor compliance with the Manual, and is always available to respond to inquiries from Bank officials and personnel regarding good corporate governance policies and practices.
Board Compensation Policy China Bank directors are entitled to a per diem of five hundred pesos (P500.00) for attendance at each meeting of the Board of Directors or of any Committee, or as may be determined from time to time by stockholders owning or representing a majority of the subscribed capital stock, at any regular or special meeting. In accordance with Article VIII of the Bank‘s By-Laws, a portion of the net earnings shall be given to the members of the Board.
Dividend Policy China Banking Corporation, as a matter of policy, shall declare cash dividends at a payout ratio of at least thirty percent (30%) of the net income of the prior year, subject to the conditions and limitations set forth in this policy statement. The Bank‘s Dividend Policy is an integral component of its Capital Management Policy and Process. Its fundamental and overriding philosophy is sustainability.
Dividend payouts are reviewed annually. These are referenced against the Bank‘s Capital Management Process. Based on this process, dividend payouts are calibrated based on the prior year‘s earnings while taking consideration of dividend yields, future earnings streams and future business opportunities.
In declaring dividend payouts, China Banking Corporation uses a combination of cash or stock dividends as follows: 1. The dividend is increased in response to the Bank‘s achieving a higher level of sustainable earnings.
2. Dividends may be increased for a specific year to plow back to shareholders a commensurate share of
unusually high earnings for a given year.
China Bank‘s capital management philosophy and process, and consequently its Dividend Policy which comprises an integral component of this undertaking, are driven by the following primary objectives: 1. Ensuring compliance with externally imposed regulatory capital requirements. 2. Maintaining strong credit ratings. 3. Maintaining healthy capital ratios to support its business and maximize shareholder value.
China Bank manages its capital structure and makes adjustments to it in the light of: 1. Changes in economic conditions. 2. The risk characteristics of its activities. 3. The assessment of prospective business requirements or directions.
80
Whistleblowing The Bank does not and will not tolerate unethical conduct, thus a whistle-blowing policy, wherein employees, customers, shareholders, and third party service providers are encouraged to report questionable activity, unethical conduct, fraud or any other malpractice by mail, phone or e-mail, without fear of reprisal or retaliation as the identity of the whistle-blower is kept confidential.
The Bank‘s CCO determines the substance and validity of all whistle-blower reports. Reports can also be disclosed to any officer of the bank, the Risk Management Group, Internal Audit and the Human Resources Group.
Code of Ethics
The Bank is committed to conduct its business in an honest and ethical manner, well guided by its core values, namely: integrity, high performance standards, commitment to quality, customer service focus, concern for people, efficiency and resourcefulness, and initiative in carrying out its functions and in dealing with its clients. These core values are also the foundation of the Bank‘s Code of Ethics.
Setting the tone from the top, our Board of Directors is fully committed to principled conduct of business. Just as it expects full compliance to the Code of Ethics from all Bank employees, the body believes that its members should also uphold the principles of integrity, fairness, accountability and transparency at all times.
The Code of Ethics for Directors articulates the acceptable practices in relation to both internal and external dealings (i.e., investors, creditors, customers, depositors, contractors, suppliers, regulators, and the general public) of the members of the Board. It also provides the guiding principles on the performance of their duties in accordance with the fit and proper rules; and establishes standards for professional and ethical conduct. All new directors are given a copy of the Code, and they acknowledge receipt of the same.
To ensure that business is carried out in compliance with relevant laws and in the protection of the interest of the Bank‘s customers, shareholders and other stakeholders, the Bank‘s Human Resources Group has disseminated the Bank‘s Code of Ethics to all employees, including new hires. Employees are required to sign an acknowledgement receipt that they have received a copy of the Code of Ethics.
Copies of the Codes are also made available in the Bank‘s intranet to be readily accessible to all employees, and are also available on the Bank‘s website. A comprehensive discussion on the Code of Ethics is conducted with new employees of the Bank to foster a culture of awareness on the Bank‘s core values. Such discussion also highlights the behavioral standards, business conduct, and corresponding sanctions for violations of the Code of Ethics.
Policy on Conflict of Interest In accordance with the Bank‘s Code of Ethics, Conflict of Interest between the Bank and its employees should be avoided at all times. However, should a conflict arise, the interest of the Bank must prevail. Employees are not permitted to have or be involved in any financial interests that are in conflict or appear to be in conflict with their duties and responsibilities to China Bank. They are likewise barred from engaging in work outside of the Bank unless with duly-approved permission, as well as work that lies in direct competition with the Bank.
Disclosure and Transparency The Bank is committed to a high standard of disclosure and transparency to facilitate understanding of the Bank‘s true financial condition and the quality of its corporate governance. All material information about the Bank is adequately and punctually disclosed, in accordance with the SEC and PSE‘s disclosure policies. In addition to compliance with the reportorial requirements such as publishing quarterly financial statements in leading newspapers and producing a comprehensive annual report for the Bank‘s annual stockholders‘ meeting, the Bank promptly discloses major and market-sensitive information like dividend
81
declarations, joint ventures and acquisitions, sale and disposition of significant assets, as well as financial and non-financial information that may affect or influence the investment decision of the investing public, in the form of press releases in newspapers and reports in our internal publications. We also electronically file our disclosures through EDGE which are then posted on the PSE‘s website. The Bank‘s corporate website is likewise regularly updated to include the latest news and current information about the Bank.
The Bank aims to ensure that information about its products and services are clear, understandable, accurate, and accessible. We give all necessary and relevant information to our customers so that they can make informed decisions when transacting with us. The information is communicated to our customers through the use of different media and channels such as printed materials that are prominently displayed in our branches or directly sent to customers — TV, print, radio and other forms of advertisements; our website and social media channels such as Twitter and Facebook; and our Customer Contact Center. All consumer information required by the BSP are likewise openly displayed at our branches. Our branch personnel are trained to handle inquiries about any information in a professional manner to explain risks relating to our products and services and to provide advice on financial matters.
82
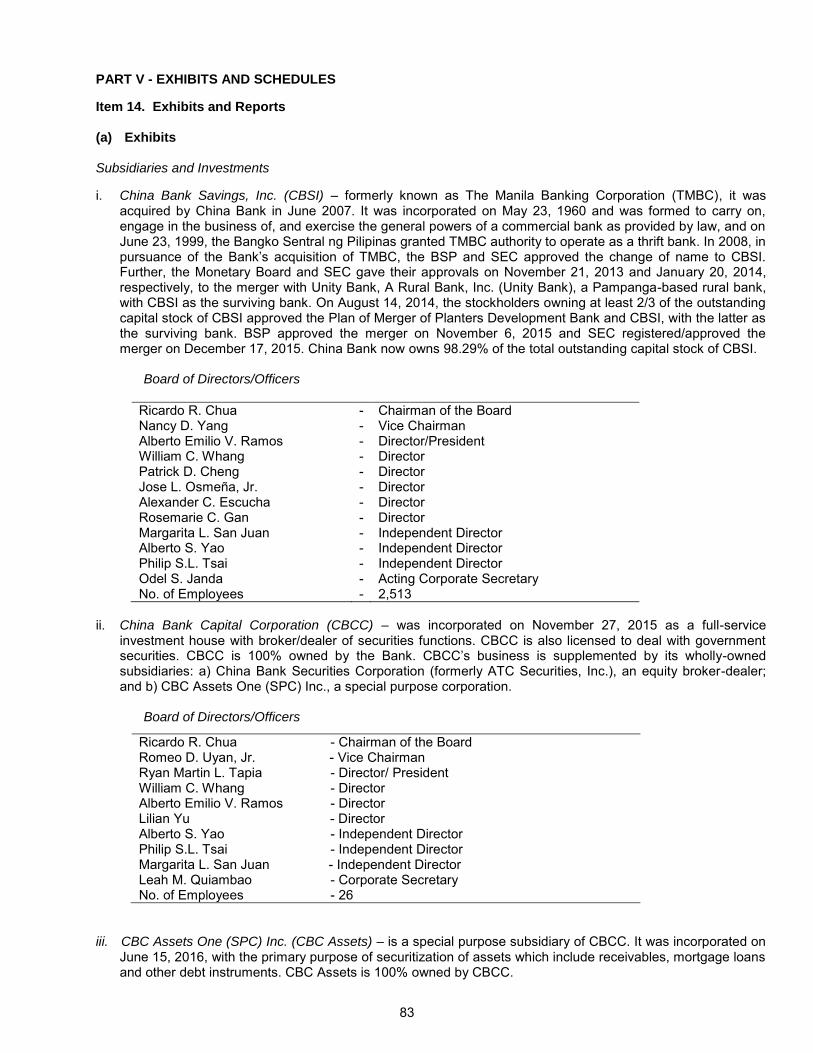
PART V - EXHIBITS AND SCHEDULES Item 14. Exhibits and Reports (a) Exhibits Subsidiaries and Investments
i. China Bank Savings, Inc. (CBSI) – formerly known as The Manila Banking Corporation (TMBC), it was acquired by China Bank in June 2007. It was incorporated on May 23, 1960 and was formed to carry on, engage in the business of, and exercise the general powers of a commercial bank as provided by law, and on June 23, 1999, the Bangko Sentral ng Pilipinas granted TMBC authority to operate as a thrift bank. In 2008, in pursuance of the Bank‘s acquisition of TMBC, the BSP and SEC approved the change of name to CBSI. Further, the Monetary Board and SEC gave their approvals on November 21, 2013 and January 20, 2014, respectively, to the merger with Unity Bank, A Rural Bank, Inc. (Unity Bank), a Pampanga-based rural bank, with CBSI as the surviving bank. On August 14, 2014, the stockholders owning at least 2/3 of the outstanding capital stock of CBSI approved the Plan of Merger of Planters Development Bank and CBSI, with the latter as the surviving bank. BSP approved the merger on November 6, 2015 and SEC registered/approved the merger on December 17, 2015. China Bank now owns 98.29% of the total outstanding capital stock of CBSI. Board of Directors/Officers
Ricardo R. Chua - Chairman of the Board Nancy D. Yang - Vice Chairman Alberto Emilio V. Ramos - Director/President William C. Whang Patrick D. Cheng
- -
Director Director
Jose L. Osmeña, Jr. - Director Alexander C. Escucha - Director Rosemarie C. Gan - Director Margarita L. San Juan - Independent Director Alberto S. Yao - Independent Director Philip S.L. Tsai - Independent Director Odel S. Janda - Acting Corporate Secretary No. of Employees - 2,513
ii. China Bank Capital Corporation (CBCC) – was incorporated on November 27, 2015 as a full-service
investment house with broker/dealer of securities functions. CBCC is also licensed to deal with government securities. CBCC is 100% owned by the Bank. CBCC‘s business is supplemented by its wholly-owned subsidiaries: a) China Bank Securities Corporation (formerly ATC Securities, Inc.), an equity broker-dealer; and b) CBC Assets One (SPC) Inc., a special purpose corporation.
Board of Directors/Officers
Ricardo R. Chua - Chairman of the Board Romeo D. Uyan, Jr. - Vice Chairman Ryan Martin L. Tapia - Director/ President William C. Whang - Director Alberto Emilio V. Ramos - Director Lilian Yu - Director Alberto S. Yao - Independent Director Philip S.L. Tsai - Independent Director Margarita L. San Juan - Independent Director Leah M. Quiambao - Corporate Secretary No. of Employees - 26
iii. CBC Assets One (SPC) Inc. (CBC Assets) – is a special purpose subsidiary of CBCC. It was incorporated on June 15, 2016, with the primary purpose of securitization of assets which include receivables, mortgage loans and other debt instruments. CBC Assets is 100% owned by CBCC.
83
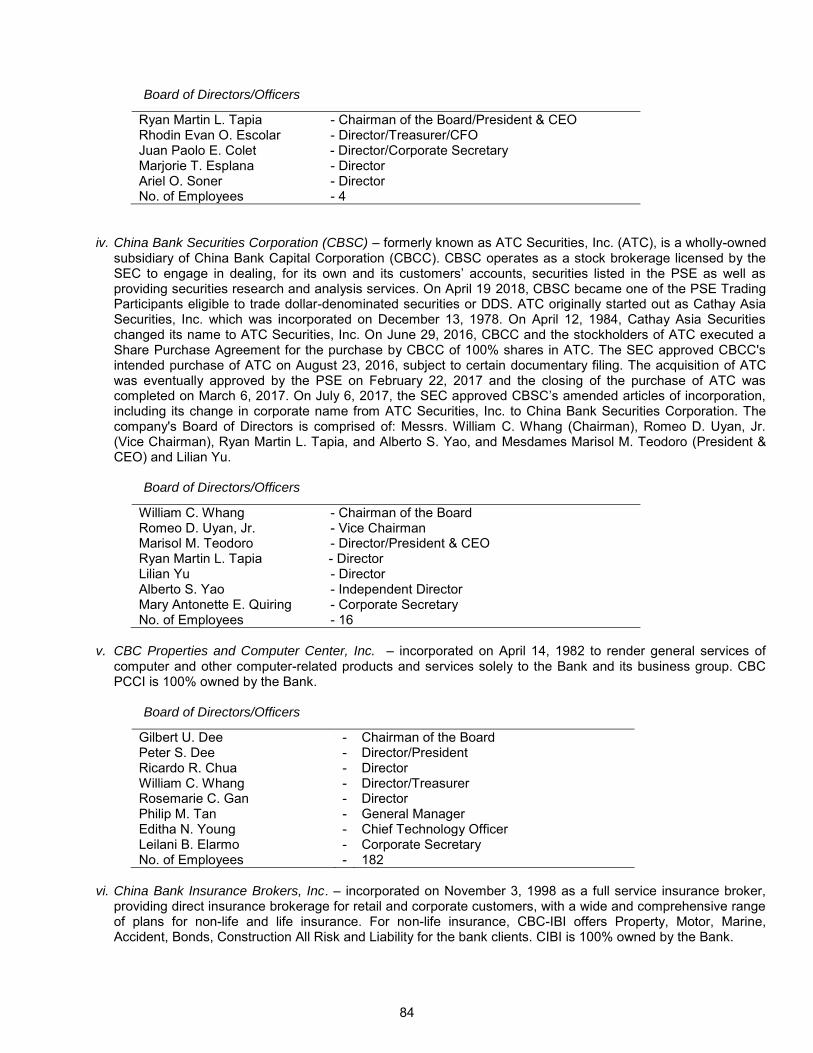
Board of Directors/Officers
Ryan Martin L. Tapia - Chairman of the Board/President & CEO Rhodin Evan O. Escolar - Director/Treasurer/CFO Juan Paolo E. Colet - Director/Corporate Secretary Marjorie T. Esplana - Director Ariel O. Soner - Director No. of Employees - 4
iv. China Bank Securities Corporation (CBSC) – formerly known as ATC Securities, Inc. (ATC), is a wholly-owned subsidiary of China Bank Capital Corporation (CBCC). CBSC operates as a stock brokerage licensed by the SEC to engage in dealing, for its own and its customers‘ accounts, securities listed in the PSE as well as providing securities research and analysis services. On April 19 2018, CBSC became one of the PSE Trading Participants eligible to trade dollar-denominated securities or DDS. ATC originally started out as Cathay Asia Securities, Inc. which was incorporated on December 13, 1978. On April 12, 1984, Cathay Asia Securities changed its name to ATC Securities, Inc. On June 29, 2016, CBCC and the stockholders of ATC executed a Share Purchase Agreement for the purchase by CBCC of 100% shares in ATC. The SEC approved CBCC's intended purchase of ATC on August 23, 2016, subject to certain documentary filing. The acquisition of ATC was eventually approved by the PSE on February 22, 2017 and the closing of the purchase of ATC was completed on March 6, 2017. On July 6, 2017, the SEC approved CBSC‘s amended articles of incorporation, including its change in corporate name from ATC Securities, Inc. to China Bank Securities Corporation. The company's Board of Directors is comprised of: Messrs. William C. Whang (Chairman), Romeo D. Uyan, Jr. (Vice Chairman), Ryan Martin L. Tapia, and Alberto S. Yao, and Mesdames Marisol M. Teodoro (President & CEO) and Lilian Yu.
Board of Directors/Officers
William C. Whang - Chairman of the Board Romeo D. Uyan, Jr. - Vice Chairman Marisol M. Teodoro - Director/President & CEO Ryan Martin L. Tapia - Director Lilian Yu - Director Alberto S. Yao - Independent Director Mary Antonette E. Quiring - Corporate Secretary No. of Employees - 16
v. CBC Properties and Computer Center, Inc. – incorporated on April 14, 1982 to render general services of
computer and other computer-related products and services solely to the Bank and its business group. CBC PCCI is 100% owned by the Bank.
Board of Directors/Officers
Gilbert U. Dee Peter S. Dee
- -
Chairman of the Board Director/President
Ricardo R. Chua - Director William C. Whang Rosemarie C. Gan
- -
Director/Treasurer Director
Philip M. Tan - General Manager Editha N. Young - Chief Technology Officer Leilani B. Elarmo - Corporate Secretary No. of Employees - 182
vi. China Bank Insurance Brokers, Inc. – incorporated on November 3, 1998 as a full service insurance broker,
providing direct insurance brokerage for retail and corporate customers, with a wide and comprehensive range of plans for non-life and life insurance. For non-life insurance, CBC-IBI offers Property, Motor, Marine, Accident, Bonds, Construction All Risk and Liability for the bank clients. CIBI is 100% owned by the Bank.
84
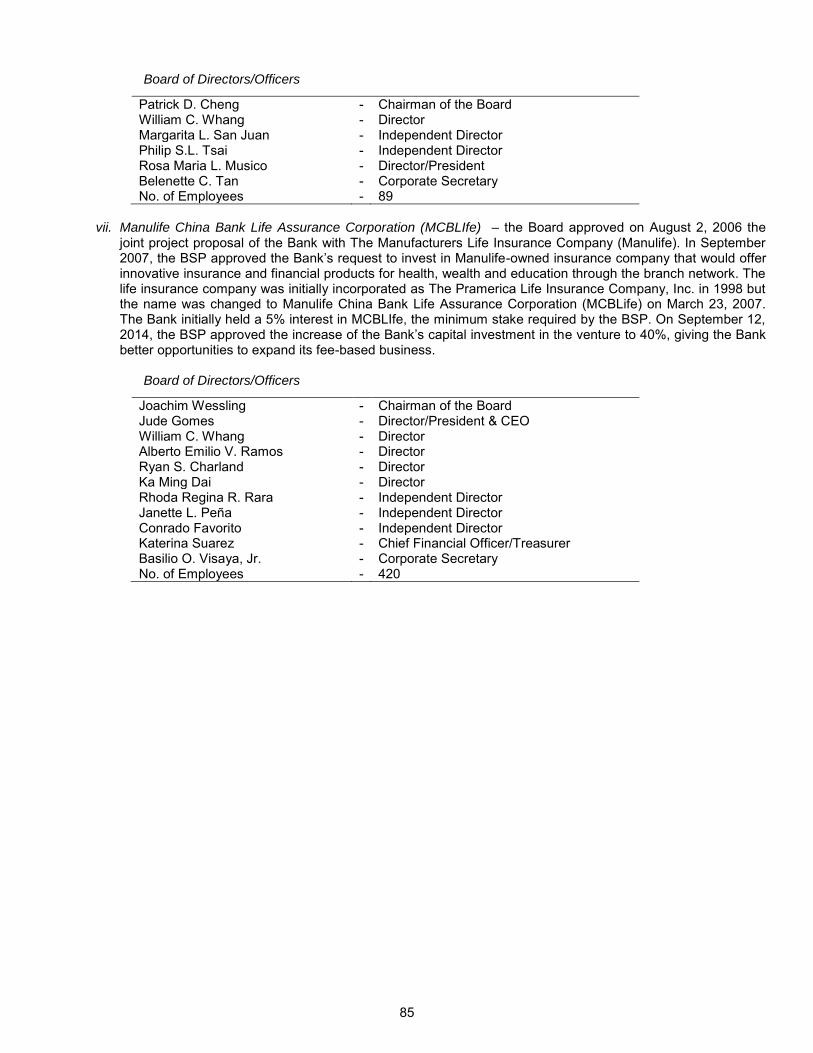
Board of Directors/Officers
Patrick D. Cheng - Chairman of the Board William C. Whang - Director Margarita L. San Juan - Independent Director Philip S.L. Tsai - Independent Director Rosa Maria L. Musico - Director/President Belenette C. Tan - Corporate Secretary No. of Employees - 89
vii. Manulife China Bank Life Assurance Corporation (MCBLIfe) – the Board approved on August 2, 2006 the
joint project proposal of the Bank with The Manufacturers Life Insurance Company (Manulife). In September 2007, the BSP approved the Bank‘s request to invest in Manulife-owned insurance company that would offer innovative insurance and financial products for health, wealth and education through the branch network. The life insurance company was initially incorporated as The Pramerica Life Insurance Company, Inc. in 1998 but the name was changed to Manulife China Bank Life Assurance Corporation (MCBLife) on March 23, 2007. The Bank initially held a 5% interest in MCBLIfe, the minimum stake required by the BSP. On September 12, 2014, the BSP approved the increase of the Bank‘s capital investment in the venture to 40%, giving the Bank better opportunities to expand its fee-based business.
Board of Directors/Officers
Joachim Wessling - Chairman of the Board Jude Gomes - Director/President & CEO William C. Whang Alberto Emilio V. Ramos Ryan S. Charland
- - -
Director Director Director
Ka Ming Dai - Director Rhoda Regina R. Rara - Independent Director Janette L. Peña - Independent Director Conrado Favorito - Independent Director Katerina Suarez - Chief Financial Officer/Treasurer Basilio O. Visaya, Jr. - Corporate Secretary No. of Employees - 420
85
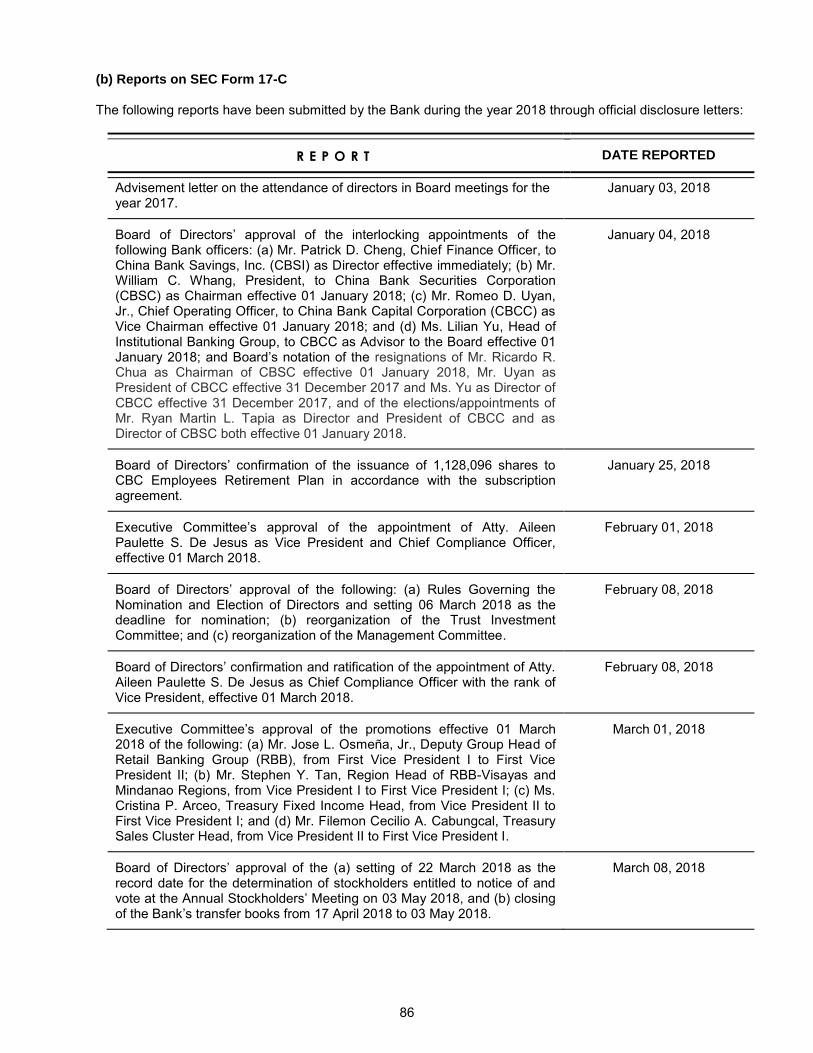
(b) Reports on SEC Form 17-C
The following reports have been submitted by the Bank during the year 2018 through official disclosure letters:
R E P O R T DATE REPORTED
Advisement letter on the attendance of directors in Board meetings for the year 2017.
January 03, 2018
Board of Directors‘ approval of the interlocking appointments of the following Bank officers: (a) Mr. Patrick D. Cheng, Chief Finance Officer, to China Bank Savings, Inc. (CBSI) as Director effective immediately; (b) Mr. William C. Whang, President, to China Bank Securities Corporation (CBSC) as Chairman effective 01 January 2018; (c) Mr. Romeo D. Uyan, Jr., Chief Operating Officer, to China Bank Capital Corporation (CBCC) as Vice Chairman effective 01 January 2018; and (d) Ms. Lilian Yu, Head of Institutional Banking Group, to CBCC as Advisor to the Board effective 01 January 2018; and Board‘s notation of the resignations of Mr. Ricardo R. Chua as Chairman of CBSC effective 01 January 2018, Mr. Uyan as President of CBCC effective 31 December 2017 and Ms. Yu as Director of CBCC effective 31 December 2017, and of the elections/appointments of Mr. Ryan Martin L. Tapia as Director and President of CBCC and as Director of CBSC both effective 01 January 2018.
January 04, 2018
Board of Directors‘ confirmation of the issuance of 1,128,096 shares to CBC Employees Retirement Plan in accordance with the subscription agreement.
January 25, 2018
Executive Committee‘s approval of the appointment of Atty. Aileen Paulette S. De Jesus as Vice President and Chief Compliance Officer, effective 01 March 2018.
February 01, 2018
Board of Directors‘ approval of the following: (a) Rules Governing the Nomination and Election of Directors and setting 06 March 2018 as the deadline for nomination; (b) reorganization of the Trust Investment Committee; and (c) reorganization of the Management Committee.
February 08, 2018
Board of Directors‘ confirmation and ratification of the appointment of Atty. Aileen Paulette S. De Jesus as Chief Compliance Officer with the rank of Vice President, effective 01 March 2018.
February 08, 2018
Executive Committee‘s approval of the promotions effective 01 March 2018 of the following: (a) Mr. Jose L. Osmeña, Jr., Deputy Group Head of Retail Banking Group (RBB), from First Vice President I to First Vice President II; (b) Mr. Stephen Y. Tan, Region Head of RBB-Visayas and Mindanao Regions, from Vice President I to First Vice President I; (c) Ms. Cristina P. Arceo, Treasury Fixed Income Head, from Vice President II to First Vice President I; and (d) Mr. Filemon Cecilio A. Cabungcal, Treasury Sales Cluster Head, from Vice President II to First Vice President I.
March 01, 2018
Board of Directors‘ approval of the (a) setting of 22 March 2018 as the record date for the determination of stockholders entitled to notice of and vote at the Annual Stockholders‘ Meeting on 03 May 2018, and (b) closing of the Bank‘s transfer books from 17 April 2018 to 03 May 2018.
March 08, 2018
86
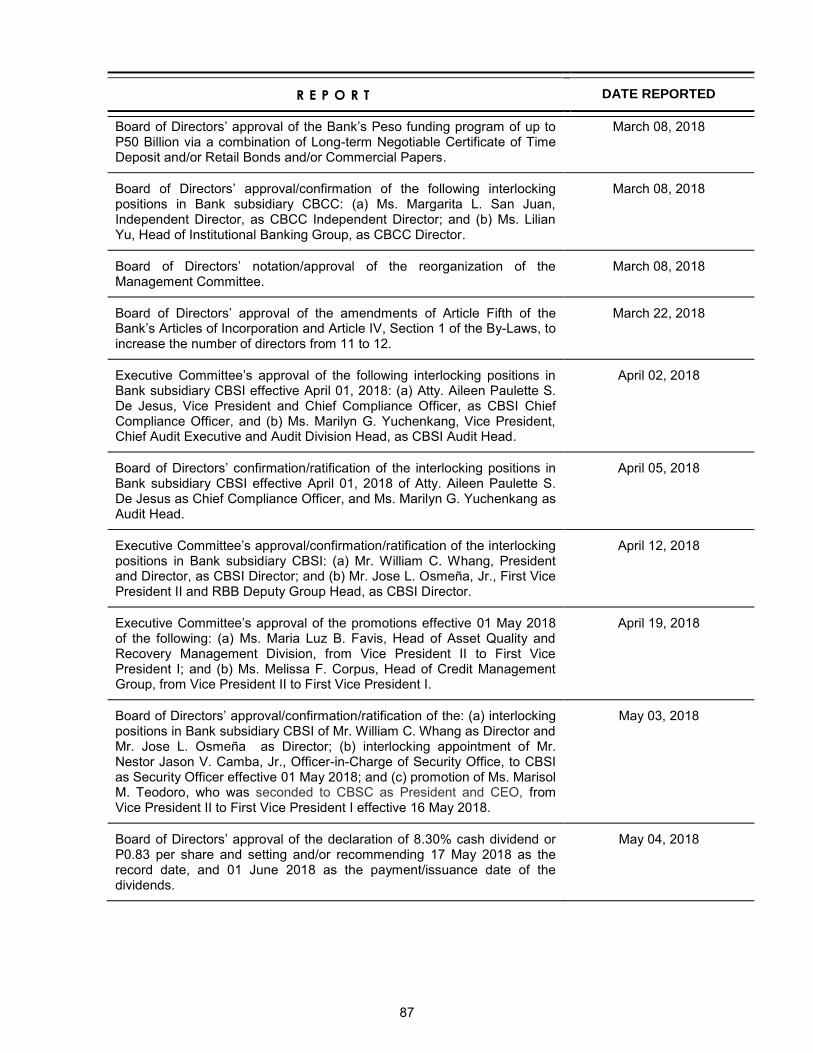
R E P O R T DATE REPORTED
Board of Directors‘ approval of the Bank‘s Peso funding program of up to P50 Billion via a combination of Long-term Negotiable Certificate of Time Deposit and/or Retail Bonds and/or Commercial Papers.
March 08, 2018
Board of Directors‘ approval/confirmation of the following interlocking positions in Bank subsidiary CBCC: (a) Ms. Margarita L. San Juan, Independent Director, as CBCC Independent Director; and (b) Ms. Lilian Yu, Head of Institutional Banking Group, as CBCC Director.
March 08, 2018
Board of Directors‘ notation/approval of the reorganization of the Management Committee.
March 08, 2018
Board of Directors‘ approval of the amendments of Article Fifth of the Bank‘s Articles of Incorporation and Article IV, Section 1 of the By-Laws, to increase the number of directors from 11 to 12.
March 22, 2018
Executive Committee‘s approval of the following interlocking positions in Bank subsidiary CBSI effective April 01, 2018: (a) Atty. Aileen Paulette S. De Jesus, Vice President and Chief Compliance Officer, as CBSI Chief Compliance Officer, and (b) Ms. Marilyn G. Yuchenkang, Vice President, Chief Audit Executive and Audit Division Head, as CBSI Audit Head.
April 02, 2018
Board of Directors‘ confirmation/ratification of the interlocking positions in Bank subsidiary CBSI effective April 01, 2018 of Atty. Aileen Paulette S. De Jesus as Chief Compliance Officer, and Ms. Marilyn G. Yuchenkang as Audit Head.
April 05, 2018
Executive Committee‘s approval/confirmation/ratification of the interlocking positions in Bank subsidiary CBSI: (a) Mr. William C. Whang, President and Director, as CBSI Director; and (b) Mr. Jose L. Osmeña, Jr., First Vice President II and RBB Deputy Group Head, as CBSI Director.
April 12, 2018
Executive Committee‘s approval of the promotions effective 01 May 2018 of the following: (a) Ms. Maria Luz B. Favis, Head of Asset Quality and Recovery Management Division, from Vice President II to First Vice President I; and (b) Ms. Melissa F. Corpus, Head of Credit Management Group, from Vice President II to First Vice President I.
April 19, 2018
Board of Directors‘ approval/confirmation/ratification of the: (a) interlocking positions in Bank subsidiary CBSI of Mr. William C. Whang as Director and Mr. Jose L. Osmeña as Director; (b) interlocking appointment of Mr. Nestor Jason V. Camba, Jr., Officer-in-Charge of Security Office, to CBSI as Security Officer effective 01 May 2018; and (c) promotion of Ms. Marisol M. Teodoro, who was seconded to CBSC as President and CEO, from Vice President II to First Vice President I effective 16 May 2018.
May 03, 2018
Board of Directors‘ approval of the declaration of 8.30% cash dividend or P0.83 per share and setting and/or recommending 17 May 2018 as the record date, and 01 June 2018 as the payment/issuance date of the dividends.
May 04, 2018
87
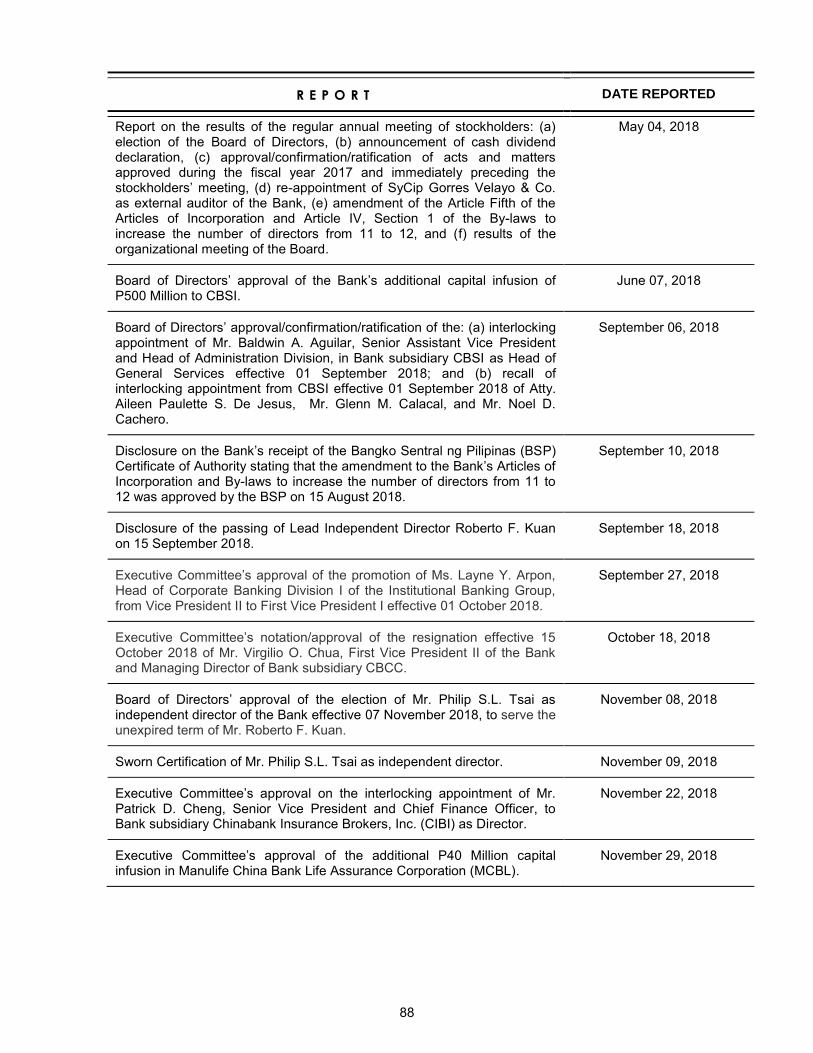
R E P O R T DATE REPORTED
Report on the results of the regular annual meeting of stockholders: (a) election of the Board of Directors, (b) announcement of cash dividend declaration, (c) approval/confirmation/ratification of acts and matters approved during the fiscal year 2017 and immediately preceding the stockholders‘ meeting, (d) re-appointment of SyCip Gorres Velayo & Co. as external auditor of the Bank, (e) amendment of the Article Fifth of the Articles of Incorporation and Article IV, Section 1 of the By-laws to increase the number of directors from 11 to 12, and (f) results of the organizational meeting of the Board.
May 04, 2018
Board of Directors‘ approval of the Bank‘s additional capital infusion of P500 Million to CBSI.
June 07, 2018
Board of Directors‘ approval/confirmation/ratification of the: (a) interlocking appointment of Mr. Baldwin A. Aguilar, Senior Assistant Vice President and Head of Administration Division, in Bank subsidiary CBSI as Head of General Services effective 01 September 2018; and (b) recall of interlocking appointment from CBSI effective 01 September 2018 of Atty. Aileen Paulette S. De Jesus, Mr. Glenn M. Calacal, and Mr. Noel D. Cachero.
September 06, 2018
Disclosure on the Bank‘s receipt of the Bangko Sentral ng Pilipinas (BSP) Certificate of Authority stating that the amendment to the Bank‘s Articles of Incorporation and By-laws to increase the number of directors from 11 to 12 was approved by the BSP on 15 August 2018.
September 10, 2018
Disclosure of the passing of Lead Independent Director Roberto F. Kuan on 15 September 2018.
September 18, 2018
Executive Committee‘s approval of the promotion of Ms. Layne Y. Arpon, Head of Corporate Banking Division I of the Institutional Banking Group, from Vice President II to First Vice President I effective 01 October 2018.
September 27, 2018
Executive Committee‘s notation/approval of the resignation effective 15 October 2018 of Mr. Virgilio O. Chua, First Vice President II of the Bank and Managing Director of Bank subsidiary CBCC.
October 18, 2018
Board of Directors‘ approval of the election of Mr. Philip S.L. Tsai as independent director of the Bank effective 07 November 2018, to serve the unexpired term of Mr. Roberto F. Kuan.
November 08, 2018
Sworn Certification of Mr. Philip S.L. Tsai as independent director. November 09, 2018
Executive Committee‘s approval on the interlocking appointment of Mr. Patrick D. Cheng, Senior Vice President and Chief Finance Officer, to Bank subsidiary Chinabank Insurance Brokers, Inc. (CIBI) as Director.
November 22, 2018
Executive Committee‘s approval of the additional P40 Million capital infusion in Manulife China Bank Life Assurance Corporation (MCBL).
November 29, 2018
88
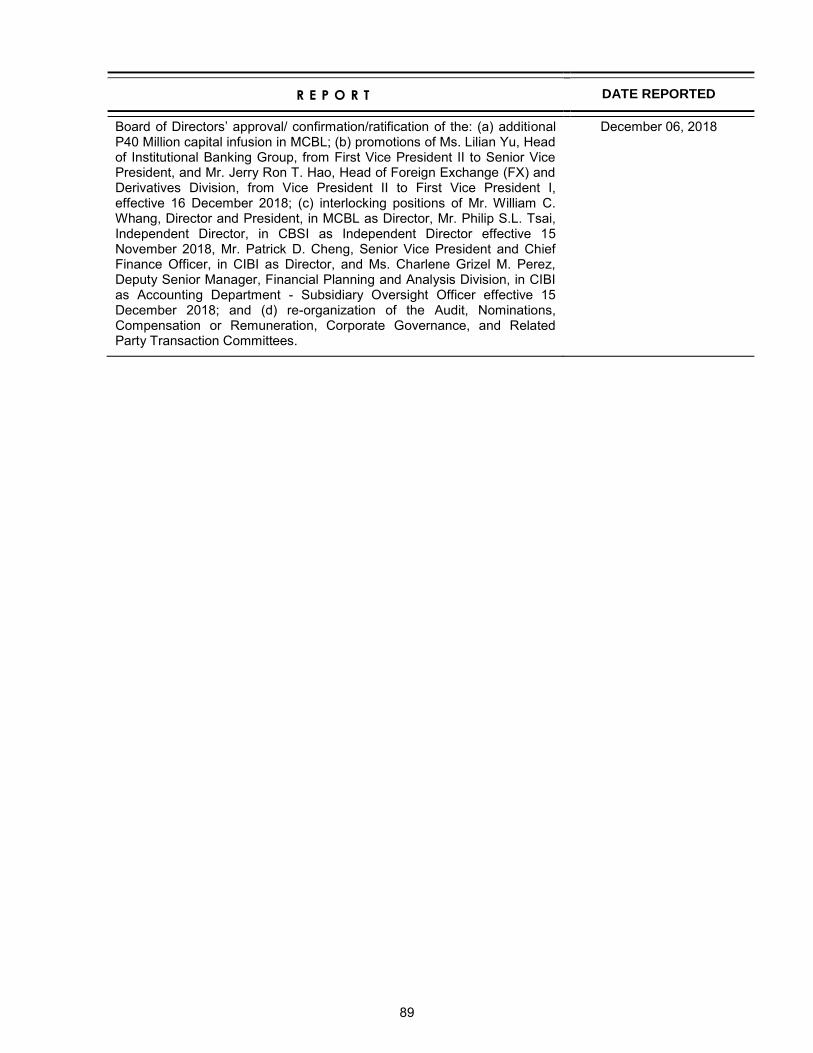
R E P O R T DATE REPORTED
Board of Directors‘ approval/ confirmation/ratification of the: (a) additional P40 Million capital infusion in MCBL; (b) promotions of Ms. Lilian Yu, Head of Institutional Banking Group, from First Vice President II to Senior Vice President, and Mr. Jerry Ron T. Hao, Head of Foreign Exchange (FX) and Derivatives Division, from Vice President II to First Vice President I, effective 16 December 2018; (c) interlocking positions of Mr. William C. Whang, Director and President, in MCBL as Director, Mr. Philip S.L. Tsai, Independent Director, in CBSI as Independent Director effective 15 November 2018, Mr. Patrick D. Cheng, Senior Vice President and Chief Finance Officer, in CIBI as Director, and Ms. Charlene Grizel M. Perez, Deputy Senior Manager, Financial Planning and Analysis Division, in CIBI as Accounting Department - Subsidiary Oversight Officer effective 15 December 2018; and (d) re-organization of the Audit, Nominations, Compensation or Remuneration, Corporate Governance, and Related Party Transaction Committees.
December 06, 2018
89
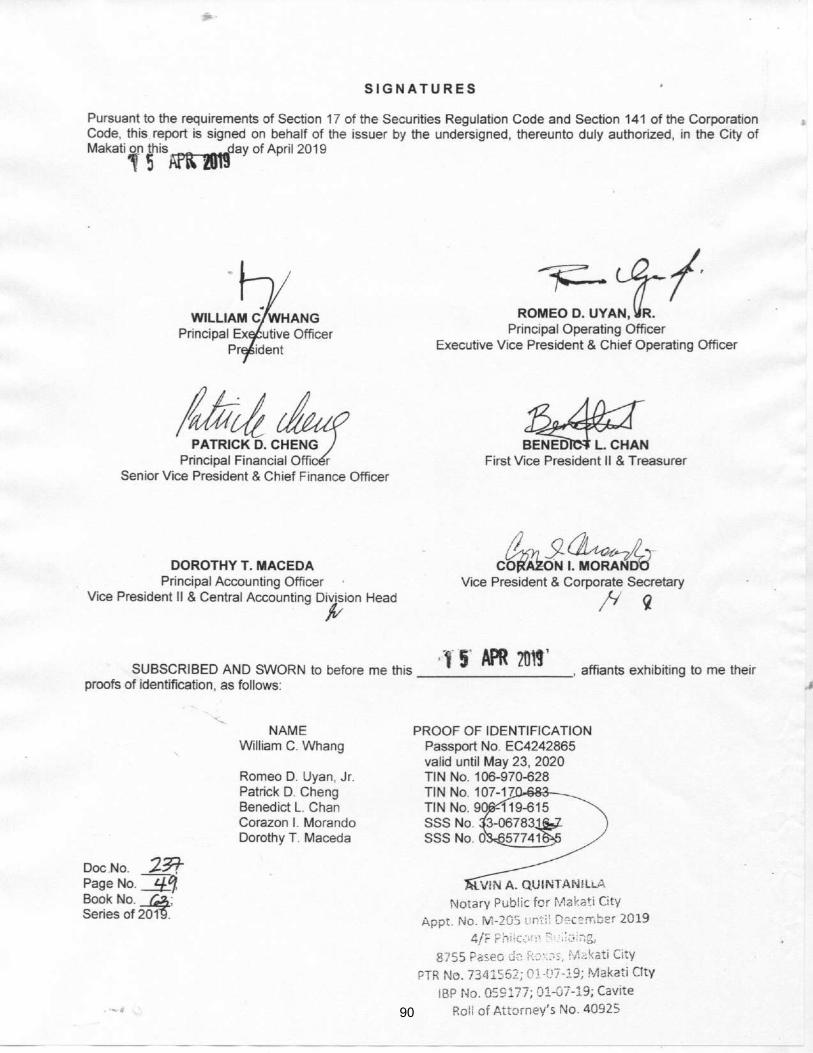
90
vjnquisido
Rectangle

91
vjnquisido
Rectangle
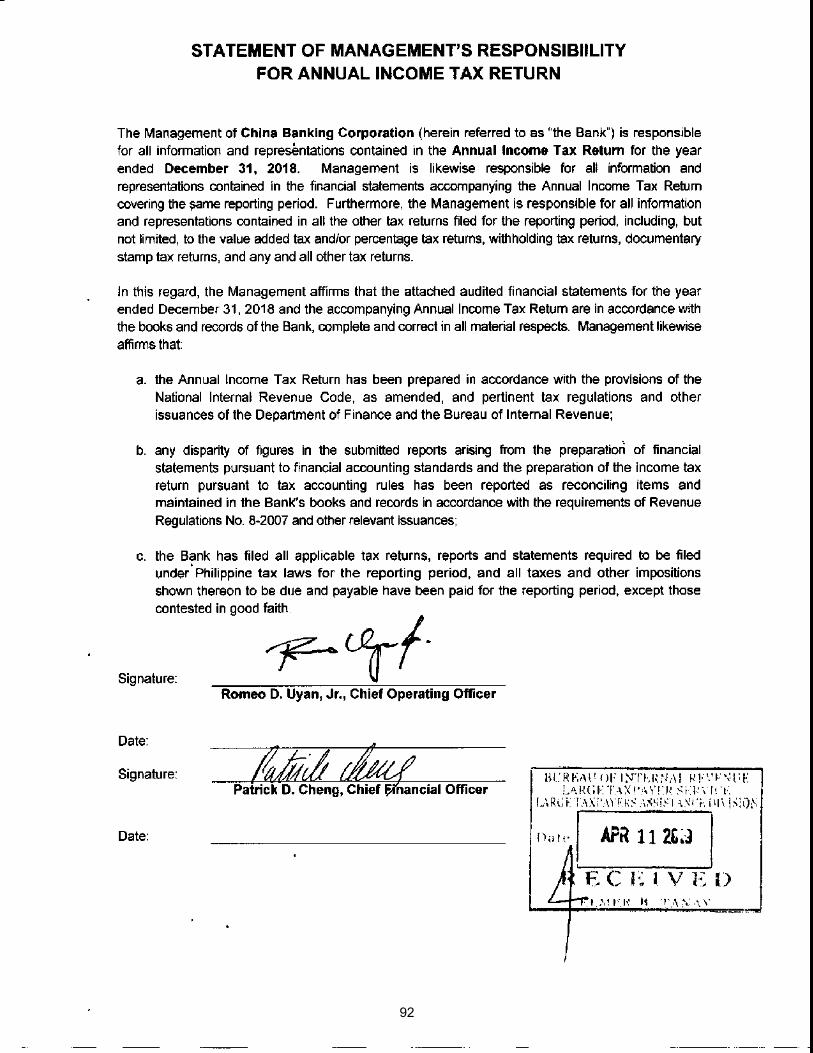
92
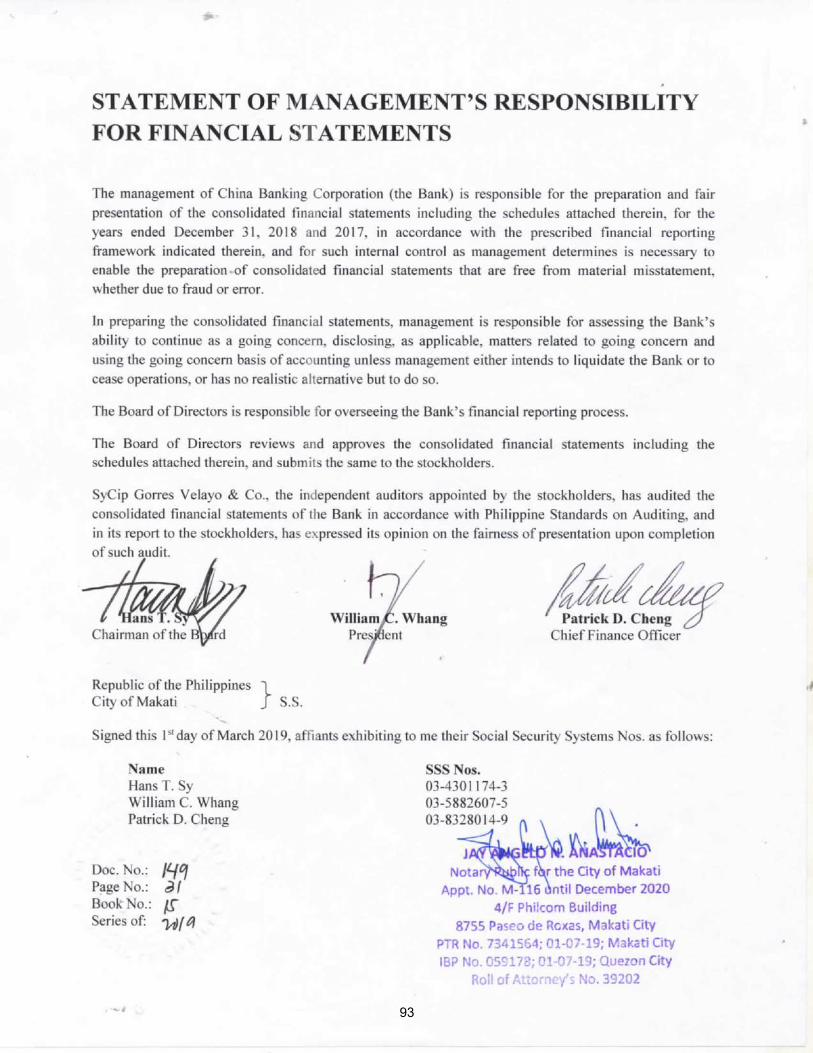
STATEMENT OF MANAGEMENT)S RESPONSIBILITY
FOR FINANCIAL STATEMENTS
The management of China Banking Corporation (the Bank) is responsible for the preparation and fair
presentation of the consolidated financial statements including the schedules attached therein, for tlie
ye狐s ended December 31, 2018 a-id 2017言n acc○rd弧ce w仙書he p「escribed簡nanciai 「epo正ng
framework indicated therein, and for such internal control as management detemines is necessary to
enable the p「eparation・of consolidated角n飢cial statements that a「e什ee什om material misstatement,
whether due to什aud or e町or.
量れpreparing the consolida章ed簡n紬cial st如ements, management is responsible for assessing the B紬k's
ab輔y to c○nti皿e as a going concern, disclosing, as appiicable, ma請e「s related to going c○iicem紬d
using the gomg c○ncem basis ofacc○unting unless皿anagement either intends to liquidate the Bank or to
cease operations, o「 has no realistic altemative but to do so.
The Bo釘d of Directors is responsible for overseeing the Bank's鰯nancial 「ep〇両ng process.
The Board of Directors reviews aiid approves the consolidated航nancial statements including the
schedules a請ached therein,劃d submits the same to the stockholders.
Sycip Go町cs Velayo & Co., the independent auditors appointed by the stockholders, has audited the
consolidated financiai statements of the Bank in accordance with Philippine Standards on Auditingつand
in its report to the stockholders, has expressed its opinion on the fairness of presentation upon completion
of such audit.
I s.s.
Name
Hans T. Sy
W皿am C. Whang
Pat五ck D. Cheng
Paogce‡:.: '#
%r詰sN.::‘: #/,
93
vjnquisido
Rectangle
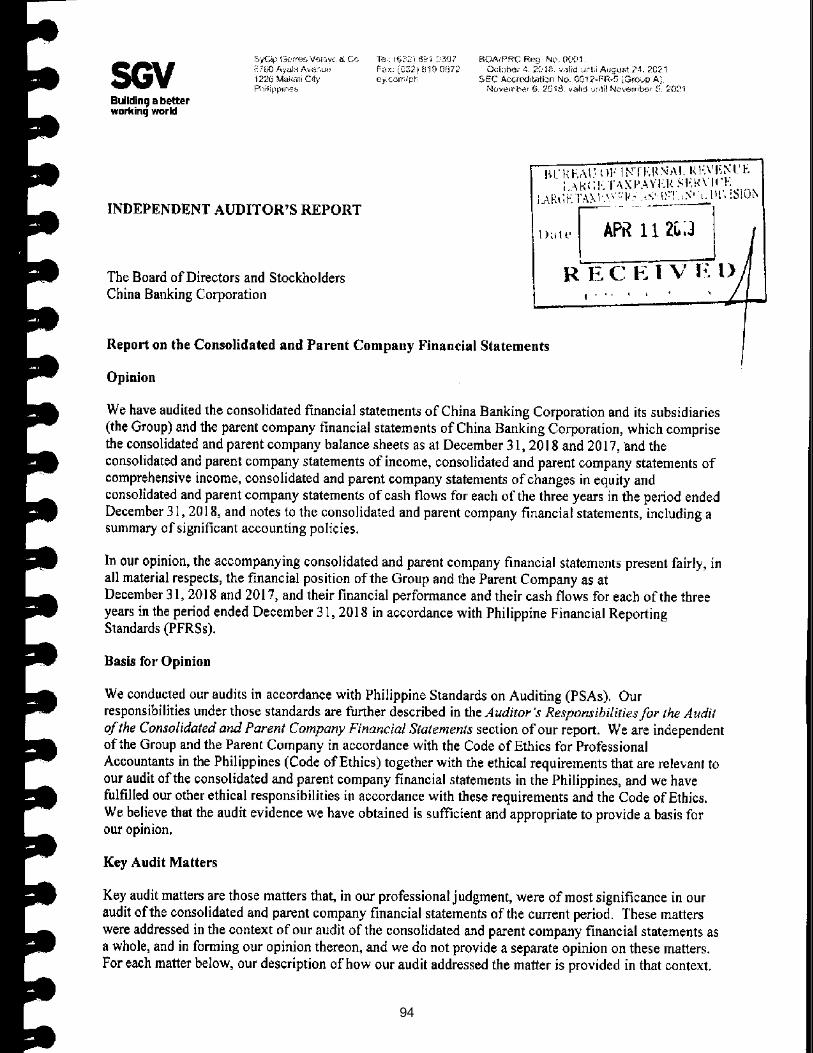
94
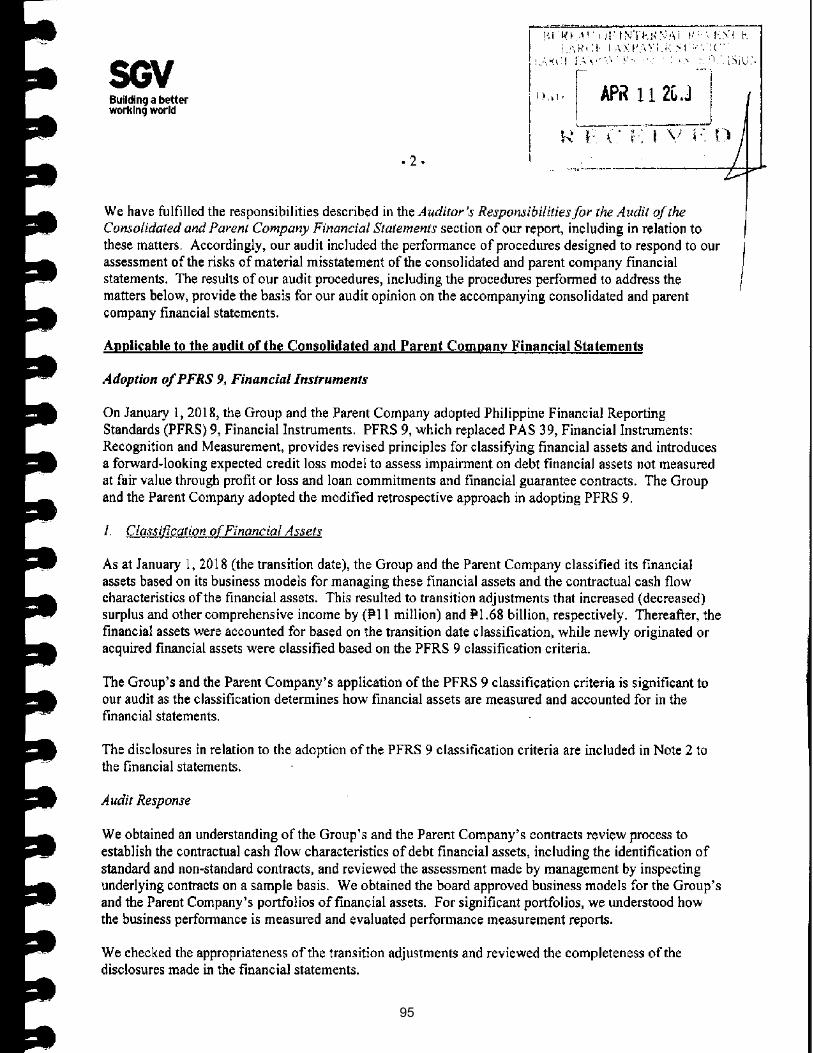
95
96
97
98
99
100
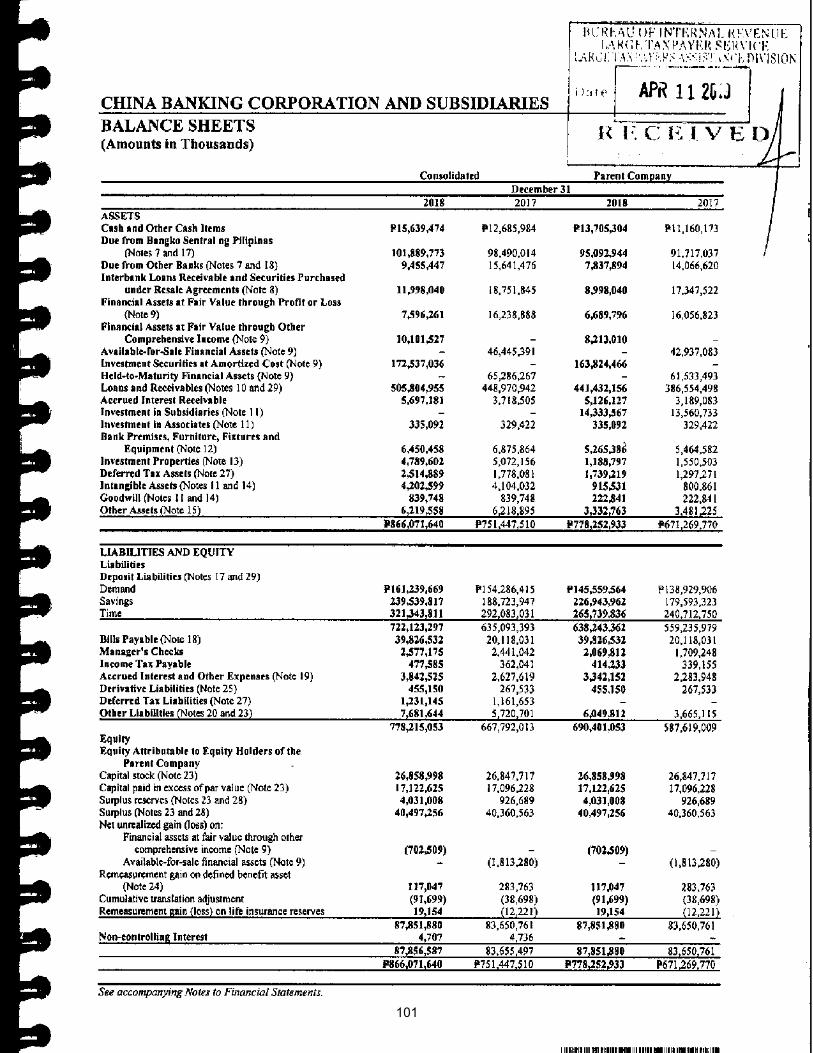
101
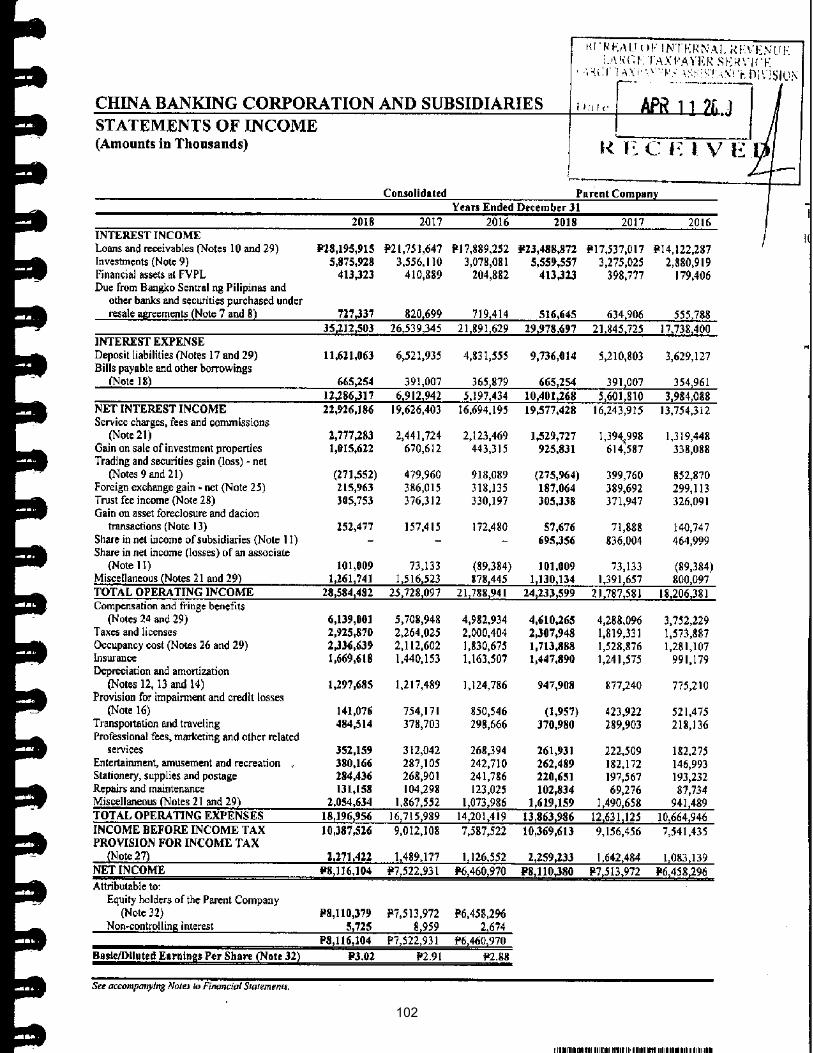
102
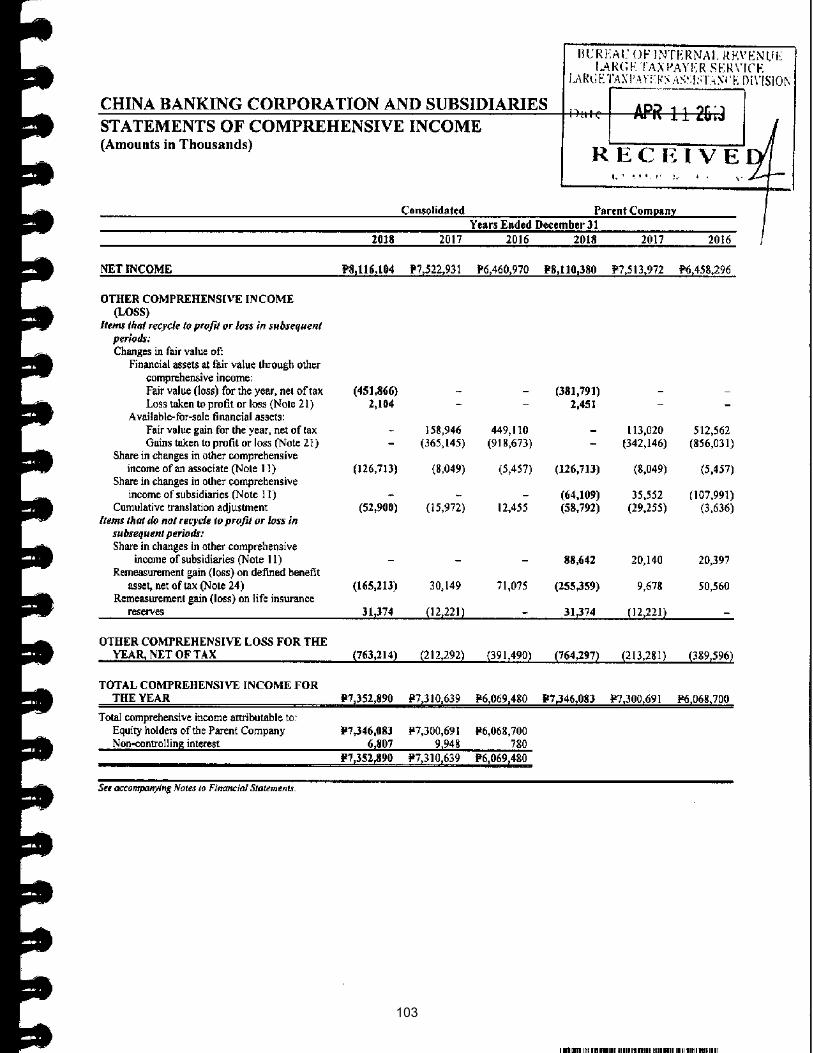
103
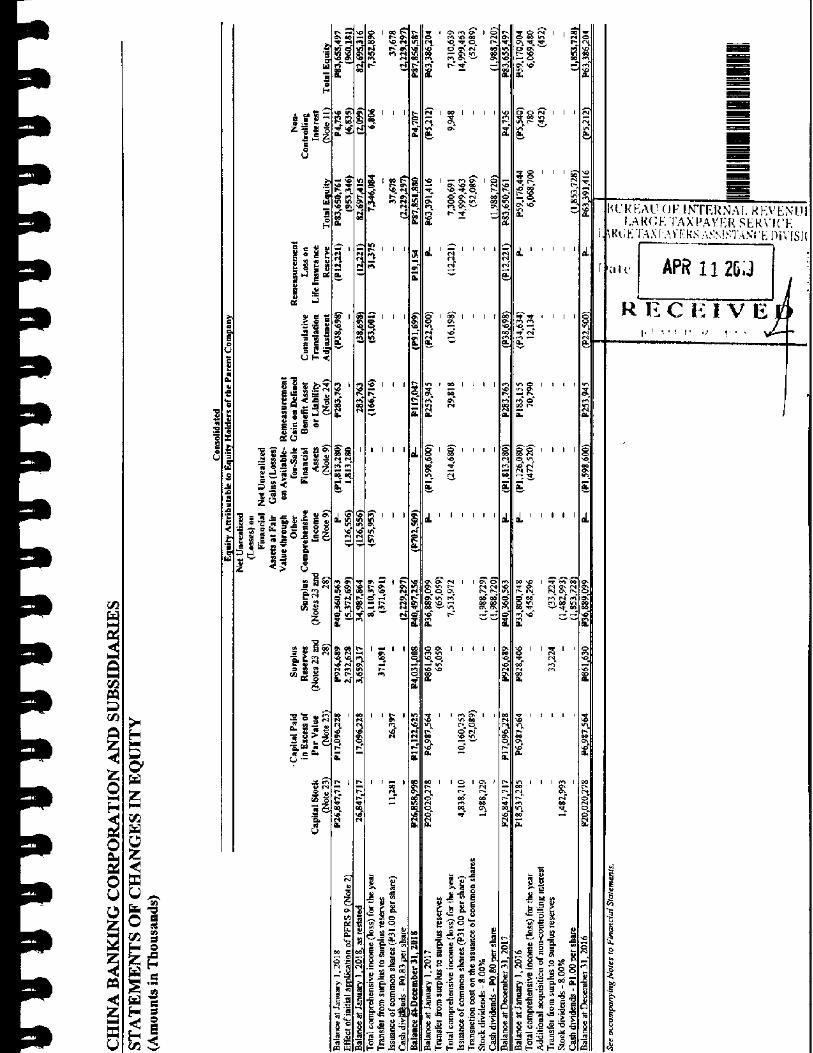
104
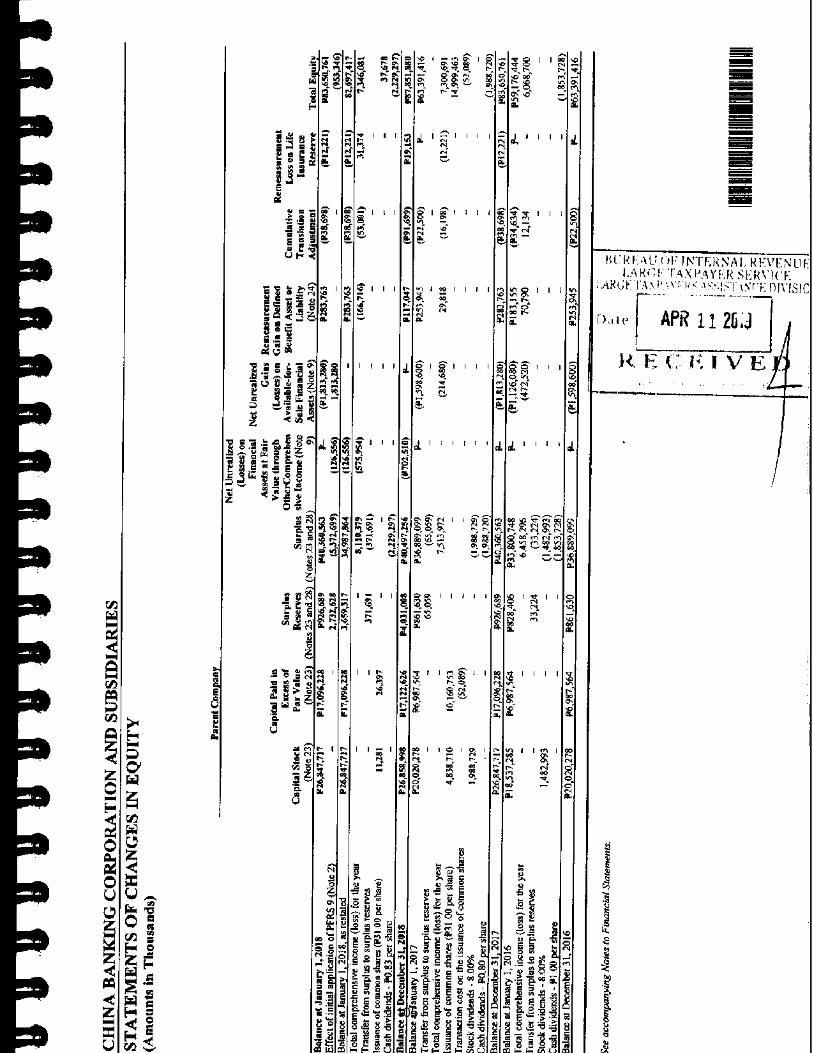
105
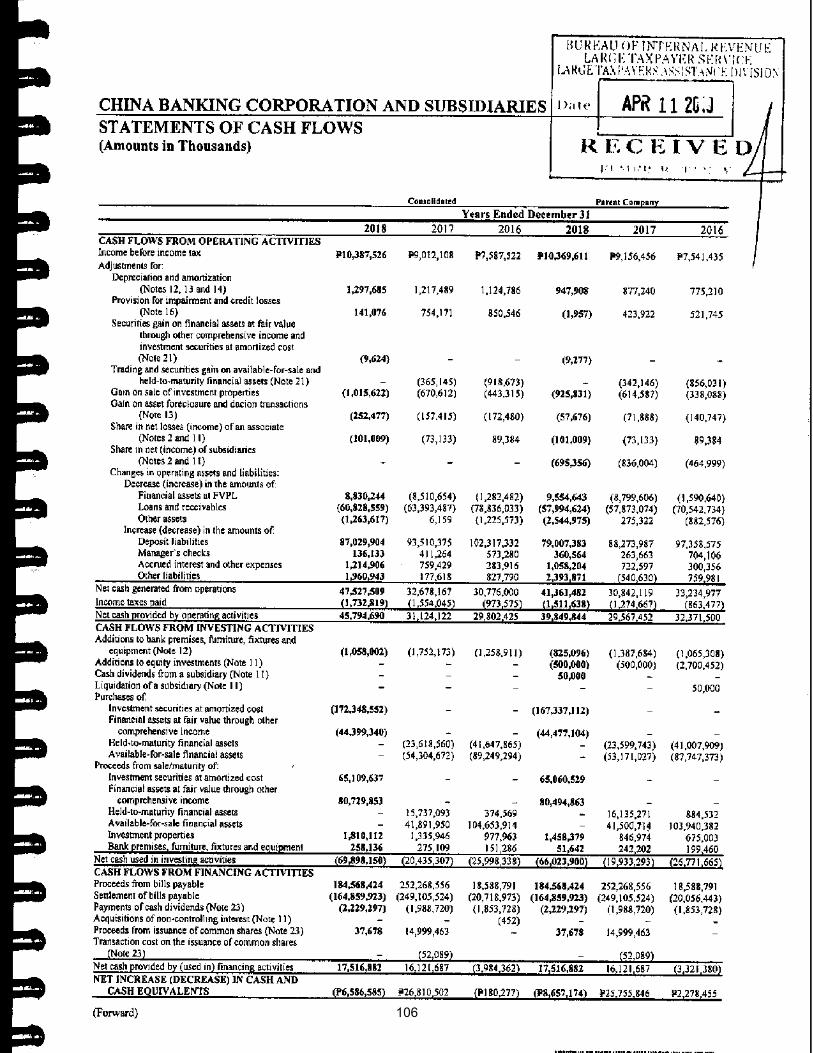
106
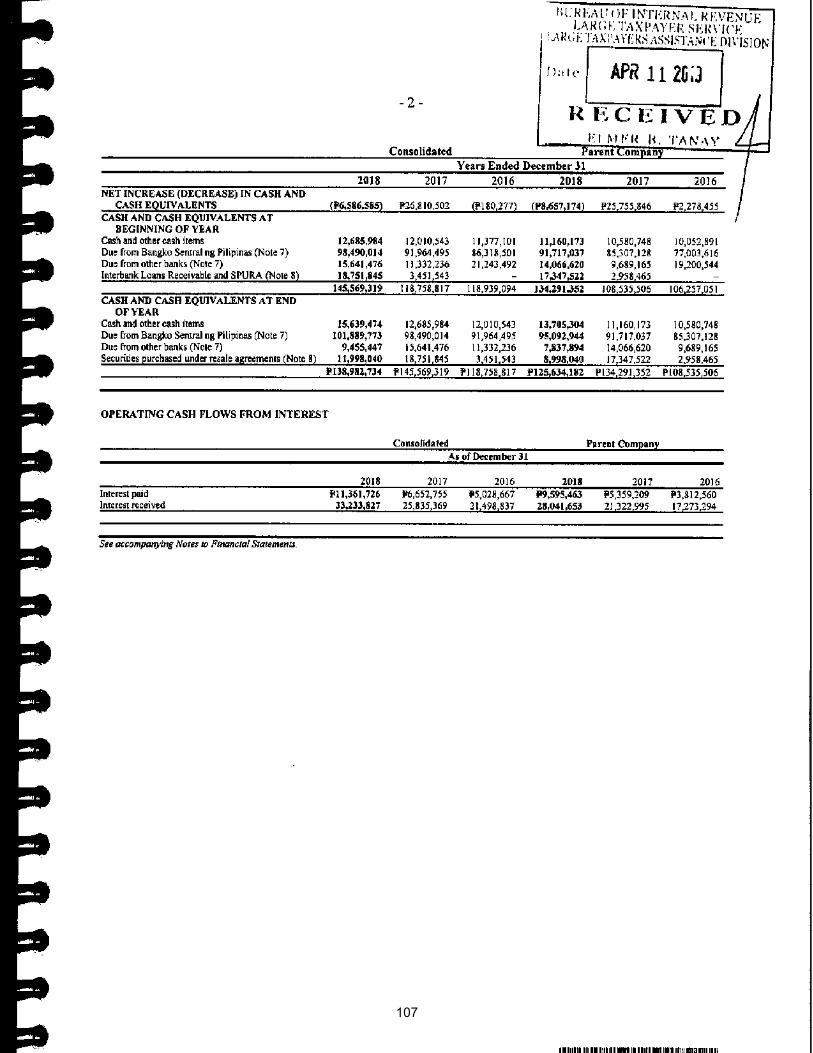
107
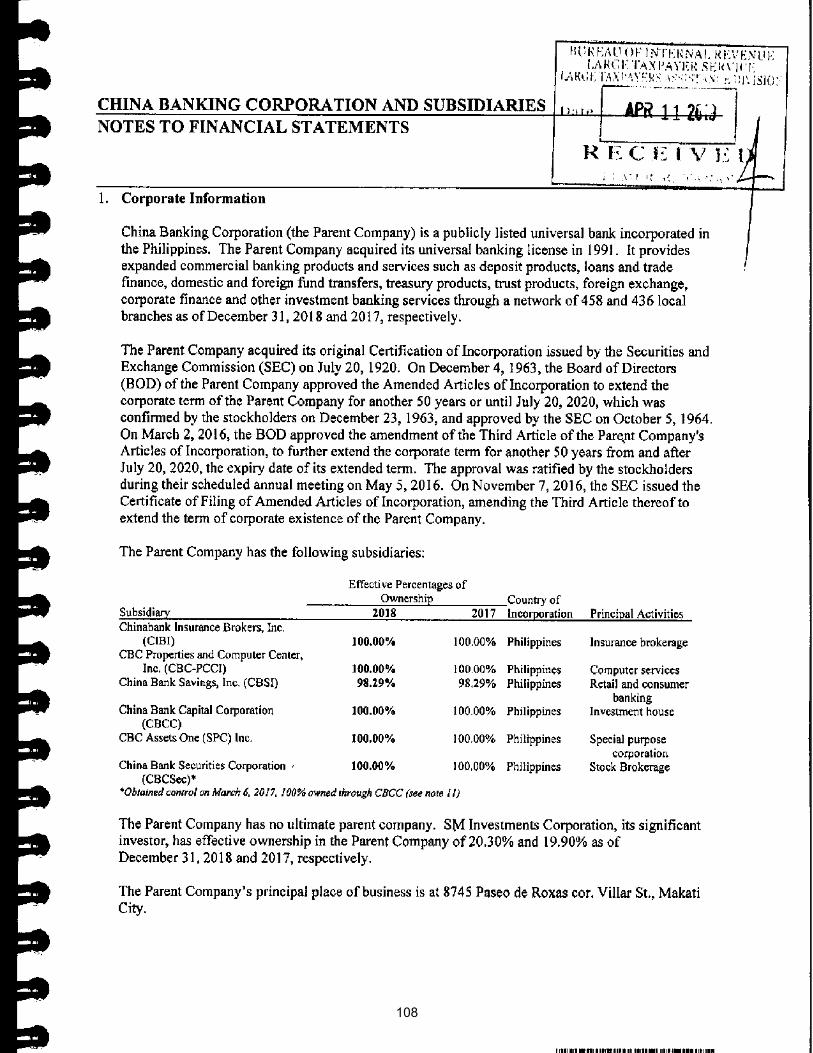
108
- 2 -
*SGVFS032944*
2. Summary of Significant Accounting Policies
Basis of PreparationThe accompanying consolidated financial statements include the financial statements of the ParentCompany and its subsidiaries (collectively referred to as “the Group”).
The accompanying financial statements have been prepared on a historical cost basis except forfinancial instruments at fair value through profit or loss (FVPL), financial assets at fair value throughother comprehensive income (FVOCI) and available-for-sale (AFS) financial assets. The financialstatements are presented in Philippine peso, and all values are rounded to the nearest thousand pesoexcept when otherwise indicated.
The financial statements of the Parent Company reflect the accounts maintained in the RegularBanking Unit (RBU) and Foreign Currency Deposit Unit (FCDU). The financial statements of theseunits are combined after eliminating inter-unit accounts.
Each entity in the Group determines its own functional currency and items included in the financialstatements of each entity are measured using that functional currency. The functional currency of theParent Company’s subsidiaries is the Philippine peso.
Statement of ComplianceThe financial statements of the Group and the Parent Company have been prepared in compliancewith Philippine Financial Reporting Standards (PFRS).
Presentation of Financial StatementsThe balance sheets of the Group and of the Parent Company are presented in order of liquidity. Ananalysis regarding recovery of assets or settlement of liabilities within 12 months after the reportingdate (current) and more than 12 months after the reporting date (non-current) is presented in Note 22.
Financial assets and financial liabilities are offset and the net amount reported in the balance sheetsonly when there is a legally enforceable right to offset the recognized amounts and there is anintention to settle on a net basis, or to realize the assets and settle the liability simultaneously. TheGroup and the Parent Company assess that they have currently enforceable right of offset if the rightis not contingent on a future event, and is legally enforceable in the normal course of business, eventof default, and event of insolvency or bankruptcy of the Group, the Parent Company and all of thecounterparties.
Income and expenses are not offset in the statement of income unless required or permitted by anyaccounting standard or interpretation, and as specifically disclosed in the accounting policies of theGroup and the Parent Company.
Basis of Consolidation and Investments in SubsidiariesThe consolidated financial statements of the Group are prepared for the same reporting year as theParent Company, using consistent accounting policies. All significant intra-group balances,transactions and income and expenses resulting from intra-group transactions are eliminated in full.
Subsidiaries are consolidated from the date on which control is transferred to the Parent Company.The Group controls an investee if and only if the Group has:
∂ power over the investee (i.e., existing rights that give it the current ability to direct the relevantactivities of the investee);
109
VJNQUISIDO
Rectangle
VJNQUISIDO
Rectangle
VJNQUISIDO
Rectangle
- 3 -
*SGVFS032944*
∂ exposure, or rights, to variable returns from its involvement with the investee, and∂ the ability to use its power over the investee to affect its returns.
When the Group has less than a majority of the voting or similar rights of an investee, the Groupconsiders all relevant facts and circumstances in assessing whether it has power over an investee,including:
∂ the contractual arrangement with the other vote holders of the investee∂ rights arising from other contractual arrangements∂ the Group’s voting rights and potential voting rights.
The Group re-assesses whether or not it controls an investee if facts and circumstances indicate thatthere are changes to one or more of the three elements of control. Consolidation of a subsidiarybegins when the Group obtains control over the subsidiary and ceases when the Group loses controlof the subsidiary. Assets, liabilities, income and expenses of a subsidiary acquired or disposed ofduring the year are included in the statement of comprehensive income from the date the Group gainscontrol until the date the Group ceases to control the subsidiary. Profit or loss and each component ofother comprehensive income (OCI) are attributed to the equity holders of the Group and to the non-controlling interests. When necessary, adjustments are made to the financial statements of thesubsidiary to bring its accounting policies into line with the Group’s accounting policies. All intra-group assets and liabilities, equity, income, expenses and cash flows relating to transactions betweenmembers of the Group are eliminated in full on consolidation.
A change in the ownership interest of a subsidiary, without a loss of control, is accounted for as anequity transaction. If the Group loses control over a subsidiary, it:
∂ Derecognizes the assets (including goodwill) and liabilities of the subsidiary∂ Derecognizes the carrying amount of any non-controlling interest∂ Derecognizes the related OCI recorded in equity and recycle the same to profit or loss or surplus∂ Recognizes the fair value of the consideration received∂ Recognizes the fair value of any investment retained∂ Recognizes the remaining difference in profit or loss∂ Reclassifies the parent’s share of components previously recognized in OCI to profit or loss or
retained earnings, as appropriate, as would be recognized if the Group had directly disposed ofthe related assets or liabilities
Non-Controlling InterestNon-controlling interest represents the portion of profit or loss and net assets not owned, directly orindirectly, by the Parent Company.
Non-controlling interest is presented separately in the consolidated statement of income, consolidatedstatement of comprehensive income, and within equity in the consolidated balance sheet, separatelyfrom parent shareholders' equity. Any losses applicable to the non-controlling interest are allocatedagainst the interests of the non-controlling interest even if this results in the non-controlling interesthaving a deficit balance.
110
VJNQUISIDO
Rectangle
- 4 -
*SGVFS032944*
Changes in Accounting Policies and Disclosures
The accounting policies adopted are consistent with those of the previous financial year except for thefollowing new, amendments and improvements to PFRS, Philippine Accounting Standards (PAS) andPhilippine Interpretation which became effective as of January 1, 2018. Except as otherwiseindicated, these changes in the accounting policies did not have any significant impact on thefinancial position or performance of the Group:
∂ New and Amended Standards∂ Amendments to PFRS 2, Share-based Payment, Classification and Measurement of Share-
based Payment Transactions∂ Amendments to PFRS 4, Insurance Contracts, Applying PFRS 9, Financial Instruments, with
PFRS 4∂ Philippine Interpretation IFRIC-22, Foreign Currency Transactions and Advance
Consideration
∂ Annual Improvements to PFRSs (2014 – 2017 Cycle)∂ Amendments to PAS 28, Investments in Associates and Joint Ventures, Measuring anAssociate or Joint Venture at Fair Value∂ Amendments to PAS 40, Investment Property, Transfers of Investment Property
Standard that has been adopted and that is deemed to have significant impact on the financialstatements or performance of the Group is described below:
PFRS 9, Financial InstrumentsThe Group adopted PFRS 9 on January 1, 2018 following the modified retrospective approach.PFRS 9 replaced PAS 39, Financial Instruments: Recognition and Measurement.
Under the modified retrospective approach, the Group did not restate the prior-period comparativeconsolidated financial statements and remains to report the comparative information for 2017 and2016 under PAS 39. Accordingly, the 2017 and 2016 comparative financial statements are notcomparable to the information presented for 2018. Differences in the carrying amounts of financialinstruments resulting from the adoption of PFRS 9 are recognized in the opening January 1, 2018surplus and OCI as if the Group had always followed the new requirements.
As a result of applying PFRS 9’s requirements on classification and measurement of financial assets,the opening January 1, 2018 equity in the Group’s and Parent Company’s balance sheet increased byP=1.78 billion and P=1.67 billion, respectively, before deferred tax effects. This change resulted fromreclassifications of financial assets depending on the Group’s and the Parent Company’s applicationof its business models and its assessment of the financial assets’ cash flow characteristics. However,applying PFRS 9’s requirements on the recognition of expected credit losses decreased the openingJanuary 1, 2018 equity in the Group’s and Parent Company’s balance sheet by P=3.59 billion andP=3.09 billion, respectively, before deferred tax effects. Impairment under ECL is now dependentupon whether there have been significant increases in the credit risk of the Group’s and ParentCompany’s financial assets since initial recognition and on the Group’s and Parent Company’sevaluation of factors relevant to the measurement of expected credit losses such as a range of possibleoutcomes and information about past events, current conditions and forecasts of future economicconditions. Deferred tax asset recognized due to adoption of PFRS 9 amounted to P=0.81 billion forthe Group and P=0.80 billion for the Parent Company.
111
VJNQUISIDO
Rectangle
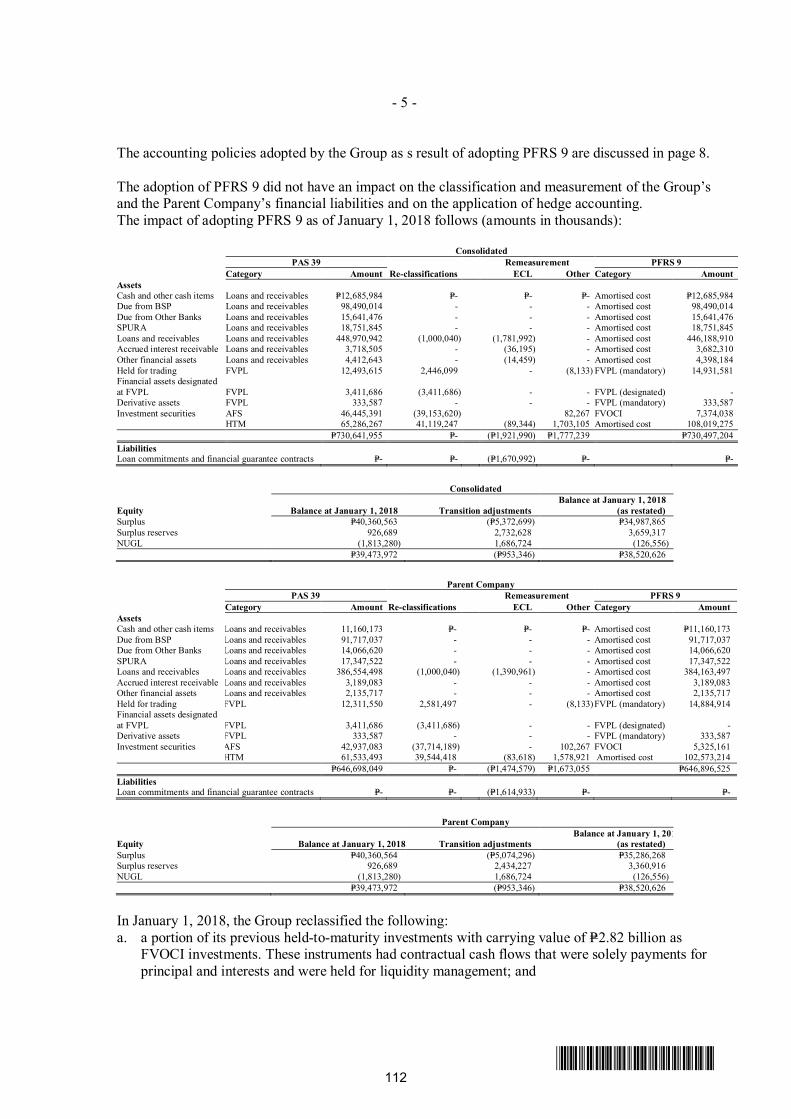
- 5 -
*SGVFS032944*
The accounting policies adopted by the Group as s result of adopting PFRS 9 are discussed in page 8.
The adoption of PFRS 9 did not have an impact on the classification and measurement of the Group’sand the Parent Company’s financial liabilities and on the application of hedge accounting.The impact of adopting PFRS 9 as of January 1, 2018 follows (amounts in thousands):
ConsolidatedPAS 39
Re-classificationsRemeasurement PFRS 9
Category Amount ECL Other Category AmountAssetsCash and other cash items Loans and receivables P=12,685,984 P=- P=- P=- Amortised cost P=12,685,984Due from BSP Loans and receivables 98,490,014 - - - Amortised cost 98,490,014Due from Other Banks Loans and receivables 15,641,476 - - - Amortised cost 15,641,476SPURA Loans and receivables 18,751,845 - - - Amortised cost 18,751,845Loans and receivables Loans and receivables 448,970,942 (1,000,040) (1,781,992) - Amortised cost 446,188,910Accrued interest receivable Loans and receivables 3,718,505 - (36,195) - Amortised cost 3,682,310Other financial assets Loans and receivables 4,412,643 - (14,459) - Amortised cost 4,398,184Held for trading FVPL 12,493,615 2,446,099 - (8,133) FVPL (mandatory) 14,931,581Financial assets designatedat FVPL FVPL 3,411,686 (3,411,686) - - FVPL (designated) -Derivative assets FVPL 333,587 - - - FVPL (mandatory) 333,587Investment securities AFS 46,445,391 (39,153,620) 82,267 FVOCI 7,374,038
HTM 65,286,267 41,119,247 (89,344) 1,703,105 Amortised cost 108,019,275P=730,641,955 P=- (P=1,921,990) P=1,777,239 P=730,497,204
LiabilitiesLoan commitments and financial guarantee contracts P=- P=- (P=1,670,992) P=- P=-
Consolidated
Equity Balance at January 1, 2018 Transition adjustmentsBalance at January 1, 2018
(as restated)Surplus P=40,360,563 (P=5,372,699) P=34,987,865Surplus reserves 926,689 2,732,628 3,659,317NUGL (1,813,280) 1,686,724 (126,556)
P=39,473,972 (P=953,346) P=38,520,626
Parent CompanyPAS 39
Re-classificationsRemeasurement PFRS 9
Category Amount ECL Other Category AmountAssetsCash and other cash items Loans and receivables 11,160,173 P=- P=- P=- Amortised cost P=11,160,173Due from BSP Loans and receivables 91,717,037 - - - Amortised cost 91,717,037Due from Other Banks Loans and receivables 14,066,620 - - - Amortised cost 14,066,620SPURA Loans and receivables 17,347,522 - - - Amortised cost 17,347,522Loans and receivables Loans and receivables 386,554,498 (1,000,040) (1,390,961) - Amortised cost 384,163,497Accrued interest receivable Loans and receivables 3,189,083 - - - Amortised cost 3,189,083Other financial assets Loans and receivables 2,135,717 - - - Amortised cost 2,135,717Held for trading FVPL 12,311,550 2,581,497 - (8,133)FVPL (mandatory) 14,884,914Financial assets designatedat FVPL FVPL 3,411,686 (3,411,686) - - FVPL (designated) -Derivative assets FVPL 333,587 - - - FVPL (mandatory) 333,587Investment securities AFS 42,937,083 (37,714,189) - 102,267 FVOCI 5,325,161
HTM 61,533,493 39,544,418 (83,618) 1,578,921 Amortised cost 102,573,214P=646,698,049 P=- (P=1,474,579) P=1,673,055 P=646,896,525
LiabilitiesLoan commitments and financial guarantee contracts P=- P=- (P=1,614,933) P=- P=-
Parent Company
Equity Balance at January 1, 2018 Transition adjustmentsBalance at January 1, 2018
(as restated)Surplus P=40,360,564 (P=5,074,296) P=35,286,268Surplus reserves 926,689 2,434,227 3,360,916NUGL (1,813,280) 1,686,724 (126,556)
P=39,473,972 (P=953,346) P=38,520,626
In January 1, 2018, the Group reclassified the following:a. a portion of its previous held-to-maturity investments with carrying value of P=2.82 billion as
FVOCI investments. These instruments had contractual cash flows that were solely payments forprincipal and interests and were held for liquidity management; and
112
VJNQUISIDO
Rectangle
- 6 -
*SGVFS032944*
c. a portion of its AFS investments and held-to-maturity investments with carrying value ofP=2.32 billion and P=2.78 billion, respectively, as FVTPL investments. These instruments either didnot have contractual cash flows that were solely payments for principal and interests, or wereintended for active trading and were held with the intention to sell.
In January 1, 2018, the Parent Company reclassified the following:a. a portion of its previous held-for-trading investments and AFS investments with carrying value of
P=5.93 billion and P=38.22 billion, respectively, as investment securities at amortized cost. Theseinstruments had contractual cash flows that were solely payments for principal and interests, werenot intended for active trading and were held with the intention to collect cash flows and withoutthe intention to sell;
b. a portion of its previous held-to-maturity investments and held-for-trading investments withcarrying value of P2.82 billion and P135.40 million, respectively, as FVOCI investments. Theseinstruments had contractual cash flows that were solely payments for principal and interests andwere held for liquidity management;
c. a portion of its AFS investments and held-to-maturity investments with carrying value of P2.32billion and P2.78 billion, respectively, as FVTPL investments. These instruments either did nothave contractual cash flows that were solely payments for principal and interests, or wereintended for active trading and were held with the intention to sell.
Had the FVPL securities not been transferred, additional fair value loss of P=389.47 million wouldhave been charged to profit or loss.
In addition, the Group has presented separately the interest revenue, calculated using effective interestmethod, from other interest revenue. As a result, Interest income on Investment securities atamortized cost and FVOCI is presented separately from Interest income on trading securities at fairvalue through profit or loss. Previously, these interest income items were presented together asInterest income on trading and investment securities.
PFRS 15, Revenue from Contracts with CustomersPFRS 15 supersedes PAS 11, Construction Contracts, PAS 18, Revenue and related Interpretationsand it applies, with limited exceptions, to all revenue arising from contracts with customers. PFRS 15establishes a five-step model to account for revenue arising from contracts with customers andrequires that revenue be recognized at an amount that reflects the consideration to which an entityexpects to be entitled in exchange for transferring goods or services to a customer.
PFRS 15 requires entities to exercise judgement, taking into consideration all of the relevant facts andcircumstances when applying each step of the model to contracts with their customers. The standardalso specifies the accounting for the incremental costs of obtaining a contract and the costs directlyrelated to fulfilling a contract. In addition, the standard requires extensive disclosures.
The Group adopted PFRS 15 using the modified retrospective method of adoption with the date ofinitial application of January 1, 2018. Under this method, the standard can be applied either to allcontracts at the date of initial application or only to contracts that are not completed at this date. TheGroup elected to apply the standard to all contracts as at January 1, 2018.
There were no adjustments recognized to the opening balance of retained earnings at the date ofinitial application as an effect of initially applying PFRS 15. Also, the comparative information wasnot restated and continues to be reported under PAS 11, PAS 18 and related Interpretations.
113
VJNQUISIDO
Rectangle
- 7 -
*SGVFS032944*
Loyalty points program on credit card businessBefore the adoption of PFRS 15, the loyalty program offered by the Group resulted in the accrual ofloyalty expenses for the fair value of estimated redeemable issued loyalty points. The Groupconcluded that under PFRS 15 the loyalty points give rise to a separate performance obligationbecause they provide a material right to the customer and a portion of the transaction price wasallocated to the loyalty points awarded to customers. The Group determined that, considering therelative stand-alone selling prices, the amount allocated to the loyalty points did not have materialimpact compared to the previous accounting policy.
Therefore, upon the adoption of PFRS 15, there were no adjustments recognized as at January 1 andDecember 31, 2018.
Significant Accounting Policies
Foreign Currency TranslationThe consolidated financial statements are presented in Philippine peso, which is the ParentCompany’s functional currency.
Transactions and balancesThe books of accounts of the RBU are maintained in Philippine peso, the RBU’s functional currency,while those of the FCDU are maintained in United States (US) dollars (USD), the FCDU’s functionalcurrency. For financial reporting purposes, the foreign currency-denominated monetary assets andliabilities in the RBU are translated in Philippine peso based on the Philippine Dealing System (PDS)closing rate prevailing at end of the year, and foreign currency-denominated income and expenses, atthe exchange rates on transaction dates. Foreign exchange differences arising from restatements offoreign currency-denominated assets and liabilities are credited to or charged against operations in theperiod in which the rates change. Non-monetary items that are measured in terms of historical cost ina foreign currency are translated using the exchange rates as at the dates of the initial transactions.Non-monetary items measured at fair value in a foreign currency are translated using the exchangerates at the date when the fair value was determined.
FCDUAs at the reporting date, the assets and liabilities of the FCDU are translated into the ParentCompany’s presentation currency (the Philippine Peso) at the PDS closing rate prevailing at thereporting date, and its income and expenses are translated at the PDSWAR for the year. Exchangedifferences arising on translation are taken directly to the statement of comprehensive income under‘Cumulative translation adjustment’. Upon actual remittance or transfer of the FCDU income toRBU, the related exchange difference arising from translation lodged under 'Cumulative translationadjustment' is recognized in the statement of income of the RBU books.
Fair Value MeasurementThe Group measures financial instruments, such as financial instruments at FVPL and AFS financialassets at fair value at each reporting date. Also, fair values of financial instruments measured atamortized cost are disclosed in Note 5.
Fair value is the price that would be received to sell an asset or paid to transfer a liability in an orderlytransaction between market participants at the measurement date. The fair value measurement isbased on the presumption that the transaction to sell the asset or transfer the liability takes placeeither:
∂ in the principal market for the asset or liability, or∂ in the absence of a principal market, in the most advantageous market for the asset or liability.
114
VJNQUISIDO
Rectangle
- 8 -
*SGVFS032944*
The principal or the most advantageous market must be accessible by the Group. The fair value of anasset or a liability is measured using the assumptions that market participants would use when pricingthe asset or liability, assuming that market participants act in their economic best interest.
If an asset or a liability measured at fair value has a bid price and an ask price, the price within thebid - ask spread that is most representative of fair value in the circumstances shall be used to measurefair value regardless of where the input is categorized within the fair value hierarchy.
A fair value measurement of a non-financial asset takes into account a market participant's ability togenerate economic benefits by using the asset in its highest and best use or by selling it to anothermarket participant that would use the asset in its highest and best use.
The Group uses valuation techniques that are appropriate in the circumstances and for whichsufficient data are available to measure fair value, maximizing the use of relevant observable inputsand minimizing the use of unobservable inputs.
All assets and liabilities for which fair value is measured or disclosed in the financial statements arecategorized within the fair value hierarchy, described as follows, based on the lowest level input thatis significant to the fair value measurement as a whole:
∂ Level 1 - Quoted (unadjusted) market prices in active markets for identical assets or liabilities∂ Level 2 - Valuation techniques for which the lowest level input that is significant to the fair value
measurement is directly or indirectly observable∂ Level 3 - Valuation techniques for which the lowest level input that is significant to the fair value
measurement is unobservable
For assets and liabilities that are recognized in the financial statements on a recurring basis, the Groupdetermines whether transfers have occurred between Levels in the hierarchy by re-assessingcategorization (based on the lowest level input that is significant to the fair value measurement as awhole) at the end of each reporting period.
Cash and Cash EquivalentsFor purposes of reporting cash flows, cash and cash equivalents include cash and other cash items,due from BSP and other banks, and securities purchased under resale agreement (SPURA) that areconvertible to known amounts of cash which have original maturities of three months or less fromdates of placements and that are subject to an insignificant risk of changes in value. Due from BSPincludes the statutory reserves required by the BSP which the Group considers as cash equivalentswherein withdrawals can be made to meet the Group’s cash requirements as allowed by the BSP.
Securities Purchased under Resale AgreementSecurities purchased under agreements to resell at a specified future date (‘reverse repos’) are notrecognized in the balance sheet. The corresponding cash paid including accrued interest, isrecognized in the balance sheet as SPURA. The difference between the purchase price and resaleprice is treated as interest income and is accrued over the life of the agreement using the EIR method.
Financial Instruments - Initial RecognitionDate of recognitionPurchases or sales of financial assets, except for derivative instruments, that require delivery of assetswithin the time frame established by regulation or convention in the marketplace are recognized onthe settlement date. Settlement date accounting refers to (a) the recognition of an asset on the day it isreceived by the Group, and (b) the derecognition of an asset and recognition of any gain or loss on
115
VJNQUISIDO
Rectangle
- 9 -
*SGVFS032944*
disposal on the day that such asset is delivered by the Group. Any change in fair value ofunrecognized financial asset is recognized in the statement of income for assets classified as financialassets at FVPL, and in equity for assets classified as Financial assets at FVOCI and AFS financialassets. Derivatives are recognized on a trade date basis. Deposits, amounts due to banks andcustomers loans and receivables are recognized when cash is received by the Group or advanced tothe borrowers.
Initial recognition of financial instrumentsAll financial instruments are initially recognized at fair value. Except for financial assets andfinancial liabilities at FVPL, the initial measurement of financial instruments includes transactioncosts.
‘Day 1’ differenceWhere the transaction price in a non-active market is different with the fair value from otherobservable current market transactions in the same instrument or based on a valuation techniquewhose variables include only data from observable market, the Group recognizes the differencebetween the transaction price and fair value (a ‘Day 1’ difference) in the statement of income. Incases where the transaction price used is made of data which is not observable, the difference betweenthe transaction price and model value is only recognized in the statement of income when the inputsbecome observable or when the instrument is derecognized. For each transaction, the Groupdetermines the appropriate method of recognizing the ‘Day 1’ difference amount.
Classification, Reclassification and Impairment of Financial Assets (PFRS 9)
Classification and measurementUnder PFRS 9, the classification and measurement of financial assets is driven by the entity’scontractual cash flow characteristics of the financial assets and business model for managing thefinancial assets.
As part of its classification process, the Group assesses the contractual terms of financial assets toidentify whether they meet the ‘solely payments of principal and interest’ (SPPI) test. ‘Principal’ forthe purpose of this test is defined as the fair value of the financial asset at initial recognition and maychange over the life of the financial asset (e.g. if there are repayments of principal or amortization ofthe premium or discount).
The most significant elements of interest within a lending arrangement are typically the considerationfor the time value of money and credit risk. To make the SPPI assessment, the Bank appliesjudgement and considers relevant factors such as the currency in which the financial asset isdenominated, and the period for which the interest rate is set. In contrast, contractual terms thatintroduce a more than de minimis exposure to risks or volatility in the contractual cash flows that areunrelated to a basic lending arrangement do not give rise to contractual cash flows that are solelypayments of principal and interest on the amount outstanding. In such cases, the financial asset isrequired to be measured at FVTPL.
The Group determines its business model at the level that best reflects how it manages groups offinancial assets to achieve its business objective.
The Bank's business model is not assessed on an instrument-by-instrument basis, but at a higher levelof aggregated portfolios and is based on observable factors such as:∂ how the performance of the business model and the financial assets held within that business
model are evaluated and reported to the entity's key management personnel
116
VJNQUISIDO
Rectangle
- 10 -
*SGVFS032944*
∂ the risks that affect the performance of the business model (and the financial assets held withinthat business model) and, in particular, the way those risks are managed
∂ how managers of the business are compensated (for example, whether the compensation is basedon the fair value of the assets managed or on the contractual cash flows collected)
∂ the expected frequency, value and timing of sales are also important aspects of the Group’sassessment
The business model assessment is based on reasonably expected scenarios without taking 'worst case'or 'stress case’ scenarios into account. If cash flows after initial recognition are realized in a way thatis different from the Group's original expectations, the Group does not change the classification of theremaining financial assets held in that business model, but incorporates such information whenassessing newly originated or newly purchased financial assets going forward.
The Group’s measurement categories are described below:
Investment Securities at Amortized CostFinancial assets are measured at amortized cost if both of the following conditions are met:∂ the asset is held within the Group’s business model whose objective is to hold financial assets in
order to collect contractual cash flows; and,∂ the contractual terms of the instrument give rise, on specified dates, to cash flows that are SPPI on
the principal amount outstanding.
Financial assets meeting these criteria are measured initially at fair value plus transaction costs. Theyare subsequently measured at amortized cost using the effective interest method, less any impairmentin value.
The Group’s investment securities at amortized cost are presented in the statement of financialposition as Due from BSP, Due from other banks, Interbank loans receivable and SPURA, investmentsecurities at amortized cost, Loans and receivables, Accrued interest receivables and certain accountsunder Other assets.
The Group may irrevocably elect at initial recognition to classify a financial asset that meets theamortized cost criteria above as at FVTPL if that designation eliminates or significantly reduces anaccounting mismatch had the financial asset been measured at amortized cost.
Financial Assets at FVTPLDebt instruments that neither meet the amortized cost nor the FVOCI criteria, or that meet the criteriabut the Group has chosen to designate as at FVTPL at initial recognition, are classified as financialassets at FVTPL. Equity investments are classified as financial assets at FVTPL, unless the Groupdesignates an equity investment that is not held for trading as at FVOCI at initial recognition. TheGroup’s financial assets at FVTPL include government securities, corporate bonds and equitysecurities which are held for trading purposes.
A financial asset is considered as held for trading if:∂ it has been acquired principally for the purpose of selling it in the near term;∂ on initial recognition, it is part of a portfolio of identified financial instruments that the Group
manages together and has evidence of a recent actual pattern of short-term profit-taking; or,∂ it is a derivative that is not designated and effective as a hedging instrument or financial
guarantee.
117
VJNQUISIDO
Rectangle
- 11 -
*SGVFS032944*
Financial assets at FVTPL are measured at fair value. Related transaction costs are recognizeddirectly as expense in profit or loss. Gains and losses arising from changes (mark-to-market) in thefair value of the financial assets at FVTPL and gains or losses arising from disposals of theseinstruments are included in ‘Gains (losses) on trading and investment securities’ account in thestatements of income.
Interest recognized based on the modified effective interest rate of these investments is reported instatements of income under ‘Interest income’ account while dividend income is reported in statementsof income under ‘Miscellaneous income’ account when the right of payment has been established.
Financial Assets at FVOCI - Equity InvestmentsAt initial recognition, the Group can make an irrevocable election (on an instrument-by-instrumentbasis) to designate equity investments as at FVOCI; however, such designation is not permitted if theequity investment is held by the Group for trading. The Group has designated certain equityinstruments as at FVOCI on initial application of PFRS 9.
Financial assets at FVOCI are initially measured at fair value plus transaction costs. Subsequently,they are measured at fair value, with no deduction for any disposal costs. Gains and losses arisingfrom changes in fair value are recognized in other comprehensive income and accumulated in Netunrealized fair value gains (losses) on investment securities in the statements of financial position.When the asset is disposed of, the cumulative gain or loss previously recognized in the Net unrealizedfair value gains (losses) on investment securities account is not reclassified to profit or loss, but isreclassified directly to Surplus free account. Any dividends earned on holding these equityinstruments are recognized in profit or loss under ‘Miscellaneous Income’ account.
Financial Assets at FVOCI - Debt InvestmentsThe Group applies the new category under PFRS 9 of debt instruments measured at FVOCI whenboth of the following conditions are met:∂ the instrument is held within a business model, the objective of which is achieved by both
collecting contractual cash flows and selling financial assets, and∂ the contractual terms of the financial asset meet the SPPI test.
FVOCI debt instruments are subsequently measured at fair value with gains and losses arising due tochanges in fair value being recognized in OCI. Interest income and foreign exchange gains and lossesare recognized in profit or loss in the same manner as for financial assets measured at amortized cost.The ECL calculation for financial assets at FVOCI is explained in the ‘Impairment of FinancialAssets’ section.
On derecognition, cumulative gains or losses previously recognized in OCI are reclassified from OCIto profit or loss.
The Group can only reclassify financial assets if the objective of its business model for managingthose financial assets changes. Accordingly, the Group is required to reclassify financial assets:(i) from amortized cost to FVTPL, if the objective of the business model changes so that theamortized cost criteria are no longer met; and, (ii) from FVTPL to amortized cost, if the objective ofthe business model changes so that the amortized cost criteria start to be met and the characteristic ofthe instrument’s contractual cash flows meet the amortized cost criteria.
A change in the objective of the Group’s business model will be effected only at the beginning of thenext reporting period following the change in the business model.
118
VJNQUISIDO
Rectangle
- 12 -
*SGVFS032944*
Impairment of financial assetsThe adoption of PFRS 9 has fundamentally changed the Group’s impairment method by replacingPAS 39’s incurred loss approach with a forward-looking ECL approach. From January 1, 2018, theGroup has been recording the allowance for expected credit losses for all loans and other debtfinancial assets carried at amortized cost, financial assets carried at FVOCI, together with loancommitments and financial guarantee contracts. Equity instruments are not subject to impairmentunder PFRS 9.
ECL represent credit losses that reflect an unbiased and probability-weighted amount which isdetermined by evaluating a range of possible outcomes, the time value of money and reasonable andsupportable information about past events, current conditions and forecasts of future economicconditions. ECL allowances are measured at amounts equal to either (i) 12-month ECL or (ii) lifetimeECL for those financial instruments which have experienced a significant increase in credit risk(SICR) since initial recognition (General Approach). The 12-month ECL is the portion of lifetimeECL that results from default events on a financial instrument that are possible within the 12 monthsafter the reporting date. Lifetime ECL are credit losses that results from all possible default eventsover the expected life of a financial instrument.
For non-credit-impaired financial instruments:∂ Stage 1 is comprised of all non-impaired financial instruments which have not experienced a
SICR since initial recognition. The Group and the Parent Company recognizes a 12-month ECLfor Stage 1 financial instruments.
∂ Stage 2 is comprised of all non-impaired financial instruments which have experienced a SICRsince initial recognition. The Group and the Parent Company recognizes a lifetime ECL forStage 2 financial instruments.
For credit-impaired financial instruments:∂ Financial instruments are classified as Stage 3 when there is objective evidence of impairment as
a result of one or more loss events that have occurred after initial recognition with a negativeimpact on the estimated future cash flows of a loan or a portfolio of loans. The ECL modelrequires that lifetime ECL be recognized for impaired financial instruments.
The Group uses internal credit assessment and approvals at various levels to determine the credit riskof exposures at initial recognition. Assessment can be quantitative or qualitative and depends on themateriality of the facility or the complexity of the portfolio to be assessed.
The Group defines a financial instrument as in default, which is fully aligned with the definition ofcredit impaired, in all cases when the borrower becomes at least 90 days past due on its contractualpayments. As a part of a qualitative assessment of whether a customer is in default, the Group alsoconsiders a variety of instances that may indicate unlikeliness to pay. When such events occur, theGroup carefully considers whether the event should result in treating the customer as defaulted. Aninstrument is considered to be no longer in default (i.e., to have cured) when it no longer meets any ofthe default criteria for a consecutive period of 180 days (i.e. consecutive payments from theborrowers for 180 days).
The criteria for determining whether credit risk has increased significantly vary by portfolio andinclude quantitative changes in probabilities of default and qualitative factors such as downgrade inthe credit rating of the borrowers and a backstop based on delinquency. The credit risk of a particularexposure is deemed to have increased significantly since initial recognition if, based on the Group’sinternal credit assessment, the borrower or counterparty is determined to require close monitoring orwith well-defined credit weaknesses. For exposures without internal credit grades, if contractual
119
VJNQUISIDO
Rectangle
- 13 -
*SGVFS032944*
payments are more than a specified days past due threshold (i.e. 30 days), the credit risk is deemed tohave increased significantly since initial recognition. Days past due are determined by counting thenumber of days since the earliest elapsed due date in respect of which full payment has not beenreceived. In subsequent reporting periods, if the credit risk of the financial instrument improves suchthat there is no longer a SICR since initial recognition, the Bank shall revert to recognizing a 12-month ECL.
ECL is a function of the PD, EAD and LGD, with the timing of the loss also considered, and isestimated by incorporating forward-looking economic information and through the use of experiencedcredit judgment.
The PD represents the likelihood that a credit exposure will not be repaid and will go into default ineither a 12-month horizon for Stage 1 or lifetime horizon for Stage 2. EAD represents an estimate ofthe outstanding amount of credit exposure at the time a default may occur. For off-balance sheet andundrawn amounts, EAD includes an estimate of any further amounts to be drawn at the time ofdefault. LGD is the amount that may not be recovered in the event of default. LGD takes intoconsideration the amount and quality of any collateral held. Please refer to Note 6 for otherinformation related to the Bank’s models for PD, EAD, and LGD.
The calculation of ECLs, including the estimation of PD, EAD, LGD and discount rate is made, on anindividual basis for most of the Group’s financial assets, and on a collective basis for retail productssuch as credit card receivables. The collective assessments are made separately for portfolios offacilities with similar credit risk characteristics.
In certain circumstances, the Bank modifies the original terms and conditions of a credit exposure toform a new loan agreement or payment schedule. The modifications can be given depending on theborrower’s or counterparty’s current or expected financial difficulty. The modifications may include,but are not limited to, change in interest rate and terms, principal amount, maturity date, date andamount of periodic payments and accrual of interest and charges. Distressed restructuring withindications of unlikeliness to pay are categorized as impaired accounts and are moved to Stage 3.
Classification, Reclassification and Impairment of Financial Assets (Prior to Adoption of PFRS 9)The Group classifies its financial assets in the following categories: financial assets at FVPL, held-to-maturity (HTM) financial assets, AFS financial assets, and loans and receivables while financialliabilities are classified as financial liabilities at FVPL and financial liabilities carried at amortizedcost. The classification depends on the purpose for which the investments were acquired and whetherthey are quoted in an active market. Management determines the classification of its investments atinitial recognition and, where allowed and appropriate, re-evaluates such designation at everyreporting date.
Financial instruments at FVPLFinancial instruments at FVPL include financial assets and liabilities held for trading purposes,financial assets and financial liabilities designated upon initial recognition as at FVPL, and derivativeinstruments.
Financial instruments held for tradingFinancial instruments held for trading (HFT) include government and corporate debt securitiespurchased and held principally with the intention of selling them in the near term. These securitiesare carried at fair value, and realized and unrealized gains and losses on these instruments arerecognized as ‘Trading and securities gain - net’ in the statement of income. Interest earned or
120
VJNQUISIDO
Rectangle
- 14 -
*SGVFS032944*
incurred on financial instruments held for trading is reported in the statement of income under‘Interest income’ (for financial assets) and ‘Interest expense’ (for financial liabilities).
Financial instruments designated at FVPLFinancial instruments are designated as at FVPL by management on initial recognition when any ofthe following criteria is met:
∂ the designation eliminates or significantly reduces the inconsistent treatment that would otherwisearise from measuring the assets or liabilities or recognizing gains or losses on them on a differentbasis; or
∂ the assets and liabilities are part of a group of financial assets, financial liabilities or both whichare managed and their performance evaluated on a fair value basis, in accordance with adocumented risk management or investment strategy; or
∂ the financial instrument contains an embedded derivative, unless the embedded derivative doesnot significantly modify the cash flows or it is clear, with little or no analysis, that it would not beseparately recorded.
Financial instruments at FVPL are recorded in the balance sheet at fair value. Changes in fair valueare recognized in ‘Trading and securities gain - net’ in the statement of income. Interest earned orincurred is reported in the statement of income under ‘Interest income’ or ‘Interest expense’,respectively, while dividend income is reported in the statement of income under ‘Miscellaneousincome’ when the right to receive payment has been established.
As of December 31, 2017, financial assets designated as at FVPL consist of instruments in shares ofstocks.
Derivative instrumentsThe Parent Company is a party to derivative instruments, particularly, forward exchange contracts,interest rate swaps (IRS) and warrants. These contracts are entered into as a service to customers andas a means of reducing and managing the Parent Company’s foreign exchange risk, and interest raterisk as well as for trading purposes, but are not designated as hedges. Such derivative financialinstruments are stated at fair value through profit or loss.
Any gains or losses arising from changes in fair value of derivative instruments that do not qualify forhedge accounting are taken directly to the statement of income under 'Foreign exchange gain (loss) -net’ for forward exchange contracts and ‘Trading and securities gain-net’ for IRS and warrants.
Embedded derivatives that are bifurcated from the host financial and non-financial contracts are alsoaccounted for as financial instruments at FVPL.
An embedded derivative is separated from the host contract and accounted for as a derivative if all ofthe following conditions are met: (a) the economic characteristics and risks of the embeddedderivative are not closely related to the economic characteristic of the host contract; (b) a separateinstrument with the same terms as the embedded derivative would meet the definition of a derivative;and (c) the hybrid or combined instrument is not recognized at fair value through profit or loss.
The Group assesses whether embedded derivatives are required to be separated from the hostcontracts when the Group first becomes a party to the contract. Reassessment of embeddedderivatives is only done when there are changes in the contract that significantly modifies thecontractual cash flows that would otherwise be required. The accounting policy on embeddedderivatives in host financial liability and non-financial contracts is still applied under PFRS 9.
121
VJNQUISIDO
Rectangle
- 15 -
*SGVFS032944*
Held-to-maturity financial assetsHTM financial assets are quoted non-derivative financial assets with fixed or determinable paymentsand fixed maturities for which the Group’s management has the positive intention and ability to holdto maturity. Where the Group would sell other than an insignificant amount of HTM financial assets,the entire category would be tainted and reclassified as AFS financial assets and the Group would beprohibited from classifying any financial asset under HTM category during the current year and twosucceeding years thereafter unless for sales or reclassifications that:∂ are so close to maturity or the financial asset’s call date (for example, less than three months
before maturity) that changes in the market rate of interest would not have a significant effect onthe financial asset’s fair value;
∂ occur after the entity has collected substantially all of the financial asset’s original principalthrough scheduled payments or prepayments; or
∂ are attributable to an isolated event that is beyond the entity’s control, is non-recurring and couldnot have been reasonably anticipated by the entity.
After initial measurement, these investments are subsequently measured at amortized cost using theeffective interest method, less any impairment in value. Amortized cost is calculated by taking intoaccount any discount or premium on acquisition and fees that are an integral part of the effectiveinterest rate (EIR). The amortization is included in ‘Interest income’ in the statement of income.Gains and losses are recognized in income when the HTM financial assets are derecognized andimpaired, as well as through the amortization process. The losses arising from impairment of suchinvestments are recognized in the statement of income under ‘Provision for impairment and creditlosses’. The effects of translation of foreign currency-denominated HTM financial assets arerecognized in the statement of income. This account consists of government and corporate debtsecurities.
Loans and receivableThis accounting policy relates to the balance sheet captions ‘Due from BSP’, ‘Due from other banks’,‘SPURA’, ‘Loans and receivables’, ‘Accrued interest receivable’, ‘Accounts receivable’, ‘Salescontract receivable’ (SCR), ‘Returned checks and other cash items’ (RCOCI), and ‘Miscellaneousfinancial assets’. These are financial assets with fixed or determinable payments that are not quotedin an active market, other than:
∂ those that the Group intends to sell immediately or in the near term and those that the Group,upon initial recognition, designates as FVPL;
∂ those that the Group, upon initial recognition, designates as AFS; and∂ those for which the Group may not cover substantially all of its initial investment, other than
because of credit deterioration.
After initial measurement, these are subsequently measured at amortized cost using the effectiveinterest method, less allowance for impairment. Amortized cost is calculated by taking into accountany discount or premium on acquisition and fees and costs that are an integral part of the EIR. Theamortization is included under ‘Interest income’ in the statement of income. The losses arising fromimpairment are recognized under ‘Provision for impairment and credit losses’ in the statement ofincome.
Available-for-sale financial assetsAFS financial assets are those which are designated as such or do not qualify to be classified asfinancial assets at FVPL, HTM financial assets, or loans and receivables. They are purchased andheld indefinitely, and may be sold in response to liquidity requirements or changes in market
122
VJNQUISIDO
Rectangle
- 16 -
*SGVFS032944*
conditions. They include equity investments, money market papers and government and corporatedebt securities.
After initial measurement, AFS financial assets are subsequently measured at fair value. Theeffective yield component of AFS debt securities, as well as the impact of translation of foreigncurrency-denominated AFS debt securities, is reported in the statement of income. The unrealizedgains and losses arising from the fair valuation of AFS financial assets are excluded, net of tax, fromreported earnings and are reported as ‘Net unrealized gains (losses) on AFS financial assets’ underOCI.
When the security is disposed of, the cumulative gain or loss previously recognized in OCI isrecognized as ‘Trading and securities gain - net’ in the statement of income. Interest earned onholding AFS debt securities are reported as ‘Interest income’ using the EIR. Dividends earned onholding AFS equity instruments are recognized in the statement of income as ‘Miscellaneous income’when the right to the payment has been established. The losses arising from impairment of suchinvestments are recognized as ‘Provision for impairment and credit losses’ in the statement ofincome.
Other financial liabilitiesThese are issued financial instruments or their components which are not designated as at FVPL andwhere the substance of the contractual arrangement results in the Group having an obligation either todeliver cash or another financial asset to the holder, or to satisfy the obligation other than by theexchange of a fixed amount of cash or another financial asset for a fixed number of its own equityshares. The components of issued financial instruments that contain both liability and equityelements are accounted for separately, with the equity component being assigned the residual amountafter deducting from the instrument as a whole the amount separately determined as the fair value ofthe liability component on the date of issue.
After initial measurement, other financial liabilities not qualified and not designated as at FVPL aresubsequently measured at amortized cost using the effective interest method. Amortized cost iscalculated by taking into account any discount or premium on the issue and fees that are an integralpart of the EIR.
This accounting policy relates to the balance sheet captions ‘Deposit liabilities’, ‘Bills payable’,‘Manager’s checks’, and financial liabilities presented under ‘Accrued interest and other expenses’and ‘Other liabilities’.
Reclassification of Financial AssetsThe Group may reclassify, in rare circumstances, non-derivative financial assets out of the HFTinvestments category and into the AFS financial assets, Loans and Receivables or HTM financialassets categories. The Group may also reclassify, in certain circumstances, financial instruments outof the AFS financial assets to loans and receivables category. Reclassifications are recorded at fairvalue at the date of reclassification, which becomes the new amortized cost.
The Group may reclassify a non-derivative trading asset out of HFT investments and into the Loansand Receivable category if it meets the definition of loans and receivables, the Group has theintention and ability to hold the financial assets for the foreseeable future or until maturity and only inrare circumstances. If a financial asset is reclassified, and if the Group subsequently increases itsestimates of future cash receipts as a result of increased recoverability of those cash receipts, theeffect of that increase is recognized as an adjustment to the EIR from the date of the change inestimate.
123
VJNQUISIDO
Rectangle
- 17 -
*SGVFS032944*
For a financial asset reclassified out of the AFS financial assets category, any previous gain or loss onthat asset that has been recognized in OCI is amortized to profit or loss over the remaining life of theinvestment using the effective interest method. Any difference between the new amortized cost andthe expected cash flows is also amortized over the remaining life of the asset using the effectiveinterest method. If the asset is subsequently determined to be impaired then the amount recorded inOCI is recycled to the statement of income. Reclassification is at the election of management, and isdetermined on an instrument by instrument basis. The Group does not reclassify any financialinstrument into the FVPL category after initial recognition. An analysis of reclassified financialassets is disclosed in Note 9.
Impairment of Financial AssetsThe Group assesses at each reporting date whether there is objective evidence that a financial asset orgroup of financial assets is impaired. A financial asset or a group of financial assets is deemed to beimpaired if, and only if, there is objective evidence of impairment as a result of one or more eventsthat has occurred after the initial recognition of the asset (an incurred ‘loss event’) and that loss event(or events) has an impact on the estimated future cash flows of the financial asset or the group offinancial assets that can be reliably estimated. Evidence of impairment may include indications thatthe borrower or a group of borrowers is experiencing significant financial difficulty, default ordelinquency in interest or principal payments, the probability that they will enter bankruptcy or otherfinancial reorganization and where observable data indicate that there is measurable decrease in theestimated future cash flows, such as changes in arrears or economic conditions that correlate withdefaults.
Financial assets carried at amortized costFor financial assets carried at amortized cost, the Group first assesses whether objective evidence ofimpairment exists individually for financial assets that are individually significant, or collectively forfinancial assets that are not individually significant.
If there is objective evidence that an impairment loss has been incurred, the amount of the loss ismeasured as the difference between the asset’s carrying amount and the present value of the estimatedfuture cash flows (excluding future credit losses that have not been incurred). The present value ofthe estimated future cash flows is discounted at the financial asset’s original EIR.
If a loan has a variable interest rate, the discount rate for measuring any impairment loss is the currentEIR, adjusted for the original credit risk premium. The calculation of the present value of theestimated future cash flows of a collateralized financial asset reflects the cash flows that may resultfrom foreclosure less costs for obtaining and selling the collateral, whether or not foreclosure isprobable.
The carrying amount of the asset is reduced through use of an allowance account and the amount ofloss is charged to the statement of income. Interest income continues to be recognized based on theoriginal EIR of the asset. The financial assets, together with the associated allowance accounts, arewritten off when there is no realistic prospect of future recovery and all collateral has been realized.
If the Group determines that no objective evidence of impairment exists for individually assessedfinancial asset, whether significant or not, it includes the asset in a group of financial assets withsimilar credit risk characteristics and collectively assesses for impairment. Those characteristics arerelevant to the estimation of future cash flows for groups of such assets by being indicative of thedebtors’ ability to pay all amounts due according to the contractual terms of the assets beingevaluated. Assets that are individually assessed for impairment and for which an impairment loss is,or continues to be, recognized are not included in a collective assessment for impairment.
124
VJNQUISIDO
Rectangle
- 18 -
*SGVFS032944*
For the purpose of a collective evaluation of impairment, financial assets are grouped on the basis ofsuch credit risk characteristics as industry, collateral type, past-due status and term. Future cashflows in a group of financial assets that are collectively evaluated for impairment are estimated on thebasis of historical loss experience for assets with credit risk characteristics similar to those in thegroup. Historical loss experience is adjusted on the basis of current observable data to reflect theeffects of current conditions that did not affect the period on which the historical loss experience isbased and to remove the effects of conditions in the historical period that do not exist currently.Estimates of changes in future cash flows reflect, and are directionally consistent with changes inrelated observable data from period to period (such as changes in unemployment rates, propertyprices, commodity prices, payment status, or other factors that are indicative of incurred losses in theGroup and their magnitude). The methodology and assumptions used for estimating future cash flowsare reviewed regularly by the Group to reduce any differences between loss estimates and actual lossexperience.
If, in a subsequent year, the amount of the estimated impairment loss decreases because of an eventoccurring after the impairment was recognized, the previously recognized impairment loss is reducedby adjusting the allowance account. If a future write-off is later recovered, the recovery is credited to‘Miscellaneous income’.
Financial assets carried at costIf there is objective evidence that an impairment loss on an unquoted equity instrument that is notcarried at fair value because its fair value cannot be reliably measured, or on a derivative asset that islinked to and must be settled by delivery of such an unquoted equity instrument has been incurred, theamount of loss is measured as the difference between the asset’s carrying amount and the presentvalue of estimated future cash flows discounted at the current market rate of return for a similarfinancial asset.
Available-for-sale financial assetsFor AFS financial assets, the Group assesses at each reporting date whether there is objectiveevidence that a financial asset or group of financial assets is impaired.
In the case of equity investments classified as AFS financial assets, this would include a significant orprolonged decline in the fair value of the investments below its cost. Where there is evidence ofimpairment, the cumulative loss - measured as the difference between the acquisition cost and thecurrent fair value, less any impairment loss on that financial asset previously recognized in thestatement of income - is removed from OCI and recognized in the statement of income. Impairmentlosses on equity investments are not reversed through the statement of income. Increases in fair valueafter impairment are recognized directly in OCI.
In the case of debt instruments classified as AFS financial assets, impairment is assessed based on thesame criteria as financial assets carried at amortized cost. However, the amount recorded forimpairment is the cumulative loss measured as the difference between the amortized cost and thecurrent fair value, less any impairment loss on that investment previously recognized in profit or loss.Future interest income is based on the reduced carrying amount and is accrued based on the rate ofinterest used to discount future cash flows for the purpose of measuring impairment loss. Suchaccrual is recorded as part of ‘Interest income’ in the statement of income. If, in subsequent years,the fair value of a debt instrument increased and the increase can be objectively related to an eventoccurring after the impairment loss was recognized in the statement of income, the impairment loss isreversed through the statement of income.
125
VJNQUISIDO
Rectangle
- 19 -
*SGVFS032944*
Restructured loansWhere possible, the Group seeks to restructure loans rather than to take possession of collateral. Thismay involve extending the payment arrangements and the agreement of new loan conditions. Oncethe terms have been renegotiated, the loan is no longer considered past due. Managementcontinuously reviews restructured loans to ensure that all criteria are met and that future payments arelikely to occur. The loans continue to be subject to an individual or collective impairmentassessment, calculated using the loan’s original EIR. The difference between the recorded value ofthe original loan and the present value of the restructured cash flows, discounted at the original EIR,is recognized in ‘Provision for impairment and credit losses’ in the statement of income.
Collateral valuationTo mitigate its credit risks on financial assets, the Group seeks to use collateral, where possible. Thecollateral comes in various forms, such as cash, securities, letters of credit/guarantees, real estate,receivables, inventories, other non-financial assets and credit enhancements such as nettingagreements. Collateral, unless repossessed, is not recorded on the Group’s balance sheets. However,the fair value of collateral affects the calculation of loss allowances. It is generally assessed, at aminimum, at inception and re-assessed on an annual basis. To the extent possible, the Group usesactive market data for valuing financial assets held as collateral. Other financial assets which do nothave readily determinable market values are valued using models. Non-financial collateral, such asreal estate, is valued based on data provided by internal or external appraisers.
Derecognition of Financial Assets and LiabilitiesFinancial assetsA financial asset (or, where applicable a part of a financial asset or part of a group of financial assets)is derecognized when:
∂ the rights to receive cash flows from the asset have expired; or∂ the Group retains the right to receive cash flows from the asset, but has assumed an obligation to
pay them in full without material delay to a third party under a “pass-through” arrangement; or∂ the Group has transferred its rights to receive cash flows from the asset and either (a) has
transferred substantially all the risks and rewards of the asset, or (b) has neither transferred norretained the risks and rewards of the asset but has transferred control of the asset.
Where the Group has transferred its rights to receive cash flows from an asset or has entered into apass-through arrangement, and has neither transferred nor retained substantially all the risks andrewards of the asset nor transferred control of the asset, the asset is recognized to the extent of theGroup’s continuing involvement in the asset. Continuing involvement that takes the form of aguarantee over the transferred asset is measured at the lower of the original carrying amount of theasset and the maximum amount of consideration that the Group could be required to repay.
Financial liabilitiesA financial liability is derecognized when the obligation under the liability is discharged, cancelled orhas expired. Where an existing financial liability is replaced by another from the same lender onsubstantially different terms, or the terms of an existing liability are substantially modified, such anexchange or modification is treated as a derecognition of the original liability and the recognition of anew liability, and the difference in the respective carrying amounts is recognized in the statement ofincome.
126
VJNQUISIDO
Rectangle
- 20 -
*SGVFS032944*
Write-offsFinancial assets are written off either partially or in their entirety when the Group no longer expectscollections or recoveries within a foreseeable future. If the amount to be written off is greater thanthe accumulated loss allowance, the difference is first treated as an addition to the allowance that isthen applied against the gross carrying amount. Any subsequent recoveries are credited to credit lossexpense.
Investment in AssociatesAssociates pertain to all entities over which the Group has significant influence but not control,generally accompanying a shareholding of between 20.00% and 50.00% of the voting rights. In theconsolidated and parent company financial statements, investments in associates are accounted forunder the equity method of accounting.
Under the equity method, an investment in an associate is carried in the balance sheet at cost pluspost-acquisition changes in the Group’s share of the net assets of the associates. Goodwill, if any,relating to an associate is included in the carrying value of the investment and is not amortized. Thestatement of income reflects the share of the results of operations of the associate. Where there hasbeen a change recognized directly in the equity of the associate, the Group recognizes its share of anychanges and discloses this, when applicable, in the statement of changes in equity.
When the Group’s share of losses in an associate equals or exceeds its interest in the associate,including any other unsecured receivables, the Group does not recognize further losses, unless it hasincurred obligations or made payments on behalf of the associate. Profits or losses resulting fromtransactions between the Group and an associate are eliminated to the extent of the interest in theassociate.
Dividends earned on this investment are recognized in the Parent Company’s statement of income asa reduction from the carrying value of the investment.
The financial statements of the associate are prepared for the same reporting period as the ParentCompany. Where necessary, adjustments are made to bring the accounting policies in line with thoseof the Group.
Upon loss of significant influence over the associate, the Group measures and recognizes any retainedinvestment at its fair value. Any difference between the carrying amount of the associate upon loss ofsignificant influence and the fair value of the retained investment and proceeds from disposal isrecognized in profit or loss.
Investment in SubsidiariesIn the parent company financial statements, investment in subsidiaries is accounted for under theequity method of accounting similar to the investment in associates.
Business Combinations and GoodwillBusiness combinations are accounted for using the acquisition method. The cost of an acquisition ismeasured as the aggregate of the consideration transferred, measured at acquisition date fair value andthe amount of any non-controlling interest in the acquiree. For each business combination, theacquirer measures the non-controlling interest in the acquiree either at fair value or at theproportionate share of the acquiree’ s identifiable net assets. Acquisition costs incurred are chargedto profit or loss.
127
VJNQUISIDO
Rectangle
- 21 -
*SGVFS032944*
When the Group acquires a business, it assesses the financial assets and liabilities assumed forappropriate classification and designation in accordance with the contractual terms, economiccircumstances and pertinent conditions as at the acquisition date. This includes the separation ofembedded derivatives in host contracts by the acquiree.
If the business combination is achieved in stages, the acquisition date fair value of the acquirer’spreviously held equity interest in the acquiree is remeasured to fair value at the acquisition datethrough profit or loss.
Any contingent consideration to be transferred by the acquirer will be recognized at fair value at theacquisition date. Subsequent changes to the fair value of the contingent consideration which isdeemed to be an asset or liability, will be recognized in accordance with PAS 39, either in profit orloss or as a charge to OCI. If the contingent consideration is classified as equity, it should not beremeasured until it is finally settled within equity.
Goodwill is initially measured at cost being the excess of the aggregate of fair value of theconsideration transferred and the amount recognized for non-controlling interest over the netidentifiable assets acquired and liabilities assumed. If this consideration is lower than the fair valueof the net assets of the subsidiary acquired, the difference is recognized in profit or loss as gain onbargain purchase under ‘Miscellaneous income’.
After initial recognition, goodwill is measured at cost less any accumulated impairment losses.
Goodwill is tested for impairment annually or more frequently if events or changes in circumstancesindicate the carrying value may be impaired. For the purpose of impairment testing, goodwillacquired in a business combination is, from the date of acquisition, allocated to each of the Group’sCGUs, or groups of CGUs, that are expected to benefit from the synergies of the combination,irrespective of whether other assets or liabilities of the acquiree are assigned to those units or group ofunits. Each unit or group of units to which the goodwill is allocated:
∂ represents the lowest level within the Group at which the goodwill is monitored for internalmanagement purposes; and
∂ is not larger than an operating segment identified for segment reporting purposes.
Where goodwill forms part of a CGU (or group of CGUs) and part of the operation within that unit isdisposed of, the goodwill associated with the operation disposed of is included in the carrying amountof the operation when determining the gain or loss on disposal of the operation. Goodwill disposed ofin this circumstance is measured based on the relative values of the operation disposed of and theportion of the CGU retained.
Cash Dividend and Non-cash Distribution to Equity Holders of the Parent CompanyThe Group recognizes a liability to make cash or non-cash distributions to equity holders of the parentcompany when the distribution is authorized and the distribution is no longer at the discretion of theGroup.
A corresponding amount is recognized directly in equity.
Non-cash distributions are measured at the fair value of the assets to be distributed with fair valueremeasurement recognized directly in equity.
Upon distribution of non-cash assets, any difference between the carrying amount of the liabilityand the carrying amount of the assets distributed is recognized in the statement of income.
128
VJNQUISIDO
Rectangle
- 22 -
*SGVFS032944*
Bank Premises, Furniture, Fixtures and EquipmentLand is stated at cost less any impairment in value while depreciable properties such as buildings,leasehold improvements, and furniture, fixtures and equipment are stated at cost less accumulateddepreciation and amortization, and any impairment in value. Such cost includes the cost of replacingpart of the bank premises, furniture, fixtures and equipment when that cost is incurred and if therecognition criteria are met, but excluding repairs and maintenance costs.
Construction-in-progress is stated at cost less any impairment in value. The initial cost comprises itsconstruction cost and any directly attributable costs of bringing the asset to its working condition andlocation for its intended use, including borrowing costs. Construction-in-progress is not depreciateduntil such time that the relevant assets are completed and put into operational use.
Depreciation and amortization is calculated using the straight-line method over the estimated usefullife (EUL) of the depreciable assets as follows:
EULBuildings 50 yearsFurniture, fixtures and equipment 3 to 5 yearsLeasehold improvements Shorter of 6 years or the
related lease terms
The depreciation and amortization method and useful life are reviewed periodically to ensure that themethod and period of depreciation and amortization are consistent with the expected pattern ofeconomic benefits from items of bank premises, furniture, fixtures and equipment and leaseholdimprovements.
An item of bank premises, furniture, fixtures and equipment is derecognized upon disposal or whenno future economic benefits are expected from its use or disposal. Any gain or loss arising onderecognition of the asset (calculated as the difference between the net disposal proceeds and thecarrying amount of the asset) is included in the statement of income in the year the asset isderecognized.
Investment PropertiesInvestment properties include real properties acquired in settlement of loans and receivables whichare measured initially at cost, including certain transaction costs. Investment properties acquiredthrough a nonmonetary asset exchange is measured initially at fair value unless (a) the exchange lackscommercial substance or (b) the fair value of neither the asset received nor the asset given up isreliably measurable. The difference between the fair value of the investment property uponforeclosure and the carrying value of the loan is recognized under ‘Gain on asset foreclosure anddacion transactions’ in the statement of income. Subsequent to initial recognition, depreciableinvestment properties are stated at cost less accumulated depreciation and any accumulatedimpairment in value except for land which is stated at cost less impairment in value.
Expenditures incurred after the investment properties have been put into operation, such as repairsand maintenance costs, are normally charged to income in the period in which the costs are incurred.
Depreciation is calculated on a straight-line basis using the remaining EUL of the building andimprovement components of investment properties which ranged from 10 to 33 years from the time ofacquisition of the investment properties.
129
VJNQUISIDO
Rectangle
- 23 -
*SGVFS032944*
Investment properties are derecognized when they have either been disposed of or when theinvestment properties are permanently withdrawn from use and no future benefit is expected fromtheir disposal. Any gains or losses on the derecognition of an investment property are recognized as‘Gain on sale of investment properties’ in the statement of income in the year of derecognition.
Transfers are made to investment properties when, and only when, there is a change in use evidencedby ending of owner occupation, commencement of an operating lease to another party or ending ofconstruction or development. Transfers are made from investment properties when, and only when,there is a change in use evidenced by commencement of owner occupation or commencement ofdevelopment with a view to sale.
Intangible AssetsIntangible assets include software cost and branch licenses resulting from the Parent Company’sacquisition of CBSI, Unity Bank and PDB (Notes 11 and 14).
Software costs Costs related to software purchased by the Group for use in operations are amortized on a straight-line basis over 3 to 10 years. The amortization method and useful life are reviewed periodically toensure that the method and period of amortization are consistent with the expected pattern ofeconomic benefits embodied in the asset.
Branch licensesThe branch licenses are initially measured at fair value as of the date of acquisition and are deemed tohave an indefinite useful life as there is no foreseeable limit to the period over which they areexpected to generate net cash inflows for the Group.
Such intangible assets are not amortized, instead they are tested for impairment annually eitherindividually or at the CGU level. Impairment is determined by assessing the recoverable amount ofeach CGU (or group of CGUs) to which the intangible asset relates. Recoverable amount is thehigher of the CGU’s fair value less costs to sell and its value in use. Where the recoverable amountof the CGU is less than its carrying amount, an impairment loss is recognized.
Gains and losses arising from derecognition of an intangible asset are measured as the differencebetween the net disposal proceeds and the carrying amount of the asset and are recognized in earningswhen the asset is derecognized.
Impairment of Nonfinancial AssetsAt each reporting date, the Group assesses whether there is any indication that its nonfinancial assets(e.g., investment in associates, investment properties, bank premises, furniture, fixtures andequipment, goodwill and intangible assets) may be impaired. When an indicator of impairment existsor when an annual impairment testing for an asset is required, the Group makes a formal estimate ofrecoverable amount.
Recoverable amount is the higher of an asset’s (or CGU’s) fair value less costs to sell and its value inuse and is determined for an individual asset, unless the asset does not generate cash inflows that arelargely independent of those from other assets or groups of assets, in which case the recoverableamount is assessed as part of the CGU to which it belongs. Where the carrying amount of an asset (orCGU) exceeds its recoverable amount, the asset (or CGU) is considered impaired and is written downto its recoverable amount. In assessing value in use, the estimated future cash flows are discounted totheir present value using a pre-tax discount rate that reflects current market assessments of the timevalue of money and the risks specific to the asset (or CGU).
130
VJNQUISIDO
Rectangle

- 24 -
*SGVFS032944*
An impairment loss is charged to operations in the year in which it arises.
For nonfinancial assets, excluding goodwill and branch licenses, an assessment is made at eachreporting date as to whether there is any indication that previously recognized impairment losses mayno longer exist or may have decreased. If such indication exists, the recoverable amount is estimated.A previously recognized impairment loss is reversed, except for goodwill, only if there has been achange in the estimates used to determine the asset’s recoverable amount since the last impairmentloss was recognized. If that is the case, the carrying amount of the asset is increased to its recoverableamount. That increased amount cannot exceed the carrying amount that would have been determined,net of depreciation, had no impairment loss been recognized for the asset in prior years. Suchreversal is recognized in the statement of income. After such a reversal, the depreciation expense isadjusted in future years to allocate the asset’s revised carrying amount, less any residual value, on asystematic basis over its remaining life.
LeasesThe determination of whether an arrangement is, or contains a lease is based on the substance of thearrangement and requires an assessment of whether the fulfillment of the arrangement is dependenton the use of a specific asset or assets and the arrangement conveys a right to use the asset. Areassessment is made after inception of the lease only if one of the following applies:
(a) there is a change in contractual terms, other than a renewal or extension of the arrangement; or(b) a renewal option is exercised or extension granted, unless that term of the renewal or extension
was initially included in the lease term; or(c) there is a change in the determination of whether fulfillment is dependent on a specified asset; or(d) there is a substantial change to the asset.
Where a reassessment is made, lease accounting shall commence or cease from the date when thechange in circumstances gave rise to the reassessment for scenarios (a), (c), or (d) above, and at thedate of renewal or extension period for scenario (b).
Group as a lesseeLeases where the lessor retains substantially all the risks and benefits of ownership of the asset areclassified as operating leases. Operating lease payments are recognized as an expense in thestatement of income on a straight-line basis over the lease term and included in ‘Occupancy cost’ inthe statement of income.
Group as a lessorLeases where the Group does not transfer substantially all the risks and benefits of ownership of theassets are classified as operating leases. Initial direct costs incurred in negotiating operating leasesare added to the carrying amount of the leased asset and recognized over the lease term on the samebasis as the rental income. Contingent rents are recognized as revenue in the period in which they areearned.
Capital StockCapital stocks are recorded at par. Proceeds in excess of par value are recognized under equity as‘Capital paid in excess of par value’ in the balance sheet. Incremental costs incurred which aredirectly attributable to the issuance of new shares are shown in equity as a deduction from proceeds,net of tax.
131
VJNQUISIDO
Rectangle
- 25 -
*SGVFS032944*
Revenue RecognitionRevenue is recognized to the extent that it is probable that the economic benefits will flow to theGroup and the revenue can be reliably measured, regardless of when the payment is being made.Revenue is measured at the fair value of the consideration received or receivable, taking into accountcontractually defined terms of payment and excluding taxes or duty. The Group assesses its revenuearrangements against specific criteria in order to determine if it is acting as principal or agent. TheGroup has concluded that it is acting as a principal in all of its revenue arrangements.
The following specific recognition criteria must also be met before revenue is recognized:
Interest incomeFor all financial instruments measured at amortized cost and interest-bearing financial instrumentsclassified as FVOCI and AFS financial assets, interest income is recorded at either EIR, which is therate that exactly discounts estimated future cash payments or receipts through the expected life of thefinancial instrument or a shorter period, where appropriate, to the net carrying amount of the financialasset or financial liability, or at rate stated in the contract. The calculation takes into account allcontractual terms of the financial instrument (for example, prepayment options), includes any fees orincremental costs that are directly attributable to the instrument and are an integral part of the EIR, asapplicable, but not future credit losses. The adjusted carrying amount is calculated based on theoriginal EIR. The change in carrying amount is recorded as ‘Interest income’.
Once the recorded value of a financial asset or group of similar financial assets has been reduced dueto an impairment loss, interest income continues to be recognized using the original EIR applied to thenew carrying amount.
Fee and commission incomeThe Group earns fee and commission income from a diverse range of services it provides to itscustomers. Fee income can be divided into the following two categories:
a. Fee income earned from services that are provided over a certain period of timeFees earned for the provision of services over a period of time are accrued over that period. Thesefees include investment fund fees, custodian fees, fiduciary fees, commission income, creditrelated fees, asset management fees, portfolio and other management fees, and advisory fees.
b. Fee income from providing transactions servicesFees arising from negotiating or participating in the negotiation of a transaction for a third party -such as underwriting fees, corporate finance fees and brokerage fees for the arrangement of theacquisition of shares or other securities or the purchase or sale of businesses - are recognized oncompletion of the underlying transaction. Fees or components of fees that are linked to a certainperformance are recognized after fulfilling the corresponding criteria. Loan syndication fees arerecognized in the statement of income when the syndication has been completed and the Groupretains no part of the loans for itself or retains part at the same EIR as for the other participants.
c. Commitment feesLoan commitment fees for loans that are likely to be drawn down are deferred (together with anyincremental costs) and recognized as an adjustment to the EIR on the loan. If the commitmentexpires without the Group making the loan, the commitment fees are recognized as other incomeon expiry.
Service charges and penaltiesService charges and penalties are recognized only upon collection or accrued where there is areasonable degree of certainty as to their collectability.
132
VJNQUISIDO
Rectangle
- 26 -
*SGVFS032944*
Other incomeIncome from sale of service is recognized upon rendition of the service. Income from sale ofproperties is recognized when control has been obtained by the customer and when the collectabilityof the sales price is reasonably assured.
Dividend incomeDividend income is recognized when the Group’s right to receive payment is established.Trading and securities gainThis represents results arising from trading activities and sale of AFS financial assets or FVOCI debtassets.
Expense RecognitionExpense is recognized when it is probable that a decrease in future economic benefits related to adecrease in an asset or an increase in liability has occurred and the decrease in economic benefits canbe measured reliably. Revenues and expenses that relate to the same transaction or other event arerecognized simultaneously.
Interest expenseInterest expense for all interest-bearing financial liabilities are recognized in ‘Interest expense’ in thestatement of income using the EIR of the financial liabilities to which they relate.
Other expensesExpenses encompass losses as well as those expenses that arise in the ordinary course of business ofthe Group. Expenses are recognized when incurred.
Retirement BenefitsDefined benefit planThe net defined benefit liability or asset is the aggregate of the present value of the defined benefitobligation at the end of the reporting period reduced by the fair value of plan assets and adjusted forany effect of limiting a net defined benefit asset to the asset ceiling. The defined benefit obligation iscalculated annually by an independent actuary. The present value of the defined benefit obligation isdetermined by discounting the estimated future cash outflows using interest rates on governmentbonds that have terms to maturity approximating the terms of the related retirement liability. Theasset ceiling is the present value of any economic benefits available in the form of refunds from theplan or reductions in future contributions to the plan.
The cost of providing benefits under the defined benefit plans is actuarially determined using theprojected unit credit method.
Defined benefit costs comprise the following:(a) service cost;(b) net interest on the net defined benefit liability or asset; and(c) remeasurements of net defined benefit liability or asset.
Service costs which include current service costs, past service costs and gains or losses on non-routine settlements are recognized as expense in profit or loss. Past service costs are recognizedwhen plan amendment or curtailment occurs.
Net interest on the net defined benefit liability or asset is the change during the period in the netdefined benefit liability or asset that arises from the passage of time which is determined by applyingthe discount rate based on Philippine government bonds to the net defined benefit liability or asset.
133
VJNQUISIDO
Rectangle
- 27 -
*SGVFS032944*
Net interest on the net defined benefit liability or asset is recognized as expense or income in profit orloss.
Remeasurements comprising actuarial gains and losses, return on plan assets and any change in theeffect of the asset ceiling (excluding net interest on defined benefit liability) are recognizedimmediately in OCI in the period in which they arise. Remeasurements are not reclassified to profitor loss in subsequent periods.
Plan assets are assets that are held by a long-term employee benefit fund. Plan assets are notavailable to the creditors of the Group, nor can they be paid directly to the Group. The fair value ofplan assets is based on market price information. When no market price is available, the fair value ofplan assets is estimated by discounting expected future cash flows using a discount rate that reflectsboth the risk associated with the plan assets and the maturity or expected disposal date of those assets(or, if they have no maturity, the expected period until the settlement of the related obligations).
The Group’s right to be reimbursed of some or all of the expenditure required to settle a definedbenefit obligation is recognized as a separate asset at fair value when and only when reimbursement isvirtually certain. If the fair value of the plan assets is higher than the present value of the definedbenefit obligation, the measurement of the resulting defined benefit asset is limited to the presentvalue of economic benefits available in the form of refunds from the plan or reductions in futurecontributions to the plan.
Employee leave entitlementEmployee entitlements to annual leave are recognized as a liability when they are accrued to theemployees. The undiscounted liability for leave expected to be settled after the end of the annualreporting period is recognized for services rendered by employees up to the end of the reportingperiod.
Provisions and ContingenciesProvisions are recognized when the Group has a present obligation (legal or constructive) as a resultof a past event and it is probable that an outflow of resources embodying economic benefits will berequired to settle the obligation and a reliable estimate can be made of the amount of the obligation.Where the Group expects some or all of a provision to be reimbursed, for example, under aninsurance contract, the reimbursement is recognized as a separate asset but only when thereimbursement is virtually certain. The expense relating to any provision is presented in thestatement of income, net of any reimbursement. If the effect of the time value of money is material,provisions are determined by discounting the expected future cash flows at a pre-tax rate that reflectscurrent market assessments of the time value of money and, where appropriate, the risks specific tothe liability. Where discounting is used, the increase in the provision due to the passage of time isrecognized as an interest expense.
Contingent liabilities are not recognized in the financial statements but are disclosed unless thepossibility of an outflow of resources embodying economic benefits is remote. Contingent assets arenot recognized but are disclosed in the financial statements when an inflow of economic benefits isprobable.
Income TaxesCurrent taxCurrent tax assets and liabilities for the current and prior periods are measured at the amount expectedto be recovered from or paid to the taxation authorities. The tax rates and tax laws used to computethe amount are those that are enacted or substantively enacted as of the reporting date.
134
VJNQUISIDO
Rectangle
- 28 -
*SGVFS032944*
Deferred taxDeferred tax is provided, using the balance sheet liability method, on all temporary differences at thereporting date between the tax bases of assets and liabilities and their carrying amounts for financialreporting purposes.
Deferred tax liabilities are recognized for all taxable temporary differences. Deferred tax assets arerecognized for all deductible temporary differences, carry forward of unused tax credits from theexcess of minimum corporate income tax (MCIT) over the regular corporate income tax (RCIT), andunused net operating loss carryover (NOLCO), to the extent that it is probable that sufficient taxableprofit will be available against which the deductible temporary differences and carry forward ofunused tax credits from MCIT and unused NOLCO can be utilized. Deferred tax, however, is notrecognized on temporary differences that arise from the initial recognition of an asset or liability in atransaction that is not a business combination and, at the time of the transaction, affects neither theaccounting income nor taxable income.
Deferred tax liabilities are not provided on non-taxable temporary differences associated withinvestments in domestic subsidiaries and associates.
The carrying amount of deferred tax assets is reviewed at each reporting date and reduced to theextent that it is no longer probable that sufficient taxable profit will be available to allow all or part ofthe deferred tax asset to be utilized. Unrecognized deferred tax assets are reassessed at each reportingdate and are recognized to the extent that it has become probable that future taxable profit will allowthe deferred tax asset to be recovered.
Deferred tax assets and liabilities are measured at the tax rates that are applicable to the period whenthe asset is realized or the liability is settled, based on tax rates (and tax laws) that have been enactedor substantively enacted at the reporting date.
Current tax and deferred tax relating to items recognized directly in equity is also recognized inequity and not in the statement of income.
Deferred tax assets and deferred tax liabilities are offset if a legally enforceable right exists to set offcurrent tax assets against current tax liabilities and deferred taxes relate to the same taxable entity andthe same taxation authority.
Earnings per ShareBasic earnings per share (EPS) is computed by dividing net income for the year by the weightedaverage number of common shares outstanding during the year after giving retroactive effect to stocksplits, stock dividends declared and stock rights exercised during the year, if any.
The Parent Company has no outstanding dilutive potential common shares.
Dividends on Common SharesDividends on common shares are recognized as a liability and deducted from equity when approvedby the respective shareholders of the Parent Company and its subsidiaries. Dividends declared duringthe year that are approved after the reporting date are dealt with as an event after the reporting date.
Segment ReportingThe Group’s operating businesses are organized and managed separately according to the nature ofthe products and services provided, with each segment representing a strategic business unit thatoffers different products and serves different markets. Financial information on business segments is
135
VJNQUISIDO
Rectangle
- 29 -
*SGVFS032944*
presented in Note 31. The Group’s revenue producing assets are located in the Philippines (i.e., onegeographical location). Therefore, geographical segment information is no longer presented.
Fiduciary ActivitiesAssets and income arising from fiduciary activities together with related undertakings to return suchassets to customers are excluded from the financial statements where the Parent Company acts in afiduciary capacity such as nominee, trustee or agent.
Events after the Reporting PeriodAny post year-end events that provide additional information about the Group’s position at thereporting date (adjusting event) are reflected in the Group’s financial statements. Post year-endevents that are not adjusting events, if any, are disclosed when material to the financial statements.
Standards Issued but Not Yet EffectiveThere are new PFRSs, amendments, interpretation and annual improvements, to existingstandards effective for annual periods subsequent to 2018, which are adopted by the FRSC.Management will adopt the following relevant pronouncements in accordance with theirtransitional provisions; and, unless otherwise stated, none of these are expected to havesignificant impact on the Group’s financial statements:
Effective beginning on or after January 1, 2019:∂ PFRS 9 (Amendment), Prepayment Features with Negative Compensation. Under PFRS 9, a
debt instrument can be measured at amortized cost or at fair value through other comprehensiveincome, provided that the contractual cash flows are ‘solely payments of principal and interest onthe principal amount outstanding’ (the SPPI criterion) and the instrument is held within theappropriate business model for that classification. The amendments to PFRS 9 clarify that afinancial asset passes the SPPI criterion regardless of the event or circumstance that causes theearly termination of the contract and irrespective of which party pays or receives reasonablecompensation for the early termination of the contract. The amendments should be appliedretrospectively and are effective from January 1, 2019, with earlier application permitted.Management has assessed that the amendment has no impact on the consolidated and parentcompany financial statements.
∂ PFRS 16, Leases. This new standard sets out the principles for the recognition, measurement,presentation and disclosure of leases and requires lessees to account for all leases under a singleon-balance sheet model similar to the accounting for finance leases under PAS 17, Leases. Thestandard includes two recognition exemptions for lessees - leases of ’low-value’ assets (e.g.,personal computers) and short-term leases (i.e., leases with a lease term of 12 months or less).At the commencement date of a lease, a lessee will recognize a liability to make lease payments(i.e., the lease liability) and an asset representing the right to use the underlying asset during thelease term (i.e., the right-of-use asset). Lessees will be required to separately recognize theinterest expense on the lease liability and the depreciation expense on the right-of-use asset.
Leesees will be also required to remeasure the lease liability upon the occurrence of certainevents (e.g., a change in the lease term, a change in future lease payments resulting from achange in an index or rate used to determine those payments). The lessee will generallyrecognize the amount of the remeasurement of the lease liability as an adjustment to the right-of-use asset.
136
VJNQUISIDO
Rectangle
- 30 -
*SGVFS032944*
Lessor accounting under PFRS 16 is substantially unchanged from today’s accounting underPAS 17. Lessors will continue to classify all leases using the same classification principle as inPAS 17 and distinguish between two types of leases: operating and finance leases.PFRS 16 also requires lessees and lessors to make more extensive disclosures than underPAS 17.
A lessee can choose to apply the standard using either a full retrospective or a modifiedretrospective approach. The standard’s transition provisions permit certain reliefs.
Upon adoption of this standard, the Group and the Parent Company expect to recognize aright of use asset and lease liability for covered lease contracts. Management is currentlyassessing the impact of this new standard in the consolidated and parent company financialstatements.
∂ PAS 19 (Amendments), Employee Benefits, Plan Amendment, Curtailment or Settlement. Theamendments to PAS 19 address the accounting when a plan amendment, curtailment orsettlement occurs during a reporting period. The amendments specify that when a planamendment, curtailment or settlement occurs during the annual reporting period, an entity isrequired to:
∂ Determine current service cost for the remainder of the period after the plan amendment,curtailment or settlement, using the actuarial assumptions used to remeasure the net definedbenefit liability (asset) reflecting the benefits offered under the plan and the plan assets afterthat event
∂ Determine net interest for the remainder of the period after the plan amendment,curtailment or settlement using: the net defined benefit liability (asset) reflecting thebenefits offered under the plan and the plan assets after that event; and the discount rateused to remeasure that net defined benefit liability (asset).
The amendments also clarify that an entity first determines any past service cost, or a gain orloss on settlement, without considering the effect of the asset ceiling. This amount is recognizedin profit or loss. An entity then determines the effect of the asset ceiling after the planamendment, curtailment or settlement. Any change in that effect, excluding amounts included inthe net interest, is recognized in other comprehensive income.
The amendments apply to plan amendments, curtailments, or settlements occurring on or after thebeginning of the first annual reporting period that begins on or after January 1, 2019, with earlyapplication permitted. These amendments will apply only to any future plan amendments,curtailments, or settlements of the Group.
∂ PAS 28 (Amendments), Long-term Interests in Associates and Joint Ventures. The amendmentsclarify that an entity applies PFRS 9 to long-term interests in an associate or joint venture towhich the equity method is not applied but that, in substance, form part of the net investment inthe associate or joint venture (long-term interests). This clarification is relevant because itimplies that the expected credit loss model in PFRS 9 applies to such long-term interests.
The amendments also clarified that, in applying PFRS 9, an entity does not take account of anylosses of the associate or joint venture, or any impairment losses on the net investment,recognized as adjustments to the net investment in the associate or joint venture that arise fromapplying PAS 28, Investments in Associates and Joint Ventures.
137
VJNQUISIDO
Rectangle
- 31 -
*SGVFS032944*
The amendments should be applied retrospectively and are effective from January 1, 2019, withearly application permitted. Since the Group does not have such long-term interests in itsassociate and joint venture, the amendments will not have an impact on its consolidatedfinancial statements.
∂ IFRIC 23, Uncertainty over Income Tax Treatments. The interpretation addresses the accountingfor income taxes when tax treatments involve uncertainty that affects the application of PAS 12,Income Taxes, and does not apply to taxes or levies outside the scope of PAS 12, nor does itspecifically include requirements relating to interest and penalties associated with uncertain taxtreatments.
The interpretation specifically addresses the following:
∂ Whether an entity considers uncertain tax treatments separately∂ The assumptions an entity makes about the examination of tax treatments by taxation
authorities∂ How an entity determines taxable profit (tax loss), tax bases, unused tax losses, unused
tax credits and tax rates∂ How an entity considers changes in facts and circumstances
An entity must determine whether to consider each uncertain tax treatment separately ortogether with one or more other uncertain tax treatments. The approach that better predicts theresolution of the uncertainty should be followed.
This interpretation is not relevant to the Group because there is no uncertainty involved in the taxtreatments made by management in connection with the calculation of current and deferred taxesas of December 31, 2018 and 2017.
Annual Improvements to PFRS 2015-2017 Cycle∂ Amendments to PFRS 3, Business Combinations, and PFRS 11, Joint Arrangements, Previously
Held Interest in a Joint Operation. The amendments clarify that, when an entity obtains controlof a business that is a joint operation, it applies the requirements for a business combinationachieved in stages, including remeasuring previously held interests in the assets and liabilities ofthe joint operation at fair value. In doing so, the acquirer remeasures its entire previously heldinterest in the joint operation.
A party that participates in, but does not have joint control of, a joint operation might obtain jointcontrol of the joint operation in which the activity of the joint operation constitutes a business asdefined in PFRS 3. The amendments clarify that the previously held interests in that jointoperation are not remeasured.
An entity applies those amendments to business combinations for which the acquisition date ison or after the beginning of the first annual reporting period beginning on or afterJanuary 1, 2019 and to transactions in which it obtains joint control on or after the beginning ofthe first annual reporting period beginning on or after January 1, 2019, with early applicationpermitted. These amendments are currently not applicable to the Group but may apply to futuretransactions.
138
VJNQUISIDO
Rectangle
- 32 -
*SGVFS032944*
∂ Amendments to PAS 12, Income Tax Consequences of Payments on Financial InstrumentsClassified as Equity. The amendments clarify that the income tax consequences of dividends arelinked more directly to past transactions or events that generated distributable profits than todistributions to owners. Therefore, an entity recognizes the income tax consequences ofdividends in profit or loss, other comprehensive income or equity according to where the entityoriginally recognized those past transactions or events.
∂ Amendments to PAS 23, Borrowing Costs, Borrowing Costs Eligible for Capitalization. Theamendments clarify that an entity treats as part of general borrowings any borrowing originallymade to develop a qualifying asset when substantially all of the activities necessary to preparethat asset for its intended use or sale are complete.
An entity applies those amendments to borrowing costs incurred on or after the beginning of theannual reporting period in which the entity first applies those amendments. An entity appliesthose amendments for annual reporting periods beginning on or after January 1, 2019, with earlyapplication permitted.
Since the Group’s current practice is in line with these amendments, the Group does not expectany effect on its consolidated financial statements upon adoption.
Effective beginning on or after January 1, 2020∂ Amendments to PFRS 3, Definition of a Business. The amendments to PFRS 3 clarify the
minimum requirements to be a business, remove the assessment of a market participant’s abilityto replace missing elements, and narrow the definition of outputs. The amendments also addguidance to assess whether an acquired process is substantive and add illustrative examples. Anoptional fair value concentration test is introduced which permits a simplified assessment ofwhether an acquired set of activities and assets is not a business.
An entity applies those amendments prospectively for annual reporting periods beginning on orafter January 1, 2020, with earlier application permitted.
These amendments will apply on future business combinations of the Group.
∂ Amendments to PAS 1, Presentation of Financial Statements, and PAS 8, Accounting Policies,Changes in Accounting Estimates and Errors, Definition of Material. The amendments refine thedefinition of material in PAS 1 and align the definitions used across PFRSs and otherpronouncements. They are intended to improve the understanding of the existing requirementsrather than to significantly impact an entity’s materiality judgements.
An entity applies those amendments prospectively for annual reporting periods beginning on orafter January 1, 2020, with earlier application permitted.
Effective beginning on or after January 1, 2021∂ PFRS 17, Insurance Contracts. The standard is a comprehensive new accounting standard for
insurance contracts covering recognition and measurement, presentation and disclosure. Onceeffective, PFRS 17 will replace PFRS 4, Insurance Contracts. This new standard on insurancecontracts applies to all types of insurance contracts (i.e., life, non-life, direct insurance and re-insurance), regardless of the type of entities that issue them, as well as to certain guarantees andfinancial instruments with discretionary participation features. A few scope exceptions willapply.
139
VJNQUISIDO
Rectangle
- 33 -
*SGVFS032944*
The overall objective of PFRS 17 is to provide an accounting model for insurance contractsthat is more useful and consistent for insurers. In contrast to the requirements in PFRS 4, whichare largely based on grandfathering previous local accounting policies, PFRS 17 provides acomprehensive model for insurance contracts, covering all relevant accounting aspects. Thecore of PFRS 17 is the general model, supplemented by:
∂ A specific adaptation for contracts with direct participation features (the variable feeapproach)
∂ A simplified approach (the premium allocation approach) mainly for short-durationcontracts
PFRS 17 is effective for reporting periods beginning on or after January 1, 2021, withcomparative figures required. Early application is permitted.
Deferred effectivity∂ Amendments to PFRS 10, Consolidated Financial Statements, and PAS 28, Sale or Contribution
of Assets between an Investor and its Associate or Joint Venture. The amendments address theconflict between PFRS 10 and PAS 28 in dealing with the loss of control of a subsidiary that issold or contributed to an associate or joint venture. The amendments clarify that a full gain orloss is recognized when a transfer to an associate or joint venture involves a business as definedin PFRS 3. Any gain or loss resulting from the sale or contribution of assets that does notconstitute a business, however, is recognized only to the extent of unrelated investors’ interests inthe associate or joint venture.
On January 13, 2016, the Financial Reporting Standards Council deferred the original effectivedate of January 1, 2016 of the said amendments until the International Accounting StandardsBoard (IASB) completes its broader review of the research project on equity accounting that mayresult in the simplification of accounting for such transactions and of other aspects of accountingfor associates and joint ventures.
3. Significant Accounting Judgments and Estimates
The preparation of the financial statements in accordance with PFRS requires the Group to makejudgments and estimates that affect the reported amounts of assets, liabilities, income and expensesand disclosure of contingent assets and contingent liabilities at reporting date. Future events mayoccur which will cause the judgments and assumptions used in arriving at the estimates to change.The effects of any change in judgments and estimates are reflected in the financial statements as theybecome reasonably determinable.
Judgments and estimates are continually evaluated and are based on historical experience and otherfactors, including expectations of future events that are believed to be reasonable under thecircumstances.
Judgmentsa. Fair value of financial instruments
The Group classifies financial assets by evaluating, among others, whether the asset is quoted ornot in an active market. Included in the evaluation on whether a financial asset is quoted in anactive market is the determination of whether quoted prices are readily and regularly available,and whether those prices represent actual and regularly occurring market transactions conductedon an arm’s length basis.
140
VJNQUISIDO
Rectangle
- 34 -
*SGVFS032944*
Where the fair values of financial assets and financial liabilities recorded on the balance sheet ordisclosed in the notes cannot be derived from active markets, they are determined usingdiscounted cash flow model, incorporating inputs such as current market rates of comparableinstruments. The carrying values and corresponding fair values of financial instruments, as wellas the manner in which fair values were determined, are discussed in more detail in Note 5.
b. HTM financial assets (prior to PFRS 9 adoption)The classification to HTM financial assets requires significant judgment. In making thisjudgment, the Group evaluates its intention and ability to hold such investments to maturity. Ifthe Group fails to keep these investments to maturity other than in certain specific circumstances -for example, selling an insignificant amount close to maturity - it will be required to reclassify theentire portfolio as part of AFS financial assets. The investments would therefore be measured atfair value and not at amortized cost.Details of AFS financial assets reclassified to HTM are disclosed in Note 9.
c. ContingenciesThe Group is currently involved in various legal proceedings. The estimate of the probable costsfor the resolution of these claims has been developed in consultation with outside counselhandling the Group’s defense in these matters and is based upon an analysis of potential results.The Group currently does not believe that these proceedings will have a material adverse effecton the financial statements (Note 30). It is possible, however, that future results of operationscould be materially affected by changes in the estimates or in the effectiveness of the strategiesrelating to these proceedings.
d. Evaluation of business model in managing financial instruments (PFRS 9)The Group manages its financial assets based on business models that maintain an adequate levelof financial assets to match its expected cash outflows, largely arising from customers’withdrawals and continuing loan disbursements to borrowers, while maintaining a strategicportfolio of financial assets for investment and trading activities consistent with its risk appetite.
The Group developed business models which reflect how it manages its portfolio of financialinstruments. The Group’s business models need not be assessed at entity level or as a whole butapplied at the level of a portfolio of financial instruments (i.e., group of financial instruments thatare managed together by the Group) and not on an instrument-by-instrument basis (i.e., not basedon intention or specific characteristics of individual financial instrument).
In determining the classification of a financial instrument under PFRS 9, the Group evaluates inwhich business model a financial instrument or a portfolio of financial instruments belong totaking into consideration the objectives of each business model established by the Group, variousrisks and key performance indicators being reviewed and monitored by responsible officers, aswell as the manner of compensation for them.
At the start of 2018, the Parent Bank’s BOD approved its documentation of business modelswhich contains broad categories of banking and trading business models. The banking businessmodel includes the Parent Bank’s lending activities as well as treasury business activities brokendown into liquidity and investment portfolios. The approval of the business models triggered therealignment and reassessment of the Parent Bank’s strategy for managing its HTC portfolio andthe introduction of new portfolios with the objective of maximizing risk-adjusted returns. Assuch, the Bank’s classification of financial assets now consists of amortized cost, FVOCI andFVTPL, where certain securities were reclassified from a classification measured at amortizedcost to a classification measured at fair value, and vice versa, at the beginning of first quarterof 2018.
141
VJNQUISIDO
Rectangle
- 35 -
*SGVFS032944*
In addition, PFRS 9 emphasizes that if more than an infrequent and more than an insignificantsale is made out of a portfolio of financial assets carried at amortized cost, an entity should assesswhether and how such sales are consistent with the objective of collecting contractual cash flows.In making this judgment, the Group considers certain circumstances documented in its businessmodel manual to assess that an increase in the frequency or value of sales of financial instrumentsin a particular period is not necessarily inconsistent with a held-to-collect business model if theGroup can explain the reasons for those sales and why those sales do not reflect a change in theGroup’s objective for the business model.
In 2018, the Bank participated in bond exchanges resulting in disposal of certain financial assetscarried at amortized cost. The Parent Bank has assessed that such sales are not more thaninfrequent and are necessary in order to ensure that the outstanding securities remain of anacceptable liquid quality. The disposals are considered not inconsistent with the objective of holdto collect business model. The remaining securities in the affected portfolios continue to bemeasured at amortized cost as of December 31, 2018.
The business model assessment is based on reasonably expected scenarios without taking worstcase or stress case scenarios into account. If cash flows, after initial recognition are realized in away that is different from the Group’s and the Parent Company’s original expectations, the Groupand the Parent Company does not change the classification of the remaining financial assets heldin that business model but incorporates such information when assessing newly originated ornewly purchased financial assets going forward.
e. Testing the cash flow characteristics of financial assets (PFRS 9)In determining the classification of financial assets under PFRS 9, the Group assesses whether thecontractual terms of the financial assets give rise on specified dates to cash flows that are SPPI onthe principal outstanding, with interest representing time value of money and credit riskassociated with the principal amount outstanding. The assessment as to whether the cash flowsmeet the test is made in the currency in which the financial asset is denominated. Any othercontractual term that changes the timing or amount of cash flows (unless it is a variable interestrate that represents time value of money and credit risk), i.e., cash flows that are non-SPPI, doesnot meet the amortized cost criteria. In cases where the relationship between the passage of timeand the interest rate of the financial instrument may be imperfect, known as modified time valueof money, the Group assesses the modified time value of money feature to determine whether thefinancial instrument still meets the SPPI criterion. The objective of the assessment is to determinehow different the undiscounted contractual cash flows could be from the undiscounted cash flowsthat would arise if the time value of money element was not modified (the benchmark cashflows). If the resulting difference is significant, the SPPI criterion is not met. In view of this, theGroup considers the effect of the modified time value of money element in each reporting periodand cumulatively over the life of the financial instrument.
Estimatesa. Credit losses on loans and receivables (prior to adoption of PFRS 9)
The Group reviews its loans and receivables at each reporting date to assess whether an allowancefor credit losses should be recorded in the balance sheet and any changes thereto in the statementof income. In particular, judgment by management is required in the estimation of the amountand timing of future cash flows when determining the level of allowance required. Suchestimates are based on assumptions about a number of factors such as the financial condition ofthe borrower, estimated future cash flows, observable market prices and estimated net sellingprices of the related collateral. Actual results may also differ, resulting in future changes to theallowance.
142
VJNQUISIDO
Rectangle
- 36 -
*SGVFS032944*
In addition to specific allowance against individually significant loans and receivables, the Groupalso makes a collective impairment assessment on exposures which, although not specificallyidentified as requiring a specific allowance, have a greater risk of default than when originallygranted. The resulting collective allowance is based on historical loss experience adjusted on thebasis of current observable data for assets with similar credit risk characteristics.
The carrying values of loans and receivables and the related allowance for credit losses of theGroup and the Parent Company are disclosed in Notes 10 and 16.
b. Expected credit losses on financial assets and commitments (PFRS 9)The Group reviews its financial assets and commitments at each reporting date to determine theamount of expected credit losses to be recognized in the balance sheet and any changes thereto inthe statement of income. In particular, judgments and estimates by management are required indetermining the following:
∂ whether a financial asset has had a significant increase in credit risk since initial recognition;∂ whether default has taken place and what comprises a default;∂ macro-economic factors that are relevant in measuring a financial asset’s probability of
default as well as the Group’s forecast of these macro-economic factors;∂ probability weights applied over a range of possible outcomes;∂ sufficiency and appropriateness of data used and relationships assumed in building the
components of the Group’s expected credit loss models;∂ measuring the exposure at default for unused commitments on which an expected credit loss
should be recognized and the applicable loss rate
The related allowance for credit losses of financial assets and commitments of the Group and theParent Company are disclosed in Notes 16 and 20.
c. Impairment of goodwillGoodwill is reviewed for impairment, annually or more frequently if events or changes incircumstances indicate that the carrying value may be impaired. Impairment is determined forgoodwill by assessing the recoverable amount of the cash generating unit CGU to which thegoodwill relates. The recoverable amount of the CGU is determined based on a VIU calculationusing cash flow projections from financial budgets approved by senior management covering afive-year period. For VIU, the Group estimates the discount rate used for the computation of thenet present value by reference to industry cost of capital. Impairment assessment process requiressignificant judgement and based on assumptions, specifically loan and deposit growth rates,discount rate and the terminal value growth rates.
Where the recoverable amount is less than the carrying amount of the CGU to which goodwillhas been allocated, an impairment loss is recognized immediately in the statement of income.Impairment losses relating to goodwill cannot be reversed for subsequent increases in itsrecoverable amount in future periods. The carrying values of the Group’s goodwill are disclosedin Note 14.
d. Impairment of branch licensesThe Group conducts an annual review for any impairment in the value of branch licenses. Branchlicenses are written down for impairment where the recoverable value is insufficient to supportthe carrying value. The recoverable amount of branch licenses is the higher between fair valueless costs of disposal (FVLCD) and its value-in-use (VIU). FVLCD of branch licenses is basedon the special licensing fee of BSP on branches operating on identified restricted areas. The
143
VJNQUISIDO
Rectangle
- 37 -
*SGVFS032944*
recoverable amount of the CGU is determined based on a VIU calculation using cash flowprojections from financial budgets approved by senior management covering a five-year period.For VIU, the Group estimates the discount rate used for the computation of the net present valueby reference to industry cost of capital. Impairment assessment process requires significantjudgement and based on assumptions, specifically loan and deposit growth rates, discount rateand the terminal value growth rates.
The carrying values of the Group’s branch licenses are disclosed in Note 14.
e. Net plan assets and retirement expenseThe determination of the Group’s net plan assets and annual retirement expense is dependent onthe selection of certain assumptions used in calculating such amounts. These assumptionsinclude, among others, discount rates and salary rates.
The assumed discount rates were determined using the market yields on Philippine governmentbonds with terms consistent with the expected employee benefit payout as of the reporting date.
The present value of the retirement obligation and fair value of plan assets, including the detailsof the assumptions used in the calculation are disclosed in Note 24.
f. Recognition of deferred income taxesDeferred tax assets are recognized for deductible temporary differences to the extent that it isprobable that taxable profit will be available against which the losses can be utilized.Management discretion is required to determine the amount of deferred tax assets that can berecognized, based on the forecasted level of future taxable profits and the related future taxplanning strategies. Key assumptions used in forecast of future taxable income include loanportfolio and deposit growth rates.
The Group believes it will be able to generate sufficient taxable income in the future to utilize itsrecorded deferred tax assets. Taxable income is sourced mainly from interest income fromlending activities and earnings from service charge, fees, commissions and trust activities.
The recognized and unrecognized deferred tax assets are disclosed in Note 27.
g. Impairment on non-financial assetsThe Group assesses impairment on its nonfinancial assets (e.g., investment properties and bankpremises, furniture, fixtures and equipment) and considers the following impairment indicators:∂ significant underperformance relative to expected historical or projected future operating
results;∂ significant changes in the manner of use of the acquired assets or the strategy for overall
business; and∂ significant negative industry or economic trends.
An impairment loss is recognized whenever the carrying amount of an asset exceeds itsrecoverable amount. Except for investment properties where recoverable amount is determinedbased on fair value less cost to sell, the recoverable amount of all other nonfinancial assets isdetermined based on the asset’s value in use computation which considers the present value ofestimated future cash flows expected to be generated from the continued use of the asset. TheGroup is required to make estimates and assumptions that can materially affect the carryingamount of the asset being assessed.
The carrying values of the Group’s nonfinancial assets are disclosed in Notes 12 and 13.
144
VJNQUISIDO
Rectangle
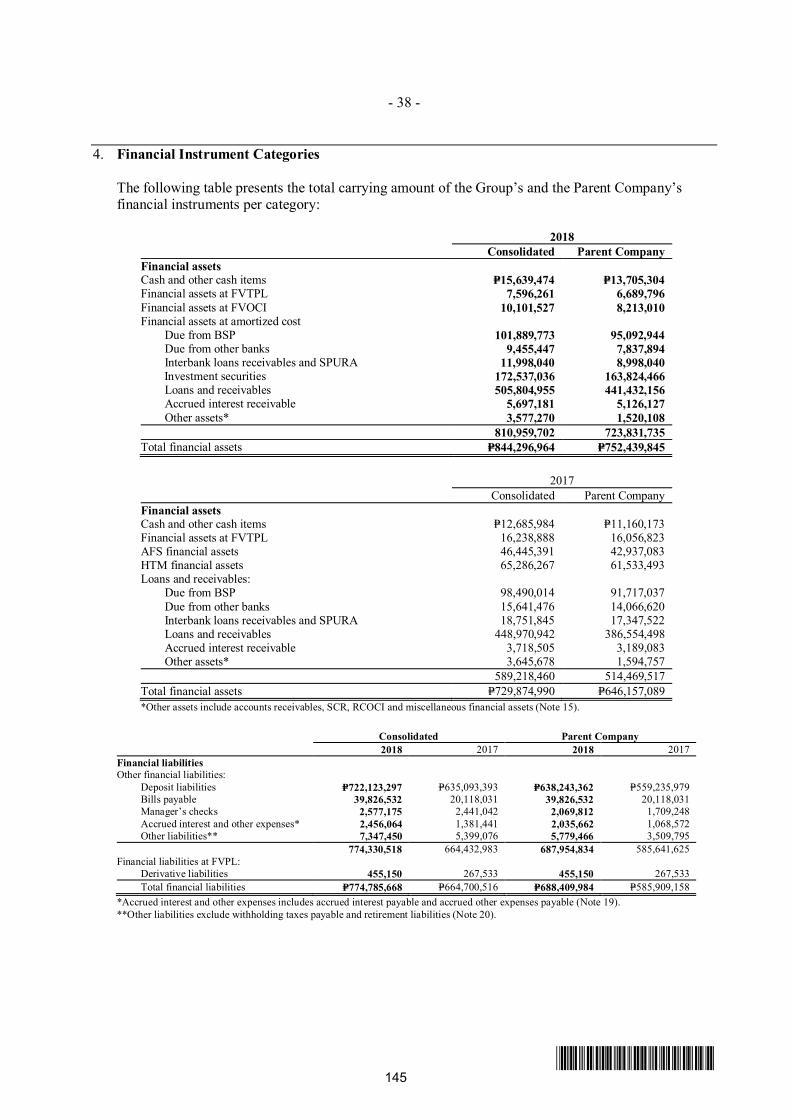
- 38 -
*SGVFS032944*
4. Financial Instrument Categories
The following table presents the total carrying amount of the Group’s and the Parent Company’sfinancial instruments per category:
2018Consolidated Parent Company
Financial assetsCash and other cash items P=15,639,474 P=13,705,304Financial assets at FVTPL 7,596,261 6,689,796Financial assets at FVOCI 10,101,527 8,213,010Financial assets at amortized cost Due from BSP 101,889,773 95,092,944 Due from other banks 9,455,447 7,837,894 Interbank loans receivables and SPURA 11,998,040 8,998,040
Investment securities 172,537,036 163,824,466 Loans and receivables 505,804,955 441,432,156 Accrued interest receivable 5,697,181 5,126,127 Other assets* 3,577,270 1,520,108
810,959,702 723,831,735Total financial assets P=844,296,964 P=752,439,845
2017Consolidated Parent Company
Financial assetsCash and other cash items P=12,685,984 P=11,160,173Financial assets at FVTPL 16,238,888 16,056,823AFS financial assets 46,445,391 42,937,083HTM financial assets 65,286,267 61,533,493Loans and receivables: Due from BSP 98,490,014 91,717,037 Due from other banks 15,641,476 14,066,620 Interbank loans receivables and SPURA 18,751,845 17,347,522 Loans and receivables 448,970,942 386,554,498 Accrued interest receivable 3,718,505 3,189,083 Other assets* 3,645,678 1,594,757
589,218,460 514,469,517Total financial assets P=729,874,990 P=646,157,089*Other assets include accounts receivables, SCR, RCOCI and miscellaneous financial assets (Note 15).
Consolidated Parent Company2018 2017 2018 2017
Financial liabilitiesOther financial liabilities:
Deposit liabilities P=722,123,297 P=635,093,393 P=638,243,362 P=559,235,979Bills payable 39,826,532 20,118,031 39,826,532 20,118,031Manager’s checks 2,577,175 2,441,042 2,069,812 1,709,248Accrued interest and other expenses* 2,456,064 1,381,441 2,035,662 1,068,572Other liabilities** 7,347,450 5,399,076 5,779,466 3,509,795
774,330,518 664,432,983 687,954,834 585,641,625Financial liabilities at FVPL:
Derivative liabilities 455,150 267,533 455,150 267,533Total financial liabilities P=774,785,668 P=664,700,516 P=688,409,984 P=585,909,158
*Accrued interest and other expenses includes accrued interest payable and accrued other expenses payable (Note 19).**Other liabilities exclude withholding taxes payable and retirement liabilities (Note 20).
145
VJNQUISIDO
Rectangle
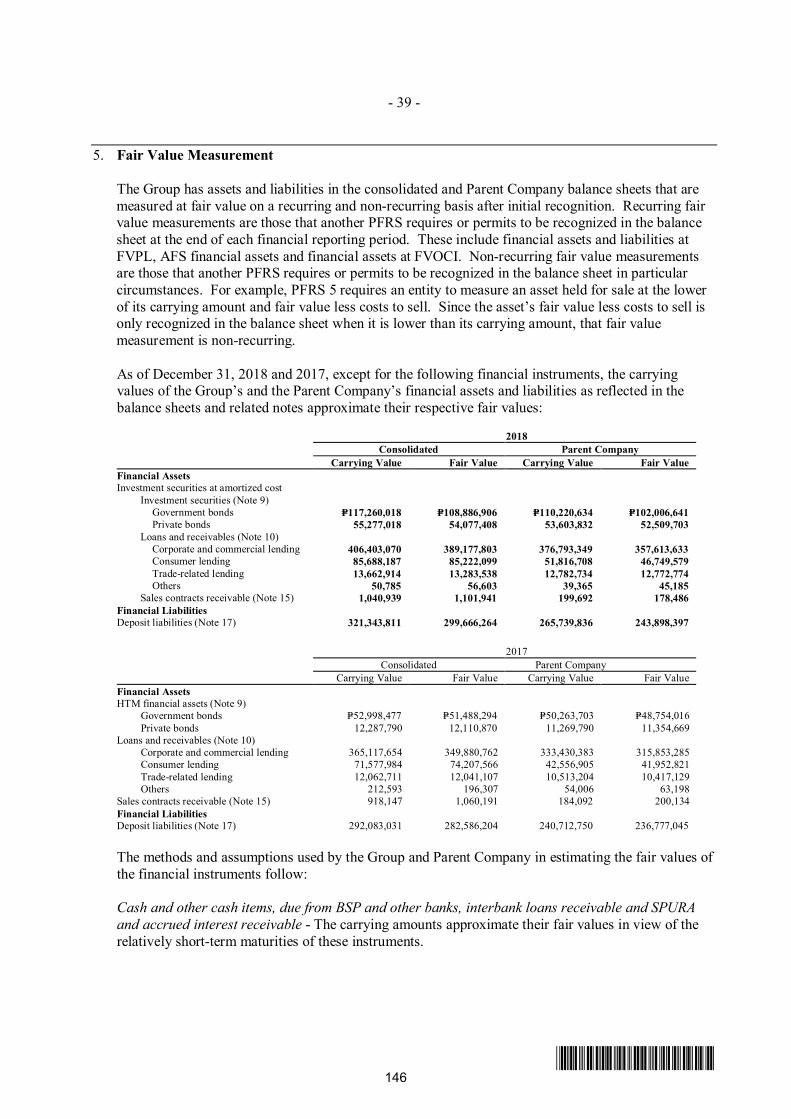
- 39 -
*SGVFS032944*
5. Fair Value Measurement
The Group has assets and liabilities in the consolidated and Parent Company balance sheets that aremeasured at fair value on a recurring and non-recurring basis after initial recognition. Recurring fairvalue measurements are those that another PFRS requires or permits to be recognized in the balancesheet at the end of each financial reporting period. These include financial assets and liabilities atFVPL, AFS financial assets and financial assets at FVOCI. Non-recurring fair value measurementsare those that another PFRS requires or permits to be recognized in the balance sheet in particularcircumstances. For example, PFRS 5 requires an entity to measure an asset held for sale at the lowerof its carrying amount and fair value less costs to sell. Since the asset’s fair value less costs to sell isonly recognized in the balance sheet when it is lower than its carrying amount, that fair valuemeasurement is non-recurring.
As of December 31, 2018 and 2017, except for the following financial instruments, the carryingvalues of the Group’s and the Parent Company’s financial assets and liabilities as reflected in thebalance sheets and related notes approximate their respective fair values:
2018Consolidated Parent Company
Carrying Value Fair Value Carrying Value Fair ValueFinancial AssetsInvestment securities at amortized cost
Investment securities (Note 9)Government bonds P=117,260,018 P=108,886,906 P=110,220,634 P=102,006,641Private bonds 55,277,018 54,077,408 53,603,832 52,509,703
Loans and receivables (Note 10)Corporate and commercial lending 406,403,070 389,177,803 376,793,349 357,613,633Consumer lending 85,688,187 85,222,099 51,816,708 46,749,579Trade-related lending 13,662,914 13,283,538 12,782,734 12,772,774Others 50,785 56,603 39,365 45,185
Sales contracts receivable (Note 15) 1,040,939 1,101,941 199,692 178,486Financial LiabilitiesDeposit liabilities (Note 17) 321,343,811 299,666,264 265,739,836 243,898,397
2017Consolidated Parent Company
Carrying Value Fair Value Carrying Value Fair ValueFinancial AssetsHTM financial assets (Note 9)
Government bonds P=52,998,477 P=51,488,294 P=50,263,703 P=48,754,016Private bonds 12,287,790 12,110,870 11,269,790 11,354,669
Loans and receivables (Note 10)Corporate and commercial lending 365,117,654 349,880,762 333,430,383 315,853,285Consumer lending 71,577,984 74,207,566 42,556,905 41,952,821Trade-related lending 12,062,711 12,041,107 10,513,204 10,417,129Others 212,593 196,307 54,006 63,198
Sales contracts receivable (Note 15) 918,147 1,060,191 184,092 200,134Financial LiabilitiesDeposit liabilities (Note 17) 292,083,031 282,586,204 240,712,750 236,777,045
The methods and assumptions used by the Group and Parent Company in estimating the fair values ofthe financial instruments follow:
Cash and other cash items, due from BSP and other banks, interbank loans receivable and SPURAand accrued interest receivable - The carrying amounts approximate their fair values in view of therelatively short-term maturities of these instruments.
146
VJNQUISIDO
Rectangle
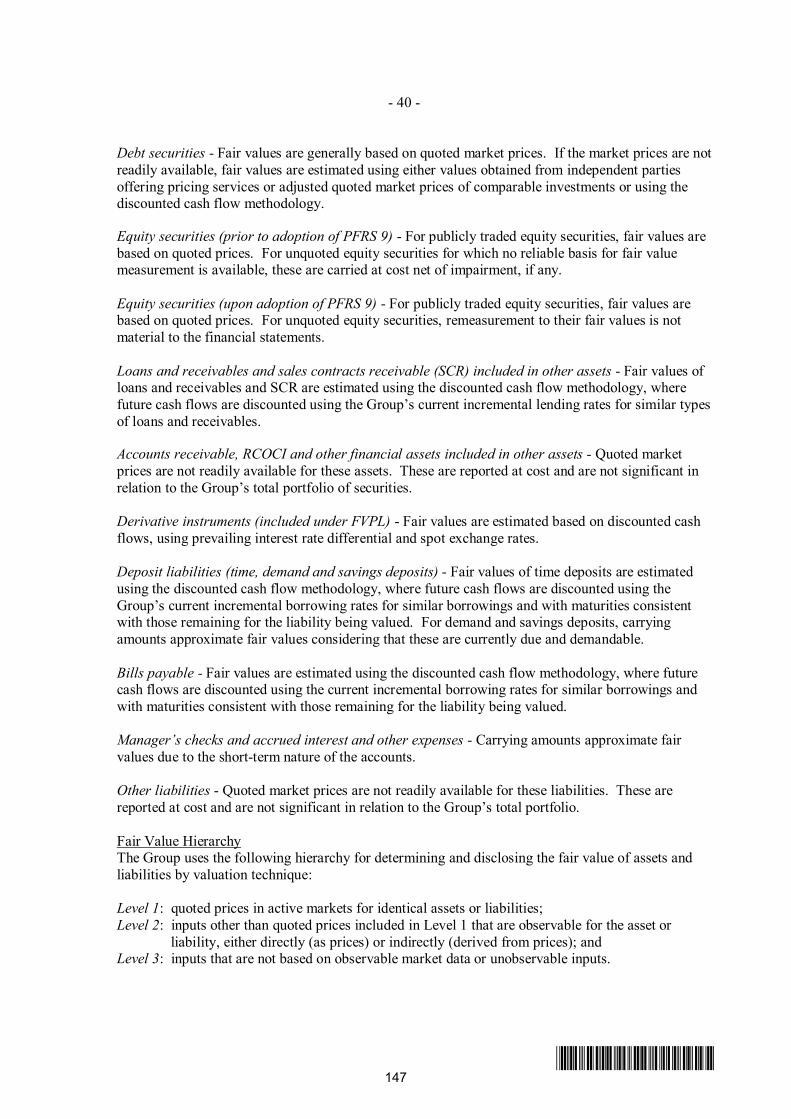
- 40 -
*SGVFS032944*
Debt securities - Fair values are generally based on quoted market prices. If the market prices are notreadily available, fair values are estimated using either values obtained from independent partiesoffering pricing services or adjusted quoted market prices of comparable investments or using thediscounted cash flow methodology.
Equity securities (prior to adoption of PFRS 9) - For publicly traded equity securities, fair values arebased on quoted prices. For unquoted equity securities for which no reliable basis for fair valuemeasurement is available, these are carried at cost net of impairment, if any.
Equity securities (upon adoption of PFRS 9) - For publicly traded equity securities, fair values arebased on quoted prices. For unquoted equity securities, remeasurement to their fair values is notmaterial to the financial statements.
Loans and receivables and sales contracts receivable (SCR) included in other assets - Fair values ofloans and receivables and SCR are estimated using the discounted cash flow methodology, wherefuture cash flows are discounted using the Group’s current incremental lending rates for similar typesof loans and receivables.
Accounts receivable, RCOCI and other financial assets included in other assets - Quoted marketprices are not readily available for these assets. These are reported at cost and are not significant inrelation to the Group’s total portfolio of securities.
Derivative instruments (included under FVPL) - Fair values are estimated based on discounted cashflows, using prevailing interest rate differential and spot exchange rates.
Deposit liabilities (time, demand and savings deposits) - Fair values of time deposits are estimatedusing the discounted cash flow methodology, where future cash flows are discounted using theGroup’s current incremental borrowing rates for similar borrowings and with maturities consistentwith those remaining for the liability being valued. For demand and savings deposits, carryingamounts approximate fair values considering that these are currently due and demandable.
Bills payable - Fair values are estimated using the discounted cash flow methodology, where futurecash flows are discounted using the current incremental borrowing rates for similar borrowings andwith maturities consistent with those remaining for the liability being valued.
Manager’s checks and accrued interest and other expenses - Carrying amounts approximate fairvalues due to the short-term nature of the accounts.
Other liabilities - Quoted market prices are not readily available for these liabilities. These arereported at cost and are not significant in relation to the Group’s total portfolio.
Fair Value HierarchyThe Group uses the following hierarchy for determining and disclosing the fair value of assets andliabilities by valuation technique:
Level 1: quoted prices in active markets for identical assets or liabilities;Level 2: inputs other than quoted prices included in Level 1 that are observable for the asset or
liability, either directly (as prices) or indirectly (derived from prices); andLevel 3: inputs that are not based on observable market data or unobservable inputs.
147
VJNQUISIDO
Rectangle
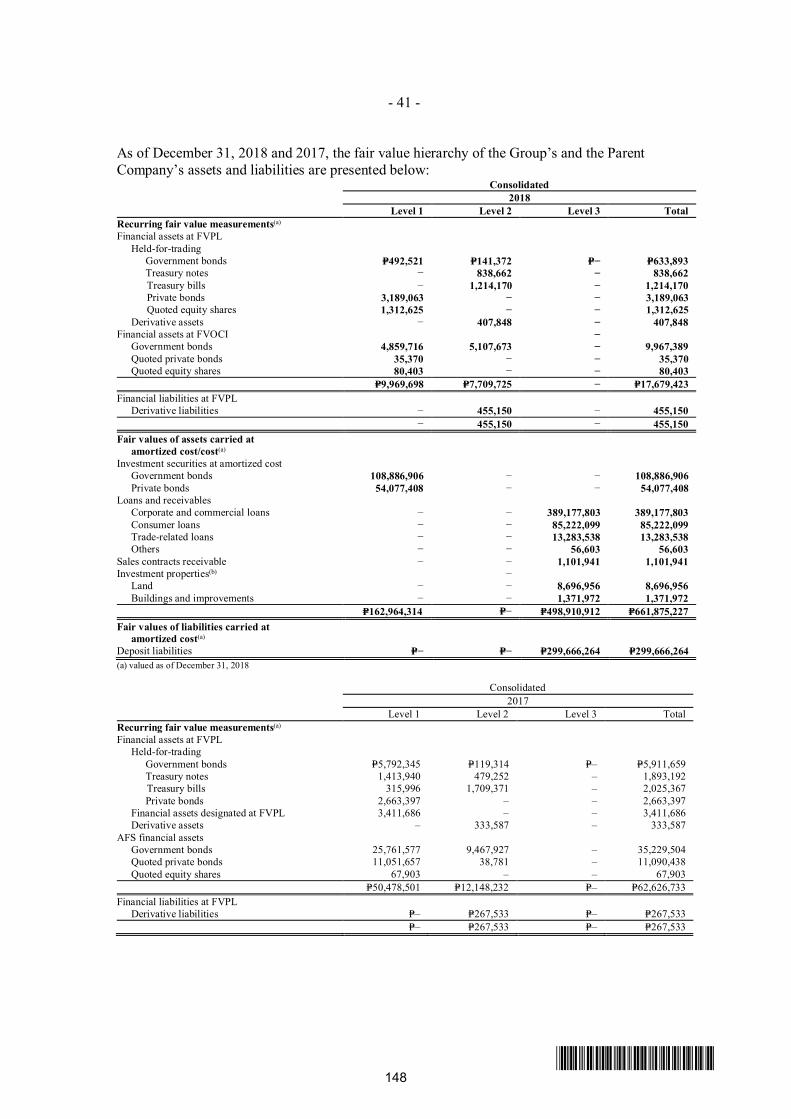
- 41 -
*SGVFS032944*
As of December 31, 2018 and 2017, the fair value hierarchy of the Group’s and the ParentCompany’s assets and liabilities are presented below:
Consolidated2018
Level 1 Level 2 Level 3 TotalRecurring fair value measurements(a)
Financial assets at FVPL Held-for-trading Government bonds P=492,521 P=141,372 P=− P=633,893 Treasury notes − 838,662 − 838,662
Treasury bills − 1,214,170 − 1,214,170Private bondsQuoted equity shares
3,189,0631,312,625
−−
−−
3,189,0631,312,625
Derivative assets − 407,848 − 407,848Financial assets at FVOCI − Government bonds 4,859,716 5,107,673 − 9,967,389 Quoted private bonds 35,370 − − 35,370 Quoted equity shares 80,403 − − 80,403
P=9,969,698 P=7,709,725 − P=17,679,423Financial liabilities at FVPL Derivative liabilities − 455,150 − 455,150
− 455,150 − 455,150Fair values of assets carried at amortized cost/cost(a)
Investment securities at amortized cost Government bonds 108,886,906 − − 108,886,906 Private bonds 54,077,408 − − 54,077,408Loans and receivables Corporate and commercial loans − − 389,177,803 389,177,803 Consumer loans − − 85,222,099 85,222,099 Trade-related loans − − 13,283,538 13,283,538 Others − − 56,603 56,603Sales contracts receivable − − 1,101,941 1,101,941Investment properties(b) − Land − − 8,696,956 8,696,956 Buildings and improvements − − 1,371,972 1,371,972
P=162,964,314 P=− P=498,910,912 P=661,875,227Fair values of liabilities carried at amortized cost(a)
Deposit liabilities P=− P=− P=299,666,264 P=299,666,264(a) valued as of December 31, 2018
Consolidated2017
Level 1 Level 2 Level 3 TotalRecurring fair value measurements(a)
Financial assets at FVPL Held-for-trading Government bonds P=5,792,345 P=119,314 P=– P=5,911,659 Treasury notes 1,413,940 479,252 – 1,893,192 Treasury bills 315,996 1,709,371 – 2,025,367 Private bonds 2,663,397 – – 2,663,397 Financial assets designated at FVPL 3,411,686 – – 3,411,686 Derivative assets – 333,587 – 333,587AFS financial assets Government bonds 25,761,577 9,467,927 – 35,229,504 Quoted private bonds 11,051,657 38,781 – 11,090,438 Quoted equity shares 67,903 – – 67,903
P=50,478,501 P=12,148,232 P=– P=62,626,733Financial liabilities at FVPL Derivative liabilities P=– P=267,533 P=– P=267,533
P=– P=267,533 P=– P=267,533
148
VJNQUISIDO
Rectangle
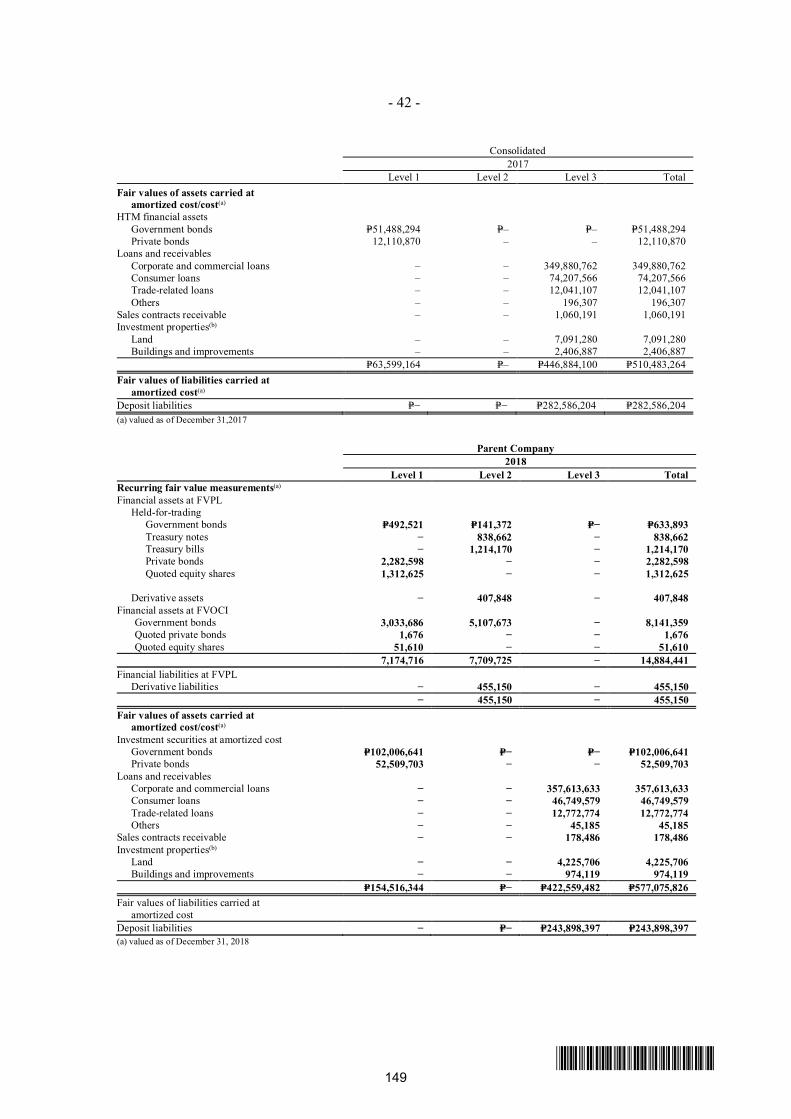
- 42 -
*SGVFS032944*
Consolidated2017
Level 1 Level 2 Level 3 TotalFair values of assets carried at amortized cost/cost(a)
HTM financial assets Government bonds P=51,488,294 P=– P=– P=51,488,294 Private bonds 12,110,870 – – 12,110,870Loans and receivables Corporate and commercial loans – – 349,880,762 349,880,762 Consumer loans – – 74,207,566 74,207,566 Trade-related loans – – 12,041,107 12,041,107 Others – – 196,307 196,307Sales contracts receivable – – 1,060,191 1,060,191Investment properties(b)
Land – – 7,091,280 7,091,280 Buildings and improvements – – 2,406,887 2,406,887
P=63,599,164 P=– P=446,884,100 P=510,483,264Fair values of liabilities carried at amortized cost(a)
Deposit liabilities P=− P=− P=282,586,204 P=282,586,204(a) valued as of December 31,2017
Parent Company2018
Level 1 Level 2 Level 3 TotalRecurring fair value measurements(a)
Financial assets at FVPL Held-for-trading Government bonds P=492,521 P=141,372 P=− P=633,893 Treasury notes − 838,662 − 838,662 Treasury bills − 1,214,170 − 1,214,170 Private bonds
Quoted equity shares2,282,5981,312,625
−−
−−
2,282,598 1,312,625
Derivative assets − 407,848 − 407,848Financial assets at FVOCI
Government bonds 3,033,686 5,107,673 − 8,141,359Quoted private bonds 1,676 − − 1,676Quoted equity shares 51,610 − − 51,610
7,174,716 7,709,725 − 14,884,441Financial liabilities at FVPL Derivative liabilities − 455,150 − 455,150
− 455,150 − 455,150Fair values of assets carried at amortized cost/cost(a)
Investment securities at amortized cost Government bonds P=102,006,641 P=− P=− P=102,006,641 Private bonds 52,509,703 − − 52,509,703Loans and receivables Corporate and commercial loans − − 357,613,633 357,613,633 Consumer loans − − 46,749,579 46,749,579 Trade-related loans − − 12,772,774 12,772,774 Others − − 45,185 45,185Sales contracts receivable − − 178,486 178,486Investment properties(b)
Land − − 4,225,706 4,225,706 Buildings and improvements − − 974,119 974,119
P=154,516,344 P=− P=422,559,482 P=577,075,826Fair values of liabilities carried at amortized costDeposit liabilities − P=− P=243,898,397 P=243,898,397(a) valued as of December 31, 2018
149
VJNQUISIDO
Rectangle
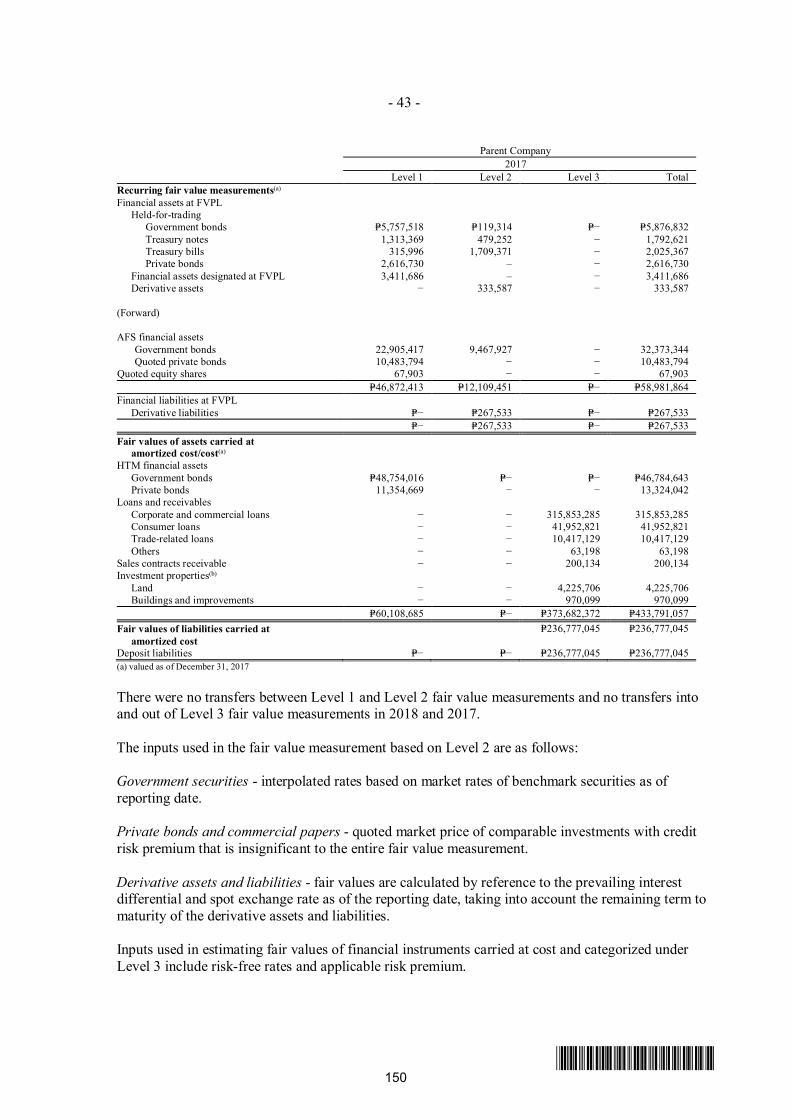
- 43 -
*SGVFS032944*
Parent Company2017
Level 1 Level 2 Level 3 TotalRecurring fair value measurements(a)
Financial assets at FVPL Held-for-trading Government bonds P=5,757,518 P=119,314 P=− P=5,876,832 Treasury notes 1,313,369 479,252 − 1,792,621 Treasury bills 315,996 1,709,371 − 2,025,367 Private bonds 2,616,730 – − 2,616,730 Financial assets designated at FVPL 3,411,686 – − 3,411,686 Derivative assets − 333,587 − 333,587
(Forward)
AFS financial assetsGovernment bonds 22,905,417 9,467,927 − 32,373,344Quoted private bonds 10,483,794 − − 10,483,794
Quoted equity shares 67,903 − − 67,903P=46,872,413 P=12,109,451 P=− P=58,981,864
Financial liabilities at FVPL Derivative liabilities P=− P=267,533 P=− P=267,533
P=− P=267,533 P=− P=267,533Fair values of assets carried at
amortized cost/cost(a)
HTM financial assets Government bonds P=48,754,016 P=− P=− P=46,784,643 Private bonds 11,354,669 − − 13,324,042Loans and receivables Corporate and commercial loans − − 315,853,285 315,853,285 Consumer loans − − 41,952,821 41,952,821 Trade-related loans − − 10,417,129 10,417,129 Others − − 63,198 63,198Sales contracts receivable − − 200,134 200,134Investment properties(b)
Land − − 4,225,706 4,225,706 Buildings and improvements − − 970,099 970,099
P=60,108,685 P=− P=373,682,372 P=433,791,057Fair values of liabilities carried at
amortized costP=236,777,045 P=236,777,045
Deposit liabilities P=− P=− P=236,777,045 P=236,777,045(a) valued as of December 31, 2017
There were no transfers between Level 1 and Level 2 fair value measurements and no transfers intoand out of Level 3 fair value measurements in 2018 and 2017.
The inputs used in the fair value measurement based on Level 2 are as follows:
Government securities - interpolated rates based on market rates of benchmark securities as ofreporting date.
Private bonds and commercial papers - quoted market price of comparable investments with creditrisk premium that is insignificant to the entire fair value measurement.
Derivative assets and liabilities - fair values are calculated by reference to the prevailing interestdifferential and spot exchange rate as of the reporting date, taking into account the remaining term tomaturity of the derivative assets and liabilities.
Inputs used in estimating fair values of financial instruments carried at cost and categorized underLevel 3 include risk-free rates and applicable risk premium.
150
VJNQUISIDO
Rectangle
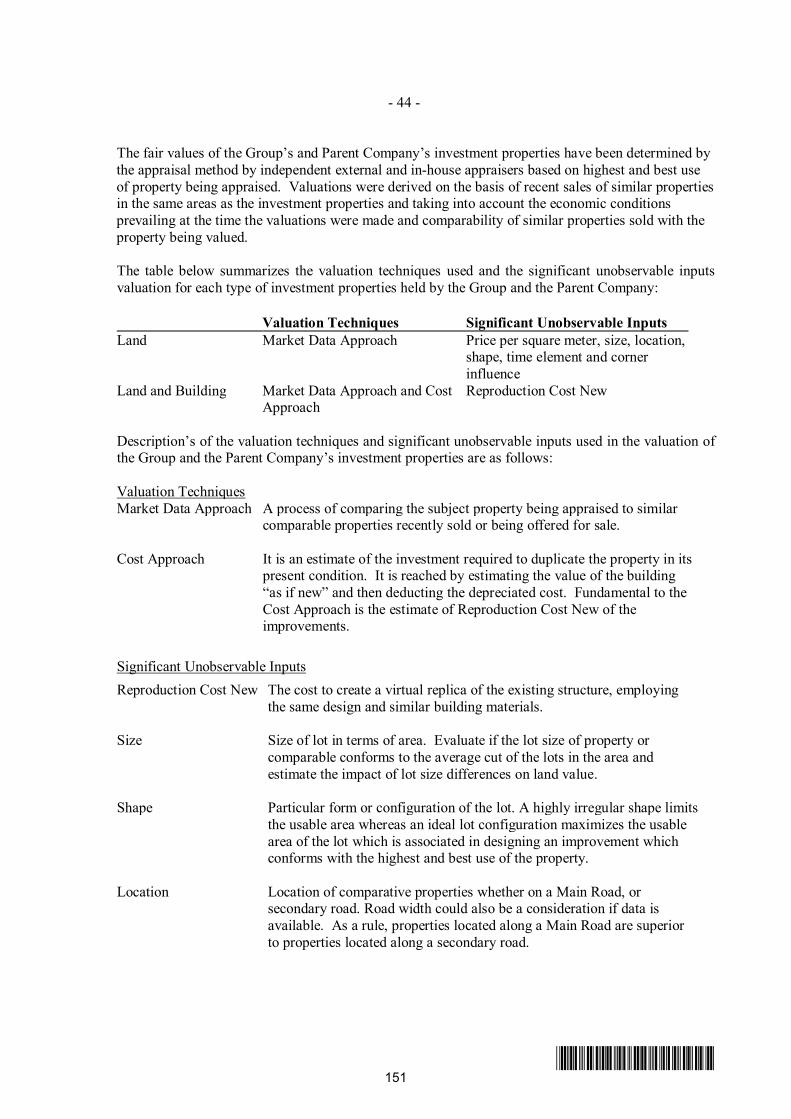
- 44 -
*SGVFS032944*
The fair values of the Group’s and Parent Company’s investment properties have been determined bythe appraisal method by independent external and in-house appraisers based on highest and best useof property being appraised. Valuations were derived on the basis of recent sales of similar propertiesin the same areas as the investment properties and taking into account the economic conditionsprevailing at the time the valuations were made and comparability of similar properties sold with theproperty being valued.
The table below summarizes the valuation techniques used and the significant unobservable inputsvaluation for each type of investment properties held by the Group and the Parent Company:
Valuation Techniques Significant Unobservable InputsLand Market Data Approach Price per square meter, size, location,
shape, time element and cornerinfluence
Land and Building Market Data Approach and CostApproach
Reproduction Cost New
Description’s of the valuation techniques and significant unobservable inputs used in the valuation ofthe Group and the Parent Company’s investment properties are as follows:
Valuation TechniquesMarket Data Approach A process of comparing the subject property being appraised to similar
comparable properties recently sold or being offered for sale.
Cost Approach It is an estimate of the investment required to duplicate the property in itspresent condition. It is reached by estimating the value of the building“as if new” and then deducting the depreciated cost. Fundamental to theCost Approach is the estimate of Reproduction Cost New of theimprovements.
Significant Unobservable InputsReproduction Cost New The cost to create a virtual replica of the existing structure, employing
the same design and similar building materials.
Size Size of lot in terms of area. Evaluate if the lot size of property orcomparable conforms to the average cut of the lots in the area andestimate the impact of lot size differences on land value.
Shape Particular form or configuration of the lot. A highly irregular shape limitsthe usable area whereas an ideal lot configuration maximizes the usablearea of the lot which is associated in designing an improvement whichconforms with the highest and best use of the property.
Location Location of comparative properties whether on a Main Road, orsecondary road. Road width could also be a consideration if data isavailable. As a rule, properties located along a Main Road are superiorto properties located along a secondary road.
151
VJNQUISIDO
Rectangle
- 45 -
*SGVFS032944*
Significant Unobservable InputsTime Element “An adjustment for market conditions is made if general property values
have appreciated or depreciated since the transaction dates due toinflation or deflation or a change in investors’ perceptions of the marketover time”. In which case, the current data is superior to historic data.
Discount Generally, asking prices in ads posted for sale are negotiable. Discountis the amount the seller or developer is willing to deduct from the postedselling price if the transaction will be in cash or equivalent.
Corner influence Bounded by two (2) roads.
6. Financial Risk Management Objectives and Policies
The Group’s activities are principally related to the profitable use of financial instruments. Risks areinherent in these activities but are managed by the Group through a rigorous, comprehensive andcontinuous process of identification, measurement, monitoring and mitigation of these risks, partlythrough the effective use of risk and authority limits and thresholds, process controls and monitoring,and independent controls. As reflected in its corporate actions and organizational improvements, theGroup has placed due importance on expanding and strengthening its risk management process andconsiders it as a vital component to the Group’s continuing profitability and financial stability.Central to the Group’s risk management process is its adoption of a risk management programintended to avoid unnecessary risks, manage and mitigate unavoidable risks and maximize returnsfrom taking acceptable risks necessary to sustain its business viability and good financial position inthe market.
The key financial risks that the Group faces are: credit risk, market risk (i.e. interest rate risk, foreigncurrency risk and equity price risk) and liquidity risk. The Group’s risk management objective isprimarily focused on controlling and mitigating these risks. The Parent Company and its subsidiariesmanage their respective financial risks separately. The subsidiaries, particularly CBSI, have theirown risk management processes but are structured similar to that of the Parent Company. To a largeextent, the respective risk management programs and objectives are the same across the Group. Thegravity of the risks, the magnitude of the financial instruments involved, and regulatory requirementsare primary considerations to the scope and extent of the risk management processes put in place forthe subsidiaries.
Risk Management StructureThe BOD of the Parent Company is ultimately responsible for the oversight of the Parent Company’srisk management processes. On the other hand, the risk management processes of the subsidiaries arethe separate responsibilities of their respective BODs. The BOD of the Parent Company created aseparate board-level independent committee with explicit authority and responsibility for managingand monitoring risks.
The BOD has delegated to the Risk Oversight Committee (ROC) the implementation of the riskmanagement process which includes, among others, the development of various risk strategies andprinciples, control guidelines policies and procedures, implementation of risk measurement tools,monitoring of key risk indicators, and the imposition and monitoring of risk limits and thresholds.The ROC is composed of three members of the BOD, two of whom are independent directors.
152
VJNQUISIDO
Rectangle
- 46 -
*SGVFS032944*
The Risk Management Group (RMG) is the direct support of the ROC in the day-to-day riskmanagement and the implementation of the risk management strategies approved by the ROC. Theimplementation cuts across all departments of the Parent Company and involves all of the ParentCompany’s financial instruments, whether “on-books” or “off-books.” The RMG is likewiseresponsible for monitoring the implementation of specific risk control procedures and enforcingcompliance thereto. The RMG is also directly involved in the day-to-day risk measurement andmonitoring to make sure that the Parent Company, in its transactions and dealings, engages only inacceptable and manageable financial risks. The RMG also ensures that risk measurements areaccurately and completely captured on a timely basis in the management reporting system of theParent Company. The RMG regularly reports the results of the risk measurements to the ROC. TheRMG is headed by the Chief Risk Officer (CRO).
Apart from RMG, each business unit has created and put in place various process controls whichensure that all the external and internal transactions and dealings of the unit are in compliance withthe unit’s risk management objectives.
The Internal Audit Division also plays a crucial role in risk management primarily because it isindependent of the business units and reports exclusively to the Audit Committee which, in turn, iscomprised of independent directors. The Internal Audit Division focuses on ensuring that adequatecontrols are in place and on monitoring compliance to controls. The regular audit covers allprocesses and controls, including those under the risk management framework handled by the RMG.The audit of these processes and controls is undertaken at least annually. The audit results andexceptions, including recommendations for their resolution or improvement, are discussed initiallywith the business units concerned before these are presented to the Audit Committee.
Risk Management ReportingThe CRO and other members of the RMG report to the ROC and are a resource to the ManagementCommittee (ManCom) on a monthly and a weekly basis, respectively. The CRO reports on key riskindicators and specific risk management issues that would need resolution from top management.This is undertaken after the risk issues and key risk indicators have been discussed with the businessunits concerned.
The key risk indicators were formulated on the basis of the financial risks faced by the ParentCompany. The key risk indicators contain information from all business units that providemeasurements on the level of the risks taken by the Parent Company in its products, transactions andfinancial structure. Among others, the report on key risk indicators includes information on theParent Company’s aggregate credit exposure, credit metric forecasts, hold limit exceptions, Value-at-Risk (VaR) analysis, utilization of market and credit limits and thresholds, liquidity risk limits andratios, overall loan loss provisioning and risk profile changes. Loan loss provisioning and credit limitutilization are, however, discussed in more detail in the Credit Committee. On a monthly basis,detailed reporting of single-name and sectoral concentration is included in the discussion with theROC. On the other hand, the Chief Audit Executive reports to the Audit Committee on a monthlybasis on the results of branch or business unit audits and for the resolution of pending but importantinternal audit issues.
Risk MitigationThe Parent Company uses derivatives to manage exposures in its financial instruments resulting fromchanges in interest rates and foreign currencies exposures. However, the nature and extent of use ofthese financial instruments to mitigate risks are limited to those allowed by the BSP for the ParentCompany and its subsidiaries.
153
VJNQUISIDO
Rectangle
- 47 -
*SGVFS032944*
To further mitigate risks throughout its different business units, the Parent Company formulates riskmanagement policies and continues to improve its existing policies. These policies further serve asthe framework and set of guidelines in the creation or revisions of operating policies and manuals foreach business unit. In the process design and implementation, preventive controls are preferred overdetection controls. Clear delineation of responsibilities and separation of incompatible duties amongofficers and staff, as well as, among business units are reiterated in these policies. To the extentpossible, reporting and accounting responsibilities are segregated from units directly involved inoperations and front line activities (i.e., players must not be scorers). This is to improve thecredibility and accuracy of management information. Any inconsistencies in the operating policiesand manuals with the risk framework created by the RMG are taken up and resolved in the ROC andManCom.
Based on the approved Operational Risk Assessment Program, RMG spearheaded the bankwide (allHead Office units and branches) risk identification and self-assessment process. This would enabledetermination of priority risk areas, assessment of mitigating controls in place, and institutionalizationof additional measures to ensure a controlled operating environment. RMG was also mandated tomaintain and update the Parent Company’s Centralized Loss Database wherein all reported incidentsof losses shall be encoded to enable assessment of weaknesses in the processes and come up withviable improvements to avoid recurrence.
Monitoring and controlling risks are primarily performed based on various limits and thresholdsestablished by the top management covering the Group’s transactions and dealings. These limits andthresholds reflect the Group’s business strategies and market environment, as well as, the levels ofrisks that the Group is willing to tolerate, with additional emphasis on selected industries. Inaddition, the Parent Company monitors and measures the overall risk-bearing capacity in relation tothe aggregate risk exposure across all risk types and activities.
Liquidity and interest rate risk exposures are measured and monitored through the MaximumCumulative Outflow and Earnings-at-Risk reports from the Asset and Liability Management (ALM)system. It was implemented in 2013 and was upgraded in 2017 to a new version which includemodules for calculating Liquidity Coverage Ratio (LCR) and Net Stable Funding Ratio (NSFR). Thesystem also has a Funds Transfer Pricing module used by the Treasury Group and Corporate PlanningGroup.
For the measurement of market risk exposures, the Bank uses Historical Simulation VaR approach forall treasury traded instruments, including fixed income bonds, foreign exchange swaps and forwards,interest rate swaps and equity securities. Market risk exposures are measured and monitored throughreports from the Market Risk Management System which has been implemented in 2017 to enhancerisk measurement and automate daily reporting.
BSP issued Circular No. 639 dated January 15, 2009 which mandated the use of the Internal CapitalAdequacy Assessment Process (ICAAP) by all universal and commercials banks to determine theirminimum required capital relative to their business risk exposures. In this regard, the Board approvedthe engagement of the services of a consultant to assist in the bank-wide implementation andembedding of the ICAAP, as provided for under Pillar 2 of Basel II and BSP Circular No. 639.
On April 5, 2018, the BOD approved the inclusion of cybersecurity as part of the priority risks relatedto Information Technology. This is in addition to the priority risks set in the 2009 Risk Self-assessment Survey and voting conducted among selected members of the BOD and SeniorManagement which were retained on the basis that there is no significant change in either thebusiness model of the Bank or its ownership structure. In addition, the BOD also approved thechanges in the trigger events for the review of Capital Ratios MAT and the retention of the
154
VJNQUISIDO
Rectangle
- 48 -
*SGVFS032944*
methodology for the CET1 ratio limit and the Management Action Trigger (MAT) on capital ratios.There were no changes made in the approved trigger events for the review of Priority Risks.
The Parent Company submitted its annually updated ICAAP document, in compliance with BSPrequirements on March 27, 2018. The document disclosed that the Parent Company has anappropriate level of internal capital relative to the Group’s risk profile.
For the ICAAP document submitted on March 27, 2018, the Parent Company retained the Pillar 1Plus approach using the Pillar 1 capital as the baseline. The process of allocating capital for all typesof risks above the Pillar 1 capital levels includes quantification of capital buffer for Pillar 2 risksunder normal business cycle/condition, in addition to the quantification based on the results of theIntegrated Stress Test (IST). The adoption of the IST allows the Parent Company to quantify itsoverall vulnerability to market shocks and operational losses in a collective manner driven by eventsrather than in silo. The capital assessment in the document discloses that the Group and the ParentCompany has appropriate and sufficient level of internal capital.
Credit Risk
Credit Risk and Concentration of Assets and Liabilities and Off-Balance Sheet ItemsCredit risk is the risk of financial loss on account of a counterparty to a financial product failing tohonor its obligation. The Group faces potential credit risks every time it extends funds to borrowers,commits funds to counterparties, guarantees the paying performance of its clients, invests funds toissuers (i.e., investment securities issued by either sovereign or corporate entities) or enters into eithermarket-traded or over-the-counter derivatives, through implied or actual contractual agreements (i.e.,on or off-balance sheet exposures). The Group manages its credit risk at various levels (i.e., strategiclevel, portfolio level down to individual credit or transaction).
The Group established risk limits and thresholds for purposes of monitoring and managing credit riskfrom individual counterparties and/or groups of counterparties, as well as major industries. It alsoconducts periodical assessment of the creditworthiness of its counterparties. In addition, the Groupobtains collateral where appropriate, enters into master netting agreements and collateralarrangements with counterparties, and limits the duration of exposures.
The Parent Company has four credit risk rating models in place: for corporate borrowers, for non-consumer individual borrowers and small & medium enterprises (SMEs), for financial institutions, forsovereign / country exposures. In addition, it also has three scoring models: for auto and housing loanapplicants, and for credit card applicants.
In compliance with BSP requirements, the Group established an internal Credit Risk Rating System(ICRRS) for the purpose of measuring credit risk for corporate borrowers in a consistent manner, asaccurately as possible, and thereafter uses the risk information for business and financial decisionmaking. The ICRRS covers corporate borrowers with total assets, total facilities, or total creditexposures amounting to P=15.00 million and above.
Further, the ICRRS was designed within the technical requirements defined under BSP CircularNo. 439. It has two components, namely: a) Borrower Risk Rating which provides an assessment ofthe creditworthiness of the borrower, without considering the proposed facility and securityarrangements, and b) Loan Exposure Ratio which provides an assessment of the proposed facilities asmitigated or enhanced by security arrangements. The ICRRS rating scale consists of ten grades, sixof which fall under unclassified accounts, with the remaining four falling under classified accounts inaccordance with regulatory provisioning guidelines.
155
VJNQUISIDO
Rectangle
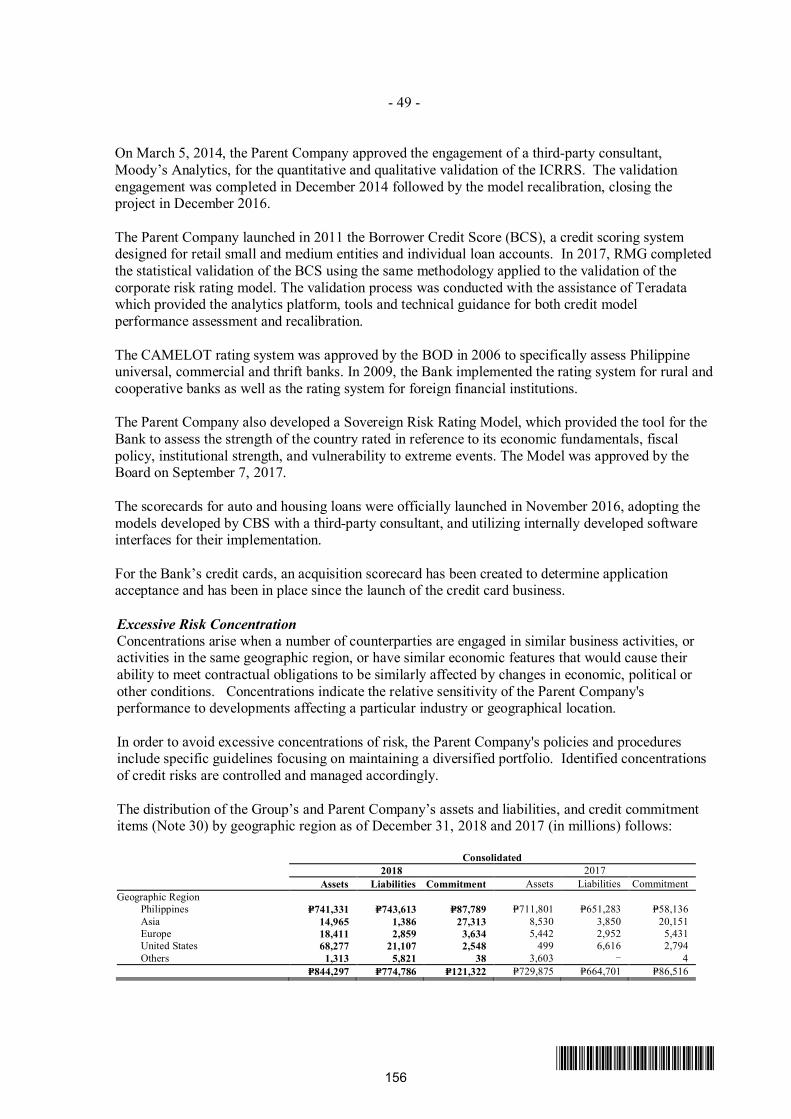
- 49 -
*SGVFS032944*
On March 5, 2014, the Parent Company approved the engagement of a third-party consultant,Moody’s Analytics, for the quantitative and qualitative validation of the ICRRS. The validationengagement was completed in December 2014 followed by the model recalibration, closing theproject in December 2016.
The Parent Company launched in 2011 the Borrower Credit Score (BCS), a credit scoring systemdesigned for retail small and medium entities and individual loan accounts. In 2017, RMG completedthe statistical validation of the BCS using the same methodology applied to the validation of thecorporate risk rating model. The validation process was conducted with the assistance of Teradatawhich provided the analytics platform, tools and technical guidance for both credit modelperformance assessment and recalibration.
The CAMELOT rating system was approved by the BOD in 2006 to specifically assess Philippineuniversal, commercial and thrift banks. In 2009, the Bank implemented the rating system for rural andcooperative banks as well as the rating system for foreign financial institutions.
The Parent Company also developed a Sovereign Risk Rating Model, which provided the tool for theBank to assess the strength of the country rated in reference to its economic fundamentals, fiscalpolicy, institutional strength, and vulnerability to extreme events. The Model was approved by theBoard on September 7, 2017.
The scorecards for auto and housing loans were officially launched in November 2016, adopting themodels developed by CBS with a third-party consultant, and utilizing internally developed softwareinterfaces for their implementation.
For the Bank’s credit cards, an acquisition scorecard has been created to determine applicationacceptance and has been in place since the launch of the credit card business.
Excessive Risk ConcentrationConcentrations arise when a number of counterparties are engaged in similar business activities, oractivities in the same geographic region, or have similar economic features that would cause theirability to meet contractual obligations to be similarly affected by changes in economic, political orother conditions. Concentrations indicate the relative sensitivity of the Parent Company'sperformance to developments affecting a particular industry or geographical location.
In order to avoid excessive concentrations of risk, the Parent Company's policies and proceduresinclude specific guidelines focusing on maintaining a diversified portfolio. Identified concentrationsof credit risks are controlled and managed accordingly.
The distribution of the Group’s and Parent Company’s assets and liabilities, and credit commitmentitems (Note 30) by geographic region as of December 31, 2018 and 2017 (in millions) follows:
Consolidated2018 2017
Assets Liabilities Commitment Assets Liabilities CommitmentGeographic Region
Philippines P=741,331 P=743,613 P=87,789 P=711,801 P=651,283 P=58,136Asia 14,965 1,386 27,313 8,530 3,850 20,151Europe 18,411 2,859 3,634 5,442 2,952 5,431United States 68,277 21,107 2,548 499 6,616 2,794Others 1,313 5,821 38 3,603 − 4
P=844,297 P=774,786 P=121,322 P=729,875 P=664,701 P=86,516
156
VJNQUISIDO
Rectangle
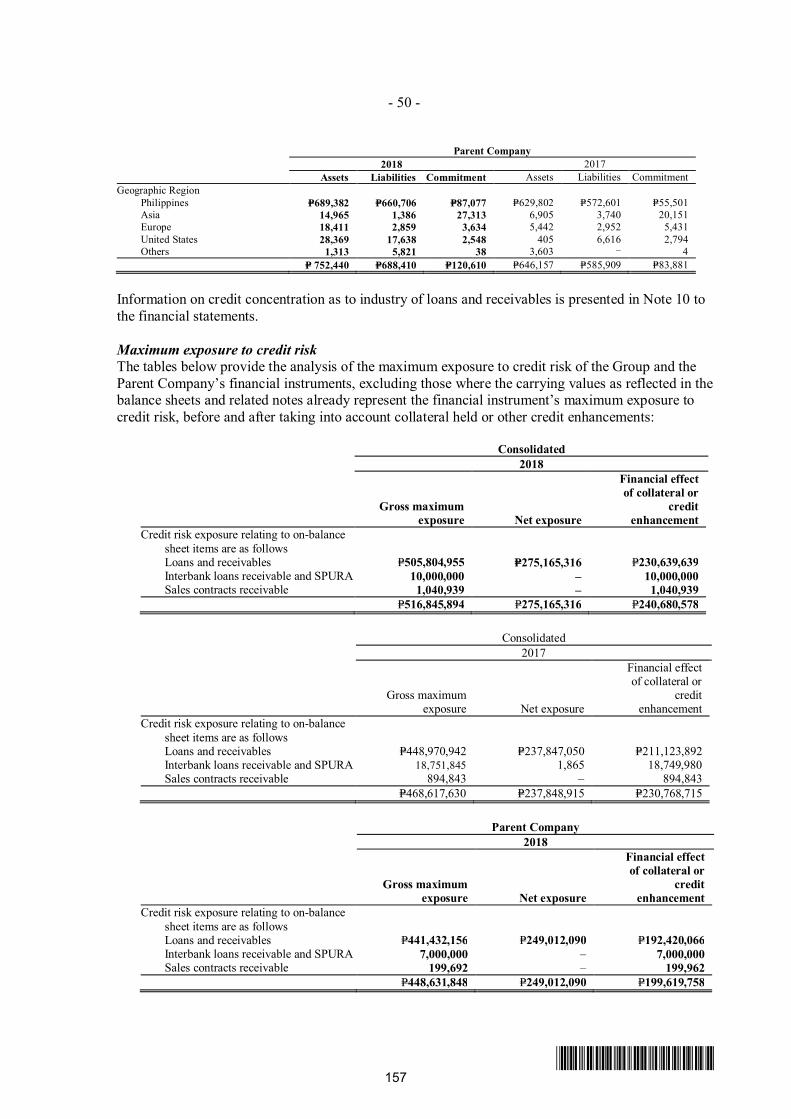
- 50 -
*SGVFS032944*
Parent Company2018 2017
Assets Liabilities Commitment Assets Liabilities CommitmentGeographic Region
Philippines P=689,382 P=660,706 P=87,077 P=629,802 P=572,601 P=55,501Asia 14,965 1,386 27,313 6,905 3,740 20,151Europe 18,411 2,859 3,634 5,442 2,952 5,431United States 28,369 17,638 2,548 405 6,616 2,794Others 1,313 5,821 38 3,603 − 4
P= 752,440 P=688,410 P=120,610 P=646,157 P=585,909 P=83,881
Information on credit concentration as to industry of loans and receivables is presented in Note 10 tothe financial statements.
Maximum exposure to credit riskThe tables below provide the analysis of the maximum exposure to credit risk of the Group and theParent Company’s financial instruments, excluding those where the carrying values as reflected in thebalance sheets and related notes already represent the financial instrument’s maximum exposure tocredit risk, before and after taking into account collateral held or other credit enhancements:
Consolidated2018
Gross maximumexposure Net exposure
Financial effectof collateral or
creditenhancement
Credit risk exposure relating to on-balancesheet items are as follows
Loans and receivables P=505,804,955 P=275,165,316 P=230,639,639 Interbank loans receivable and SPURA 10,000,000 – 10,000,000 Sales contracts receivable 1,040,939 – 1,040,939
P=516,845,894 P=275,165,316 P=240,680,578
Consolidated2017
Gross maximumexposure Net exposure
Financial effectof collateral or
creditenhancement
Credit risk exposure relating to on-balancesheet items are as follows
Loans and receivables P=448,970,942 P=237,847,050 P=211,123,892 Interbank loans receivable and SPURA 18,751,845 1,865 18,749,980 Sales contracts receivable 894,843 – 894,843
P=468,617,630 P=237,848,915 P=230,768,715
Parent Company2018
Gross maximumexposure Net exposure
Financial effectof collateral or
creditenhancement
Credit risk exposure relating to on-balancesheet items are as follows
Loans and receivables P=441,432,156 P=249,012,090 P=192,420,066 Interbank loans receivable and SPURA 7,000,000 – 7,000,000 Sales contracts receivable 199,692 – 199,962
P=448,631,848 P=249,012,090 P=199,619,758
157
VJNQUISIDO
Rectangle
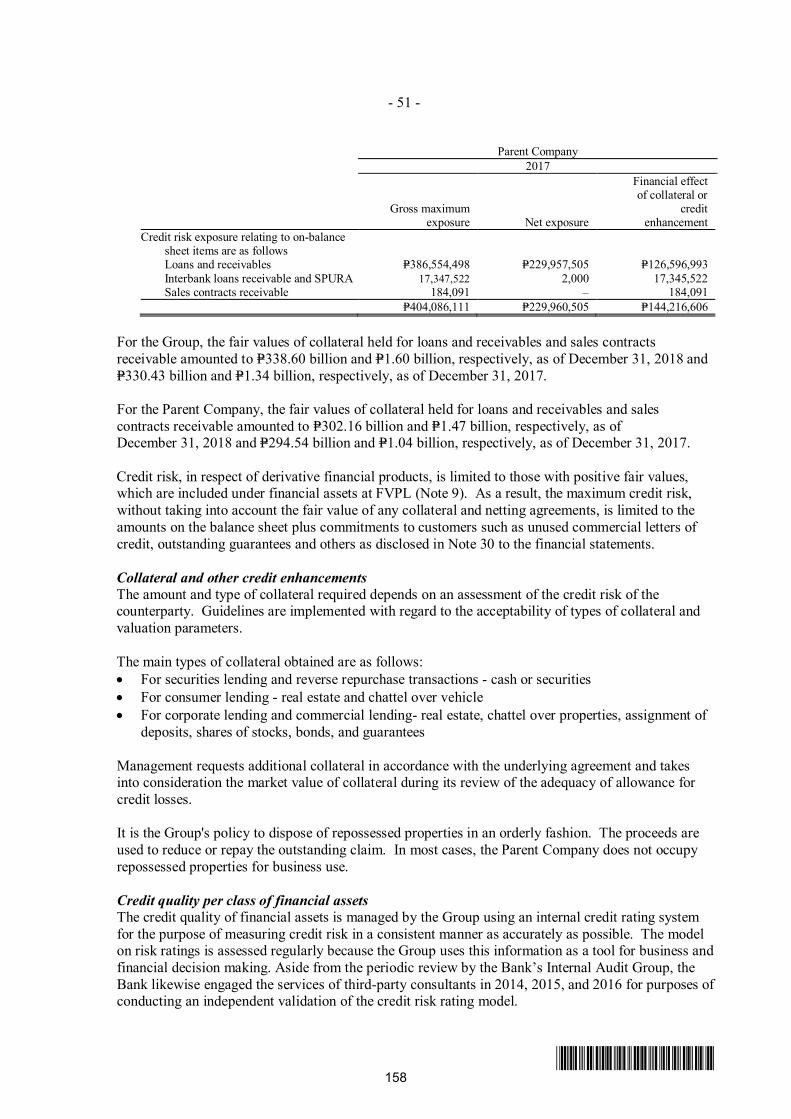
- 51 -
*SGVFS032944*
Parent Company2017
Gross maximumexposure Net exposure
Financial effectof collateral or
creditenhancement
Credit risk exposure relating to on-balancesheet items are as follows
Loans and receivables P=386,554,498 P=229,957,505 P=126,596,993 Interbank loans receivable and SPURA 17,347,522 2,000 17,345,522 Sales contracts receivable 184,091 – 184,091
P=404,086,111 P=229,960,505 P=144,216,606
For the Group, the fair values of collateral held for loans and receivables and sales contractsreceivable amounted to P=338.60 billion and P=1.60 billion, respectively, as of December 31, 2018 andP=330.43 billion and P=1.34 billion, respectively, as of December 31, 2017.
For the Parent Company, the fair values of collateral held for loans and receivables and salescontracts receivable amounted to P=302.16 billion and P=1.47 billion, respectively, as ofDecember 31, 2018 and P=294.54 billion and P=1.04 billion, respectively, as of December 31, 2017.
Credit risk, in respect of derivative financial products, is limited to those with positive fair values,which are included under financial assets at FVPL (Note 9). As a result, the maximum credit risk,without taking into account the fair value of any collateral and netting agreements, is limited to theamounts on the balance sheet plus commitments to customers such as unused commercial letters ofcredit, outstanding guarantees and others as disclosed in Note 30 to the financial statements.
Collateral and other credit enhancementsThe amount and type of collateral required depends on an assessment of the credit risk of thecounterparty. Guidelines are implemented with regard to the acceptability of types of collateral andvaluation parameters.
The main types of collateral obtained are as follows:∂ For securities lending and reverse repurchase transactions - cash or securities∂ For consumer lending - real estate and chattel over vehicle∂ For corporate lending and commercial lending- real estate, chattel over properties, assignment of
deposits, shares of stocks, bonds, and guarantees
Management requests additional collateral in accordance with the underlying agreement and takesinto consideration the market value of collateral during its review of the adequacy of allowance forcredit losses.
It is the Group's policy to dispose of repossessed properties in an orderly fashion. The proceeds areused to reduce or repay the outstanding claim. In most cases, the Parent Company does not occupyrepossessed properties for business use.
Credit quality per class of financial assetsThe credit quality of financial assets is managed by the Group using an internal credit rating systemfor the purpose of measuring credit risk in a consistent manner as accurately as possible. The modelon risk ratings is assessed regularly because the Group uses this information as a tool for business andfinancial decision making. Aside from the periodic review by the Bank’s Internal Audit Group, theBank likewise engaged the services of third-party consultants in 2014, 2015, and 2016 for purposes ofconducting an independent validation of the credit risk rating model.
158
VJNQUISIDO
Rectangle
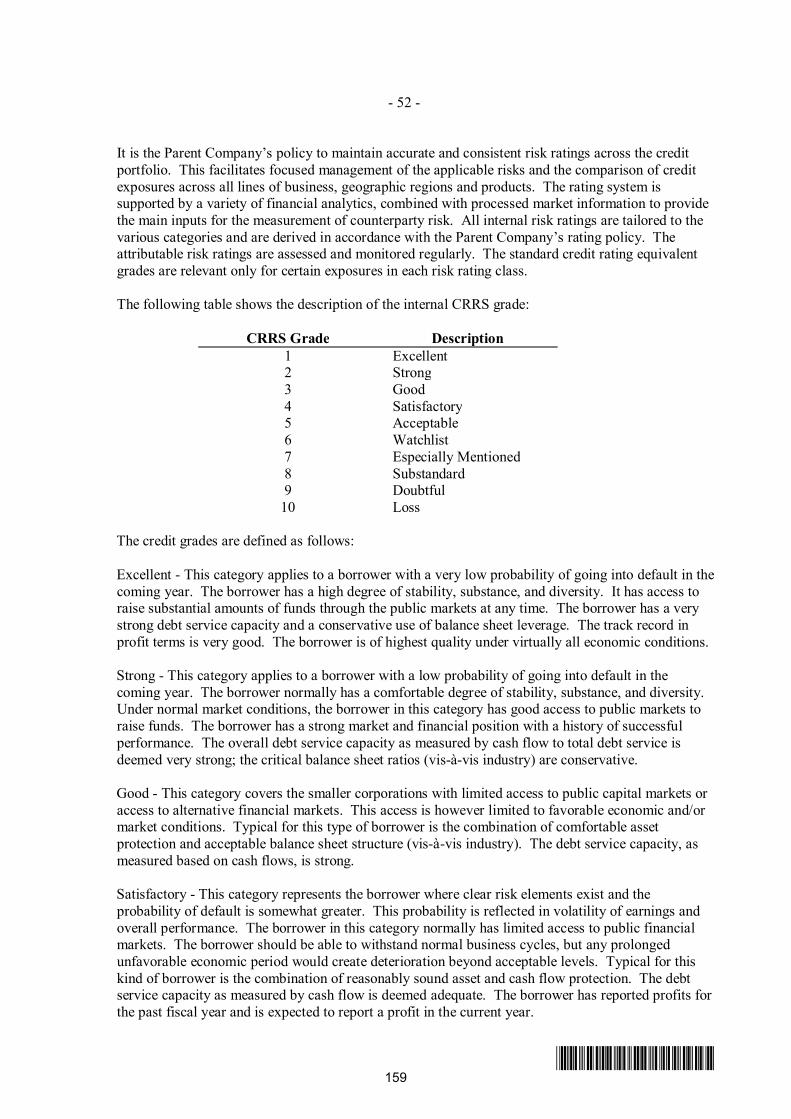
- 52 -
*SGVFS032944*
It is the Parent Company’s policy to maintain accurate and consistent risk ratings across the creditportfolio. This facilitates focused management of the applicable risks and the comparison of creditexposures across all lines of business, geographic regions and products. The rating system issupported by a variety of financial analytics, combined with processed market information to providethe main inputs for the measurement of counterparty risk. All internal risk ratings are tailored to thevarious categories and are derived in accordance with the Parent Company’s rating policy. Theattributable risk ratings are assessed and monitored regularly. The standard credit rating equivalentgrades are relevant only for certain exposures in each risk rating class.
The following table shows the description of the internal CRRS grade:
CRRS Grade Description1 Excellent2 Strong3 Good4 Satisfactory5 Acceptable6 Watchlist7 Especially Mentioned8 Substandard9 Doubtful
10 Loss
The credit grades are defined as follows:
Excellent - This category applies to a borrower with a very low probability of going into default in thecoming year. The borrower has a high degree of stability, substance, and diversity. It has access toraise substantial amounts of funds through the public markets at any time. The borrower has a verystrong debt service capacity and a conservative use of balance sheet leverage. The track record inprofit terms is very good. The borrower is of highest quality under virtually all economic conditions.
Strong - This category applies to a borrower with a low probability of going into default in thecoming year. The borrower normally has a comfortable degree of stability, substance, and diversity.Under normal market conditions, the borrower in this category has good access to public markets toraise funds. The borrower has a strong market and financial position with a history of successfulperformance. The overall debt service capacity as measured by cash flow to total debt service isdeemed very strong; the critical balance sheet ratios (vis-à-vis industry) are conservative.
Good - This category covers the smaller corporations with limited access to public capital markets oraccess to alternative financial markets. This access is however limited to favorable economic and/ormarket conditions. Typical for this type of borrower is the combination of comfortable assetprotection and acceptable balance sheet structure (vis-à-vis industry). The debt service capacity, asmeasured based on cash flows, is strong.
Satisfactory - This category represents the borrower where clear risk elements exist and theprobability of default is somewhat greater. This probability is reflected in volatility of earnings andoverall performance. The borrower in this category normally has limited access to public financialmarkets. The borrower should be able to withstand normal business cycles, but any prolongedunfavorable economic period would create deterioration beyond acceptable levels. Typical for thiskind of borrower is the combination of reasonably sound asset and cash flow protection. The debtservice capacity as measured by cash flow is deemed adequate. The borrower has reported profits forthe past fiscal year and is expected to report a profit in the current year.
159
VJNQUISIDO
Rectangle
- 53 -
*SGVFS032944*
Acceptable - The risk elements for the Parent Company are sufficiently pronounced, although theborrower should still be able to withstand normal business cycles. Any prolonged unfavorableeconomic and/or market period would create an immediate deterioration beyond acceptable levels.
Watchlist - This category represents the borrower for which unfavorable industry or company-specific risk factors represent a concern. Operating performance and financial strength may bemarginal and it is uncertain whether the borrower can attract alternative sources of financing. Theborrower will find it very hard to cope with any significant economic downturn and a default in sucha case is more than a possibility. It includes the borrower where the credit exposure is not a risk ofloss at the moment, but the performance of the borrower has weakened, and unless present trends arereversed, could lead to losses.
Especially Mentioned - This category applies to the borrower that is characterized by a reasonableprobability of default, manifested by some or all the following: (a) evidence of weakness in theborrower’s financial condition or creditworthiness; (b) unacceptable risk is generated by potential oremerging weaknesses as far as asset protection and/or cash flow is concerned; (c) the borrower hasreached a point where there is a real risk that the borrower’s ability to pay the interest and repay theprincipal timely could be jeopardized; (d) the borrower is expected to have financial difficulties andexposure may be at risk. Closer account management attention is warranted.
Concerted efforts should be made to improve lender’s position (e.g., demanding additional collateralor reduction of account exposure). These potential weaknesses, if left uncorrected or unmitigated,would affect the repayment of the loan and, thus, increase credit risk to the Parent Company.
Substandard - This category represents the borrower where one or more of the following factorsapply: (a) the collection of principal or interest becomes questionable regardless of scheduledpayment date, by reason of adverse developments on account of a financial, managerial, economic, orpolitical nature, or by important weaknesses in cover; (b) the probability of default is assessed at up to50%. Substandard loans are loans or portions thereof which appear to involve a substantial andunreasonable degree of risk to the Parent Company because of unfavorable record or unsatisfactorycharacteristics. There exists in such loans the possibility of future loss to the Parent Company unlessgiven closer supervision.
Doubtful - This category includes the borrower with “non-performing loan” status or with any portionof interest and/or principal payment is in arrears for more than ninety (90) days. The borrower isunable or unwilling to service debt over an extended period of time and near future prospects oforderly debt service is doubtful. Doubtful loans are loans or portions thereof which have theweaknesses inherent in those classified as “Substandard”, with the added characteristics that existingfacts, conditions, and values make collection or liquidation in full highly improbable and in whichsubstantial loss is probable.
Loss - This category represents the borrower whose prospect for re-establishment of creditworthinessand debt service is remote. It also applies where the Parent Company will take or has taken title tothe assets of the borrower and is preparing a foreclosure and/or liquidation of the borrower’s business.These are loans or portions thereof which are considered uncollectible or worthless and of such littlevalue that their continuance as bankable assets is not warranted although the loans may have somerecovery or salvage value.
160
VJNQUISIDO
Rectangle
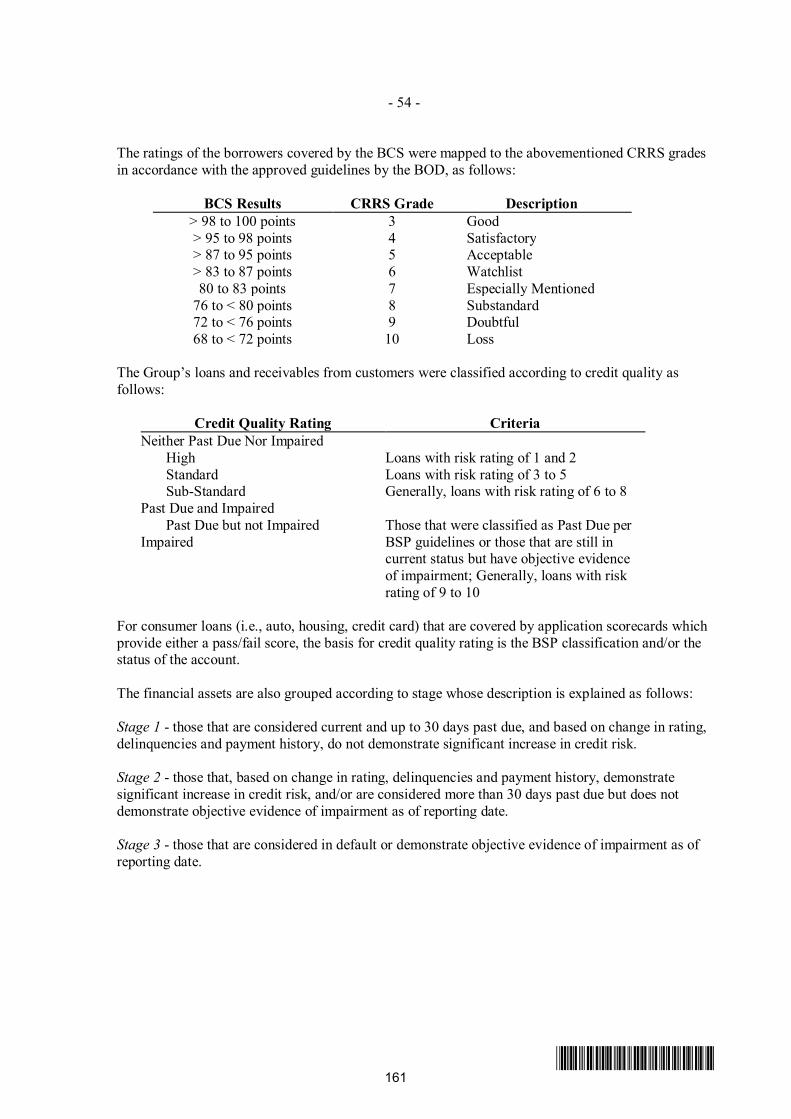
- 54 -
*SGVFS032944*
The ratings of the borrowers covered by the BCS were mapped to the abovementioned CRRS gradesin accordance with the approved guidelines by the BOD, as follows:
BCS Results CRRS Grade Description> 98 to 100 points 3 Good> 95 to 98 points 4 Satisfactory> 87 to 95 points 5 Acceptable> 83 to 87 points 6 Watchlist80 to 83 points 7 Especially Mentioned
76 to < 80 points 8 Substandard72 to < 76 points 9 Doubtful68 to < 72 points 10 Loss
The Group’s loans and receivables from customers were classified according to credit quality asfollows:
Credit Quality Rating CriteriaNeither Past Due Nor Impaired
High Loans with risk rating of 1 and 2Standard Loans with risk rating of 3 to 5Sub-Standard Generally, loans with risk rating of 6 to 8
Past Due and ImpairedPast Due but not Impaired Those that were classified as Past Due per
BSP guidelines or those that are still incurrent status but have objective evidenceof impairment; Generally, loans with riskrating of 9 to 10
Impaired
For consumer loans (i.e., auto, housing, credit card) that are covered by application scorecards whichprovide either a pass/fail score, the basis for credit quality rating is the BSP classification and/or thestatus of the account.
The financial assets are also grouped according to stage whose description is explained as follows:
Stage 1 - those that are considered current and up to 30 days past due, and based on change in rating,delinquencies and payment history, do not demonstrate significant increase in credit risk.
Stage 2 - those that, based on change in rating, delinquencies and payment history, demonstratesignificant increase in credit risk, and/or are considered more than 30 days past due but does notdemonstrate objective evidence of impairment as of reporting date.
Stage 3 - those that are considered in default or demonstrate objective evidence of impairment as ofreporting date.
161
VJNQUISIDO
Rectangle
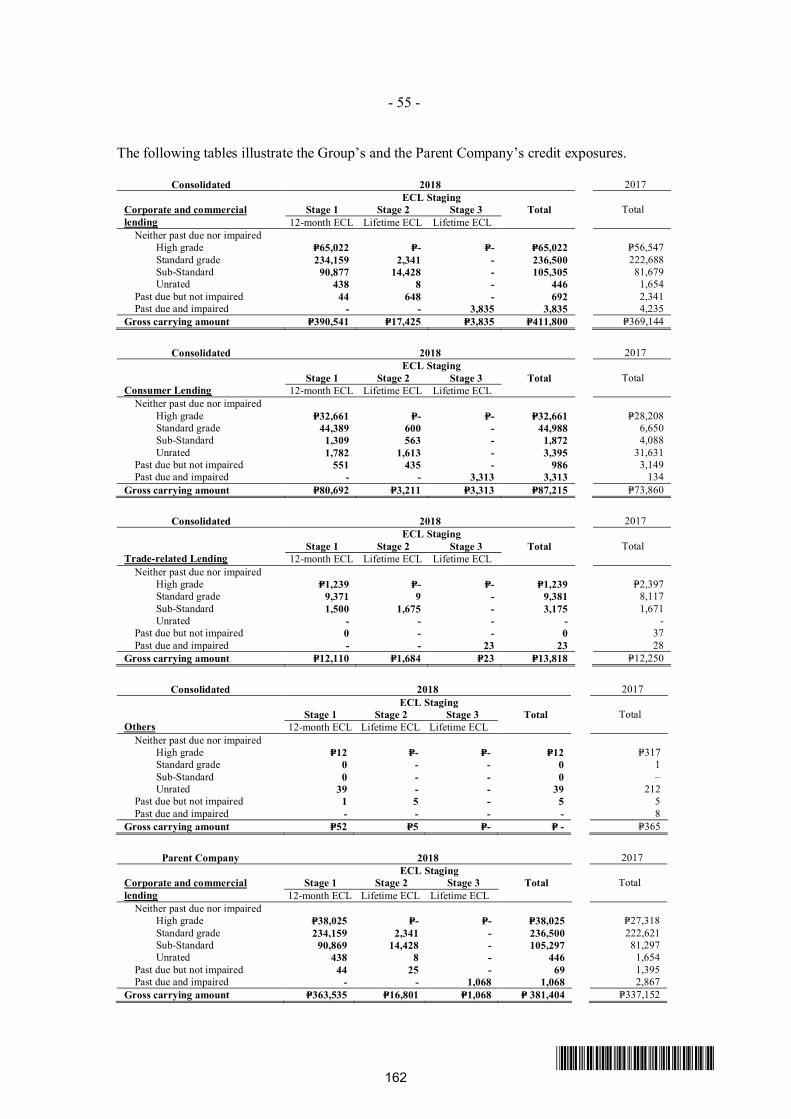
- 55 -
*SGVFS032944*
The following tables illustrate the Group’s and the Parent Company’s credit exposures.
Consolidated 2018 2017 ECL Staging
Corporate and commerciallending
Stage 1 Stage 2 Stage 3 Total Total 12-month ECL Lifetime ECL Lifetime ECL
Neither past due nor impairedHigh grade P=65,022 P=- P=- P=65,022 P=56,547Standard grade 234,159 2,341 - 236,500 222,688Sub-Standard 90,877 14,428 - 105,305 81,679Unrated 438 8 - 446 1,654
Past due but not impaired 44 648 - 692 2,341Past due and impaired - - 3,835 3,835 4,235
Gross carrying amount P=390,541 P=17,425 P=3,835 P=411,800 P=369,144
Consolidated 2018 2017 ECL Staging
Consumer Lending Stage 1 Stage 2 Stage 3 Total Total
12-month ECL Lifetime ECL Lifetime ECLNeither past due nor impaired
High grade P=32,661 P=- P=- P=32,661 P=28,208Standard grade 44,389 600 - 44,988 6,650Sub-Standard 1,309 563 - 1,872 4,088Unrated 1,782 1,613 - 3,395 31,631
Past due but not impaired 551 435 - 986 3,149Past due and impaired - - 3,313 3,313 134
Gross carrying amount P=80,692 P=3,211 P=3,313 P=87,215 P=73,860
Consolidated 2018 2017 ECL Staging
Trade-related Lending Stage 1 Stage 2 Stage 3 Total Total
12-month ECL Lifetime ECL Lifetime ECLNeither past due nor impaired
High grade P=1,239 P=- P=- P=1,239 P=2,397Standard grade 9,371 9 - 9,381 8,117Sub-Standard 1,500 1,675 - 3,175 1,671Unrated - - - - -
Past due but not impaired 0 - - 0 37Past due and impaired - - 23 23 28
Gross carrying amount P=12,110 P=1,684 P=23 P=13,818 P=12,250
Consolidated 2018 2017 ECL Staging
Others Stage 1 Stage 2 Stage 3 Total Total
12-month ECL Lifetime ECL Lifetime ECLNeither past due nor impaired
High grade P=12 P=- P=- P=12 P=317Standard grade 0 - - 0 1Sub-Standard 0 - - 0 –Unrated 39 - - 39 212
Past due but not impaired 1 5 - 5 5Past due and impaired - - - - 8
Gross carrying amount P=52 P=5 P=- P= - P=365
Parent Company 2018 2017 ECL Staging
Corporate and commerciallending
Stage 1 Stage 2 Stage 3 Total Total 12-month ECL Lifetime ECL Lifetime ECL
Neither past due nor impairedHigh grade P=38,025 P=- P=- P=38,025 P=27,318Standard grade 234,159 2,341 - 236,500 222,621Sub-Standard 90,869 14,428 - 105,297 81,297Unrated 438 8 - 446 1,654
Past due but not impaired 44 25 - 69 1,395Past due and impaired - - 1,068 1,068 2,867
Gross carrying amount P=363,535 P=16,801 P=1,068 P= 381,404 P=337,152
162
VJNQUISIDO
Rectangle
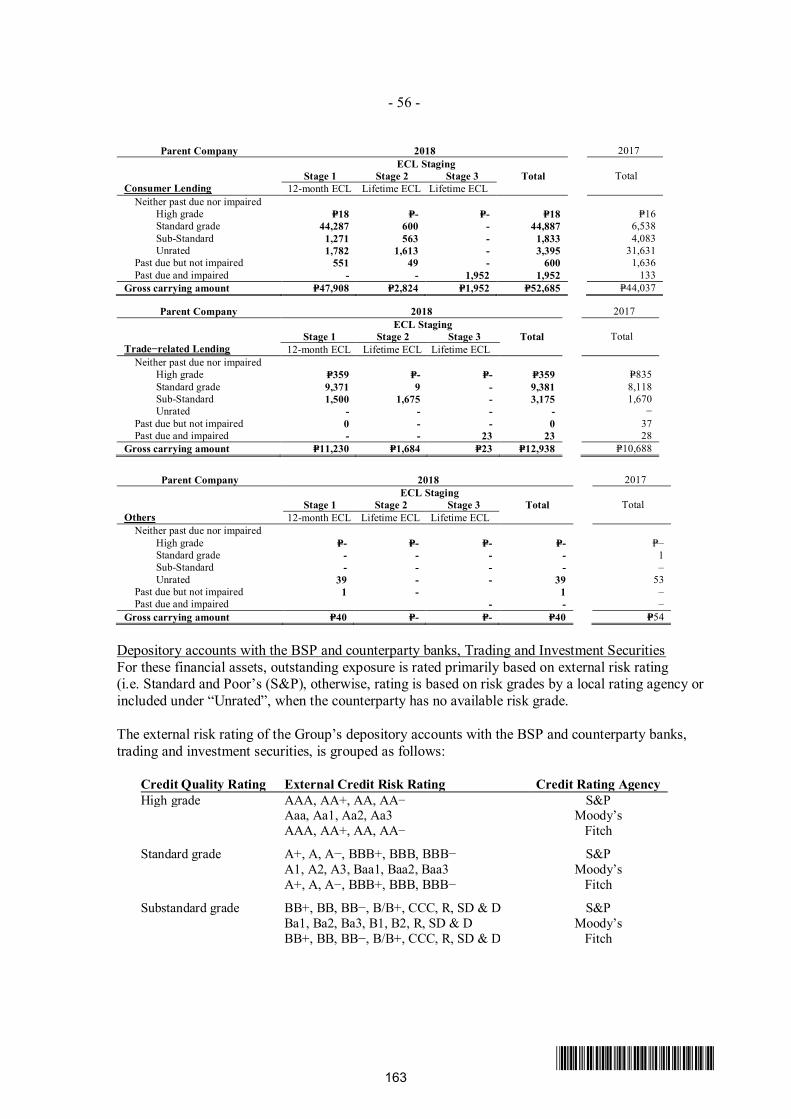
- 56 -
*SGVFS032944*
Parent Company 2018 2017 ECL Staging
Consumer Lending Stage 1 Stage 2 Stage 3 Total Total
12-month ECL Lifetime ECL Lifetime ECLNeither past due nor impaired
High grade P=18 P=- P=- P=18 P=16Standard grade 44,287 600 - 44,887 6,538Sub-Standard 1,271 563 - 1,833 4,083Unrated 1,782 1,613 - 3,395 31,631
Past due but not impaired 551 49 - 600 1,636Past due and impaired - - 1,952 1,952 133
Gross carrying amount P=47,908 P=2,824 P=1,952 P=52,685 P=44,037
Parent Company 2018 2017 ECL Staging
Trade−related Lending Stage 1 Stage 2 Stage 3 Total Total
12-month ECL Lifetime ECL Lifetime ECLNeither past due nor impaired
High grade P=359 P=- P=- P=359 P=835Standard grade 9,371 9 - 9,381 8,118Sub-Standard 1,500 1,675 - 3,175 1,670Unrated - - - - −
Past due but not impaired 0 - - 0 37Past due and impaired - - 23 23 28
Gross carrying amount P=11,230 P=1,684 P=23 P=12,938 P=10,688
Parent Company 2018 2017 ECL Staging
Others Stage 1 Stage 2 Stage 3 Total Total
12-month ECL Lifetime ECL Lifetime ECLNeither past due nor impaired
High grade P=- P=- P=- P=- P=–Standard grade - - - - 1Sub-Standard - - - - –Unrated 39 - - 39 53
Past due but not impaired 1 - 1 –Past due and impaired - - –
Gross carrying amount P=40 P=- P=- P=40 P=54
Depository accounts with the BSP and counterparty banks, Trading and Investment SecuritiesFor these financial assets, outstanding exposure is rated primarily based on external risk rating(i.e. Standard and Poor’s (S&P), otherwise, rating is based on risk grades by a local rating agency orincluded under “Unrated”, when the counterparty has no available risk grade.
The external risk rating of the Group’s depository accounts with the BSP and counterparty banks,trading and investment securities, is grouped as follows:
Credit Quality Rating External Credit Risk Rating Credit Rating AgencyHigh grade AAA, AA+, AA, AA− S&P
Aaa, Aa1, Aa2, Aa3 Moody’sAAA, AA+, AA, AA− Fitch
Standard grade A+, A, A−, BBB+, BBB, BBB− S&PA1, A2, A3, Baa1, Baa2, Baa3 Moody’sA+, A, A−, BBB+, BBB, BBB− Fitch
Substandard grade BB+, BB, BB−, B/B+, CCC, R, SD & D S&PBa1, Ba2, Ba3, B1, B2, R, SD & D Moody’sBB+, BB, BB−, B/B+, CCC, R, SD & D Fitch
163
VJNQUISIDO
Rectangle
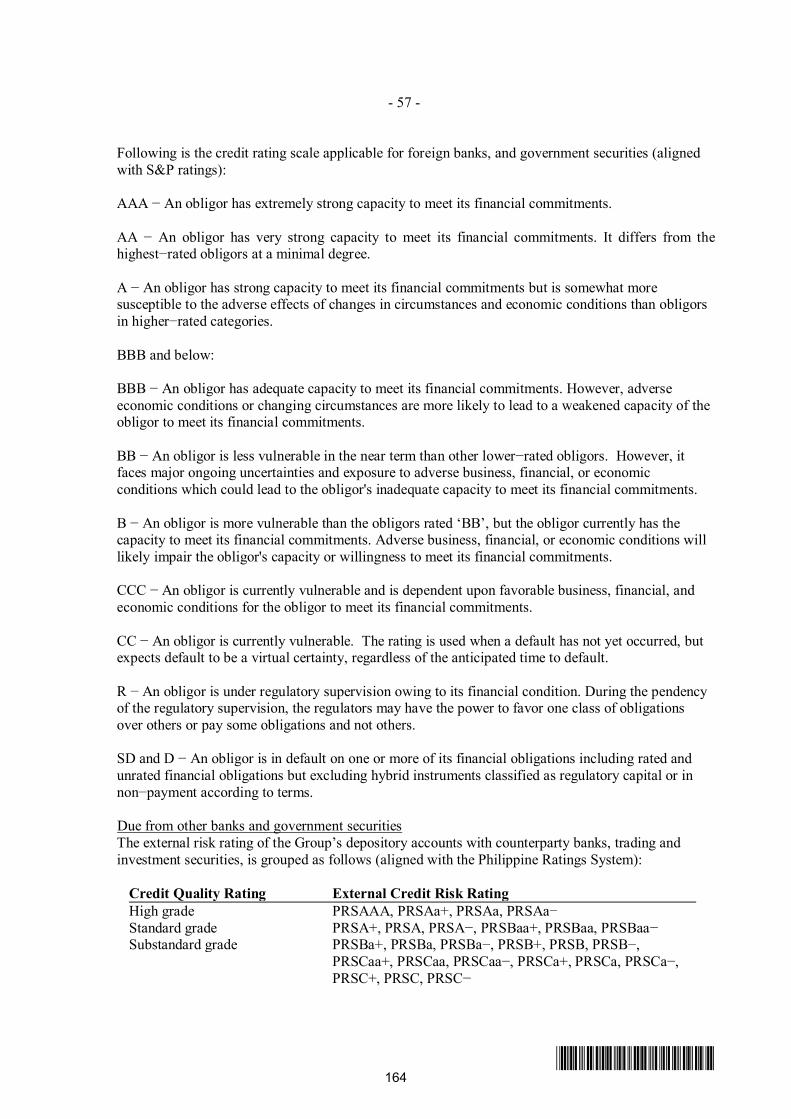
- 57 -
*SGVFS032944*
Following is the credit rating scale applicable for foreign banks, and government securities (alignedwith S&P ratings):
AAA − An obligor has extremely strong capacity to meet its financial commitments.
AA − An obligor has very strong capacity to meet its financial commitments. It differs from thehighest−rated obligors at a minimal degree.
A − An obligor has strong capacity to meet its financial commitments but is somewhat moresusceptible to the adverse effects of changes in circumstances and economic conditions than obligorsin higher−rated categories.
BBB and below:
BBB − An obligor has adequate capacity to meet its financial commitments. However, adverseeconomic conditions or changing circumstances are more likely to lead to a weakened capacity of theobligor to meet its financial commitments.
BB − An obligor is less vulnerable in the near term than other lower−rated obligors. However, itfaces major ongoing uncertainties and exposure to adverse business, financial, or economicconditions which could lead to the obligor's inadequate capacity to meet its financial commitments.
B − An obligor is more vulnerable than the obligors rated ‘BB’, but the obligor currently has thecapacity to meet its financial commitments. Adverse business, financial, or economic conditions willlikely impair the obligor's capacity or willingness to meet its financial commitments.
CCC − An obligor is currently vulnerable and is dependent upon favorable business, financial, andeconomic conditions for the obligor to meet its financial commitments.
CC − An obligor is currently vulnerable. The rating is used when a default has not yet occurred, butexpects default to be a virtual certainty, regardless of the anticipated time to default.
R − An obligor is under regulatory supervision owing to its financial condition. During the pendencyof the regulatory supervision, the regulators may have the power to favor one class of obligationsover others or pay some obligations and not others.
SD and D − An obligor is in default on one or more of its financial obligations including rated andunrated financial obligations but excluding hybrid instruments classified as regulatory capital or innon−payment according to terms.
Due from other banks and government securitiesThe external risk rating of the Group’s depository accounts with counterparty banks, trading andinvestment securities, is grouped as follows (aligned with the Philippine Ratings System):
Credit Quality Rating External Credit Risk RatingHigh grade PRSAAA, PRSAa+, PRSAa, PRSAa−Standard grade PRSA+, PRSA, PRSA−, PRSBaa+, PRSBaa, PRSBaa−Substandard grade PRSBa+, PRSBa, PRSBa−, PRSB+, PRSB, PRSB−,
PRSCaa+, PRSCaa, PRSCaa−, PRSCa+, PRSCa, PRSCa−,PRSC+, PRSC, PRSC−
164
VJNQUISIDO
Rectangle
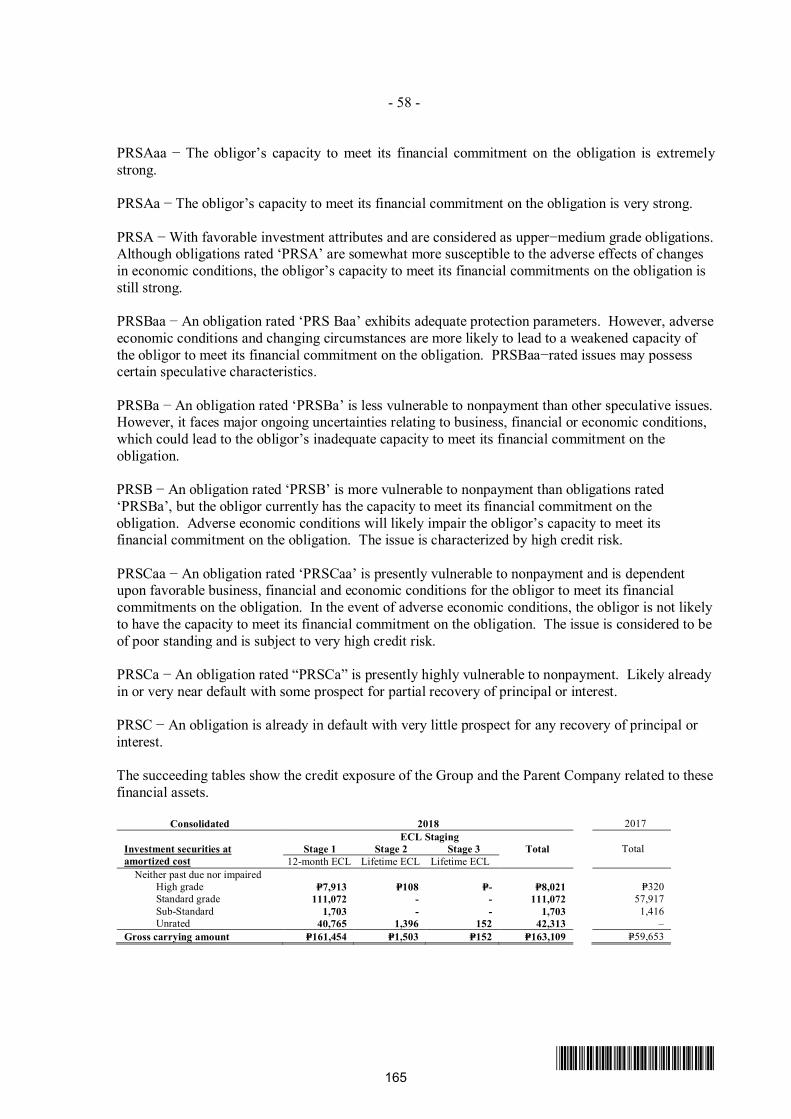
- 58 -
*SGVFS032944*
PRSAaa − The obligor’s capacity to meet its financial commitment on the obligation is extremelystrong.
PRSAa − The obligor’s capacity to meet its financial commitment on the obligation is very strong.
PRSA − With favorable investment attributes and are considered as upper−medium grade obligations.Although obligations rated ‘PRSA’ are somewhat more susceptible to the adverse effects of changesin economic conditions, the obligor’s capacity to meet its financial commitments on the obligation isstill strong.
PRSBaa − An obligation rated ‘PRS Baa’ exhibits adequate protection parameters. However, adverseeconomic conditions and changing circumstances are more likely to lead to a weakened capacity ofthe obligor to meet its financial commitment on the obligation. PRSBaa−rated issues may possesscertain speculative characteristics.
PRSBa − An obligation rated ‘PRSBa’ is less vulnerable to nonpayment than other speculative issues.However, it faces major ongoing uncertainties relating to business, financial or economic conditions,which could lead to the obligor’s inadequate capacity to meet its financial commitment on theobligation.
PRSB − An obligation rated ‘PRSB’ is more vulnerable to nonpayment than obligations rated‘PRSBa’, but the obligor currently has the capacity to meet its financial commitment on theobligation. Adverse economic conditions will likely impair the obligor’s capacity to meet itsfinancial commitment on the obligation. The issue is characterized by high credit risk.
PRSCaa − An obligation rated ‘PRSCaa’ is presently vulnerable to nonpayment and is dependentupon favorable business, financial and economic conditions for the obligor to meet its financialcommitments on the obligation. In the event of adverse economic conditions, the obligor is not likelyto have the capacity to meet its financial commitment on the obligation. The issue is considered to beof poor standing and is subject to very high credit risk.
PRSCa − An obligation rated “PRSCa” is presently highly vulnerable to nonpayment. Likely alreadyin or very near default with some prospect for partial recovery of principal or interest.
PRSC − An obligation is already in default with very little prospect for any recovery of principal orinterest.
The succeeding tables show the credit exposure of the Group and the Parent Company related to thesefinancial assets.
Consolidated 2018 2017 ECL Staging
Investment securities atamortized cost
Stage 1 Stage 2 Stage 3 Total Total 12-month ECL Lifetime ECL Lifetime ECL
Neither past due nor impairedHigh grade P=7,913 P=108 P=- P=8,021 P=320Standard grade 111,072 - - 111,072 57,917Sub-Standard 1,703 - - 1,703 1,416Unrated 40,765 1,396 152 42,313 –
Gross carrying amount P=161,454 P=1,503 P=152 P=163,109 P=59,653
165
VJNQUISIDO
Rectangle
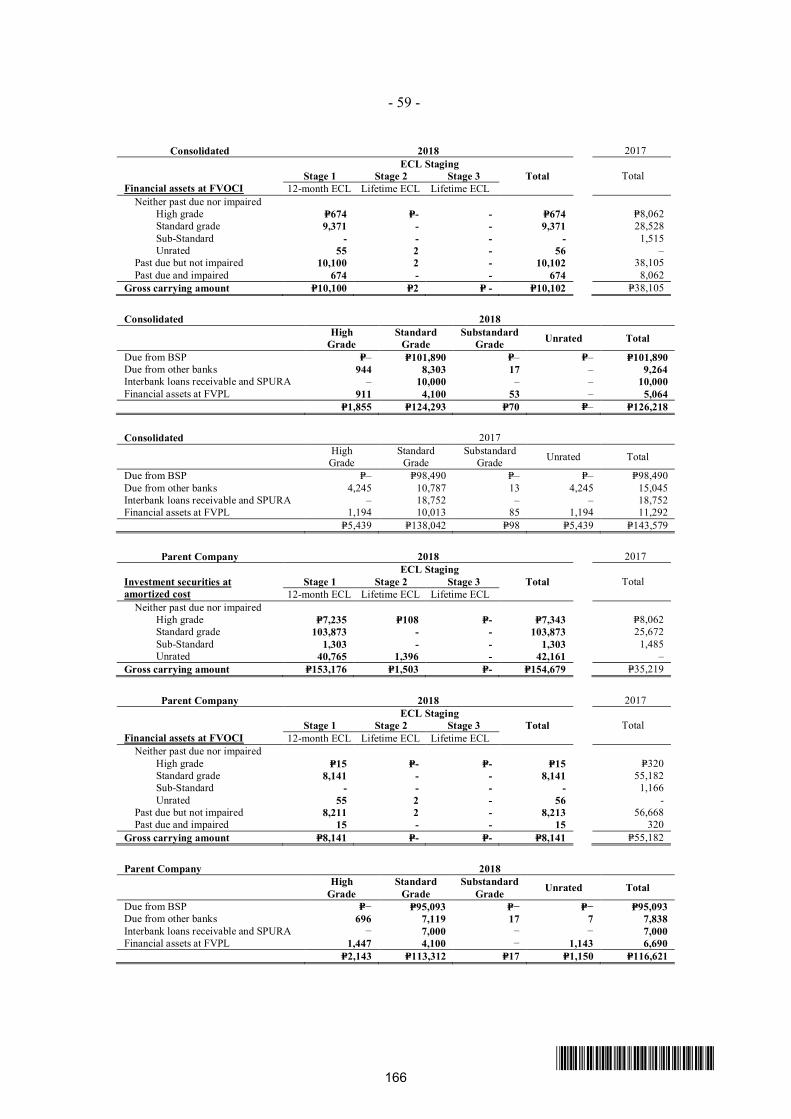
- 59 -
*SGVFS032944*
Consolidated 2018 2017 ECL Staging
Financial assets at FVOCI Stage 1 Stage 2 Stage 3 Total Total
12-month ECL Lifetime ECL Lifetime ECLNeither past due nor impaired
High grade P=674 P=- - P=674 P=8,062Standard grade 9,371 - - 9,371 28,528Sub-Standard - - - - 1,515Unrated 55 2 - 56 –
Past due but not impaired 10,100 2 - 10,102 38,105Past due and impaired 674 - - 674 8,062
Gross carrying amount P=10,100 P=2 P= - P=10,102 P=38,105
Consolidated 2018High
GradeStandard
GradeSubstandard
Grade Unrated Total
Due from BSP P=– P=101,890 P=– P=– P=101,890Due from other banks 944 8,303 17 – 9,264Interbank loans receivable and SPURA – 10,000 – – 10,000Financial assets at FVPL 911 4,100 53 – 5,064
P=1,855 P=124,293 P=70 P=– P=126,218
Consolidated 2017HighGrade
StandardGrade
SubstandardGrade Unrated Total
Due from BSP P=– P=98,490 P=– P=– P=98,490Due from other banks 4,245 10,787 13 4,245 15,045Interbank loans receivable and SPURA – 18,752 – – 18,752Financial assets at FVPL 1,194 10,013 85 1,194 11,292
P=5,439 P=138,042 P=98 P=5,439 P=143,579
Parent Company 2018 2017 ECL Staging
Investment securities atamortized cost
Stage 1 Stage 2 Stage 3 Total Total 12-month ECL Lifetime ECL Lifetime ECL
Neither past due nor impairedHigh grade P=7,235 P=108 P=- P=7,343 P=8,062Standard grade 103,873 - - 103,873 25,672Sub-Standard 1,303 - - 1,303 1,485Unrated 40,765 1,396 - 42,161 –
Gross carrying amount P=153,176 P=1,503 P=- P=154,679 P=35,219
Parent Company 2018 2017 ECL Staging
Financial assets at FVOCI Stage 1 Stage 2 Stage 3 Total Total
12-month ECL Lifetime ECL Lifetime ECLNeither past due nor impaired
High grade P=15 P=- P=- P=15 P=320Standard grade 8,141 - - 8,141 55,182Sub-Standard - - - - 1,166Unrated 55 2 - 56 -
Past due but not impaired 8,211 2 - 8,213 56,668Past due and impaired 15 - - 15 320
Gross carrying amount P=8,141 P=- P=- P=8,141 P=55,182
Parent Company 2018High
GradeStandard
GradeSubstandard
Grade Unrated Total
Due from BSP P=− P=95,093 P=− P=− P=95,093Due from other banks 696 7,119 17 7 7,838Interbank loans receivable and SPURA − 7,000 − − 7,000Financial assets at FVPL 1,447 4,100 − 1,143 6,690
P=2,143 P=113,312 P=17 P=1,150 P=116,621
166
VJNQUISIDO
Rectangle
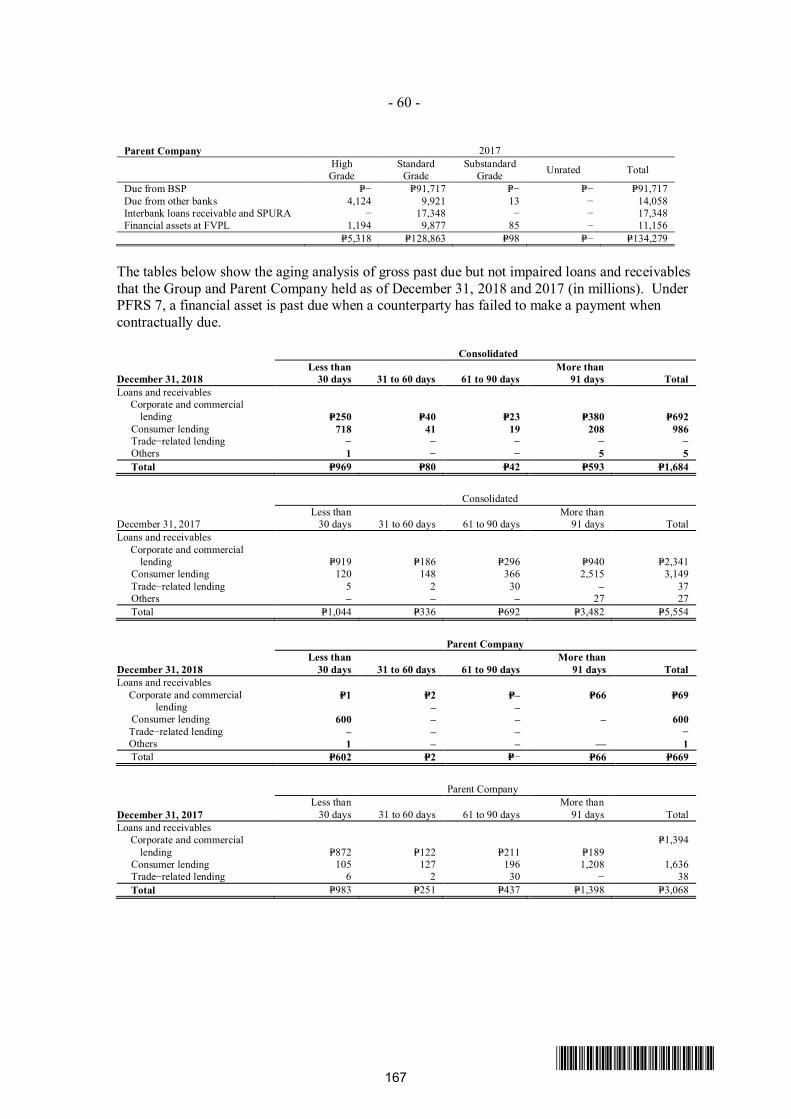
- 60 -
*SGVFS032944*
Parent Company 2017HighGrade
StandardGrade
SubstandardGrade Unrated Total
Due from BSP P=− P=91,717 P=− P=− P=91,717Due from other banks 4,124 9,921 13 − 14,058Interbank loans receivable and SPURA − 17,348 − − 17,348Financial assets at FVPL 1,194 9,877 85 − 11,156
P=5,318 P=128,863 P=98 P=− P=134,279
The tables below show the aging analysis of gross past due but not impaired loans and receivablesthat the Group and Parent Company held as of December 31, 2018 and 2017 (in millions). UnderPFRS 7, a financial asset is past due when a counterparty has failed to make a payment whencontractually due.
Consolidated
December 31, 2018Less than
30 days 31 to 60 days 61 to 90 daysMore than
91 days TotalLoans and receivables
Corporate and commerciallending P=250 P=40 P=23 P=380 P=692
Consumer lending 718 41 19 208 986Trade−related lending − − − − −Others 1 − − 5 5
Total P=969 P=80 P=42 P=593 P=1,684
Consolidated
December 31, 2017Less than
30 days 31 to 60 days 61 to 90 daysMore than
91 days TotalLoans and receivables
Corporate and commerciallending P=919 P=186 P=296 P=940 P=2,341
Consumer lending 120 148 366 2,515 3,149Trade−related lending 5 2 30 – 37Others – – – 27 27
Total P=1,044 P=336 P=692 P=3,482 P=5,554
Parent Company
December 31, 2018Less than
30 days 31 to 60 days 61 to 90 daysMore than
91 days TotalLoans and receivables
Corporate and commercial P=1 P=2 P=– P=66 P=69 lending – – Consumer lending 600 – – – 600Trade−related lendingOthers
–1
––
–– ––
−1
Total P=602 P=2 P=− P=66 P=669
Parent Company
December 31, 2017Less than
30 days 31 to 60 days 61 to 90 daysMore than
91 days TotalLoans and receivables
Corporate and commerciallending P=872 P=122 P=211 P=189
P=1,394
Consumer lending 105 127 196 1,208 1,636Trade−related lending 6 2 30 − 38
Total P=983 P=251 P=437 P=1,398 P=3,068
167
VJNQUISIDO
Rectangle
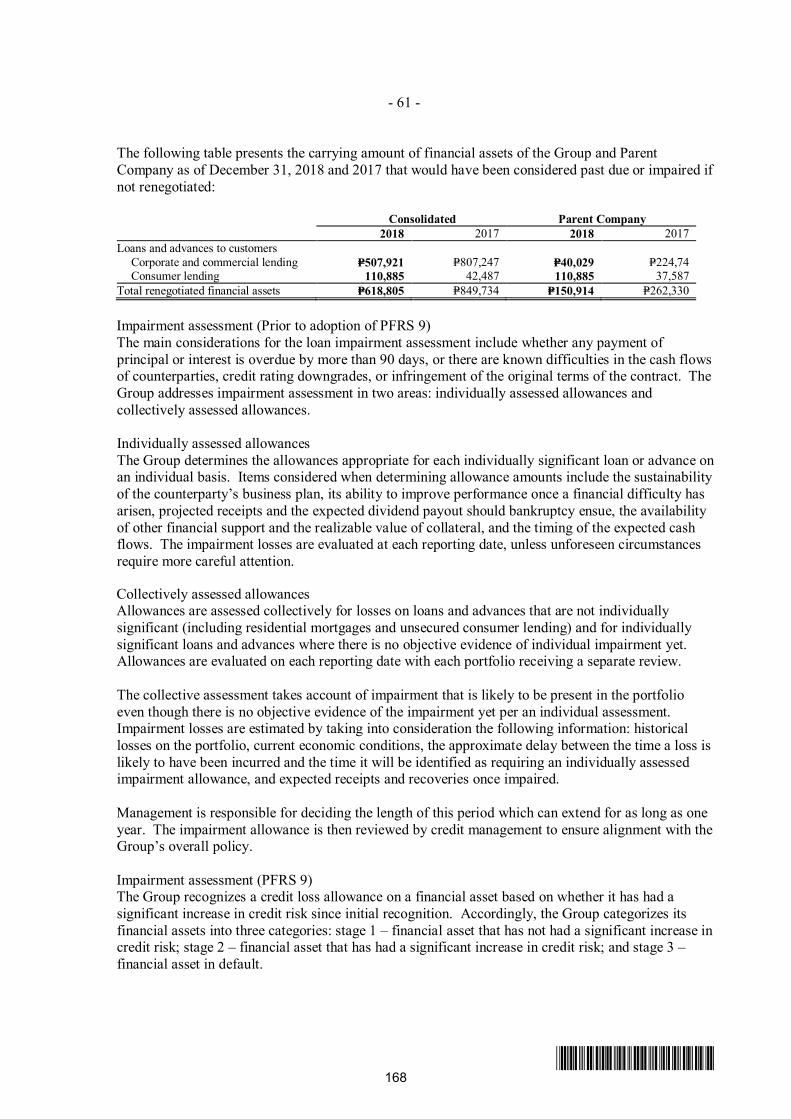
- 61 -
*SGVFS032944*
The following table presents the carrying amount of financial assets of the Group and ParentCompany as of December 31, 2018 and 2017 that would have been considered past due or impaired ifnot renegotiated:
Consolidated Parent Company2018 2017 2018 2017
Loans and advances to customers Corporate and commercial lending P=507,921 P=807,247 P=40,029 P=224,74 Consumer lending 110,885 42,487 110,885 37,587Total renegotiated financial assets P=618,805 P=849,734 P=150,914 P=262,330
Impairment assessment (Prior to adoption of PFRS 9)The main considerations for the loan impairment assessment include whether any payment ofprincipal or interest is overdue by more than 90 days, or there are known difficulties in the cash flowsof counterparties, credit rating downgrades, or infringement of the original terms of the contract. TheGroup addresses impairment assessment in two areas: individually assessed allowances andcollectively assessed allowances.
Individually assessed allowancesThe Group determines the allowances appropriate for each individually significant loan or advance onan individual basis. Items considered when determining allowance amounts include the sustainabilityof the counterparty’s business plan, its ability to improve performance once a financial difficulty hasarisen, projected receipts and the expected dividend payout should bankruptcy ensue, the availabilityof other financial support and the realizable value of collateral, and the timing of the expected cashflows. The impairment losses are evaluated at each reporting date, unless unforeseen circumstancesrequire more careful attention.
Collectively assessed allowancesAllowances are assessed collectively for losses on loans and advances that are not individuallysignificant (including residential mortgages and unsecured consumer lending) and for individuallysignificant loans and advances where there is no objective evidence of individual impairment yet.Allowances are evaluated on each reporting date with each portfolio receiving a separate review.
The collective assessment takes account of impairment that is likely to be present in the portfolioeven though there is no objective evidence of the impairment yet per an individual assessment.Impairment losses are estimated by taking into consideration the following information: historicallosses on the portfolio, current economic conditions, the approximate delay between the time a loss islikely to have been incurred and the time it will be identified as requiring an individually assessedimpairment allowance, and expected receipts and recoveries once impaired.
Management is responsible for deciding the length of this period which can extend for as long as oneyear. The impairment allowance is then reviewed by credit management to ensure alignment with theGroup’s overall policy.
Impairment assessment (PFRS 9)The Group recognizes a credit loss allowance on a financial asset based on whether it has had asignificant increase in credit risk since initial recognition. Accordingly, the Group categorizes itsfinancial assets into three categories: stage 1 – financial asset that has not had a significant increase incredit risk; stage 2 – financial asset that has had a significant increase in credit risk; and stage 3 –financial asset in default.
168
VJNQUISIDO
Rectangle
- 62 -
*SGVFS032944*
Generally, the Group assesses the presence of a significant increase in credit risk based on the numberof notches that a financial asset’s credit risk rating has declined. When applicable, the Group alsoapplies a rebuttable presumption that the credit risk on a financial asset has increased significantlysince initial recognition when contractual payments are more than 30 days past due.
Further, the Group considers a financial asset as in default when (a) as a result of one or more lossevents, there is objective evidence that its recoverable value is less than its carrying amount; (b) it isclassified as doubtful or loss under prudential reporting; (c) it is in litigation; and/or (d) fullrepayment of principal and interest is unlikely without foreclosure of collateral, if any. Whenapplicable, the Group also applies a rebuttable presumption that default does not occur later thanwhen a financial asset is 90 days past due unless the Group has reasonable and supportableinformation to demonstrate that a more lagging default criterion is more appropriate.
The Group then measures the credit loss allowance on a financial instrument at an amount equal to12-month expected credit losses for items categorized as stage 1 and lifetime credit losses to itemscategorized as stage 2 and stage 3.
The Group modeled the following inputs to the expected credit loss formula separately. The formulais applied to each financial asset, with certain exceptions wherein a collective or other generalapproach is applied:
Exposure at Default (EAD)The Group defines EAD as the principal and interests that would not be collected assuming theborrower’s defaults during a future point in time. The Bank computes for a financial asset’s EADusing the expected contractual cash flows during the contractual life of the financial instrument. Afinancial asset’s EAD is defined as the sum of EAD from principal and EAD from interest.
Probability of default (PD)The Group uses forward-looking PD estimates that are unbiased and probability-weighted using arange of possible outcomes. The PD for each individual instrument is modelled based on historicaldata and is estimated based on current market conditions and reasonable and supportable informationabout future economic conditions. The Bank segmented its credit exposures based on homogenousrisk characteristics and developed a corresponding PD methodology for each portfolio. The PDmethodology for each relevant portfolio is determined based on the underlying nature orcharacteristic of the portfolio, behavior of the accounts and materiality of the segment as compared tothe total portfolio. The Group’s PDs are mainly categoried into three: (a) corporate; (b) soverign; and(c) retail.
Loss given default (LGD)The Group’s LGD model considers certain factors such as the historical cash flow recovery andreasonable and supportable information about future economic conditions, where appropriate.Generally, the model utilizes the Bank’s existing loan exposure rating system which is designed tocapture these factors as well as the characteristics of collaterals related to an exposure. In caseswherein this does not apply, the Group looks into the standard characteristics of collaterals (e.g., carand housing loans) in order to estimate an LGD factor. In the case of exposures without collaterals(e.g., securities), the Group uses internationally-accepted standard LGD factors.
Credit ReviewIn accordance with BSP Circular 855, credit reviews are conducted on loan accounts to evaluatewhether loans are granted in accordance with the Bank’s policies, to assess loan quality andappropriateness of classification and adequacy of loan loss provisioning. Results of credit reviews
169
VJNQUISIDO
Rectangle
- 63 -
*SGVFS032944*
are promptly reported to management to apprise them of any significant findings for proper correctiveactions.
Market RiskMarket risk is the risk of loss that may result from changes in the value of a financial product. TheParent Company’s market risk originates from its holdings of domestic and foreign−denominateddebt securities, foreign exchange instruments, equities, foreign exchange derivatives and interest ratederivatives.
The RMG of the Parent Company is responsible for assisting the ROC with its responsibility foridentifying, measuring, managing and controlling market risk. Market risk management measures theParent Company market risk exposures through the use of VaR. VaR is a statistical measure thatestimates the maximum potential loss from a portfolio over a holding period, within a givenconfidence level.
VaR assumptionsThe Parent Company calculates the VaR in trading activities. The Parent Company uses theHistorical Simulation Full Valuation approach to measure VaR for all treasury traded instruments,using a 99.00% confidence level and a 1−day holding period.
The use of a 99.00% confidence level means that, within a one day horizon, losses exceeding the VaRfigure should occur, on average, not more than once every hundred days. The validity of the VaRmodel is verified through back testing, which examines how frequently actual and hypothetical dailylosses exceeds daily VaR. The Parent Company measures and monitors the VaR and profit and losson a daily basis.
Since VaR is an integral part of the Parent Company’s market risk management, VaR limits havebeen established for all trading positions and exposures are reviewed daily against the limits bymanagement. Further, stress testing is performed for monitoring extreme events.
Limitations of the VaR MethodologyThe VaR models are designed to measure market risk in a normal market environment using equallyweighted historical data. The use of VaR has limitations because it is based on historical correlationsand volatilities in market prices and assumes that future price movements will follow the samedistribution. Due to the fact that VaR relies heavily on historical data to provide information and maynot clearly predict the future changes and modifications of the risk factors, the probability of largemarket moves may be underestimated if changes in risk factors fail to align with the assumptions.VaR may also be under− or over−estimated due to the assumptions placed on risk factors and therelationship between such factors for specific instruments. Even though positions may changethroughout the day, the VaR only represents the risk of the portfolios at the close of each businessday, and it does not account for any losses that may occur beyond the 99.00% confidence level.
In practice, the actual trading results will differ from the VaR calculation and, in particular, thecalculation does not provide a meaningful indication of profits and losses in stressed marketconditions. To determine the reliability of the VaR models, actual outcomes are monitored regularlyto test the validity of the assumptions and the parameters used in the VaR calculation. Market riskpositions are also subject to regular stress tests to ensure that the Group would withstand an extrememarket event.
170
VJNQUISIDO
Rectangle
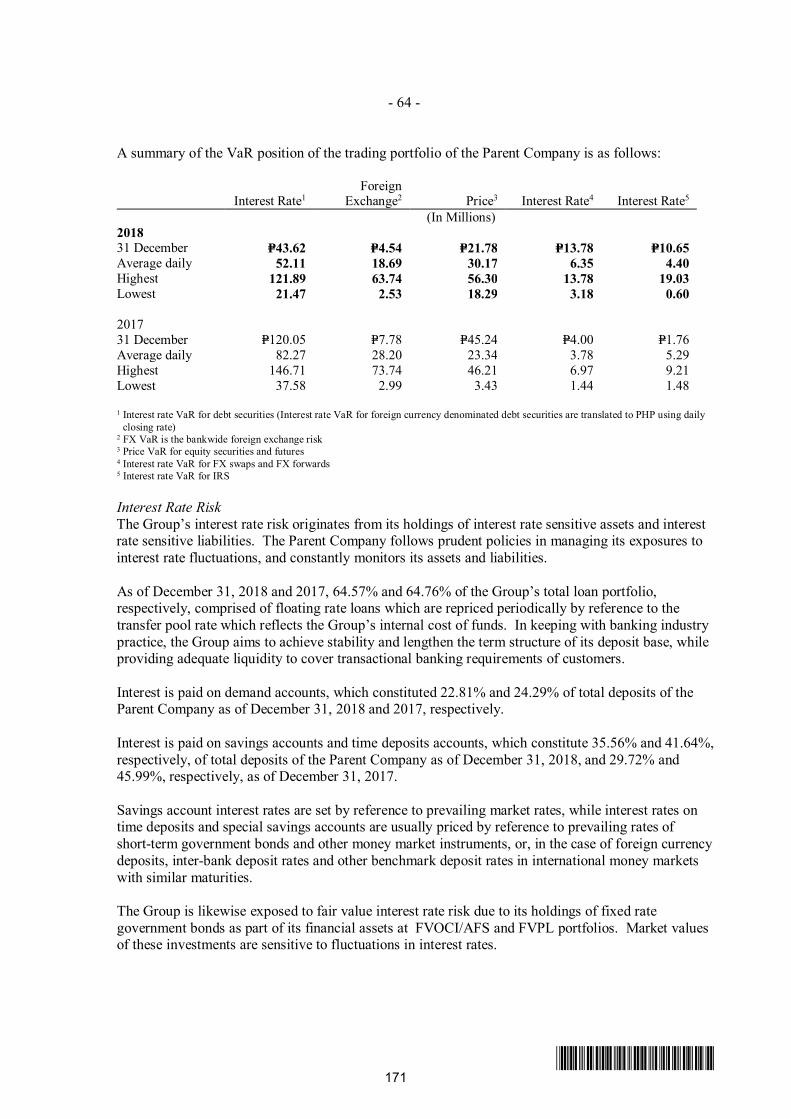
- 64 -
*SGVFS032944*
A summary of the VaR position of the trading portfolio of the Parent Company is as follows:
Interest Rate1Foreign
Exchange2 Price3 Interest Rate4 Interest Rate5
(In Millions)201831 December P=43.62 P=4.54 P=21.78 P=13.78 P=10.65Average daily 52.11 18.69 30.17 6.35 4.40Highest 121.89 63.74 56.30 13.78 19.03Lowest 21.47 2.53 18.29 3.18 0.60
201731 December P=120.05 P=7.78 P=45.24 P=4.00 P=1.76Average daily 82.27 28.20 23.34 3.78 5.29Highest 146.71 73.74 46.21 6.97 9.21Lowest 37.58 2.99 3.43 1.44 1.48
1 Interest rate VaR for debt securities (Interest rate VaR for foreign currency denominated debt securities are translated to PHP using dailyclosing rate)
2 FX VaR is the bankwide foreign exchange risk3 Price VaR for equity securities and futures4 Interest rate VaR for FX swaps and FX forwards5 Interest rate VaR for IRS
Interest Rate RiskThe Group’s interest rate risk originates from its holdings of interest rate sensitive assets and interestrate sensitive liabilities. The Parent Company follows prudent policies in managing its exposures tointerest rate fluctuations, and constantly monitors its assets and liabilities.
As of December 31, 2018 and 2017, 64.57% and 64.76% of the Group’s total loan portfolio,respectively, comprised of floating rate loans which are repriced periodically by reference to thetransfer pool rate which reflects the Group’s internal cost of funds. In keeping with banking industrypractice, the Group aims to achieve stability and lengthen the term structure of its deposit base, whileproviding adequate liquidity to cover transactional banking requirements of customers.
Interest is paid on demand accounts, which constituted 22.81% and 24.29% of total deposits of theParent Company as of December 31, 2018 and 2017, respectively.
Interest is paid on savings accounts and time deposits accounts, which constitute 35.56% and 41.64%,respectively, of total deposits of the Parent Company as of December 31, 2018, and 29.72% and45.99%, respectively, as of December 31, 2017.
Savings account interest rates are set by reference to prevailing market rates, while interest rates ontime deposits and special savings accounts are usually priced by reference to prevailing rates ofshort-term government bonds and other money market instruments, or, in the case of foreign currencydeposits, inter-bank deposit rates and other benchmark deposit rates in international money marketswith similar maturities.
The Group is likewise exposed to fair value interest rate risk due to its holdings of fixed rategovernment bonds as part of its financial assets at FVOCI/AFS and FVPL portfolios. Market valuesof these investments are sensitive to fluctuations in interest rates.
171
VJNQUISIDO
Rectangle
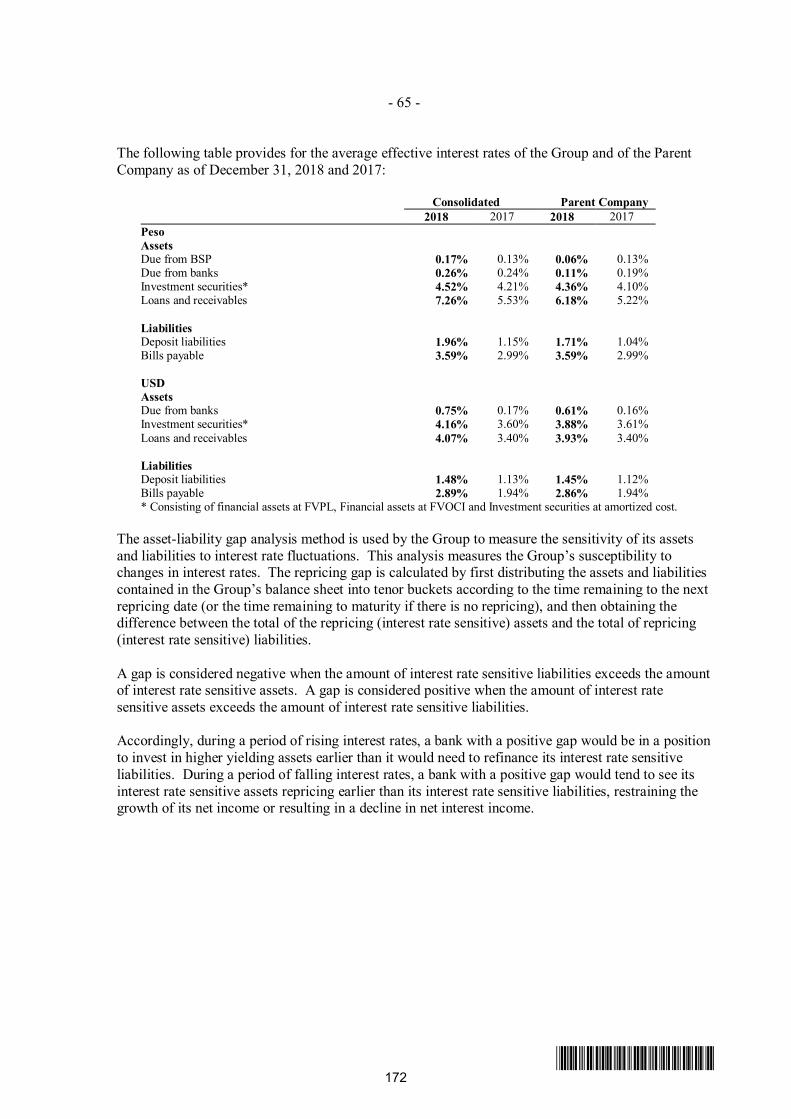
- 65 -
*SGVFS032944*
The following table provides for the average effective interest rates of the Group and of the ParentCompany as of December 31, 2018 and 2017:
Consolidated Parent Company2018 2017 2018 2017
PesoAssetsDue from BSP 0.17% 0.13% 0.06% 0.13%Due from banks 0.26% 0.24% 0.11% 0.19%Investment securities* 4.52% 4.21% 4.36% 4.10%Loans and receivables 7.26% 5.53% 6.18% 5.22%
LiabilitiesDeposit liabilities 1.96% 1.15% 1.71% 1.04%Bills payable 3.59% 2.99% 3.59% 2.99%
USDAssetsDue from banks 0.75% 0.17% 0.61% 0.16%Investment securities* 4.16% 3.60% 3.88% 3.61%Loans and receivables 4.07% 3.40% 3.93% 3.40%
LiabilitiesDeposit liabilities 1.48% 1.13% 1.45% 1.12%Bills payable 2.89% 1.94% 2.86% 1.94%* Consisting of financial assets at FVPL, Financial assets at FVOCI and Investment securities at amortized cost.
The asset-liability gap analysis method is used by the Group to measure the sensitivity of its assetsand liabilities to interest rate fluctuations. This analysis measures the Group’s susceptibility tochanges in interest rates. The repricing gap is calculated by first distributing the assets and liabilitiescontained in the Group’s balance sheet into tenor buckets according to the time remaining to the nextrepricing date (or the time remaining to maturity if there is no repricing), and then obtaining thedifference between the total of the repricing (interest rate sensitive) assets and the total of repricing(interest rate sensitive) liabilities.
A gap is considered negative when the amount of interest rate sensitive liabilities exceeds the amountof interest rate sensitive assets. A gap is considered positive when the amount of interest ratesensitive assets exceeds the amount of interest rate sensitive liabilities.
Accordingly, during a period of rising interest rates, a bank with a positive gap would be in a positionto invest in higher yielding assets earlier than it would need to refinance its interest rate sensitiveliabilities. During a period of falling interest rates, a bank with a positive gap would tend to see itsinterest rate sensitive assets repricing earlier than its interest rate sensitive liabilities, restraining thegrowth of its net income or resulting in a decline in net interest income.
172
VJNQUISIDO
Rectangle
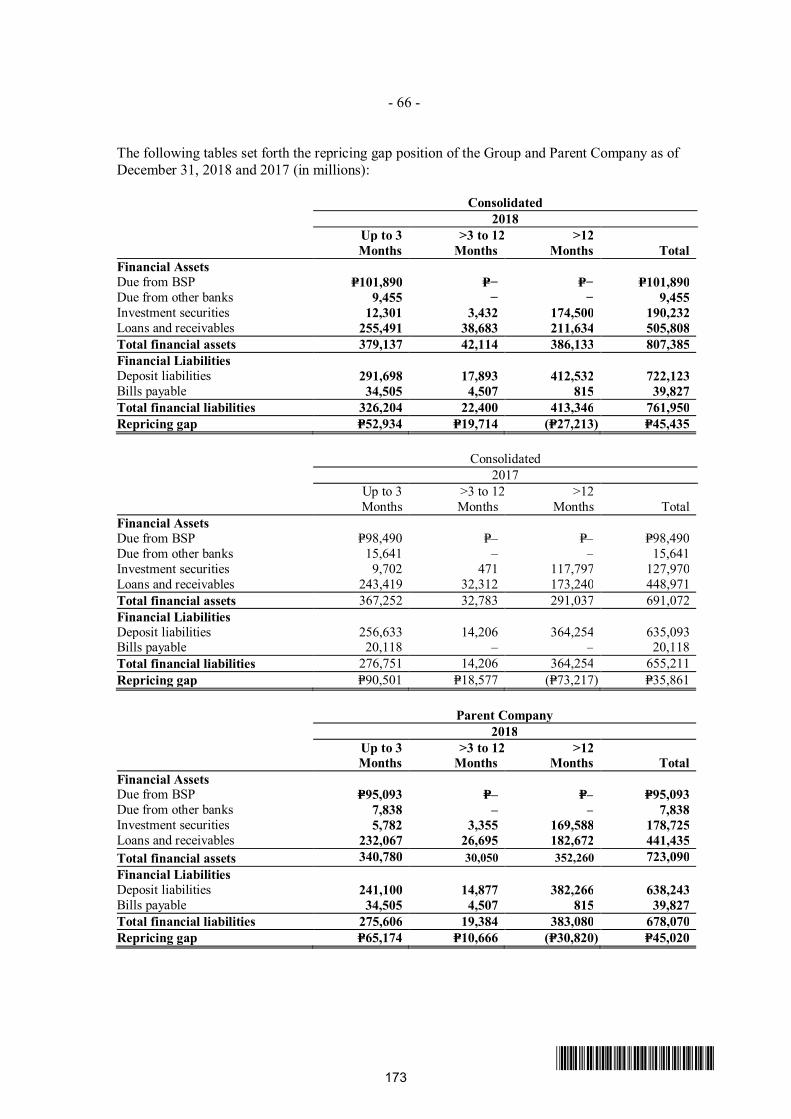
- 66 -
*SGVFS032944*
The following tables set forth the repricing gap position of the Group and Parent Company as ofDecember 31, 2018 and 2017 (in millions):
Consolidated2018
Up to 3Months
>3 to 12Months
>12Months Total
Financial AssetsDue from BSP P=101,890 P=− P=− P=101,890Due from other banks 9,455 − − 9,455Investment securities 12,301 3,432 174,500 190,232Loans and receivables 255,491 38,683 211,634 505,808Total financial assets 379,137 42,114 386,133 807,385Financial LiabilitiesDeposit liabilities 291,698 17,893 412,532 722,123Bills payable 34,505 4,507 815 39,827Total financial liabilities 326,204 22,400 413,346 761,950Repricing gap P=52,934 P=19,714 (P=27,213) P=45,435
Consolidated2017
Up to 3Months
>3 to 12Months
>12Months Total
Financial AssetsDue from BSP P=98,490 P=– P=– P=98,490Due from other banks 15,641 – – 15,641Investment securities 9,702 471 117,797 127,970Loans and receivables 243,419 32,312 173,240 448,971Total financial assets 367,252 32,783 291,037 691,072Financial LiabilitiesDeposit liabilities 256,633 14,206 364,254 635,093Bills payable 20,118 – – 20,118Total financial liabilities 276,751 14,206 364,254 655,211Repricing gap P=90,501 P=18,577 (P=73,217) P=35,861
Parent Company2018
Up to 3Months
>3 to 12Months
>12Months Total
Financial AssetsDue from BSP P=95,093 P=– P=– P=95,093Due from other banks 7,838 – – 7,838Investment securities 5,782 3,355 169,588 178,725Loans and receivables 232,067 26,695 182,672 441,435Total financial assets 340,780 30,050 352,260 723,090Financial LiabilitiesDeposit liabilities 241,100 14,877 382,266 638,243Bills payable 34,505 4,507 815 39,827Total financial liabilities 275,606 19,384 383,080 678,070Repricing gap P=65,174 P=10,666 (P=30,820) P=45,020
173
VJNQUISIDO
Rectangle
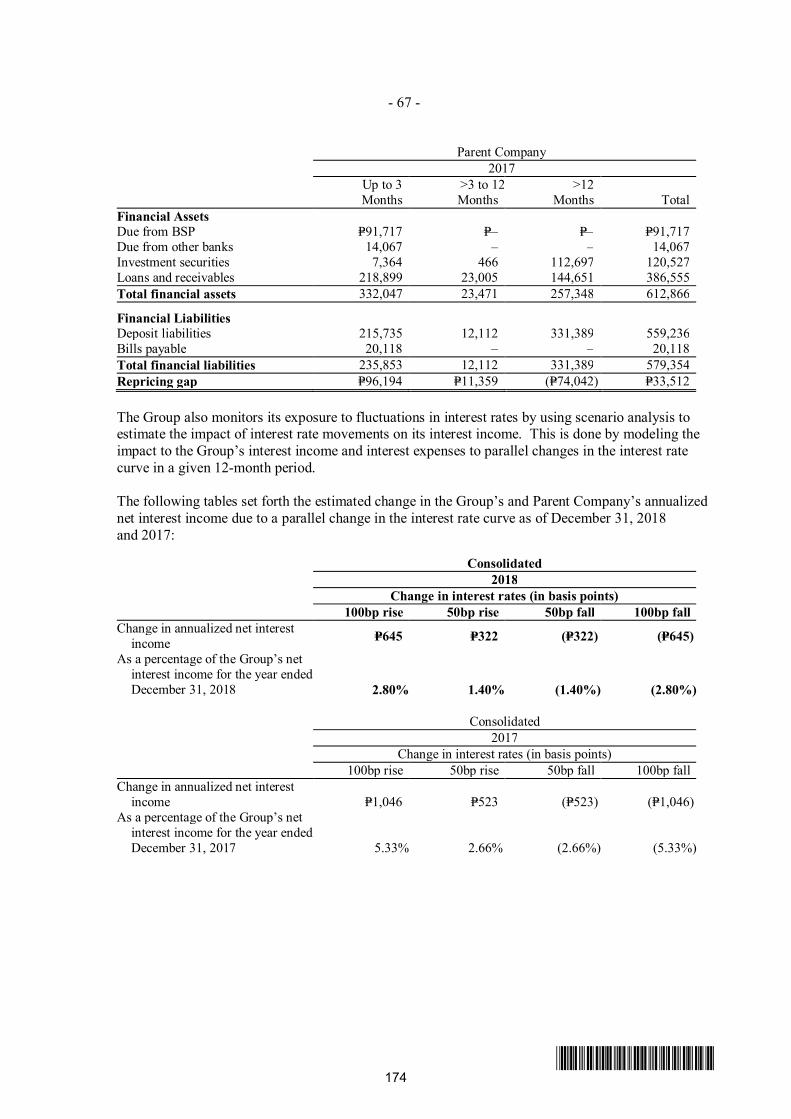
- 67 -
*SGVFS032944*
Parent Company2017
Up to 3Months
>3 to 12Months
>12Months Total
Financial AssetsDue from BSP P=91,717 P=– P=– P=91,717Due from other banks 14,067 – – 14,067Investment securities 7,364 466 112,697 120,527Loans and receivables 218,899 23,005 144,651 386,555Total financial assets 332,047 23,471 257,348 612,866
Financial LiabilitiesDeposit liabilities 215,735 12,112 331,389 559,236Bills payable 20,118 – – 20,118Total financial liabilities 235,853 12,112 331,389 579,354Repricing gap P=96,194 P=11,359 (P=74,042) P=33,512
The Group also monitors its exposure to fluctuations in interest rates by using scenario analysis toestimate the impact of interest rate movements on its interest income. This is done by modeling theimpact to the Group’s interest income and interest expenses to parallel changes in the interest ratecurve in a given 12-month period.
The following tables set forth the estimated change in the Group’s and Parent Company’s annualizednet interest income due to a parallel change in the interest rate curve as of December 31, 2018and 2017:
Consolidated2018
Change in interest rates (in basis points)100bp rise 50bp rise 50bp fall 100bp fall
Change in annualized net interestincome P=645 P=322 (P=322) (P=645)
As a percentage of the Group’s netinterest income for the year endedDecember 31, 2018 2.80% 1.40% (1.40%) (2.80%)
Consolidated2017
Change in interest rates (in basis points)100bp rise 50bp rise 50bp fall 100bp fall
Change in annualized net interestincome P=1,046 P=523 (P=523) (P=1,046)
As a percentage of the Group’s netinterest income for the year endedDecember 31, 2017 5.33% 2.66% (2.66%) (5.33%)
174
VJNQUISIDO
Rectangle
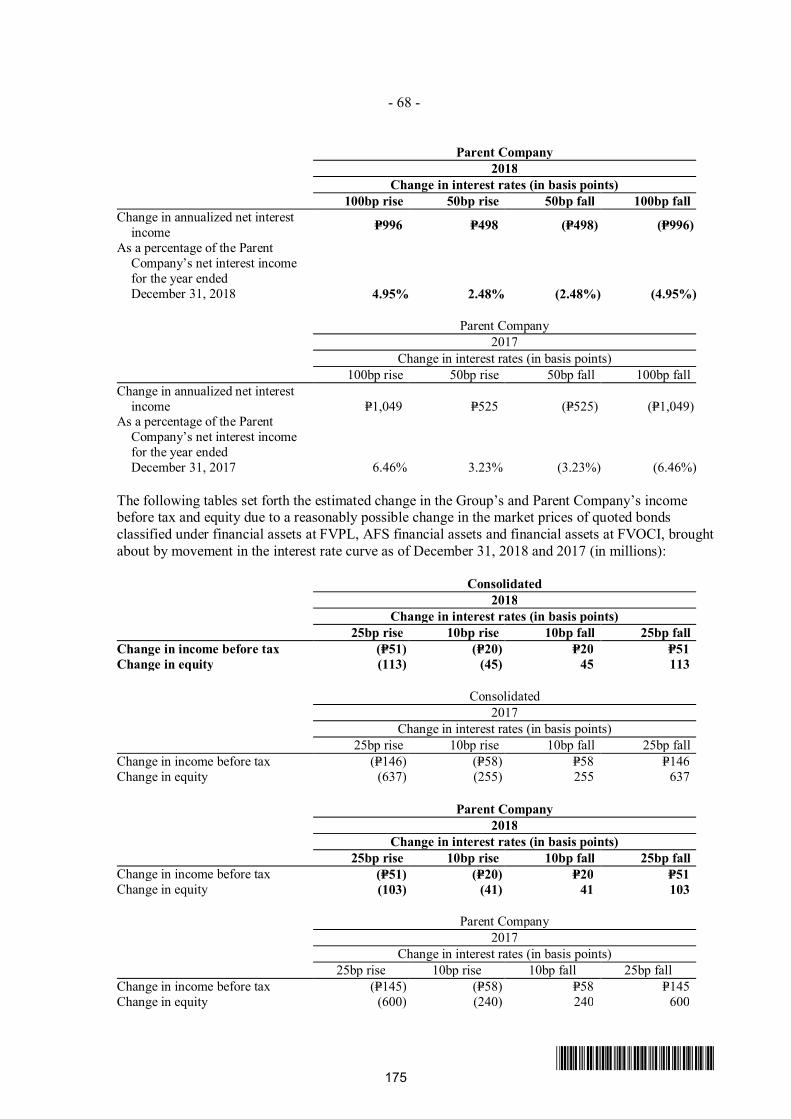
- 68 -
*SGVFS032944*
Parent Company2018
Change in interest rates (in basis points)100bp rise 50bp rise 50bp fall 100bp fall
Change in annualized net interestincome P=996 P=498 (P=498) (P=996)
As a percentage of the ParentCompany’s net interest incomefor the year ended
December 31, 2018 4.95% 2.48% (2.48%) (4.95%)
Parent Company2017
Change in interest rates (in basis points)100bp rise 50bp rise 50bp fall 100bp fall
Change in annualized net interestincome P=1,049 P=525 (P=525) (P=1,049)
As a percentage of the ParentCompany’s net interest incomefor the year ended
December 31, 2017 6.46% 3.23% (3.23%) (6.46%)
The following tables set forth the estimated change in the Group’s and Parent Company’s incomebefore tax and equity due to a reasonably possible change in the market prices of quoted bondsclassified under financial assets at FVPL, AFS financial assets and financial assets at FVOCI, broughtabout by movement in the interest rate curve as of December 31, 2018 and 2017 (in millions):
Consolidated2018
Change in interest rates (in basis points)25bp rise 10bp rise 10bp fall 25bp fall
Change in income before tax (P=51) (P=20) P=20 P=51Change in equity (113) (45) 45 113
Consolidated2017
Change in interest rates (in basis points)25bp rise 10bp rise 10bp fall 25bp fall
Change in income before tax (P=146) (P=58) P=58 P=146Change in equity (637) (255) 255 637
Parent Company2018
Change in interest rates (in basis points)25bp rise 10bp rise 10bp fall 25bp fall
Change in income before tax (P=51) (P=20) P=20 P=51Change in equity (103) (41) 41 103
Parent Company2017
Change in interest rates (in basis points)25bp rise 10bp rise 10bp fall 25bp fall
Change in income before tax (P=145) (P=58) P=58 P=145Change in equity (600) (240) 240 600
175
VJNQUISIDO
Rectangle
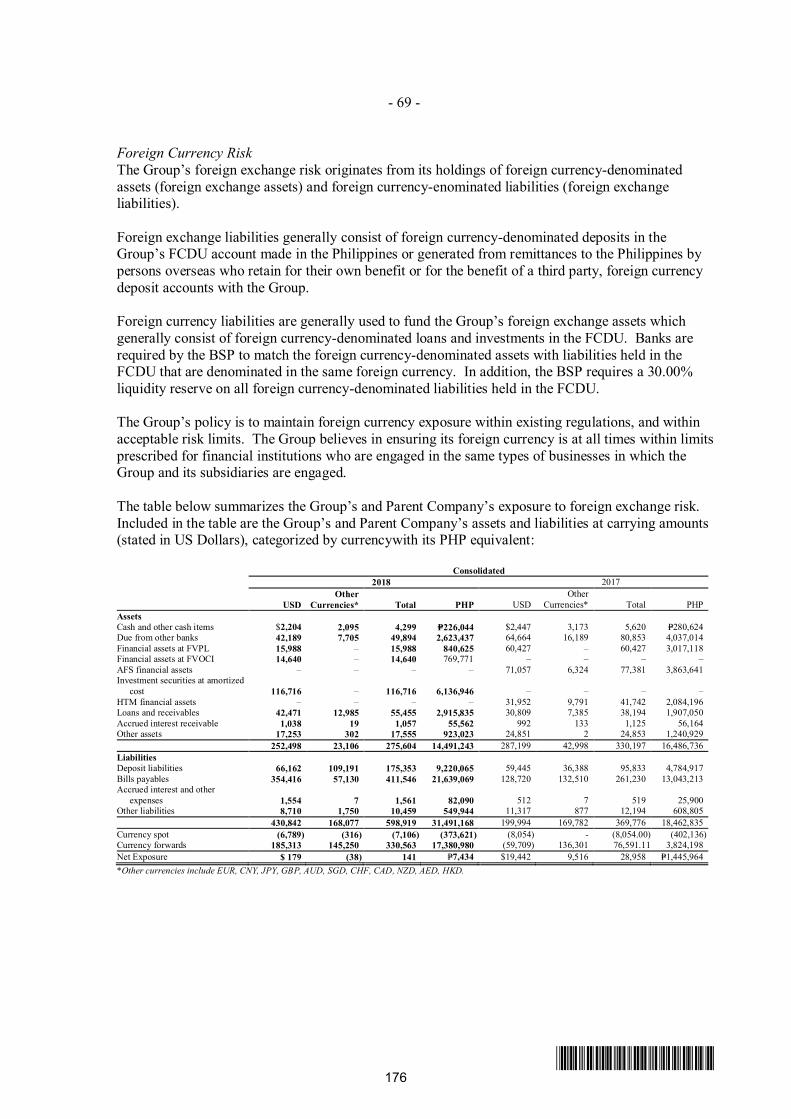
- 69 -
*SGVFS032944*
Foreign Currency RiskThe Group’s foreign exchange risk originates from its holdings of foreign currency-denominatedassets (foreign exchange assets) and foreign currency-enominated liabilities (foreign exchangeliabilities).
Foreign exchange liabilities generally consist of foreign currency-denominated deposits in theGroup’s FCDU account made in the Philippines or generated from remittances to the Philippines bypersons overseas who retain for their own benefit or for the benefit of a third party, foreign currencydeposit accounts with the Group.
Foreign currency liabilities are generally used to fund the Group’s foreign exchange assets whichgenerally consist of foreign currency-denominated loans and investments in the FCDU. Banks arerequired by the BSP to match the foreign currency-denominated assets with liabilities held in theFCDU that are denominated in the same foreign currency. In addition, the BSP requires a 30.00%liquidity reserve on all foreign currency-denominated liabilities held in the FCDU.
The Group’s policy is to maintain foreign currency exposure within existing regulations, and withinacceptable risk limits. The Group believes in ensuring its foreign currency is at all times within limitsprescribed for financial institutions who are engaged in the same types of businesses in which theGroup and its subsidiaries are engaged.
The table below summarizes the Group’s and Parent Company’s exposure to foreign exchange risk.Included in the table are the Group’s and Parent Company’s assets and liabilities at carrying amounts(stated in US Dollars), categorized by currencywith its PHP equivalent:
Consolidated2018 2017
USDOther
Currencies* Total PHP USDOther
Currencies* Total PHPAssetsCash and other cash items $2,204 2,095 4,299 P=226,044 $2,447 3,173 5,620 P=280,624Due from other banks 42,189 7,705 49,894 2,623,437 64,664 16,189 80,853 4,037,014Financial assets at FVPLFinancial assets at FVOCI
15,98814,640
––
15,98814,640
840,625769,771
60,427–
––
60,427–
3,017,118–
AFS financial assets – – – – 71,057 6,324 77,381 3,863,641Investment securities at amortized
cost 116,716 – 116,716 6,136,946 – – – –HTM financial assets – – – – 31,952 9,791 41,742 2,084,196Loans and receivables 42,471 12,985 55,455 2,915,835 30,809 7,385 38,194 1,907,050Accrued interest receivable 1,038 19 1,057 55,562 992 133 1,125 56,164Other assets 17,253 302 17,555 923,023 24,851 2 24,853 1,240,929
252,498 23,106 275,604 14,491,243 287,199 42,998 330,197 16,486,736LiabilitiesDeposit liabilities 66,162 109,191 175,353 9,220,065 59,445 36,388 95,833 4,784,917Bills payables 354,416 57,130 411,546 21,639,069 128,720 132,510 261,230 13,043,213Accrued interest and other
expenses 1,554 7 1,561 82,090 512 7 519 25,900Other liabilities 8,710 1,750 10,459 549,944 11,317 877 12,194 608,805
430,842 168,077 598,919 31,491,168 199,994 169,782 369,776 18,462,835Currency spot (6,789) (316) (7,106) (373,621) (8,054) - (8,054.00) (402,136)Currency forwards 185,313 145,250 330,563 17,380,980 (59,709) 136,301 76,591.11 3,824,198Net Exposure $ 179 (38) 141 P=7,434 $19,442 9,516 28,958 P=1,445,964*Other currencies include EUR, CNY, JPY, GBP, AUD, SGD, CHF, CAD, NZD, AED, HKD.
176
VJNQUISIDO
Rectangle
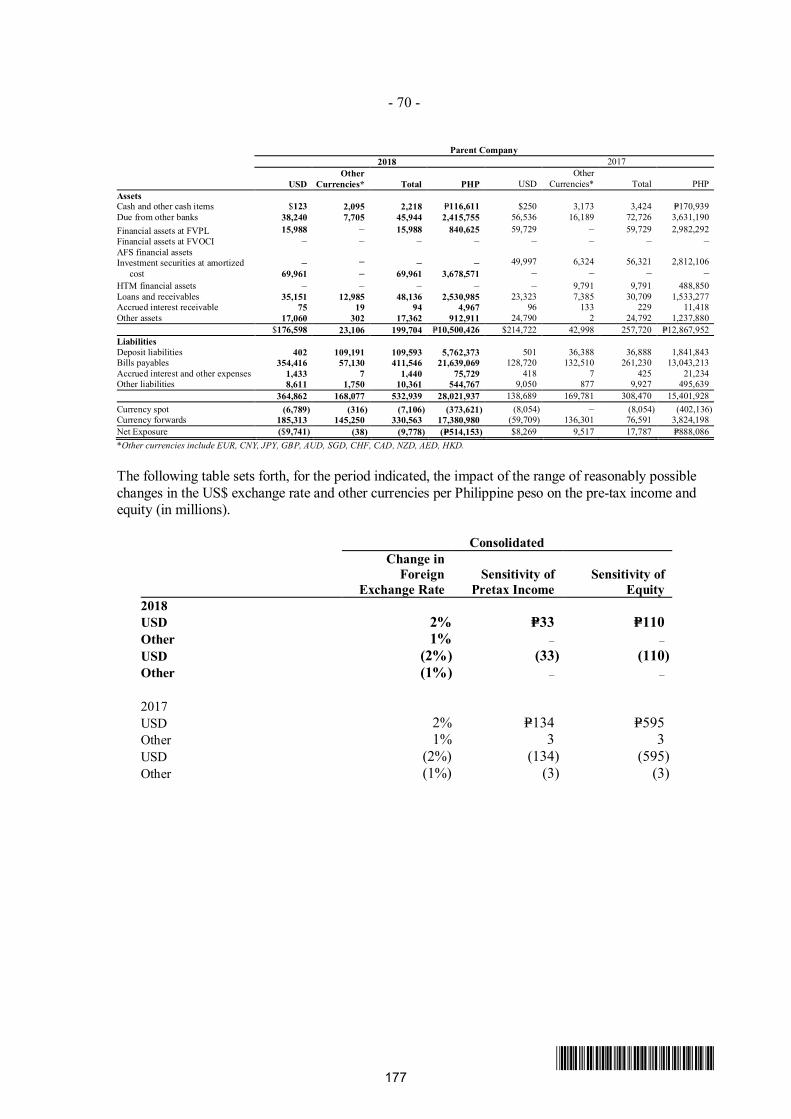
- 70 -
*SGVFS032944*
Parent Company2018 2017
USDOther
Currencies* Total PHP USDOther
Currencies* Total PHPAssetsCash and other cash items $123 2,095 2,218 P=116,611 $250 3,173 3,424 P=170,939Due from other banks 38,240 7,705 45,944 2,415,755 56,536 16,189 72,726 3,631,190Financial assets at FVPLFinancial assets at FVOCI
15,988–
––
15,988–
840,625–
59,729–
––
59,729–
2,982,292–
AFS financial assetsInvestment securities at amortized
cost–
69,961––
–69,961
–3,678,571
49,997–
6,324–
56,321–
2,812,106–
HTM financial assets – – – – – 9,791 9,791 488,850Loans and receivables 35,151 12,985 48,136 2,530,985 23,323 7,385 30,709 1,533,277Accrued interest receivable 75 19 94 4,967 96 133 229 11,418Other assets 17,060 302 17,362 912,911 24,790 2 24,792 1,237,880
$176,598 23,106 199,704 P=10,500,426 $214,722 42,998 257,720 P=12,867,952LiabilitiesDeposit liabilities 402 109,191 109,593 5,762,373 501 36,388 36,888 1,841,843Bills payables 354,416 57,130 411,546 21,639,069 128,720 132,510 261,230 13,043,213Accrued interest and other expenses 1,433 7 1,440 75,729 418 7 425 21,234Other liabilities 8,611 1,750 10,361 544,767 9,050 877 9,927 495,639
364,862 168,077 532,939 28,021,937 138,689 169,781 308,470 15,401,928Currency spot (6,789) (316) (7,106) (373,621) (8,054) – (8,054) (402,136)Currency forwards 185,313 145,250 330,563 17,380,980 (59,709) 136,301 76,591 3,824,198Net Exposure ($9,741) (38) (9,778) (P=514,153) $8,269 9,517 17,787 P=888,086*Other currencies include EUR, CNY, JPY, GBP, AUD, SGD, CHF, CAD, NZD, AED, HKD.
The following table sets forth, for the period indicated, the impact of the range of reasonably possiblechanges in the US$ exchange rate and other currencies per Philippine peso on the pre-tax income andequity (in millions).
ConsolidatedChange in
ForeignExchange Rate
Sensitivity ofPretax Income
Sensitivity ofEquity
2018USD 2% P=33 P=110Other 1% – –USD (2%) (33) (110)Other (1%) – –
2017USD 2% P=134 P=595Other 1% 3 3USD (2%) (134) (595)Other (1%) (3) (3)
177
VJNQUISIDO
Rectangle
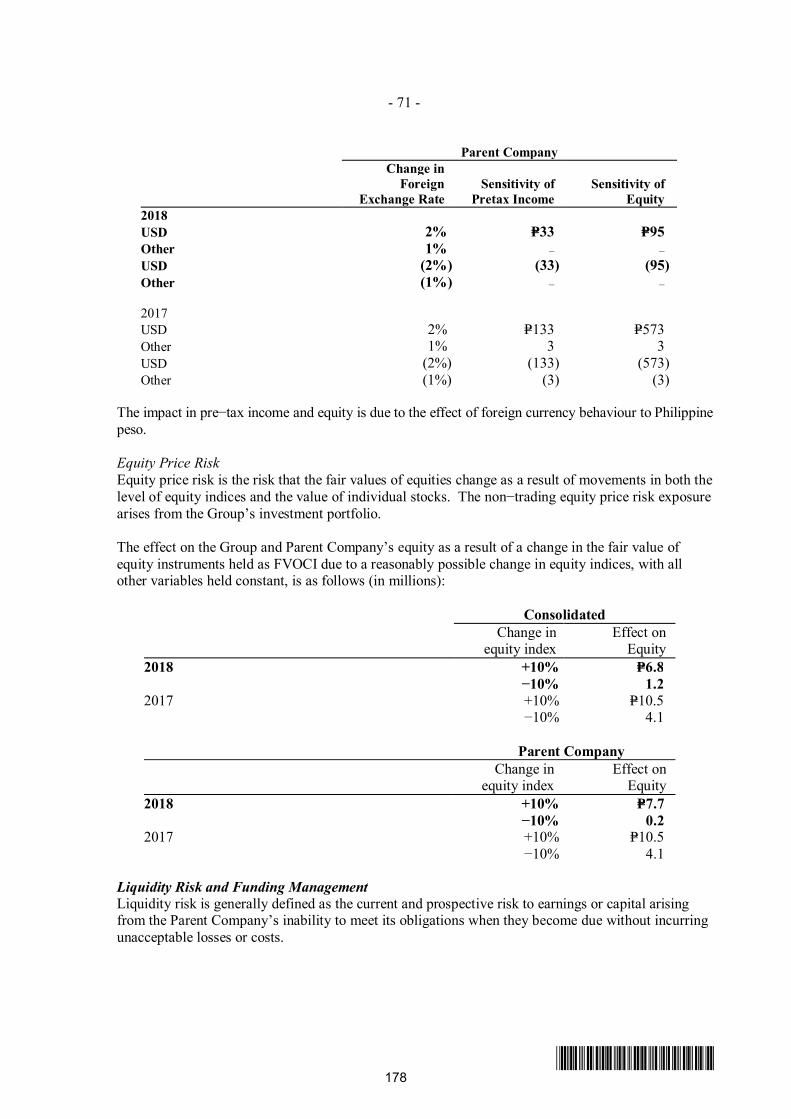
- 71 -
*SGVFS032944*
Parent CompanyChange in
ForeignExchange Rate
Sensitivity ofPretax Income
Sensitivity ofEquity
2018USD 2% P=33 P=95Other 1% – –USD (2%) (33) (95)Other (1%) – –
2017USD 2% P=133 P=573Other 1% 3 3USD (2%) (133) (573)Other (1%) (3) (3)
The impact in pre−tax income and equity is due to the effect of foreign currency behaviour to Philippinepeso.
Equity Price RiskEquity price risk is the risk that the fair values of equities change as a result of movements in both thelevel of equity indices and the value of individual stocks. The non−trading equity price risk exposurearises from the Group’s investment portfolio.
The effect on the Group and Parent Company’s equity as a result of a change in the fair value ofequity instruments held as FVOCI due to a reasonably possible change in equity indices, with allother variables held constant, is as follows (in millions):
ConsolidatedChange in
equity indexEffect on
Equity2018 +10% P=6.8
−10% 1.22017 +10% P=10.5
−10% 4.1
Parent CompanyChange in
equity indexEffect on
Equity2018 +10% P=7.7
−10% 0.22017 +10% P=10.5
−10% 4.1
Liquidity Risk and Funding ManagementLiquidity risk is generally defined as the current and prospective risk to earnings or capital arisingfrom the Parent Company’s inability to meet its obligations when they become due without incurringunacceptable losses or costs.
178
VJNQUISIDO
Rectangle
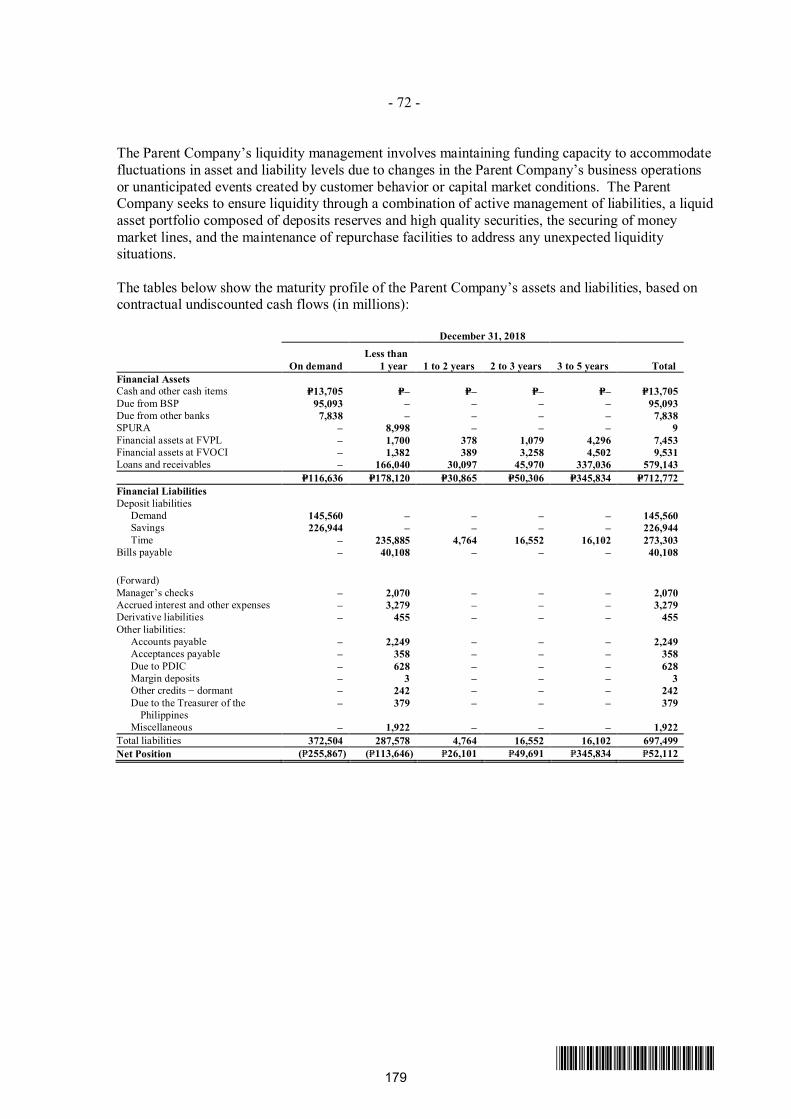
- 72 -
*SGVFS032944*
The Parent Company’s liquidity management involves maintaining funding capacity to accommodatefluctuations in asset and liability levels due to changes in the Parent Company’s business operationsor unanticipated events created by customer behavior or capital market conditions. The ParentCompany seeks to ensure liquidity through a combination of active management of liabilities, a liquidasset portfolio composed of deposits reserves and high quality securities, the securing of moneymarket lines, and the maintenance of repurchase facilities to address any unexpected liquiditysituations.
The tables below show the maturity profile of the Parent Company’s assets and liabilities, based oncontractual undiscounted cash flows (in millions):
December 31, 2018
On demandLess than
1 year 1 to 2 years 2 to 3 years 3 to 5 years TotalFinancial AssetsCash and other cash items P=13,705 P=– P=– P=– P=– P=13,705Due from BSP 95,093 – – – – 95,093Due from other banks 7,838 – – – – 7,838SPURA – 8,998 – – – 9Financial assets at FVPL – 1,700 378 1,079 4,296 7,453Financial assets at FVOCI – 1,382 389 3,258 4,502 9,531Loans and receivables – 166,040 30,097 45,970 337,036 579,143
P=116,636 P=178,120 P=30,865 P=50,306 P=345,834 P=712,772Financial LiabilitiesDeposit liabilities Demand 145,560 – – – – 145,560 Savings 226,944 – – – – 226,944 Time – 235,885 4,764 16,552 16,102 273,303Bills payable – 40,108 – – – 40,108
(Forward)Manager’s checks – 2,070 – – – 2,070Accrued interest and other expenses – 3,279 – – – 3,279Derivative liabilities – 455 – – – 455Other liabilities: Accounts payable – 2,249 – – – 2,249 Acceptances payable – 358 – – – 358 Due to PDIC – 628 – – – 628 Margin deposits – 3 – – – 3 Other credits − dormant – 242 – – – 242 Due to the Treasurer of the
Philippines– 379 – – – 379
Miscellaneous – 1,922 – – – 1,922Total liabilities 372,504 287,578 4,764 16,552 16,102 697,499Net Position (P=255,867) (P=113,646) P=26,101 P=49,691 P=345,834 P=52,112
179
VJNQUISIDO
Rectangle
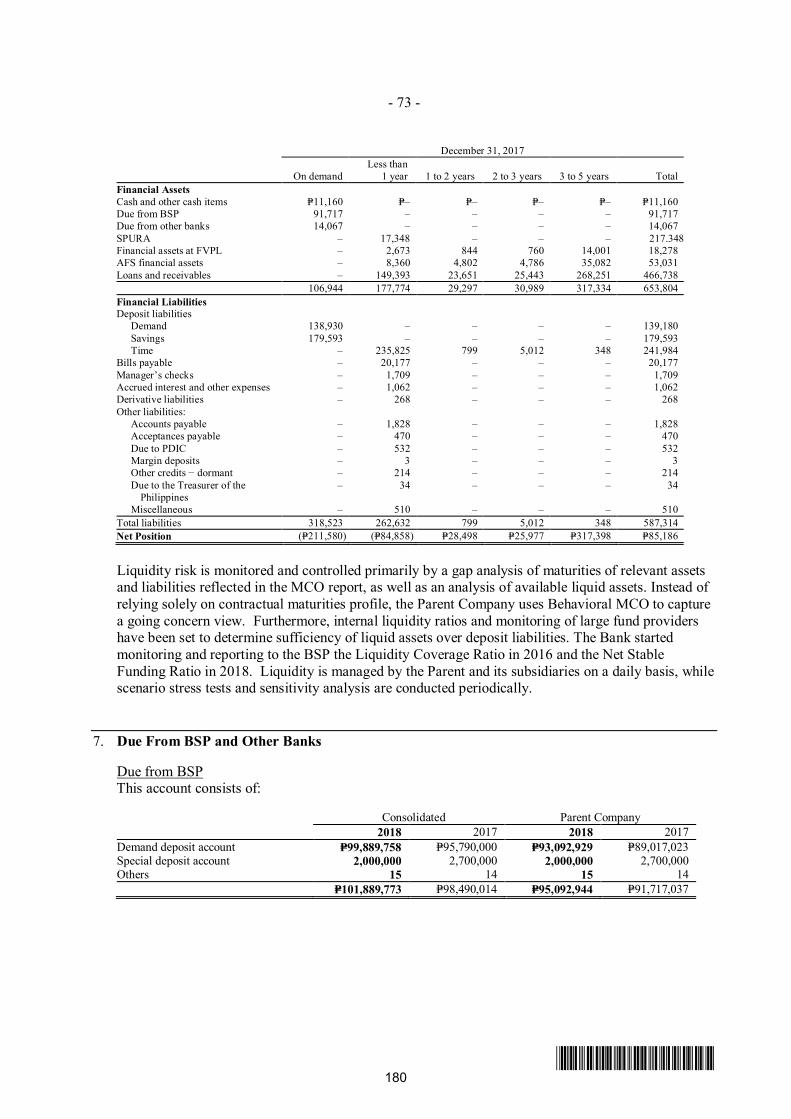
- 73 -
*SGVFS032944*
December 31, 2017
On demandLess than
1 year 1 to 2 years 2 to 3 years 3 to 5 years TotalFinancial AssetsCash and other cash items P=11,160 P=– P=– P=– P=– P=11,160Due from BSP 91,717 – – – – 91,717Due from other banks 14,067 – – – – 14,067SPURA – 17,348 – – – 217.348Financial assets at FVPL – 2,673 844 760 14,001 18,278AFS financial assets – 8,360 4,802 4,786 35,082 53,031Loans and receivables – 149,393 23,651 25,443 268,251 466,738
106,944 177,774 29,297 30,989 317,334 653,804Financial LiabilitiesDeposit liabilities Demand 138,930 – – – – 139,180 Savings 179,593 – – – – 179,593 Time – 235,825 799 5,012 348 241,984Bills payable – 20,177 – – – 20,177Manager’s checks – 1,709 – – – 1,709Accrued interest and other expenses – 1,062 – – – 1,062Derivative liabilities – 268 – – – 268Other liabilities: Accounts payable – 1,828 – – – 1,828 Acceptances payable – 470 – – – 470 Due to PDIC – 532 – – – 532 Margin deposits – 3 – – – 3 Other credits − dormant – 214 – – – 214 Due to the Treasurer of the
Philippines– 34 – – – 34
Miscellaneous – 510 – – – 510Total liabilities 318,523 262,632 799 5,012 348 587,314Net Position (P=211,580) (P=84,858) P=28,498 P=25,977 P=317,398 P=85,186
Liquidity risk is monitored and controlled primarily by a gap analysis of maturities of relevant assetsand liabilities reflected in the MCO report, as well as an analysis of available liquid assets. Instead ofrelying solely on contractual maturities profile, the Parent Company uses Behavioral MCO to capturea going concern view. Furthermore, internal liquidity ratios and monitoring of large fund providershave been set to determine sufficiency of liquid assets over deposit liabilities. The Bank startedmonitoring and reporting to the BSP the Liquidity Coverage Ratio in 2016 and the Net StableFunding Ratio in 2018. Liquidity is managed by the Parent and its subsidiaries on a daily basis, whilescenario stress tests and sensitivity analysis are conducted periodically.
7. Due From BSP and Other Banks
Due from BSPThis account consists of:
Consolidated Parent Company2018 2017 2018 2017
Demand deposit account P=99,889,758 P=95,790,000 P=93,092,929 P=89,017,023Special deposit account 2,000,000 2,700,000 2,000,000 2,700,000Others 15 14 15 14
P=101,889,773 P=98,490,014 P=95,092,944 P=91,717,037
180
VJNQUISIDO
Rectangle
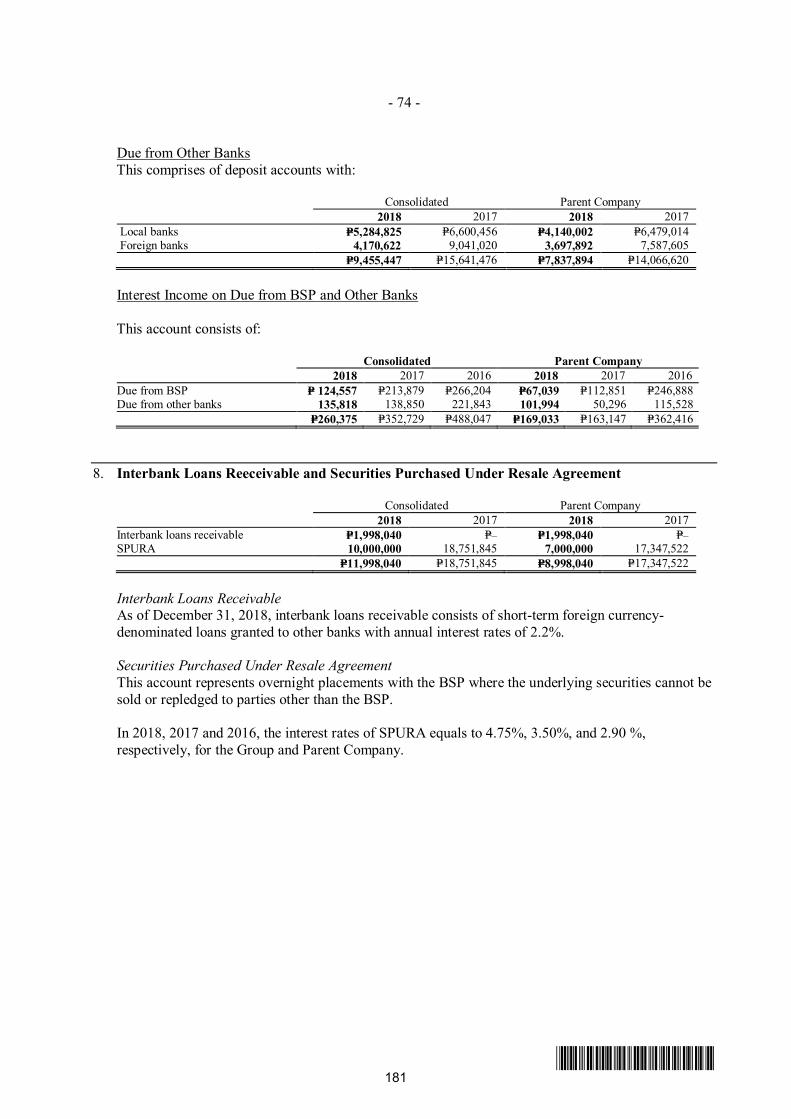
- 74 -
*SGVFS032944*
Due from Other BanksThis comprises of deposit accounts with:
Consolidated Parent Company2018 2017 2018 2017
Local banks P=5,284,825 P=6,600,456 P=4,140,002 P=6,479,014 Foreign banks 4,170,622 9,041,020 3,697,892 7,587,605
P=9,455,447 P=15,641,476 P=7,837,894 P=14,066,620
Interest Income on Due from BSP and Other Banks
This account consists of:
Consolidated Parent Company2018 2017 2016 2018 2017 2016
Due from BSP P= 124,557 P=213,879 P=266,204 P=67,039 P=112,851 P=246,888Due from other banks 135,818 138,850 221,843 101,994 50,296 115,528
P=260,375 P=352,729 P=488,047 P=169,033 P=163,147 P=362,416
8. Interbank Loans Reeceivable and Securities Purchased Under Resale Agreement
Consolidated Parent Company2018 2017 2018 2017
Interbank loans receivable P=1,998,040 P=– P=1,998,040 P=–SPURA 10,000,000 18,751,845 7,000,000 17,347,522
P=11,998,040 P=18,751,845 P=8,998,040 P=17,347,522
Interbank Loans ReceivableAs of December 31, 2018, interbank loans receivable consists of short-term foreign currency-denominated loans granted to other banks with annual interest rates of 2.2%.
Securities Purchased Under Resale AgreementThis account represents overnight placements with the BSP where the underlying securities cannot besold or repledged to parties other than the BSP.
In 2018, 2017 and 2016, the interest rates of SPURA equals to 4.75%, 3.50%, and 2.90 %,respectively, for the Group and Parent Company.
181
VJNQUISIDO
Rectangle
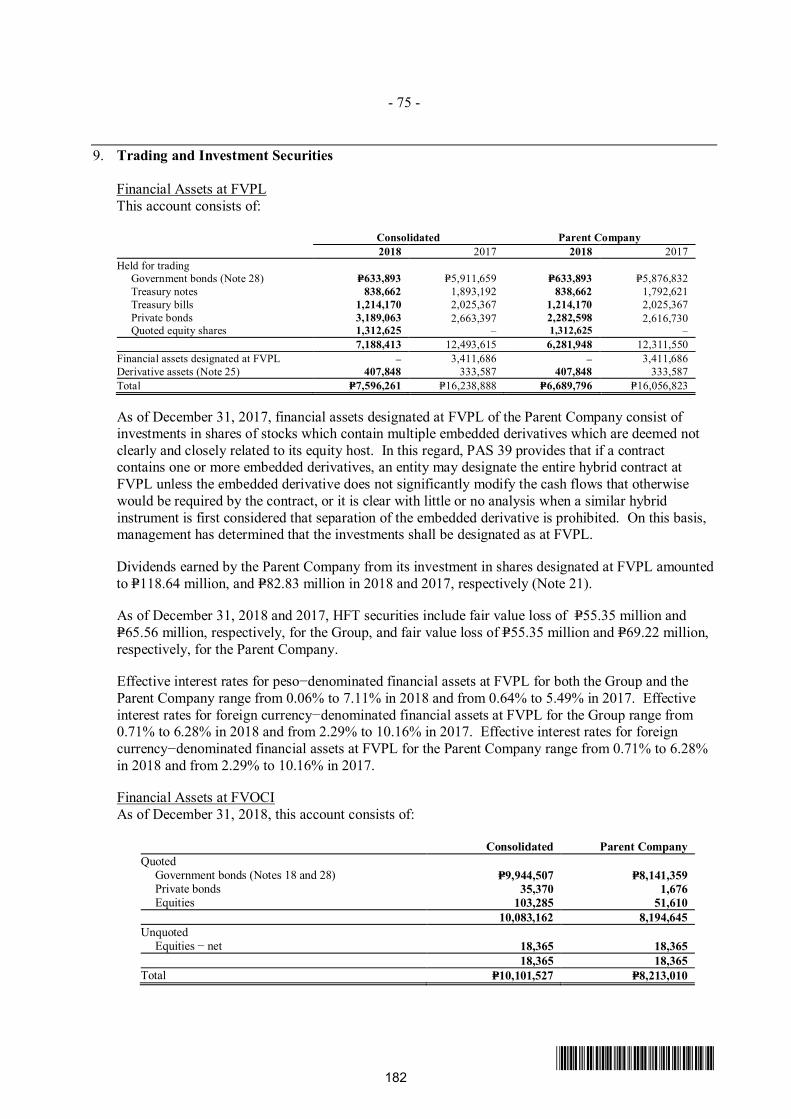
- 75 -
*SGVFS032944*
9. Trading and Investment Securities
Financial Assets at FVPLThis account consists of:
Consolidated Parent Company2018 2017 2018 2017
Held for trading Government bonds (Note 28) P=633,893 P=5,911,659 P=633,893 P=5,876,832 Treasury notes 838,662 1,893,192 838,662 1,792,621 Treasury bills 1,214,170 2,025,367 1,214,170 2,025,367 Private bonds
Quoted equity shares3,189,0631,312,625
2,663,397–
2,282,5981,312,625
2,616,730–
7,188,413 12,493,615 6,281,948 12,311,550Financial assets designated at FVPL – 3,411,686 – 3,411,686Derivative assets (Note 25) 407,848 333,587 407,848 333,587Total P=7,596,261 P=16,238,888 P=6,689,796 P=16,056,823
As of December 31, 2017, financial assets designated at FVPL of the Parent Company consist ofinvestments in shares of stocks which contain multiple embedded derivatives which are deemed notclearly and closely related to its equity host. In this regard, PAS 39 provides that if a contractcontains one or more embedded derivatives, an entity may designate the entire hybrid contract atFVPL unless the embedded derivative does not significantly modify the cash flows that otherwisewould be required by the contract, or it is clear with little or no analysis when a similar hybridinstrument is first considered that separation of the embedded derivative is prohibited. On this basis,management has determined that the investments shall be designated as at FVPL.
Dividends earned by the Parent Company from its investment in shares designated at FVPL amountedto P=118.64 million, and P=82.83 million in 2018 and 2017, respectively (Note 21).
As of December 31, 2018 and 2017, HFT securities include fair value loss of P=55.35 million andP=65.56 million, respectively, for the Group, and fair value loss of P=55.35 million and P=69.22 million,respectively, for the Parent Company.
Effective interest rates for peso−denominated financial assets at FVPL for both the Group and theParent Company range from 0.06% to 7.11% in 2018 and from 0.64% to 5.49% in 2017. Effectiveinterest rates for foreign currency−denominated financial assets at FVPL for the Group range from0.71% to 6.28% in 2018 and from 2.29% to 10.16% in 2017. Effective interest rates for foreigncurrency−denominated financial assets at FVPL for the Parent Company range from 0.71% to 6.28%in 2018 and from 2.29% to 10.16% in 2017.
Financial Assets at FVOCIAs of December 31, 2018, this account consists of:
Consolidated Parent CompanyQuoted Government bonds (Notes 18 and 28) P=9,944,507 P=8,141,359 Private bonds 35,370 1,676 Equities 103,285 51,610
10,083,162 8,194,645Unquoted
Equities − net 18,365 18,36518,365 18,365
Total P=10,101,527 P=8,213,010
182
VJNQUISIDO
Rectangle
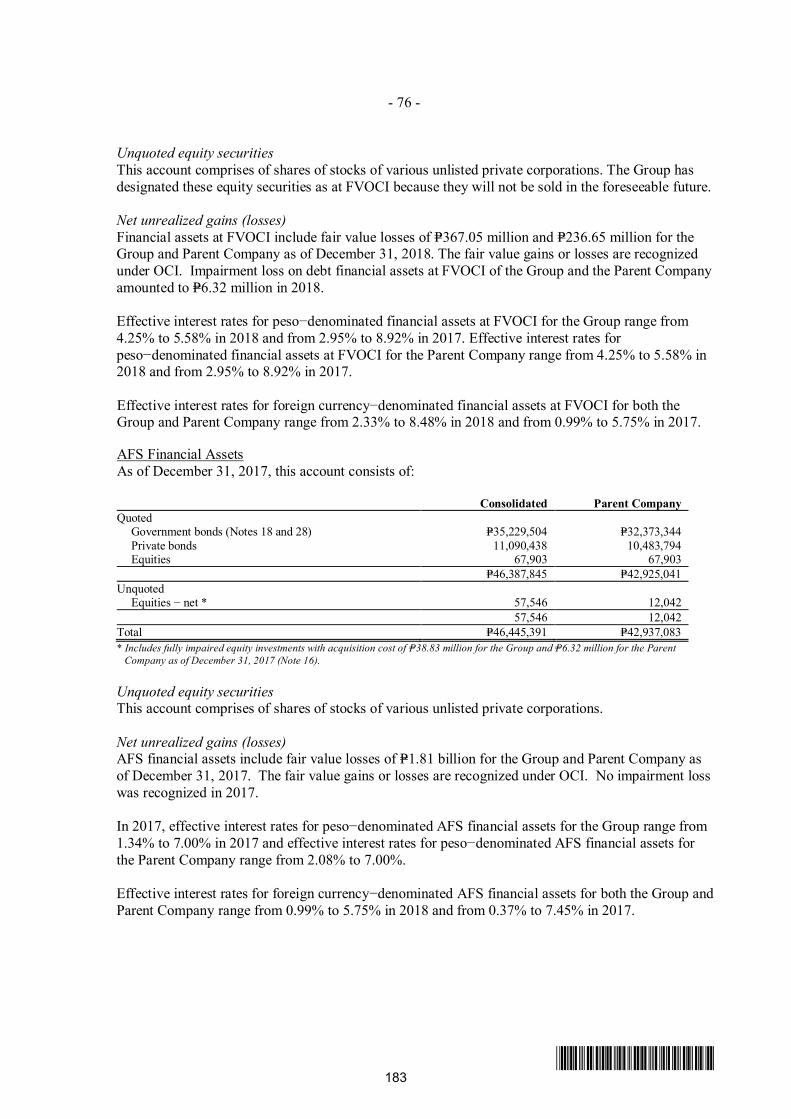
- 76 -
*SGVFS032944*
Unquoted equity securitiesThis account comprises of shares of stocks of various unlisted private corporations. The Group hasdesignated these equity securities as at FVOCI because they will not be sold in the foreseeable future.
Net unrealized gains (losses)Financial assets at FVOCI include fair value losses of P=367.05 million and P=236.65 million for theGroup and Parent Company as of December 31, 2018. The fair value gains or losses are recognizedunder OCI. Impairment loss on debt financial assets at FVOCI of the Group and the Parent Companyamounted to P=6.32 million in 2018.
Effective interest rates for peso−denominated financial assets at FVOCI for the Group range from4.25% to 5.58% in 2018 and from 2.95% to 8.92% in 2017. Effective interest rates forpeso−denominated financial assets at FVOCI for the Parent Company range from 4.25% to 5.58% in2018 and from 2.95% to 8.92% in 2017.
Effective interest rates for foreign currency−denominated financial assets at FVOCI for both theGroup and Parent Company range from 2.33% to 8.48% in 2018 and from 0.99% to 5.75% in 2017.
AFS Financial AssetsAs of December 31, 2017, this account consists of:
Consolidated Parent CompanyQuoted Government bonds (Notes 18 and 28) P=35,229,504 P=32,373,344 Private bonds 11,090,438 10,483,794 Equities 67,903 67,903
P=46,387,845 P=42,925,041Unquoted Equities − net * 57,546 12,042
57,546 12,042Total P=46,445,391 P=42,937,083* Includes fully impaired equity investments with acquisition cost of P=38.83 million for the Group and P=6.32 million for the Parent
Company as of December 31, 2017 (Note 16).
Unquoted equity securitiesThis account comprises of shares of stocks of various unlisted private corporations.
Net unrealized gains (losses)AFS financial assets include fair value losses of P=1.81 billion for the Group and Parent Company asof December 31, 2017. The fair value gains or losses are recognized under OCI. No impairment losswas recognized in 2017.
In 2017, effective interest rates for peso−denominated AFS financial assets for the Group range from1.34% to 7.00% in 2017 and effective interest rates for peso−denominated AFS financial assets forthe Parent Company range from 2.08% to 7.00%.
Effective interest rates for foreign currency−denominated AFS financial assets for both the Group andParent Company range from 0.99% to 5.75% in 2018 and from 0.37% to 7.45% in 2017.
183
VJNQUISIDO
Rectangle
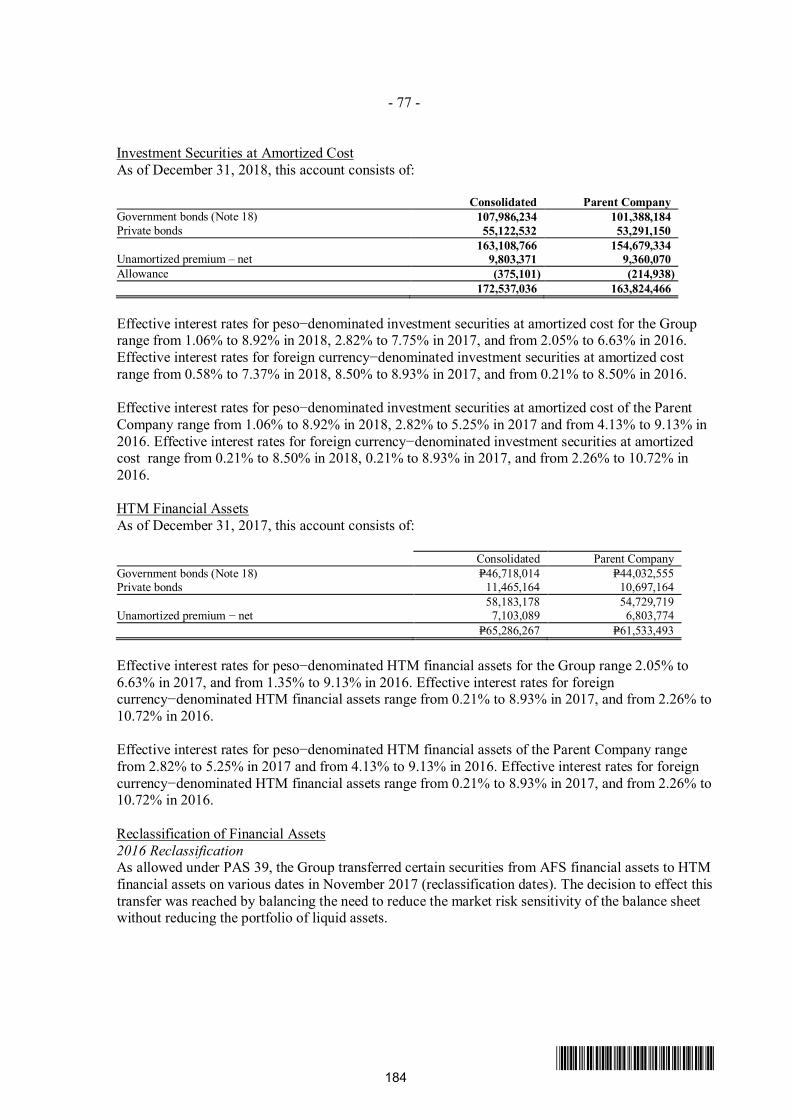
- 77 -
*SGVFS032944*
Investment Securities at Amortized CostAs of December 31, 2018, this account consists of:
Consolidated Parent CompanyGovernment bonds (Note 18) 107,986,234 101,388,184Private bonds 55,122,532 53,291,150
163,108,766 154,679,334Unamortized premium – net 9,803,371 9,360,070Allowance (375,101) (214,938)
172,537,036 163,824,466
Effective interest rates for peso−denominated investment securities at amortized cost for the Grouprange from 1.06% to 8.92% in 2018, 2.82% to 7.75% in 2017, and from 2.05% to 6.63% in 2016.Effective interest rates for foreign currency−denominated investment securities at amortized costrange from 0.58% to 7.37% in 2018, 8.50% to 8.93% in 2017, and from 0.21% to 8.50% in 2016.
Effective interest rates for peso−denominated investment securities at amortized cost of the ParentCompany range from 1.06% to 8.92% in 2018, 2.82% to 5.25% in 2017 and from 4.13% to 9.13% in2016. Effective interest rates for foreign currency−denominated investment securities at amortizedcost range from 0.21% to 8.50% in 2018, 0.21% to 8.93% in 2017, and from 2.26% to 10.72% in2016.
HTM Financial AssetsAs of December 31, 2017, this account consists of:
Consolidated Parent CompanyGovernment bonds (Note 18) P=46,718,014 P=44,032,555Private bonds 11,465,164 10,697,164
58,183,178 54,729,719Unamortized premium − net 7,103,089 6,803,774
P=65,286,267 P=61,533,493
Effective interest rates for peso−denominated HTM financial assets for the Group range 2.05% to6.63% in 2017, and from 1.35% to 9.13% in 2016. Effective interest rates for foreigncurrency−denominated HTM financial assets range from 0.21% to 8.93% in 2017, and from 2.26% to10.72% in 2016.
Effective interest rates for peso−denominated HTM financial assets of the Parent Company rangefrom 2.82% to 5.25% in 2017 and from 4.13% to 9.13% in 2016. Effective interest rates for foreigncurrency−denominated HTM financial assets range from 0.21% to 8.93% in 2017, and from 2.26% to10.72% in 2016.
Reclassification of Financial Assets2016 ReclassificationAs allowed under PAS 39, the Group transferred certain securities from AFS financial assets to HTMfinancial assets on various dates in November 2017 (reclassification dates). The decision to effect thistransfer was reached by balancing the need to reduce the market risk sensitivity of the balance sheetwithout reducing the portfolio of liquid assets.
184
VJNQUISIDO
Rectangle
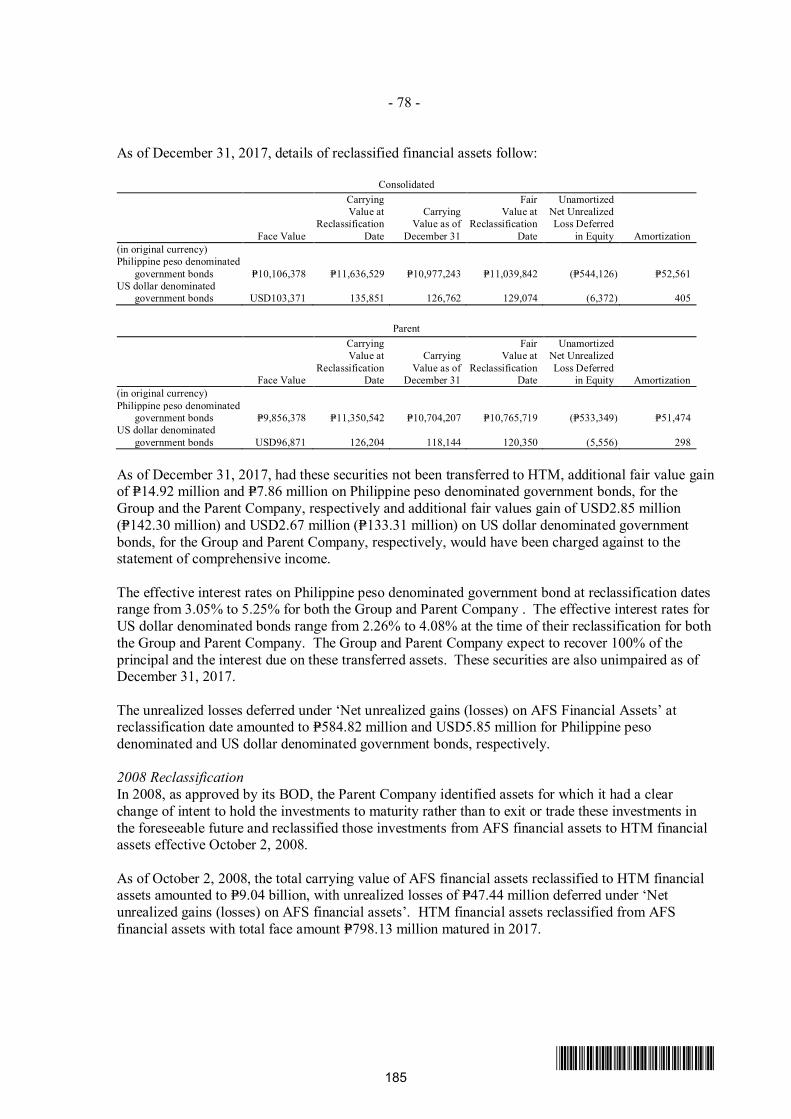
- 78 -
*SGVFS032944*
As of December 31, 2017, details of reclassified financial assets follow:
Consolidated
Face Value
CarryingValue at
ReclassificationDate
CarryingValue as of
December 31
FairValue at
ReclassificationDate
UnamortizedNet UnrealizedLoss Deferred
in Equity Amortization(in original currency)Philippine peso denominated
government bonds P=10,106,378 P=11,636,529 P=10,977,243 P=11,039,842 (P=544,126) P=52,561US dollar denominated
government bonds USD103,371 135,851 126,762 129,074 (6,372) 405
Parent
Face Value
CarryingValue at
ReclassificationDate
CarryingValue as of
December 31
FairValue at
ReclassificationDate
UnamortizedNet UnrealizedLoss Deferred
in Equity Amortization(in original currency)Philippine peso denominated
government bonds P=9,856,378 P=11,350,542 P=10,704,207 P=10,765,719 (P=533,349) P=51,474US dollar denominated
government bonds USD96,871 126,204 118,144 120,350 (5,556) 298
As of December 31, 2017, had these securities not been transferred to HTM, additional fair value gainof P=14.92 million and P=7.86 million on Philippine peso denominated government bonds, for theGroup and the Parent Company, respectively and additional fair values gain of USD2.85 million(P=142.30 million) and USD2.67 million (P=133.31 million) on US dollar denominated governmentbonds, for the Group and Parent Company, respectively, would have been charged against to thestatement of comprehensive income.
The effective interest rates on Philippine peso denominated government bond at reclassification datesrange from 3.05% to 5.25% for both the Group and Parent Company . The effective interest rates forUS dollar denominated bonds range from 2.26% to 4.08% at the time of their reclassification for boththe Group and Parent Company. The Group and Parent Company expect to recover 100% of theprincipal and the interest due on these transferred assets. These securities are also unimpaired as ofDecember 31, 2017.
The unrealized losses deferred under ‘Net unrealized gains (losses) on AFS Financial Assets’ atreclassification date amounted to P=584.82 million and USD5.85 million for Philippine pesodenominated and US dollar denominated government bonds, respectively.
2008 ReclassificationIn 2008, as approved by its BOD, the Parent Company identified assets for which it had a clearchange of intent to hold the investments to maturity rather than to exit or trade these investments inthe foreseeable future and reclassified those investments from AFS financial assets to HTM financialassets effective October 2, 2008.
As of October 2, 2008, the total carrying value of AFS financial assets reclassified to HTM financialassets amounted to P=9.04 billion, with unrealized losses of P=47.44 million deferred under ‘Netunrealized gains (losses) on AFS financial assets’. HTM financial assets reclassified from AFSfinancial assets with total face amount P=798.13 million matured in 2017.
185
VJNQUISIDO
Rectangle
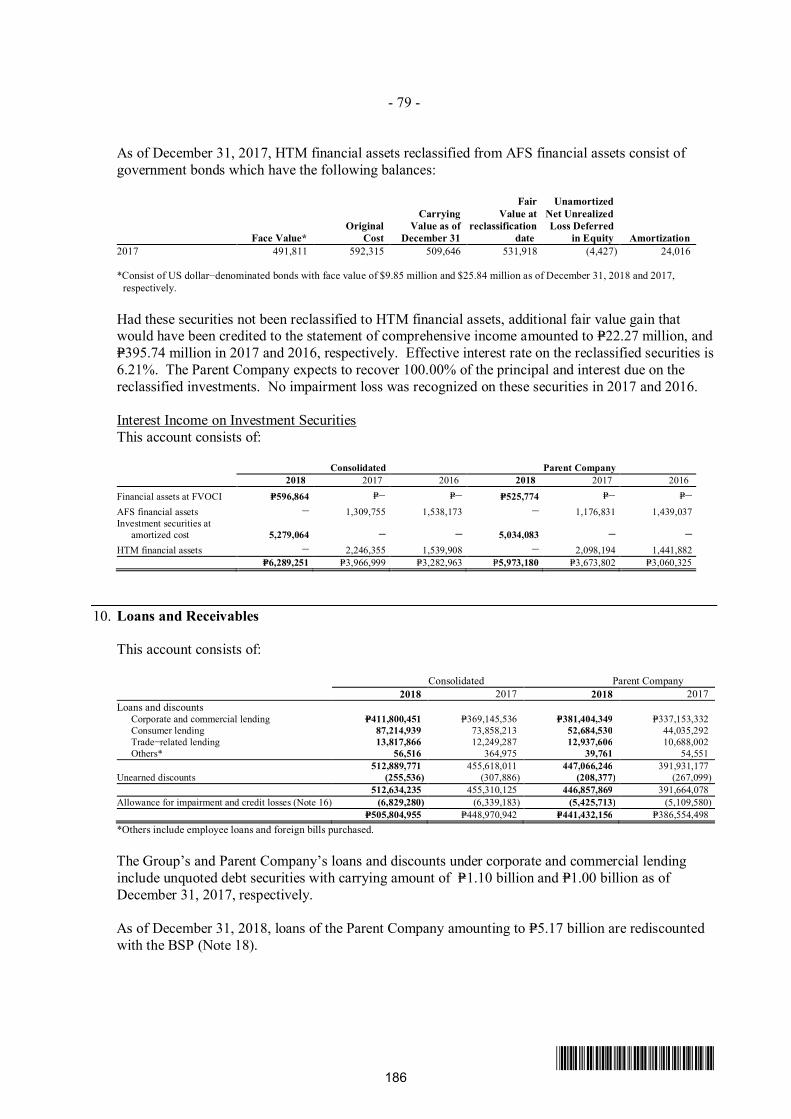
- 79 -
*SGVFS032944*
As of December 31, 2017, HTM financial assets reclassified from AFS financial assets consist ofgovernment bonds which have the following balances:
Face Value*Original
Cost
CarryingValue as of
December 31
FairValue at
reclassificationdate
UnamortizedNet UnrealizedLoss Deferred
in Equity Amortization2017 491,811 592,315 509,646 531,918 (4,427) 24,016
*Consist of US dollar−denominated bonds with face value of $9.85 million and $25.84 million as of December 31, 2018 and 2017,respectively.
Had these securities not been reclassified to HTM financial assets, additional fair value gain thatwould have been credited to the statement of comprehensive income amounted to P=22.27 million, andP=395.74 million in 2017 and 2016, respectively. Effective interest rate on the reclassified securities is6.21%. The Parent Company expects to recover 100.00% of the principal and interest due on thereclassified investments. No impairment loss was recognized on these securities in 2017 and 2016.
Interest Income on Investment SecuritiesThis account consists of:
Consolidated Parent Company2018 2017 2016 2018 2017 2016
Financial assets at FVOCI P=596,864 P=– P=– P=525,774 P=– P=–AFS financial assets – 1,309,755 1,538,173 – 1,176,831 1,439,037Investment securities at
amortized cost 5,279,064 – – 5,034,083 – –HTM financial assets – 2,246,355 1,539,908 – 2,098,194 1,441,882
P=6,289,251 P=3,966,999 P=3,282,963 P=5,973,180 P=3,673,802 P=3,060,325
10. Loans and Receivables
This account consists of:
Consolidated Parent Company2018 2017 2018 2017
Loans and discounts Corporate and commercial lending P=411,800,451 P=369,145,536 P=381,404,349 P=337,153,332 Consumer lending 87,214,939 73,858,213 52,684,530 44,035,292
Trade−related lending 13,817,866 12,249,287 12,937,606 10,688,002 Others* 56,516 364,975 39,761 54,551
512,889,771 455,618,011 447,066,246 391,931,177Unearned discounts (255,536) (307,886) (208,377) (267,099)
512,634,235 455,310,125 446,857,869 391,664,078Allowance for impairment and credit losses (Note 16) (6,829,280) (6,339,183) (5,425,713) (5,109,580)
P=505,804,955 P=448,970,942 P=441,432,156 P=386,554,498*Others include employee loans and foreign bills purchased.
The Group’s and Parent Company’s loans and discounts under corporate and commercial lendinginclude unquoted debt securities with carrying amount of P=1.10 billion and P=1.00 billion as ofDecember 31, 2017, respectively.
As of December 31, 2018, loans of the Parent Company amounting to P=5.17 billion are rediscountedwith the BSP (Note 18).
186
VJNQUISIDO
Rectangle
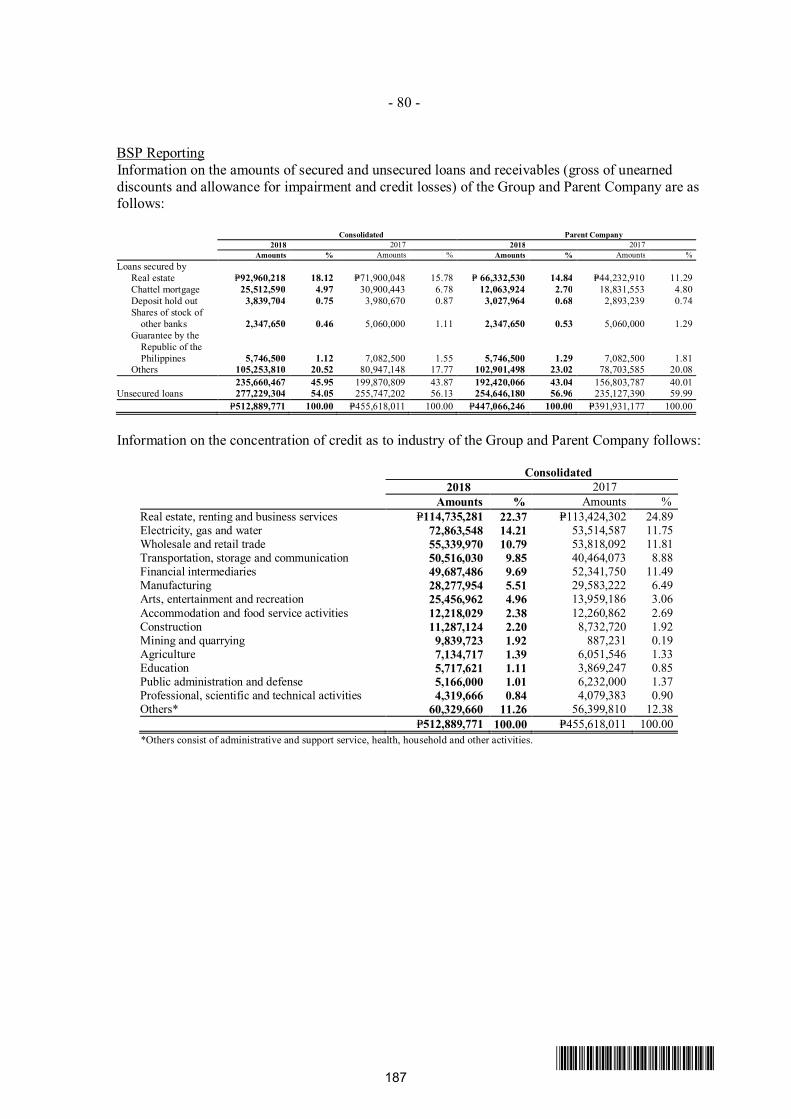
- 80 -
*SGVFS032944*
BSP ReportingInformation on the amounts of secured and unsecured loans and receivables (gross of unearneddiscounts and allowance for impairment and credit losses) of the Group and Parent Company are asfollows:
Consolidated Parent Company2018 2017 2018 2017
Amounts % Amounts % Amounts % Amounts %Loans secured by Real estate P=92,960,218 18.12 P=71,900,048 15.78 P= 66,332,530 14.84 P=44,232,910 11.29 Chattel mortgage 25,512,590 4.97 30,900,443 6.78 12,063,924 2.70 18,831,553 4.80 Deposit hold out 3,839,704 0.75 3,980,670 0.87 3,027,964 0.68 2,893,239 0.74 Shares of stock of
other banks 2,347,650 0.46 5,060,000 1.11 2,347,650 0.53 5,060,000 1.29 Guarantee by the
Republic of the Philippines 5,746,500 1.12 7,082,500 1.55 5,746,500 1.29 7,082,500 1.81
Others 105,253,810 20.52 80,947,148 17.77 102,901,498 23.02 78,703,585 20.08235,660,467 45.95 199,870,809 43.87 192,420,066 43.04 156,803,787 40.01
Unsecured loans 277,229,304 54.05 255,747,202 56.13 254,646,180 56.96 235,127,390 59.99P=512,889,771 100.00 P=455,618,011 100.00 P=447,066,246 100.00 P=391,931,177 100.00
Information on the concentration of credit as to industry of the Group and Parent Company follows:
Consolidated2018 2017
Amounts % Amounts %Real estate, renting and business services P=114,735,281 22.37 P=113,424,302 24.89Electricity, gas and water 72,863,548 14.21 53,514,587 11.75Wholesale and retail trade 55,339,970 10.79 53,818,092 11.81Transportation, storage and communication 50,516,030 9.85 40,464,073 8.88Financial intermediaries 49,687,486 9.69 52,341,750 11.49Manufacturing 28,277,954 5.51 29,583,222 6.49Arts, entertainment and recreation 25,456,962 4.96 13,959,186 3.06Accommodation and food service activities 12,218,029 2.38 12,260,862 2.69Construction 11,287,124 2.20 8,732,720 1.92Mining and quarrying 9,839,723 1.92 887,231 0.19Agriculture 7,134,717 1.39 6,051,546 1.33Education 5,717,621 1.11 3,869,247 0.85Public administration and defense 5,166,000 1.01 6,232,000 1.37Professional, scientific and technical activities 4,319,666 0.84 4,079,383 0.90Others* 60,329,660 11.26 56,399,810 12.38
P=512,889,771 100.00 P=455,618,011 100.00*Others consist of administrative and support service, health, household and other activities.
187
VJNQUISIDO
Rectangle
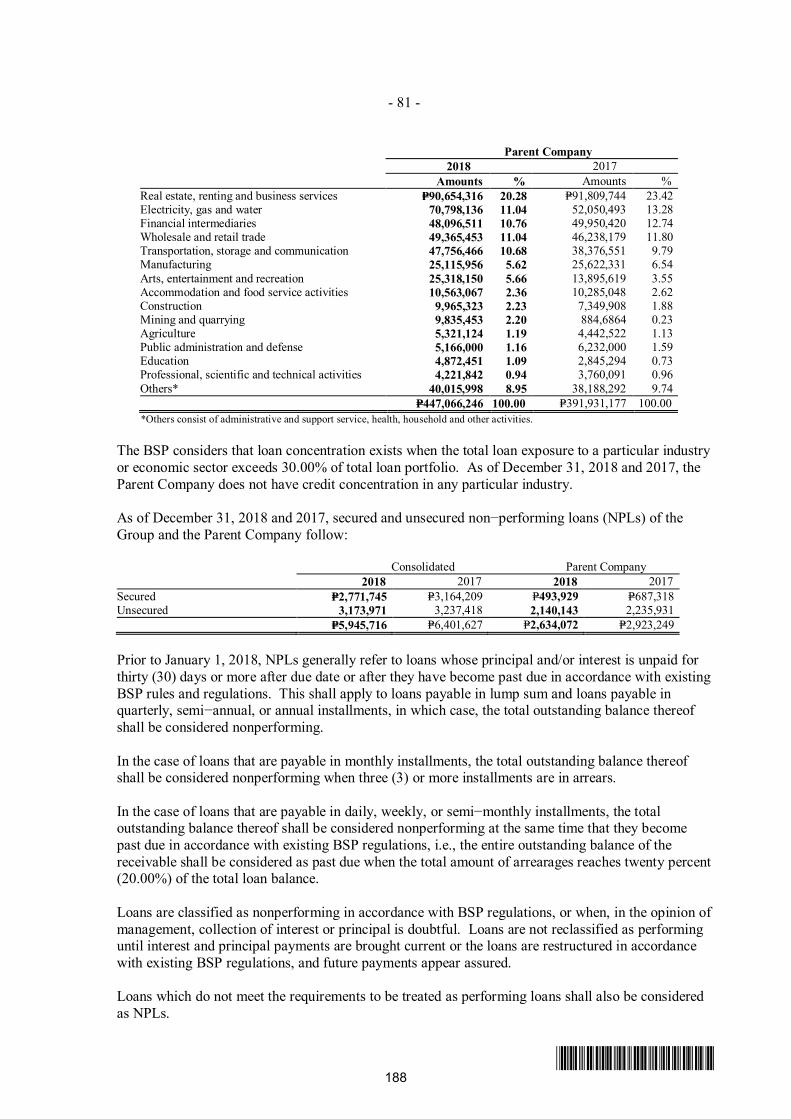
- 81 -
*SGVFS032944*
Parent Company2018 2017
Amounts % Amounts %Real estate, renting and business services P=90,654,316 20.28 P=91,809,744 23.42Electricity, gas and water 70,798,136 11.04 52,050,493 13.28Financial intermediaries 48,096,511 10.76 49,950,420 12.74Wholesale and retail trade 49,365,453 11.04 46,238,179 11.80Transportation, storage and communication 47,756,466 10.68 38,376,551 9.79Manufacturing 25,115,956 5.62 25,622,331 6.54Arts, entertainment and recreation 25,318,150 5.66 13,895,619 3.55Accommodation and food service activities 10,563,067 2.36 10,285,048 2.62Construction 9,965,323 2.23 7,349,908 1.88Mining and quarrying 9,835,453 2.20 884,6864 0.23Agriculture 5,321,124 1.19 4,442,522 1.13Public administration and defense 5,166,000 1.16 6,232,000 1.59Education 4,872,451 1.09 2,845,294 0.73Professional, scientific and technical activities 4,221,842 0.94 3,760,091 0.96Others* 40,015,998 8.95 38,188,292 9.74
P=447,066,246 100.00 P=391,931,177 100.00*Others consist of administrative and support service, health, household and other activities.
The BSP considers that loan concentration exists when the total loan exposure to a particular industryor economic sector exceeds 30.00% of total loan portfolio. As of December 31, 2018 and 2017, theParent Company does not have credit concentration in any particular industry.
As of December 31, 2018 and 2017, secured and unsecured non−performing loans (NPLs) of theGroup and the Parent Company follow:
Consolidated Parent Company2018 2017 2018 2017
Secured P=2,771,745 P=3,164,209 P=493,929 P=687,318Unsecured 3,173,971 3,237,418 2,140,143 2,235,931
P=5,945,716 P=6,401,627 P=2,634,072 P=2,923,249
Prior to January 1, 2018, NPLs generally refer to loans whose principal and/or interest is unpaid forthirty (30) days or more after due date or after they have become past due in accordance with existingBSP rules and regulations. This shall apply to loans payable in lump sum and loans payable inquarterly, semi−annual, or annual installments, in which case, the total outstanding balance thereofshall be considered nonperforming.
In the case of loans that are payable in monthly installments, the total outstanding balance thereofshall be considered nonperforming when three (3) or more installments are in arrears.
In the case of loans that are payable in daily, weekly, or semi−monthly installments, the totaloutstanding balance thereof shall be considered nonperforming at the same time that they becomepast due in accordance with existing BSP regulations, i.e., the entire outstanding balance of thereceivable shall be considered as past due when the total amount of arrearages reaches twenty percent(20.00%) of the total loan balance.
Loans are classified as nonperforming in accordance with BSP regulations, or when, in the opinion ofmanagement, collection of interest or principal is doubtful. Loans are not reclassified as performinguntil interest and principal payments are brought current or the loans are restructured in accordancewith existing BSP regulations, and future payments appear assured.
Loans which do not meet the requirements to be treated as performing loans shall also be consideredas NPLs.
188
VJNQUISIDO
Rectangle
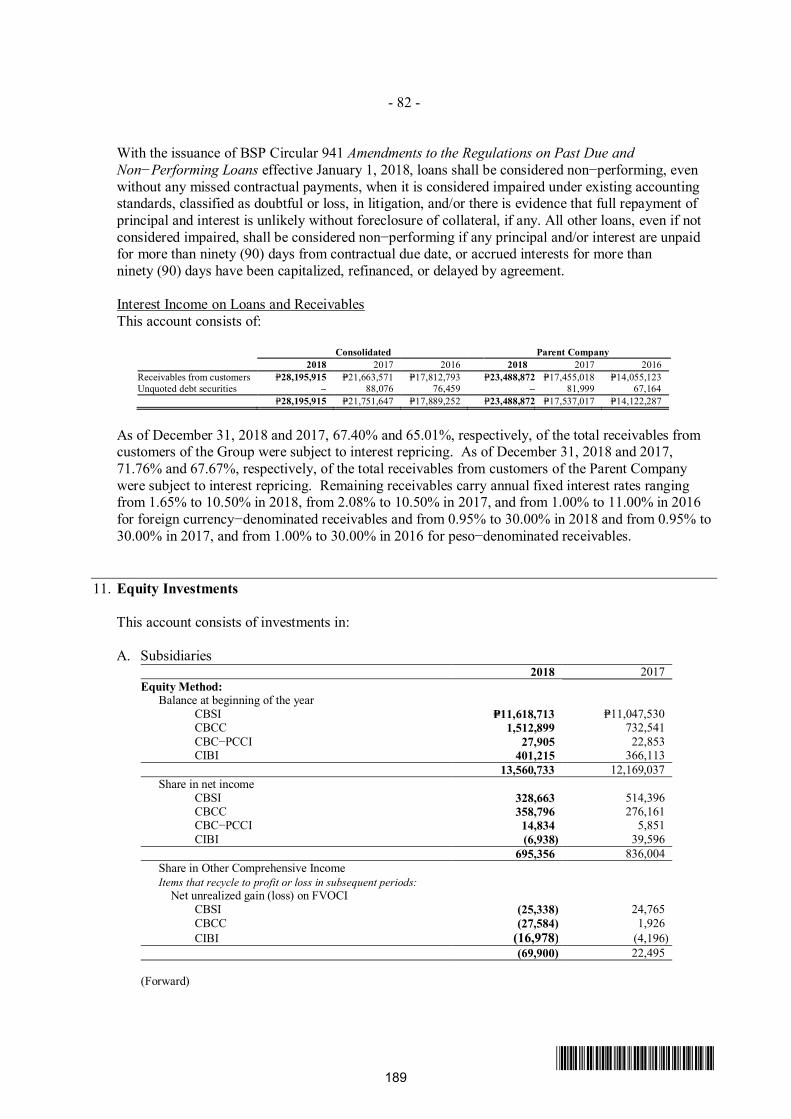
- 82 -
*SGVFS032944*
With the issuance of BSP Circular 941 Amendments to the Regulations on Past Due andNon−Performing Loans effective January 1, 2018, loans shall be considered non−performing, evenwithout any missed contractual payments, when it is considered impaired under existing accountingstandards, classified as doubtful or loss, in litigation, and/or there is evidence that full repayment ofprincipal and interest is unlikely without foreclosure of collateral, if any. All other loans, even if notconsidered impaired, shall be considered non−performing if any principal and/or interest are unpaidfor more than ninety (90) days from contractual due date, or accrued interests for more thanninety (90) days have been capitalized, refinanced, or delayed by agreement.
Interest Income on Loans and ReceivablesThis account consists of:
Consolidated Parent Company2018 2017 2016 2018 2017 2016
Receivables from customers P=28,195,915 P=21,663,571 P=17,812,793 P=23,488,872 P=17,455,018 P=14,055,123Unquoted debt securities – 88,076 76,459 – 81,999 67,164
P=28,195,915 P=21,751,647 P=17,889,252 P=23,488,872 P=17,537,017 P=14,122,287
As of December 31, 2018 and 2017, 67.40% and 65.01%, respectively, of the total receivables fromcustomers of the Group were subject to interest repricing. As of December 31, 2018 and 2017,71.76% and 67.67%, respectively, of the total receivables from customers of the Parent Companywere subject to interest repricing. Remaining receivables carry annual fixed interest rates rangingfrom 1.65% to 10.50% in 2018, from 2.08% to 10.50% in 2017, and from 1.00% to 11.00% in 2016for foreign currency−denominated receivables and from 0.95% to 30.00% in 2018 and from 0.95% to30.00% in 2017, and from 1.00% to 30.00% in 2016 for peso−denominated receivables.
11. Equity Investments
This account consists of investments in:
A. Subsidiaries2018 2017
Equity Method:Balance at beginning of the year
CBSI P=11,618,713 P=11,047,530 CBCC 1,512,899 732,541 CBC−PCCI 27,905 22,853 CIBI 401,215 366,113
13,560,733 12,169,037Share in net income
CBSI 328,663 514,396 CBCC 358,796 276,161 CBC−PCCI 14,834 5,851 CIBI (6,938) 39,596
695,356 836,004Share in Other Comprehensive IncomeItems that recycle to profit or loss in subsequent periods:
Net unrealized gain (loss) on FVOCI CBSI (25,338) 24,765 CBCC (27,584) 1,926 CIBI (16,978) (4,196)
(69,900) 22,495
(Forward)
189
VJNQUISIDO
Rectangle
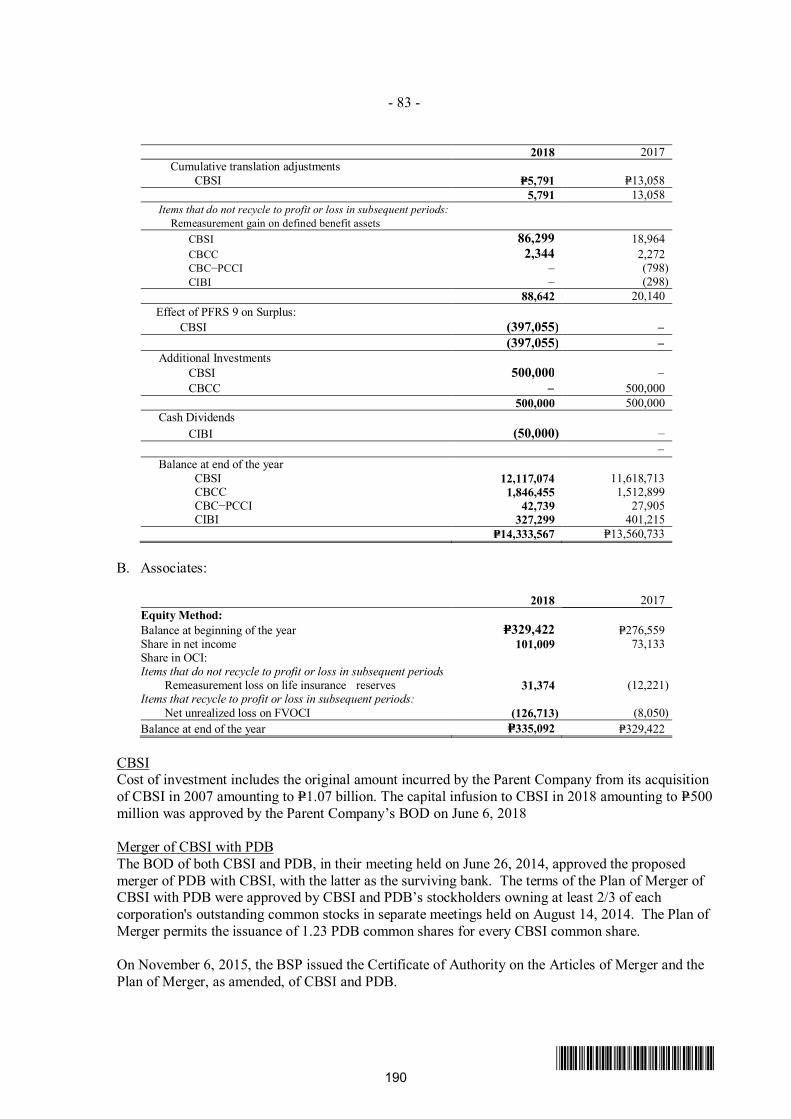
- 83 -
*SGVFS032944*
2018 2017Cumulative translation adjustments
CBSI P=5,791 P=13,0585,791 13,058
Items that do not recycle to profit or loss in subsequent periods:Remeasurement gain on defined benefit assets
CBSI 86,299 18,964 CBCC 2,344 2,272 CBC−PCCI – (798) CIBI – (298)
88,642 20,140 Effect of PFRS 9 on Surplus: CBSI (397,055) –
(397,055) –Additional Investments
CBSI 500,000 – CBCC – 500,000
500,000 500,000Cash Dividends
CIBI (50,000) ––
Balance at end of the year CBSI 12,117,074 11,618,713 CBCC 1,846,455 1,512,899 CBC−PCCI 42,739 27,905 CIBI 327,299 401,215
P=14,333,567 P=13,560,733
B. Associates:
2018 2017Equity Method:Balance at beginning of the year P=329,422 P=276,559Share in net income 101,009 73,133Share in OCI:Items that do not recycle to profit or loss in subsequent periods Remeasurement loss on life insurance reserves 31,374 (12,221)Items that recycle to profit or loss in subsequent periods:
Net unrealized loss on FVOCI (126,713) (8,050)Balance at end of the year P=335,092 P=329,422
CBSICost of investment includes the original amount incurred by the Parent Company from its acquisitionof CBSI in 2007 amounting to P=1.07 billion. The capital infusion to CBSI in 2018 amounting to P=500million was approved by the Parent Company’s BOD on June 6, 2018
Merger of CBSI with PDBThe BOD of both CBSI and PDB, in their meeting held on June 26, 2014, approved the proposedmerger of PDB with CBSI, with the latter as the surviving bank. The terms of the Plan of Merger ofCBSI with PDB were approved by CBSI and PDB’s stockholders owning at least 2/3 of eachcorporation's outstanding common stocks in separate meetings held on August 14, 2014. The Plan ofMerger permits the issuance of 1.23 PDB common shares for every CBSI common share.
On November 6, 2015, the BSP issued the Certificate of Authority on the Articles of Merger and thePlan of Merger, as amended, of CBSI and PDB.
190
VJNQUISIDO
Rectangle
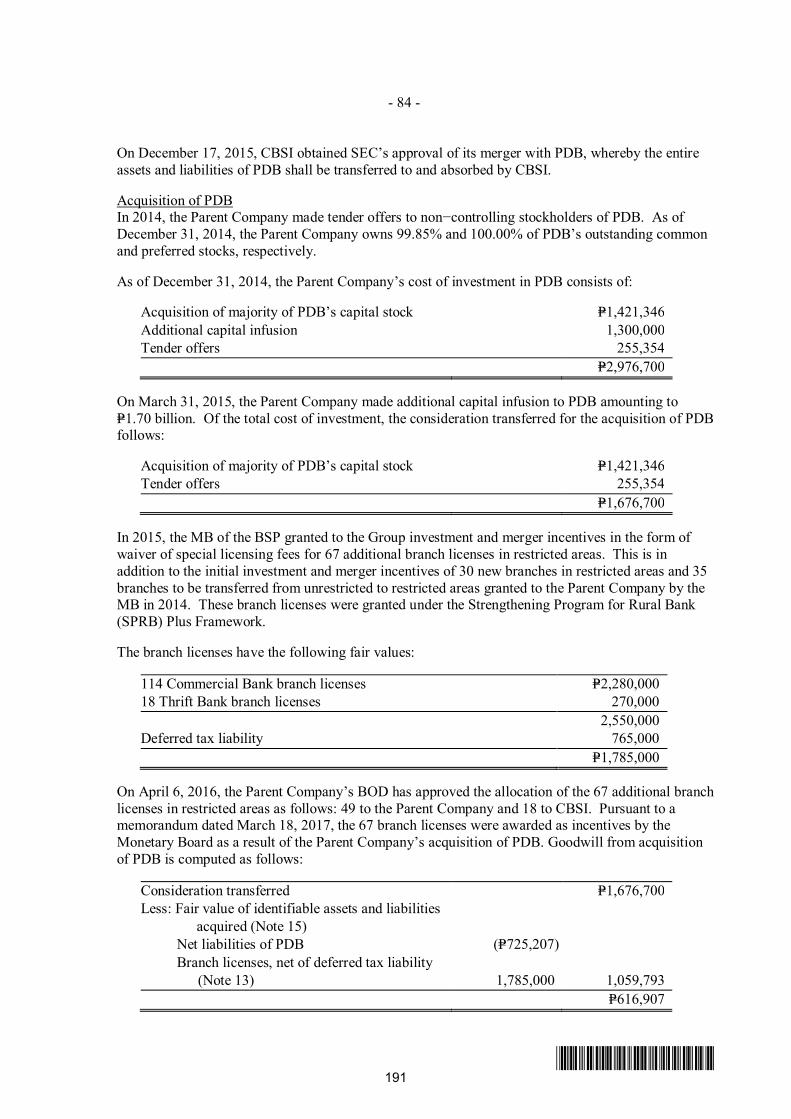
- 84 -
*SGVFS032944*
On December 17, 2015, CBSI obtained SEC’s approval of its merger with PDB, whereby the entireassets and liabilities of PDB shall be transferred to and absorbed by CBSI.
Acquisition of PDBIn 2014, the Parent Company made tender offers to non−controlling stockholders of PDB. As ofDecember 31, 2014, the Parent Company owns 99.85% and 100.00% of PDB’s outstanding commonand preferred stocks, respectively.
As of December 31, 2014, the Parent Company’s cost of investment in PDB consists of:
Acquisition of majority of PDB’s capital stock P=1,421,346Additional capital infusion 1,300,000Tender offers 255,354
P=2,976,700
On March 31, 2015, the Parent Company made additional capital infusion to PDB amounting toP=1.70 billion. Of the total cost of investment, the consideration transferred for the acquisition of PDBfollows:
Acquisition of majority of PDB’s capital stock P=1,421,346Tender offers 255,354
P=1,676,700
In 2015, the MB of the BSP granted to the Group investment and merger incentives in the form ofwaiver of special licensing fees for 67 additional branch licenses in restricted areas. This is inaddition to the initial investment and merger incentives of 30 new branches in restricted areas and 35branches to be transferred from unrestricted to restricted areas granted to the Parent Company by theMB in 2014. These branch licenses were granted under the Strengthening Program for Rural Bank(SPRB) Plus Framework.
The branch licenses have the following fair values:
114 Commercial Bank branch licenses P=2,280,00018 Thrift Bank branch licenses 270,000
2,550,000Deferred tax liability 765,000
P=1,785,000
On April 6, 2016, the Parent Company’s BOD has approved the allocation of the 67 additional branchlicenses in restricted areas as follows: 49 to the Parent Company and 18 to CBSI. Pursuant to amemorandum dated March 18, 2017, the 67 branch licenses were awarded as incentives by theMonetary Board as a result of the Parent Company’s acquisition of PDB. Goodwill from acquisitionof PDB is computed as follows:
Consideration transferred P=1,676,700Less: Fair value of identifiable assets and liabilities
acquired (Note 15)Net liabilities of PDB (P=725,207)Branch licenses, net of deferred tax liability
(Note 13) 1,785,000 1,059,793P=616,907
191
VJNQUISIDO
Rectangle
- 85 -
*SGVFS032944*
CIBIOn December 7, 2018, the BOD of CIBI approved the declaration of the cash dividends ofP=50 million from the CIBI’s unrestricted retained earnings for Stockholders on record as of December15, 2018 payable on December 26, 2018.
CBCCOn April 1, 2015, the BOD approved the investment of the Parent Company in an investment housesubsidiary, CBCC, up to the amount of P=500.00 million, subject to the requirements of relevantregulatory agencies. On April 30, 2015, the BSP approved the request of the Parent Company toinvest up to 100% or up to P=500.00 million common shares in CBCC, subject to certain conditions.On November 27, 2015, the SEC approved the Articles of Incorporation and By−Laws of CBCC. Italso granted CBCC the license to operate as an investment house. Actual capital infusion to CBCCamounted to P=200.00 million and P=300.00 million in 2016 and 2015, respectively.
On January 19, 2017, the BOD of CBCC approved the increase in authorized capital stock of CBCCfrom P=500.00 million to P=2.00 billion to enable CBCC to handle bigger deals. The approval wasratified by the BOD of the Parent Company on February 1, 2017. On April 27, 2017, the ParentCompany paid CBCC P=500.00 million for additional subscription of 50,000,000 shares.
CBCC acquisition of CBCSec (formerly ATC Securities, Inc.)On May 19, 2016, the BOD of CBCC approved the acquisition of ATC Securities, Inc. (ATC).
On June 29, 2016, CBCC and the shareholders of ATC (the Original Shareholders) entered into anAgreement for the Purchase of Shares (Agreement), whereby CBCC agreed to buy, and the OriginalShareholders agreed to sell, 3,800,000 shares representing 100% of the issued and outstanding sharesof ATC.
The initial purchase price for the acquisition of ATC was set at P=21,767,997.50, payable as follows:
a. 10% – on signing date of the Agreement (June 29, 2016)b. 70% of the purchase price – on closing date (March 6, 2017)c. 10% of the purchase price – upon receipt of Certificates Authorizing Registration and Tax
Clearance Certificatesd. 10% of the purchase price – one year from the closing date (March 6, 2018), subject to any
deduction for certain losses
On February 22, 2017, the Philippine Stock Exchange approved ATC’s application for change incontrolling interest through CBCC’s acquisition of 100% of the issued and outstanding shares ofATC.
In view of the prolonged period since the Agreement was signed and the resulting change in thefinancial position, prospects, and other circumstances of ATC and its Original Shareholders, theparties agreed to negotiate an adjustment to the purchase price that is mutually acceptable to CBCCand the Original Shareholders.
On March 6, 2017, CBCC and the Original Shareholders agreed to fix the final purchase price of theacquisition at P=26,704,341, and the Original Shareholders executed deeds of absolute sale of theirrespective shares in ATC in favor of CBCC. By virtue of this transaction, CBCC assumed ownershipand control of ATC.
192
VJNQUISIDO
Rectangle
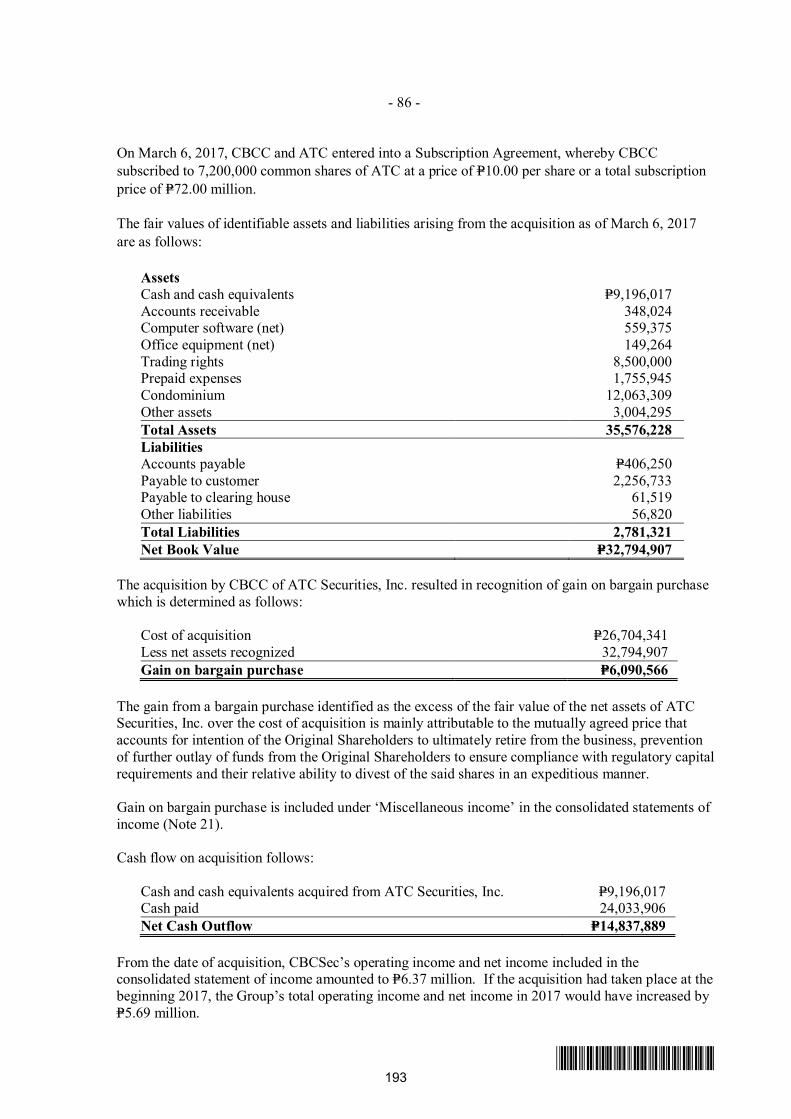
- 86 -
*SGVFS032944*
On March 6, 2017, CBCC and ATC entered into a Subscription Agreement, whereby CBCCsubscribed to 7,200,000 common shares of ATC at a price of P=10.00 per share or a total subscriptionprice of P=72.00 million.
The fair values of identifiable assets and liabilities arising from the acquisition as of March 6, 2017are as follows:
AssetsCash and cash equivalents P=9,196,017Accounts receivable 348,024Computer software (net) 559,375Office equipment (net) 149,264Trading rights 8,500,000Prepaid expenses 1,755,945Condominium 12,063,309Other assets 3,004,295Total Assets 35,576,228LiabilitiesAccounts payable P=406,250Payable to customer 2,256,733Payable to clearing house 61,519Other liabilities 56,820Total Liabilities 2,781,321Net Book Value P=32,794,907
The acquisition by CBCC of ATC Securities, Inc. resulted in recognition of gain on bargain purchasewhich is determined as follows:
Cost of acquisition P=26,704,341Less net assets recognized 32,794,907Gain on bargain purchase P=6,090,566
The gain from a bargain purchase identified as the excess of the fair value of the net assets of ATCSecurities, Inc. over the cost of acquisition is mainly attributable to the mutually agreed price thataccounts for intention of the Original Shareholders to ultimately retire from the business, preventionof further outlay of funds from the Original Shareholders to ensure compliance with regulatory capitalrequirements and their relative ability to divest of the said shares in an expeditious manner.
Gain on bargain purchase is included under ‘Miscellaneous income’ in the consolidated statements ofincome (Note 21).
Cash flow on acquisition follows:
Cash and cash equivalents acquired from ATC Securities, Inc. P=9,196,017Cash paid 24,033,906Net Cash Outflow P=14,837,889
From the date of acquisition, CBCSec’s operating income and net income included in theconsolidated statement of income amounted to P=6.37 million. If the acquisition had taken place at thebeginning 2017, the Group’s total operating income and net income in 2017 would have increased byP=5.69 million.
193
VJNQUISIDO
Rectangle
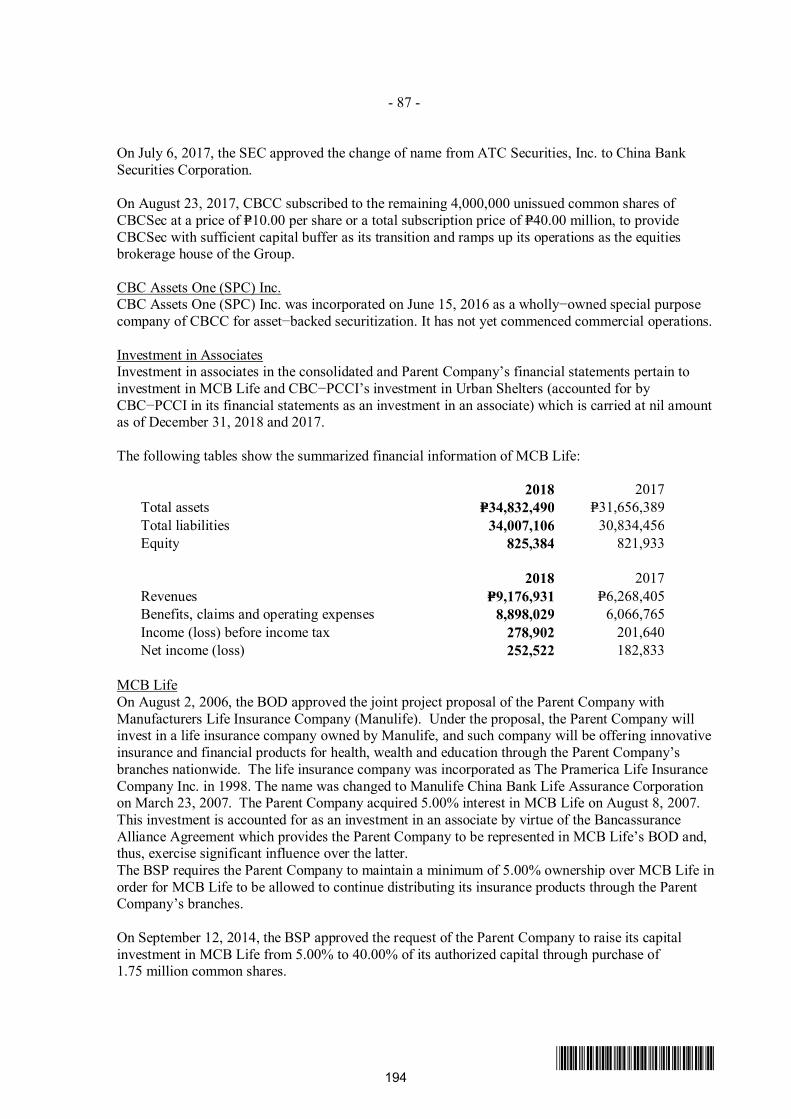
- 87 -
*SGVFS032944*
On July 6, 2017, the SEC approved the change of name from ATC Securities, Inc. to China BankSecurities Corporation.
On August 23, 2017, CBCC subscribed to the remaining 4,000,000 unissued common shares ofCBCSec at a price of P=10.00 per share or a total subscription price of P=40.00 million, to provideCBCSec with sufficient capital buffer as its transition and ramps up its operations as the equitiesbrokerage house of the Group.
CBC Assets One (SPC) Inc.CBC Assets One (SPC) Inc. was incorporated on June 15, 2016 as a wholly−owned special purposecompany of CBCC for asset−backed securitization. It has not yet commenced commercial operations.
Investment in AssociatesInvestment in associates in the consolidated and Parent Company’s financial statements pertain toinvestment in MCB Life and CBC−PCCI’s investment in Urban Shelters (accounted for byCBC−PCCI in its financial statements as an investment in an associate) which is carried at nil amountas of December 31, 2018 and 2017.
The following tables show the summarized financial information of MCB Life:
2018 2017Total assets P=34,832,490 P=31,656,389Total liabilities 34,007,106 30,834,456Equity 825,384 821,933
2018 2017Revenues P=9,176,931 P=6,268,405Benefits, claims and operating expenses 8,898,029 6,066,765Income (loss) before income tax 278,902 201,640Net income (loss) 252,522 182,833
MCB LifeOn August 2, 2006, the BOD approved the joint project proposal of the Parent Company withManufacturers Life Insurance Company (Manulife). Under the proposal, the Parent Company willinvest in a life insurance company owned by Manulife, and such company will be offering innovativeinsurance and financial products for health, wealth and education through the Parent Company’sbranches nationwide. The life insurance company was incorporated as The Pramerica Life InsuranceCompany Inc. in 1998. The name was changed to Manulife China Bank Life Assurance Corporationon March 23, 2007. The Parent Company acquired 5.00% interest in MCB Life on August 8, 2007.This investment is accounted for as an investment in an associate by virtue of the BancassuranceAlliance Agreement which provides the Parent Company to be represented in MCB Life’s BOD and,thus, exercise significant influence over the latter.The BSP requires the Parent Company to maintain a minimum of 5.00% ownership over MCB Life inorder for MCB Life to be allowed to continue distributing its insurance products through the ParentCompany’s branches.
On September 12, 2014, the BSP approved the request of the Parent Company to raise its capitalinvestment in MCB Life from 5.00% to 40.00% of its authorized capital through purchase of1.75 million common shares.
194
VJNQUISIDO
Rectangle
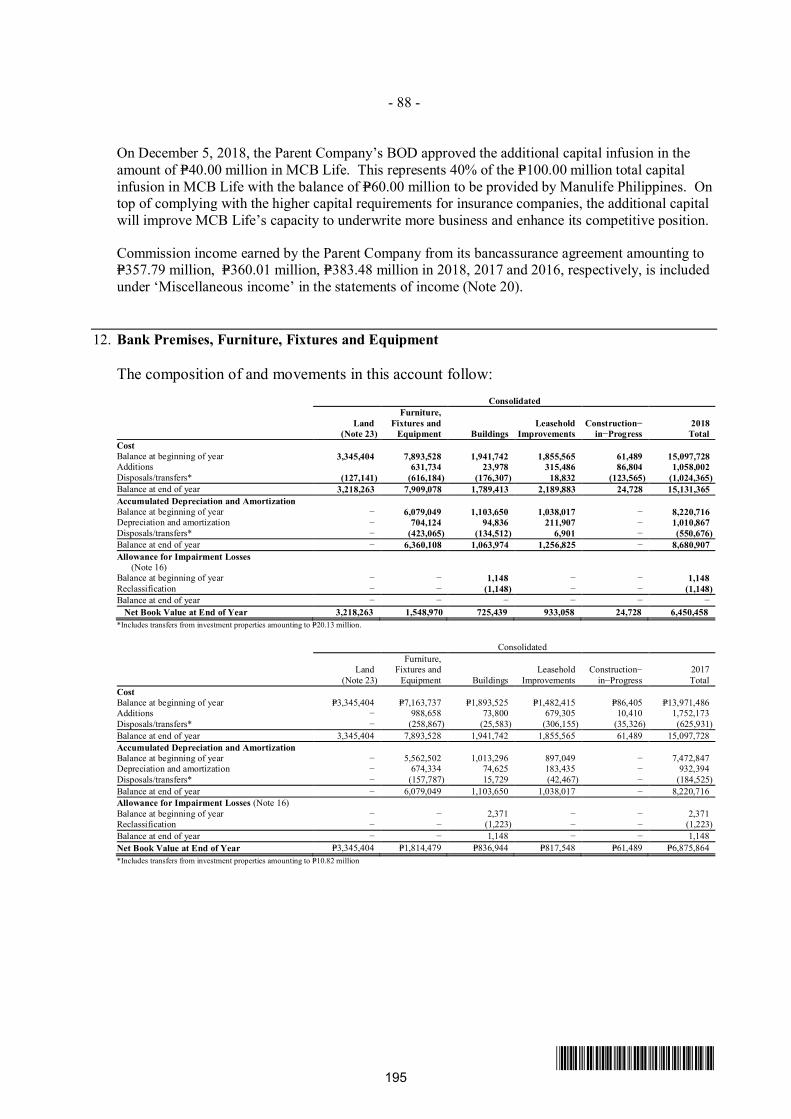
- 88 -
*SGVFS032944*
On December 5, 2018, the Parent Company’s BOD approved the additional capital infusion in theamount of P=40.00 million in MCB Life. This represents 40% of the P=100.00 million total capitalinfusion in MCB Life with the balance of P=60.00 million to be provided by Manulife Philippines. Ontop of complying with the higher capital requirements for insurance companies, the additional capitalwill improve MCB Life’s capacity to underwrite more business and enhance its competitive position.
Commission income earned by the Parent Company from its bancassurance agreement amounting toP=357.79 million, P=360.01 million, P=383.48 million in 2018, 2017 and 2016, respectively, is includedunder ‘Miscellaneous income’ in the statements of income (Note 20).
12. Bank Premises, Furniture, Fixtures and Equipment
The composition of and movements in this account follow:Consolidated
Land(Note 23)
Furniture,Fixtures and
Equipment BuildingsLeasehold
ImprovementsConstruction−
in−Progress2018
TotalCostBalance at beginning of year 3,345,404 7,893,528 1,941,742 1,855,565 61,489 15,097,728Additions 631,734 23,978 315,486 86,804 1,058,002Disposals/transfers* (127,141) (616,184) (176,307) 18,832 (123,565) (1,024,365)Balance at end of year 3,218,263 7,909,078 1,789,413 2,189,883 24,728 15,131,365Accumulated Depreciation and AmortizationBalance at beginning of year − 6,079,049 1,103,650 1,038,017 − 8,220,716Depreciation and amortization − 704,124 94,836 211,907 − 1,010,867Disposals/transfers* − (423,065) (134,512) 6,901 − (550,676)Balance at end of year − 6,360,108 1,063,974 1,256,825 − 8,680,907Allowance for Impairment Losses
(Note 16)Balance at beginning of year − − 1,148 − − 1,148Reclassification − − (1,148) − − (1,148)Balance at end of year − − − − − −
Net Book Value at End of Year 3,218,263 1,548,970 725,439 933,058 24,728 6,450,458*Includes transfers from investment properties amounting to P=20.13 million.
Consolidated
Land(Note 23)
Furniture,Fixtures and
Equipment BuildingsLeasehold
ImprovementsConstruction−
in−Progress2017Total
CostBalance at beginning of year P=3,345,404 P=7,163,737 P=1,893,525 P=1,482,415 P=86,405 P=13,971,486Additions − 988,658 73,800 679,305 10,410 1,752,173Disposals/transfers* − (258,867) (25,583) (306,155) (35,326) (625,931)Balance at end of year 3,345,404 7,893,528 1,941,742 1,855,565 61,489 15,097,728Accumulated Depreciation and AmortizationBalance at beginning of year − 5,562,502 1,013,296 897,049 − 7,472,847Depreciation and amortization − 674,334 74,625 183,435 − 932,394Disposals/transfers* − (157,787) 15,729 (42,467) − (184,525)Balance at end of year − 6,079,049 1,103,650 1,038,017 − 8,220,716Allowance for Impairment Losses (Note 16)Balance at beginning of year − − 2,371 − − 2,371Reclassification − − (1,223) − − (1,223)Balance at end of year − − 1,148 − − 1,148Net Book Value at End of Year P=3,345,404 P=1,814,479 P=836,944 P=817,548 P=61,489 P=6,875,864*Includes transfers from investment properties amounting to P=10.82 million
195
VJNQUISIDO
Rectangle
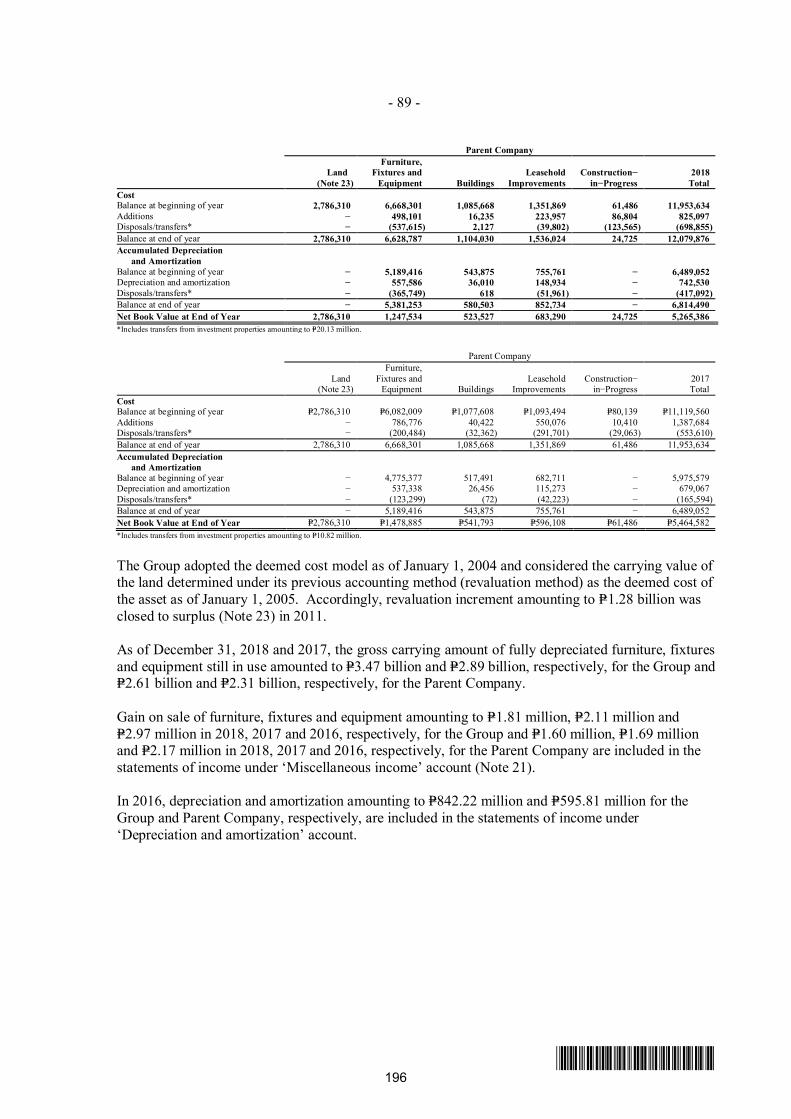
- 89 -
*SGVFS032944*
Parent Company
Land(Note 23)
Furniture,Fixtures and
Equipment BuildingsLeasehold
ImprovementsConstruction−
in−Progress2018
TotalCostBalance at beginning of year 2,786,310 6,668,301 1,085,668 1,351,869 61,486 11,953,634Additions − 498,101 16,235 223,957 86,804 825,097Disposals/transfers* − (537,615) 2,127 (39,802) (123,565) (698,855)Balance at end of year 2,786,310 6,628,787 1,104,030 1,536,024 24,725 12,079,876Accumulated Depreciation
and AmortizationBalance at beginning of year − 5,189,416 543,875 755,761 − 6,489,052Depreciation and amortization − 557,586 36,010 148,934 − 742,530Disposals/transfers* − (365,749) 618 (51,961) − (417,092)Balance at end of year − 5,381,253 580,503 852,734 − 6,814,490Net Book Value at End of Year 2,786,310 1,247,534 523,527 683,290 24,725 5,265,386*Includes transfers from investment properties amounting to P=20.13 million.
Parent Company
Land(Note 23)
Furniture,Fixtures and
Equipment BuildingsLeasehold
ImprovementsConstruction−
in−Progress2017Total
CostBalance at beginning of year P=2,786,310 P=6,082,009 P=1,077,608 P=1,093,494 P=80,139 P=11,119,560Additions − 786,776 40,422 550,076 10,410 1,387,684Disposals/transfers* − (200,484) (32,362) (291,701) (29,063) (553,610)Balance at end of year 2,786,310 6,668,301 1,085,668 1,351,869 61,486 11,953,634Accumulated Depreciation
and AmortizationBalance at beginning of year − 4,775,377 517,491 682,711 − 5,975,579Depreciation and amortization − 537,338 26,456 115,273 − 679,067Disposals/transfers* − (123,299) (72) (42,223) − (165,594)Balance at end of year − 5,189,416 543,875 755,761 − 6,489,052Net Book Value at End of Year P=2,786,310 P=1,478,885 P=541,793 P=596,108 P=61,486 P=5,464,582*Includes transfers from investment properties amounting to P=10.82 million.
The Group adopted the deemed cost model as of January 1, 2004 and considered the carrying value ofthe land determined under its previous accounting method (revaluation method) as the deemed cost ofthe asset as of January 1, 2005. Accordingly, revaluation increment amounting to P=1.28 billion wasclosed to surplus (Note 23) in 2011.
As of December 31, 2018 and 2017, the gross carrying amount of fully depreciated furniture, fixturesand equipment still in use amounted to P=3.47 billion and P=2.89 billion, respectively, for the Group andP=2.61 billion and P=2.31 billion, respectively, for the Parent Company.
Gain on sale of furniture, fixtures and equipment amounting to P=1.81 million, P=2.11 million andP=2.97 million in 2018, 2017 and 2016, respectively, for the Group and P=1.60 million, P=1.69 millionand P=2.17 million in 2018, 2017 and 2016, respectively, for the Parent Company are included in thestatements of income under ‘Miscellaneous income’ account (Note 21).
In 2016, depreciation and amortization amounting to P=842.22 million and P=595.81 million for theGroup and Parent Company, respectively, are included in the statements of income under‘Depreciation and amortization’ account.
196
VJNQUISIDO
Rectangle
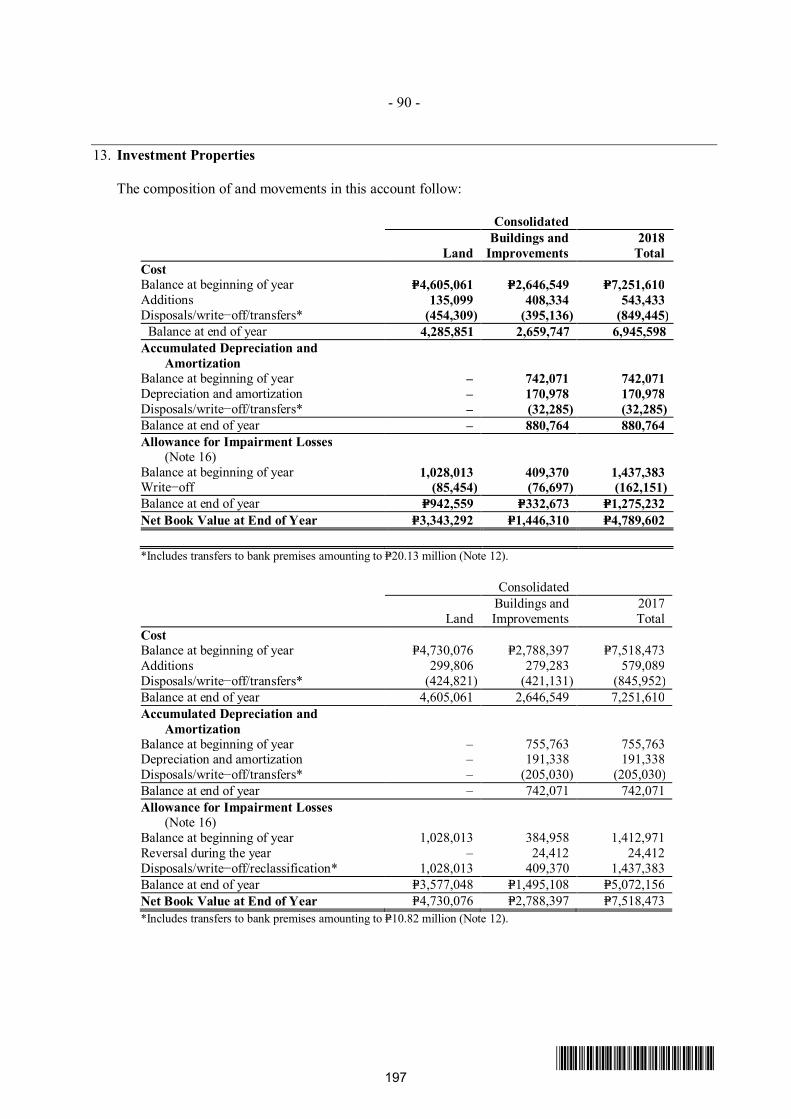
- 90 -
*SGVFS032944*
13. Investment Properties
The composition of and movements in this account follow:
Consolidated
LandBuildings and
Improvements2018
TotalCostBalance at beginning of year P=4,605,061 P=2,646,549 P=7,251,610Additions 135,099 408,334 543,433Disposals/write−off/transfers* (454,309) (395,136) (849,445)
Balance at end of year 4,285,851 2,659,747 6,945,598Accumulated Depreciation and
AmortizationBalance at beginning of year – 742,071 742,071Depreciation and amortization – 170,978 170,978Disposals/write−off/transfers* – (32,285) (32,285)Balance at end of year – 880,764 880,764Allowance for Impairment Losses
(Note 16)Balance at beginning of year 1,028,013 409,370 1,437,383Write−off (85,454) (76,697) (162,151)Balance at end of year P=942,559 P=332,673 P=1,275,232Net Book Value at End of Year P=3,343,292 P=1,446,310 P=4,789,602
*Includes transfers to bank premises amounting to P=20.13 million (Note 12).
Consolidated
LandBuildings andImprovements
2017Total
CostBalance at beginning of year P=4,730,076 P=2,788,397 P=7,518,473Additions 299,806 279,283 579,089Disposals/write−off/transfers* (424,821) (421,131) (845,952)Balance at end of year 4,605,061 2,646,549 7,251,610Accumulated Depreciation and
AmortizationBalance at beginning of year – 755,763 755,763Depreciation and amortization – 191,338 191,338Disposals/write−off/transfers* – (205,030) (205,030)Balance at end of year – 742,071 742,071Allowance for Impairment Losses
(Note 16)Balance at beginning of year 1,028,013 384,958 1,412,971Reversal during the year – 24,412 24,412Disposals/write−off/reclassification* 1,028,013 409,370 1,437,383Balance at end of year P=3,577,048 P=1,495,108 P=5,072,156Net Book Value at End of Year P=4,730,076 P=2,788,397 P=7,518,473
*Includes transfers to bank premises amounting to P=10.82 million (Note 12).
197
VJNQUISIDO
Rectangle
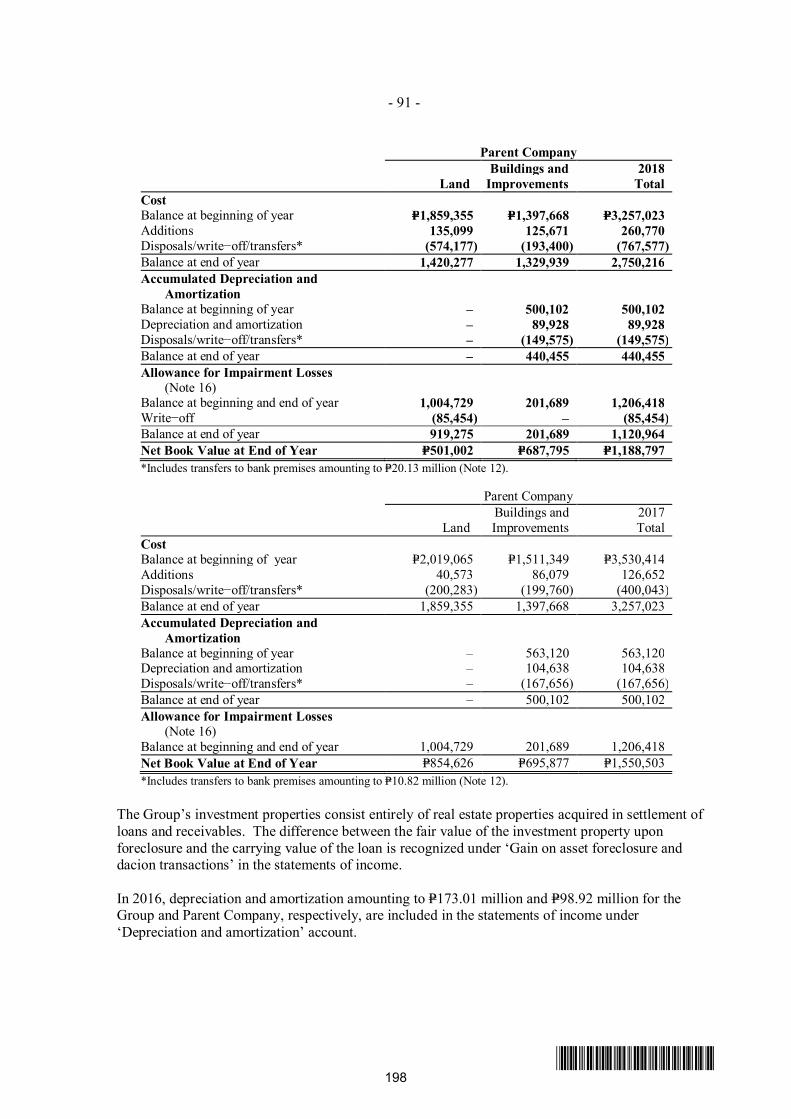
- 91 -
*SGVFS032944*
Parent Company
LandBuildings and
Improvements2018
TotalCostBalance at beginning of year P=1,859,355 P=1,397,668 P=3,257,023Additions 135,099 125,671 260,770Disposals/write−off/transfers* (574,177) (193,400) (767,577)Balance at end of year 1,420,277 1,329,939 2,750,216Accumulated Depreciation and
AmortizationBalance at beginning of year – 500,102 500,102Depreciation and amortization – 89,928 89,928Disposals/write−off/transfers* – (149,575) (149,575)Balance at end of year – 440,455 440,455Allowance for Impairment Losses
(Note 16)Balance at beginning and end of year 1,004,729 201,689 1,206,418Write−off (85,454) – (85,454)Balance at end of year 919,275 201,689 1,120,964Net Book Value at End of Year P=501,002 P=687,795 P=1,188,797
*Includes transfers to bank premises amounting to P=20.13 million (Note 12).
Parent Company
LandBuildings andImprovements
2017Total
CostBalance at beginning of year P=2,019,065 P=1,511,349 P=3,530,414Additions 40,573 86,079 126,652Disposals/write−off/transfers* (200,283) (199,760) (400,043)Balance at end of year 1,859,355 1,397,668 3,257,023Accumulated Depreciation and
AmortizationBalance at beginning of year – 563,120 563,120Depreciation and amortization – 104,638 104,638Disposals/write−off/transfers* – (167,656) (167,656)Balance at end of year – 500,102 500,102Allowance for Impairment Losses
(Note 16)Balance at beginning and end of year 1,004,729 201,689 1,206,418Net Book Value at End of Year P=854,626 P=695,877 P=1,550,503*Includes transfers to bank premises amounting to P=10.82 million (Note 12).
The Group’s investment properties consist entirely of real estate properties acquired in settlement ofloans and receivables. The difference between the fair value of the investment property uponforeclosure and the carrying value of the loan is recognized under ‘Gain on asset foreclosure anddacion transactions’ in the statements of income.
In 2016, depreciation and amortization amounting to P=173.01 million and P=98.92 million for theGroup and Parent Company, respectively, are included in the statements of income under‘Depreciation and amortization’ account.
198
VJNQUISIDO
Rectangle
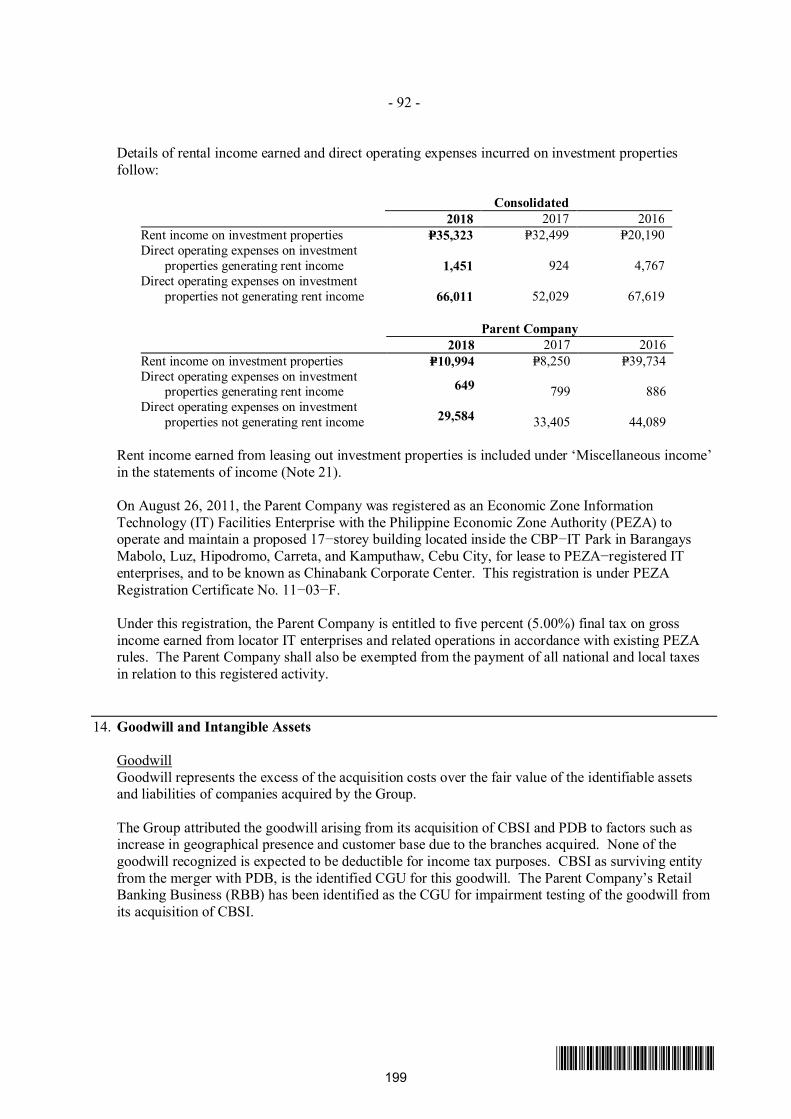
- 92 -
*SGVFS032944*
Details of rental income earned and direct operating expenses incurred on investment propertiesfollow:
Consolidated2018 2017 2016
Rent income on investment properties P=35,323 P=32,499 P=20,190Direct operating expenses on investment
properties generating rent income 1,451 924 4,767Direct operating expenses on investment
properties not generating rent income 66,011 52,029 67,619
Parent Company2018 2017 2016
Rent income on investment properties P=10,994 P=8,250 P=39,734Direct operating expenses on investment
properties generating rent income 649 799 886Direct operating expenses on investment
properties not generating rent income 29,584 33,405 44,089
Rent income earned from leasing out investment properties is included under ‘Miscellaneous income’in the statements of income (Note 21).
On August 26, 2011, the Parent Company was registered as an Economic Zone InformationTechnology (IT) Facilities Enterprise with the Philippine Economic Zone Authority (PEZA) tooperate and maintain a proposed 17−storey building located inside the CBP−IT Park in BarangaysMabolo, Luz, Hipodromo, Carreta, and Kamputhaw, Cebu City, for lease to PEZA−registered ITenterprises, and to be known as Chinabank Corporate Center. This registration is under PEZARegistration Certificate No. 11−03−F.
Under this registration, the Parent Company is entitled to five percent (5.00%) final tax on grossincome earned from locator IT enterprises and related operations in accordance with existing PEZArules. The Parent Company shall also be exempted from the payment of all national and local taxesin relation to this registered activity.
14. Goodwill and Intangible Assets
GoodwillGoodwill represents the excess of the acquisition costs over the fair value of the identifiable assetsand liabilities of companies acquired by the Group.
The Group attributed the goodwill arising from its acquisition of CBSI and PDB to factors such asincrease in geographical presence and customer base due to the branches acquired. None of thegoodwill recognized is expected to be deductible for income tax purposes. CBSI as surviving entityfrom the merger with PDB, is the identified CGU for this goodwill. The Parent Company’s RetailBanking Business (RBB) has been identified as the CGU for impairment testing of the goodwill fromits acquisition of CBSI.
199
VJNQUISIDO
Rectangle
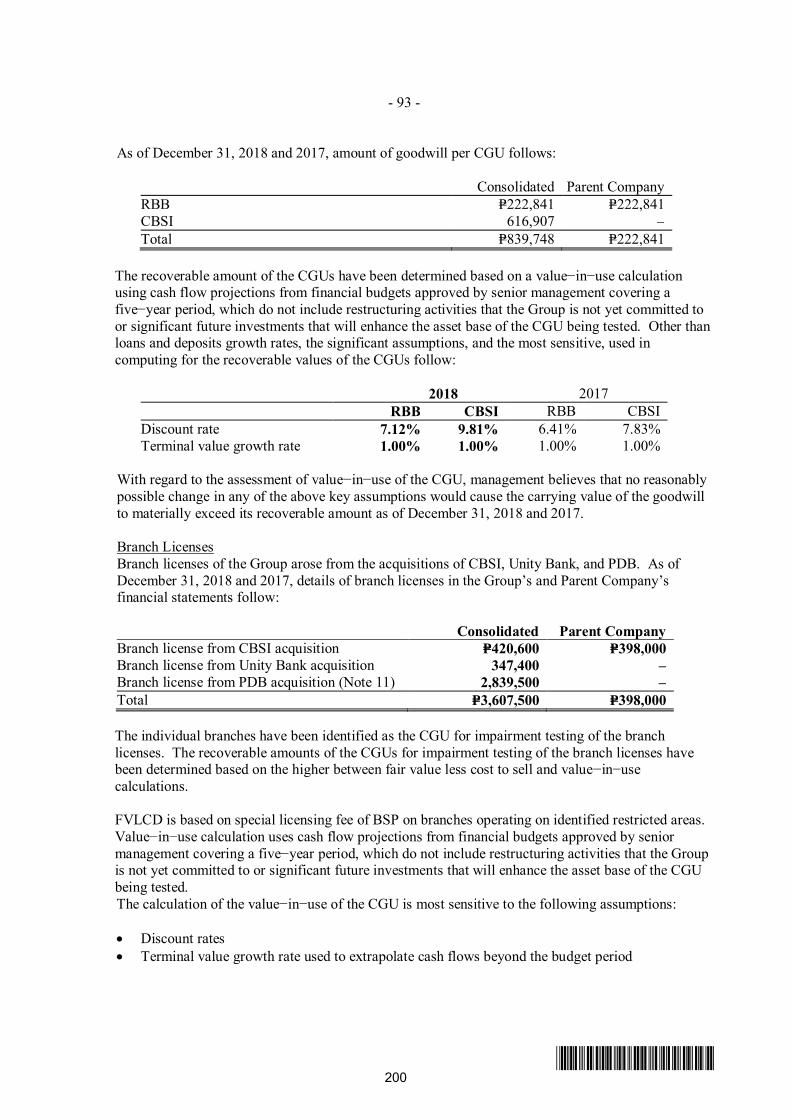
- 93 -
*SGVFS032944*
As of December 31, 2018 and 2017, amount of goodwill per CGU follows:
Consolidated Parent CompanyRBB P=222,841 P=222,841CBSI 616,907 –Total P=839,748 P=222,841
The recoverable amount of the CGUs have been determined based on a value−in−use calculationusing cash flow projections from financial budgets approved by senior management covering afive−year period, which do not include restructuring activities that the Group is not yet committed toor significant future investments that will enhance the asset base of the CGU being tested. Other thanloans and deposits growth rates, the significant assumptions, and the most sensitive, used incomputing for the recoverable values of the CGUs follow:
2018 2017RBB CBSI RBB CBSI
Discount rate 7.12% 9.81% 6.41% 7.83%Terminal value growth rate 1.00% 1.00% 1.00% 1.00%
With regard to the assessment of value−in−use of the CGU, management believes that no reasonablypossible change in any of the above key assumptions would cause the carrying value of the goodwillto materially exceed its recoverable amount as of December 31, 2018 and 2017.
Branch LicensesBranch licenses of the Group arose from the acquisitions of CBSI, Unity Bank, and PDB. As ofDecember 31, 2018 and 2017, details of branch licenses in the Group’s and Parent Company’sfinancial statements follow:
Consolidated Parent CompanyBranch license from CBSI acquisition P=420,600 P=398,000Branch license from Unity Bank acquisition 347,400 –Branch license from PDB acquisition (Note 11) 2,839,500 –Total P=3,607,500 P=398,000
The individual branches have been identified as the CGU for impairment testing of the branchlicenses. The recoverable amounts of the CGUs for impairment testing of the branch licenses havebeen determined based on the higher between fair value less cost to sell and value−in−usecalculations.
FVLCD is based on special licensing fee of BSP on branches operating on identified restricted areas.Value−in−use calculation uses cash flow projections from financial budgets approved by seniormanagement covering a five−year period, which do not include restructuring activities that the Groupis not yet committed to or significant future investments that will enhance the asset base of the CGUbeing tested.The calculation of the value−in−use of the CGU is most sensitive to the following assumptions:
∂ Discount rates∂ Terminal value growth rate used to extrapolate cash flows beyond the budget period
200
VJNQUISIDO
Rectangle
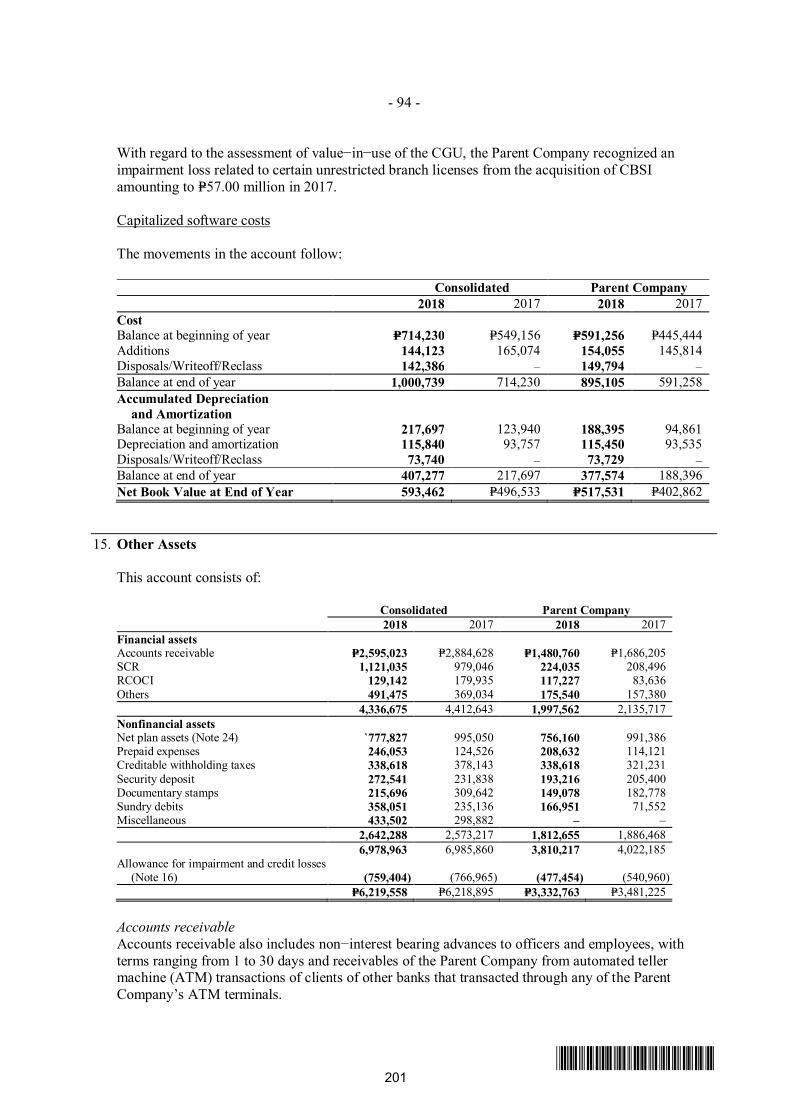
- 94 -
*SGVFS032944*
With regard to the assessment of value−in−use of the CGU, the Parent Company recognized animpairment loss related to certain unrestricted branch licenses from the acquisition of CBSIamounting to P=57.00 million in 2017.
Capitalized software costs
The movements in the account follow:
Consolidated Parent Company2018 2017 2018 2017
CostBalance at beginning of year P=714,230 P=549,156 P=591,256 P=445,444Additions 144,123 165,074 154,055 145,814Disposals/Writeoff/Reclass 142,386 – 149,794 –Balance at end of year 1,000,739 714,230 895,105 591,258Accumulated Depreciation
and AmortizationBalance at beginning of year 217,697 123,940 188,395 94,861Depreciation and amortization 115,840 93,757 115,450 93,535Disposals/Writeoff/Reclass 73,740 – 73,729 –Balance at end of year 407,277 217,697 377,574 188,396Net Book Value at End of Year 593,462 P=496,533 P=517,531 P=402,862
15. Other Assets
This account consists of:
Consolidated Parent Company2018 2017 2018 2017
Financial assetsAccounts receivable P=2,595,023 P=2,884,628 P=1,480,760 P=1,686,205SCR 1,121,035 979,046 224,035 208,496RCOCI 129,142 179,935 117,227 83,636Others 491,475 369,034 175,540 157,380
4,336,675 4,412,643 1,997,562 2,135,717Nonfinancial assetsNet plan assets (Note 24) `777,827 995,050 756,160 991,386Prepaid expenses 246,053 124,526 208,632 114,121Creditable withholding taxes 338,618 378,143 338,618 321,231Security deposit 272,541 231,838 193,216 205,400Documentary stamps 215,696 309,642 149,078 182,778Sundry debits 358,051 235,136 166,951 71,552Miscellaneous 433,502 298,882 – –
2,642,288 2,573,217 1,812,655 1,886,4686,978,963 6,985,860 3,810,217 4,022,185
Allowance for impairment and credit losses(Note 16) (759,404) (766,965) (477,454) (540,960)
P=6,219,558 P=6,218,895 P=3,332,763 P=3,481,225
Accounts receivableAccounts receivable also includes non−interest bearing advances to officers and employees, withterms ranging from 1 to 30 days and receivables of the Parent Company from automated tellermachine (ATM) transactions of clients of other banks that transacted through any of the ParentCompany’s ATM terminals.
201
VJNQUISIDO
Rectangle
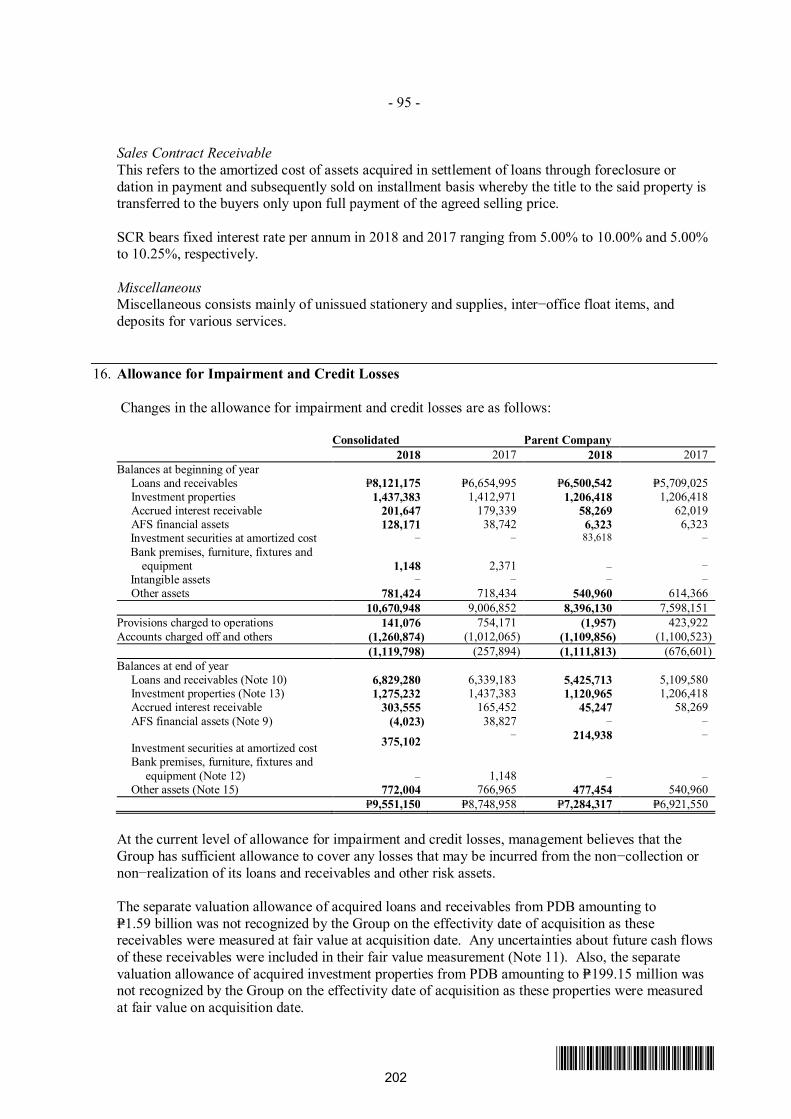
- 95 -
*SGVFS032944*
Sales Contract ReceivableThis refers to the amortized cost of assets acquired in settlement of loans through foreclosure ordation in payment and subsequently sold on installment basis whereby the title to the said property istransferred to the buyers only upon full payment of the agreed selling price.
SCR bears fixed interest rate per annum in 2018 and 2017 ranging from 5.00% to 10.00% and 5.00%to 10.25%, respectively.
MiscellaneousMiscellaneous consists mainly of unissued stationery and supplies, inter−office float items, anddeposits for various services.
16. Allowance for Impairment and Credit Losses
Changes in the allowance for impairment and credit losses are as follows:
Consolidated Parent Company2018 2017 2018 2017
Balances at beginning of year Loans and receivables P=8,121,175 P=6,654,995 P=6,500,542 P=5,709,025 Investment properties 1,437,383 1,412,971 1,206,418 1,206,418 Accrued interest receivable 201,647 179,339 58,269 62,019 AFS financial assets 128,171 38,742 6,323 6,323
Investment securities at amortized cost – – 83,618 –Bank premises, furniture, fixtures and
equipment 1,148 2,371 – –Intangible assets – – – –
Other assets 781,424 718,434 540,960 614,36610,670,948 9,006,852 8,396,130 7,598,151
Provisions charged to operations 141,076 754,171 (1,957) 423,922Accounts charged off and others (1,260,874) (1,012,065) (1,109,856) (1,100,523)
(1,119,798) (257,894) (1,111,813) (676,601)Balances at end of year Loans and receivables (Note 10) 6,829,280 6,339,183 5,425,713 5,109,580 Investment properties (Note 13) 1,275,232 1,437,383 1,120,965 1,206,418 Accrued interest receivable 303,555 165,452 45,247 58,269 AFS financial assets (Note 9) (4,023) 38,827 – –
Investment securities at amortized cost 375,102 – 214,938 –
Bank premises, furniture, fixtures andequipment (Note 12) – 1,148 – –
Other assets (Note 15) 772,004 766,965 477,454 540,960P=9,551,150 P=8,748,958 P=7,284,317 P=6,921,550
At the current level of allowance for impairment and credit losses, management believes that theGroup has sufficient allowance to cover any losses that may be incurred from the non−collection ornon−realization of its loans and receivables and other risk assets.
The separate valuation allowance of acquired loans and receivables from PDB amounting toP=1.59 billion was not recognized by the Group on the effectivity date of acquisition as thesereceivables were measured at fair value at acquisition date. Any uncertainties about future cash flowsof these receivables were included in their fair value measurement (Note 11). Also, the separatevaluation allowance of acquired investment properties from PDB amounting to P=199.15 million wasnot recognized by the Group on the effectivity date of acquisition as these properties were measuredat fair value on acquisition date.
202
VJNQUISIDO
Rectangle
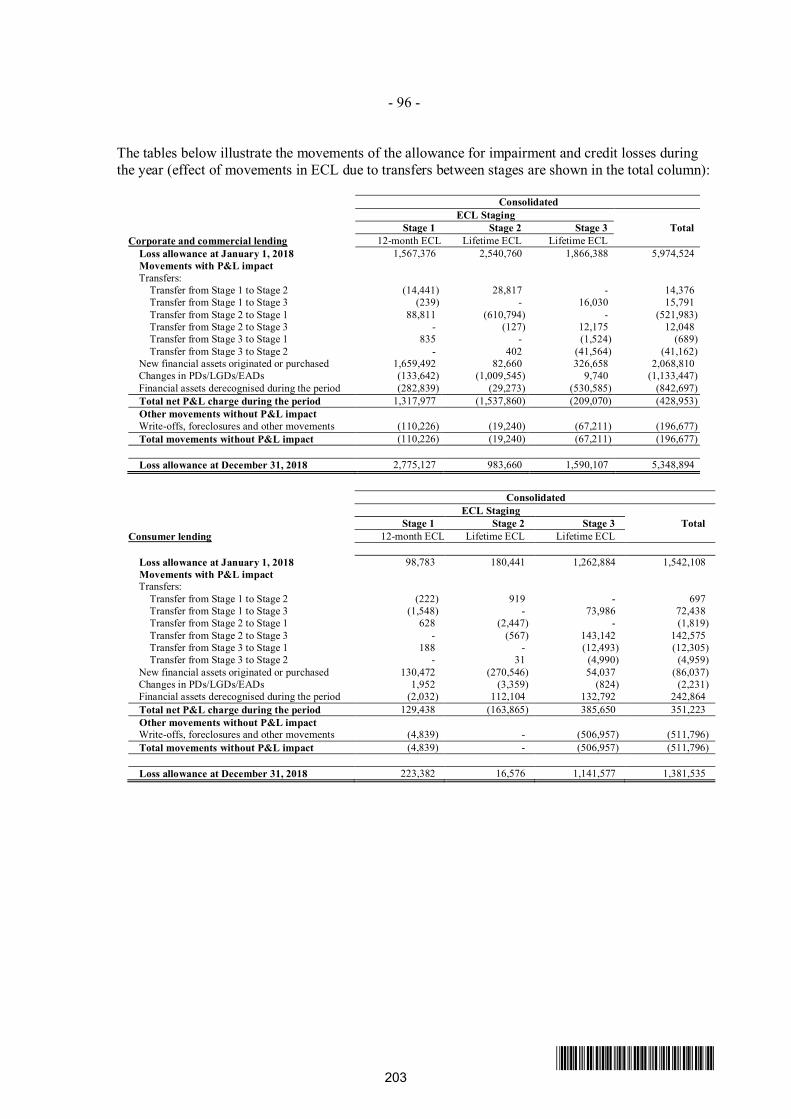
- 96 -
*SGVFS032944*
The tables below illustrate the movements of the allowance for impairment and credit losses duringthe year (effect of movements in ECL due to transfers between stages are shown in the total column):
Consolidated ECL Staging
Stage 1 Stage 2 Stage 3 TotalCorporate and commercial lending 12-month ECL Lifetime ECL Lifetime ECL
Loss allowance at January 1, 2018 1,567,376 2,540,760 1,866,388 5,974,524Movements with P&L impactTransfers:
Transfer from Stage 1 to Stage 2 (14,441) 28,817 - 14,376Transfer from Stage 1 to Stage 3 (239) - 16,030 15,791Transfer from Stage 2 to Stage 1 88,811 (610,794) - (521,983)Transfer from Stage 2 to Stage 3 - (127) 12,175 12,048Transfer from Stage 3 to Stage 1 835 - (1,524) (689)Transfer from Stage 3 to Stage 2 - 402 (41,564) (41,162)
New financial assets originated or purchased 1,659,492 82,660 326,658 2,068,810Changes in PDs/LGDs/EADs (133,642) (1,009,545) 9,740 (1,133,447)Financial assets derecognised during the period (282,839) (29,273) (530,585) (842,697)Total net P&L charge during the period 1,317,977 (1,537,860) (209,070) (428,953)Other movements without P&L impactWrite-offs, foreclosures and other movements (110,226) (19,240) (67,211) (196,677)Total movements without P&L impact (110,226) (19,240) (67,211) (196,677)
Loss allowance at December 31, 2018 2,775,127 983,660 1,590,107 5,348,894
Consolidated ECL Staging
Stage 1 Stage 2 Stage 3 TotalConsumer lending 12-month ECL Lifetime ECL Lifetime ECL
Loss allowance at January 1, 2018 98,783 180,441 1,262,884 1,542,108Movements with P&L impactTransfers:
Transfer from Stage 1 to Stage 2 (222) 919 - 697Transfer from Stage 1 to Stage 3 (1,548) - 73,986 72,438Transfer from Stage 2 to Stage 1 628 (2,447) - (1,819)Transfer from Stage 2 to Stage 3 - (567) 143,142 142,575Transfer from Stage 3 to Stage 1 188 - (12,493) (12,305)Transfer from Stage 3 to Stage 2 - 31 (4,990) (4,959)
New financial assets originated or purchased 130,472 (270,546) 54,037 (86,037)Changes in PDs/LGDs/EADs 1,952 (3,359) (824) (2,231)Financial assets derecognised during the period (2,032) 112,104 132,792 242,864Total net P&L charge during the period 129,438 (163,865) 385,650 351,223Other movements without P&L impactWrite-offs, foreclosures and other movements (4,839) - (506,957) (511,796)Total movements without P&L impact (4,839) - (506,957) (511,796)
Loss allowance at December 31, 2018 223,382 16,576 1,141,577 1,381,535
203
VJNQUISIDO
Rectangle
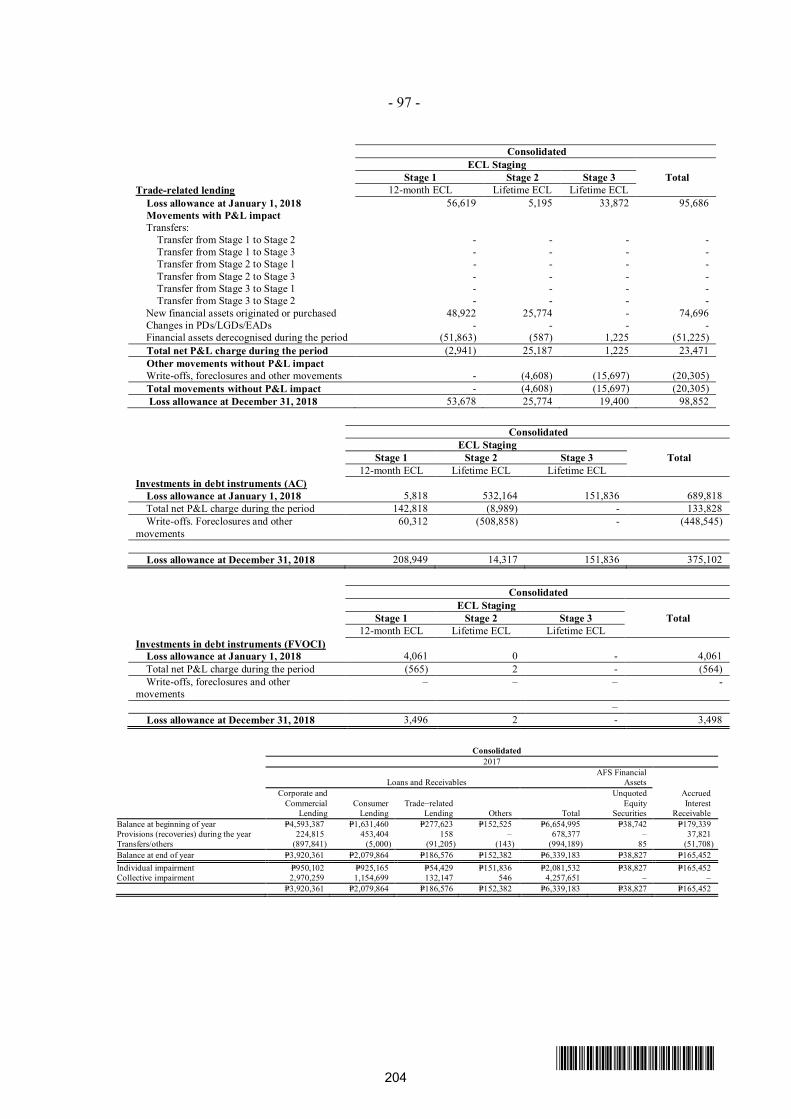
- 97 -
*SGVFS032944*
Consolidated ECL Staging
Stage 1 Stage 2 Stage 3 TotalTrade-related lending 12-month ECL Lifetime ECL Lifetime ECL
Loss allowance at January 1, 2018 56,619 5,195 33,872 95,686Movements with P&L impactTransfers:
Transfer from Stage 1 to Stage 2 - - - -Transfer from Stage 1 to Stage 3 - - - -Transfer from Stage 2 to Stage 1 - - - -Transfer from Stage 2 to Stage 3 - - - -Transfer from Stage 3 to Stage 1 - - - -Transfer from Stage 3 to Stage 2 - - - -
New financial assets originated or purchased 48,922 25,774 - 74,696Changes in PDs/LGDs/EADs - - - -Financial assets derecognised during the period (51,863) (587) 1,225 (51,225)Total net P&L charge during the period (2,941) 25,187 1,225 23,471Other movements without P&L impactWrite-offs, foreclosures and other movements - (4,608) (15,697) (20,305)Total movements without P&L impact - (4,608) (15,697) (20,305) Loss allowance at December 31, 2018 53,678 25,774 19,400 98,852
Consolidated ECL Staging
Stage 1 Stage 2 Stage 3 Total 12-month ECL Lifetime ECL Lifetime ECL
Investments in debt instruments (AC)Loss allowance at January 1, 2018 5,818 532,164 151,836 689,818Total net P&L charge during the period 142,818 (8,989) - 133,828Write-offs. Foreclosures and other
movements 60,312 (508,858) - (448,545)
Loss allowance at December 31, 2018 208,949 14,317 151,836 375,102
Consolidated ECL Staging
Stage 1 Stage 2 Stage 3 Total 12-month ECL Lifetime ECL Lifetime ECL
Investments in debt instruments (FVOCI)Loss allowance at January 1, 2018 4,061 0 - 4,061Total net P&L charge during the period (565) 2 - (564)Write-offs, foreclosures and other
movements– – – -
–Loss allowance at December 31, 2018 3,496 2 - 3,498
Consolidated2017
Loans and ReceivablesAFS Financial
AssetsAccruedInterest
Receivable
Corporate andCommercial
LendingConsumer
LendingTrade−related
Lending Others Total
UnquotedEquity
SecuritiesBalance at beginning of year P=4,593,387 P=1,631,460 P=277,623 P=152,525 P=6,654,995 P=38,742 P=179,339Provisions (recoveries) during the year 224,815 453,404 158 – 678,377 – 37,821Transfers/others (897,841) (5,000) (91,205) (143) (994,189) 85 (51,708)Balance at end of year P=3,920,361 P=2,079,864 P=186,576 P=152,382 P=6,339,183 P=38,827 P=165,452Individual impairment P=950,102 P=925,165 P=54,429 P=151,836 P=2,081,532 P=38,827 P=165,452Collective impairment 2,970,259 1,154,699 132,147 546 4,257,651 – –
P=3,920,361 P=2,079,864 P=186,576 P=152,382 P=6,339,183 P=38,827 P=165,452
204
VJNQUISIDO
Rectangle
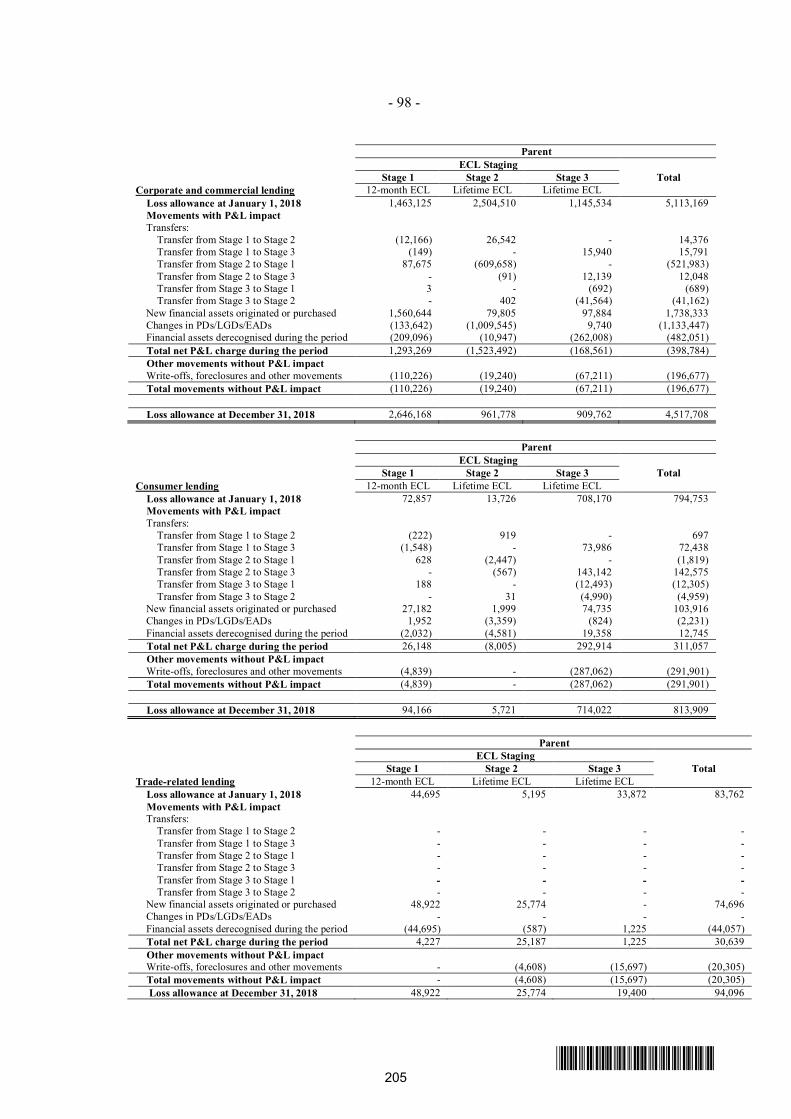
- 98 -
*SGVFS032944*
Parent ECL Staging
Stage 1 Stage 2 Stage 3 TotalCorporate and commercial lending 12-month ECL Lifetime ECL Lifetime ECL
Loss allowance at January 1, 2018 1,463,125 2,504,510 1,145,534 5,113,169Movements with P&L impactTransfers:
Transfer from Stage 1 to Stage 2 (12,166) 26,542 - 14,376Transfer from Stage 1 to Stage 3 (149) - 15,940 15,791Transfer from Stage 2 to Stage 1 87,675 (609,658) - (521,983)Transfer from Stage 2 to Stage 3 - (91) 12,139 12,048Transfer from Stage 3 to Stage 1 3 - (692) (689)Transfer from Stage 3 to Stage 2 - 402 (41,564) (41,162)
New financial assets originated or purchased 1,560,644 79,805 97,884 1,738,333Changes in PDs/LGDs/EADs (133,642) (1,009,545) 9,740 (1,133,447)Financial assets derecognised during the period (209,096) (10,947) (262,008) (482,051)Total net P&L charge during the period 1,293,269 (1,523,492) (168,561) (398,784)Other movements without P&L impactWrite-offs, foreclosures and other movements (110,226) (19,240) (67,211) (196,677)Total movements without P&L impact (110,226) (19,240) (67,211) (196,677)
Loss allowance at December 31, 2018 2,646,168 961,778 909,762 4,517,708
Parent ECL Staging
Stage 1 Stage 2 Stage 3 TotalConsumer lending 12-month ECL Lifetime ECL Lifetime ECL
Loss allowance at January 1, 2018 72,857 13,726 708,170 794,753Movements with P&L impactTransfers:
Transfer from Stage 1 to Stage 2 (222) 919 - 697Transfer from Stage 1 to Stage 3 (1,548) - 73,986 72,438Transfer from Stage 2 to Stage 1 628 (2,447) - (1,819)Transfer from Stage 2 to Stage 3 - (567) 143,142 142,575Transfer from Stage 3 to Stage 1 188 - (12,493) (12,305)Transfer from Stage 3 to Stage 2 - 31 (4,990) (4,959)
New financial assets originated or purchased 27,182 1,999 74,735 103,916Changes in PDs/LGDs/EADs 1,952 (3,359) (824) (2,231)Financial assets derecognised during the period (2,032) (4,581) 19,358 12,745Total net P&L charge during the period 26,148 (8,005) 292,914 311,057Other movements without P&L impactWrite-offs, foreclosures and other movements (4,839) - (287,062) (291,901)Total movements without P&L impact (4,839) - (287,062) (291,901)
Loss allowance at December 31, 2018 94,166 5,721 714,022 813,909
Parent ECL Staging
Stage 1 Stage 2 Stage 3 TotalTrade-related lending 12-month ECL Lifetime ECL Lifetime ECL
Loss allowance at January 1, 2018 44,695 5,195 33,872 83,762Movements with P&L impactTransfers:
Transfer from Stage 1 to Stage 2 - - - -Transfer from Stage 1 to Stage 3 - - - -Transfer from Stage 2 to Stage 1 - - - -Transfer from Stage 2 to Stage 3 - - - -Transfer from Stage 3 to Stage 1 - - - -Transfer from Stage 3 to Stage 2 - - - -
New financial assets originated or purchased 48,922 25,774 - 74,696Changes in PDs/LGDs/EADs - - - -Financial assets derecognised during the period (44,695) (587) 1,225 (44,057)Total net P&L charge during the period 4,227 25,187 1,225 30,639Other movements without P&L impactWrite-offs, foreclosures and other movements - (4,608) (15,697) (20,305)Total movements without P&L impact - (4,608) (15,697) (20,305) Loss allowance at December 31, 2018 48,922 25,774 19,400 94,096
205
VJNQUISIDO
Rectangle
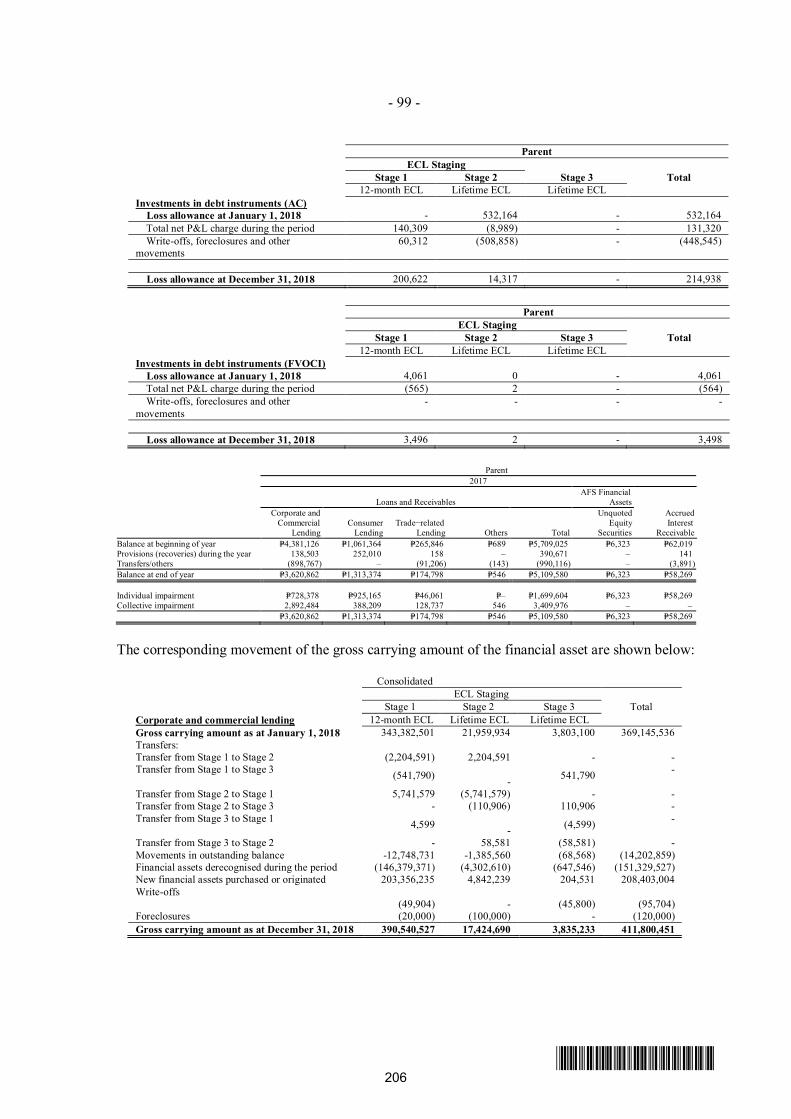
- 99 -
*SGVFS032944*
Parent ECL Staging
Stage 1 Stage 2 Stage 3 Total 12-month ECL Lifetime ECL Lifetime ECL
Investments in debt instruments (AC)Loss allowance at January 1, 2018 - 532,164 - 532,164Total net P&L charge during the period 140,309 (8,989) - 131,320Write-offs, foreclosures and other
movements 60,312 (508,858) - (448,545)
Loss allowance at December 31, 2018 200,622 14,317 - 214,938
Parent ECL Staging
Stage 1 Stage 2 Stage 3 Total 12-month ECL Lifetime ECL Lifetime ECL
Investments in debt instruments (FVOCI)Loss allowance at January 1, 2018 4,061 0 - 4,061Total net P&L charge during the period (565) 2 - (564)Write-offs, foreclosures and other
movements - - - -
Loss allowance at December 31, 2018 3,496 2 - 3,498
Parent2017
Loans and ReceivablesAFS Financial
AssetsAccruedInterest
Receivable
Corporate andCommercial
LendingConsumer
LendingTrade−related
Lending Others Total
UnquotedEquity
SecuritiesBalance at beginning of year P=4,381,126 P=1,061,364 P=265,846 P=689 P=5,709,025 P=6,323 P=62,019Provisions (recoveries) during the year 138,503 252,010 158 – 390,671 – 141Transfers/others (898,767) – (91,206) (143) (990,116) – (3,891)Balance at end of year P=3,620,862 P=1,313,374 P=174,798 P=546 P=5,109,580 P=6,323 P=58,269
Individual impairment P=728,378 P=925,165 P=46,061 P=– P=1,699,604 P=6,323 P=58,269Collective impairment 2,892,484 388,209 128,737 546 3,409,976 – –
P=3,620,862 P=1,313,374 P=174,798 P=546 P=5,109,580 P=6,323 P=58,269
The corresponding movement of the gross carrying amount of the financial asset are shown below:
ConsolidatedECL Staging
Stage 1 Stage 2 Stage 3 TotalCorporate and commercial lending 12-month ECL Lifetime ECL Lifetime ECLGross carrying amount as at January 1, 2018 343,382,501 21,959,934 3,803,100 369,145,536Transfers:Transfer from Stage 1 to Stage 2 (2,204,591) 2,204,591 - -Transfer from Stage 1 to Stage 3 (541,790) - 541,790 -
Transfer from Stage 2 to Stage 1 5,741,579 (5,741,579) - -Transfer from Stage 2 to Stage 3 - (110,906) 110,906 -Transfer from Stage 3 to Stage 1 4,599 - (4,599) -
Transfer from Stage 3 to Stage 2 - 58,581 (58,581) -Movements in outstanding balance -12,748,731 -1,385,560 (68,568) (14,202,859)Financial assets derecognised during the period (146,379,371) (4,302,610) (647,546) (151,329,527)New financial assets purchased or originated 203,356,235 4,842,239 204,531 208,403,004Write-offs
(49,904) - (45,800) (95,704)Foreclosures (20,000) (100,000) - (120,000)Gross carrying amount as at December 31, 2018 390,540,527 17,424,690 3,835,233 411,800,451
206
VJNQUISIDO
Rectangle
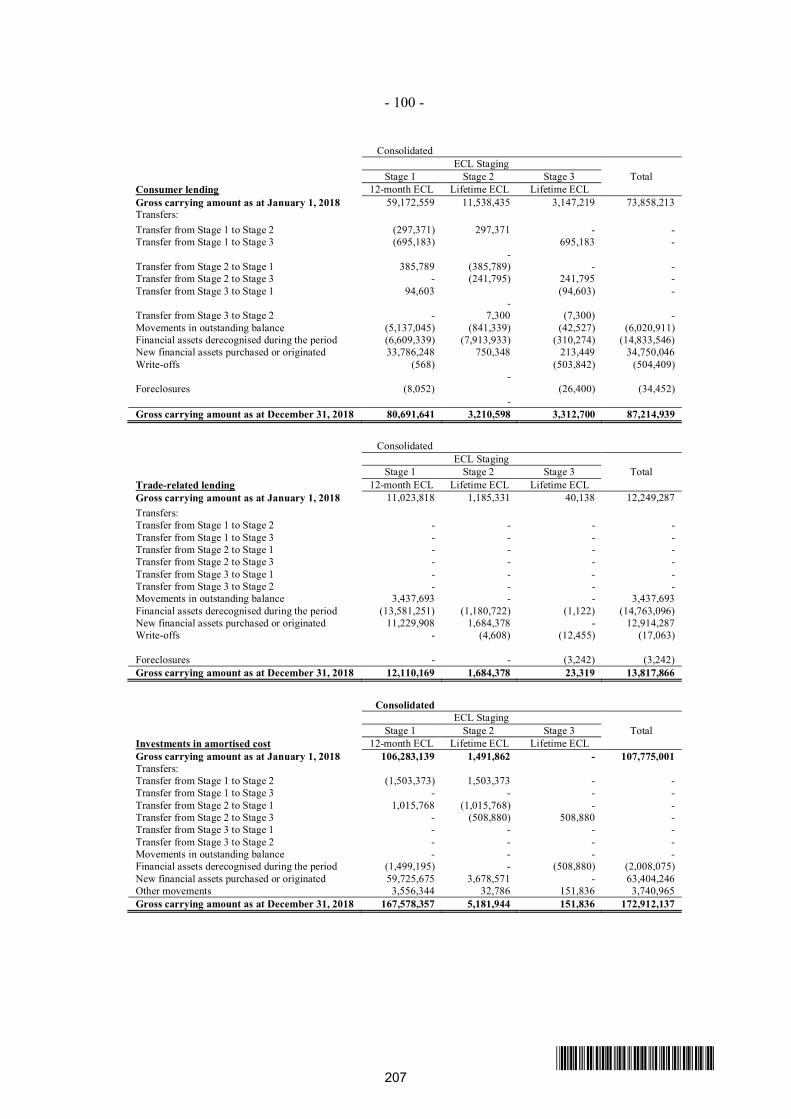
- 100 -
*SGVFS032944*
ConsolidatedECL Staging
Stage 1 Stage 2 Stage 3 TotalConsumer lending 12-month ECL Lifetime ECL Lifetime ECLGross carrying amount as at January 1, 2018 59,172,559 11,538,435 3,147,219 73,858,213Transfers:Transfer from Stage 1 to Stage 2 (297,371) 297,371 - -Transfer from Stage 1 to Stage 3 (695,183)
- 695,183 -
Transfer from Stage 2 to Stage 1 385,789 (385,789) - -Transfer from Stage 2 to Stage 3 - (241,795) 241,795 -Transfer from Stage 3 to Stage 1 94,603
- (94,603) -
Transfer from Stage 3 to Stage 2 - 7,300 (7,300) -Movements in outstanding balance (5,137,045) (841,339) (42,527) (6,020,911)Financial assets derecognised during the period (6,609,339) (7,913,933) (310,274) (14,833,546)New financial assets purchased or originated 33,786,248 750,348 213,449 34,750,046Write-offs (568)
- (503,842) (504,409)
Foreclosures (8,052)-
(26,400) (34,452)
Gross carrying amount as at December 31, 2018 80,691,641 3,210,598 3,312,700 87,214,939
ConsolidatedECL Staging
Stage 1 Stage 2 Stage 3 TotalTrade-related lending 12-month ECL Lifetime ECL Lifetime ECLGross carrying amount as at January 1, 2018 11,023,818 1,185,331 40,138 12,249,287Transfers:Transfer from Stage 1 to Stage 2 - - - -Transfer from Stage 1 to Stage 3 - - - -Transfer from Stage 2 to Stage 1 - - - -Transfer from Stage 2 to Stage 3 - - - -Transfer from Stage 3 to Stage 1 - - - -Transfer from Stage 3 to Stage 2 - - - -Movements in outstanding balance 3,437,693 - - 3,437,693Financial assets derecognised during the period (13,581,251) (1,180,722) (1,122) (14,763,096)New financial assets purchased or originated 11,229,908 1,684,378 - 12,914,287Write-offs - (4,608) (12,455) (17,063)
Foreclosures - - (3,242) (3,242)Gross carrying amount as at December 31, 2018 12,110,169 1,684,378 23,319 13,817,866
ConsolidatedECL Staging
Stage 1 Stage 2 Stage 3 TotalInvestments in amortised cost 12-month ECL Lifetime ECL Lifetime ECLGross carrying amount as at January 1, 2018 106,283,139 1,491,862 - 107,775,001Transfers:Transfer from Stage 1 to Stage 2 (1,503,373) 1,503,373 - -Transfer from Stage 1 to Stage 3 - - - -Transfer from Stage 2 to Stage 1 1,015,768 (1,015,768) - -Transfer from Stage 2 to Stage 3 - (508,880) 508,880 -Transfer from Stage 3 to Stage 1 - - - -Transfer from Stage 3 to Stage 2 - - - -Movements in outstanding balance - - - -Financial assets derecognised during the period (1,499,195) - (508,880) (2,008,075)New financial assets purchased or originated 59,725,675 3,678,571 - 63,404,246Other movements 3,556,344 32,786 151,836 3,740,965Gross carrying amount as at December 31, 2018 167,578,357 5,181,944 151,836 172,912,137
207
VJNQUISIDO
Rectangle
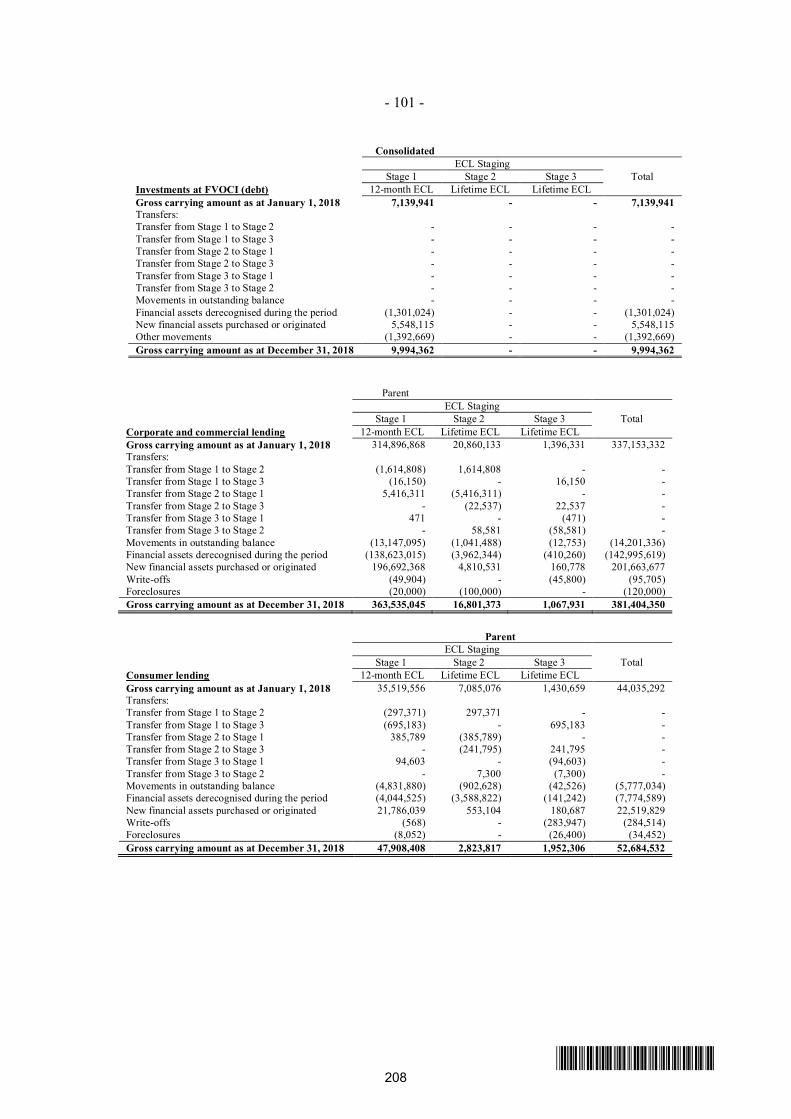
- 101 -
*SGVFS032944*
ConsolidatedECL Staging
Stage 1 Stage 2 Stage 3 TotalInvestments at FVOCI (debt) 12-month ECL Lifetime ECL Lifetime ECLGross carrying amount as at January 1, 2018 7,139,941 - - 7,139,941Transfers:Transfer from Stage 1 to Stage 2 - - - -Transfer from Stage 1 to Stage 3 - - - -Transfer from Stage 2 to Stage 1 - - - -Transfer from Stage 2 to Stage 3 - - - -Transfer from Stage 3 to Stage 1 - - - -Transfer from Stage 3 to Stage 2 - - - -Movements in outstanding balance - - - -Financial assets derecognised during the period (1,301,024) - - (1,301,024)New financial assets purchased or originated 5,548,115 - - 5,548,115Other movements (1,392,669) - - (1,392,669)Gross carrying amount as at December 31, 2018 9,994,362 - - 9,994,362
ParentECL Staging
Stage 1 Stage 2 Stage 3 TotalCorporate and commercial lending 12-month ECL Lifetime ECL Lifetime ECLGross carrying amount as at January 1, 2018 314,896,868 20,860,133 1,396,331 337,153,332Transfers:Transfer from Stage 1 to Stage 2 (1,614,808) 1,614,808 - -Transfer from Stage 1 to Stage 3 (16,150) - 16,150 -Transfer from Stage 2 to Stage 1 5,416,311 (5,416,311) - -Transfer from Stage 2 to Stage 3 - (22,537) 22,537 -Transfer from Stage 3 to Stage 1 471 - (471) -Transfer from Stage 3 to Stage 2 - 58,581 (58,581) -Movements in outstanding balance (13,147,095) (1,041,488) (12,753) (14,201,336)Financial assets derecognised during the period (138,623,015) (3,962,344) (410,260) (142,995,619)New financial assets purchased or originated 196,692,368 4,810,531 160,778 201,663,677Write-offs (49,904) - (45,800) (95,705)Foreclosures (20,000) (100,000) - (120,000)Gross carrying amount as at December 31, 2018 363,535,045 16,801,373 1,067,931 381,404,350
ParentECL Staging
Stage 1 Stage 2 Stage 3 TotalConsumer lending 12-month ECL Lifetime ECL Lifetime ECLGross carrying amount as at January 1, 2018 35,519,556 7,085,076 1,430,659 44,035,292Transfers:Transfer from Stage 1 to Stage 2 (297,371) 297,371 - -Transfer from Stage 1 to Stage 3 (695,183) - 695,183 -Transfer from Stage 2 to Stage 1 385,789 (385,789) - -Transfer from Stage 2 to Stage 3 - (241,795) 241,795 -Transfer from Stage 3 to Stage 1 94,603 - (94,603) -Transfer from Stage 3 to Stage 2 - 7,300 (7,300) -Movements in outstanding balance (4,831,880) (902,628) (42,526) (5,777,034)Financial assets derecognised during the period (4,044,525) (3,588,822) (141,242) (7,774,589)New financial assets purchased or originated 21,786,039 553,104 180,687 22,519,829Write-offs (568) - (283,947) (284,514)Foreclosures (8,052) - (26,400) (34,452)Gross carrying amount as at December 31, 2018 47,908,408 2,823,817 1,952,306 52,684,532
208
VJNQUISIDO
Rectangle
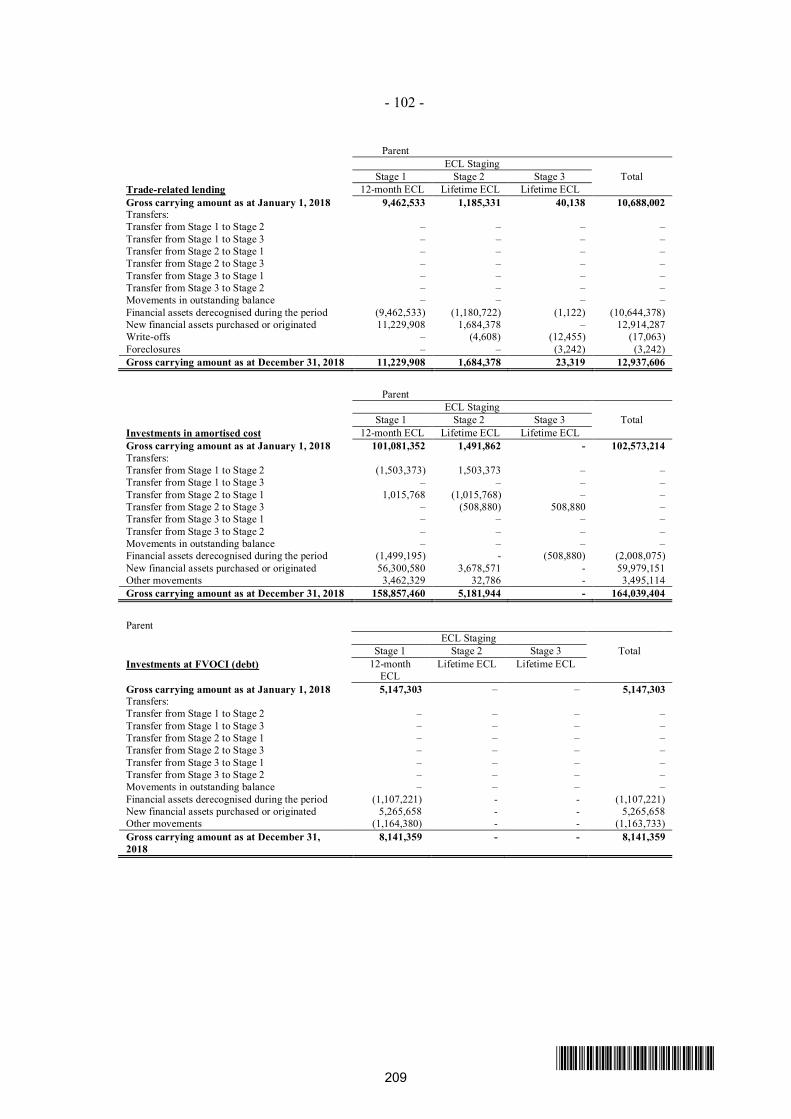
- 102 -
*SGVFS032944*
ParentECL Staging
Stage 1 Stage 2 Stage 3 TotalTrade-related lending 12-month ECL Lifetime ECL Lifetime ECLGross carrying amount as at January 1, 2018 9,462,533 1,185,331 40,138 10,688,002Transfers:Transfer from Stage 1 to Stage 2 – – – –Transfer from Stage 1 to Stage 3 – – – –Transfer from Stage 2 to Stage 1 – – – –Transfer from Stage 2 to Stage 3 – – – –Transfer from Stage 3 to Stage 1 – – – –Transfer from Stage 3 to Stage 2 – – – –Movements in outstanding balance – – – –Financial assets derecognised during the period (9,462,533) (1,180,722) (1,122) (10,644,378)New financial assets purchased or originated 11,229,908 1,684,378 – 12,914,287Write-offs – (4,608) (12,455) (17,063)Foreclosures – – (3,242) (3,242)Gross carrying amount as at December 31, 2018 11,229,908 1,684,378 23,319 12,937,606
ParentECL Staging
Stage 1 Stage 2 Stage 3 TotalInvestments in amortised cost 12-month ECL Lifetime ECL Lifetime ECLGross carrying amount as at January 1, 2018 101,081,352 1,491,862 - 102,573,214Transfers:Transfer from Stage 1 to Stage 2 (1,503,373) 1,503,373 – –Transfer from Stage 1 to Stage 3 – – – –Transfer from Stage 2 to Stage 1 1,015,768 (1,015,768) – –Transfer from Stage 2 to Stage 3 – (508,880) 508,880 –Transfer from Stage 3 to Stage 1 – – – –Transfer from Stage 3 to Stage 2 – – – –Movements in outstanding balance – – – –Financial assets derecognised during the period (1,499,195) - (508,880) (2,008,075)New financial assets purchased or originated 56,300,580 3,678,571 - 59,979,151Other movements 3,462,329 32,786 - 3,495,114Gross carrying amount as at December 31, 2018 158,857,460 5,181,944 - 164,039,404
ParentECL Staging
Stage 1 Stage 2 Stage 3 TotalInvestments at FVOCI (debt) 12-month
ECLLifetime ECL Lifetime ECL
Gross carrying amount as at January 1, 2018 5,147,303 – – 5,147,303Transfers:Transfer from Stage 1 to Stage 2 – – – –Transfer from Stage 1 to Stage 3 – – – –Transfer from Stage 2 to Stage 1 – – – –Transfer from Stage 2 to Stage 3 – – – –Transfer from Stage 3 to Stage 1 – – – –Transfer from Stage 3 to Stage 2 – – – –Movements in outstanding balance – – – –Financial assets derecognised during the period (1,107,221) - - (1,107,221)New financial assets purchased or originated 5,265,658 - - 5,265,658Other movements (1,164,380) - - (1,163,733)Gross carrying amount as at December 31,2018
8,141,359 - - 8,141,359
209
VJNQUISIDO
Rectangle
- 103 -
*SGVFS032944*
While the Group recognizes through the statement of income the movements in the expected creditlosses computed using the models, the Group also complies with BSP's regulatory requirement toappropriate a portion of its retained earnings at an amount necessary to bring to at least 1% theallowance for credit losses on loans (Note 23). In 2018, the amount of retained earnings appropriatedfor this purpose increased by P=340.41 million for both the Group and the Parent Company.
Consolidated Parent2018 2017 2016 2018 2017 2016
Provision for Inpairment andCredit Losses P=141,076 P=754,171 P=850,546 (P=1,957) P=423,922 P=521,475Retained Earnings,appropriated 340,409 – – 340,409 – –
P=481,485 P=754,171 P=850,546 P=338,452 P=423,922 P=521,475
17. Deposit Liabilities
As of December 31, 2018 and 2017, 33.64% and 36.13% respectively, of the total deposit liabilitiesof the Group and 37.56% and 40.19% of the parent are subject to periodic interest repricing. Theremaining deposit liabilities bear annual fixed interest rates ranging from 0.13% to 4.55% in 2018,0.13% to 3.65% in 2017, 0.13% to 3.25% in 2016, 0.13% to 2.75% in 2015 and 2014.
Interest Expense on Deposit LiabilitiesThis account consists of:
Consolidated Parent Company2018 2017 2016 2018 2017 2016
Demand P=257,129 P=233,984 P=197,595 P=182,521 P=163,524 P=143,917Savings 3,491,085 1,120,422 819,991 3,429,446 1,072,849 567,447Time 7,873,305 5,167,529 3,813,969 6,124,047 3,974,430 2,917,763
P=11,621,609 P=6,521,935 P=4,831,555 9,738,032 P=5,210,803 P=3,629,127
BSP Circular No. 830 requires reserves against deposit liabilities. As of December 31, 2018 and2017, due from BSP amounting to P=100.06 billion and P=95.90 billion, respectively, for the Group andP=93.26 billion and P=89.17 billion, respectively, for the Parent Company were set aside as reserves fordeposit liabilities per latest report submitted BSP. As of December 31, 2018 and 2017, the Group isin compliance with such regulation.
LTNCDOn August 3, 2016, the BOD of the Parent Company approved the issuance of Long Term NegotiableCertificates of Deposits (LTNCD) of up to P=20.00 billion in tranches of P=5.00 billion to P=10.00billion each and with tenors ranging from 5 to 7 years to support the Group’s strategic initiatives andbusiness growth. On October 27, 2016, the Monetary Board of the BSP approved the LTNCDissuances. On November 18, 2016, the Parent Company issued the first tranche at par with aggregateprincipal amount of P=9.58 billion due May 18, 2022. The LTNCDs bear a fixed coupon rate of3.65% per annum, payable quarterly in arrears. Subject to BSP rules, the Group has the option topre−terminate the LTNCDs as a whole but not in part, prior to maturity and on any interest paymentdate at face value plus accrued interest covering the accrued and unpaid interest.
On June 2, 2017, the Parent Company issued at par LTNCDs with aggregate principal amount ofP=6.35 billion due December 22, 2022, representing the second tranche of the P=20.00 billion.
On March 7, 2018, the Board of Directors approved the Bank’s Peso funding program of up toP=50 billion via a combination of Long−Term Negotiable Certificate of Time Deposit and/or RetailBonds and/or Commercial Papers.
210
VJNQUISIDO
Rectangle
- 104 -
*SGVFS032944*
On July 12, 2018, the Parent Company issued at par LTNCDs with aggregate principal amount ofP=10.25 billion due January 12, 2024, representing the first tranche of the P=20 billion LTNCDapproved by BSP on June 14, 2018. The LTNCDs bear a fixed coupon rate of 4.55% per annum,payable quarterly in arrears. The P20 billion LTNCD program is part of the Group’s fundingprogram amounting to P50 billion.
The LTNCDs are included under the ‘Time deposit liabilities’ account.
18. Bills Payable
Bills PayableThe Group’s and the Parent Company’s bills payable consist of:
Consolidated Parent Company2018 2017 2018 2017
Interbank loans payable P= 28,426,800 P=16,378,274 P= 28,426,800 P=16,378,274Trade finance 5,804,832 3,739,757 5,804,832 3,739,757BPS rediscounting (Note 10) 4,132,800 – 4,132,800 –Promissory Notes 1,462,100 – 1,462,100 –
P=39,826,532 P=20,118,031 P=39,826,532 P=20,118,031
Interbank loans payableInterbank loans payable consists of short−term dollar−denominated borrowings of the ParentCompany with annual interest ranging from 3.11% to 4.73% and from 0.12% to 2.28% in 2018 and2017, respectively.
As of December 31, 2018, the carrying amount of foreign currency−denominated investmentsecurities at amortized cost and FVOCI pledged by the Parent Company as collateral for its interbankborrowings amounted to ₱13.32 billion and ₱0.73 billion, respectively. The carrying amount ofpeso−denominated investment securities at amortized cost pledged by the Parent Company ascollateral for its interbank borrowings amounted to ₱20.69 billion. The fair value of investmentsecurities at amortized cost pledged as collateral amounted to ₱31.86 billion as of December 31, 2018(Note 9).
As of December 31, 2017, the carrying amount of foreign currency−denominated HTM and AFSfinancial assets pledged by the Parent Company as collateral for its interbank borrowings amounted toP=3.43 billion and P=3.72 billion, respectively. The carrying amount of peso−denominated HTM, AFSand HFT financial assets pledged by the Parent Company as collateral for its interbank borrowingsamounted to P=10.25 billion, P=0.10 billion and P=0.49 billion, respectively. The fair value of HTMfinancial assets pledged as collateral amounted to P=13.24 billion as of December 31, 2017 (Note 9).
As of December 31, 2018 and 2017, margin deposits amounting to P=930.82 billion andP=497.26 million, respectively, are deposited with various counterparties to meet the collateralrequirements for its interbank loans payable.
Trade financeAs of December 31, 2018 and 2017, trade finance consists of the Parent Company’s borrowings fromfinancial institutions using bank trade assets as the basis for borrowing foreign currency. Therefinancing amount should not exceed the aggregate amount of trade assets.
211
VJNQUISIDO
Rectangle
- 105 -
*SGVFS032944*
19. Accrued Interest and Other Expenses
This account consists of:
Consolidated Parent Company2018 2017 2018 2017
Accrued interest payable P=1,737,659 P=813,068 P=1,513,147 P=707,342Accrued payable for employee benefits 958,643 963,774 958,643 956,348Accrued taxes and other licenses 229,059 116,158 149,088 96,153Accrued lease payable 198,759 166,246 198,759 162,875Accrued other expenses payable 718,405 568,373 522,515 361,230
P=3,842,525 P=2,627,619 P=3,342,152 P=2,283,948
20. Other Liabilities
This account consists of:
Consolidated Parent Company2018 2017 2018 2017
Financial liabilitiesAccounts payable P=3,426,924 P=3,131,826 P=2,248,710 P=1,827,956Due to PDIC 628,142 531,645 628,142 531,645Acceptances payable 348,738 469,518 357,832 469,518Other credits−dormant 241,720 281,008 241,720 213,681Due to the Treasurer of the Philippines 386,930 43,174 378,871 33,950Margin deposits 3,359 3,004 3,359 3,004Expected credit losses on off−balance sheet
exposures 1,629,150 – 1,619,131 –
Miscellaneous (Note 23) 682,487 938,901 301,701 430,0417,347,450 5,399,076 5,779,466 3,509,795
Nonfinancial liabilitiesWithholding taxes payable 325,508 202,174 270,346 155,320Retirement liabilities (Note 24) 8,686 119,451 – –
334,194 321,625 270,346 155,320P=7,681,644 P=5,720,701 P=6,049,812 P=3,665,115
Accounts payable includes payables to suppliers and service providers, and loan payments and othercharges received from customers in advance.
Off-balance sheet exposures (see Note 30) subject to ECL include syndicated and long-term lines.ECL for these exposures that was recognized on January 1, 2018 amounted to P=1.67 billion for theGroup and P=1.61 billion for the Parent Company.
Miscellaneous mainly includes sundry credits, inter−office float items, and dormant deposit accounts.
212
VJNQUISIDO
Rectangle
VJNQUISIDO
Rectangle
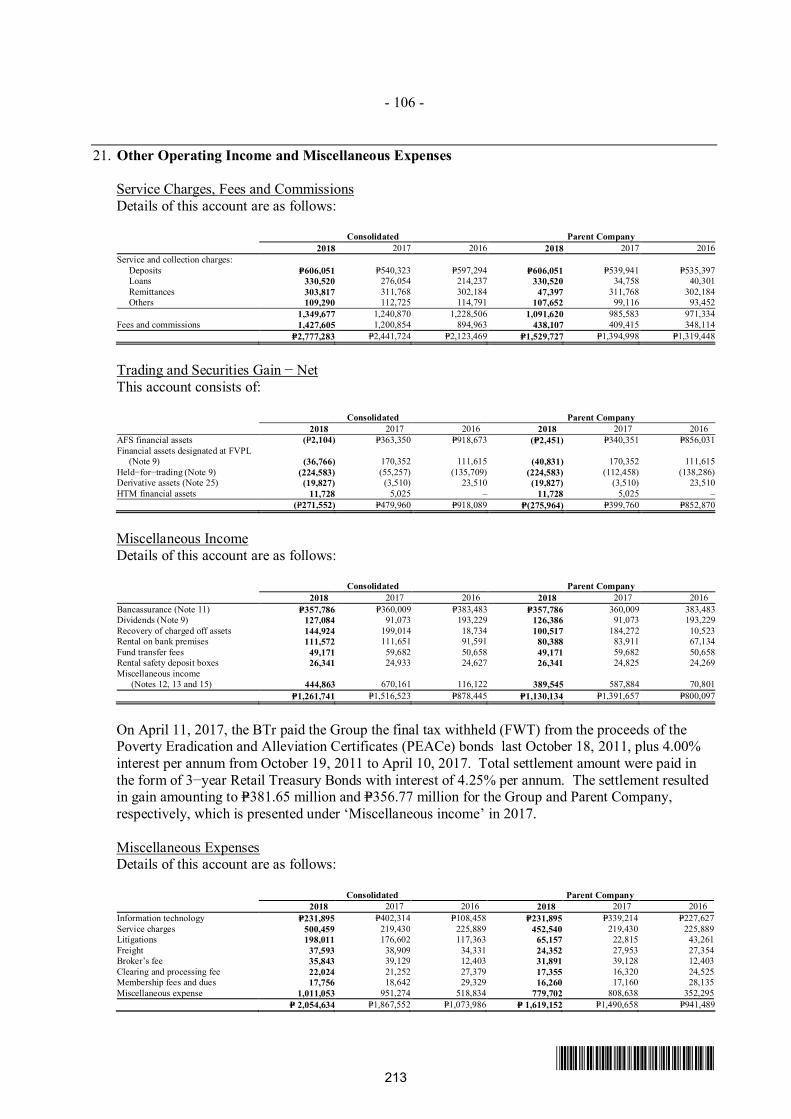
- 106 -
*SGVFS032944*
21. Other Operating Income and Miscellaneous Expenses
Service Charges, Fees and CommissionsDetails of this account are as follows:
Consolidated Parent Company2018 2017 2016 2018 2017 2016
Service and collection charges:Deposits P=606,051 P=540,323 P=597,294 P=606,051 P=539,941 P=535,397Loans 330,520 276,054 214,237 330,520 34,758 40,301Remittances 303,817 311,768 302,184 47,397 311,768 302,184Others 109,290 112,725 114,791 107,652 99,116 93,452
1,349,677 1,240,870 1,228,506 1,091,620 985,583 971,334Fees and commissions 1,427,605 1,200,854 894,963 438,107 409,415 348,114
P=2,777,283 P=2,441,724 P=2,123,469 P=1,529,727 P=1,394,998 P=1,319,448
Trading and Securities Gain − NetThis account consists of:
Consolidated Parent Company2018 2017 2016 2018 2017 2016
AFS financial assets (P=2,104) P=363,350 P=918,673 (P=2,451) P=340,351 P=856,031Financial assets designated at FVPL (Note 9) (36,766) 170,352 111,615 (40,831) 170,352 111,615Held−for−trading (Note 9) (224,583) (55,257) (135,709) (224,583) (112,458) (138,286)Derivative assets (Note 25) (19,827) (3,510) 23,510 (19,827) (3,510) 23,510HTM financial assets 11,728 5,025 – 11,728 5,025 –
(P=271,552) P=479,960 P=918,089 P=(275,964) P=399,760 P=852,870
Miscellaneous IncomeDetails of this account are as follows:
Consolidated Parent Company2018 2017 2016 2018 2017 2016
Bancassurance (Note 11) P=357,786 P=360,009 P=383,483 P=357,786 360,009 383,483Dividends (Note 9) 127,084 91,073 193,229 126,386 91,073 193,229Recovery of charged off assets 144,924 199,014 18,734 100,517 184,272 10,523Rental on bank premises 111,572 111,651 91,591 80,388 83,911 67,134Fund transfer fees 49,171 59,682 50,658 49,171 59,682 50,658Rental safety deposit boxes 26,341 24,933 24,627 26,341 24,825 24,269Miscellaneous income (Notes 12, 13 and 15) 444,863 670,161 116,122 389,545 587,884 70,801
P=1,261,741 P=1,516,523 P=878,445 P=1,130,134 P=1,391,657 P=800,097
On April 11, 2017, the BTr paid the Group the final tax withheld (FWT) from the proceeds of thePoverty Eradication and Alleviation Certificates (PEACe) bonds last October 18, 2011, plus 4.00%interest per annum from October 19, 2011 to April 10, 2017. Total settlement amount were paid inthe form of 3−year Retail Treasury Bonds with interest of 4.25% per annum. The settlement resultedin gain amounting to P=381.65 million and P=356.77 million for the Group and Parent Company,respectively, which is presented under ‘Miscellaneous income’ in 2017.
Miscellaneous ExpensesDetails of this account are as follows:
Consolidated Parent Company2018 2017 2016 2018 2017 2016
Information technology P=231,895 P=402,314 P=108,458 P=231,895 P=339,214 P=227,627Service charges 500,459 219,430 225,889 452,540 219,430 225,889Litigations 198,011 176,602 117,363 65,157 22,815 43,261Freight 37,593 38,909 34,331 24,352 27,953 27,354Broker’s fee 35,843 39,129 12,403 31,891 39,128 12,403Clearing and processing fee 22,024 21,252 27,379 17,355 16,320 24,525Membership fees and dues 17,756 18,642 29,329 16,260 17,160 28,135Miscellaneous expense 1,011,053 951,274 518,834 779,702 808,638 352,295
P= 2,054,634 P=1,867,552 P=1,073,986 P= 1,619,152 P=1,490,658 P=941,489
213
VJNQUISIDO
Rectangle
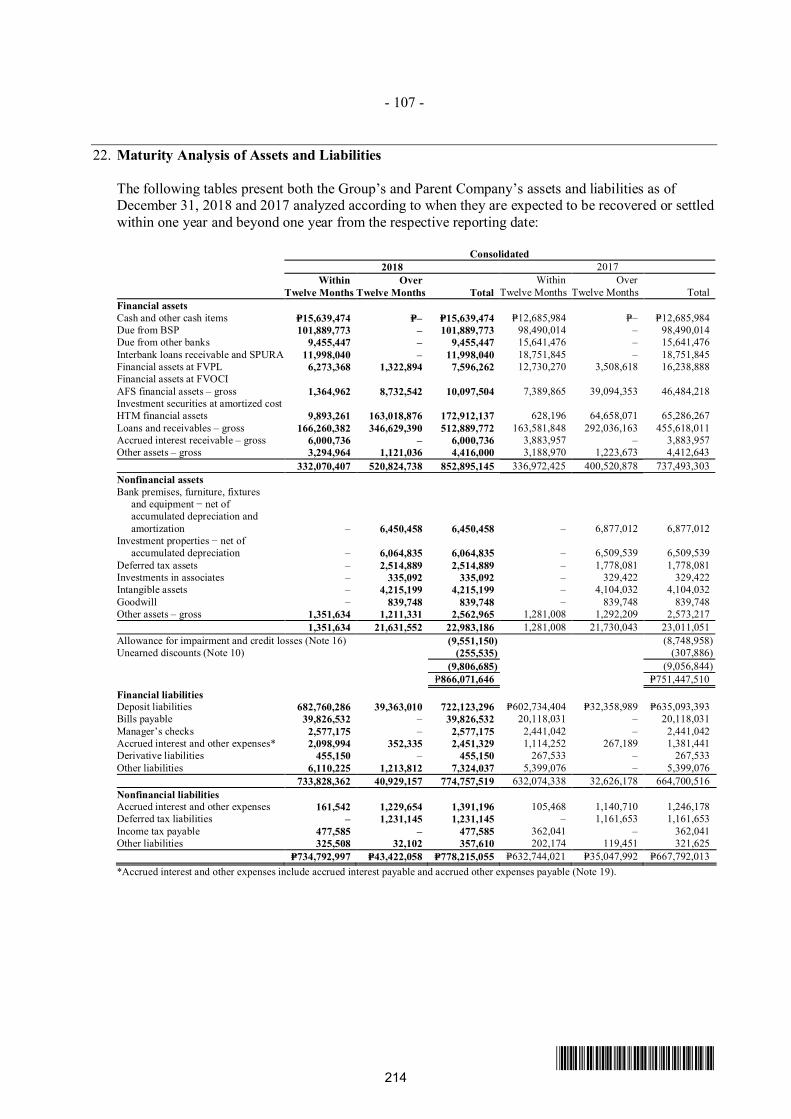
- 107 -
*SGVFS032944*
22. Maturity Analysis of Assets and Liabilities
The following tables present both the Group’s and Parent Company’s assets and liabilities as ofDecember 31, 2018 and 2017 analyzed according to when they are expected to be recovered or settledwithin one year and beyond one year from the respective reporting date:
Consolidated2018 2017
WithinTwelve Months
OverTwelve Months Total
WithinTwelve Months
OverTwelve Months Total
Financial assetsCash and other cash items P=15,639,474 P=– P=15,639,474 P=12,685,984 P=– P=12,685,984Due from BSP 101,889,773 – 101,889,773 98,490,014 – 98,490,014Due from other banks 9,455,447 – 9,455,447 15,641,476 – 15,641,476Interbank loans receivable and SPURA 11,998,040 – 11,998,040 18,751,845 – 18,751,845Financial assets at FVPL 6,273,368 1,322,894 7,596,262 12,730,270 3,508,618 16,238,888Financial assets at FVOCIAFS financial assets – gross 1,364,962 8,732,542 10,097,504 7,389,865 39,094,353 46,484,218Investment securities at amortized costHTM financial assets 9,893,261 163,018,876 172,912,137 628,196 64,658,071 65,286,267Loans and receivables – gross 166,260,382 346,629,390 512,889,772 163,581,848 292,036,163 455,618,011Accrued interest receivable – gross 6,000,736 – 6,000,736 3,883,957 – 3,883,957Other assets – gross 3,294,964 1,121,036 4,416,000 3,188,970 1,223,673 4,412,643
332,070,407 520,824,738 852,895,145 336,972,425 400,520,878 737,493,303Nonfinancial assetsBank premises, furniture, fixtures
and equipment − net ofaccumulated depreciation andamortization – 6,450,458 6,450,458 – 6,877,012 6,877,012
Investment properties − net ofaccumulated depreciation – 6,064,835 6,064,835 – 6,509,539 6,509,539
Deferred tax assets – 2,514,889 2,514,889 – 1,778,081 1,778,081Investments in associates – 335,092 335,092 – 329,422 329,422Intangible assets – 4,215,199 4,215,199 – 4,104,032 4,104,032Goodwill – 839,748 839,748 – 839,748 839,748Other assets – gross 1,351,634 1,211,331 2,562,965 1,281,008 1,292,209 2,573,217
1,351,634 21,631,552 22,983,186 1,281,008 21,730,043 23,011,051Allowance for impairment and credit losses (Note 16) (9,551,150) (8,748,958)Unearned discounts (Note 10) (255,535) (307,886)
(9,806,685) (9,056,844)P=866,071,646 P=751,447,510
Financial liabilitiesDeposit liabilities 682,760,286 39,363,010 722,123,296 P=602,734,404 P=32,358,989 P=635,093,393Bills payable 39,826,532 – 39,826,532 20,118,031 – 20,118,031Manager’s checks 2,577,175 – 2,577,175 2,441,042 – 2,441,042Accrued interest and other expenses* 2,098,994 352,335 2,451,329 1,114,252 267,189 1,381,441Derivative liabilities 455,150 – 455,150 267,533 – 267,533Other liabilities 6,110,225 1,213,812 7,324,037 5,399,076 – 5,399,076
733,828,362 40,929,157 774,757,519 632,074,338 32,626,178 664,700,516Nonfinancial liabilitiesAccrued interest and other expenses 161,542 1,229,654 1,391,196 105,468 1,140,710 1,246,178Deferred tax liabilities – 1,231,145 1,231,145 – 1,161,653 1,161,653Income tax payable 477,585 – 477,585 362,041 – 362,041Other liabilities 325,508 32,102 357,610 202,174 119,451 321,625
P=734,792,997 P=43,422,058 P=778,215,055 P=632,744,021 P=35,047,992 P=667,792,013*Accrued interest and other expenses include accrued interest payable and accrued other expenses payable (Note 19).
214
VJNQUISIDO
Rectangle
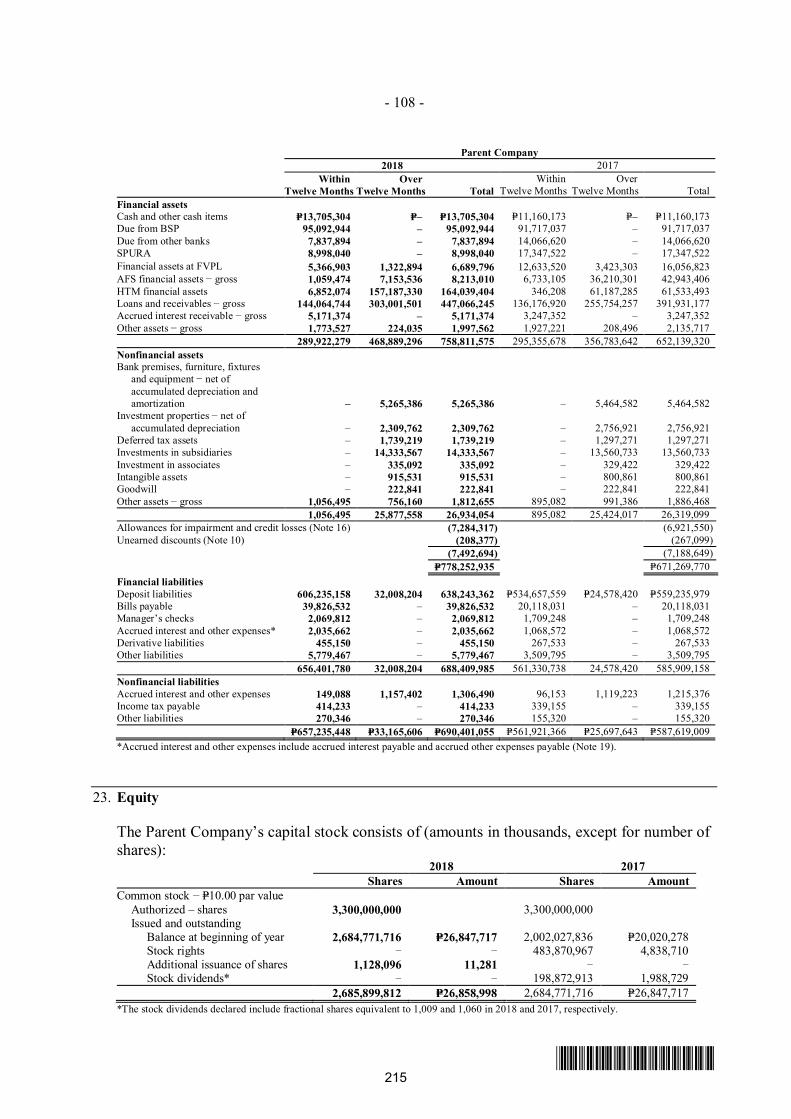
- 108 -
*SGVFS032944*
Parent Company2018 2017
WithinTwelve Months
OverTwelve Months Total
WithinTwelve Months
OverTwelve Months Total
Financial assetsCash and other cash items P=13,705,304 P=– P=13,705,304 P=11,160,173 P=– P=11,160,173Due from BSP 95,092,944 – 95,092,944 91,717,037 – 91,717,037Due from other banks 7,837,894 – 7,837,894 14,066,620 – 14,066,620SPURA 8,998,040 – 8,998,040 17,347,522 – 17,347,522Financial assets at FVPL 5,366,903 1,322,894 6,689,796 12,633,520 3,423,303 16,056,823AFS financial assets − gross 1,059,474 7,153,536 8,213,010 6,733,105 36,210,301 42,943,406HTM financial assets 6,852,074 157,187,330 164,039,404 346,208 61,187,285 61,533,493Loans and receivables − gross 144,064,744 303,001,501 447,066,245 136,176,920 255,754,257 391,931,177Accrued interest receivable − gross 5,171,374 – 5,171,374 3,247,352 – 3,247,352Other assets − gross 1,773,527 224,035 1,997,562 1,927,221 208,496 2,135,717
289,922,279 468,889,296 758,811,575 295,355,678 356,783,642 652,139,320Nonfinancial assetsBank premises, furniture, fixtures
and equipment − net ofaccumulated depreciation andamortization – 5,265,386 5,265,386 – 5,464,582 5,464,582
Investment properties − net ofaccumulated depreciation – 2,309,762 2,309,762 – 2,756,921 2,756,921
Deferred tax assets – 1,739,219 1,739,219 – 1,297,271 1,297,271Investments in subsidiaries – 14,333,567 14,333,567 – 13,560,733 13,560,733Investment in associates – 335,092 335,092 – 329,422 329,422Intangible assets – 915,531 915,531 – 800,861 800,861Goodwill – 222,841 222,841 – 222,841 222,841Other assets − gross 1,056,495 756,160 1,812,655 895,082 991,386 1,886,468
1,056,495 25,877,558 26,934,054 895,082 25,424,017 26,319,099Allowances for impairment and credit losses (Note 16) (7,284,317) (6,921,550)Unearned discounts (Note 10) (208,377) (267,099)
(7,492,694) (7,188,649) P=778,252,935 P=671,269,770
Financial liabilitiesDeposit liabilities 606,235,158 32,008,204 638,243,362 P=534,657,559 P=24,578,420 P=559,235,979Bills payable 39,826,532 – 39,826,532 20,118,031 – 20,118,031Manager’s checks 2,069,812 – 2,069,812 1,709,248 – 1,709,248Accrued interest and other expenses* 2,035,662 – 2,035,662 1,068,572 – 1,068,572Derivative liabilities 455,150 – 455,150 267,533 – 267,533Other liabilities 5,779,467 – 5,779,467 3,509,795 – 3,509,795
656,401,780 32,008,204 688,409,985 561,330,738 24,578,420 585,909,158Nonfinancial liabilitiesAccrued interest and other expenses 149,088 1,157,402 1,306,490 96,153 1,119,223 1,215,376Income tax payable 414,233 – 414,233 339,155 – 339,155Other liabilities 270,346 – 270,346 155,320 – 155,320
P=657,235,448 P=33,165,606 P=690,401,055 P=561,921,366 P=25,697,643 P=587,619,009*Accrued interest and other expenses include accrued interest payable and accrued other expenses payable (Note 19).
23. Equity
The Parent Company’s capital stock consists of (amounts in thousands, except for number ofshares):
2018 2017Shares Amount Shares Amount
Common stock − P=10.00 par value Authorized – shares 3,300,000,000 3,300,000,000 Issued and outstanding
Balance at beginning of year 2,684,771,716 P=26,847,717 2,002,027,836 P=20,020,278Stock rights – – 483,870,967 4,838,710Additional issuance of shares 1,128,096 11,281 – –Stock dividends* – – 198,872,913 1,988,729
2,685,899,812 P=26,858,998 2,684,771,716 P=26,847,717*The stock dividends declared include fractional shares equivalent to 1,009 and 1,060 in 2018 and 2017, respectively.
215
VJNQUISIDO
Rectangle
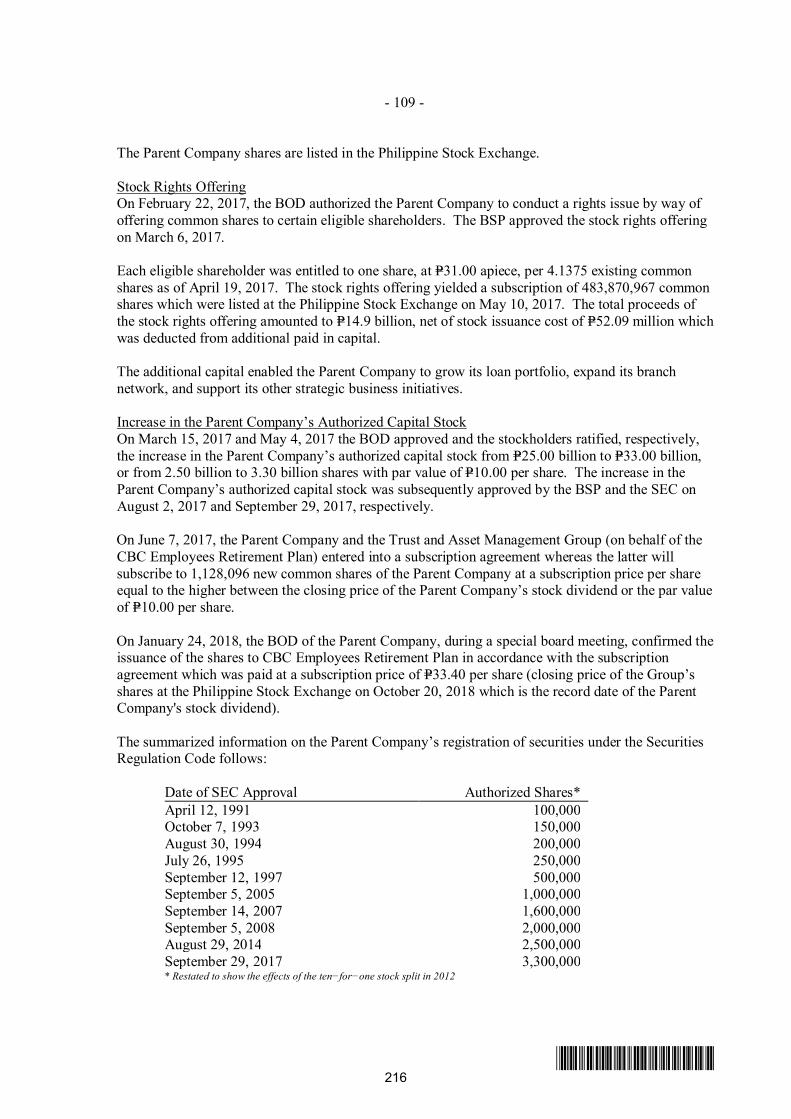
- 109 -
*SGVFS032944*
The Parent Company shares are listed in the Philippine Stock Exchange.
Stock Rights OfferingOn February 22, 2017, the BOD authorized the Parent Company to conduct a rights issue by way ofoffering common shares to certain eligible shareholders. The BSP approved the stock rights offeringon March 6, 2017.
Each eligible shareholder was entitled to one share, at P=31.00 apiece, per 4.1375 existing commonshares as of April 19, 2017. The stock rights offering yielded a subscription of 483,870,967 commonshares which were listed at the Philippine Stock Exchange on May 10, 2017. The total proceeds ofthe stock rights offering amounted to P=14.9 billion, net of stock issuance cost of P=52.09 million whichwas deducted from additional paid in capital.
The additional capital enabled the Parent Company to grow its loan portfolio, expand its branchnetwork, and support its other strategic business initiatives.
Increase in the Parent Company’s Authorized Capital StockOn March 15, 2017 and May 4, 2017 the BOD approved and the stockholders ratified, respectively,the increase in the Parent Company’s authorized capital stock from P=25.00 billion to P=33.00 billion,or from 2.50 billion to 3.30 billion shares with par value of P=10.00 per share. The increase in theParent Company’s authorized capital stock was subsequently approved by the BSP and the SEC onAugust 2, 2017 and September 29, 2017, respectively.
On June 7, 2017, the Parent Company and the Trust and Asset Management Group (on behalf of theCBC Employees Retirement Plan) entered into a subscription agreement whereas the latter willsubscribe to 1,128,096 new common shares of the Parent Company at a subscription price per shareequal to the higher between the closing price of the Parent Company’s stock dividend or the par valueof P=10.00 per share.
On January 24, 2018, the BOD of the Parent Company, during a special board meeting, confirmed theissuance of the shares to CBC Employees Retirement Plan in accordance with the subscriptionagreement which was paid at a subscription price of P=33.40 per share (closing price of the Group’sshares at the Philippine Stock Exchange on October 20, 2018 which is the record date of the ParentCompany's stock dividend).
The summarized information on the Parent Company’s registration of securities under the SecuritiesRegulation Code follows:
Date of SEC Approval Authorized Shares*April 12, 1991 100,000October 7, 1993 150,000August 30, 1994 200,000July 26, 1995 250,000September 12, 1997 500,000September 5, 2005 1,000,000September 14, 2007 1,600,000September 5, 2008 2,000,000August 29, 2014 2,500,000September 29, 2017 3,300,000* Restated to show the effects of the ten−for−one stock split in 2012
216
VJNQUISIDO
Rectangle
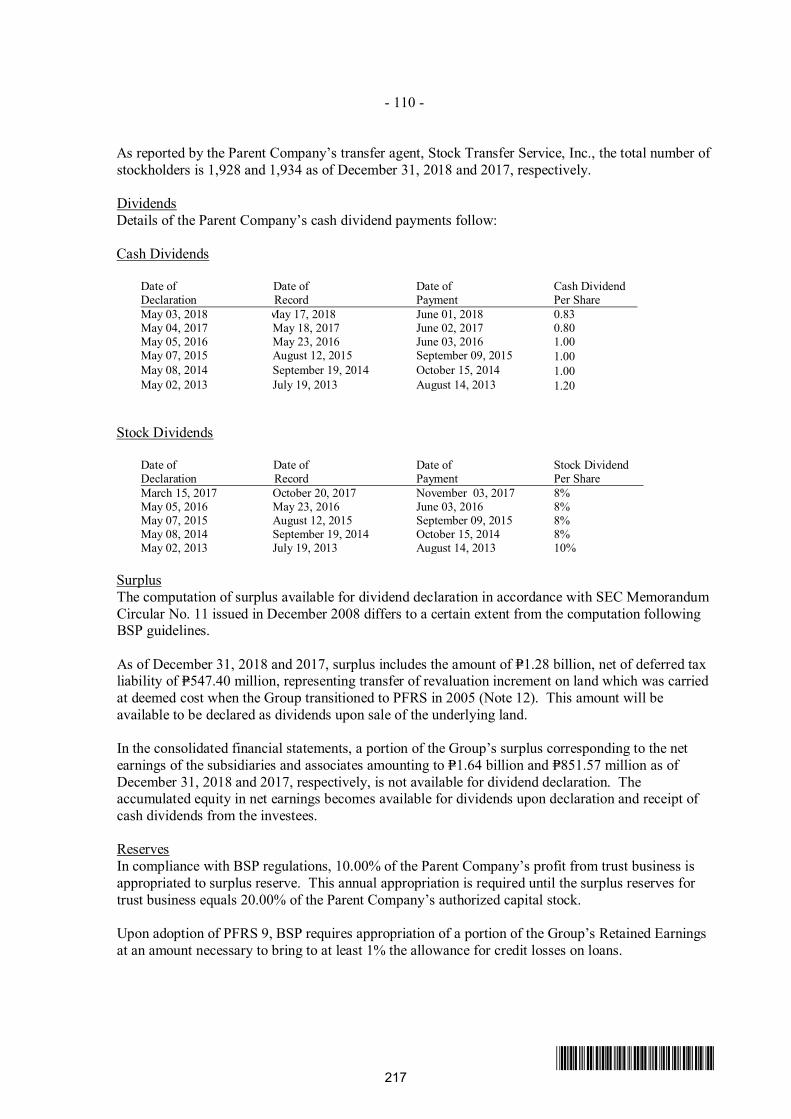
- 110 -
*SGVFS032944*
As reported by the Parent Company’s transfer agent, Stock Transfer Service, Inc., the total number ofstockholders is 1,928 and 1,934 as of December 31, 2018 and 2017, respectively.
DividendsDetails of the Parent Company’s cash dividend payments follow:
Cash Dividends
Date of Date of Date of Cash DividendDeclaration Record Payment Per ShareMay 03, 2018 May 17, 2018 June 01, 2018 0.83May 04, 2017 May 18, 2017 June 02, 2017 0.80May 05, 2016 May 23, 2016 June 03, 2016 1.00May 07, 2015 August 12, 2015 September 09, 2015 1.00May 08, 2014 September 19, 2014 October 15, 2014 1.00May 02, 2013 July 19, 2013 August 14, 2013 1.20
Stock Dividends
Date of Date of Date of Stock DividendDeclaration Record Payment Per ShareMarch 15, 2017 October 20, 2017 November 03, 2017 8%May 05, 2016 May 23, 2016 June 03, 2016 8%May 07, 2015 August 12, 2015 September 09, 2015 8%May 08, 2014 September 19, 2014 October 15, 2014 8%May 02, 2013 July 19, 2013 August 14, 2013 10%
SurplusThe computation of surplus available for dividend declaration in accordance with SEC MemorandumCircular No. 11 issued in December 2008 differs to a certain extent from the computation followingBSP guidelines.
As of December 31, 2018 and 2017, surplus includes the amount of P=1.28 billion, net of deferred taxliability of P=547.40 million, representing transfer of revaluation increment on land which was carriedat deemed cost when the Group transitioned to PFRS in 2005 (Note 12). This amount will beavailable to be declared as dividends upon sale of the underlying land.
In the consolidated financial statements, a portion of the Group’s surplus corresponding to the netearnings of the subsidiaries and associates amounting to P=1.64 billion and P=851.57 million as ofDecember 31, 2018 and 2017, respectively, is not available for dividend declaration. Theaccumulated equity in net earnings becomes available for dividends upon declaration and receipt ofcash dividends from the investees.
ReservesIn compliance with BSP regulations, 10.00% of the Parent Company’s profit from trust business isappropriated to surplus reserve. This annual appropriation is required until the surplus reserves fortrust business equals 20.00% of the Parent Company’s authorized capital stock.
Upon adoption of PFRS 9, BSP requires appropriation of a portion of the Group’s Retained Earningsat an amount necessary to bring to at least 1% the allowance for credit losses on loans.
217
VJNQUISIDO
Rectangle
- 111 -
*SGVFS032944*
As of January 1, 2018 and December 31, 2018, the accumulated amount of appropriation to surplusreserves amounted to P2.43 billion and P2.75 billion, respectively. Appropriation for the yearamounted to P312.82 million (Note 16).
Capital ManagementThe primary objectives of the Group’s capital management are to ensure that it complies withexternally imposed capital requirements and that it maintains strong credit ratings and healthy capitalratios in order to support its business and to maximize shareholders’ value.
The Group manages its capital structure and makes adjustments to it in light of changes in economicconditions and the risk characteristics of its activities. In order to maintain or adjust the capitalstructure, the Group may adjust the amount of dividend payment to shareholders, return capital toshareholders or issue capital securities. No changes were made in the objectives, policies andprocesses as of December 31, 2018 and 2017.
Regulatory Qualifying CapitalUnder existing BSP regulations, the determination of the Parent Company’s compliance withregulatory requirements and ratios is based on the amount of the Parent Company’s unimpairedcapital (regulatory capital) as reported to the BSP. This is determined on the basis of regulatoryaccounting policies which differ from PFRS in some respects.
In addition, the risk−based capital ratio of a bank, expressed as a percentage of qualifying capital torisk−weighted assets (RWA), should not be less than 10.00% for both solo basis (head office andbranches) and consolidated basis (Parent Company and subsidiaries engaged in financial alliedundertakings but excluding insurance companies). Qualifying capital and RWA are computed basedon BSP regulations. RWA consists of total assets less cash on hand, due from BSP, loans covered byhold−out on or assignment of deposits, loans or acceptances under letters of credit to the extentcovered by margin deposits and other non−risk items determined by the Monetary Board of the BSP.
On August 4, 2006, the BSP, under BSP Circular No. 538, issued the prescribed guidelinesimplementing the revised risk−based capital adequacy framework for the Philippine banking systemto conform to Basel II capital adequacy framework. The BSP guidelines took effect on July 1, 2007.Thereafter, banks were required to compute their CAR using these guidelines.
Standardized credit risk weights were used in the credit assessment of asset exposures. Third partycredit assessments were based on ratings by Standard & Poor's, Moody's and Fitch, while PhilRatingswere used on peso−denominated exposures to Sovereigns, MDBs, Banks, LGUs, GovernmentCorporations, Corporates.
On January 15, 2013, the BSP issued Circular No. 781, Basel III Implementing Guidelines onMinimum Capital Requirements, which provides the implementing guidelines on the revisedrisk−based capital adequacy framework particularly on the minimum capital and disclosurerequirements for universal banks and commercial banks, as well as their subsidiary banks andquasi−banks, in accordance with the Basel III standards. The circular took effect on January 1, 2014.
The Circular sets out a minimum Common Equity Tier 1 (CET1) ratio of 6.00% and Tier 1 capitalratio of 7.50%. It also introduces a capital conservation buffer of 2.50% comprised of CET1 capital.The BSP’s existing requirement for Total CAR remains unchanged at 10.00% and this ratio shall bemaintained at all times.
218
VJNQUISIDO
Rectangle
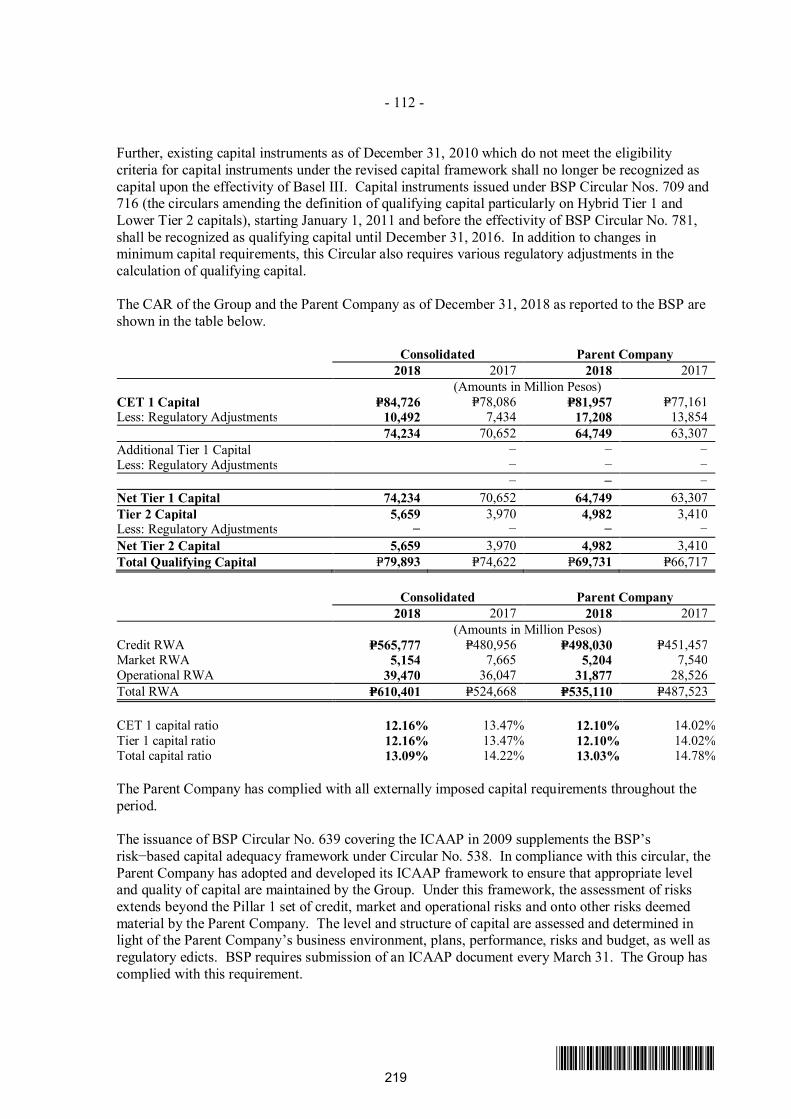
- 112 -
*SGVFS032944*
Further, existing capital instruments as of December 31, 2010 which do not meet the eligibilitycriteria for capital instruments under the revised capital framework shall no longer be recognized ascapital upon the effectivity of Basel III. Capital instruments issued under BSP Circular Nos. 709 and716 (the circulars amending the definition of qualifying capital particularly on Hybrid Tier 1 andLower Tier 2 capitals), starting January 1, 2011 and before the effectivity of BSP Circular No. 781,shall be recognized as qualifying capital until December 31, 2016. In addition to changes inminimum capital requirements, this Circular also requires various regulatory adjustments in thecalculation of qualifying capital.
The CAR of the Group and the Parent Company as of December 31, 2018 as reported to the BSP areshown in the table below.
Consolidated Parent Company2018 2017 2018 2017
(Amounts in Million Pesos)CET 1 Capital P=84,726 P=78,086 P=81,957 P=77,161Less: Regulatory Adjustments 10,492 7,434 17,208 13,854
74,234 70,652 64,749 63,307Additional Tier 1 Capital − − −Less: Regulatory Adjustments − − −
− − −Net Tier 1 Capital 74,234 70,652 64,749 63,307Tier 2 Capital 5,659 3,970 4,982 3,410Less: Regulatory Adjustments − − − −Net Tier 2 Capital 5,659 3,970 4,982 3,410Total Qualifying Capital P=79,893 P=74,622 P=69,731 P=66,717
Consolidated Parent Company2018 2017 2018 2017
(Amounts in Million Pesos)Credit RWA P=565,777 P=480,956 P=498,030 P=451,457Market RWA 5,154 7,665 5,204 7,540Operational RWA 39,470 36,047 31,877 28,526Total RWA P=610,401 P=524,668 P=535,110 P=487,523
CET 1 capital ratio 12.16% 13.47% 12.10% 14.02%Tier 1 capital ratio 12.16% 13.47% 12.10% 14.02%Total capital ratio 13.09% 14.22% 13.03% 14.78%
The Parent Company has complied with all externally imposed capital requirements throughout theperiod.
The issuance of BSP Circular No. 639 covering the ICAAP in 2009 supplements the BSP’srisk−based capital adequacy framework under Circular No. 538. In compliance with this circular, theParent Company has adopted and developed its ICAAP framework to ensure that appropriate leveland quality of capital are maintained by the Group. Under this framework, the assessment of risksextends beyond the Pillar 1 set of credit, market and operational risks and onto other risks deemedmaterial by the Parent Company. The level and structure of capital are assessed and determined inlight of the Parent Company’s business environment, plans, performance, risks and budget, as well asregulatory edicts. BSP requires submission of an ICAAP document every March 31. The Group hascomplied with this requirement.
219
VJNQUISIDO
Rectangle
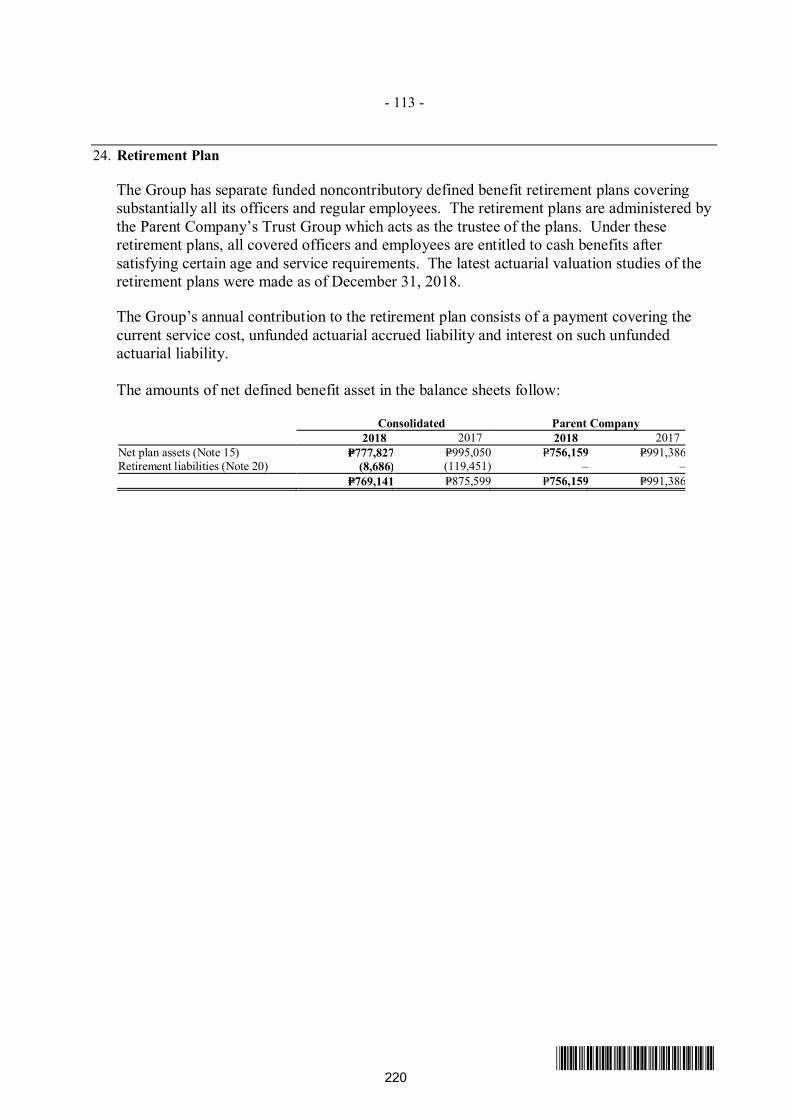
- 113 -
*SGVFS032944*
24. Retirement Plan
The Group has separate funded noncontributory defined benefit retirement plans coveringsubstantially all its officers and regular employees. The retirement plans are administered bythe Parent Company’s Trust Group which acts as the trustee of the plans. Under theseretirement plans, all covered officers and employees are entitled to cash benefits aftersatisfying certain age and service requirements. The latest actuarial valuation studies of theretirement plans were made as of December 31, 2018.
The Group’s annual contribution to the retirement plan consists of a payment covering thecurrent service cost, unfunded actuarial accrued liability and interest on such unfundedactuarial liability.
The amounts of net defined benefit asset in the balance sheets follow:
Consolidated Parent Company2018 2017 2018 2017
Net plan assets (Note 15) P=777,827 P=995,050 P=756,159 P=991,386Retirement liabilities (Note 20) (8,686) (119,451) – –
P=769,141 P=875,599 P=756,159 P=991,386
220
VJNQUISIDO
Rectangle
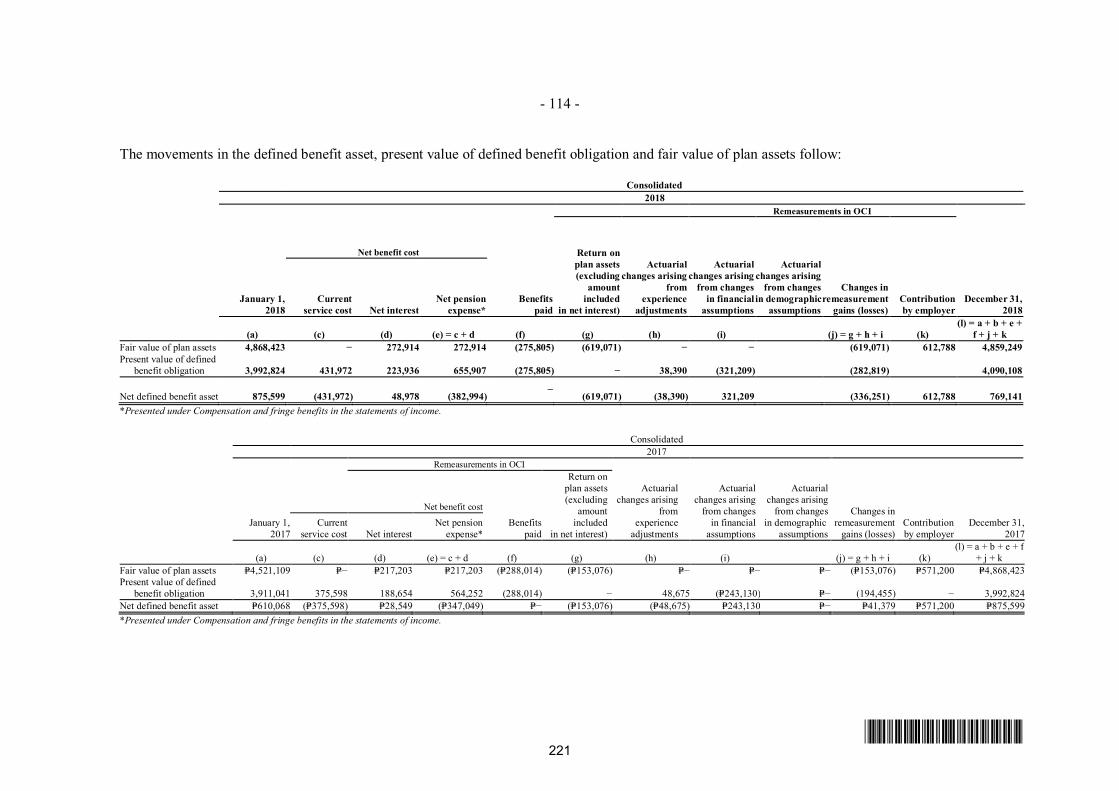
- 114 -
*SGVFS032944*
The movements in the defined benefit asset, present value of defined benefit obligation and fair value of plan assets follow:
Consolidated2018
Remeasurements in OCI
January 1,2018
Net benefit cost
Benefitspaid
Return onplan assets(excluding
amountincluded
in net interest)
Actuarialchanges arising
fromexperience
adjustments
Actuarialchanges arising
from changesin financial
assumptions
Changes inremeasurement
gains (losses)Contributionby employer
December 31,2018
Currentservice cost Net interest
Net pensionexpense*
Actuarialchanges arising
from changesin demographic
assumptions
(a) (c) (d) (e) = c + d (f) (g) (h) (i) (j) = g + h + i (k)(l) = a + b + e +
f + j + kFair value of plan assets 4,868,423 − 272,914 272,914 (275,805) (619,071) − − (619,071) 612,788 4,859,249Present value of defined
benefit obligation 3,992,824 431,972 223,936 655,907 (275,805) − 38,390 (321,209) (282,819) 4,090,108
Net defined benefit asset 875,599 (431,972) 48,978 (382,994)−
(619,071) (38,390) 321,209 (336,251) 612,788 769,141*Presented under Compensation and fringe benefits in the statements of income.
Consolidated2017
Remeasurements in OCI
January 1,2017
Net benefit cost
Benefitspaid
Return onplan assets(excluding
amountincluded
in net interest)
Actuarialchanges arising
fromexperience
adjustments
Actuarialchanges arising
from changesin financial
assumptions
Actuarialchanges arising
from changesin demographic
assumptions
Changes inremeasurement
gains (losses)Contributionby employer
December 31,2017
Currentservice cost Net interest
Net pensionexpense*
(a) (c) (d) (e) = c + d (f) (g) (h) (i) (j) = g + h + i (k)(l) = a + b + e + f
+ j + kFair value of plan assets P=4,521,109 P=− P=217,203 P=217,203 (P=288,014) (P=153,076) P=− P=− P=− (P=153,076) P=571,200 P=4,868,423Present value of defined
benefit obligation 3,911,041 375,598 188,654 564,252 (288,014) − 48,675 (P=243,130) P=− (194,455) − 3,992,824Net defined benefit asset P=610,068 (P=375,598) P=28,549 (P=347,049) P=− (P=153,076) (P=48,675) P=243,130 P=− P=41,379 P=571,200 P=875,599*Presented under Compensation and fringe benefits in the statements of income.
221
VJNQUISIDO
Rectangle
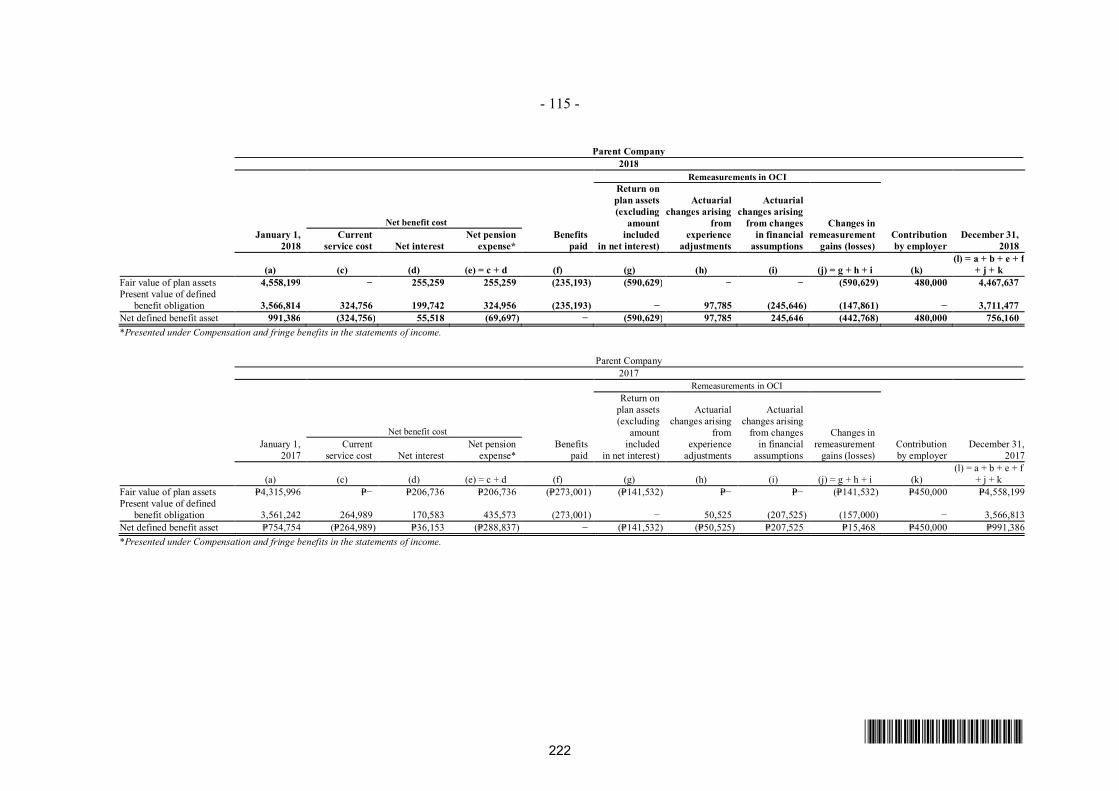
- 115 -
*SGVFS032944*
Parent Company2018
Remeasurements in OCI
January 1,2018
Net benefit costBenefits
paid
Return onplan assets(excluding
amountincluded
in net interest)
Actuarialchanges arising
fromexperience
adjustments
Actuarialchanges arising
from changesin financial
assumptions
Changes inremeasurement
gains (losses)Contributionby employer
December 31,2018
Currentservice cost Net interest
Net pensionexpense*
(a) (c) (d) (e) = c + d (f) (g) (h) (i) (j) = g + h + i (k)(l) = a + b + e + f
+ j + kFair value of plan assets 4,558,199 − 255,259 255,259 (235,193) (590,629) − − (590,629) 480,000 4,467,637Present value of defined
benefit obligation 3,566,814 324,756 199,742 324,956 (235,193) − 97,785 (245,646) (147,861) − 3,711,477Net defined benefit asset 991,386 (324,756) 55,518 (69,697) − (590,629) 97,785 245,646 (442,768) 480,000 756,160*Presented under Compensation and fringe benefits in the statements of income.
Parent Company2017
Remeasurements in OCI
January 1,2017
Net benefit costBenefits
paid
Return onplan assets(excluding
amountincluded
in net interest)
Actuarialchanges arising
fromexperience
adjustments
Actuarialchanges arising
from changesin financial
assumptions
Changes inremeasurement
gains (losses)Contributionby employer
December 31,2017
Currentservice cost Net interest
Net pensionexpense*
(a) (c) (d) (e) = c + d (f) (g) (h) (i) (j) = g + h + i (k)(l) = a + b + e + f
+ j + kFair value of plan assets P=4,315,996 P=− P=206,736 P=206,736 (P=273,001) (P=141,532) P=− P=− (P=141,532) P=450,000 P=4,558,199Present value of defined
benefit obligation 3,561,242 264,989 170,583 435,573 (273,001) − 50,525 (207,525) (157,000) − 3,566,813Net defined benefit asset P=754,754 (P=264,989) P=36,153 (P=288,837) − (P=141,532) (P=50,525) P=207,525 P=15,468 P=450,000 P=991,386*Presented under Compensation and fringe benefits in the statements of income.
222
VJNQUISIDO
Rectangle
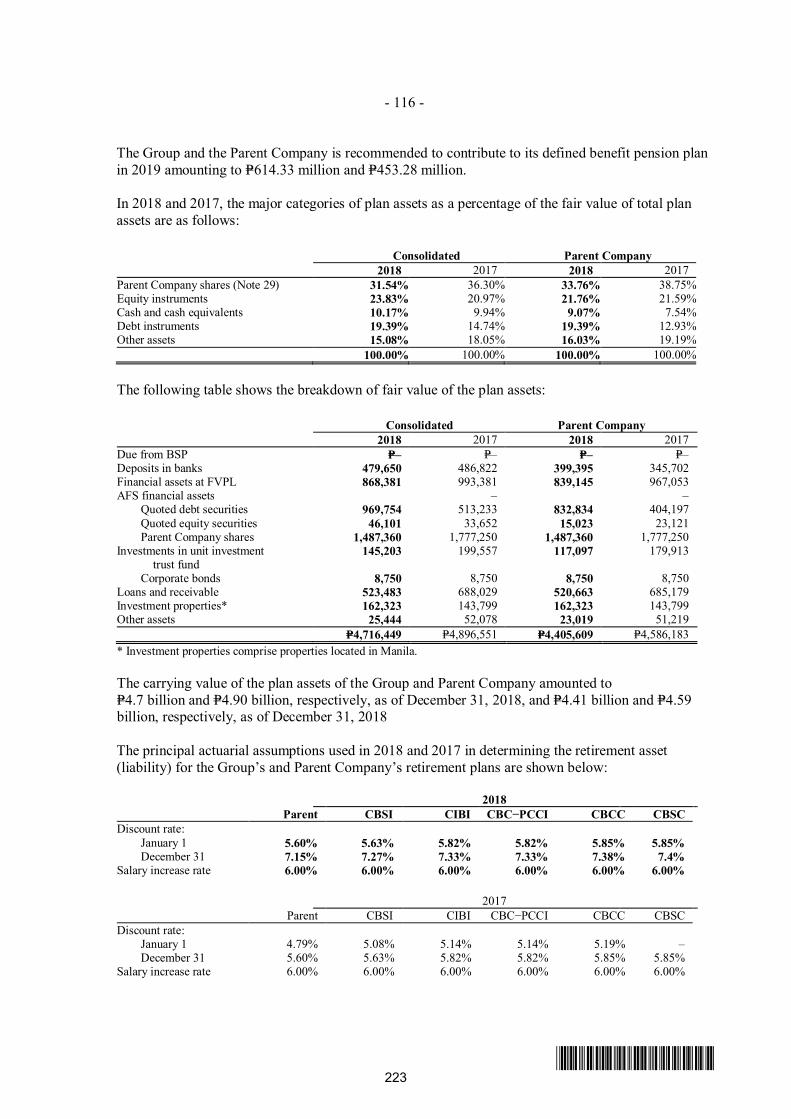
- 116 -
*SGVFS032944*
The Group and the Parent Company is recommended to contribute to its defined benefit pension planin 2019 amounting to P=614.33 million and P=453.28 million.
In 2018 and 2017, the major categories of plan assets as a percentage of the fair value of total planassets are as follows:
Consolidated Parent Company2018 2017 2018 2017
Parent Company shares (Note 29) 31.54% 36.30% 33.76% 38.75%Equity instruments 23.83% 20.97% 21.76% 21.59%Cash and cash equivalents 10.17% 9.94% 9.07% 7.54%Debt instruments 19.39% 14.74% 19.39% 12.93%Other assets 15.08% 18.05% 16.03% 19.19%
100.00% 100.00% 100.00% 100.00%
The following table shows the breakdown of fair value of the plan assets:
Consolidated Parent Company2018 2017 2018 2017
Due from BSP P=– P=– P=– P=–Deposits in banks 479,650 486,822 399,395 345,702Financial assets at FVPL 868,381 993,381 839,145 967,053AFS financial assets – –
Quoted debt securities 969,754 513,233 832,834 404,197Quoted equity securities 46,101 33,652 15,023 23,121Parent Company shares 1,487,360 1,777,250 1,487,360 1,777,250
Investments in unit investmenttrust fund
145,203 199,557 117,097 179,913
Corporate bonds 8,750 8,750 8,750 8,750Loans and receivable 523,483 688,029 520,663 685,179Investment properties* 162,323 143,799 162,323 143,799Other assets 25,444 52,078 23,019 51,219
P=4,716,449 P=4,896,551 P=4,405,609 P=4,586,183 * Investment properties comprise properties located in Manila.
The carrying value of the plan assets of the Group and Parent Company amounted toP=4.7 billion and P=4.90 billion, respectively, as of December 31, 2018, and P=4.41 billion and P=4.59billion, respectively, as of December 31, 2018
The principal actuarial assumptions used in 2018 and 2017 in determining the retirement asset(liability) for the Group’s and Parent Company’s retirement plans are shown below:
2018Parent CBSI CIBI CBC−PCCI CBCC CBSC
Discount rate: January 1 5.60% 5.63% 5.82% 5.82% 5.85% 5.85% December 31 7.15% 7.27% 7.33% 7.33% 7.38% 7.4%Salary increase rate 6.00% 6.00% 6.00% 6.00% 6.00% 6.00%
2017Parent CBSI CIBI CBC−PCCI CBCC CBSC
Discount rate: January 1 4.79% 5.08% 5.14% 5.14% 5.19% – December 31 5.60% 5.63% 5.82% 5.82% 5.85% 5.85%Salary increase rate 6.00% 6.00% 6.00% 6.00% 6.00% 6.00%
223
VJNQUISIDO
Rectangle
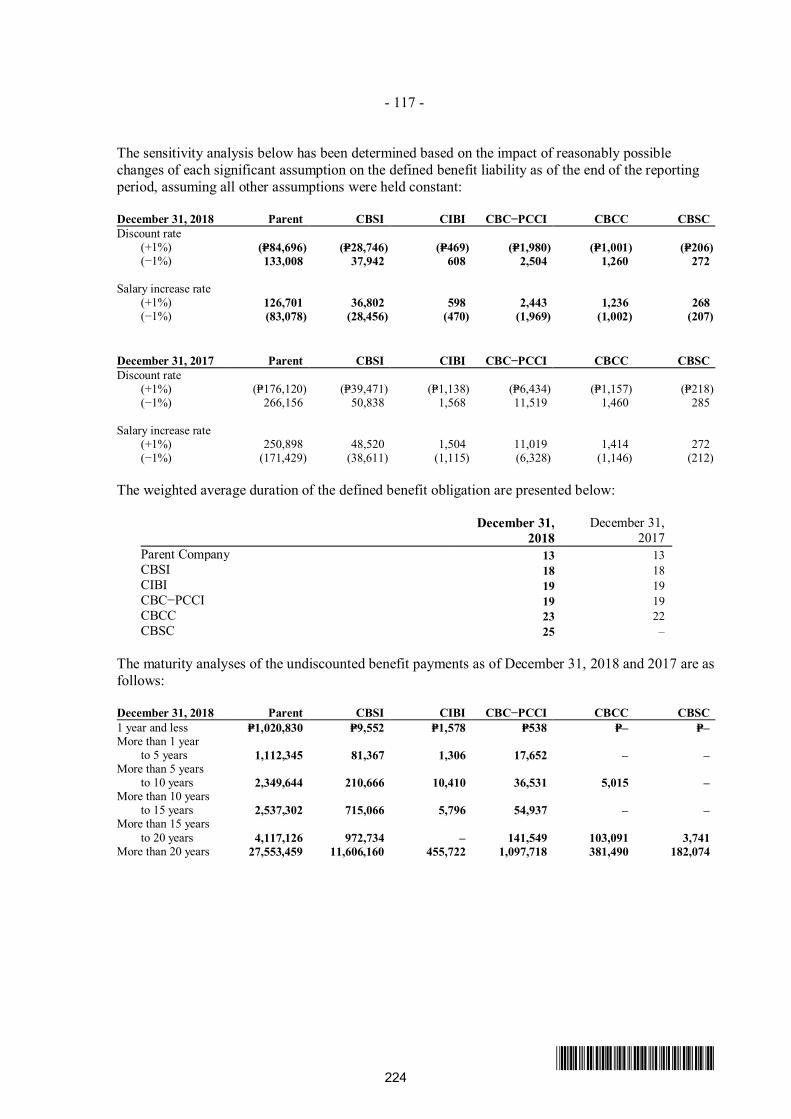
- 117 -
*SGVFS032944*
The sensitivity analysis below has been determined based on the impact of reasonably possiblechanges of each significant assumption on the defined benefit liability as of the end of the reportingperiod, assuming all other assumptions were held constant:
December 31, 2018 Parent CBSI CIBI CBC−PCCI CBCC CBSCDiscount rate (+1%) (P=84,696) (P=28,746) (P=469) (P=1,980) (P=1,001) (P=206) (−1%) 133,008 37,942 608 2,504 1,260 272
Salary increase rate (+1%) 126,701 36,802 598 2,443 1,236 268 (−1%) (83,078) (28,456) (470) (1,969) (1,002) (207)
December 31, 2017 Parent CBSI CIBI CBC−PCCI CBCC CBSCDiscount rate (+1%) (P=176,120) (P=39,471) (P=1,138) (P=6,434) (P=1,157) (P=218) (−1%) 266,156 50,838 1,568 11,519 1,460 285
Salary increase rate (+1%) 250,898 48,520 1,504 11,019 1,414 272 (−1%) (171,429) (38,611) (1,115) (6,328) (1,146) (212)
The weighted average duration of the defined benefit obligation are presented below:
December 31,2018
December 31,2017
Parent Company 13 13CBSI 18 18CIBI 19 19CBC−PCCI 19 19CBCC 23 22CBSC 25 –
The maturity analyses of the undiscounted benefit payments as of December 31, 2018 and 2017 are asfollows:
December 31, 2018 Parent CBSI CIBI CBC−PCCI CBCC CBSC1 year and less P=1,020,830 P=9,552 P=1,578 P=538 P=– P=–More than 1 year
to 5 years 1,112,345 81,367 1,306 17,652 – –More than 5 years
to 10 years 2,349,644 210,666 10,410 36,531 5,015 –More than 10 years
to 15 years 2,537,302 715,066 5,796 54,937 – –More than 15 years
to 20 years 4,117,126 972,734 – 141,549 103,091 3,741More than 20 years 27,553,459 11,606,160 455,722 1,097,718 381,490 182,074
224
VJNQUISIDO
Rectangle
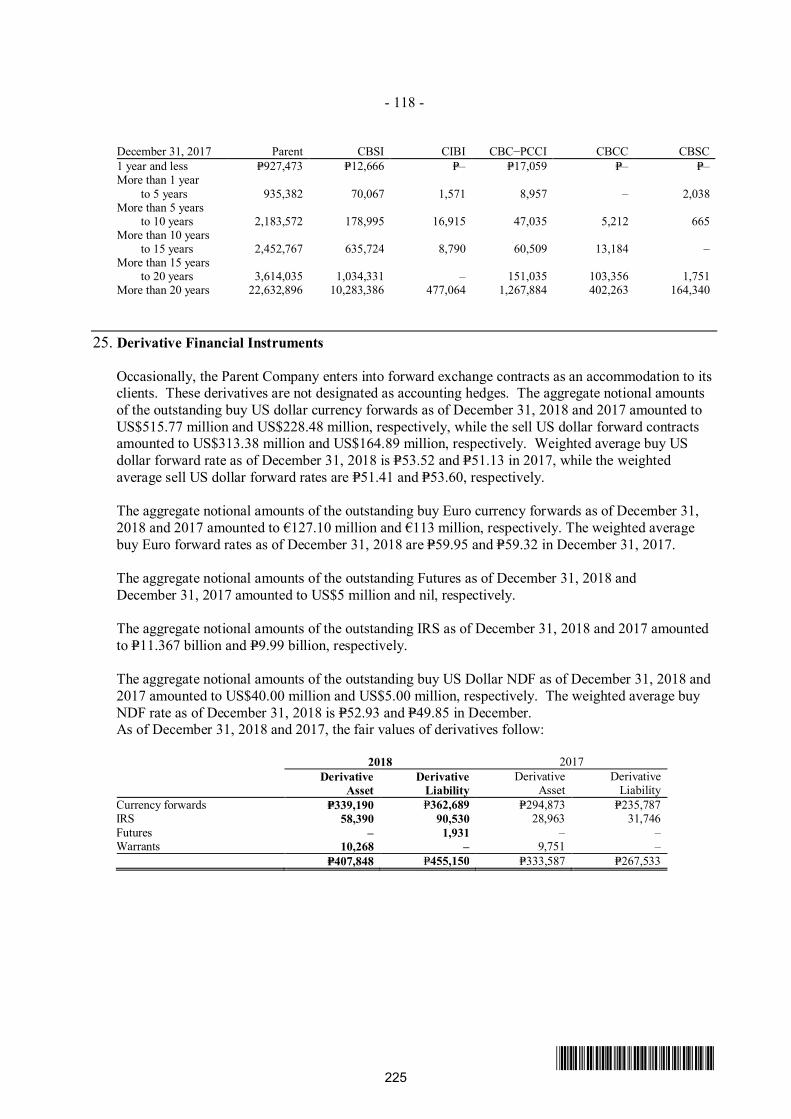
- 118 -
*SGVFS032944*
December 31, 2017 Parent CBSI CIBI CBC−PCCI CBCC CBSC1 year and less P=927,473 P=12,666 P=– P=17,059 P=– P=–More than 1 year
to 5 years 935,382 70,067 1,571 8,957 – 2,038More than 5 years
to 10 years 2,183,572 178,995 16,915 47,035 5,212 665More than 10 years
to 15 years 2,452,767 635,724 8,790 60,509 13,184 –More than 15 years
to 20 years 3,614,035 1,034,331 – 151,035 103,356 1,751More than 20 years 22,632,896 10,283,386 477,064 1,267,884 402,263 164,340
25. Derivative Financial Instruments
Occasionally, the Parent Company enters into forward exchange contracts as an accommodation to itsclients. These derivatives are not designated as accounting hedges. The aggregate notional amountsof the outstanding buy US dollar currency forwards as of December 31, 2018 and 2017 amounted toUS$515.77 million and US$228.48 million, respectively, while the sell US dollar forward contractsamounted to US$313.38 million and US$164.89 million, respectively. Weighted average buy USdollar forward rate as of December 31, 2018 is P=53.52 and P=51.13 in 2017, while the weightedaverage sell US dollar forward rates are P=51.41 and P=53.60, respectively.
The aggregate notional amounts of the outstanding buy Euro currency forwards as of December 31,2018 and 2017 amounted to €127.10 million and €113 million, respectively. The weighted averagebuy Euro forward rates as of December 31, 2018 are P=59.95 and P=59.32 in December 31, 2017.
The aggregate notional amounts of the outstanding Futures as of December 31, 2018 andDecember 31, 2017 amounted to US$5 million and nil, respectively.
The aggregate notional amounts of the outstanding IRS as of December 31, 2018 and 2017 amountedto P=11.367 billion and P=9.99 billion, respectively.
The aggregate notional amounts of the outstanding buy US Dollar NDF as of December 31, 2018 and2017 amounted to US$40.00 million and US$5.00 million, respectively. The weighted average buyNDF rate as of December 31, 2018 is P=52.93 and P=49.85 in December.As of December 31, 2018 and 2017, the fair values of derivatives follow:
2018 2017Derivative
AssetDerivative
LiabilityDerivative
AssetDerivative
LiabilityCurrency forwards P=339,190 P=362,689 P=294,873 P=235,787IRS 58,390 90,530 28,963 31,746Futures – 1,931 – –Warrants 10,268 – 9,751 –
P=407,848 P=455,150 P=333,587 P=267,533
225
VJNQUISIDO
Rectangle
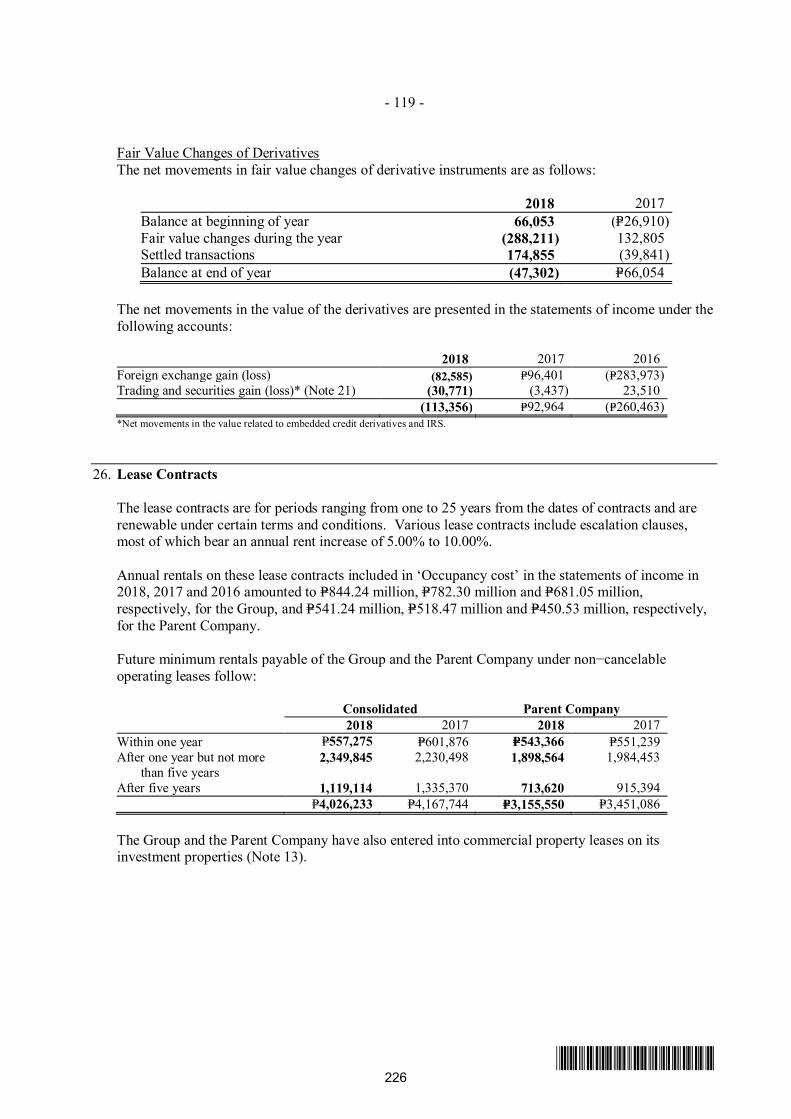
- 119 -
*SGVFS032944*
Fair Value Changes of DerivativesThe net movements in fair value changes of derivative instruments are as follows:
2018 2017Balance at beginning of year 66,053 (P=26,910)Fair value changes during the year (288,211) 132,805Settled transactions 174,855 (39,841)Balance at end of year (47,302) P=66,054
The net movements in the value of the derivatives are presented in the statements of income under thefollowing accounts:
2018 2017 2016Foreign exchange gain (loss) (82,585) P=96,401 (P=283,973)Trading and securities gain (loss)* (Note 21) (30,771) (3,437) 23,510
(113,356) P=92,964 (P=260,463)*Net movements in the value related to embedded credit derivatives and IRS.
26. Lease Contracts
The lease contracts are for periods ranging from one to 25 years from the dates of contracts and arerenewable under certain terms and conditions. Various lease contracts include escalation clauses,most of which bear an annual rent increase of 5.00% to 10.00%.
Annual rentals on these lease contracts included in ‘Occupancy cost’ in the statements of income in2018, 2017 and 2016 amounted to P=844.24 million, P=782.30 million and P=681.05 million,respectively, for the Group, and P=541.24 million, P=518.47 million and P=450.53 million, respectively,for the Parent Company.
Future minimum rentals payable of the Group and the Parent Company under non−cancelableoperating leases follow:
Consolidated Parent Company2018 2017 2018 2017
Within one year P=557,275 P=601,876 P=543,366 P=551,239After one year but not more
than five years2,349,845 2,230,498 1,898,564 1,984,453
After five years 1,119,114 1,335,370 713,620 915,394P=4,026,233 P=4,167,744 P=3,155,550 P=3,451,086
The Group and the Parent Company have also entered into commercial property leases on itsinvestment properties (Note 13).
226
VJNQUISIDO
Rectangle
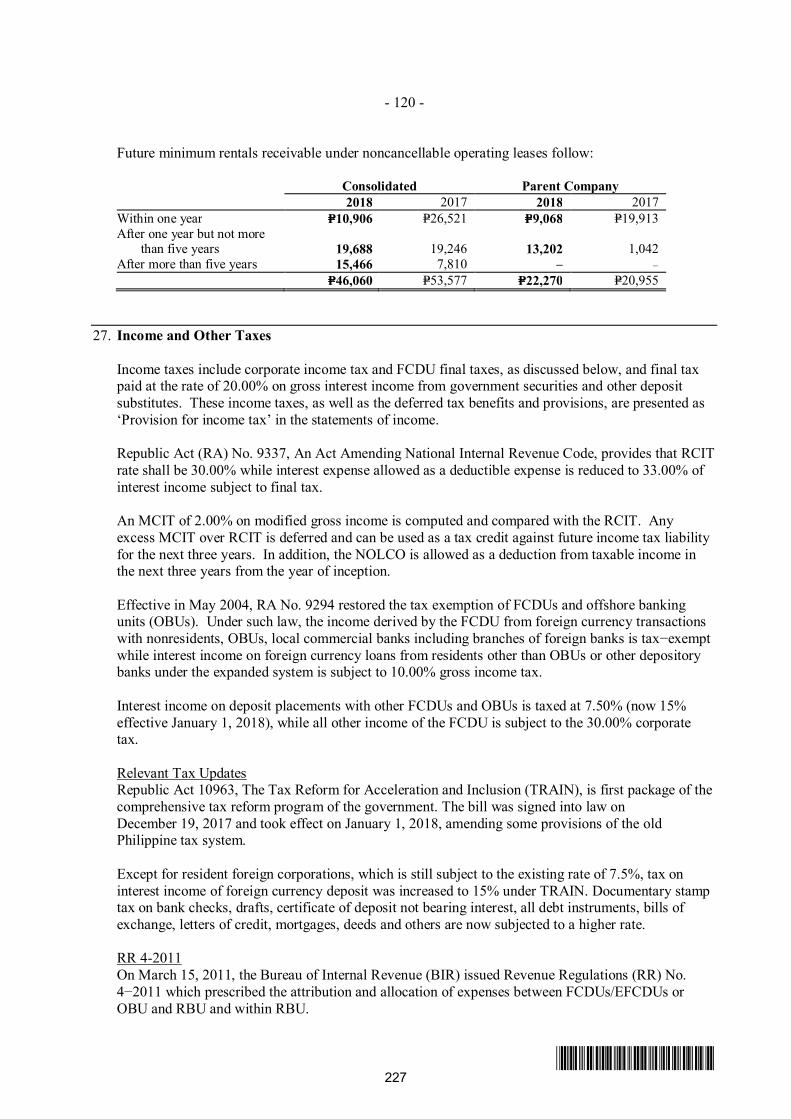
- 120 -
*SGVFS032944*
Future minimum rentals receivable under noncancellable operating leases follow:
Consolidated Parent Company2018 2017 2018 2017
Within one year P=10,906 P=26,521 P=9,068 P=19,913After one year but not more
than five years 19,688 19,246 13,202 1,042After more than five years 15,466 7,810 − −
P=46,060 P=53,577 P=22,270 P=20,955
27. Income and Other Taxes
Income taxes include corporate income tax and FCDU final taxes, as discussed below, and final taxpaid at the rate of 20.00% on gross interest income from government securities and other depositsubstitutes. These income taxes, as well as the deferred tax benefits and provisions, are presented as‘Provision for income tax’ in the statements of income.
Republic Act (RA) No. 9337, An Act Amending National Internal Revenue Code, provides that RCITrate shall be 30.00% while interest expense allowed as a deductible expense is reduced to 33.00% ofinterest income subject to final tax.
An MCIT of 2.00% on modified gross income is computed and compared with the RCIT. Anyexcess MCIT over RCIT is deferred and can be used as a tax credit against future income tax liabilityfor the next three years. In addition, the NOLCO is allowed as a deduction from taxable income inthe next three years from the year of inception.
Effective in May 2004, RA No. 9294 restored the tax exemption of FCDUs and offshore bankingunits (OBUs). Under such law, the income derived by the FCDU from foreign currency transactionswith nonresidents, OBUs, local commercial banks including branches of foreign banks is tax−exemptwhile interest income on foreign currency loans from residents other than OBUs or other depositorybanks under the expanded system is subject to 10.00% gross income tax.
Interest income on deposit placements with other FCDUs and OBUs is taxed at 7.50% (now 15%effective January 1, 2018), while all other income of the FCDU is subject to the 30.00% corporatetax.
Relevant Tax UpdatesRepublic Act 10963, The Tax Reform for Acceleration and Inclusion (TRAIN), is first package of thecomprehensive tax reform program of the government. The bill was signed into law onDecember 19, 2017 and took effect on January 1, 2018, amending some provisions of the oldPhilippine tax system.
Except for resident foreign corporations, which is still subject to the existing rate of 7.5%, tax oninterest income of foreign currency deposit was increased to 15% under TRAIN. Documentary stamptax on bank checks, drafts, certificate of deposit not bearing interest, all debt instruments, bills ofexchange, letters of credit, mortgages, deeds and others are now subjected to a higher rate.
RR 4-2011On March 15, 2011, the Bureau of Internal Revenue (BIR) issued Revenue Regulations (RR) No.4−2011 which prescribed the attribution and allocation of expenses between FCDUs/EFCDUs orOBU and RBU and within RBU.
227
VJNQUISIDO
Rectangle
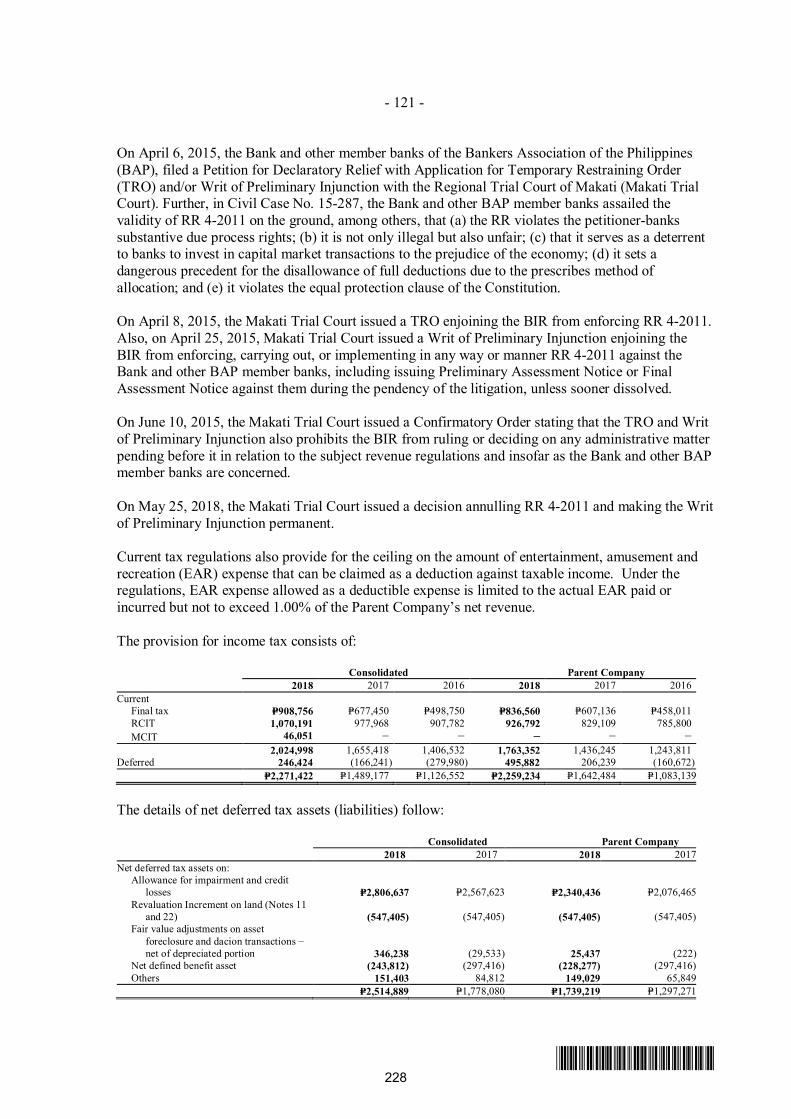
- 121 -
*SGVFS032944*
On April 6, 2015, the Bank and other member banks of the Bankers Association of the Philippines(BAP), filed a Petition for Declaratory Relief with Application for Temporary Restraining Order(TRO) and/or Writ of Preliminary Injunction with the Regional Trial Court of Makati (Makati TrialCourt). Further, in Civil Case No. 15-287, the Bank and other BAP member banks assailed thevalidity of RR 4-2011 on the ground, among others, that (a) the RR violates the petitioner-bankssubstantive due process rights; (b) it is not only illegal but also unfair; (c) that it serves as a deterrentto banks to invest in capital market transactions to the prejudice of the economy; (d) it sets adangerous precedent for the disallowance of full deductions due to the prescribes method ofallocation; and (e) it violates the equal protection clause of the Constitution.
On April 8, 2015, the Makati Trial Court issued a TRO enjoining the BIR from enforcing RR 4-2011.Also, on April 25, 2015, Makati Trial Court issued a Writ of Preliminary Injunction enjoining theBIR from enforcing, carrying out, or implementing in any way or manner RR 4-2011 against theBank and other BAP member banks, including issuing Preliminary Assessment Notice or FinalAssessment Notice against them during the pendency of the litigation, unless sooner dissolved.
On June 10, 2015, the Makati Trial Court issued a Confirmatory Order stating that the TRO and Writof Preliminary Injunction also prohibits the BIR from ruling or deciding on any administrative matterpending before it in relation to the subject revenue regulations and insofar as the Bank and other BAPmember banks are concerned.
On May 25, 2018, the Makati Trial Court issued a decision annulling RR 4-2011 and making the Writof Preliminary Injunction permanent.
Current tax regulations also provide for the ceiling on the amount of entertainment, amusement andrecreation (EAR) expense that can be claimed as a deduction against taxable income. Under theregulations, EAR expense allowed as a deductible expense is limited to the actual EAR paid orincurred but not to exceed 1.00% of the Parent Company’s net revenue.
The provision for income tax consists of:
Consolidated Parent Company2018 2017 2016 2018 2017 2016
Current Final tax P=908,756 P=677,450 P=498,750 P=836,560 P=607,136 P=458,011 RCIT 1,070,191 977,968 907,782 926,792 829,109 785,800 MCIT 46,051 − − − − −
2,024,998 1,655,418 1,406,532 1,763,352 1,436,245 1,243,811Deferred 246,424 (166,241) (279,980) 495,882 206,239 (160,672)
P=2,271,422 P=1,489,177 P=1,126,552 P=2,259,234 P=1,642,484 P=1,083,139
The details of net deferred tax assets (liabilities) follow:
Consolidated Parent Company2018 2017 2018 2017
Net deferred tax assets on:Allowance for impairment and credit
losses P=2,806,637 P=2,567,623 P=2,340,436 P=2,076,465Revaluation Increment on land (Notes 11
and 22) (547,405) (547,405) (547,405) (547,405)Fair value adjustments on asset
foreclosure and dacion transactions −net of depreciated portion 346,238 (29,533) 25,437 (222)
Net defined benefit asset (243,812) (297,416) (228,277) (297,416)Others 151,403 84,812 149,029 65,849
P=2,514,889 P=1,778,080 P=1,739,219 P=1,297,271
228
VJNQUISIDO
Rectangle
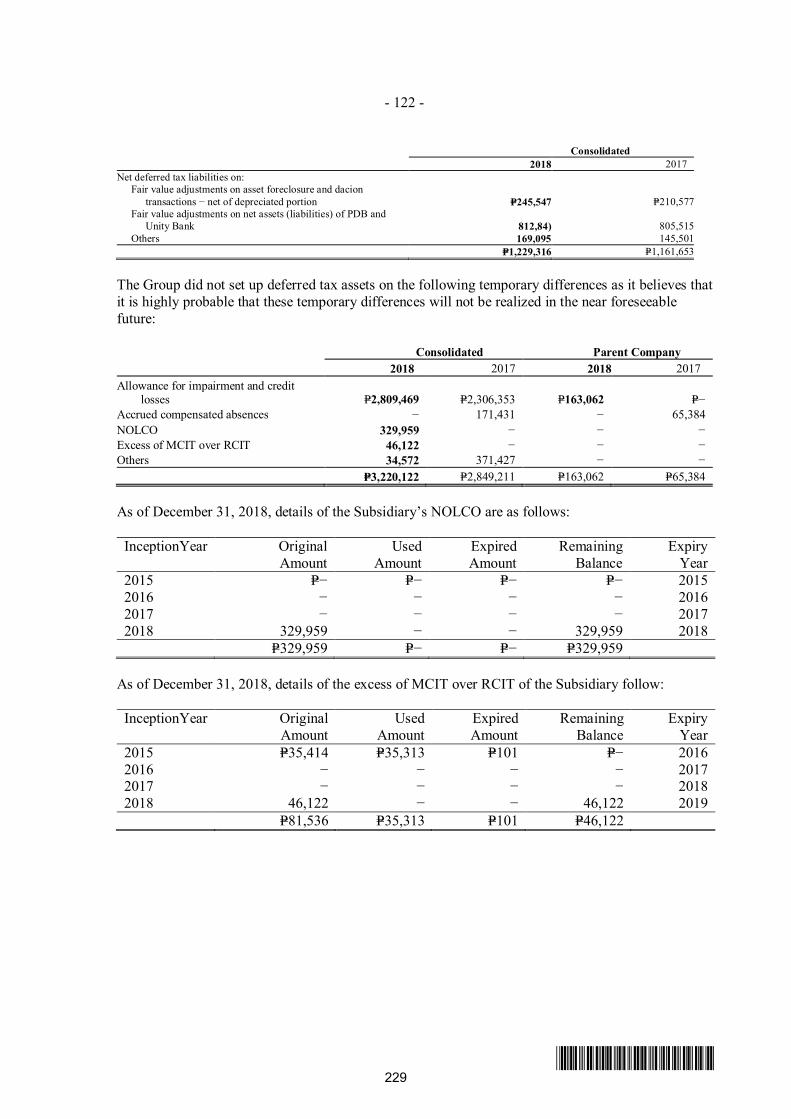
- 122 -
*SGVFS032944*
Consolidated2018 2017
Net deferred tax liabilities on:Fair value adjustments on asset foreclosure and dacion
transactions − net of depreciated portion P=245,547 P=210,577Fair value adjustments on net assets (liabilities) of PDB and
Unity Bank 812,84) 805,515Others 169,095 145,501
P=1,229,316 P=1,161,653
The Group did not set up deferred tax assets on the following temporary differences as it believes thatit is highly probable that these temporary differences will not be realized in the near foreseeablefuture:
Consolidated Parent Company2018 2017 2018 2017
Allowance for impairment and creditlosses P=2,809,469 P=2,306,353 P=163,062 P=−
Accrued compensated absences − 171,431 − 65,384NOLCO 329,959 − − −Excess of MCIT over RCIT 46,122 − − −Others 34,572 371,427 − −
P=3,220,122 P=2,849,211 P=163,062 P=65,384
As of December 31, 2018, details of the Subsidiary’s NOLCO are as follows:
InceptionYear OriginalAmount
UsedAmount
ExpiredAmount
RemainingBalance
ExpiryYear
2015 P=− P=− P=− P=− 20152016 − − − − 20162017 − − − − 20172018 329,959 − − 329,959 2018
P=329,959 P=− P=− P=329,959
As of December 31, 2018, details of the excess of MCIT over RCIT of the Subsidiary follow:
InceptionYear OriginalAmount
UsedAmount
ExpiredAmount
RemainingBalance
ExpiryYear
2015 P=35,414 P=35,313 P=101 P=− 20162016 − − − − 20172017 − − − − 20182018 46,122 − − 46,122 2019
P=81,536 P=35,313 P=101 P=46,122
229
VJNQUISIDO
Rectangle
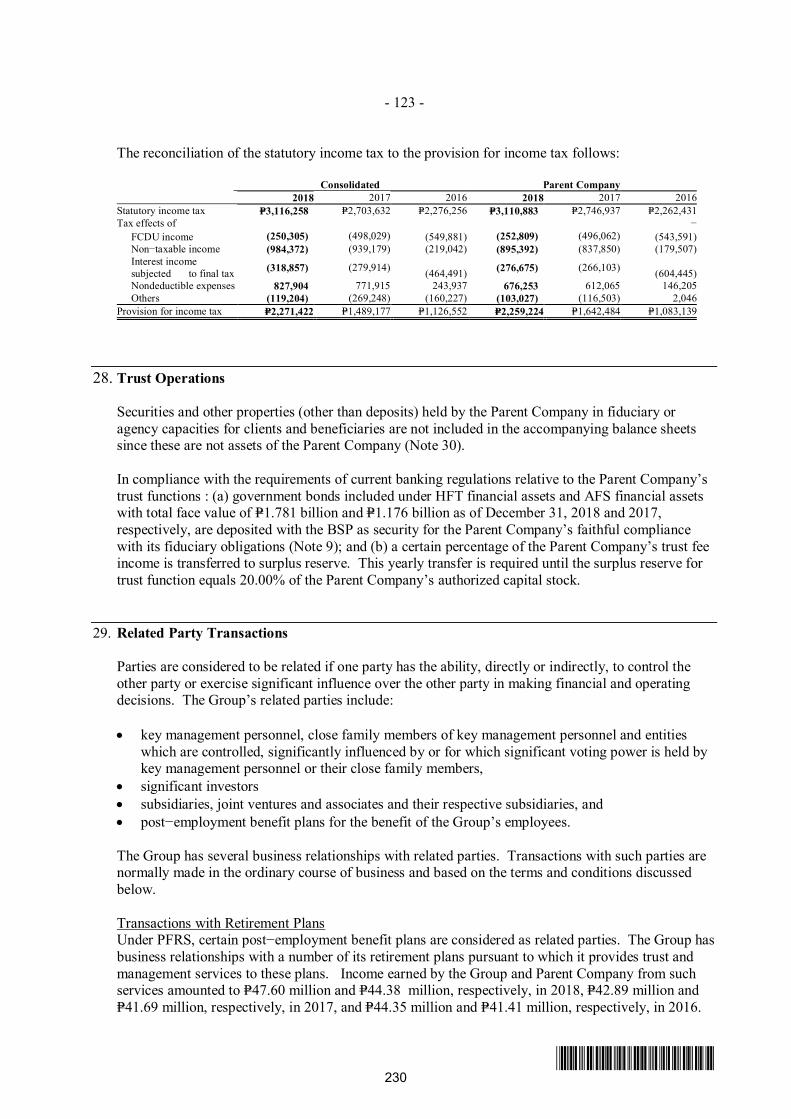
- 123 -
*SGVFS032944*
The reconciliation of the statutory income tax to the provision for income tax follows:
Consolidated Parent Company2018 2017 2016 2018 2017 2016
Statutory income tax P=3,116,258 P=2,703,632 P=2,276,256 P=3,110,883 P=2,746,937 P=2,262,431Tax effects of − FCDU income (250,305) (498,029) (549,881) (252,809) (496,062) (543,591) Non−taxable income (984,372) (939,179) (219,042) (895,392) (837,850) (179,507) Interest income
subjected to final tax (318,857) (279,914) (464,491) (276,675) (266,103) (604,445) Nondeductible expenses 827,904 771,915 243,937 676,253 612,065 146,205 Others (119,204) (269,248) (160,227) (103,027) (116,503) 2,046Provision for income tax P=2,271,422 P=1,489,177 P=1,126,552 P=2,259,224 P=1,642,484 P=1,083,139
28. Trust Operations
Securities and other properties (other than deposits) held by the Parent Company in fiduciary oragency capacities for clients and beneficiaries are not included in the accompanying balance sheetssince these are not assets of the Parent Company (Note 30).
In compliance with the requirements of current banking regulations relative to the Parent Company’strust functions : (a) government bonds included under HFT financial assets and AFS financial assetswith total face value of P=1.781 billion and P=1.176 billion as of December 31, 2018 and 2017,respectively, are deposited with the BSP as security for the Parent Company’s faithful compliancewith its fiduciary obligations (Note 9); and (b) a certain percentage of the Parent Company’s trust feeincome is transferred to surplus reserve. This yearly transfer is required until the surplus reserve fortrust function equals 20.00% of the Parent Company’s authorized capital stock.
29. Related Party Transactions
Parties are considered to be related if one party has the ability, directly or indirectly, to control theother party or exercise significant influence over the other party in making financial and operatingdecisions. The Group’s related parties include:
∂ key management personnel, close family members of key management personnel and entitieswhich are controlled, significantly influenced by or for which significant voting power is held bykey management personnel or their close family members,
∂ significant investors∂ subsidiaries, joint ventures and associates and their respective subsidiaries, and∂ post−employment benefit plans for the benefit of the Group’s employees.
The Group has several business relationships with related parties. Transactions with such parties arenormally made in the ordinary course of business and based on the terms and conditions discussedbelow.
Transactions with Retirement PlansUnder PFRS, certain post−employment benefit plans are considered as related parties. The Group hasbusiness relationships with a number of its retirement plans pursuant to which it provides trust andmanagement services to these plans. Income earned by the Group and Parent Company from suchservices amounted to P=47.60 million and P=44.38 million, respectively, in 2018, P=42.89 million andP=41.69 million, respectively, in 2017, and P=44.35 million and P=41.41 million, respectively, in 2016.
230
VJNQUISIDO
Rectangle
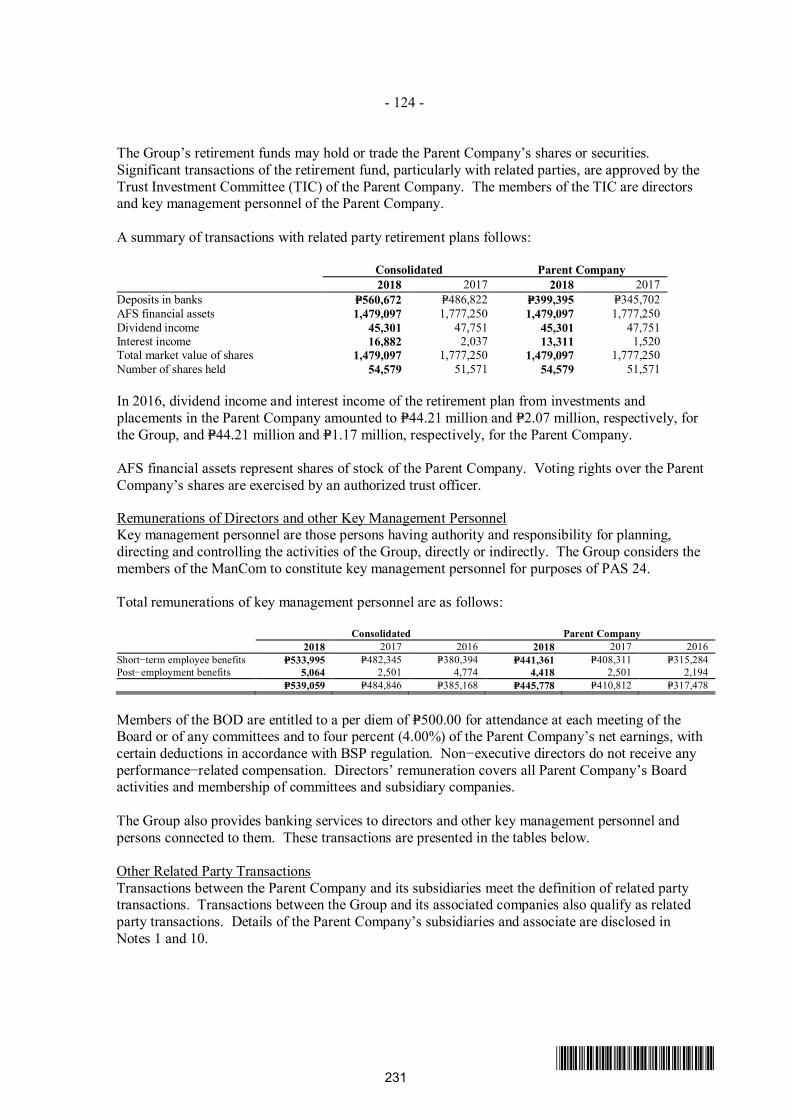
- 124 -
*SGVFS032944*
The Group’s retirement funds may hold or trade the Parent Company’s shares or securities.Significant transactions of the retirement fund, particularly with related parties, are approved by theTrust Investment Committee (TIC) of the Parent Company. The members of the TIC are directorsand key management personnel of the Parent Company.
A summary of transactions with related party retirement plans follows:
Consolidated Parent Company2018 2017 2018 2017
Deposits in banks P=560,672 P=486,822 P=399,395 P=345,702AFS financial assets 1,479,097 1,777,250 1,479,097 1,777,250Dividend income 45,301 47,751 45,301 47,751Interest income 16,882 2,037 13,311 1,520Total market value of shares 1,479,097 1,777,250 1,479,097 1,777,250Number of shares held 54,579 51,571 54,579 51,571
In 2016, dividend income and interest income of the retirement plan from investments andplacements in the Parent Company amounted to P=44.21 million and P=2.07 million, respectively, forthe Group, and P=44.21 million and P=1.17 million, respectively, for the Parent Company.
AFS financial assets represent shares of stock of the Parent Company. Voting rights over the ParentCompany’s shares are exercised by an authorized trust officer.
Remunerations of Directors and other Key Management PersonnelKey management personnel are those persons having authority and responsibility for planning,directing and controlling the activities of the Group, directly or indirectly. The Group considers themembers of the ManCom to constitute key management personnel for purposes of PAS 24.
Total remunerations of key management personnel are as follows:
Consolidated Parent Company2018 2017 2016 2018 2017 2016
Short−term employee benefits P=533,995 P=482,345 P=380,394 P=441,361 P=408,311 P=315,284Post−employment benefits 5,064 2,501 4,774 4,418 2,501 2,194
P=539,059 P=484,846 P=385,168 P=445,778 P=410,812 P=317,478
Members of the BOD are entitled to a per diem of P=500.00 for attendance at each meeting of theBoard or of any committees and to four percent (4.00%) of the Parent Company’s net earnings, withcertain deductions in accordance with BSP regulation. Non−executive directors do not receive anyperformance−related compensation. Directors’ remuneration covers all Parent Company’s Boardactivities and membership of committees and subsidiary companies.
The Group also provides banking services to directors and other key management personnel andpersons connected to them. These transactions are presented in the tables below.
Other Related Party TransactionsTransactions between the Parent Company and its subsidiaries meet the definition of related partytransactions. Transactions between the Group and its associated companies also qualify as relatedparty transactions. Details of the Parent Company’s subsidiaries and associate are disclosed inNotes 1 and 10.
231
VJNQUISIDO
Rectangle
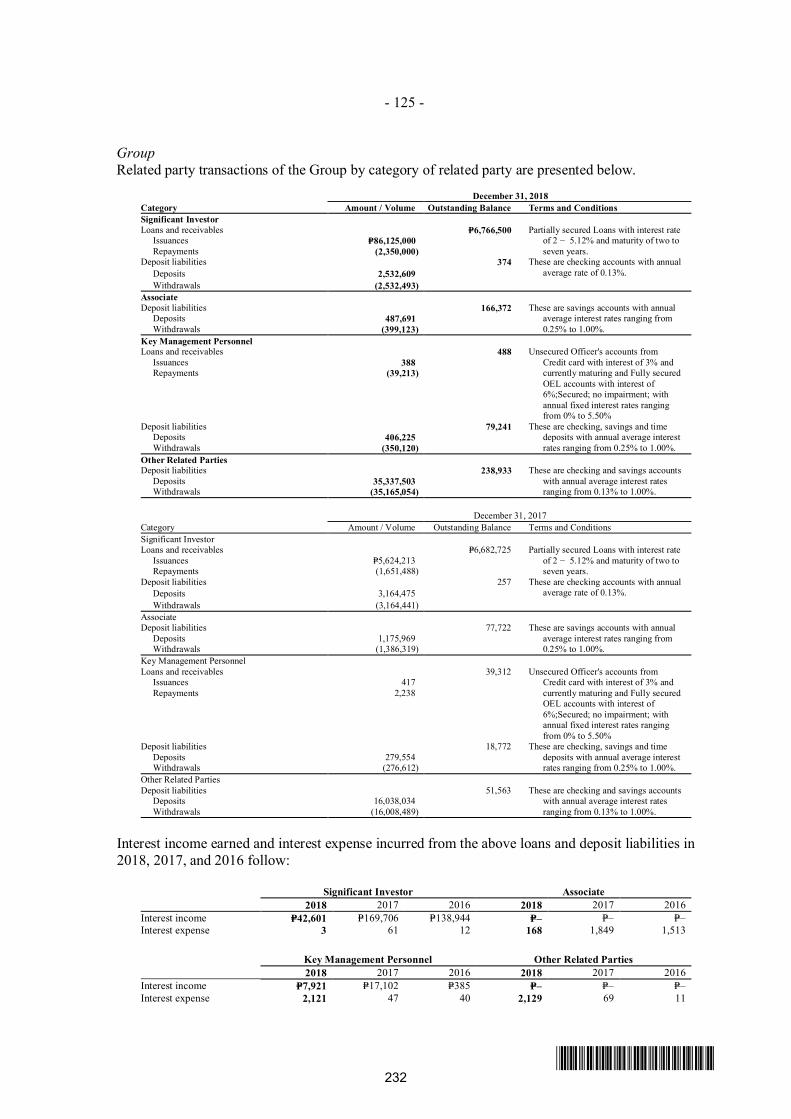
- 125 -
*SGVFS032944*
GroupRelated party transactions of the Group by category of related party are presented below.
December 31, 2018Category Amount / Volume Outstanding Balance Terms and ConditionsSignificant InvestorLoans and receivables P=6,766,500 Partially secured Loans with interest rate
of 2 − 5.12% and maturity of two toseven years.
Issuances P=86,125,000Repayments (2,350,000)
Deposit liabilities 374 These are checking accounts with annualaverage rate of 0.13%.Deposits 2,532,609
Withdrawals (2,532,493)AssociateDeposit liabilities 166,372 These are savings accounts with annual
average interest rates ranging from0.25% to 1.00%.
Deposits 487,691Withdrawals (399,123)
Key Management PersonnelLoans and receivables 488 Unsecured Officer's accounts from
Credit card with interest of 3% andcurrently maturing and Fully securedOEL accounts with interest of6%;Secured; no impairment; withannual fixed interest rates rangingfrom 0% to 5.50%
Issuances 388Repayments (39,213)
Deposit liabilities 79,241 These are checking, savings and timedeposits with annual average interestrates ranging from 0.25% to 1.00%.
Deposits 406,225Withdrawals (350,120)
Other Related PartiesDeposit liabilities 238,933 These are checking and savings accounts
with annual average interest ratesranging from 0.13% to 1.00%.
Deposits 35,337,503Withdrawals (35,165,054)
December 31, 2017Category Amount / Volume Outstanding Balance Terms and ConditionsSignificant InvestorLoans and receivables P=6,682,725 Partially secured Loans with interest rate
of 2 − 5.12% and maturity of two toseven years.
Issuances P=5,624,213Repayments (1,651,488)
Deposit liabilities 257 These are checking accounts with annualaverage rate of 0.13%.Deposits 3,164,475
Withdrawals (3,164,441)AssociateDeposit liabilities 77,722 These are savings accounts with annual
average interest rates ranging from0.25% to 1.00%.
Deposits 1,175,969Withdrawals (1,386,319)
Key Management PersonnelLoans and receivables 39,312 Unsecured Officer's accounts from
Credit card with interest of 3% andcurrently maturing and Fully securedOEL accounts with interest of6%;Secured; no impairment; withannual fixed interest rates rangingfrom 0% to 5.50%
Issuances 417Repayments 2,238
Deposit liabilities 18,772 These are checking, savings and timedeposits with annual average interestrates ranging from 0.25% to 1.00%.
Deposits 279,554Withdrawals (276,612)
Other Related PartiesDeposit liabilities 51,563 These are checking and savings accounts
with annual average interest ratesranging from 0.13% to 1.00%.
Deposits 16,038,034Withdrawals (16,008,489)
Interest income earned and interest expense incurred from the above loans and deposit liabilities in2018, 2017, and 2016 follow:
Significant Investor Associate2018 2017 2016 2018 2017 2016
Interest income P=42,601 P=169,706 P=138,944 P=– P=– P=–Interest expense 3 61 12 168 1,849 1,513
Key Management Personnel Other Related Parties2018 2017 2016 2018 2017 2016
Interest income P=7,921 P=17,102 P=385 P=– P=– P=–Interest expense 2,121 47 40 2,129 69 11
232
VJNQUISIDO
Rectangle
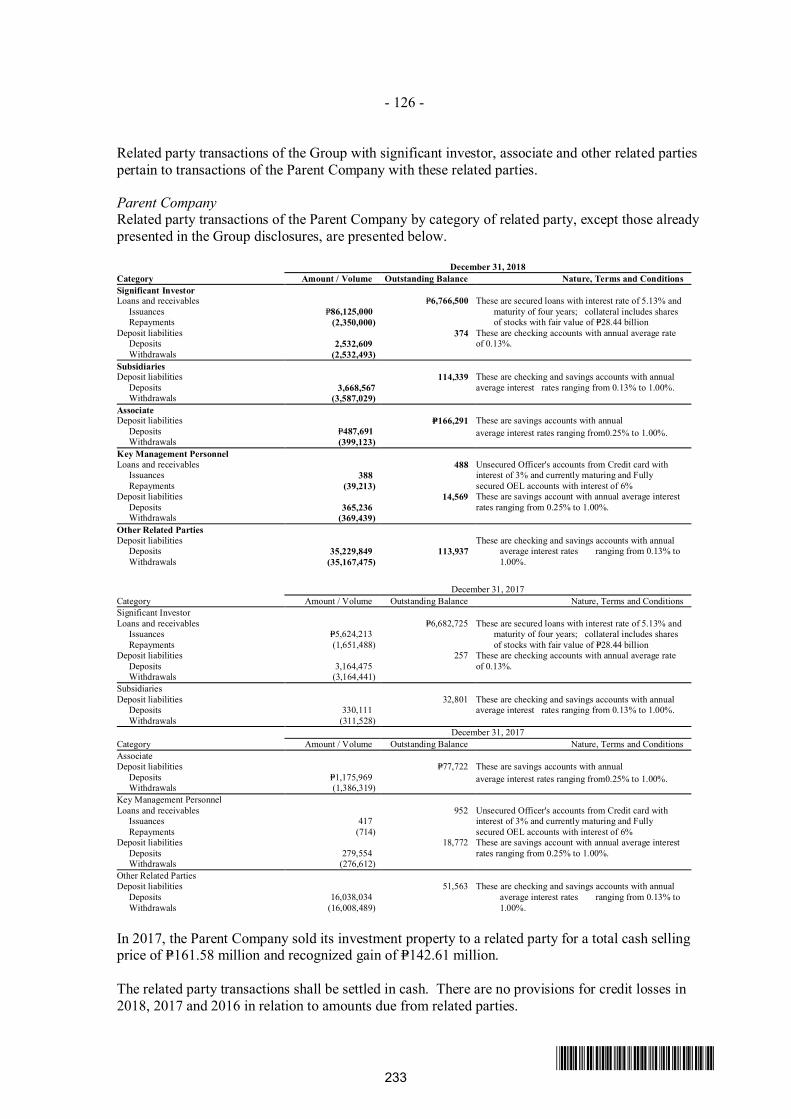
- 126 -
*SGVFS032944*
Related party transactions of the Group with significant investor, associate and other related partiespertain to transactions of the Parent Company with these related parties.
Parent CompanyRelated party transactions of the Parent Company by category of related party, except those alreadypresented in the Group disclosures, are presented below.
December 31, 2018Category Amount / Volume Outstanding Balance Nature, Terms and ConditionsSignificant InvestorLoans and receivables P=6,766,500 These are secured loans with interest rate of 5.13% and
maturity of four years; collateral includes sharesof stocks with fair value of P=28.44 billion
Issuances P=86,125,000Repayments (2,350,000)
Deposit liabilities 374 These are checking accounts with annual average rateof 0.13%.Deposits 2,532,609
Withdrawals (2,532,493)SubsidiariesDeposit liabilities 114,339 These are checking and savings accounts with annual
average interest rates ranging from 0.13% to 1.00%.Deposits 3,668,567Withdrawals (3,587,029)
AssociateDeposit liabilities P=166,291 These are savings accounts with annual
average interest rates ranging from0.25% to 1.00%.Deposits P=487,691Withdrawals (399,123)
Key Management PersonnelLoans and receivables 488 Unsecured Officer's accounts from Credit card with
interest of 3% and currently maturing and Fullysecured OEL accounts with interest of 6%
Issuances 388Repayments (39,213)
Deposit liabilities 14,569 These are savings account with annual average interestrates ranging from 0.25% to 1.00%.Deposits 365,236
Withdrawals (369,439)Other Related PartiesDeposit liabilities These are checking and savings accounts with annual
average interest rates ranging from 0.13% to1.00%.
Deposits 35,229,849 113,937Withdrawals (35,167,475)
December 31, 2017Category Amount / Volume Outstanding Balance Nature, Terms and ConditionsSignificant InvestorLoans and receivables P=6,682,725 These are secured loans with interest rate of 5.13% and
maturity of four years; collateral includes sharesof stocks with fair value of P=28.44 billion
Issuances P=5,624,213Repayments (1,651,488)
Deposit liabilities 257 These are checking accounts with annual average rateof 0.13%.Deposits 3,164,475
Withdrawals (3,164,441)SubsidiariesDeposit liabilities 32,801 These are checking and savings accounts with annual
average interest rates ranging from 0.13% to 1.00%.Deposits 330,111Withdrawals (311,528)
December 31, 2017Category Amount / Volume Outstanding Balance Nature, Terms and ConditionsAssociateDeposit liabilities P=77,722 These are savings accounts with annual
average interest rates ranging from0.25% to 1.00%.Deposits P=1,175,969Withdrawals (1,386,319)
Key Management PersonnelLoans and receivables 952 Unsecured Officer's accounts from Credit card with
interest of 3% and currently maturing and Fullysecured OEL accounts with interest of 6%
Issuances 417Repayments (714)
Deposit liabilities 18,772 These are savings account with annual average interestrates ranging from 0.25% to 1.00%.Deposits 279,554
Withdrawals (276,612)Other Related PartiesDeposit liabilities 51,563 These are checking and savings accounts with annual
average interest rates ranging from 0.13% to1.00%.
Deposits 16,038,034Withdrawals (16,008,489)
In 2017, the Parent Company sold its investment property to a related party for a total cash sellingprice of P=161.58 million and recognized gain of P=142.61 million.
The related party transactions shall be settled in cash. There are no provisions for credit losses in2018, 2017 and 2016 in relation to amounts due from related parties.
233
VJNQUISIDO
Rectangle
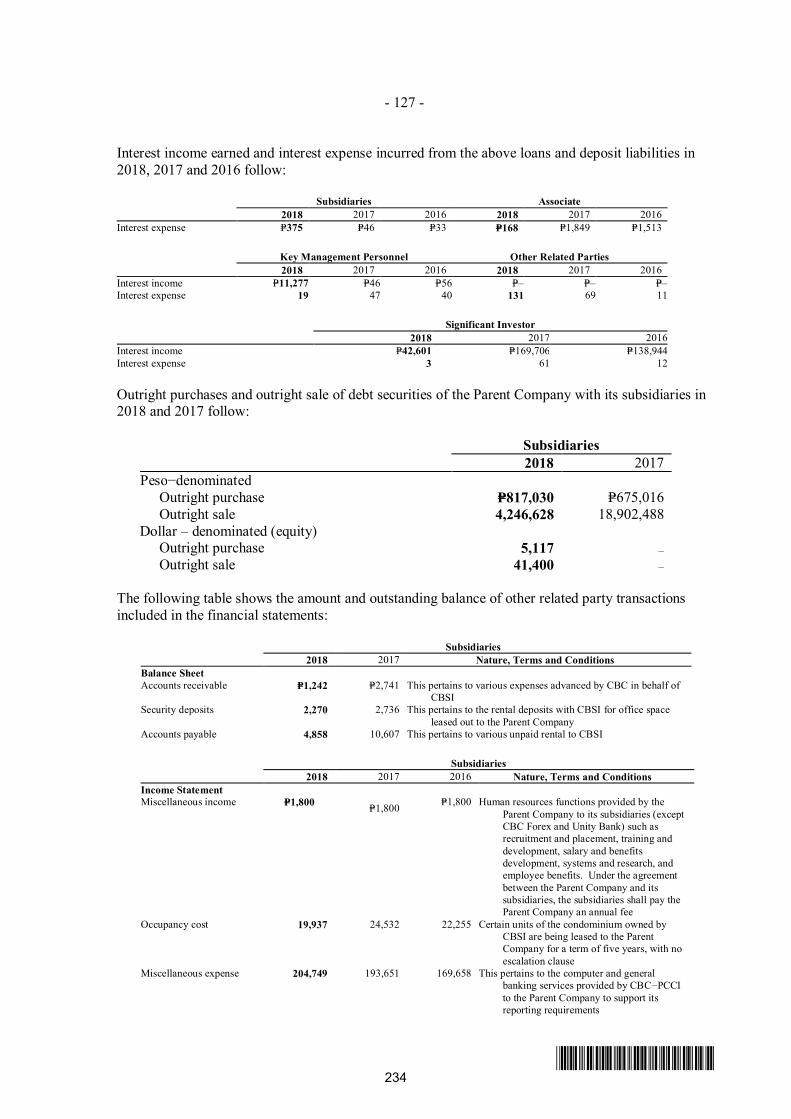
- 127 -
*SGVFS032944*
Interest income earned and interest expense incurred from the above loans and deposit liabilities in2018, 2017 and 2016 follow:
Subsidiaries Associate2018 2017 2016 2018 2017 2016
Interest expense P=375 P=46 P=33 P=168 P=1,849 P=1,513
Key Management Personnel Other Related Parties2018 2017 2016 2018 2017 2016
Interest income P=11,277 P=46 P=56 P=– P=– P=–Interest expense 19 47 40 131 69 11
Significant Investor2018 2017 2016
Interest income P=42,601 P=169,706 P=138,944Interest expense 3 61 12
Outright purchases and outright sale of debt securities of the Parent Company with its subsidiaries in2018 and 2017 follow:
Subsidiaries2018 2017
Peso−denominatedOutright purchase P=817,030 P=675,016Outright sale 4,246,628 18,902,488
Dollar – denominated (equity)Outright purchase 5,117 –Outright sale 41,400 –
The following table shows the amount and outstanding balance of other related party transactionsincluded in the financial statements:
Subsidiaries2018 2017 Nature, Terms and Conditions
Balance SheetAccounts receivable P=1,242 P=2,741 This pertains to various expenses advanced by CBC in behalf of
CBSISecurity deposits 2,270 2,736 This pertains to the rental deposits with CBSI for office space
leased out to the Parent CompanyAccounts payable 4,858 10,607 This pertains to various unpaid rental to CBSI
Subsidiaries2018 2017 2016 Nature, Terms and Conditions
Income StatementMiscellaneous income P=1,800 P=1,800 P=1,800 Human resources functions provided by the
Parent Company to its subsidiaries (exceptCBC Forex and Unity Bank) such asrecruitment and placement, training anddevelopment, salary and benefitsdevelopment, systems and research, andemployee benefits. Under the agreementbetween the Parent Company and itssubsidiaries, the subsidiaries shall pay theParent Company an annual fee
Occupancy cost 19,937 24,532 22,255 Certain units of the condominium owned byCBSI are being leased to the ParentCompany for a term of five years, with noescalation clause
Miscellaneous expense 204,749 193,651 169,658 This pertains to the computer and generalbanking services provided by CBC−PCCIto the Parent Company to support itsreporting requirements
234
VJNQUISIDO
Rectangle
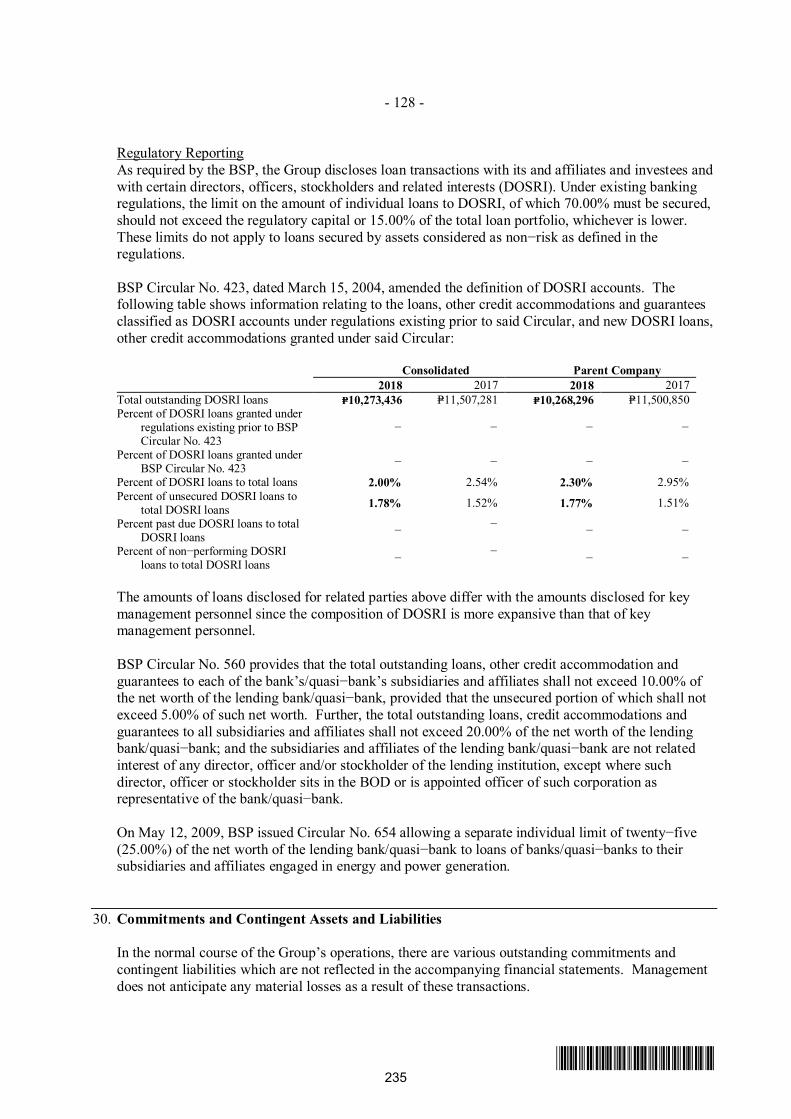
- 128 -
*SGVFS032944*
Regulatory ReportingAs required by the BSP, the Group discloses loan transactions with its and affiliates and investees andwith certain directors, officers, stockholders and related interests (DOSRI). Under existing bankingregulations, the limit on the amount of individual loans to DOSRI, of which 70.00% must be secured,should not exceed the regulatory capital or 15.00% of the total loan portfolio, whichever is lower.These limits do not apply to loans secured by assets considered as non−risk as defined in theregulations.
BSP Circular No. 423, dated March 15, 2004, amended the definition of DOSRI accounts. Thefollowing table shows information relating to the loans, other credit accommodations and guaranteesclassified as DOSRI accounts under regulations existing prior to said Circular, and new DOSRI loans,other credit accommodations granted under said Circular:
Consolidated Parent Company2018 2017 2018 2017
Total outstanding DOSRI loans P=10,273,436 P=11,507,281 P=10,268,296 P=11,500,850Percent of DOSRI loans granted under
regulations existing prior to BSPCircular No. 423
− − − −
Percent of DOSRI loans granted underBSP Circular No. 423 − − − −
Percent of DOSRI loans to total loans 2.00% 2.54% 2.30% 2.95%Percent of unsecured DOSRI loans to
total DOSRI loans 1.78% 1.52% 1.77% 1.51%
Percent past due DOSRI loans to totalDOSRI loans − − − −
Percent of non−performing DOSRIloans to total DOSRI loans − − − −
The amounts of loans disclosed for related parties above differ with the amounts disclosed for keymanagement personnel since the composition of DOSRI is more expansive than that of keymanagement personnel.
BSP Circular No. 560 provides that the total outstanding loans, other credit accommodation andguarantees to each of the bank’s/quasi−bank’s subsidiaries and affiliates shall not exceed 10.00% ofthe net worth of the lending bank/quasi−bank, provided that the unsecured portion of which shall notexceed 5.00% of such net worth. Further, the total outstanding loans, credit accommodations andguarantees to all subsidiaries and affiliates shall not exceed 20.00% of the net worth of the lendingbank/quasi−bank; and the subsidiaries and affiliates of the lending bank/quasi−bank are not relatedinterest of any director, officer and/or stockholder of the lending institution, except where suchdirector, officer or stockholder sits in the BOD or is appointed officer of such corporation asrepresentative of the bank/quasi−bank.
On May 12, 2009, BSP issued Circular No. 654 allowing a separate individual limit of twenty−five(25.00%) of the net worth of the lending bank/quasi−bank to loans of banks/quasi−banks to theirsubsidiaries and affiliates engaged in energy and power generation.
30. Commitments and Contingent Assets and Liabilities
In the normal course of the Group’s operations, there are various outstanding commitments andcontingent liabilities which are not reflected in the accompanying financial statements. Managementdoes not anticipate any material losses as a result of these transactions.
235
VJNQUISIDO
Rectangle
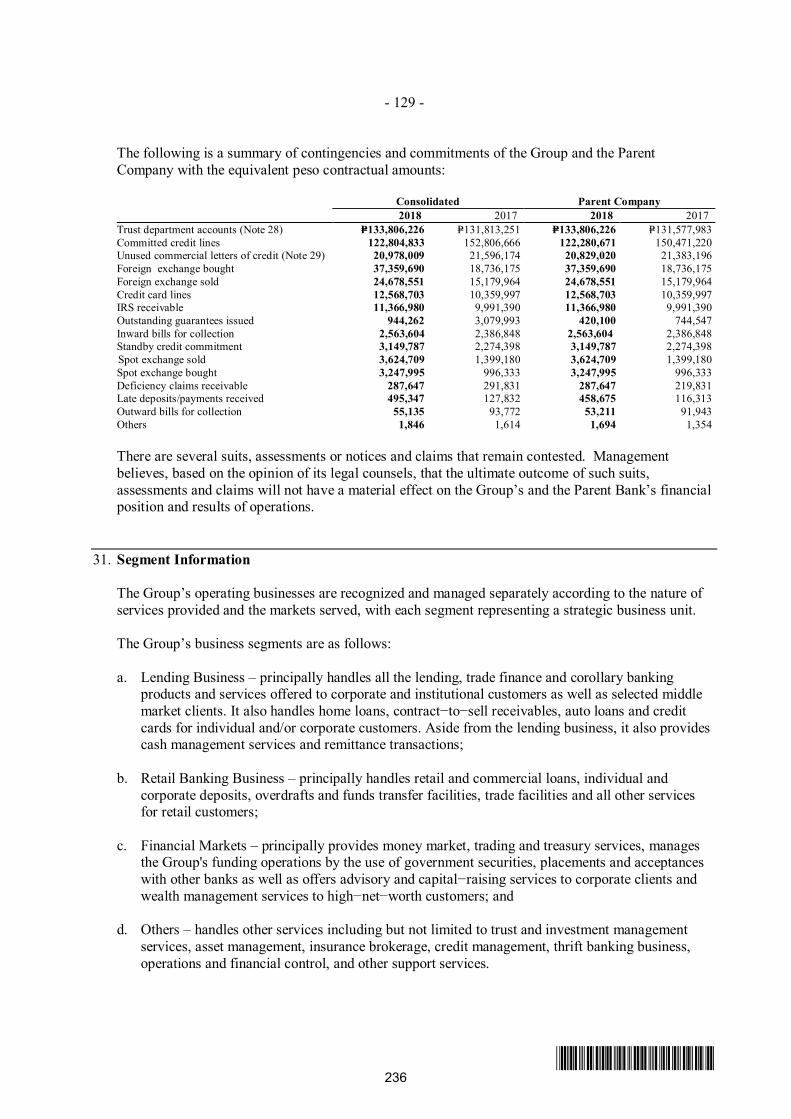
- 129 -
*SGVFS032944*
The following is a summary of contingencies and commitments of the Group and the ParentCompany with the equivalent peso contractual amounts:
Consolidated Parent Company2018 2017 2018 2017
Trust department accounts (Note 28) P=133,806,226 P=131,813,251 P=133,806,226 P=131,577,983Committed credit lines 122,804,833 152,806,666 122,280,671 150,471,220Unused commercial letters of credit (Note 29) 20,978,009 21,596,174 20,829,020 21,383,196Foreign exchange bought 37,359,690 18,736,175 37,359,690 18,736,175Foreign exchange sold 24,678,551 15,179,964 24,678,551 15,179,964Credit card lines 12,568,703 10,359,997 12,568,703 10,359,997IRS receivable 11,366,980 9,991,390 11,366,980 9,991,390Outstanding guarantees issued 944,262 3,079,993 420,100 744,547Inward bills for collection 2,563,604 2,386,848 2,563,604 2,386,848Standby credit commitment 3,149,787 2,274,398 3,149,787 2,274,398Spot exchange sold 3,624,709 1,399,180 3,624,709 1,399,180Spot exchange bought 3,247,995 996,333 3,247,995 996,333Deficiency claims receivable 287,647 291,831 287,647 219,831Late deposits/payments received 495,347 127,832 458,675 116,313Outward bills for collection 55,135 93,772 53,211 91,943Others 1,846 1,614 1,694 1,354
There are several suits, assessments or notices and claims that remain contested. Managementbelieves, based on the opinion of its legal counsels, that the ultimate outcome of such suits,assessments and claims will not have a material effect on the Group’s and the Parent Bank’s financialposition and results of operations.
31. Segment Information
The Group’s operating businesses are recognized and managed separately according to the nature ofservices provided and the markets served, with each segment representing a strategic business unit.
The Group’s business segments are as follows:
a. Lending Business – principally handles all the lending, trade finance and corollary bankingproducts and services offered to corporate and institutional customers as well as selected middlemarket clients. It also handles home loans, contract−to−sell receivables, auto loans and creditcards for individual and/or corporate customers. Aside from the lending business, it also providescash management services and remittance transactions;
b. Retail Banking Business – principally handles retail and commercial loans, individual andcorporate deposits, overdrafts and funds transfer facilities, trade facilities and all other servicesfor retail customers;
c. Financial Markets – principally provides money market, trading and treasury services, managesthe Group's funding operations by the use of government securities, placements and acceptanceswith other banks as well as offers advisory and capital−raising services to corporate clients andwealth management services to high−net−worth customers; and
d. Others – handles other services including but not limited to trust and investment managementservices, asset management, insurance brokerage, credit management, thrift banking business,operations and financial control, and other support services.
236
VJNQUISIDO
Rectangle
- 130 -
*SGVFS032944*
The Group’s businesses are organized to cater to the banking needs of market segments, facilitatecustomer engagement, ensure timely delivery of products and services as well as achieve costefficiency and economies of scale. Accordingly, the corresponding segment information for allperiods presented herein are restated to reflect such change.
The Group reports its primary segment information to the Chief Operating Decision Maker (CODM)on the basis of the above−mentioned segments. The CODM of the Group is the President.
Segment assets are those operating assets that are employed by a segment in its operating activitiesthat are either directly attributable to the segment or can be allocated to the segment on a reasonablebasis.
Segment liabilities are those operating liabilities that result from the operating activities of a segmentand that either are directly attributable to the segment or can be allocated to the segment on areasonable basis.
Interest income is reported net as management primarily relies on the net interest income asperformance measure, not the gross income and expense.
The segment results include internal transfer pricing adjustments across business units as deemedappropriate by management. Transactions between segments are conducted at estimated market rateson an arm’s length basis. Interest is charged/credited to the business units based on a pool rate whichapproximates the marginal cost of funds.
Other operating income mainly consists of trading and securities gain (loss) − net, service charges,fees and commissions, trust fee income and foreign exchange gain − net. Other operating expensemainly consists of compensation and fringe benefits, provision for impairment and credit losses, taxesand licenses, occupancy, depreciation and amortization, stationery, supplies and postage andinsurance. Other operating income and expense are allocated between segments based on equitablesharing arrangements.
The Group has no significant customers which contributes 10.00% or more of the consolidatedrevenues.
The Group’s asset producing revenues are located in the Philippines (i.e., one geographical location);therefore, geographical segment information is no longer presented.
237
VJNQUISIDO
Rectangle
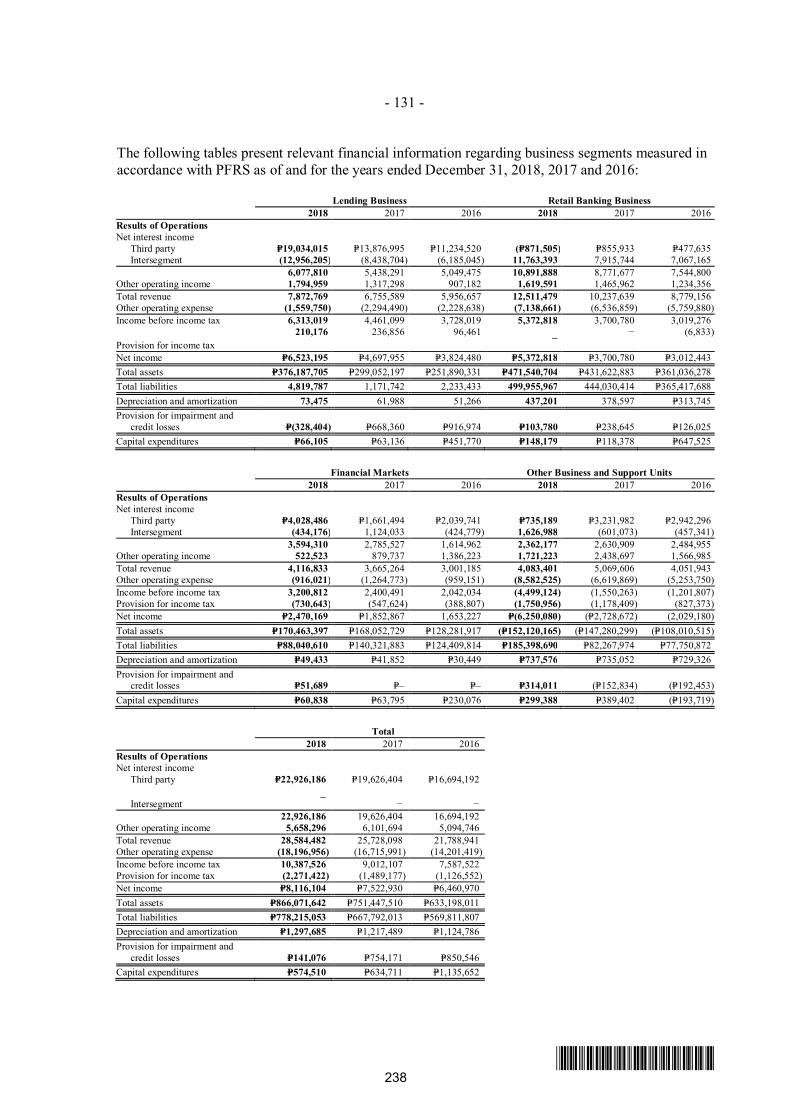
- 131 -
*SGVFS032944*
The following tables present relevant financial information regarding business segments measured inaccordance with PFRS as of and for the years ended December 31, 2018, 2017 and 2016:
Lending Business Retail Banking Business2018 2017 2016 2018 2017 2016
Results of OperationsNet interest income Third party P=19,034,015 P=13,876,995 P=11,234,520 (P=871,505) P=855,933 P=477,635 Intersegment (12,956,205) (8,438,704) (6,185,045) 11,763,393 7,915,744 7,067,165
6,077,810 5,438,291 5,049,475 10,891,888 8,771,677 7,544,800Other operating income 1,794,959 1,317,298 907,182 1,619,591 1,465,962 1,234,356Total revenue 7,872,769 6,755,589 5,956,657 12,511,479 10,237,639 8,779,156Other operating expense (1,559,750) (2,294,490) (2,228,638) (7,138,661) (6,536,859) (5,759,880)Income before income tax 6,313,019 4,461,099 3,728,019 5,372,818 3,700,780 3,019,276
Provision for income tax210,176 236,856 96,461
−− (6,833)
Net income P=6,523,195 P=4,697,955 P=3,824,480 P=5,372,818 P=3,700,780 P=3,012,443Total assets P=376,187,705 P=299,052,197 P=251,890,331 P=471,540,704 P=431,622,883 P=361,036,278Total liabilities 4,819,787 1,171,742 2,233,433 499,955,967 444,030,414 P=365,417,688Depreciation and amortization 73,475 61,988 51,266 437,201 378,597 P=313,745Provision for impairment and
credit losses P=(328,404) P=668,360 P=916,974 P=103,780 P=238,645 P=126,025Capital expenditures P=66,105 P=63,136 P=451,770 P=148,179 P=118,378 P=647,525
Financial Markets Other Business and Support Units2018 2017 2016 2018 2017 2016
Results of OperationsNet interest income Third party P=4,028,486 P=1,661,494 P=2,039,741 P=735,189 P=3,231,982 P=2,942,296 Intersegment (434,176) 1,124,033 (424,779) 1,626,988 (601,073) (457,341)
3,594,310 2,785,527 1,614,962 2,362,177 2,630,909 2,484,955Other operating income 522,523 879,737 1,386,223 1,721,223 2,438,697 1,566,985Total revenue 4,116,833 3,665,264 3,001,185 4,083,401 5,069,606 4,051,943Other operating expense (916,021) (1,264,773) (959,151) (8,582,525) (6,619,869) (5,253,750)Income before income tax 3,200,812 2,400,491 2,042,034 (4,499,124) (1,550,263) (1,201,807)Provision for income tax (730,643) (547,624) (388,807) (1,750,956) (1,178,409) (827,373)Net income P=2,470,169 P=1,852,867 1,653,227 P=(6,250,080) (P=2,728,672) (2,029,180)Total assets P=170,463,397 P=168,052,729 P=128,281,917 (P=152,120,165) (P=147,280,299) (P=108,010,515)Total liabilities P=88,040,610 P=140,321,883 P=124,409,814 P=185,398,690 P=82,267,974 P=77,750,872Depreciation and amortization P=49,433 P=41,852 P=30,449 P=737,576 P=735,052 P=729,326Provision for impairment and
credit losses P=51,689 P=– P=– P=314,011 (P=152,834) (P=192,453)Capital expenditures P=60,838 P=63,795 P=230,076 P=299,388 P=389,402 (P=193,719)
Total2018 2017 2016
Results of OperationsNet interest income Third party P=22,926,186 P=19,626,404 P=16,694,192
Intersegment − − −22,926,186 19,626,404 16,694,192
Other operating income 5,658,296 6,101,694 5,094,746Total revenue 28,584,482 25,728,098 21,788,941Other operating expense (18,196,956) (16,715,991) (14,201,419)Income before income tax 10,387,526 9,012,107 7,587,522Provision for income tax (2,271,422) (1,489,177) (1,126,552)Net income P=8,116,104 P=7,522,930 P=6,460,970Total assets P=866,071,642 P=751,447,510 P=633,198,011Total liabilities P=778,215,053 P=667,792,013 P=569,811,807Depreciation and amortization P=1,297,685 P=1,217,489 P=1,124,786Provision for impairment and
credit losses P=141,076 P=754,171 P=850,546Capital expenditures P=574,510 P=634,711 P=1,135,652
238
VJNQUISIDO
Rectangle
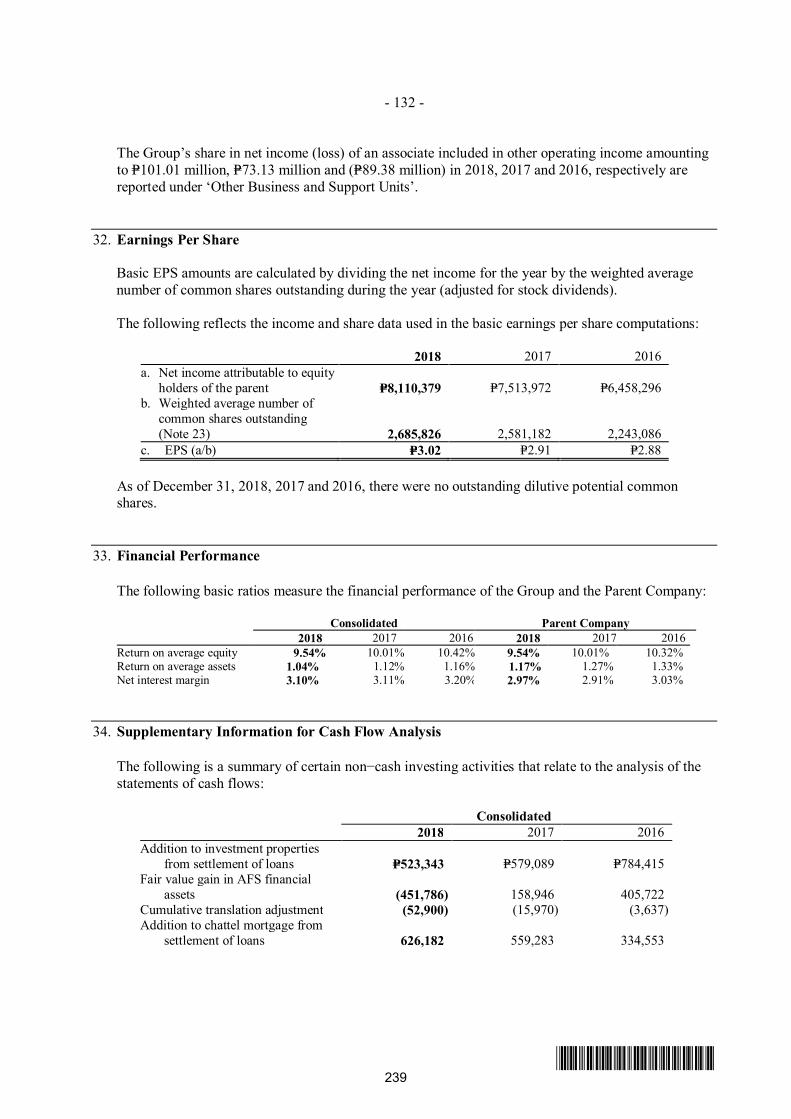
- 132 -
*SGVFS032944*
The Group’s share in net income (loss) of an associate included in other operating income amountingto P=101.01 million, P=73.13 million and (P=89.38 million) in 2018, 2017 and 2016, respectively arereported under ‘Other Business and Support Units’.
32. Earnings Per Share
Basic EPS amounts are calculated by dividing the net income for the year by the weighted averagenumber of common shares outstanding during the year (adjusted for stock dividends).
The following reflects the income and share data used in the basic earnings per share computations:
2018 2017 2016a. Net income attributable to equity holders of the parent P=8,110,379 P=7,513,972 P=6,458,296b. Weighted average number of
common shares outstanding(Note 23) 2,685,826 2,581,182 2,243,086
c. EPS (a/b) P=3.02 P=2.91 P=2.88
As of December 31, 2018, 2017 and 2016, there were no outstanding dilutive potential commonshares.
33. Financial Performance
The following basic ratios measure the financial performance of the Group and the Parent Company:
Consolidated Parent Company2018 2017 2016 2018 2017 2016
Return on average equity 9.54% 10.01% 10.42% 9.54% 10.01% 10.32%Return on average assets 1.04% 1.12% 1.16% 1.17% 1.27% 1.33%Net interest margin 3.10% 3.11% 3.20% 2.97% 2.91% 3.03%
34. Supplementary Information for Cash Flow Analysis
The following is a summary of certain non−cash investing activities that relate to the analysis of thestatements of cash flows:
Consolidated2018 2017 2016
Addition to investment propertiesfrom settlement of loans P=523,343 P=579,089 P=784,415
Fair value gain in AFS financialassets (451,786) 158,946 405,722
Cumulative translation adjustment (52,900) (15,970) (3,637)Addition to chattel mortgage from
settlement of loans 626,182 559,283 334,553
239
VJNQUISIDO
Rectangle
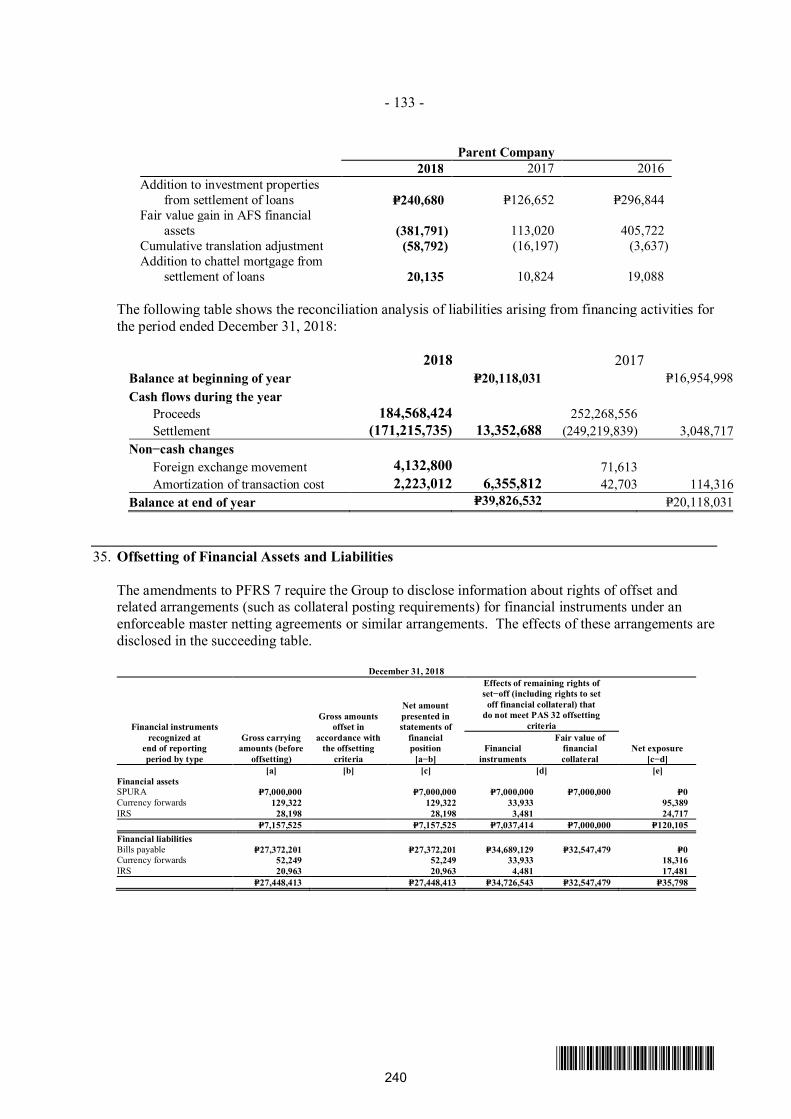
- 133 -
*SGVFS032944*
Parent Company2018 2017 2016
Addition to investment propertiesfrom settlement of loans P=240,680 P=126,652 P=296,844
Fair value gain in AFS financialassets (381,791) 113,020 405,722
Cumulative translation adjustment (58,792) (16,197) (3,637)Addition to chattel mortgage from
settlement of loans 20,135 10,824 19,088
The following table shows the reconciliation analysis of liabilities arising from financing activities forthe period ended December 31, 2018:
2018 2017Balance at beginning of year P=20,118,031 P=16,954,998Cash flows during the year Proceeds 184,568,424 252,268,556 Settlement (171,215,735) 13,352,688 (249,219,839) 3,048,717Non−cash changes Foreign exchange movement 4,132,800 71,613 Amortization of transaction cost 2,223,012 6,355,812 42,703 114,316Balance at end of year P=39,826,532 P=20,118,031
35. Offsetting of Financial Assets and Liabilities
The amendments to PFRS 7 require the Group to disclose information about rights of offset andrelated arrangements (such as collateral posting requirements) for financial instruments under anenforceable master netting agreements or similar arrangements. The effects of these arrangements aredisclosed in the succeeding table.
December 31, 2018
Financial instrumentsrecognized at
end of reportingperiod by type
Gross carryingamounts (before
offsetting)
Gross amountsoffset in
accordance withthe offsetting
criteria
Net amountpresented instatements of
financialposition
[a−b]
Effects of remaining rights ofset−off (including rights to set
off financial collateral) thatdo not meet PAS 32 offsetting
criteria
Net exposure[c−d]
Financialinstruments
Fair value offinancialcollateral
[a] [b] [c] [d] [e]Financial assetsSPURA P=7,000,000 P=7,000,000 P=7,000,000 P=7,000,000 P=0Currency forwards 129,322 129,322 33,933 95,389IRS 28,198 28,198 3,481 24,717
P=7,157,525 P=7,157,525 P=7,037,414 P=7,000,000 P=120,105Financial liabilitiesBills payable P=27,372,201 P=27,372,201 P=34,689,129 P=32,547,479 P=0Currency forwards 52,249 52,249 33,933 18,316IRS 20,963 20,963 4,481 17,481
P=27,448,413 P=27,448,413 P=34,726,543 P=32,547,479 P=35,798
240
VJNQUISIDO
Rectangle
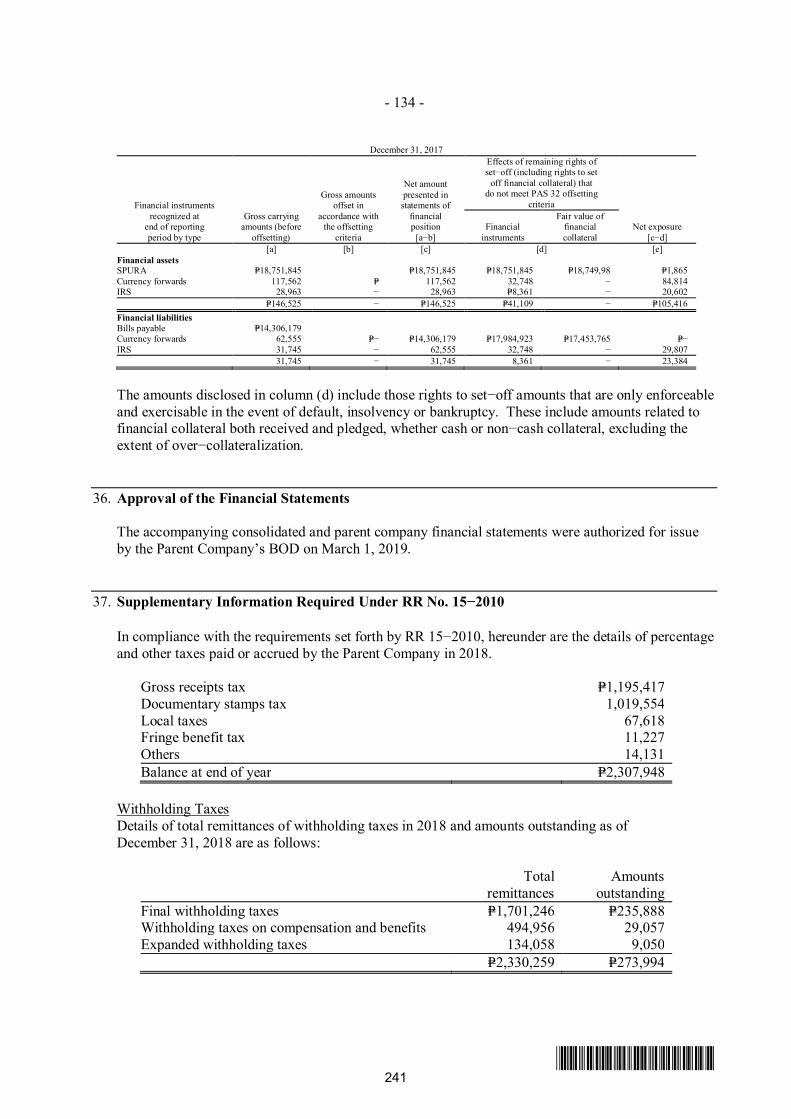
- 134 -
*SGVFS032944*
December 31, 2017
Financial instrumentsrecognized at
end of reportingperiod by type
Gross carryingamounts (before
offsetting)
Gross amountsoffset in
accordance withthe offsetting
criteria
Net amountpresented instatements of
financialposition
[a−b]
Effects of remaining rights ofset−off (including rights to set
off financial collateral) thatdo not meet PAS 32 offsetting
criteria
Net exposure[c−d]
Financialinstruments
Fair value offinancialcollateral
[a] [b] [c] [d] [e]Financial assetsSPURA P=18,751,845 P=18,751,845 P=18,751,845 P=18,749,98 P=1,865Currency forwards 117,562 P= 117,562 32,748 − 84,814IRS 28,963 − 28,963 P=8,361 − 20,602
P=146,525 − P=146,525 P=41,109 − P=105,416Financial liabilitiesBills payable P=14,306,179Currency forwards 62,555 P=− P=14,306,179 P=17,984,923 P=17,453,765 P=−IRS 31,745 − 62,555 32,748 − 29,807
31,745 − 31,745 8,361 − 23,384
The amounts disclosed in column (d) include those rights to set−off amounts that are only enforceableand exercisable in the event of default, insolvency or bankruptcy. These include amounts related tofinancial collateral both received and pledged, whether cash or non−cash collateral, excluding theextent of over−collateralization.
36. Approval of the Financial Statements
The accompanying consolidated and parent company financial statements were authorized for issueby the Parent Company’s BOD on March 1, 2019.
37. Supplementary Information Required Under RR No. 15−2010
In compliance with the requirements set forth by RR 15−2010, hereunder are the details of percentageand other taxes paid or accrued by the Parent Company in 2018.
Gross receipts tax P=1,195,417Documentary stamps tax 1,019,554Local taxes 67,618Fringe benefit tax 11,227Others 14,131Balance at end of year P=2,307,948
Withholding TaxesDetails of total remittances of withholding taxes in 2018 and amounts outstanding as ofDecember 31, 2018 are as follows:
Totalremittances
Amountsoutstanding
Final withholding taxes P=1,701,246 P=235,888Withholding taxes on compensation and benefits 494,956 29,057Expanded withholding taxes 134,058 9,050
P=2,330,259 P=273,994
241
VJNQUISIDO
Rectangle
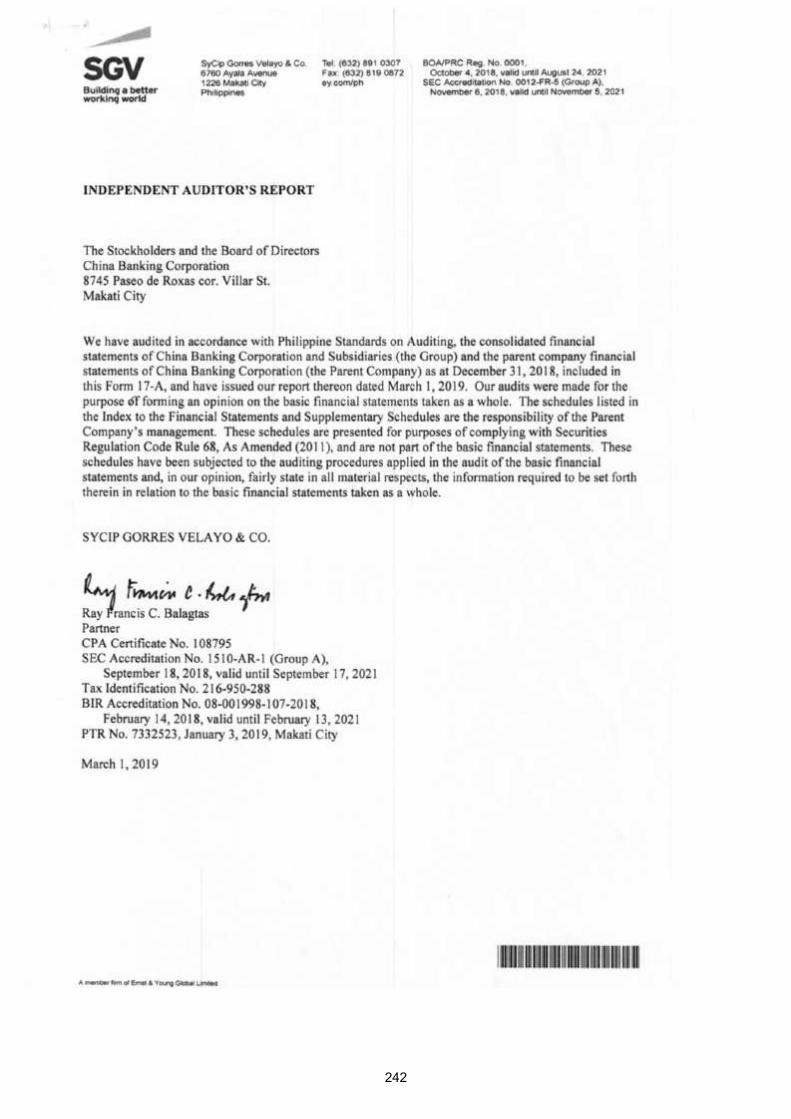
242
CHINA BANKING CORPORATION
INDEX TO THE FINANCIAL STATEMENTS AND SUPPLEMENTARY SCHEDULES
DECEMBER 31, 2018
Part I
Schedule Content Page No.
I Reconciliation of retained earnings available for dividend declaration
(Part 1 4C, Annex 68-C) 1
II List of Philippine Financial Reporting Standards (PFRS) effective as of
December 31, 2018 (Part 1 4J) 2-7
III Map showing relationships between and among parent, subsidiaries, an associate,
and joint venture (Part 1 4H) 8
Part II
A Financial Assets (Part II 6D, Annex 68-E, A)
Financial Assets at Fair Value through Profit or Loss
Financial Assets at Fair Value through Other Comprehensive Income
Investment Securities at Amortized Cost 9
B Amounts Receivable from Directors, Officers, Employees, Related Parties
and Principal Stockholders (Other than Related Parties)
(Part II 6D, Annex 68-E, B) 10
C Amounts Receivable from Related Parties which are eliminated during the
consolidation of financial statements
(Part II 6D, Annex 68-E, C) 11
D Intangible Assets - Other Assets
(Part II 6D, Annex 68-E, D) 12
E Long-Term Debt
(Part II 6D, Annex 68-E, E) 13
F Indebtedness to Related Parties (included in the consolidated balance sheet)
(Part II 6D, Annex 68-E, F) 14
G Guarantees of Securities of Other Issuers
(Part II 6D, Annex 68-E, G) 15
H Capital Stock
(Part II 6D, Annex 68-E, H) 16
243
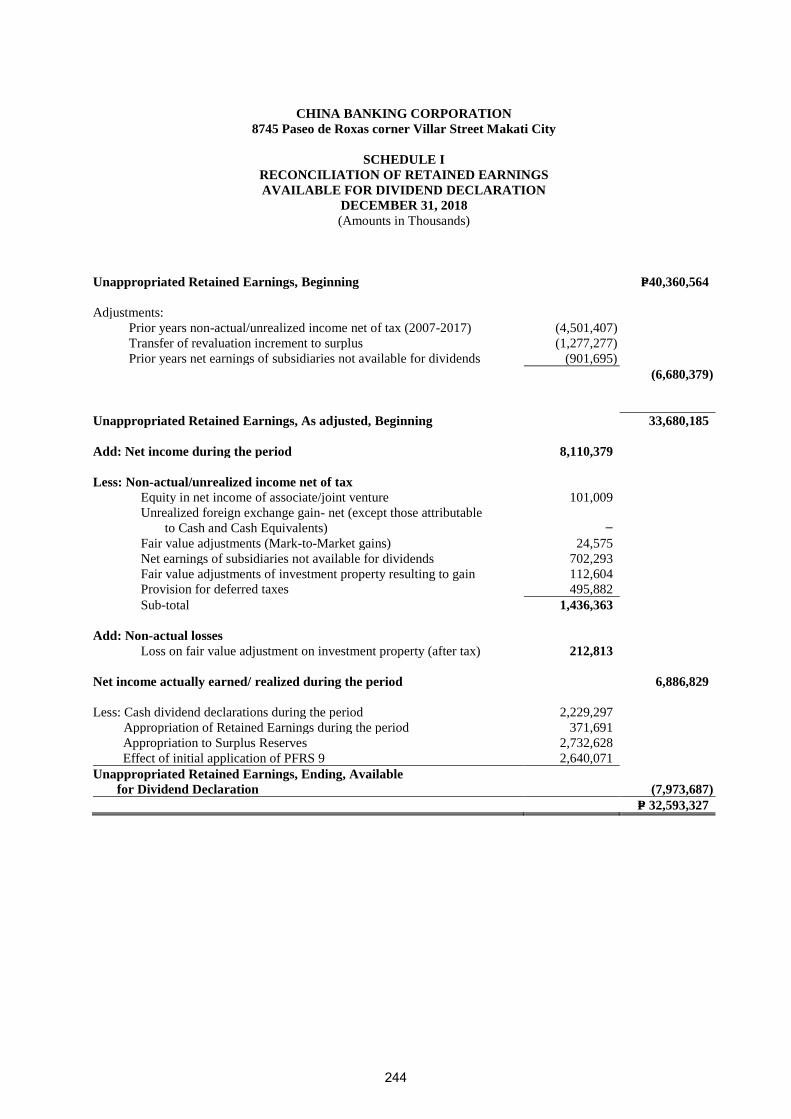
CHINA BANKING CORPORATION
8745 Paseo de Roxas corner Villar Street Makati City
SCHEDULE I
RECONCILIATION OF RETAINED EARNINGS
AVAILABLE FOR DIVIDEND DECLARATION
DECEMBER 31, 2018
(Amounts in Thousands)
Unappropriated Retained Earnings, Beginning P=40,360,564
Adjustments:
Prior years non-actual/unrealized income net of tax (2007-2017) (4,501,407)
Transfer of revaluation increment to surplus (1,277,277)
Prior years net earnings of subsidiaries not available for dividends (901,695)
(6,680,379)
Unappropriated Retained Earnings, As adjusted, Beginning 33,680,185
Add: Net income during the period 8,110,379
Less: Non-actual/unrealized income net of tax
Equity in net income of associate/joint venture 101,009
Unrealized foreign exchange gain- net (except those attributable
to Cash and Cash Equivalents) −
Fair value adjustments (Mark-to-Market gains) 24,575
Net earnings of subsidiaries not available for dividends 702,293
Fair value adjustments of investment property resulting to gain 112,604
Provision for deferred taxes 495,882
Sub-total 1,436,363
Add: Non-actual losses
Loss on fair value adjustment on investment property (after tax) 212,813
Net income actually earned/ realized during the period 6,886,829
Less: Cash dividend declarations during the period 2,229,297
Appropriation of Retained Earnings during the period 371,691
Appropriation to Surplus Reserves 2,732,628
Effect of initial application of PFRS 9 2,640,071
Unappropriated Retained Earnings, Ending, Available
for Dividend Declaration (7,973,687)
P= 32,593,327
244
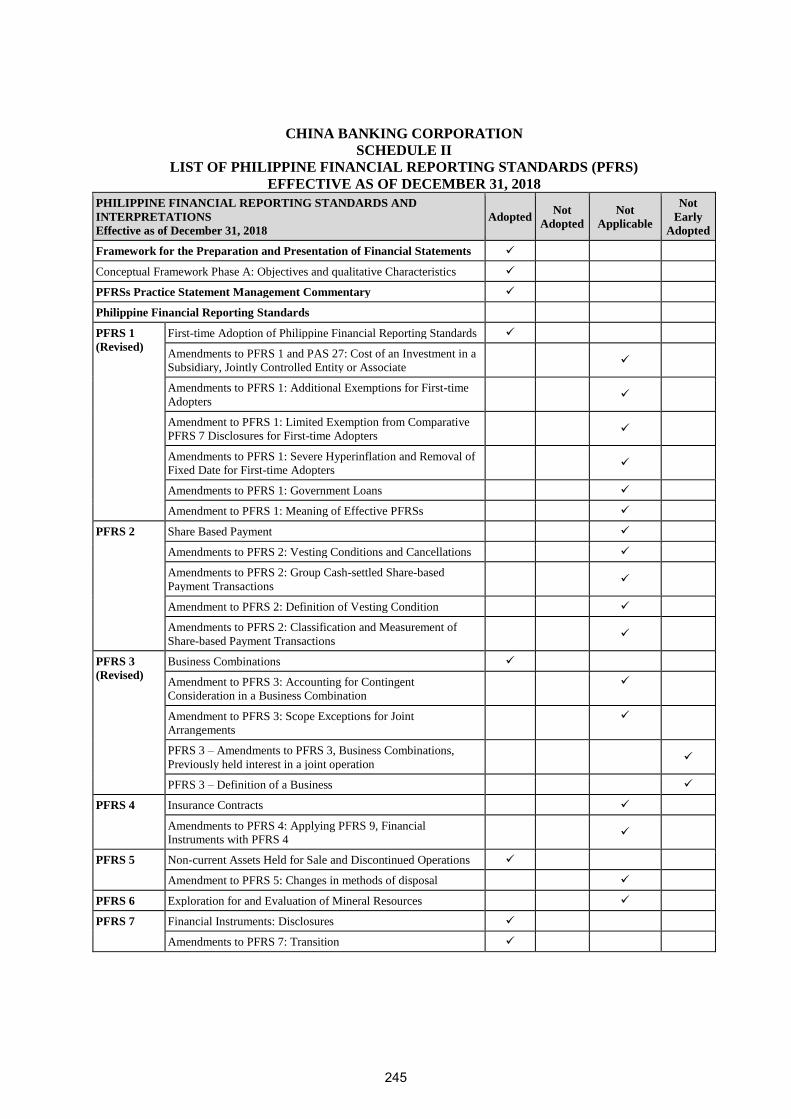
CHINA BANKING CORPORATION
SCHEDULE II
LIST OF PHILIPPINE FINANCIAL REPORTING STANDARDS (PFRS)
EFFECTIVE AS OF DECEMBER 31, 2018
PHILIPPINE FINANCIAL REPORTING STANDARDS AND
INTERPRETATIONS
Effective as of December 31, 2018
Adopted Not
Adopted
Not
Applicable
Not
Early
Adopted
Framework for the Preparation and Presentation of Financial Statements ✓
Conceptual Framework Phase A: Objectives and qualitative Characteristics ✓
PFRSs Practice Statement Management Commentary ✓
Philippine Financial Reporting Standards
PFRS 1
(Revised)
First-time Adoption of Philippine Financial Reporting Standards ✓
Amendments to PFRS 1 and PAS 27: Cost of an Investment in a
Subsidiary, Jointly Controlled Entity or Associate ✓
Amendments to PFRS 1: Additional Exemptions for First-time
Adopters ✓
Amendment to PFRS 1: Limited Exemption from Comparative
PFRS 7 Disclosures for First-time Adopters ✓
Amendments to PFRS 1: Severe Hyperinflation and Removal of
Fixed Date for First-time Adopters ✓
Amendments to PFRS 1: Government Loans ✓
Amendment to PFRS 1: Meaning of Effective PFRSs ✓
PFRS 2 Share Based Payment ✓
Amendments to PFRS 2: Vesting Conditions and Cancellations ✓
Amendments to PFRS 2: Group Cash-settled Share-based
Payment Transactions ✓
Amendment to PFRS 2: Definition of Vesting Condition ✓
Amendments to PFRS 2: Classification and Measurement of
Share-based Payment Transactions ✓
PFRS 3
(Revised)
Business Combinations ✓
Amendment to PFRS 3: Accounting for Contingent
Consideration in a Business Combination
✓
Amendment to PFRS 3: Scope Exceptions for Joint
Arrangements
✓
PFRS 3 – Amendments to PFRS 3, Business Combinations,
Previously held interest in a joint operation
✓
PFRS 3 – Definition of a Business ✓
PFRS 4 Insurance Contracts ✓
Amendments to PFRS 4: Applying PFRS 9, Financial
Instruments with PFRS 4 ✓
PFRS 5 Non-current Assets Held for Sale and Discontinued Operations ✓
Amendment to PFRS 5: Changes in methods of disposal ✓
PFRS 6 Exploration for and Evaluation of Mineral Resources ✓
PFRS 7 Financial Instruments: Disclosures ✓
Amendments to PFRS 7: Transition ✓
245
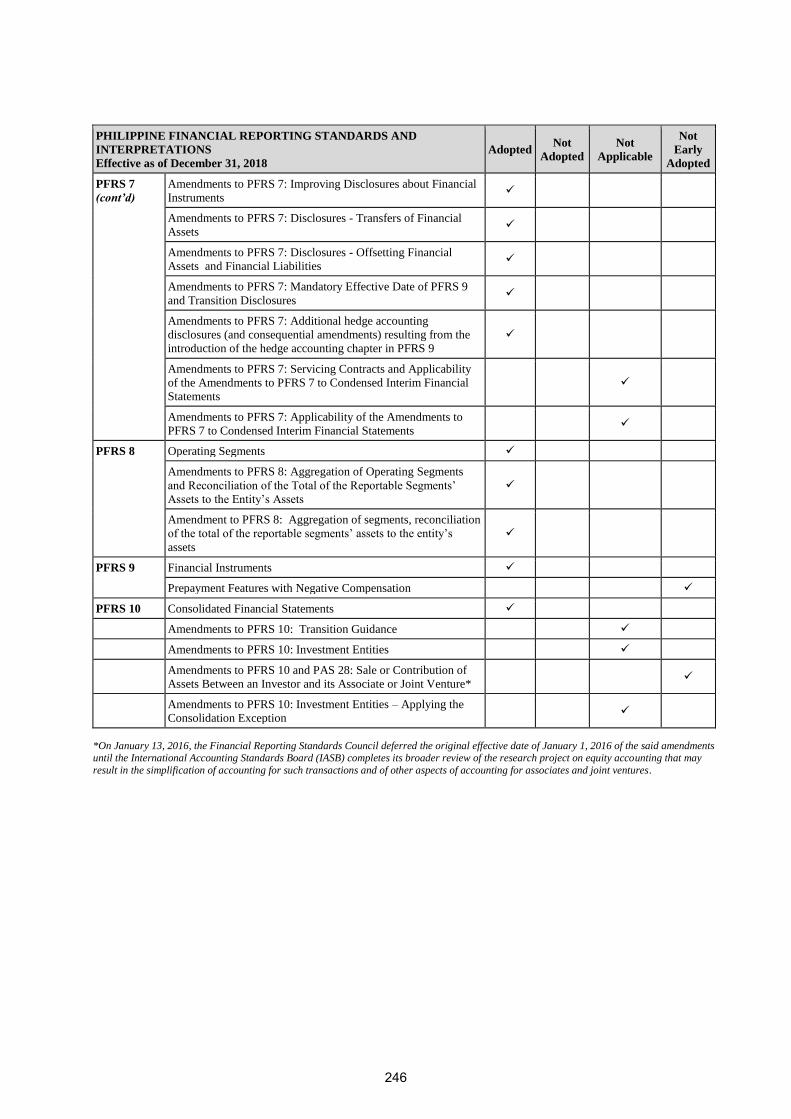
PHILIPPINE FINANCIAL REPORTING STANDARDS AND
INTERPRETATIONS
Effective as of December 31, 2018
Adopted Not
Adopted
Not
Applicable
Not
Early
Adopted
PFRS 7
(cont’d)
Amendments to PFRS 7: Improving Disclosures about Financial
Instruments ✓
Amendments to PFRS 7: Disclosures - Transfers of Financial
Assets ✓
Amendments to PFRS 7: Disclosures - Offsetting Financial
Assets and Financial Liabilities ✓
Amendments to PFRS 7: Mandatory Effective Date of PFRS 9
and Transition Disclosures ✓
Amendments to PFRS 7: Additional hedge accounting
disclosures (and consequential amendments) resulting from the
introduction of the hedge accounting chapter in PFRS 9
✓
Amendments to PFRS 7: Servicing Contracts and Applicability
of the Amendments to PFRS 7 to Condensed Interim Financial
Statements
✓
Amendments to PFRS 7: Applicability of the Amendments to
PFRS 7 to Condensed Interim Financial Statements ✓
PFRS 8
Operating Segments ✓
Amendments to PFRS 8: Aggregation of Operating Segments
and Reconciliation of the Total of the Reportable Segments’
Assets to the Entity’s Assets
✓
Amendment to PFRS 8: Aggregation of segments, reconciliation
of the total of the reportable segments’ assets to the entity’s
assets
✓
PFRS 9
Financial Instruments ✓
Prepayment Features with Negative Compensation ✓
PFRS 10 Consolidated Financial Statements ✓
Amendments to PFRS 10: Transition Guidance ✓
Amendments to PFRS 10: Investment Entities ✓
Amendments to PFRS 10 and PAS 28: Sale or Contribution of
Assets Between an Investor and its Associate or Joint Venture* ✓
Amendments to PFRS 10: Investment Entities – Applying the
Consolidation Exception ✓
*On January 13, 2016, the Financial Reporting Standards Council deferred the original effective date of January 1, 2016 of the said amendments
until the International Accounting Standards Board (IASB) completes its broader review of the research project on equity accounting that may
result in the simplification of accounting for such transactions and of other aspects of accounting for associates and joint ventures.
246
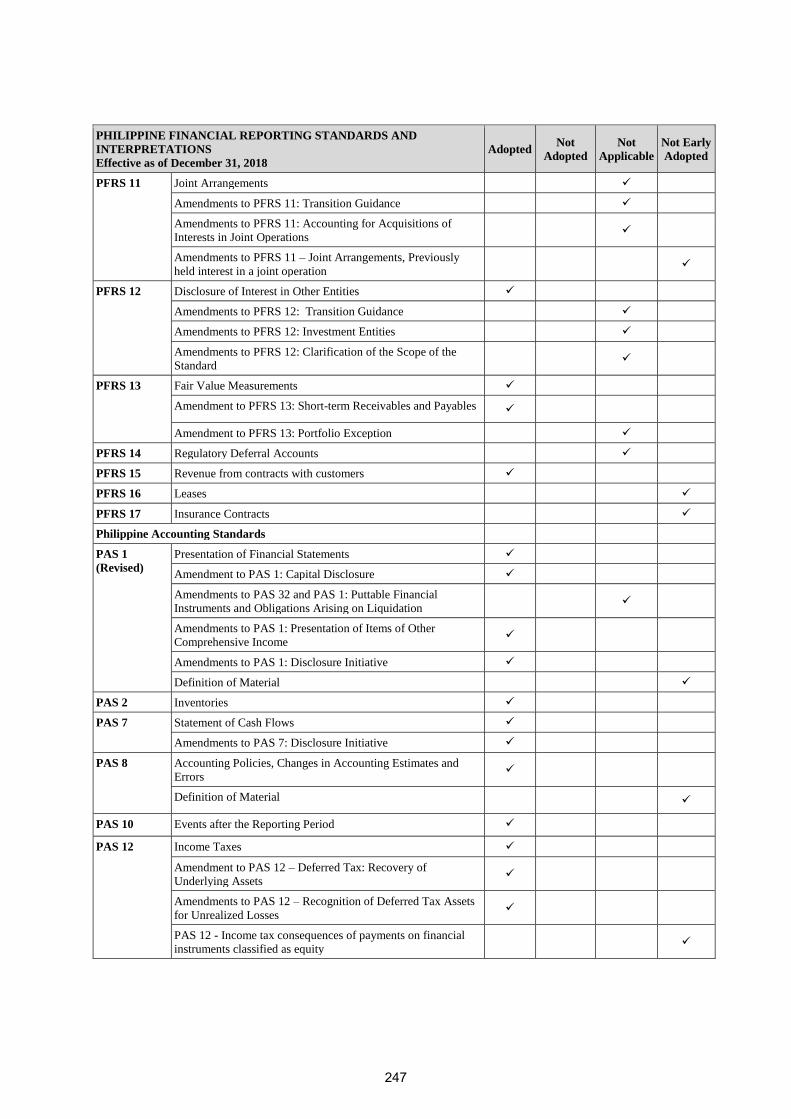
PHILIPPINE FINANCIAL REPORTING STANDARDS AND
INTERPRETATIONS
Effective as of December 31, 2018
Adopted Not
Adopted
Not
Applicable
Not Early
Adopted
PFRS 11 Joint Arrangements ✓
Amendments to PFRS 11: Transition Guidance ✓
Amendments to PFRS 11: Accounting for Acquisitions of
Interests in Joint Operations ✓
Amendments to PFRS 11 – Joint Arrangements, Previously
held interest in a joint operation ✓
PFRS 12 Disclosure of Interest in Other Entities ✓
Amendments to PFRS 12: Transition Guidance ✓
Amendments to PFRS 12: Investment Entities ✓
Amendments to PFRS 12: Clarification of the Scope of the
Standard ✓
PFRS 13 Fair Value Measurements ✓
Amendment to PFRS 13: Short-term Receivables and Payables ✓
Amendment to PFRS 13: Portfolio Exception ✓
PFRS 14 Regulatory Deferral Accounts ✓
PFRS 15 Revenue from contracts with customers ✓
PFRS 16 Leases ✓
PFRS 17 Insurance Contracts ✓
Philippine Accounting Standards
PAS 1
(Revised)
Presentation of Financial Statements ✓
Amendment to PAS 1: Capital Disclosure ✓
Amendments to PAS 32 and PAS 1: Puttable Financial
Instruments and Obligations Arising on Liquidation ✓
Amendments to PAS 1: Presentation of Items of Other
Comprehensive Income ✓
Amendments to PAS 1: Disclosure Initiative ✓
Definition of Material ✓
PAS 2 Inventories ✓
PAS 7 Statement of Cash Flows ✓
Amendments to PAS 7: Disclosure Initiative ✓
PAS 8 Accounting Policies, Changes in Accounting Estimates and
Errors ✓
Definition of Material ✓
PAS 10 Events after the Reporting Period ✓
PAS 12 Income Taxes ✓
Amendment to PAS 12 – Deferred Tax: Recovery of
Underlying Assets ✓
Amendments to PAS 12 – Recognition of Deferred Tax Assets
for Unrealized Losses ✓
PAS 12 - Income tax consequences of payments on financial
instruments classified as equity ✓
247
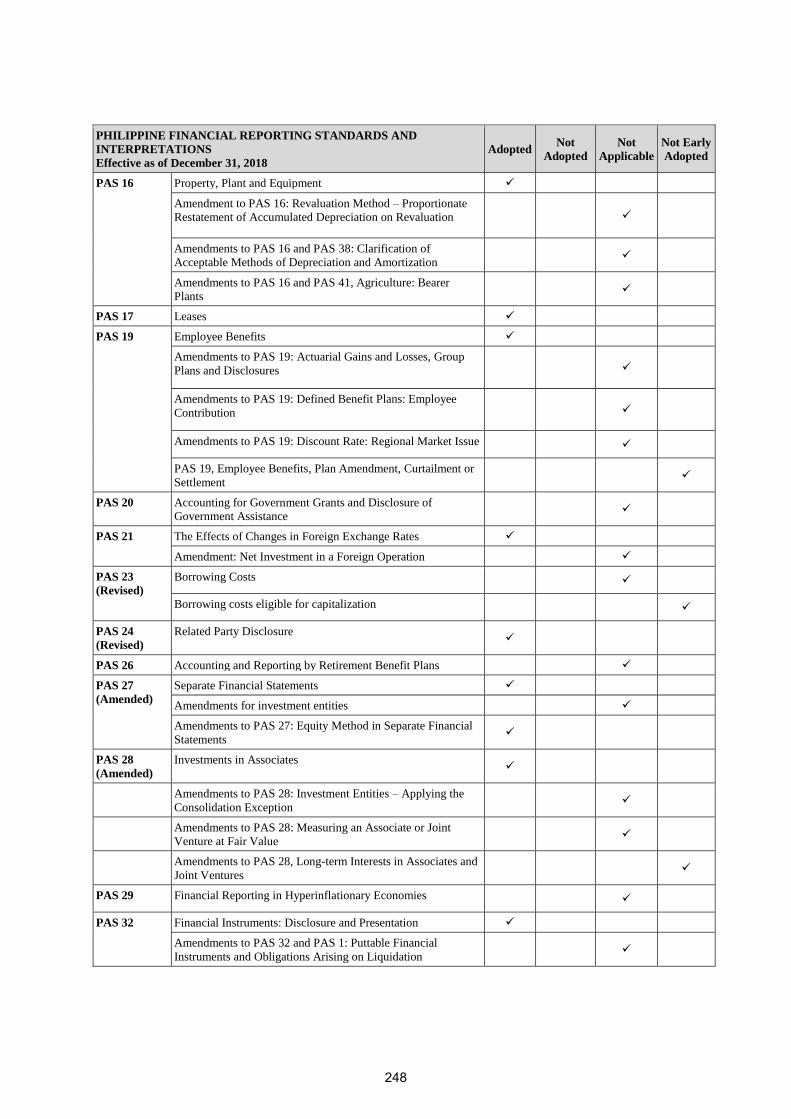
PHILIPPINE FINANCIAL REPORTING STANDARDS AND
INTERPRETATIONS
Effective as of December 31, 2018
Adopted Not
Adopted
Not
Applicable
Not Early
Adopted
PAS 16 Property, Plant and Equipment ✓
Amendment to PAS 16: Revaluation Method – Proportionate
Restatement of Accumulated Depreciation on Revaluation ✓
Amendments to PAS 16 and PAS 38: Clarification of
Acceptable Methods of Depreciation and Amortization ✓
Amendments to PAS 16 and PAS 41, Agriculture: Bearer
Plants ✓
PAS 17 Leases ✓
PAS 19 Employee Benefits ✓
Amendments to PAS 19: Actuarial Gains and Losses, Group
Plans and Disclosures ✓
Amendments to PAS 19: Defined Benefit Plans: Employee
Contribution ✓
Amendments to PAS 19: Discount Rate: Regional Market Issue ✓
PAS 19, Employee Benefits, Plan Amendment, Curtailment or
Settlement ✓
PAS 20 Accounting for Government Grants and Disclosure of
Government Assistance ✓
PAS 21 The Effects of Changes in Foreign Exchange Rates ✓
Amendment: Net Investment in a Foreign Operation ✓
PAS 23
(Revised)
Borrowing Costs ✓
Borrowing costs eligible for capitalization ✓
PAS 24
(Revised)
Related Party Disclosure ✓
PAS 26 Accounting and Reporting by Retirement Benefit Plans ✓
PAS 27
(Amended)
Separate Financial Statements ✓
Amendments for investment entities ✓
Amendments to PAS 27: Equity Method in Separate Financial
Statements ✓
PAS 28
(Amended)
Investments in Associates ✓
Amendments to PAS 28: Investment Entities – Applying the
Consolidation Exception ✓
Amendments to PAS 28: Measuring an Associate or Joint
Venture at Fair Value ✓
Amendments to PAS 28, Long-term Interests in Associates and
Joint Ventures ✓
PAS 29 Financial Reporting in Hyperinflationary Economies ✓
PAS 32 Financial Instruments: Disclosure and Presentation ✓
Amendments to PAS 32 and PAS 1: Puttable Financial
Instruments and Obligations Arising on Liquidation ✓
248
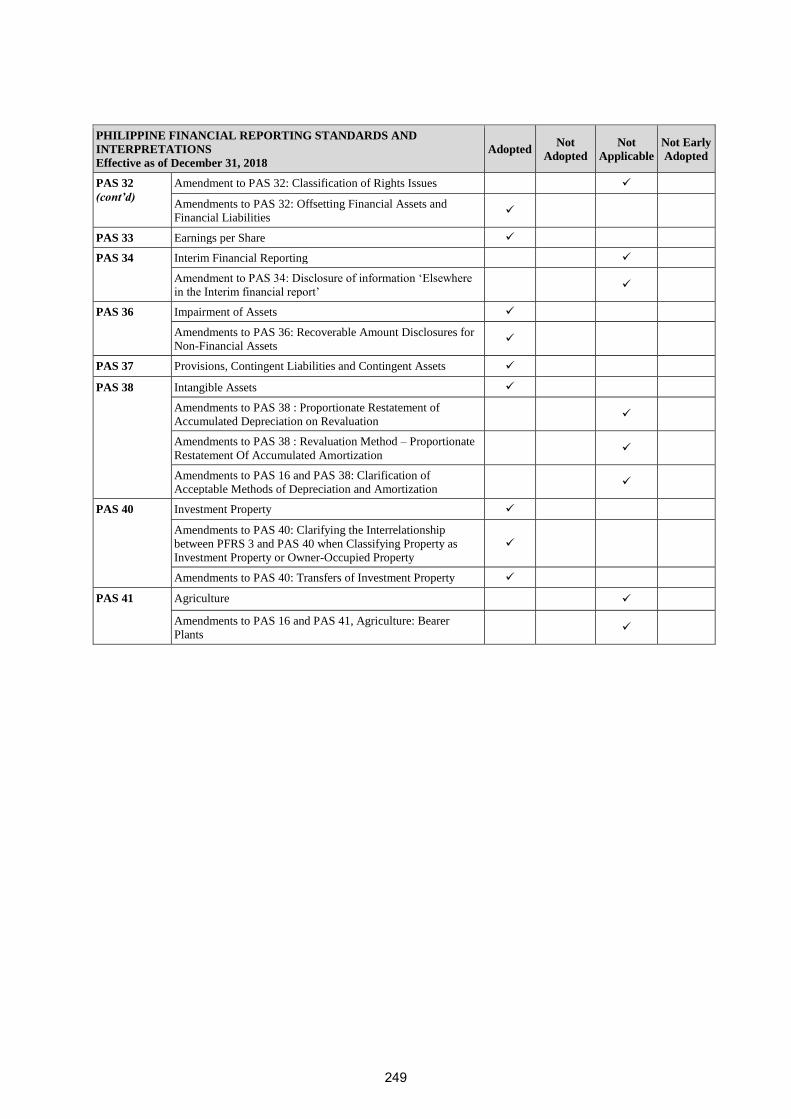
PHILIPPINE FINANCIAL REPORTING STANDARDS AND
INTERPRETATIONS
Effective as of December 31, 2018
Adopted Not
Adopted
Not
Applicable
Not Early
Adopted
PAS 32
(cont’d)
Amendment to PAS 32: Classification of Rights Issues ✓
Amendments to PAS 32: Offsetting Financial Assets and
Financial Liabilities ✓
PAS 33 Earnings per Share ✓
PAS 34 Interim Financial Reporting ✓
Amendment to PAS 34: Disclosure of information ‘Elsewhere
in the Interim financial report’ ✓
PAS 36 Impairment of Assets ✓
Amendments to PAS 36: Recoverable Amount Disclosures for
Non-Financial Assets ✓
PAS 37 Provisions, Contingent Liabilities and Contingent Assets ✓
PAS 38 Intangible Assets ✓
Amendments to PAS 38 : Proportionate Restatement of
Accumulated Depreciation on Revaluation ✓
Amendments to PAS 38 : Revaluation Method – Proportionate
Restatement Of Accumulated Amortization ✓
Amendments to PAS 16 and PAS 38: Clarification of
Acceptable Methods of Depreciation and Amortization ✓
PAS 40 Investment Property ✓
Amendments to PAS 40: Clarifying the Interrelationship
between PFRS 3 and PAS 40 when Classifying Property as
Investment Property or Owner-Occupied Property
✓
Amendments to PAS 40: Transfers of Investment Property ✓
PAS 41 Agriculture ✓
Amendments to PAS 16 and PAS 41, Agriculture: Bearer
Plants ✓
249
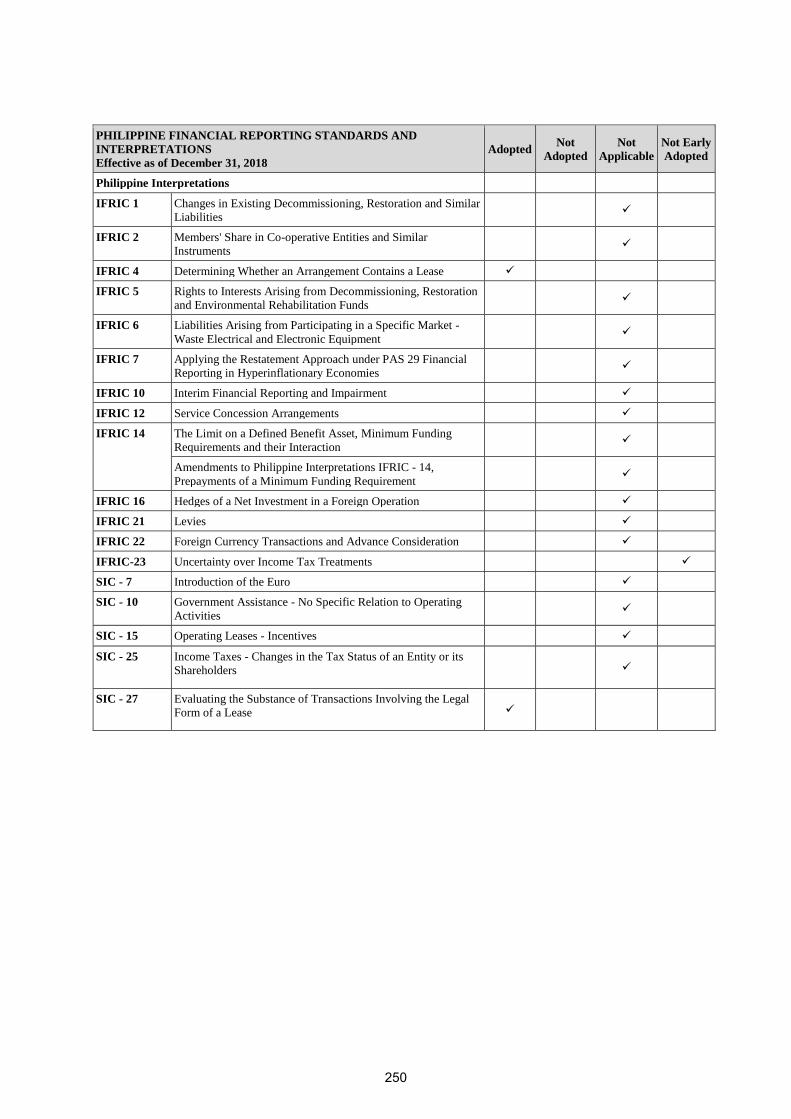
PHILIPPINE FINANCIAL REPORTING STANDARDS AND
INTERPRETATIONS
Effective as of December 31, 2018
Adopted Not
Adopted
Not
Applicable
Not Early
Adopted
Philippine Interpretations
IFRIC 1 Changes in Existing Decommissioning, Restoration and Similar
Liabilities ✓
IFRIC 2 Members' Share in Co-operative Entities and Similar
Instruments ✓
IFRIC 4 Determining Whether an Arrangement Contains a Lease ✓
IFRIC 5 Rights to Interests Arising from Decommissioning, Restoration
and Environmental Rehabilitation Funds ✓
IFRIC 6 Liabilities Arising from Participating in a Specific Market -
Waste Electrical and Electronic Equipment ✓
IFRIC 7 Applying the Restatement Approach under PAS 29 Financial
Reporting in Hyperinflationary Economies ✓
IFRIC 10 Interim Financial Reporting and Impairment ✓
IFRIC 12 Service Concession Arrangements ✓
IFRIC 14 The Limit on a Defined Benefit Asset, Minimum Funding
Requirements and their Interaction ✓
Amendments to Philippine Interpretations IFRIC - 14,
Prepayments of a Minimum Funding Requirement ✓
IFRIC 16 Hedges of a Net Investment in a Foreign Operation ✓
IFRIC 21 Levies ✓
IFRIC 22 Foreign Currency Transactions and Advance Consideration ✓
IFRIC-23 Uncertainty over Income Tax Treatments ✓
SIC - 7 Introduction of the Euro ✓
SIC - 10 Government Assistance - No Specific Relation to Operating
Activities ✓
SIC - 15 Operating Leases - Incentives ✓
SIC - 25 Income Taxes - Changes in the Tax Status of an Entity or its
Shareholders ✓
SIC - 27 Evaluating the Substance of Transactions Involving the Legal
Form of a Lease ✓
250
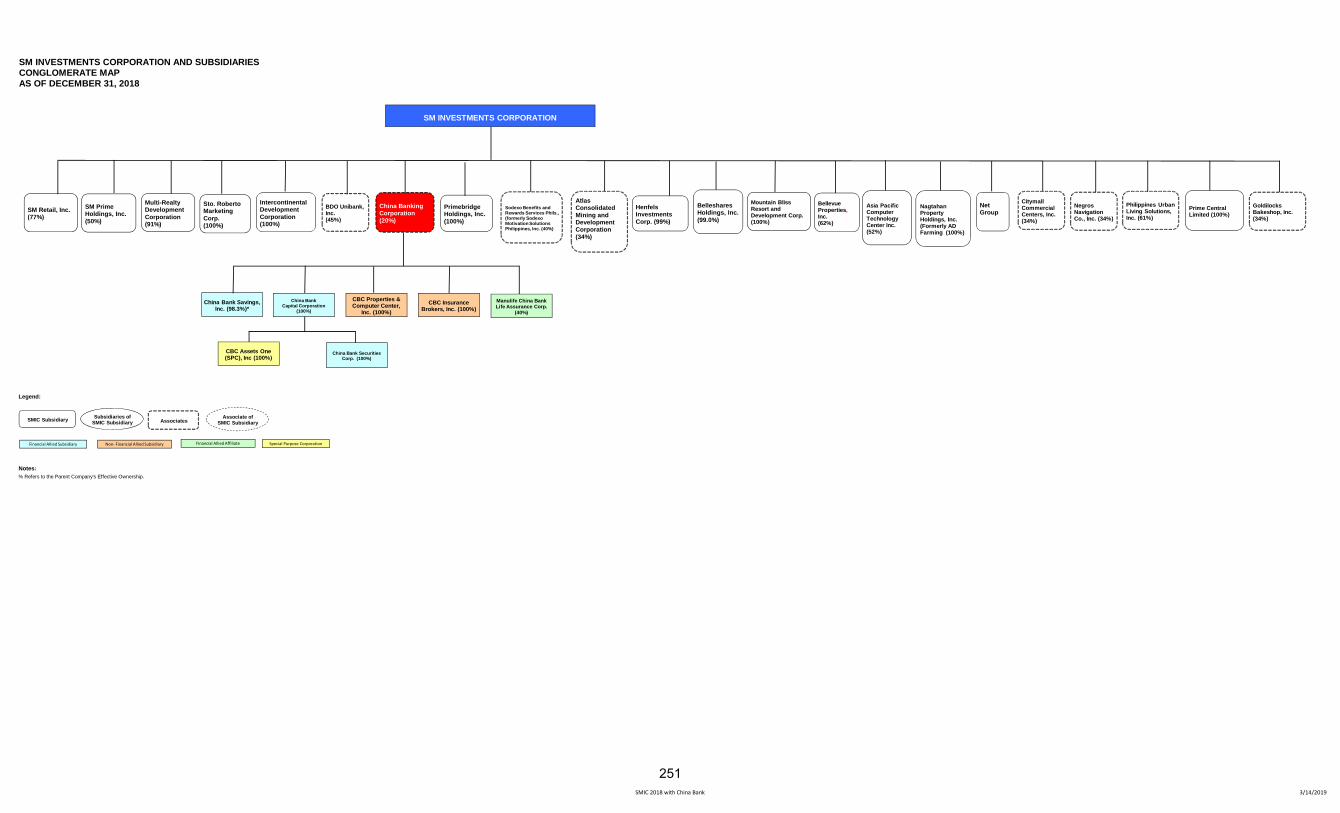
SM INVESTMENTS CORPORATION AND SUBSIDIARIESCONGLOMERATE MAPAS OF DECEMBER 31, 2018
Legend:
Notes:% Refers to the Parent Company's Effective Ownership.
SM Prime Holdings, Inc.(50%)
SM Retail, Inc.(77%)
Intercontinental Development Corporation(100%)
Belleshares Holdings, Inc.(99.0%)
Multi-Realty Development Corporation(91%)
BDO Unibank, Inc. (45%)
China Banking Corporation(20%)
SM INVESTMENTS CORPORATION
SMIC Subsidiary Subsidiaries of SMIC Subsidiary Associates
Associate of SMIC Subsidiary
Primebridge Holdings, Inc. (100%)
China Bank Savings, Inc. (98.3%)*
China BankCapital Corporation
(100%)
CBC Properties & Computer Center,
Inc. (100%)CBC Insurance
Brokers, Inc. (100%)
Financial Allied Subsidiary Non‐ Financial Allied Subsidiary
Manulife China Bank Life Assurance Corp.
(40%)
Financial Allied Affiliate
Sto. Roberto Marketing Corp.(100%)
Atlas Consolidated Mining and Development Corporation (34%)
Sodexo Benefits and Rewards Services Phils., (formerly Sodexo Motivation Solutions Philippines, Inc. (40%)
Henfels Investments Corp. (99%)
Mountain Bliss Resort and Development Corp. (100%)
Bellevue Properties,Inc.(62%)
Asia Pacific Computer Technology Center Inc.(52%)
Net Group
Nagtahan Property Holdings, Inc. (Formerly AD Farming (100%)
CBC Assets One (SPC), Inc (100%)
Special Purpose Corporation
China Bank Securities Corp. (100%)
NegrosNavigation Co., Inc. (34%)
Citymall Commercial Centers, Inc. (34%)
Philippines Urban Living Solutions, Inc. (61%)
Prime CentralLimited (100%)
Goldilocks Bakeshop, Inc. (34%)
SMIC 2018 with China Bank 3/14/2019
251
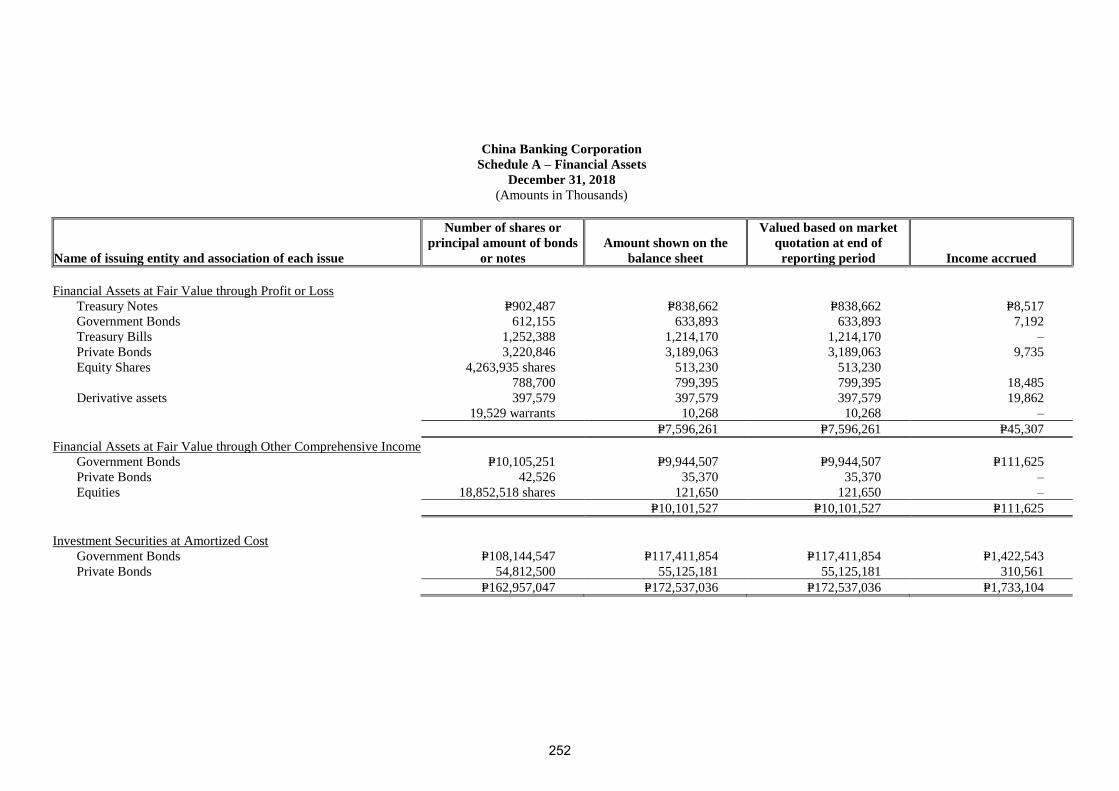
China Banking Corporation
Schedule A – Financial Assets
December 31, 2018
(Amounts in Thousands)
Name of issuing entity and association of each issue
Number of shares or
principal amount of bonds
or notes
Amount shown on the
balance sheet
Valued based on market
quotation at end of
reporting period Income accrued
Financial Assets at Fair Value through Profit or Loss
Treasury Notes P=902,487 P=838,662 P=838,662 P=8,517
Government Bonds 612,155 633,893 633,893 7,192
Treasury Bills 1,252,388 1,214,170 1,214,170 –
Private Bonds 3,220,846 3,189,063 3,189,063 9,735
Equity Shares 4,263,935 shares 513,230 513,230
788,700 799,395 799,395 18,485
Derivative assets 397,579 397,579 397,579 19,862
19,529 warrants 10,268 10,268 –
P=7,596,261 P=7,596,261 P=45,307
Financial Assets at Fair Value through Other Comprehensive Income
Government Bonds P=10,105,251 P=9,944,507 P=9,944,507 P=111,625
Private Bonds 42,526 35,370 35,370 –
Equities 18,852,518 shares 121,650 121,650 –
P=10,101,527 P=10,101,527 P=111,625
Investment Securities at Amortized Cost
Government Bonds P=108,144,547 P=117,411,854 P=117,411,854 P=1,422,543
Private Bonds 54,812,500 55,125,181 55,125,181 310,561
P=162,957,047 P=172,537,036 P=172,537,036 P=1,733,104
252
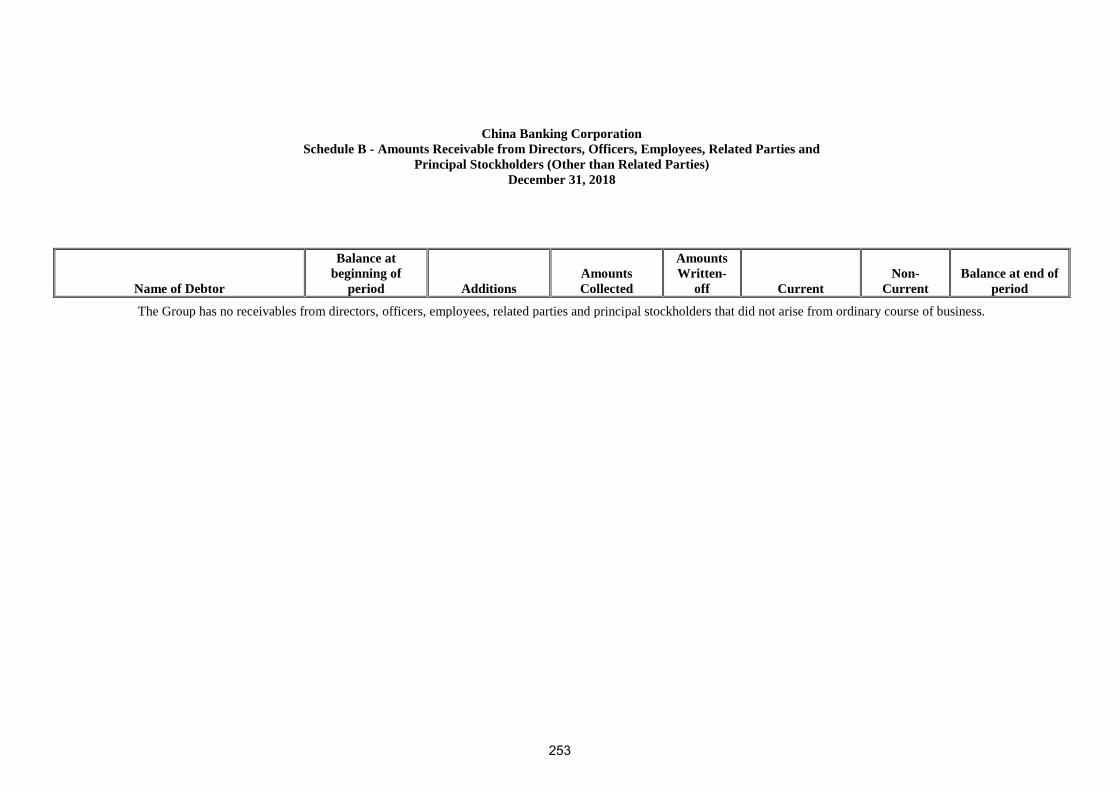
China Banking Corporation
Schedule B - Amounts Receivable from Directors, Officers, Employees, Related Parties and
Principal Stockholders (Other than Related Parties)
December 31, 2018
Name of Debtor
Balance at
beginning of
period Additions
Amounts
Collected
Amounts
Written-
off Current
Non-
Current
Balance at end of
period
The Group has no receivables from directors, officers, employees, related parties and principal stockholders that did not arise from ordinary course of business.
253
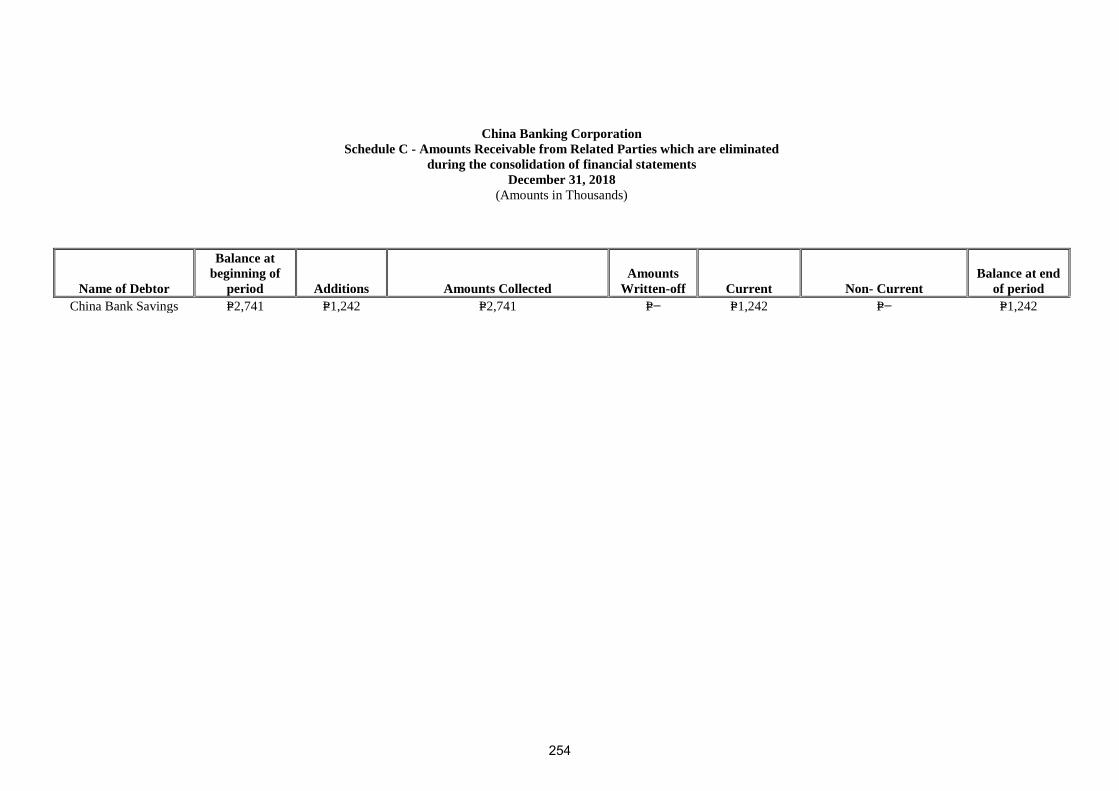
China Banking Corporation
Schedule C - Amounts Receivable from Related Parties which are eliminated
during the consolidation of financial statements
December 31, 2018
(Amounts in Thousands)
Name of Debtor
Balance at
beginning of
period Additions Amounts Collected
Amounts
Written-off Current Non- Current
Balance at end
of period
China Bank Savings P=2,741 P=1,242 P=2,741 P=− P=1,242 P=− P=1,242
254
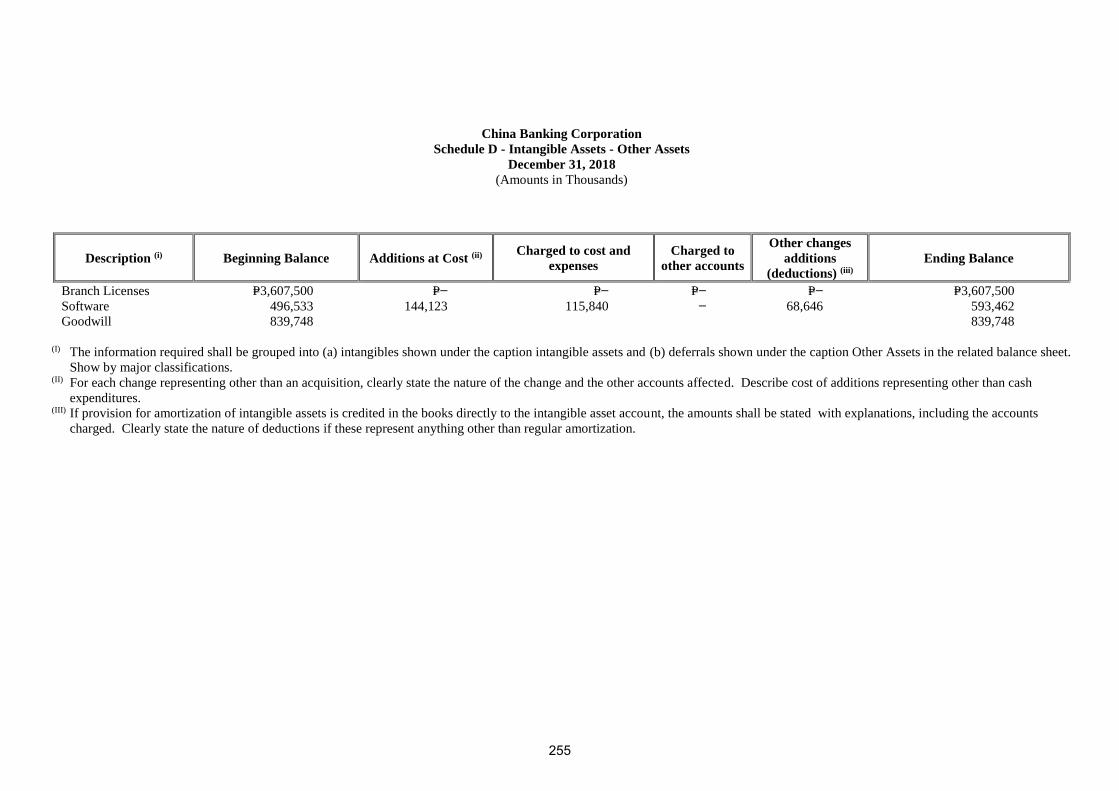
China Banking Corporation
Schedule D - Intangible Assets - Other Assets
December 31, 2018
(Amounts in Thousands)
Description (i) Beginning Balance Additions at Cost (ii) Charged to cost and
expenses
Charged to
other accounts
Other changes
additions
(deductions) (iii)
Ending Balance
Branch Licenses P=3,607,500 P=− P=− P=− P=− P=3,607,500
Software 496,533 144,123 115,840 − 68,646 593,462
Goodwill 839,748 839,748
(I) The information required shall be grouped into (a) intangibles shown under the caption intangible assets and (b) deferrals shown under the caption Other Assets in the related balance sheet.
Show by major classifications. (II) For each change representing other than an acquisition, clearly state the nature of the change and the other accounts affected. Describe cost of additions representing other than cash
expenditures. (III) If provision for amortization of intangible assets is credited in the books directly to the intangible asset account, the amounts shall be stated with explanations, including the accounts
charged. Clearly state the nature of deductions if these represent anything other than regular amortization.
255
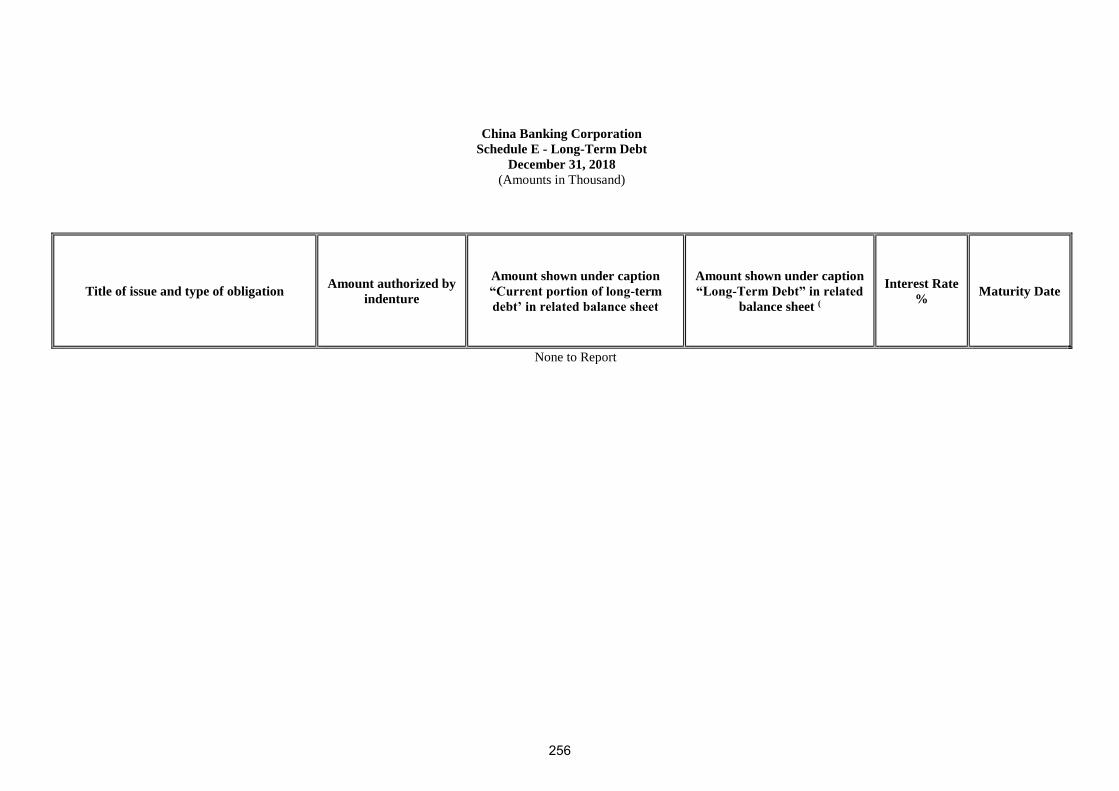
China Banking Corporation
Schedule E - Long-Term Debt
December 31, 2018
(Amounts in Thousand)
Title of issue and type of obligation Amount authorized by
indenture
Amount shown under caption
“Current portion of long-term
debt’ in related balance sheet
Amount shown under caption
“Long-Term Debt” in related
balance sheet (
Interest Rate
% Maturity Date
None to Report
256
China Banking Corporation
Schedule F - Indebtedness to Related Parties
(Long-term from Related Companies)
December 31, 2018
Name of Related Parties (i) Balance at beginning of period Balance at end of period (ii)
None to Report
(i) The related parties named shall be grouped as in Schedule D. The information called shall be stated for any persons whose investments shown separately in such related schedule. (ii) For each affiliate named in the first column, explain in a note hereto the nature and purpose of any material increase during the period that is in excess of 10 percent of the related balance
at either the beginning or end of the period.
257
China Banking Corporation
Schedule G - Guarantees of Securities of Other Issuers
December 31, 2018
Name of issuing entity of
securities guaranteed by the
company for which this
statement is filed
Title of issue of each class of
securities guaranteed
Total amount of guaranteed and
outstanding (i)
Amount owned by person of
which statement is filed Nature of guarantee (ii)
None to Report
(i) Indicate in a note any significant changes since the date of the last balance sheet file. If this schedule is filed in support of consolidated financial statements, there shall be set forth
guarantees by any person included in the consolidation except such guarantees of securities which are included in the consolidated balance sheet. (ii) There must be a brief statement of the nature of the guarantee, such as “Guarantee of principal and interest”, “Guarantee of Interest”, or “Guarantee of Dividends”. If the guarantee is of
interest, dividends, or both, state the annual aggregate amount of interest or dividends so guaranteed.
258
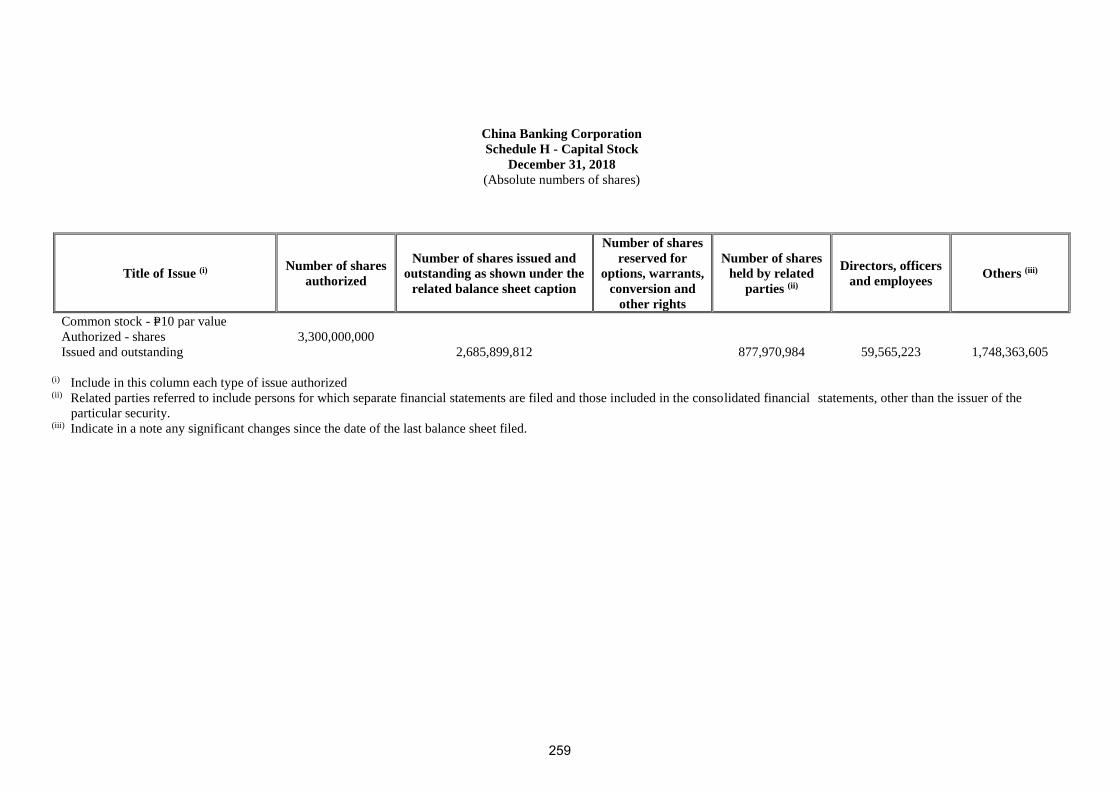
China Banking Corporation
Schedule H - Capital Stock
December 31, 2018
(Absolute numbers of shares)
Title of Issue (i) Number of shares
authorized
Number of shares issued and
outstanding as shown under the
related balance sheet caption
Number of shares
reserved for
options, warrants,
conversion and
other rights
Number of shares
held by related
parties (ii)
Directors, officers
and employees Others (iii)
Common stock - P=10 par value
Authorized - shares 3,300,000,000
Issued and outstanding 2,685,899,812 877,970,984 59,565,223 1,748,363,605
(i) Include in this column each type of issue authorized (ii) Related parties referred to include persons for which separate financial statements are filed and those included in the consolidated financial statements, other than the issuer of the
particular security. (iii) Indicate in a note any significant changes since the date of the last balance sheet filed.
259
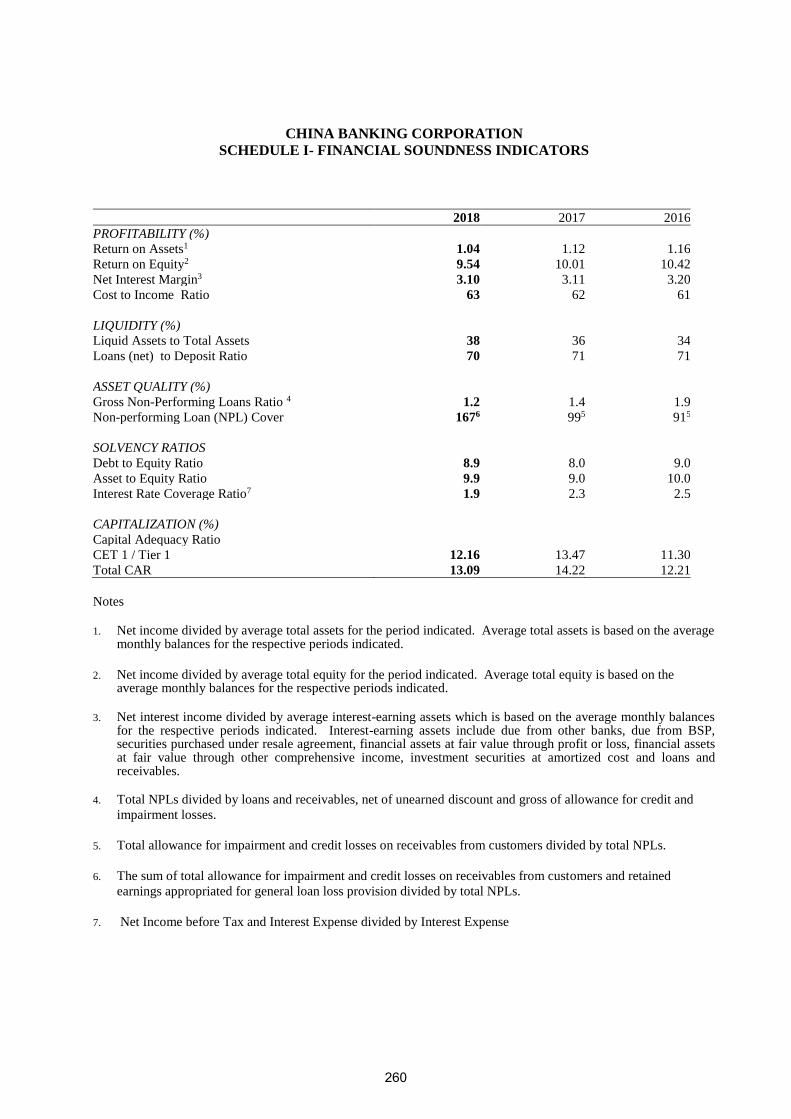
CHINA BANKING CORPORATION
SCHEDULE I- FINANCIAL SOUNDNESS INDICATORS
2018 2017 2016
PROFITABILITY (%)
Return on Assets1 1.04 1.12 1.16
Return on Equity2 9.54 10.01 10.42
Net Interest Margin3 3.10 3.11 3.20
Cost to Income Ratio 63 62 61
LIQUIDITY (%)
Liquid Assets to Total Assets 38 36 34
Loans (net) to Deposit Ratio 70 71 71
ASSET QUALITY (%)
Gross Non-Performing Loans Ratio 4 1.2 1.4 1.9
Non-performing Loan (NPL) Cover 1676 995 915
SOLVENCY RATIOS
Debt to Equity Ratio 8.9 8.0 9.0
Asset to Equity Ratio 9.9 9.0 10.0
Interest Rate Coverage Ratio7 1.9 2.3 2.5
CAPITALIZATION (%)
Capital Adequacy Ratio
CET 1 / Tier 1 12.16 13.47 11.30
Total CAR 13.09 14.22 12.21
Notes
1. Net income divided by average total assets for the period indicated. Average total assets is based on the average
monthly balances for the respective periods indicated.
2. Net income divided by average total equity for the period indicated. Average total equity is based on the average monthly balances for the respective periods indicated.
3. Net interest income divided by average interest-earning assets which is based on the average monthly balances
for the respective periods indicated. Interest-earning assets include due from other banks, due from BSP, securities purchased under resale agreement, financial assets at fair value through profit or loss, financial assets at fair value through other comprehensive income, investment securities at amortized cost and loans and receivables.
4. Total NPLs divided by loans and receivables, net of unearned discount and gross of allowance for credit and
impairment losses.
5. Total allowance for impairment and credit losses on receivables from customers divided by total NPLs.
6. The sum of total allowance for impairment and credit losses on receivables from customers and retained
earnings appropriated for general loan loss provision divided by total NPLs.
7. Net Income before Tax and Interest Expense divided by Interest Expense
260
vjnquisido
Typewritten Text
vjnquisido
Typewritten Text
vjnquisido
Typewritten Text
vjnquisido
Typewritten Text
vjnquisido
Typewritten Text
Related Documents