COVER SHEET P H I L I P P I N E S E V E N C O R P O R A T I O N (Company’s full Name) 7 t h F l r . T h e C o l u m b i a T o w e r O r t i g a s A v e. M A n d a l u y o n g C i t y (Business Address: No. Street City / Town / Province) Company Telephone Number Contact Person 1 2 3 1 1 7 - Q 0 7 3 rd Thursday Month Day FORM TYPE Month Day Fiscal Year Annual Meeting 2ND QUARTER REPORT Secondary License Type, if Applicable Dept. Requiring this Doc. Amended Articles Number/Section Total Amount of Borrowings Total No. of Stockholders Domestic Foreign ----------------------------------------------------------------------------------------------------------------------------------- To be accomplished by SEC personnel concerned File Number LCU Remarks = pls. use black ink for scanning purposes 0 0 0 0 1 0 8 4 7 6 S.E.C Registration Number 724-44-41 to 51 Atty. Evelyn S. Enriquez Corporate Secretary Document I.D. Cashier STAMPS

Welcome message from author
This document is posted to help you gain knowledge. Please leave a comment to let me know what you think about it! Share it to your friends and learn new things together.
Transcript

COVER SHEET
P H I L I P P I N E
S E V E N
C O R P O R A T I O N
(Company’s full Name)
7 t h F l r . T h e C o l u m b i a T o w e r
O r t i g a s A v e. M A n d a l u y o n g C i t y
(Business Address: No. Street City / Town / Province)
Company Telephone Number
Contact Person
1 2 3 1 1 7 - Q 0 7 3rd Thursday
Month Day FORM TYPE Month Day
Fiscal Year Annual Meeting
2ND QUARTER REPORT
Secondary License Type, if Applicable
Dept. Requiring this Doc. Amended Articles Number/Section
Total Amount of Borrowings
Total No. of Stockholders Domestic Foreign
-----------------------------------------------------------------------------------------------------------------------------------
To be accomplished by SEC personnel concerned
File Number LCU
Remarks = pls. use black ink for scanning purposes
0 0 0 0 1 0 8 4 7 6
S.E.C Registration Number
724-44-41 to 51 Atty. Evelyn S. Enriquez
Corporate Secretary
Document I.D. Cashier
STAMPS

SECURITIES AND EXCHANGE COMMISSION
FORM 17-Q
QUARTERLY REPORT PURSUANT TO SECTION 17 OF THE SECU RITIES REGULATION CODE AND SRC RULE 17(2) (b) THEREUNDER
1. For the quarterly period ended June 30, 2015 2. Commission identification number: 108476 3. BIR Tax Identification No : 000-390-189-000 4. Exact name of registrant as specified in its charter :
PHILIPPINE SEVEN CORPORATION 5. Country of incorporation : PHILIPPINES 6. Industry Classification Code: (S (SEC Use Only) 7. Address of registrant’s principal office : 7TH Floor, The Columbia Tower
Ortigas Avenue, Mandaluyong City 1550
8. Telephone number : (632) 724-44-41 to 51 9. Former name, former address and former fiscal year, if changed since last report N/A 10. Securities registered pursuant to Section 8 and 12 of the Code, or Sections 4 and 8 of the
RSA No. of Shares of Common Stock
Shares Outstanding - Common : 458,435,323 Warrants : -0-
11. Are any or all of the securities listed on the Stock Exchange?
Yes [ X ] No [ ]
Stock Exchange: Class/es of Securities listed
Philippine Stock Exchange - Common
12. Indicate by check mark whether the registrant:
a. has filed all reports required to be filed by Section 17 of the Code and SRC Rule 17 thereunder or Sections 11 of the RSA and RSA Rule 11(a)-1 thereunder, and Sections 26 and 141 of the Corporation Code of the Philippines, during the preceding twelve (12) months (or for such shorter period the registrant was required to file such reports)
Yes [ X ] No [ ]


i
Part 1 – FNANCIAL INFORMATION Item 1. Financial Statements The consolidated financial statements accompany this form 17-Q and the following is the table of contents
a. Unaudited Consolidated Balance Sheet as at June 30, 2015 and Audited Consolidated Balance Sheet as at December 31, 2014
3
b. Unaudited Consolidated Statements of Comprehensive Income for the Three Months Ended June 30, 2015 and 2014
5
c. Unaudited Consolidated Statements of Comprehensive Income for the Six Months Ended June 30, 2015 and 2014
6
d. Unaudited Consolidated Statements of Changes in Stockholders’ Equity for the Six Months Ended June 30, 2015 and 2014
7
e. Unaudited Consolidated Statements of Cash Flow for the Three Months Ended June 30, 2015 and 2014
8
f. Unaudited Consolidated Statements of Cash Flow for the Six Months Ended June 30, 2015 and 2014
9
g. Notes to Unaudited Consolidated Financial Statements 10
Item 2. Management’s Discussion and Analysis of Res ults of Operations and Financial
Condition (Pages i –viii)
SELECTED FINANCIAL DATA
* Amount in thousands of Pesos, except EPS
Three Months Ended June 30 (Unaudited)
Six Months Ended June 30 (Unaudited)
2015 2014 2015 2014 SYSTEM WIDE SALES 6,651,773 5,348,979 12,153,268 9,778,940 Statement of Income Data:
Revenues and other income
Revenue from merchandise sales 5,586,684 4,375,032 10,129,318 7,986,454 Franchise revenue 502,629 449,976 936,898 797,828 Marketing income 106,900 67,500 251,426 148,137 Cost and expenses
Cost of merchandise sales 4,165,809 3,337,253 7,617,761 6,106,765 General & administrative expenses 1,893,243 1,328,098 3,564,025 2,528,381 Interest expense 7,750 3,578 13,812 7,263 Net income 243,629 223,869 356,485 323,875
Earnings per share (EPS) 0.53 0.49
0.78 0.71
Cash Flow Data:
Net cash from operating activities 1,400,772 821,456 969,222 833,956
Net cash (used in) investing activities (614,182) (576,950) (1,116,985) (833,113)
Net cash (used in) from financing activities (581,293) (271,109) (6,713) (274,663)

ii
OVERVIEW
We operate the largest convenience store network in the country. We acquired from Southland Corporation (now Seven Eleven Inc.) of Dallas, Texas the area license to operate 7-Eleven convenience stores in the Philippines in December 1982. The license was renewed in 2007 for another twenty years. We opened our first store in February 1984 at the corner of Kamias Road and EDSA Quezon City, and grew slowly as the economy struggled. Expansion was stepped up in 1993, followed by an IPO in 1998. President Chain Store Corporation of Taiwan took a majority stake in 2000 at management’s invitation, providing technology transfer from a more advanced market. After a period of consolidation of organization, processes, and systems, the rate of expansion was stepped up further in 2007 through the franchise business model and close collaboration with business partners. This was backed by a strong logistics system and head office support. At the end of June 30, 2015, we have 1,405 7-Eleven convenience stores all over the Philippines. We penetrated the Visayas during the middle of 2012 and we ended the second quarter with 137 stores in the Cebu, Negros and Panay market. We successfully entered Mindanao during the second quarter with the opening of four stores in Davao and CDO. We have taken steps to protect and expand our leadership in light of increased competition, recognizing that rewards for market share are especially strong in the convenience store sector. This involves not only an increased pace of expansion in areas contested by competition, but strategic entry into new territories. The latter may be unprofitable for the first few years due to the high fixed costs of logistics, but the Company will later be rewarded with strong first mover advantages. Our retail chain of convenience stores is sustained by a manpower complement of 4,992 employees engaged in corporate store operations and in support service units. Despite of growing competition, we maintain our leadership in the CVS industry. We seek to meet the needs of our customers and maintain a leadership position in the C-store industry by taking advantage of economies of scale, technology, people and a widely recognized brand. Our vision is to be the best retailer of convenience for emerging markets. Second Quarter Financial Condition and Results of O perations Results of Operations For the Second Quarter Net income generated in the second quarter rose by 8.8 percent to P 243.6 million from P 223.9 million registered in the same period last year. The improvement in net income can be attributed to the increase in sales and higher franchise revenues and marketing income. System wide sales, which represent sales of all corporate and franchise-operated stores, grew by 24.4 percent during the April to June period. Opening of new stores and improvement in same store sales increased revenues. At the end of June, store count stood at 1,405, up by 25.3% from 1,121 same period in 2014. The Company achieved another milestone during the second quarter by opening four 7-Eleven stores in Davao City and Cagayan de Oro and two stores in Boracay.

iii
The rate of earnings growth was slower and can be attributed to the Company’s capacity building expenditures. PSC has been expanding its logistics infrastructure to support its unprecedented expansion in Visayas and Mindanao. This will impact profitability in the medium term, in the form of under utilized warehouses, but is expected to benefit the Company in the longer term by achieving dominant market position. For the Six-Months Ended June 30 Net income at the end of the first six months of the year rose by 10.1% to P356.5 million from P323.9 million the preceding year. This was mainly driven by the increase in sales and improvement in gross margin during the period. System-wide sales rose by 24.3 percent to P 12.2 billion at the end of first half. Revenue from merchandise sales, which pertains to retail sales of corporate stores and merchandise sold to franchised stores, grew by 26.8 percent year-to-date June. Gross margin improved to 24.8 percent of revenue from merchandise sales in the second quarter from 23.6 percent during the same period in 2014. This can be attributed to the higher discounts and rebates earned as volumes rose. Earnings per share (EPS) likewise increased by 10.1 percent to P0.78 per share at the end of first half. The Company opened the most number of new stores in its history last year. It intends to accelerate the rate of new store openings over the medium-term at a rate of at least twenty percent per year to take advantage of improving economic conditions and to protect its market share in light of increased competition. PSC believes that the CVS sector will remain to be crowded over the next five years. It intends to capitalize on its first-mover advantage and economies of scale to remain the market leader. Further, new operators boosted franchise store count to 860 franchisees from 739 a year ago. As a result, total franchise revenues went up by 17.4 percent to P 936.9 million due to the higher number of franchisees and margin improvement. Rent and electricity of franchisees, which were advanced by the Company formed part of the latter’s expense. The corresponding reimbursements were billed and recognized as other income. This resulted into a timing difference but there will be no impact to the bottom line. Marketing income continued to enhance earnings by generating P251.4 million as 7-Eleven expanded brand building opportunities for vendor partners, and as increased sales made it easier to request for more equitable treatment vis-à-vis other channels. EBITDA (earnings before interest, taxes, depreciation and amortization) rose by 19.1 percent from P 869.9 million in 2014 to P 1.0 billion at the end June 2015 while EBITDA margin declined to 10.2 percent of revenue from merchandise sales from 10.9 percent in 2014. Operating margin likewise decreased to 3.5 percent from 4.1 percent in 2014. Stock price ranged from P106-118 per share during the second quarter. Revenue and Gross Margin The Company closed the first half with total revenue from merchandise sales of P10.1 billion, an increase of 26.8 percent compared to P8.0 billion in 2014. Cost of merchandise sold rose by P1.5 billion to P7.6 billion as at June 30, 2015. Gross Profit stood at P 2.5 billion, an increase of 1.2 percent compared to last year’s rate of 23.6 percent.

iv
Along with its 24/7 convenience, PSC also offers services including bills payment, phone/call cards, and 7-Connect that allows customers to pay for selected online purchases with cash through any 7-Eleven store. These products in the services category plus consigned goods formed part of commission income. The services line stabilized leading to a higher commission income as at the end of the quarter amounting to P 23.5 million compared to P 18.4 million for the same period last year.
June 30, 2015 June 30, 2014 Increase (Decrease)
Value Percentage Revenue from merchandise sales 10,129,318 7,986,454 2,142,864 26.8 Cost of merchandise sales 7,617,760 6,103,389 1,514,371 24.8 Gross profit 2,511,558 1,883,064 628,494 33.4 Commission income 23,493 18,423 5,070 27.5 (amount in thousand Pesos)
Other Income Other income mainly consists of franchise revenues, marketing and rental income. The Company’s total other income increased by P 444.5 million, to 1.6 billion as a result of the following: Franchise revenues went up by 17.4 percent to P 936.9 million due to the increase in the number of franchisees from 633 at the end of June 2014 to 766 in 2015. Other income rose by 120.4 percent to P 369.0 million partly due to penalties imposed on suppliers, which incurred low inbound fill rate and delayed deliveries. No significant element of income came from sources other than the result of the Company’s continuing operations.
Selling, General and Administrative Expense Selling, general and administrative (SG & A) expenses which is comprised of store operating and selling expenses and headquarters’ expenses went up by 41.0 percent or P1.0 billion to P 3.6 billion in the second quarter of 2015. This is quite higher than the growth rate in system-wide sales of 24.3 percent and in the increase in number of stores of 27.8 percent. Communication, light and water were the highest contributor as it increased by 18.3 percent to P 621.5 million and was pegged at 6.1 percent of Merchandise sales. The increase was due mainly to the opening of new stores. Depreciation and amortization expense rose by 27.4 percent but its percentage to sales remained at 5. percent. Higher depreciation was a result of opening of new stores and renovation of existing stores. The Company continued to employ outsourced manpower on its new corporate stores and warehouse facilities, outsourced services as percentage of sales rose to 4.9 percent from 4. percent in 2014.
June 30, 2015 June 30, 2014 Increase (Decrease) Value Percentage Franchise revenue 936,898 797,828 139,070 17.4 Marketing income 251,426 148,137 103,289 69.7 Rental income 22,692 22,130 562 2.5 Other income 369,000 167,420 201,580 120.4 Total 1,580,016 1,135,515 444,501 39.2 (amount in thousand Pesos)

v
Rent, as percentage of sales went up to 4.9 percent, due to store opening, while warehouse and trucking services grew because of Visayas operations from 4.0 percent in the same period last year. All other expense types went up over preceding year’s level as a result of the increased number of stores. The said growth is considered to be incidental and proportionate as PSC continues to grow its store base. There are no significant nor unusual expense incurred during the calendar year and is considered to be in the normal course of business.
Interest Expense Interest incurred to service debt increased by 90.2 percent to P 13.8 million. Outstanding loan balance at the end of the second quarter was pegged at P 940 million, up by P 190.0 million or 25.3 percent from the start of the year. Proceeds from the loans were used to fund expansion. Net Income
Net income for the first half of 2015 grew by P 32.6 million or 10.1 percent to P 356.4 million. This was primarily due to improved sales, higher margins and continued store expansion. The net income generated for the first half of 2015 translated into a 2.9 percent return on system wide sales, lower compared with 3.3 percent in 2014, while return on equity went up to 10.3 percent from 9.9 percent. Moreover, EPS reached P .78 per share at the end of the quarter, up from P .71 in 2014. Financial Condition
Total assets went up by P 532.8 million or 6.8 percent to P 8.4 billion at the end of the second quarter of 2015. This was mainly driven by the increase in Property and Equipment by 16.1 percent to end the quarter with P 4.1 billion from P 3.6 billion as at the end of 2014. This is due to capital expenditure spent in relation to store expansion and investment in store equipment to support new product lines.
June 30, 2015 June 30, 2014 Increase (Decrease) Value Percentage Communication, light and water 621,452 525,226 96,226 18.3 Depreciation and amortization 510,858 401,043 109,815 27.4 Outside services 492,607 354,406 138,201 39.0 Rent 491,642 313,508 178,134 56.8 Personnel costs 283,888 235,413 48,475 20.6 Advertising and promotion 115,381 89,692 25,689 28.6 Trucking services 174,208 134,084 40,124 29.9 Royalties 121,049 97,366 23,683 24.3 Warehousing services 121,954 83,857 38,097 45.4 Repairs and maintenance 99,968 64,431 35,537 55.2 Supplies 98,591 60,988 37,603 61.7 Taxes and licenses 70,679 39,890 30,789 77.2 Entertainment and amusement 8,030 5,599 2,431 43.4 Transportation and travel 35,491 26,088 9,403 36.0 Others 318,227 96,790 221,437 228.8 Total 3,564,025 2,528,381 1,035,644 41.0 (amount in thousand Pesos)

vi
Also, Prepayments and other current assets which includes advances to lessors for newly acquired sites contributed an increase of 51.1 percent or P 183.2 million from P 358.4 million at the end of 2014. Rental deposits, also made to acquire new sites contributed an increase of 9.7 percent and reached P 505.3 million at the end of the quarter. On the other hand, current liabilities increased by P 299.4 million or 7.1 percent owing to the increase in Accounts payable and accrued expenses to P 2.9 billion. Loan balance was higher by 25.3 percent to partly finance expansion. The Company operates on a negative working capital position, which is manifested by a current ratio of 0.72:1 from 0.80:1 at the end of 2014. This is because cash proceeds from retail sales are invested in long-term assets and at the same time utilizing credit term extended by trade suppliers. Stockholders’ equity at the end of the quarter comprises 41.2 percent of total assets, lower compared to 41.7 percent at the beginning of the year. Liquidity and Capital Resources The Company obtains majority of its working capital and capital expenditure requirements from cash generated by retailing operations and franchising activities. There are short-term credit lines from various banks totaling to more than P3.0 billion, which can be utilized. PSC believes that operating activities and available working capital sources will provide sufficient liquidity in 2015 as it continues to expand its store base. This will enable the Company to fund its capital expenditures, pay dividends and other general corporate purposes. Management believes that this trend will be favorable in the long term, as rate of store expansion will be entering a more rapid stage augmented by improving economic outlook and prevailing positive investor sentiment in the country. The following are the discussion of the sources and uses of cash in 2015. Cash Flows from Operating Activities Net cash from operating activities at the end of Q2 2015 totaled to P 969.2 million, 16.2 percent higher compared to P 834.0 million generated in 2014. The increase in operating cash flow can be attributed to the decrease in working capital contribution resulting from decrease in receivables. Cash Flows from Investing Activities Net cash used in investing activities, primarily for capital expenditures, rose by 34.1 percent to almost P 1.1 billion. Major cash outlay went to new store constructions and renovations and acquisition of new equipment to support new product lines. There were 123 new stores opened in the first half of the year. Cash Flows from Financing Activities Net cash used in financing activities amounted to P 6.7 million lower compared to the cash used in financing activities in 2014 due to higher availment of loans. We expect to take advantage of our working capital and utilizing the short-term line extended by leading local banks in funding our growth strategies.
vii
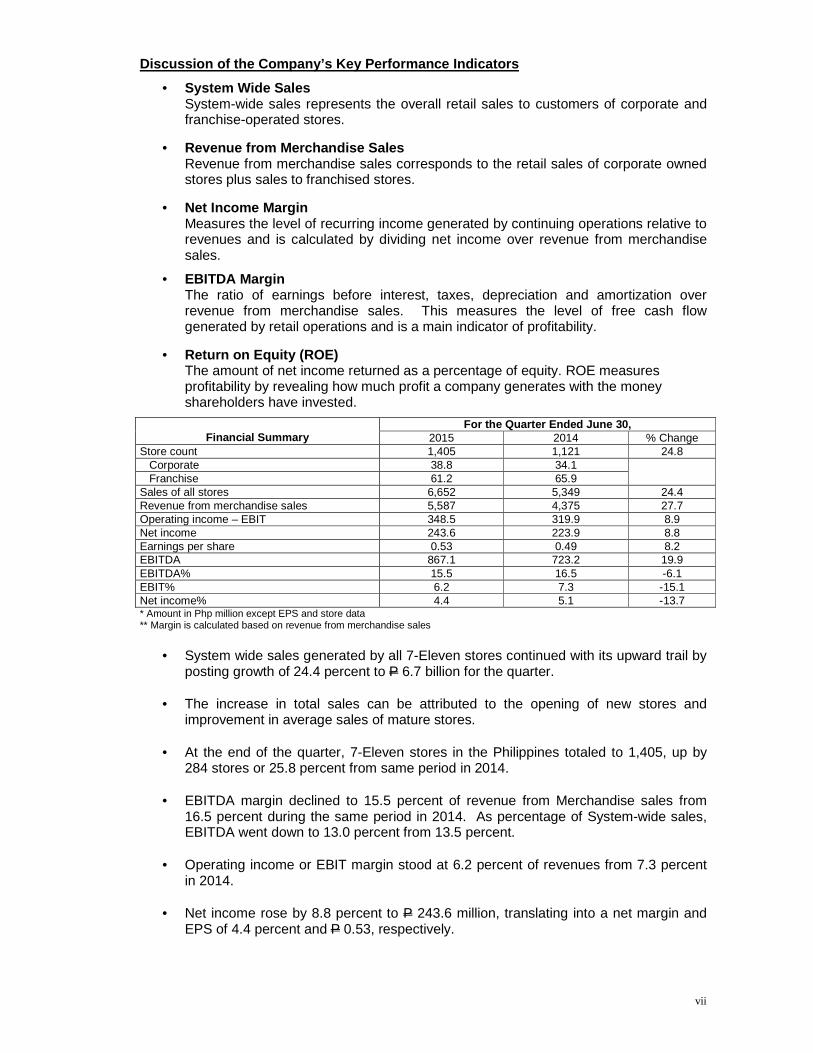
Discussion of the Company’s Key Performance Indicat ors
• System Wide Sales System-wide sales represents the overall retail sales to customers of corporate and franchise-operated stores.
• Revenue from Merchandise Sales Revenue from merchandise sales corresponds to the retail sales of corporate owned stores plus sales to franchised stores.
• Net Income Margin Measures the level of recurring income generated by continuing operations relative to revenues and is calculated by dividing net income over revenue from merchandise sales.
• EBITDA Margin The ratio of earnings before interest, taxes, depreciation and amortization over revenue from merchandise sales. This measures the level of free cash flow generated by retail operations and is a main indicator of profitability.
• Return on Equity (ROE) The amount of net income returned as a percentage of equity. ROE measures profitability by revealing how much profit a company generates with the money shareholders have invested.
For the Quarter Ended June 30, Financial Summary 2015 2014 % Change
Store count 1,405 1,121 24.8 Corporate 38.8 34.1 Franchise 61.2 65.9
Sales of all stores 6,652 5,349 24.4 Revenue from merchandise sales 5,587 4,375 27.7 Operating income – EBIT 348.5 319.9 8.9 Net income 243.6 223.9 8.8 Earnings per share 0.53 0.49 8.2 EBITDA 867.1 723.2 19.9 EBITDA% 15.5 16.5 -6.1 EBIT% 6.2 7.3 -15.1 Net income% 4.4 5.1 -13.7 * Amount in Php million except EPS and store data ** Margin is calculated based on revenue from merchandise sales
• System wide sales generated by all 7-Eleven stores continued with its upward trail by
posting growth of 24.4 percent to P 6.7 billion for the quarter.
• The increase in total sales can be attributed to the opening of new stores and improvement in average sales of mature stores.
• At the end of the quarter, 7-Eleven stores in the Philippines totaled to 1,405, up by
284 stores or 25.8 percent from same period in 2014.
• EBITDA margin declined to 15.5 percent of revenue from Merchandise sales from 16.5 percent during the same period in 2014. As percentage of System-wide sales, EBITDA went down to 13.0 percent from 13.5 percent.
• Operating income or EBIT margin stood at 6.2 percent of revenues from 7.3 percent
in 2014.
• Net income rose by 8.8 percent to P 243.6 million, translating into a net margin and EPS of 4.4 percent and P 0.53, respectively.

viii
Financial Soundness Indicator Formula 2015 2014 Liquidity Ratio
Current ratio Current Assets/Current
Liabilities 0.72 0.80
Quick ratio Cash + Receivables/Current Liabilities 0.36 0.44 Financial Leverage Debt ratio Total Debt/Total Assets 0.96 1.02 Debt to equity ratio Total Debt/Total Equity 1.43 1.40 Interest coverage EBIT/Interest charges 38.01 64.73 Asset to equity ratio Total Assets/Total Equity 1.48 1.37 Profitability Ratio Gross profit margin Gross profit/Revenue from merchandise sales 24.79% 23.58%
Net profit margin Net income/Revenue from
merchandise sales 3.52% 4.06%
Return on assets Net income/Total Assets 6.94% 7.17% Return on equity Net income/Average Equity 10.30% 9.85% Price/earnings ratio Stock price (end of year)/EPS 75.6 61.9
Discussion and Analysis of Material Events and Unce rtainties
1. There are no known trends, events and uncertainties that will have a material impact on liquidity after the balance sheet date.
2. There are no material off-balance sheet transactions, arrangements and obligations of the Company with unconsolidated entities during the reporting period.
3. All of the Company’s income was earned in the ordinary course of business.
4. There are no seasonal aspects that have a potentially material effect on the financial
statements.
5. The Company’s financial risk management objectives and policies are discussed in Note 29 of the June 30, 2015 Notes to Unaudited Consolidated Financial Statements.
1
Philippine Seven Corporation and Subsidiaries
Unaudited Consolidated Financial Statements As at June 30, 2015 and December 31, 2014(Audited) and for the Quarters Ended June 30, 2015 and 2014

2
1 0 8 4 7 6
SEC Registration Number
P H I L I P P I N E S E V E N C O R P O R A T I O N A N D
S U B S I D I A R I E S
(Company’s Full Name)
7 t h F l o o r , T h e C o l u m b i a T O w e r ,
O r t i g a s A v e n u e , M a n d a l u y o N g C i t y
(Business Address: No. StreetCity/Town/Province)
Steve Chen 705-5200 (Contact Person) (Company Telephone Number)
0 6 3 0 A A C F S 0 7 3rd Thursday Month Day (Form Type) Month Day
(Calendar Year) (Annual Meeting)
Not Applicable (Secondary License Type, If Applicable)
– – Dept. Requiring this Doc. Amended Articles Number/Section Total Amount of Borrowings
637 P=940M – Total No. of Stockholders Domestic Foreign
To be accomplished by SEC Personnel concerned
File Number LCU
Document ID Cashier
S T A M P S
Remarks: Please use BLACK ink for scanning purposes.
COVER SHEET
3
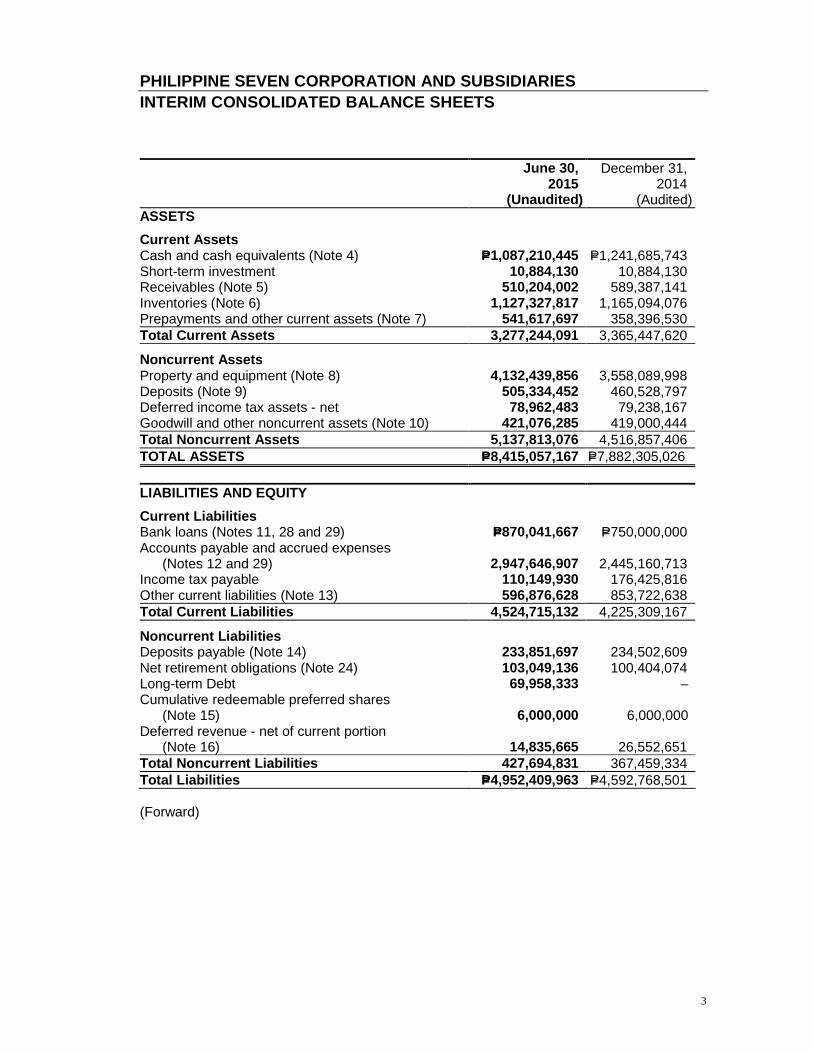
PHILIPPINE SEVEN CORPORATION AND SUBSIDIARIES INTERIM CONSOLIDATED BALANCE SHEETS
June 30,
2015 December 31,
2014 (Unaudited) (Audited) ASSETS
Current Assets Cash and cash equivalents (Note 4) P=1,087,210,445 P=1,241,685,743 Short-term investment 10,884,130 10,884,130 Receivables (Note 5) 510,204,002 589,387,141 Inventories (Note 6) 1,127,327,817 1,165,094,076 Prepayments and other current assets (Note 7) 541,617,697 358,396,530 Total Current Assets 3,277,244,091 3,365,447,620
Noncurrent Assets Property and equipment (Note 8) 4,132,439,856 3,558,089,998 Deposits (Note 9) 505,334,452 460,528,797 Deferred income tax assets - net 78,962,483 79,238,167 Goodwill and other noncurrent assets (Note 10) 421,076,285 419,000,444 Total Noncurrent Assets 5,137,813,076 4,516,857,406 TOTAL ASSETS P=8,415,057,167 P=7,882,305,026 LIABILITIES AND EQUITY
Current Liabilities Bank loans (Notes 11, 28 and 29) P=870,041,667 P=750,000,000 Accounts payable and accrued expenses
(Notes 12 and 29) 2,947,646,907 2,445,160,713 Income tax payable 110,149,930 176,425,816 Other current liabilities (Note 13) 596,876,628 853,722,638 Total Current Liabilities 4,524,715,132 4,225,309,167
Noncurrent Liabilities Deposits payable (Note 14) 233,851,697 234,502,609 Net retirement obligations (Note 24) 103,049,136 100,404,074 Long-term Debt 69,958,333 – Cumulative redeemable preferred shares
(Note 15) 6,000,000 6,000,000 Deferred revenue - net of current portion
(Note 16) 14,835,665 26,552,651 Total Noncurrent Liabilities 427,694,831 367,459,334 Total Liabilities P=4,952,409,963 P=4,592,768,501
(Forward)
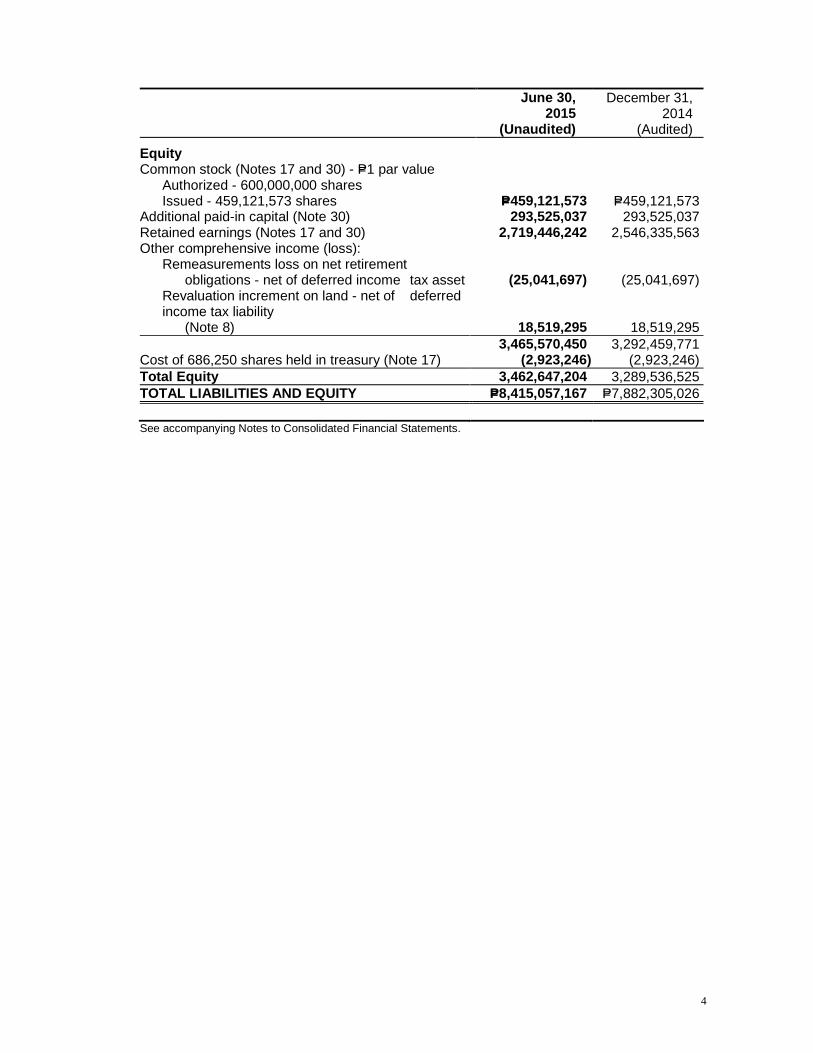
4
June 30, 2015
(Unaudited)
December 31, 2014
(Audited)
Equity Common stock (Notes 17 and 30) - P=1 par value Authorized - 600,000,000 shares Issued - 459,121,573 shares P=459,121,573 P=459,121,573 Additional paid-in capital (Note 30) 293,525,037 293,525,037 Retained earnings (Notes 17 and 30) 2,719,446,242 2,546,335,563 Other comprehensive income (loss): Remeasurements loss on net retirement
obligations - net of deferred income tax asset (25,041,697) (25,041,697) Revaluation increment on land - net of deferred
income tax liability (Note 8) 18,519,295 18,519,295
3,465,570,450 3,292,459,771 Cost of 686,250 shares held in treasury (Note 17) (2,923,246) (2,923,246) Total Equity 3,462,647,204 3,289,536,525 TOTAL LIABILITIES AND EQUITY P=8,415,057,167 P=7,882,305,026 See accompanying Notes to Consolidated Financial Statements.
5
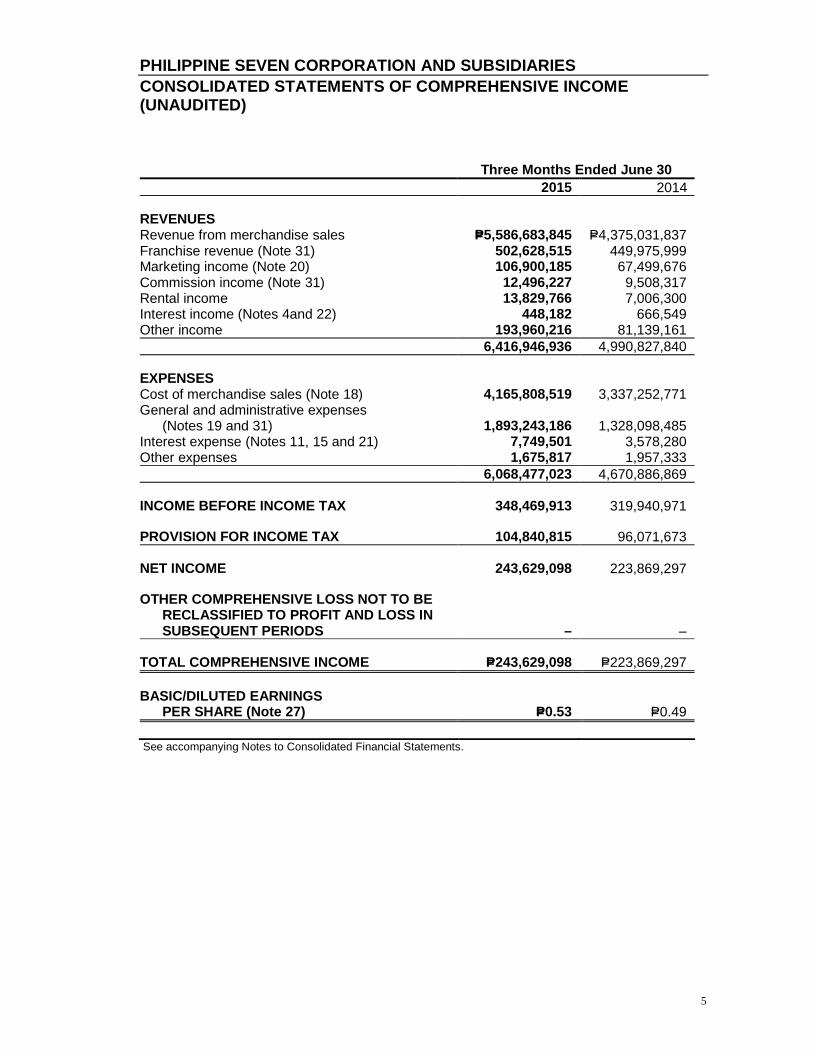
PHILIPPINE SEVEN CORPORATION AND SUBSIDIARIES CONSOLIDATED STATEMENTS OF COMPREHENSIVE INCOME (UNAUDITED) Three Months Ended June 30 2015 2014
REVENUES Revenue from merchandise sales P=5,586,683,845 P=4,375,031,837 Franchise revenue (Note 31) 502,628,515 449,975,999 Marketing income (Note 20) 106,900,185 67,499,676 Commission income (Note 31) 12,496,227 9,508,317 Rental income 13,829,766 7,006,300 Interest income (Notes 4and 22) 448,182 666,549 Other income 193,960,216 81,139,161 6,416,946,936 4,990,827,840
EXPENSES Cost of merchandise sales (Note 18) 4,165,808,519 3,337,252,771 General and administrative expenses
(Notes 19 and 31) 1,893,243,186 1,328,098,485 Interest expense (Notes 11, 15 and 21) 7,749,501 3,578,280 Other expenses 1,675,817 1,957,333 6,068,477,023 4,670,886,869
INCOME BEFORE INCOME TAX 348,469,913 319,940,971
PROVISION FOR INCOME TAX 104,840,815 96,071,673
NET INCOME 243,629,098 223,869,297
OTHER COMPREHENSIVE LOSS NOT TO BE RECLASSIFIED TO PROFIT AND LOSS IN SUBSEQUENT PERIODS – –
TOTAL COMPREHENSIVE INCOME P=243,629,098 P=223,869,297
BASIC/DILUTED EARNINGS PER SHARE (Note 27) P=0.53 P=0.49
See accompanying Notes to Consolidated Financial Statements.

6
PHILIPPINE SEVEN CORPORATION AND SUBSIDIARIES CONSOLIDATED STATEMENTS OF COMPREHENSIVE INCOME (UNAUDITED) Six Months Ended June 30 2015 2014
REVENUES Revenue from merchandise sales P=10,129,318,090 P=7,986,453,643 Franchise revenue (Note 31) 936,897,790 797,827,646 Marketing income (Note 20) 251,425,990 148,136,804 Commission income (Note 31) 23,492,885 18,422,844 Rental income 22,692,244 10,993,656 Interest income (Notes 4and 22) 1,054,356 1,259,581 Other income 344,452,738 146,337,483 11,709,334,093 9,109,431,658
EXPENSES Cost of merchandise sales (Note 18) 7,617,760,683 6,106,764,979 General and administrative expenses
(Notes 19 and 31) 3,564,513,817 2,528,381,483 Interest expense (Notes 11, 15 and 21) 13,811,664 7,263,034 Other expenses 2,124,401 4,158,452 11,198,210,565 8,646,567,948
INCOME BEFORE INCOME TAX 511,123,528 462,863,710
PROVISION FOR INCOME TAX 154,638,761 138,989,056
NET INCOME 356,484,767 323,874,651
OTHER COMPREHENSIVE LOSS NOT TO BE RECLASSIFIED TO PROFIT AND LOSS IN SUBSEQUENT PERIODS – –
TOTAL COMPREHENSIVE INCOME P=356,484,767 P=323,874,651
BASIC/DILUTED EARNINGS PER SHARE (Note 27) P=0.78 P=0.71
See accompanying Notes to Consolidated Financial Statements.
7
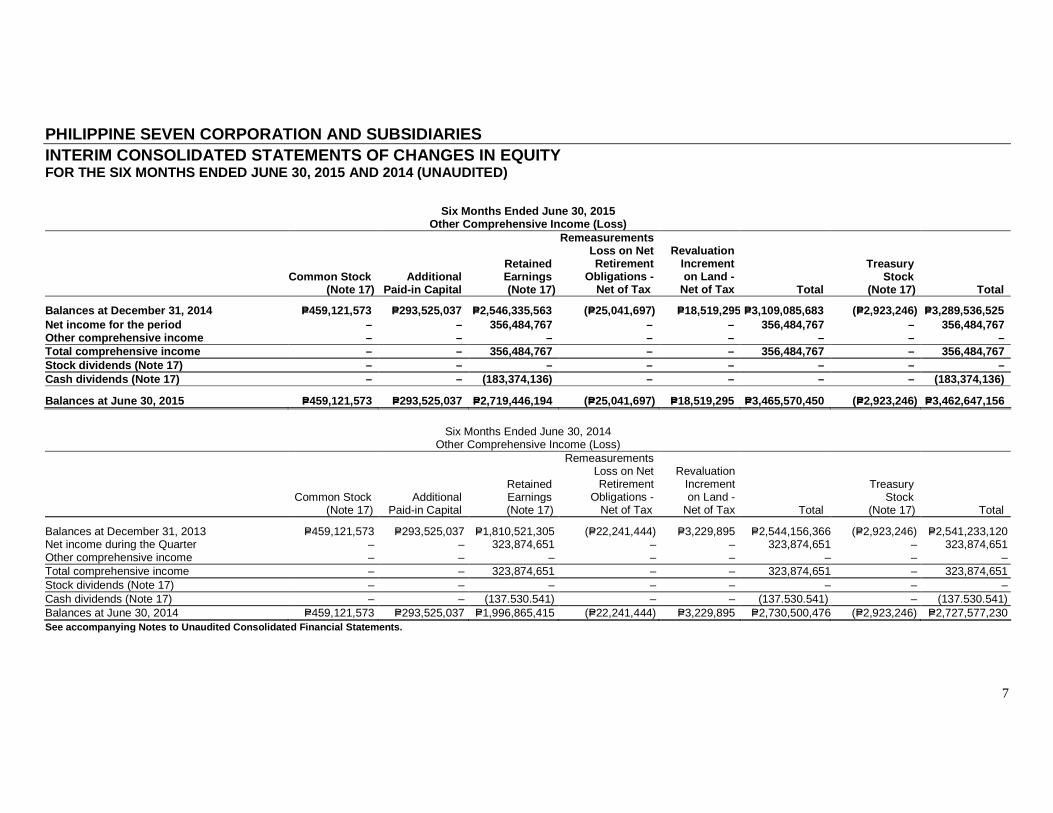
PHILIPPINE SEVEN CORPORATION AND SUBSIDIARIES INTERIM CONSOLIDATED STATEMENTS OF CHANGES IN EQUIT Y FOR THE SIX MONTHS ENDED JUNE 30, 2015 AND 2014 (UNAUDITED)
Six Months Ended June 30, 2015 Other Comprehensive Income (Loss)
Common Stock
(Note 17) Additional
Paid-in Capital
Retained Earnings (Note 17)
Remeasurements Loss on Net Retirement
Obligations - Net of Tax
Revaluation Increment on Land -
Net of Tax Total
Treasury Stock
(Note 17) Total
Balances at December 31, 2014 P=459,121,573 P=293,5 25,037 P=2,546,335,563 (P=25,041,697) P=18,519,295 P=3,109,085,683 (P=2,923,246) P=3,289,536,525 Net income for the period – – 356,484,767 – – 356,4 84,767 – 356,484,767 Other comprehensive income – – – – – – – – Total comprehensive income – – 356,484,767 – – 356, 484,767 – 356,484,767 Stock dividends (Note 17) – – – – – – – – Cash dividends (Note 17) – – (183,374,136) – – – – (183,374,136)
Balances at June 30, 2015 P=459,121,573 P=293,525,0 37 P=2,719,446,194 (P=25,041,697) P=18,519,295 P=3,465,570,450 (P=2,923,246) P=3,462,647,156
Six Months Ended June 30, 2014
Other Comprehensive Income (Loss)
Common Stock
(Note 17) Additional
Paid-in Capital
Retained Earnings (Note 17)
Remeasurements Loss on Net Retirement
Obligations - Net of Tax
Revaluation Increment on Land -
Net of Tax Total
Treasury Stock
(Note 17) Total
Balances at December 31, 2013 P=459,121,573 P=293,525,037 P=1,810,521,305 (P=22,241,444) P=3,229,895 P=2,544,156,366 (P=2,923,246) P=2,541,233,120 Net income during the Quarter – – 323,874,651 – – 323,874,651 – 323,874,651 Other comprehensive income – – – – – – – – Total comprehensive income – – 323,874,651 – – 323,874,651 – 323,874,651 Stock dividends (Note 17) – – – – – – – – Cash dividends (Note 17) – – (137.530.541) – – (137.530.541) – (137.530.541) Balances at June 30, 2014 P=459,121,573 P=293,525,037 P=1,996,865,415 (P=22,241,444) P=3,229,895 P=2,730,500,476 (P=2,923,246) P=2,727,577,230 See accompanying Notes to Unaudited Consolidated Financial Statements.
8
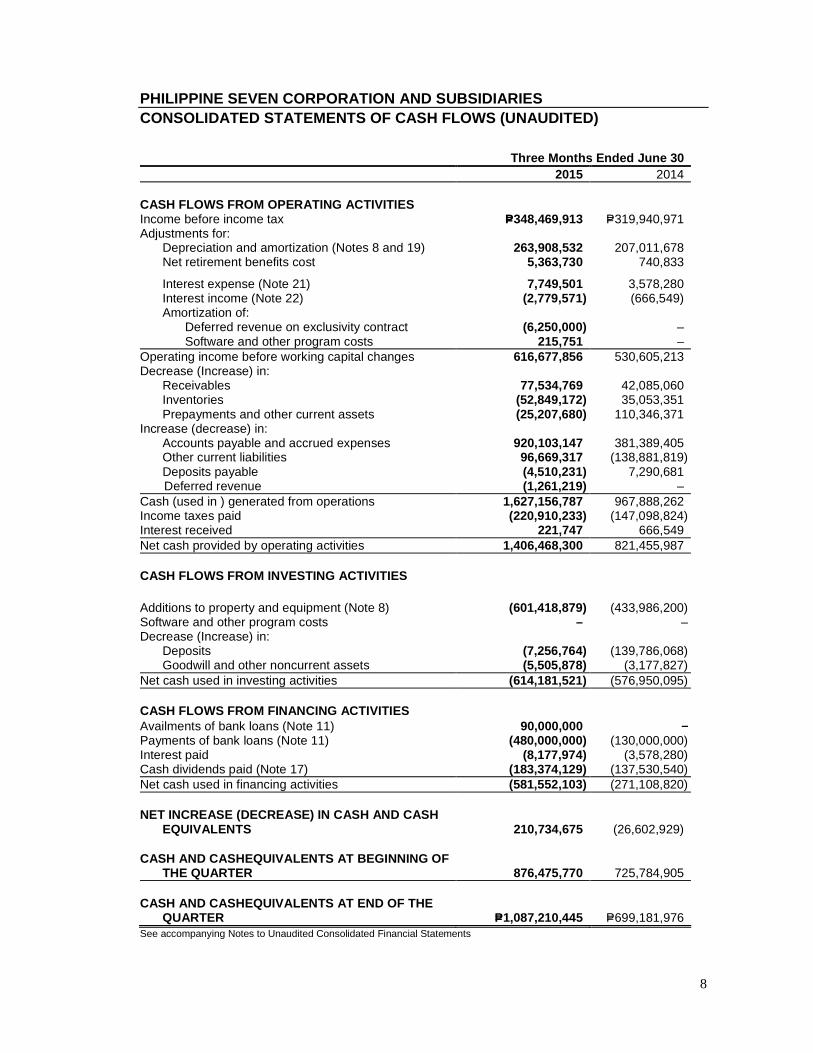
PHILIPPINE SEVEN CORPORATION AND SUBSIDIARIES CONSOLIDATED STATEMENTS OF CASH FLOWS (UNAUDITED)
See accompanying Notes to Unaudited Consolidated Financial Statements
Three Months Ended June 30 2015 2014
CASH FLOWS FROM OPERATING ACTIVITIES Income before income tax P=348,469,913 P=319,940,971 Adjustments for: Depreciation and amortization (Notes 8 and 19) 263,908,532 207,011,678 Net retirement benefits cost 5,363,730 740,833
Interest expense (Note 21) 7,749,501 3,578,280 Interest income (Note 22) (2,779,571) (666,549) Amortization of: Deferred revenue on exclusivity contract (6,250,000) – Software and other program costs 215,751 – Operating income before working capital changes 616,677,856 530,605,213 Decrease (Increase) in: Receivables 77,534,769 42,085,060 Inventories (52,849,172) 35,053,351 Prepayments and other current assets (25,207,680) 110,346,371 Increase (decrease) in: Accounts payable and accrued expenses 920,103,147 381,389,405 Other current liabilities 96,669,317 (138,881,819) Deposits payable (4,510,231) 7,290,681 Deferred revenue (1,261,219) – Cash (used in ) generated from operations 1,627,156,787 967,888,262 Income taxes paid (220,910,233) (147,098,824) Interest received 221,747 666,549 Net cash provided by operating activities 1,406,468,300 821,455,987
CASH FLOWS FROM INVESTING ACTIVITIES Additions to property and equipment (Note 8) (601,418,879) (433,986,200) Software and other program costs – – Decrease (Increase) in: Deposits (7,256,764) (139,786,068) Goodwill and other noncurrent assets (5,505,878) (3,177,827) Net cash used in investing activities (614,181,521) (576,950,095)
CASH FLOWS FROM FINANCING ACTIVITIES Availments of bank loans (Note 11) 90,000,000 – Payments of bank loans (Note 11) (480,000,000) (130,000,000) Interest paid (8,177,974) (3,578,280) Cash dividends paid (Note 17) (183,374,129) (137,530,540) Net cash used in financing activities (581,552,103) (271,108,820)
NET INCREASE (DECREASE) IN CASH AND CASH EQUIVALENTS 210,734,675 (26,602,929)
CASH AND CASHEQUIVALENTS AT BEGINNING OF THE QUARTER 876,475,770 725,784,905
CASH AND CASHEQUIVALENTS AT END OF THE QUARTER P=1,087,210,445 P=699,181,976
9
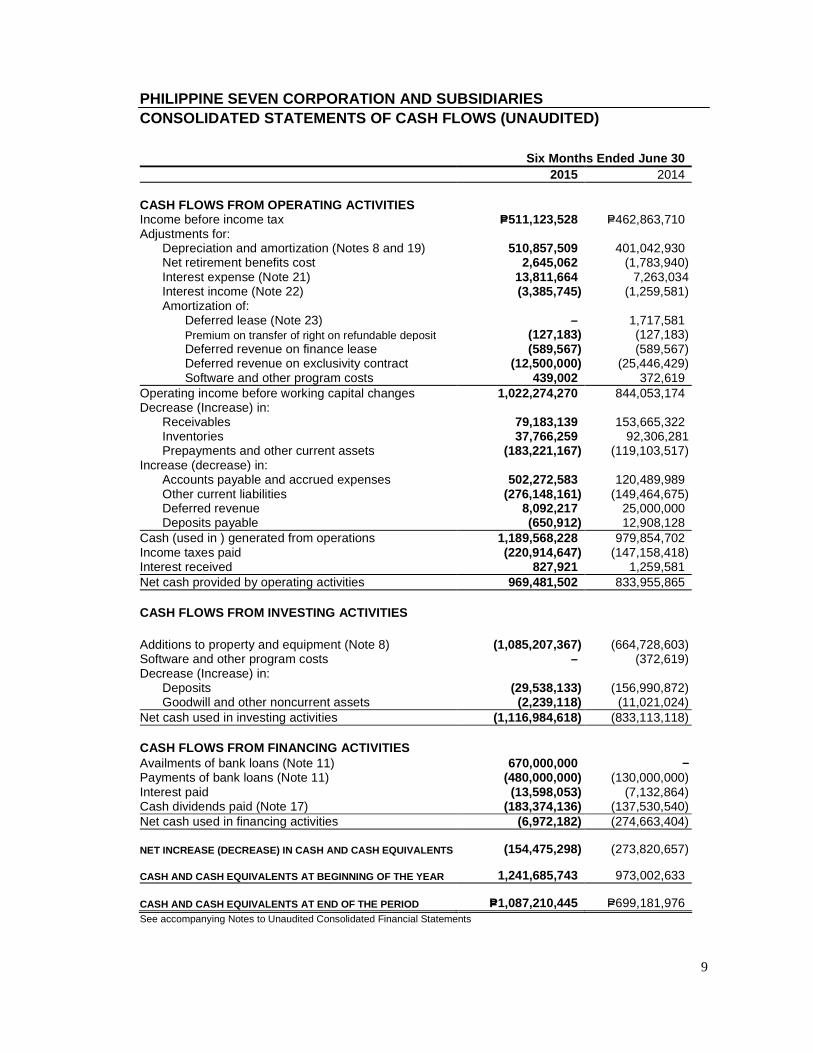
PHILIPPINE SEVEN CORPORATION AND SUBSIDIARIES CONSOLIDATED STATEMENTS OF CASH FLOWS (UNAUDITED)
See accompanying Notes to Unaudited Consolidated Financial Statements
Six Months Ended June 30 2015 2014
CASH FLOWS FROM OPERATING ACTIVITIES Income before income tax P=511,123,528 P=462,863,710 Adjustments for: Depreciation and amortization (Notes 8 and 19) 510,857,509 401,042,930 Net retirement benefits cost 2,645,062 (1,783,940) Interest expense (Note 21) 13,811,664 7,263,034 Interest income (Note 22) (3,385,745) (1,259,581) Amortization of: Deferred lease (Note 23) – 1,717,581 Premium on transfer of right on refundable deposit (127,183) (127,183) Deferred revenue on finance lease (589,567) (589,567) Deferred revenue on exclusivity contract (12,500,000) (25,446,429) Software and other program costs 439,002 372,619 Operating income before working capital changes 1,022,274,270 844,053,174 Decrease (Increase) in: Receivables 79,183,139 153,665,322 Inventories 37,766,259 92,306,281 Prepayments and other current assets (183,221,167) (119,103,517) Increase (decrease) in: Accounts payable and accrued expenses 502,272,583 120,489,989 Other current liabilities (276,148,161) (149,464,675) Deferred revenue 8,092,217 25,000,000 Deposits payable (650,912) 12,908,128 Cash (used in ) generated from operations 1,189,568,228 979,854,702 Income taxes paid (220,914,647) (147,158,418) Interest received 827,921 1,259,581 Net cash provided by operating activities 969,481,502 833,955,865
CASH FLOWS FROM INVESTING ACTIVITIES Additions to property and equipment (Note 8) (1,085,207,367) (664,728,603) Software and other program costs – (372,619) Decrease (Increase) in: Deposits (29,538,133) (156,990,872) Goodwill and other noncurrent assets (2,239,118) (11,021,024) Net cash used in investing activities (1,116,984,618) (833,113,118)
CASH FLOWS FROM FINANCING ACTIVITIES Availments of bank loans (Note 11) 670,000,000 – Payments of bank loans (Note 11) (480,000,000) (130,000,000) Interest paid (13,598,053) (7,132,864) Cash dividends paid (Note 17) (183,374,136) (137,530,540) Net cash used in financing activities (6,972,182) (274,663,404)
NET INCREASE (DECREASE) IN CASH AND CASH EQUIVALENTS (154,475,298) (273,820,657)
CASH AND CASH EQUIVALENTS AT BEGINNING OF THE YEAR 1,241,685,743 973,002,633
CASH AND CASH EQUIVALENTS AT END OF THE PERIOD P=1,087,210,445 P=699,181,976

10
PHILIPPINE SEVEN CORPORATION AND SUBSIDIARIES NOTES TO CONSOLIDATED FINANCIAL STATEMENTS 1. Corporate Information and Authorization for Issuance of the Consolidated Financial
Statements
Corporate Information Philippine Seven Corporation (the Company or PSC) was incorporated in the Philippines and registered with the Philippine Securities and Exchange Commission (SEC) on November 24, 1982. The Company and its subsidiaries (collectively referred to as the “Group”), are primarily engaged in the business of retailing, merchandising, buying, selling, marketing, importing, exporting, franchising, acquiring, holding, distributing, warehousing, trading, exchanging or otherwise dealing in all kinds of grocery items, dry goods, food or foodstuff, beverages, drinks and all kinds of consumer needs or requirements and in connection therewith, operating or maintaining warehouses, storages, delivery vehicles and similar or incidental facilities. The Group is also engaged in the management, development, sale, exchange, and holding for investment or otherwise of real estate of all kinds, including buildings, houses and apartments and other structures.
The Company is controlled by President Chain Store (Labuan) Holdings, Ltd., an investment holding company incorporated in Malaysia, which owns 51.56% of the Company’s outstanding shares. The remaining 48.44% of the shares are widely held. The ultimate parent of the Company is President Chain Store Corporation (PCSC), which is incorporated in Taiwan, Republic of China.
The Company has its primary listing on the Philippine Stock Exchange. As at December 31, 2014 and 2013, the Company has 640 and 650 equity holders, respectively.
The registered business address of the Company is 7th Floor, The Columbia Tower, Ortigas Avenue, Mandaluyong City.
Authorization for Issuance of the Consolidated Financial Statements The consolidated financial statements were authorized for issue by the Board of Directors (BOD) on February 17, 2015.
2. Summary of Significant Accounting Policies and Fina ncial Reporting Practices
Basis of Preparation The consolidated financial statements are prepared under the historical cost basis, except for parcels of land, which are carried at revalued amount. The consolidated financial statements are presented in Philippine Peso (Peso), which is the Group’s functional currency and all amounts are rounded to the nearest Peso except when otherwise indicated. Statement of Compliance The consolidated financial statements are prepared in compliance with Philippine Financial Reporting Standards (PFRS). New Accounting Standards, Interpretations, and Amendments to Existing Standards Effective Subsequent to December 31, 2014 The Group will adopt the following standards, interpretations and amendments to existing standards enumerated below when these become effective. Except as otherwise indicated, the Group does not expect the adoption of these new and amended standards and interpretations to have a significant impact on the Group’s consolidated financial statements:
11
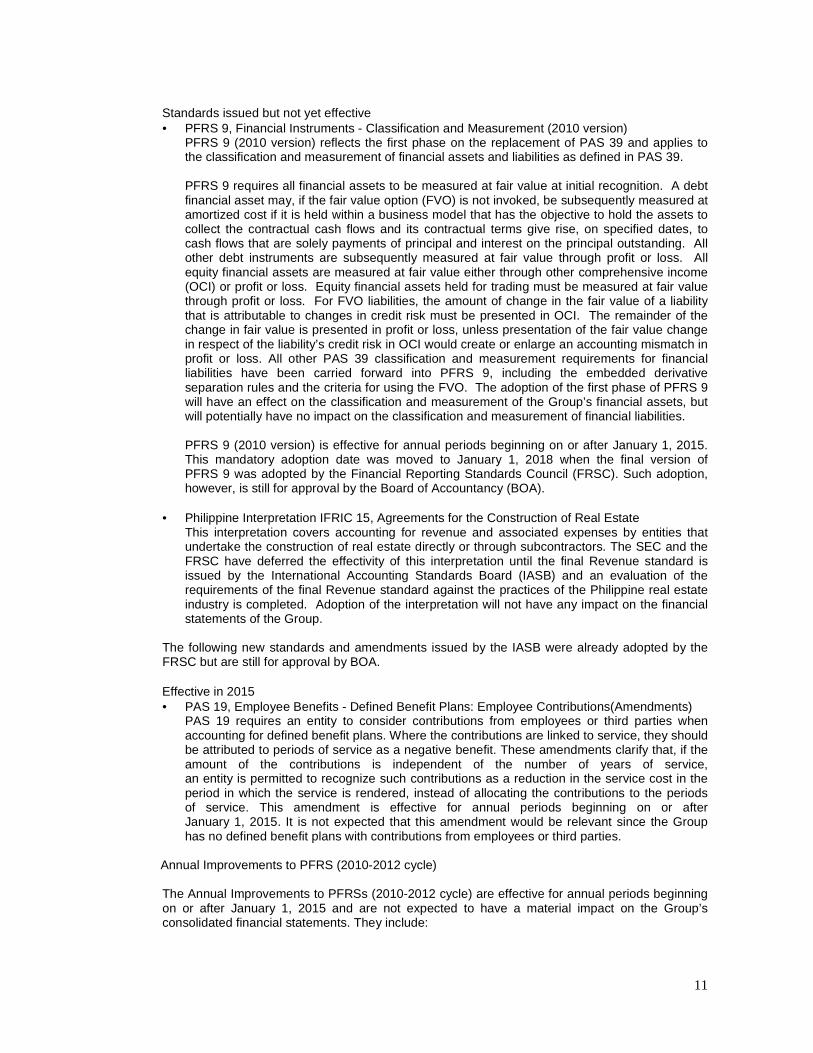
Standards issued but not yet effective • PFRS 9, Financial Instruments - Classification and Measurement (2010 version)
PFRS 9 (2010 version) reflects the first phase on the replacement of PAS 39 and applies to the classification and measurement of financial assets and liabilities as defined in PAS 39. PFRS 9 requires all financial assets to be measured at fair value at initial recognition. A debt financial asset may, if the fair value option (FVO) is not invoked, be subsequently measured at amortized cost if it is held within a business model that has the objective to hold the assets to collect the contractual cash flows and its contractual terms give rise, on specified dates, to cash flows that are solely payments of principal and interest on the principal outstanding. All other debt instruments are subsequently measured at fair value through profit or loss. All equity financial assets are measured at fair value either through other comprehensive income (OCI) or profit or loss. Equity financial assets held for trading must be measured at fair value through profit or loss. For FVO liabilities, the amount of change in the fair value of a liability that is attributable to changes in credit risk must be presented in OCI. The remainder of the change in fair value is presented in profit or loss, unless presentation of the fair value change in respect of the liability’s credit risk in OCI would create or enlarge an accounting mismatch in profit or loss. All other PAS 39 classification and measurement requirements for financial liabilities have been carried forward into PFRS 9, including the embedded derivative separation rules and the criteria for using the FVO. The adoption of the first phase of PFRS 9 will have an effect on the classification and measurement of the Group’s financial assets, but will potentially have no impact on the classification and measurement of financial liabilities. PFRS 9 (2010 version) is effective for annual periods beginning on or after January 1, 2015. This mandatory adoption date was moved to January 1, 2018 when the final version of PFRS 9 was adopted by the Financial Reporting Standards Council (FRSC). Such adoption, however, is still for approval by the Board of Accountancy (BOA).
• Philippine Interpretation IFRIC 15, Agreements for the Construction of Real Estate
This interpretation covers accounting for revenue and associated expenses by entities that undertake the construction of real estate directly or through subcontractors. The SEC and the FRSC have deferred the effectivity of this interpretation until the final Revenue standard is issued by the International Accounting Standards Board (IASB) and an evaluation of the requirements of the final Revenue standard against the practices of the Philippine real estate industry is completed. Adoption of the interpretation will not have any impact on the financial statements of the Group.
The following new standards and amendments issued by the IASB were already adopted by the FRSC but are still for approval by BOA.
Effective in 2015 • PAS 19, Employee Benefits - Defined Benefit Plans: Employee Contributions(Amendments)
PAS 19 requires an entity to consider contributions from employees or third parties when accounting for defined benefit plans. Where the contributions are linked to service, they should be attributed to periods of service as a negative benefit. These amendments clarify that, if the amount of the contributions is independent of the number of years of service, an entity is permitted to recognize such contributions as a reduction in the service cost in the period in which the service is rendered, instead of allocating the contributions to the periods of service. This amendment is effective for annual periods beginning on or after January 1, 2015. It is not expected that this amendment would be relevant since the Group has no defined benefit plans with contributions from employees or third parties.
Annual Improvements to PFRS (2010-2012 cycle) The Annual Improvements to PFRSs (2010-2012 cycle) are effective for annual periods beginning on or after January 1, 2015 and are not expected to have a material impact on the Group’s consolidated financial statements. They include:
12
• PFRS 8, Operating Segments - Aggregation of Operating Segments and Reconciliation of the Total of the Reportable Segments’ Assets to the Entity’s Assets The amendments are applied retrospectively and clarify that: a. An entity must disclose the judgments made by management in applying the aggregation
criteria in the standard, including a brief description of operating segments that have been aggregated and the economic characteristics (e.g., sales and gross margins) used to assess whether the segments are ‘similar’.
b. The reconciliation of segment assets to total assets is only required to be disclosed if the reconciliation is reported to the chief operating decision maker, similar to the required disclosure for segment liabilities.
• PAS 16, Property, Plant and Equipment and PAS 38, Intangible Assets - Revaluation Method - Proportionate Restatement of Accumulated Depreciation and Amortization The amendment is applied retrospectively and clarifies in PAS 16 and PAS 38 that the asset may be revalued by reference to the observable data on either the gross or the net carrying amount. In addition, the accumulated depreciation or amortization is the difference between the gross and carrying amounts of the asset.
• PAS 24, Related Party Disclosures - Key Management Personnel
The amendment is applied retrospectively and clarifies that a management entity, which is an entity that provides key management personnel services, is a related party subject to the related party disclosures. In addition, an entity that uses a management entity is required to disclose the expenses incurred for management services.
Annual Improvements to PFRS (2011-2013 cycle) The Annual Improvements to PFRSs (2011-2013 cycle) are effective for annual periods beginning on or after January 1, 2015 and are not expected to have a material impact on the Group’s consolidated financial statements. They include:
• PFRS 13, Fair Value Measurement - Portfolio Exception
The amendment is applied prospectively and clarifies that the portfolio exception in PFRS 13 can be applied not only to financial assets and financial liabilities, but also to other contracts within the scope of PAS 39.
• PAS 40, Investment Property
The amendment is applied prospectively and clarifies that PFRS 3, and not the description of ancillary services in PAS 40, is used to determine if the transaction is the purchase of an asset or business combination. The description of ancillary services in PAS 40 only differentiates between investment property and owner-occupied property (i.e., property, plant and equipment).
Annual Improvements to PFRSs (2012-2014 cycle) The Annual Improvements to PFRSs (2012-2014 cycle) are effective for annual periods beginning on or after January 1, 2016 and are not expected to have a material impact on the Group’s consolidated financial statements. They include:
• PFRS 5, Non-current Assets Held for Sale and Discontinued Operations - Changes in
Methods of Disposal The amendment is applied prospectively and clarifies that changing from a disposal through sale to a disposal through distribution to owners and vice-versa should not be considered to be a new plan of disposal, rather it is a continuation of the original plan. There is, therefore, no interruption of the application of the requirements in PFRS 5. The amendment also clarifies that changing the disposal method does not change the date of classification.
13
• PFRS 7 - Applicability of the Amendments to PFRS 7 to Condensed Interim Financial Statements This amendment is applied retrospectively and clarifies that the disclosures on offsetting of financial assets and financial liabilities are not required in the condensed interim financial report unless they provide a significant update to the information reported in the most recent annual report.
• PAS 34, Interim Financial Reporting - Disclosure of Information ‘Elsewhere in the Interim Financial Report’ The amendment is applied retrospectively and clarifies that the required interim disclosures must either be in the interim financial statements or incorporated by cross-reference between the interim financial statements and wherever they are included within the greater interim financial report (e.g., in the management commentary or risk report).
The Group continues to assess the impact of the above new and amended accounting standards and interpretations effective subsequent to the December 31, 2014 consolidated financial statements. Additional disclosures required by these amendments will be included in the consolidated financial statements when these amendments are adopted.
Basis of Consolidation The consolidated financial statements comprise the financial statements of the Company and its subsidiaries. Control is achieved when the Group is exposed, or has rights, to variable returns from its involvement with the investee and has the ability to affect those returns through its power over the investee. Specifically, the Group controls an investee if and only if the Group has: • Power over the investee (i.e. existing rights that give it the current ability to direct the relevant
activities of the investee); • Exposure, or rights, to variable returns from its involvement with the investee; and • The ability to use its power over the investee to affect its returns. When the Group has less than a majority of the voting or similar rights of an investee, the Group considers all relevant facts and circumstances in assessing whether it has power over an investee, including: • The contractual arrangement with the other vote holders of the investee • Rights arising from other contractual arrangements • The Group’s voting rights and potential voting rights
The Group reassesses whether or not it controls an investee if facts and circumstances indicate that there are changes to one or more of the three elements of control. Consolidation of a subsidiary begins when the Group obtains control over the subsidiary and ceases when the Group loses control of the subsidiary. Assets, liabilities, income and expenses of a subsidiary acquired or disposed of during the year are included in the consolidated financial statements from the date the Group gains control until the date the Group ceases to control the subsidiary.
When necessary, adjustments are made to the financial statements of subsidiaries to bring their accounting policies into line with the Group’s accounting policies. All intra-group assets and liabilities, equity, income, expenses and cash flows relating to transactions between members of the Group are eliminated in full on consolidation. A change in the ownership interest of a subsidiary, without a loss of control, is accounted for as an equity transaction. If the Company loses control over a subsidiary, it:
• Derecognizes the assets (including goodwill) and liabilities of the subsidiary • Derecognizes the carrying amount of any non-controlling interests • Derecognizes the cumulative translation differences recorded in equity
14
• Recognizes the fair value of the consideration received • Recognizes the fair value of any investment retained • Recognizes any surplus or deficit in profit or loss • Reclassifies the Company’s share of components previously recognized in OCI to profit or
loss or retained earnings, as appropriate, as would be required if the Company had directly disposed of the related assets or liabilities
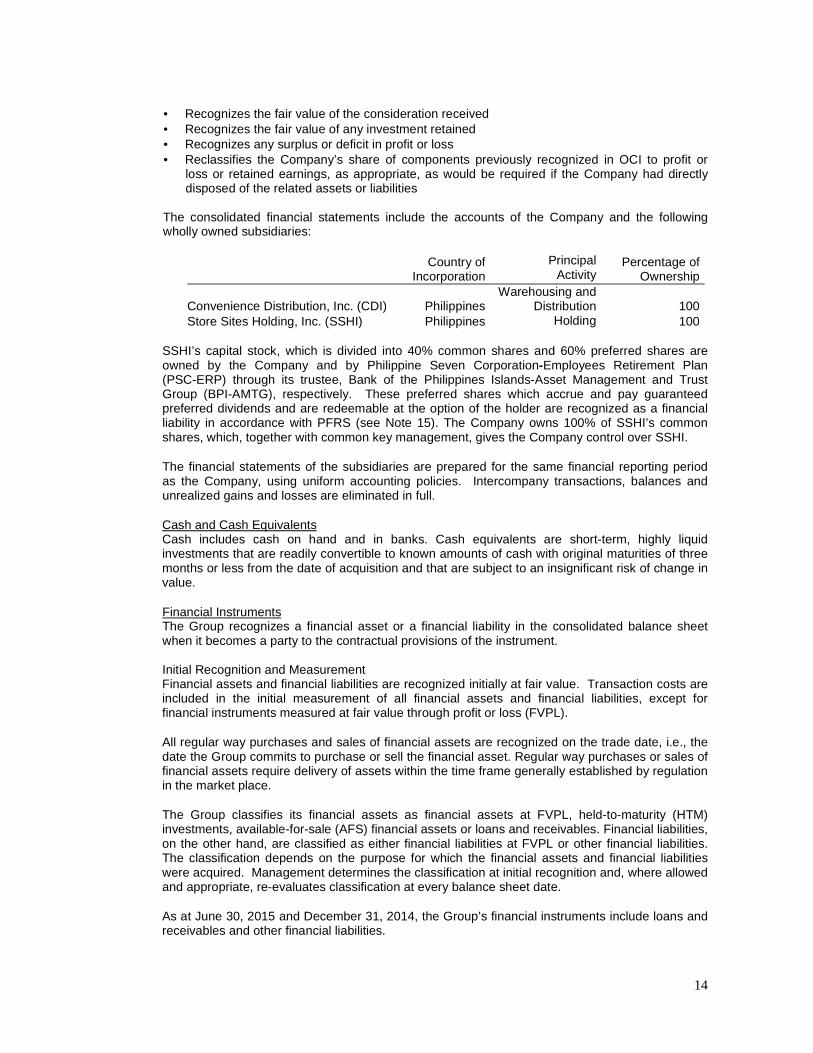
The consolidated financial statements include the accounts of the Company and the following wholly owned subsidiaries:
Country of
Incorporation Principal
Activity Percentage of
Ownership
Convenience Distribution, Inc. (CDI) Philippines Warehousing and
Distribution 100 Store Sites Holding, Inc. (SSHI) Philippines Holding 100
SSHI’s capital stock, which is divided into 40% common shares and 60% preferred shares are owned by the Company and by Philippine Seven Corporation-Employees Retirement Plan (PSC-ERP) through its trustee, Bank of the Philippines Islands-Asset Management and Trust Group (BPI-AMTG), respectively. These preferred shares which accrue and pay guaranteed preferred dividends and are redeemable at the option of the holder are recognized as a financial liability in accordance with PFRS (see Note 15). The Company owns 100% of SSHI’s common shares, which, together with common key management, gives the Company control over SSHI.
The financial statements of the subsidiaries are prepared for the same financial reporting period as the Company, using uniform accounting policies. Intercompany transactions, balances and unrealized gains and losses are eliminated in full.
Cash and Cash Equivalents Cash includes cash on hand and in banks. Cash equivalents are short-term, highly liquid investments that are readily convertible to known amounts of cash with original maturities of three months or less from the date of acquisition and that are subject to an insignificant risk of change in value.
Financial Instruments The Group recognizes a financial asset or a financial liability in the consolidated balance sheet when it becomes a party to the contractual provisions of the instrument.
Initial Recognition and Measurement Financial assets and financial liabilities are recognized initially at fair value. Transaction costs are included in the initial measurement of all financial assets and financial liabilities, except for financial instruments measured at fair value through profit or loss (FVPL).
All regular way purchases and sales of financial assets are recognized on the trade date, i.e., the date the Group commits to purchase or sell the financial asset. Regular way purchases or sales of financial assets require delivery of assets within the time frame generally established by regulation in the market place.
The Group classifies its financial assets as financial assets at FVPL, held-to-maturity (HTM) investments, available-for-sale (AFS) financial assets or loans and receivables. Financial liabilities, on the other hand, are classified as either financial liabilities at FVPL or other financial liabilities. The classification depends on the purpose for which the financial assets and financial liabilities were acquired. Management determines the classification at initial recognition and, where allowed and appropriate, re-evaluates classification at every balance sheet date.
As at June 30, 2015 and December 31, 2014, the Group’s financial instruments include loans and receivables and other financial liabilities.

15
Loans and Receivables Loans and receivables are non-derivative financial assets with fixed or determinable payments that are not quoted in an active market. They are not entered into with the intention of immediate or short-term resale and are not classified as financial assets at FVPL, HTM investments or AFS financial assets. After initial measurement, loans and receivables are subsequently measured at amortized cost using the effective interest method, less impairment. The amortization is included as part of interest income in the consolidated statement of comprehensive income. Losses arising from impairment are recognized in the consolidated statement of comprehensive income. Loans and receivables are classified as current assets if maturity is within 12 months from balance sheet date. Otherwise, these are classified as noncurrent assets.
The Group’s loans and receivables consists of cash and cash equivalents, short-term investment, receivables and deposits(excluding rent deposits) as at June 30, 2015 and December 31, 2014(see Notes4,5,9 and 10).
Other Financial Liabilities This category pertains to financial liabilities that are neither held-for-trading nor designated as at FVPL upon the inception of the liability. Other financial liabilities are subsequently carried at amortized cost, taking into account the impact of applying the effective interest rate method of amortization (or accretion) for any related premium, discount and any directly attributable transaction costs.
Other financial liabilities are classified as current liabilities if maturity is within the normal operating cycle of the Company and it does not have unconditional right to defer settlement of the liability for at least 12 months from balance sheet date. Otherwise, these are classified as noncurrent liabilities.
The Group’s other financial liabilities consist of bank loans, accounts payable and accrued expenses, other current liabilities (excluding statutory liabilities), and cumulative redeemable preferred shares as at June 30, 2015 and December 31, 2014 (see Notes11, 12, 13 and 15).
Classification of Financial Instruments Between Liability and Equity A financial instrument is classified as liability if it provides for a contractual obligation to: • deliver cash or another financial asset to another entity; or • exchange financial assets or financial liabilities with another entity under conditions that are
potentially unfavorable to the Group; or • satisfy the obligation other than by the exchange of a fixed amount of cash or another financial
asset for a fixed number of own equity shares.
If the Group does not have an unconditional right to avoid delivering cash or another financial asset to settle its contractual obligation, the obligation meets the definition of a financial liability. The components of issued financial instruments that contain both liability and equity elements are accounted for separately, with the equity component being assigned the residual amount after deducting from the instrument as a whole the amount separately determined as the fair value of the liability component on the date of issue.
Determination of Fair Value Fair value is the price that would be received to sell an asset or paid to transfer a liability in an orderly transaction between market participants at the measurement date. The fair value measurement is based on the presumption that the transaction to sell the asset or transfer the liability takes place either: • In the principal market for the asset or liability, or • In the absence of a principal market, in the most advantageous market for the asset or liability
The principal or the most advantageous market must be accessible to by the Group.
16
The fair value of an asset or a liability is measured using the assumptions that market participants would use when pricing the asset or liability, assuming that market participants act in their economic best interest. A fair value measurement of a non-financial asset takes into account a market participant’s ability to generate economic benefits by using the asset in its highest and best use or by selling it to another market participant that would use the asset in its highest and best use. All assets and liabilities for which fair value is measured or disclosed in the financial statements are categorized within the fair value hierarchy, described, as follows, based on lowest level of input that is significant to the fair value measurement as a whole: • Level 1 - quoted (unadjusted) prices in active markets for identical assets or liabilities • Level 2 - valuation techniques for which the lowest level input that is significant to the fair
value measurement is directly or indirectly observable • Level 3 - valuation techniques for which the lowest level input that is significant to the fair
value measurement is unobservable
Offsetting Financial Instruments Financial assets and financial liabilities are offset and the net amount is reported in the consolidated balance sheet if, and only if, there is a currently enforceable legal right to offset the recognized amounts and there is an intention to settle on a net basis, or to realize the asset and settle the liability simultaneously. Impairment of Financial Assets The Group assesses at each balance sheet date whether a financial asset or a group of financial assets is impaired.
Financial Assets Carried at Amortized Cost The Group first assesses whether objective evidence of impairment exists for financial assets that are individually significant and collectively for financial assets that are not individually significant. Objective evidence includes observable data that comes to the attention of the Group about loss events such as but not limited to significant financial difficulty of the counterparty, a breach of contract, such as a default or delinquency in interest or principal payments, probability that the borrower will enter bankruptcy or other financial reorganization. If it is determined that no objective evidence of impairment exists for an individually or collectively assessed financial asset, whether significant or not, the asset is included in the group of financial assets with similar credit risk characteristics and that group of financial assets is collectively assessed for impairment. Assets that are individually assessed for impairment and for which an impairment loss is or continue to be recognized are not included in a collective assessment of impairment. The impairment assessment is performed at each balance sheet date. For the purpose of a collective evaluation of impairment, financial assets are grouped on the basis of such credit risk characteristics such as customer type, payment history, past-due status and term. If there is objective evidence that an impairment loss on loans and receivables has been incurred, the amount of impairment loss is measured as the difference between the financial asset’s carrying amount and the present value of estimated future cash flows (excluding future expected credit losses that have not been incurred) discounted at the financial asset’s original effective interest rate (i.e., the effective interest rate computed at initial recognition). The carrying amount of the asset is reduced by the impairment loss, which is recognized in profit or loss.
Loans and receivables, together with the related allowance, are written off when there is no realistic prospect of future recovery and all collateral has been realized. If, in a subsequent period, the amount of the impairment loss decreases and the decrease can be related objectively to an event occurring after the impairment was recognized, the previously recognized impairment loss is reversed. Any subsequent reversal of an impairment loss is recognized in profit or loss, to the extent that the carrying value of the asset does not exceed its amortized cost at the reversal date.

17
Derecognition of Financial Assets and Liabilities Financial Assets A financial asset (or, where applicable, a part of a financial asset or a part of a group of similar financial assets) is derecognized when:
• the right to receive cash flows from the asset has expired; • the Group retains the right to receive cash flows from the asset, but has assumed an
obligation to pay them in full without material delay to a third party under a pass-through arrangement; or
• the Group has transferred its right to receive cash flows from the asset and either (a) has transferred substantially all the risks and rewards of the asset, or (b) has neither transferred nor retained substantially all risks and rewards of the asset, but has transferred control of the asset.
Where the Group has transferred its rights to receive cash flows from an asset and has neither transferred nor retained substantially all the risks and rewards of the asset nor transferred control of the asset, the asset is recognized to the extent of the Group’s continuing involvement in the asset. Continuing involvement that takes the form of a guarantee over the transferred asset is measured at the lower of the original carrying amount of the asset and the maximum amount of consideration that the Group could be required to repay.
Financial Liabilities A financial liability is derecognized when the obligation under the liability is discharged, cancelled or has expired.
Where an existing financial liability is replaced by another from the same lender on substantially different terms, or the terms of an existing liability are substantially modified, such an exchange or modification is treated as a derecognition of the original liability and the recognition of a new liability, and the difference in the respective carrying amounts is recognized in profit or loss.
Inventories Inventories are stated at the lower of cost and net realizable value (NRV). Cost of inventories is determined using the first-in, first-out method. NRV is the selling price in the ordinary course of business, less the estimated cost of marketing and distribution.
Prepayments and Other Current Assets Prepayments and other current assets are primarily comprised of advances to suppliers, deferred input value-added tax (VAT), prepaid rent and prepaid store expenses. Prepayments and other current assets that are expected to be realized for no more than 12 months after the balance sheet date are classified as current assets; otherwise, these are classified as other noncurrent assets. These are recorded as assets and expensed when utilized or expired.
Advances to suppliers are down payments for acquisitions of property and equipment not yet received. Once the property and equipment are received, the asset is recognized together with the corresponding liability. These are stated at cost less any impairment in value.
Property and Equipment Property and equipment, except for land, are carried at cost less accumulated depreciation and amortization, and any impairment in value.
The initial cost of property and equipment consists of its purchase price and any directly attributable costs of bringing the asset to its working condition and location for its intended use. Expenditures incurred after the assets have been put into operation, such as repairs and maintenance and overhaul costs, are recognized in profit or loss in the period in which the costs are incurred. In situations where it can be clearly demonstrated that the expenditures have resulted in an increase in the future economic benefits expected to be obtained from the use of an item of property and equipment beyond its originally assessed standard of performance, the expenditures are capitalized as an additional cost of the assets.

18
Construction in-progress includes cost of construction and other direct costs and is stated at cost less any impairment in value. Construction in-progress is not depreciated until such time the relevant assets are completed and put into operational use.
Depreciation and amortization commence once the assets are available for use. It ceases at the earlier of the date that it is classified as noncurrent asset held-for-sale and the date the asset is derecognized.
Depreciation is computed on a straight-line method over the estimated useful lives of the assets as follows:
Years Buildings and improvements 10 to 12 Store furniture and equipment 5 to 10 Office furniture and equipment 3 to 5 Transportation equipment 3 to 5 Computer equipment 3
Leasehold improvements are amortized over the estimated useful life of the improvements, ranging from five to ten years, or the term of the lease, whichever is shorter.
The assets’ estimated useful lives and depreciation and amortization method are reviewed periodically to ensure that the period and method of depreciation and amortization are consistent with the expected pattern of economic benefits from the items of property and equipment. When assets are retired or otherwise disposed of, the cost or revalued amount and the related accumulated depreciation and amortization and any impairment in value are removed from the accounts and any resulting gain or loss is recognized in profit or loss. The revaluation increment in equity relating to the revalued asset sold is transferred to retained earnings.
Fully depreciated assets are retained in the books until disposed.
Land is carried at revalued amount less any impairment in value. Revaluations shall be made with sufficient regularity to ensure that the carrying amount does not differ materially from that which would be determined using fair value at the end of the financial reporting period. When the fair value of a revalued land differs materially from its carrying amount, a further revaluation is required.
A revaluation surplus is recorded in OCI and credited to the “Revaluation increment on land - net of deferred income tax liability” account in equity. However, to the extent that the Group reverses a revaluation deficit of the same asset previously recognized in profit or loss, the increase is recognized in profit or loss. A revaluation deficit is recognized in the profit or loss, except to the extent that it offsets an existing surplus on the same asset recognized in “Revaluation increment on land -net of deferred income tax liability” account in equity.
Deposits Deposits are amounts paid as guarantee in relation to non cancelable lease agreements entered into by the Group. These deposits are recognized at cost and can be refunded or applied to future billings.
Intangible Assets Intangible assets acquired separately are measured on initial recognition at cost. Following initial recognition, intangible assets are carried at cost less accumulated amortization and any accumulated impairment loss, if any. Internally-generated intangible assets, if any, excluding capitalized development costs, are not capitalized and expenditure is reflected in profit or loss in which the expenditure is incurred.
The useful lives of intangible assets are assessed to be either finite or indefinite. Intangible assets with finite lives are amortized over the useful economic life and assessed for impairment whenever there is an indication that the intangible asset may be impaired. The amortization period and amortization method for an intangible asset with a finite useful life is reviewed at least at each
19
balance sheet date. Changes in the expected useful life or the expected pattern of consumption of future economic benefits embodied in the asset is accounted for by changing the amortization period or method, as appropriate, and treated as changes in accounting estimates. The amortization expense on intangible assets with finite lives is recognized in profit or loss in the expense category consistent with the function of the intangible asset. Intangible assets with indefinite useful lives are tested for impairment annually at the CGU level and are not amortized. The useful life of an intangible asset with an indefinite life is reviewed annually to determine whether indefinite useful life assessment continues to be supportable. If not, the change in the useful life assessment from indefinite to finite is made on a prospective basis. Gains or losses arising from derecognition of an intangible asset are measured as the difference between the net disposal proceeds, if any, and the carrying amount of the asset and are recognized in profit or loss when the asset is derecognized.
Software and Program Cost Software and program cost, which are not specifically identifiable and integral to a specific computer hardware, are shown under “Goodwill and other noncurrent assets” in the consolidated balance sheet. These are carried at cost, less accumulated amortization and any impairment in value. Amortization is computed on a straight-line method over their estimated useful life of five years.
Goodwill Goodwill, included in “Goodwill and other noncurrent assets” account in the consolidated balance sheet, represents the excess of the cost of an acquisition over the fair value of the businesses acquired. Following initial recognition, goodwill is measured at cost less any accumulated impairment losses.
Impairment of Non-financial Assets The Group assesses at each balance sheet date whether there is an indication that its non-financial assets such as property and equipment, rent deposits and intangible assets may be impaired. If any such indication exists, or when annual impairment testing for an asset is required, the Group makes an estimate of the asset’s recoverable amount. An asset’s recoverable amount is the higher of an asset’s or CGU’s fair value less costs to sell and its value-in-use and is determined for an individual asset, unless the asset does not generate cash inflows that are largely independent of those from other assets or groups of assets. For land, the asset’s recoverable amount is the higher of the land’s net selling price, which may be obtained from its sale in an arm’s-length transaction, and its value-in-use. For goodwill, the asset’s recoverable amount is its value-in-use. Where the carrying amount of an asset exceeds its recoverable amount, the asset is considered impaired and is written down to its recoverable amount. In assessing value-in-use, the estimated future cash flows are discounted to their present value, using a pre-tax discount rate that reflects current market assessments of the time value of money and risks specific to the asset. Impairment losses, if any, are recognized in profit or loss, except for revalued land when revaluation was taken to OCI. In this case, the impairment is also recognized in OCI up to the amount of any previous revaluation.
For non-financial assets, excluding goodwill, an assessment is made at each balance sheet date as to whether there is any indication that previously recognized impairment losses may no longer exist or may have decreased. If such indication exists, the recoverable amount is estimated. A previously recognized impairment loss is reversed only if there has been a change in the estimates used to determine the asset’s recoverable amount since the last impairment loss was recognized. If that is the case, the carrying amount of the asset is increased to its recoverable amount. That increased amount cannot exceed the carrying amount that would have been determined, net of depreciation and amortization, had no impairment loss been recognized for the asset in previous years. Such reversal is recognized in profit or loss, unless the asset is carried at revalued amount, in which case, the reversal is treated as a revaluation increase. After such reversal, the depreciation charge is adjusted in the future periods to allocate the asset’s revised carrying amount, less any residual value, on a systematic basis over its remaining useful life.

20
Goodwill is reviewed for impairment, annually or more frequently if event or changes in circumstances indicate that the carrying value may be impaired. Impairment is determined for goodwill by assessing the recoverable amount of the CGU or group of CGUs to which the goodwill relates. Where the recoverable amount of the CGU or group of CGUs is less than the carrying amount of the CGU or group of CGUs to which goodwill has been allocated, an impairment loss is recognized. Impairment losses relating to goodwill cannot be reversed in future periods.
Deposits Payable Deposits payable are amounts received from franchisees, store operators and sublessees as guarantee in relation to various agreements entered into by the Group. These deposits are recognized at cost and payable or applied to future billings.
Cumulative Redeemable Preferred Shares Cumulative redeemable preferred shares that exhibit characteristics of a liability is recognized as a financial liability in the consolidated balance sheet, net of transaction cost. The corresponding dividends on those shares are charged as interest expense in profit or loss.
Deferred Revenue Deferred revenue is recognized for cash received for income not yet earned. Deferred revenue is recognized as revenue over the life of the revenue contract or upon delivery of goods or services.
Equity Common Stock Common stock is measured at par value for all shares issued and outstanding.
Additional Paid-in Capital When the shares are sold at premium, the difference between the proceeds and the par value is credited to the “Additional paid-in capital” account. When shares are issued for a consideration other than cash, the proceeds are measured by the fair value of the consideration received. In case the shares are issued to extinguish or settle the liability of the Group, the shares shall be measured either at the fair value of the shares issued or fair value of the liability settled, whichever is more reliably determinable.
Retained Earnings Retained earnings represent the cumulative balance of periodic net income or loss and changes in accounting policy. When the retained earnings account has a debit balance, it is called “deficit.” A deficit is not an asset but a deduction from equity.
Stock Dividends Stock dividends are distribution of the earnings in the form of own shares. When stock dividends are declared, the amount of stock dividends is transferred from retained earnings to capital stock.
Treasury Stock Treasury stock is stated at acquisition cost and is deducted from equity. No gain or loss is recognized in profit or loss on the purchase, sale, issuance or cancellation of the Group’s own equity instruments.
OCI OCI comprises of items of income and expenses that are not recognized in profit or loss as required or permitted by other PFRS. The Group’s OCI pertains to actuarial gains and losses from pension benefits and revaluation increment on land which are recognized in full in the period in which they occur. Revenue Recognition Revenue is recognized to the extent that it is probable that the economic benefits will flow to the Group and the amount of revenue can be measured reliably. The Group has assessed its revenue arrangements against the criteria enumerated under PAS 18, Revenue Recognition, and concluded that it is acting as principal in all arrangements, except for its sale of consigned goods.

21
The following specific recognition criteria must also be met before revenue is recognized:
Merchandise Sales Revenue from merchandise sales is recognized when the significant risks and rewards of ownership of the goods have passed to the buyer. Revenue is measured at the fair value of the consideration received, excluding discounts, returns, rebates and sales taxes.
The Group operates a customer loyalty programme, Every Day! Rewards, which allows customers to accumulate points when they purchase products in the stores. The points can be redeemed for free products, subject to a minimum number of points being obtained.
Consideration received is allocated between the products sold and the points issued, with the consideration allocated to the points equal to their fair value. Fair value of the points is equal to the retail value of the products that can be redeemed multiplied by the redemption rate. The fair value of the points issued is deferred (included as part of “Other current liabilities” account in the consolidated balance sheet) and recognized as revenue when the points are redeemed.
Franchise Franchise fee is recognized upon execution of the franchise agreement and performance of initial services required under the franchise agreement. Franchise revenue is recognized in the period earned.
Marketing Marketing income is recognized when service is rendered. In case of marketing support funds, revenue is recognized upon start of promotional activity for the suppliers.
Rental Rental income is accounted for on a straight-line basis over the term of the lease.
Commission Commission income is recognized upon the sale of consigned goods.
Interest Interest income is recognized as it accrues based on the effective interest rate method.
Other Income Other income is recognized when there are incidental economic benefits, other than the usual business operations, that will flow to the Group and can be measured reliably.
Costs and Expenses Recognition Costs of merchandise sold are recognized in profit or loss at the point of sale. Expenses are recognized in profit or loss upon utilization of the services or when they are incurred.
Retirement Benefits The net defined benefit liability or asset is the aggregate of the present value of the defined benefit obligation at the end of the financial reporting period reduced by the fair value of plan assets (if any), adjusted for any effect of limiting a net defined benefit asset to the asset ceiling. The asset ceiling is the present value of any economic benefits available in the form of refunds from the plan or reductions in future contributions to the plan.
The cost of providing benefits under the defined benefit plans is actuarially determined using the projected unit credit method.
Net retirement benefits cost comprises the following: • Service cost • Net interest on the net defined benefit liability or asset • Remeasurements of net defined benefit liability or asset
22
Service costs which include current service costs, past service costs and gains or losses on non-routine settlements are recognized as expense in profit or loss. Past service costs are recognized when plan amendment or curtailment occurs. These amounts are calculated periodically by independent qualified actuaries.
Net interest on the net defined benefit liability or asset is the change during the period in the net defined benefit liability or asset that arises from the passage of time which is determined by applying the discount rate based on government bonds to the net defined benefit liability or asset. Net interest on the net defined benefit liability or asset is recognized as expense or income in profit or loss.
Remeasurements comprising actuarial gains and losses, return on plan assets and any change in the effect of the asset ceiling (excluding net interest on defined benefit liability) are recognized immediately in OCI in the period in which they arise. Remeasurements are not reclassified to profit or loss in subsequent periods.
Plan assets are assets that are held by a long-term employee benefit fund or qualifying insurance policies. Plan assets are not available to the creditors of the Group, nor can they be paid directly to the Group. Fair value of plan assets is based on market price information. When no market price is available, the fair value of plan assets is estimated by discounting expected future cash flows using a discount rate that reflects both the risk associated with the plan assets and the maturity or expected disposal date of those assets (or, if they have no maturity, the expected period until the settlement of the related obligations). If the fair value of the plan assets is higher than the present value of the defined benefit obligation, the measurement of the resulting defined benefit asset is limited to the present value of economic benefits available in the form of refunds from the plan or reductions in future contributions to the plan.
The Group’s right to be reimbursed of some or all of the expenditure required to settle a defined benefit obligation is recognized as a separate asset at fair value when and only when reimbursement is virtually certain.
Termination Benefit Termination benefits are employee benefits provided in exchange for the termination of an employee’s employment as a result of either an entity’s decision to terminate an employee’s employment before the normal retirement date or an employee’s decision to accept an offer of benefits in exchange for the termination of employment. A liability and expense for a termination benefit is recognized at the earlier of when the entity can no longer withdraw the offer of those benefits and when the entity recognizes related restructuring costs. Initial recognition and subsequent changes to termination benefits are measured in accordance with the nature of the employee benefit, as either post-employment benefits, short-term employee benefits, or other long-term employee benefits. Employee Leave Entitlement
Employee entitlements to annual leave are recognized as a liability when they are accrued to the employees. The undiscounted liability for leave expected to be settled wholly before twelve months after the end of the annual reporting period is recognized for services rendered by employees up to the end of the reporting period. Leases Finance leases, which transfer to the lessee substantially all the risks and rewards of ownership of the asset, are capitalized at the inception of the lease at the fair value of the leased property or, if lower, at the present value of the minimum lease payments. Lease payments are apportioned between the interest income and reduction of the lease receivable so as to achieve a constant rate of interest on the remaining balance of the receivable. Interest income is recognized directly in profit or loss.

23
Leases where the lessor retains substantially all the risks and rewards of ownership of the asset are classified as operating leases. Operating leases are recognized as an expense in profit or loss on a straight-line basis over the lease term.
The determination of whether an arrangement is, or contains a lease is based on the substance of the arrangement and requires an assessment of whether the fulfillment of the arrangement is dependent on the use of a specific asset or assets and the arrangement conveys a right to use the asset. A reassessment is made after inception of the lease only if one of the following applies: a. there is a change in contractual terms, other than a renewal or extension of the arrangement;
or b. a renewal option is exercised or extension is granted, unless the term of the renewal or
extension was initially included in the lease term; or c. there is a change in the determination of whether fulfillment is dependent on a specified asset;
or d. there is a substantial change to the asset. Where a reassessment is made, lease accounting shall commence or cease from the date when the change in circumstance gave rise to the reassessment for scenarios (a), (c) or (d) above, and the date of renewal or extension for scenario (b).
Borrowing Costs Borrowing costs directly attributable to the acquisition, construction or production of an asset that necessarily takes a substantial period of time to get ready for its intended use or sale are capitalized as part of the cost of the respective assets. All other borrowing costs are expensed in the period they occur. Borrowing costs consist of interest and other costs that an entity incurs in connection with the borrowing of funds. Foreign Currency-denominated Transactions The consolidated financial statements are presented in Philippine Peso, which is the Parent Company’s functional and presentation currency. All subsidiaries evaluate their primary economic and operating environment and determine their functional currency. Transactions in foreign currency are initially recorded at the exchange rate at the date of transaction. Outstanding foreign currency-denominated monetary assets and liabilities are translated using the applicable exchange rate at balance sheet date. Exchange differences arising from translation of foreign currency monetary items at rates different from those at which they were originally recorded are recognized in profit or loss.
Taxes Current Income Tax Current income tax assets and liabilities for the current and prior periods are measured at the amount expected to be recovered from or paid to the taxation authorities. The tax rates and tax laws used to compute the amount are those that have been enacted or substantively enacted at the balance sheet date.
Deferred Income Tax Deferred income tax is recognized for all temporary differences at the balance sheet date between the tax bases of assets and liabilities and their carrying amounts for financial reporting purposes.
Deferred income tax liabilities are recognized for all taxable temporary differences. Deferred income tax assets are recognized for all deductible temporary differences to the extent that it is probable that sufficient future taxable profits will be available against which the deductible temporary differences can be utilized.
Deferred income tax relating to items recognized outside profit or loss is recognized outside profit or loss. Deferred income tax items are recognized in correlation to the underlying transaction either in OCI or directly in equity.

24
The carrying amount of deferred income tax assets is reviewed at each balance sheet date and reduced to the extent that it is no longer probable that sufficient future taxable profits will be available to allow all or part of the deferred income tax assets to be utilized. Unrecognized deferred income tax assets are reassessed at each balance sheet date and are recognized to the extent that it has become probable that sufficient future taxable profits will allow the deferred income tax assets to be recovered.
Deferred income tax assets and liabilities are measured at the tax rates that are expected to apply to the period when the asset is realized or the liability is settled, based on tax rates and tax laws that have been enacted or substantively enacted at the balance sheet date.
Deferred income tax assets and liabilities are offset, if a legally enforceable right exists to set off current tax assets against current tax liabilities and the deferred income taxes relate to the same taxable entity and the same taxation authority.
VAT Input VAT is the 12% indirect tax paid by the Group in the course of the Group’s trade or business on local purchase of goods or services, including lease or use of property, from a VAT-registered entity. For acquisition of capital goods over P=1,000,000, the related input taxes are deferred and amortized over the useful life of the asset or 60 months, whichever is shorter, commencing on the date of acquisition. Deferred input VAT which is expected to be utilized for more than 12 months after the balance sheet date is included under “Goodwill and other noncurrent assets” account in the consolidated balance sheet.
Output VAT pertains to the 12% tax due on the sale of merchandise and lease or exchange of taxable goods or properties or services by the Group.
If at the end of any taxable month the output VAT exceeds the input VAT, the excess shall be paid by the Group. Any outstanding balance is included under “Other current liabilities” account in the consolidated balance sheet. If the input VAT exceeds the output VAT, the excess shall be carried over to the succeeding month or months. Excess input VAT is included under “Prepayments and other current assets” account in the consolidated balance sheet. Input VAT on capital goods may, at the option of the Group, be refunded or credited against other internal revenue taxes, subject to certain tax laws.
Revenue, expenses and assets are recognized net of the amount of VAT.
Earnings Per Share Basic earnings per share is calculated by dividing the net income or for the year attributable to common shareholders by the weighted average number of shares outstanding during the year, excluding treasury shares.
Diluted earnings per share is calculated by dividing the net income for the year attributable to common shareholders by the weighted average number of shares outstanding during the year, excluding treasury shares and adjusted for the effects of all potential dilutive common shares, if any.
In determining both the basic and diluted earnings per share, the effect of stock dividends, if any, is accounted for retrospectively.
Segment Reporting Operating segments are components of an entity for which separate financial information is available and evaluated regularly by management in deciding how to allocate resources and assessing performance. The Group considers the store operation as its primary activity and it’s only business segment. Franchising, renting of properties and commissioning on bills payment services are considered an integral part of the store operations.
25
Provisions Provisions are recognized when: (a) the Group has a present obligation (legal or constructive) as a result of a past event; (b) it is probable that an outflow of resources embodying economic benefits will be required to settle the obligation; and (c) a reliable estimate can be made of the amount of the obligation. If the effect of the time value of money is material, provisions are determined by discounting the expected future cash flows at a pre-tax rate that reflects current market assessments of the time value of money and, where appropriate, the risks specific to the liability. Where discounting is used, the increase in the provision due to the passage of time is recognized as interest expense. When the Group expects a provision or loss to be reimbursed, the reimbursement is recognized as a separate asset only when the reimbursement is virtually certain and its amount is estimable. The expense relating to any provision is presented in profit or loss, net of any reimbursement. Contingencies Contingent liabilities are not recognized in the consolidated financial statements. They are disclosed unless the possibility of an outflow of resources embodying economic benefits is remote. Contingent assets are not recognized in the consolidated financial statements but disclosed when an inflow of economic benefit is probable. Contingent assets are assessed continually to ensure that developments are appropriately reflected in the consolidated financial statements. If it has become virtually certain that an inflow of economic benefits will arise, the asset and the related income are recognized in the consolidated financial statements.
Events after the Balance Sheet Date Post year-end events that provide additional information about the Group’s position at the balance sheet date (adjusting events) are reflected in the consolidated financial statements. Post year-end events that are non-adjusting events are disclosed in the notes to the consolidated financial statements when material.
3. Use of Significant Accounting Judgments, Estimates and Assumptions
The preparation of the consolidated financial statements in accordance with PFRS requires management to make judgments, estimates and assumptions that affect the amounts reported in the consolidated financial statements and notes. The judgments, estimates and assumptions used in the consolidated financial statements are based upon management’s evaluation of relevant facts and circumstances as at balance sheet date. Future events may occur which can cause the assumptions used in arriving at those judgments, estimates and assumptions to change. The effects of any changes will be reflected in the consolidated financial statements of the Group as they become reasonably determinable.
Judgments In the process of applying the Group’s accounting policies, management has made the following judgments, apart from those involving estimations, which have the most significant effect on amounts recognized in the consolidated financial statements:
Determination of Functional Currency Based on the economic substance of the underlying circumstances relevant to the Group, the functional currency of the Group has been determined to be the Philippine Peso. The Philippine Peso is the currency of the primary economic environment in which the Group operates. It is the currency that mainly influences the revenue, costs and expenses of the Group.
Classification of Financial Instruments The Group classifies a financial instrument, or its components, on initial recognition as a financial asset, liability or equity instrument in accordance with the substance of the contractual arrangement and the definitions of a financial asset, liability or equity instrument. The substance of a financial instrument, rather than its legal form, governs its classification in the consolidated balance sheet.
26
Financial assets are classified as financial assets at FVPL, HTM investments, AFS financial assets and loans and receivables. Financial liabilities, on the other hand, are classified as financial liabilities at FVPL and other financial liabilities.
The Group classifies the cumulative redeemable preferred shares as liability in accordance with the redemption features contained in the shareholders agreement (see Note 15). The cumulative redeemable preferred shares are redeemable at the option of the holder.
The Group determines the classification at initial recognition and, where allowed and appropriate, re-evaluates this classification at every balance sheet date.
The Group’s financial instruments consist of loans and receivables and other financial liabilities (see Note 28).
Classification of Leases a. Finance lease as lessor
The Group entered into a sale and leaseback transaction with an armored car service provider where it has determined that the risks and rewards related to the armored vehicles leased out will be transferred to the lessee at the end of the lease term. As such, the lease agreement was accounted for as a finance lease (see Note 26).
b. Operating lease as lessee The Group entered into various property leases, where it has determined that the risks and rewards related to the properties are retained with the lessors. As such, the lease agreements were accounted for as operating leases (see Note 26).
c. Operating lease as lessor The Company entered into property subleases on its leased properties. The Company determined that it retains all the significant risks and rewards of these properties which are leased out on operating leases (see Note 26).
Estimates The key assumptions concerning the future and other key sources of estimation uncertainty at the balance sheet date that have a significant risk of causing a material adjustment to the carrying amounts of assets and liabilities follow:
Determination of Fair Values The fair value for financial instruments traded in active markets at the balance sheet date is based on their quoted market price or dealer price quotations (bid price for long positions and ask price for short positions), without any deduction for transaction costs. When current bid and ask prices are not available, the price of the most recent transaction provides evidence of the current fair value as long as there has not been a significant change in economic circumstances since the time of the transaction.
For all other financial instruments not listed in an active market, the fair value is determined by using appropriate valuation techniques. Valuation techniques include net present value techniques, comparison to similar instruments for which observable market prices exist, options pricing models, and other relevant valuation models.
Note 28 presents the fair values of the financial instruments and the methods and assumptions used in estimating their fair values.
Impairment of Loans and Receivables The Group reviews its loans and receivables at each balance sheet date to assess whether a provision for impairment should be recognized in profit or loss or loans and receivables balance should be written off. In particular, judgment by management is required in the estimation of the amount and timing of future cash flows when determining the level of allowance required. Such estimates are based on assumptions about a number of factors and actual results may differ, resulting in future changes to the allowance. Moreover, management evaluates the presence of

27
objective evidence of impairment which includes observable data that comes to the attention of the Group about loss events such as but not limited to significant financial difficulty of the counterparty, a breach of contract, such as a default or delinquency in interest or principal payments, probability that the borrower will enter bankruptcy or other financial re-organization.
In addition to specific allowances against individually significant loans and receivables, the Group also makes a collective impairment allowance against exposures which, although not specifically identified as requiring a specific allowance, have a greater risk of default than when originally granted. This takes into consideration the credit risk characteristics such as customer type, payment history, past due status and term.
Decline in Inventory Value Provisions are made for inventories whose NRV are lower than their carrying cost. This entails determination of replacement costs and costs necessary to make the sale. The estimates are based on a number of factors, such as but not limited to the age, status and recoverability of inventories.
Impairment of Non-financial Assets Other than Goodwill The Group assesses whether there are any indicators of impairment for all non-financial assets, other than goodwill, at each balance sheet date. These non-financial assets (property and equipment, rent deposits, and software and program cost) are tested for impairment when there are indicators that the carrying amounts may not be recoverable.
The factors that the Group considers important which could trigger an impairment review include the following:
• significant underperformance relative to expected historical or projected future operating results;
• significant changes in the manner of use of the acquired assets or the strategy for overall business;
• significant negative industry or economic trends; and • decline in appraised value.
The carrying values of these non-financial assets are as follows:
June 30, 2015 Dec. 31, 2014Property and equipment (Note 8) P=4,132,439,856 P=3,558,089,998Rent deposits (Note 9) 392,009,280 324,638,850Software and program cost (Note 10) 2,963,678 3,477,680
Estimation of Useful Lives of Property and Equipment and Software and Program Cost The Group estimates the useful lives of its property and equipment and software and program cost based on a period over which the assets are expected to be available for use and on collective assessment of industry practices, internal evaluation and experience with similar arrangement. The estimated useful lives of property and equipment and software and program cost are revisited at the end of each financial reporting period and updated if expectations differ materially from previous estimates. Revaluation of Land The Group’s parcels of land are carried at revalued amounts, which approximate its fair values at the date of the revaluation, less any subsequent accumulated impairment losses. The valuations of land are performed by independent appraisers. Revaluations are made every three to five years or more frequently as necessary, to ensure that the carrying amounts do not differ materially from those which would be determined using fair values at balance sheet date. Impairment of Goodwill The Group determines whether goodwill is impaired at least on an annual basis. This requires an estimation of the value-in-use of the CGUs to which the goodwill is allocated. Estimating the
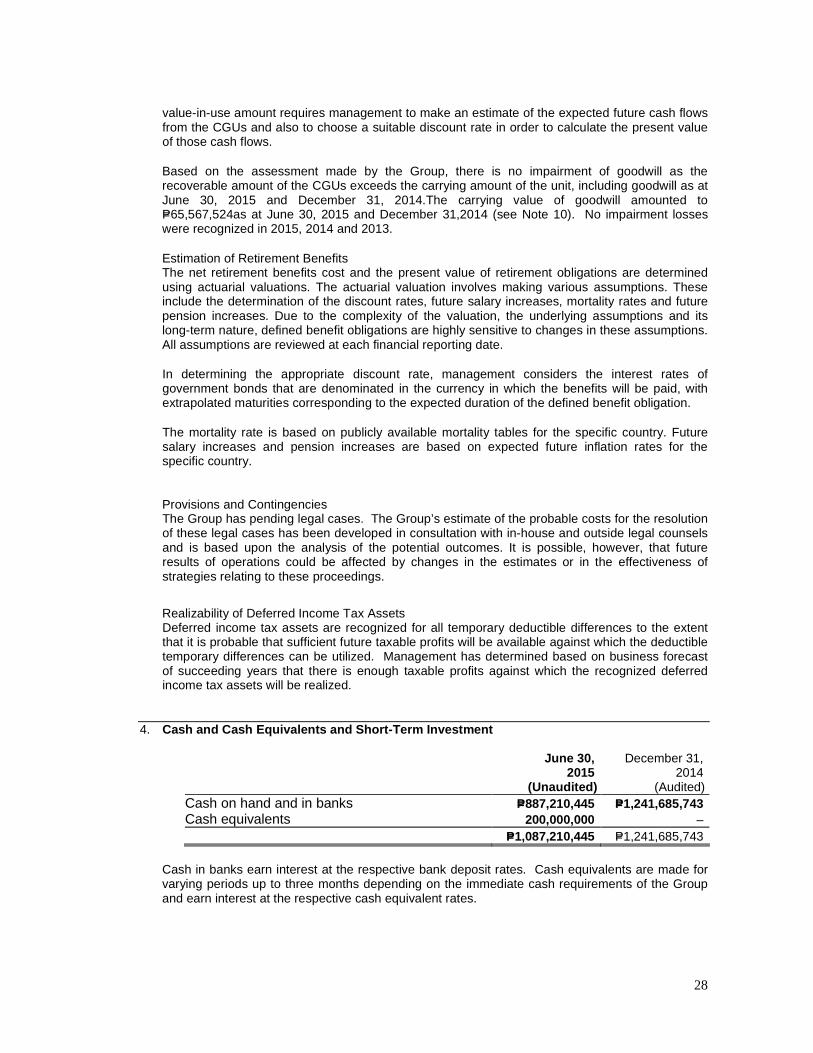
28
value-in-use amount requires management to make an estimate of the expected future cash flows from the CGUs and also to choose a suitable discount rate in order to calculate the present value of those cash flows.
Based on the assessment made by the Group, there is no impairment of goodwill as the recoverable amount of the CGUs exceeds the carrying amount of the unit, including goodwill as at June 30, 2015 and December 31, 2014.The carrying value of goodwill amounted to P=65,567,524as at June 30, 2015 and December 31,2014 (see Note 10). No impairment losses were recognized in 2015, 2014 and 2013.
Estimation of Retirement Benefits The net retirement benefits cost and the present value of retirement obligations are determined using actuarial valuations. The actuarial valuation involves making various assumptions. These include the determination of the discount rates, future salary increases, mortality rates and future pension increases. Due to the complexity of the valuation, the underlying assumptions and its long-term nature, defined benefit obligations are highly sensitive to changes in these assumptions. All assumptions are reviewed at each financial reporting date.
In determining the appropriate discount rate, management considers the interest rates of government bonds that are denominated in the currency in which the benefits will be paid, with extrapolated maturities corresponding to the expected duration of the defined benefit obligation.
The mortality rate is based on publicly available mortality tables for the specific country. Future salary increases and pension increases are based on expected future inflation rates for the specific country.
Provisions and Contingencies The Group has pending legal cases. The Group’s estimate of the probable costs for the resolution of these legal cases has been developed in consultation with in-house and outside legal counsels and is based upon the analysis of the potential outcomes. It is possible, however, that future results of operations could be affected by changes in the estimates or in the effectiveness of strategies relating to these proceedings.
Realizability of Deferred Income Tax Assets Deferred income tax assets are recognized for all temporary deductible differences to the extent that it is probable that sufficient future taxable profits will be available against which the deductible temporary differences can be utilized. Management has determined based on business forecast of succeeding years that there is enough taxable profits against which the recognized deferred income tax assets will be realized.
4. Cash and Cash Equivalents and Short-Term Investment
June 30,
2015 December 31,
2014 (Unaudited) (Audited) Cash on hand and in banks P=887,210,445 P=1,241,685,743 Cash equivalents 200,000,000 – P=1,087,210,445 P=1,241,685,743
Cash in banks earn interest at the respective bank deposit rates. Cash equivalents are made for varying periods up to three months depending on the immediate cash requirements of the Group and earn interest at the respective cash equivalent rates.

29
5. Receivables
June 30,
2015 December 31,
2014 (Unaudited) (Audited) Suppliers P=285,352,046 P=159,162,156 Franchisees (Note 31) 189,252,722 403,074,403 Employees 17,000,461 17,206,304 Store operators 11,474,362 12,048,431 Rent 2,800,505 5,363,909 Due from PhilSeven Foundation, Inc. (PFI)
(Note 25) 3,775,351 3,525,452 Current portion of: Lease receivable - net of unearned interest
income amounting to P=5,773 as at June 30, 2015 and December 31, 2014
(Notes 10 and 26) 3,742,000 3,742,000 Notes receivable 990,917 990,917 Insurance receivable 10,632,939 1,155,417 Others 4,142,881 2,078,334 529,164,184 608,347,323 Less allowance for impairment (18,960,182) (18,960,182) P=510,204,002 P=589,387,141
Impairment on receivables is based on individual assessment of accounts. Movements in allowance for impairment as at June 30, 2015 and December 31, 2014 are as follows:
Beginning
balances
Provision for the year
(Note 19) Write-off Ending
balances Franchisees P=214,342 P=– P=– P=214,342 Suppliers 15,565,934 – – 15,565,934 Employees 539,921 – – 539,921 Store operators 365,801 – – 365,801 Rent 2,274,184 – – 2,274,184 Total P=18,960,182 P=– P=– P=18,960,182
6. Inventories
June 30,
2015 December 31,
2014 (Unaudited) (Audited) At cost (Note 18): Warehouse merchandise P=659,065,877 P=716,772,116 Store merchandise 468,261,940 448,321,960 P=1,127,327,817 P=1,165,094,076

30
7. Prepayments and Other Current Assets
June 30,
2015 December 31,
2014 (Unaudited) (Audited) Current portion of: Deferred input VAT P=140,056,260 P=99,572,933 Deferred lease (Notes10 and 26) 5,337,113 3,554,358 Prepaid: Deferred rent 105,342,963 133,107,466 Store expenses 46,428,368 33,469,093 Taxes 26,122,979 7,548,088 Supplies 1,698,358 5,810,873 Uniform 3,352,049 1,531,177 Repairs and maintenance – 46,294 Advances to suppliers 88,033,858 33,409,032 Advances for expenses 38,707,142 25,820,535 Dues and subscription 1,606,356 706,584 Others 84,932,251 13,820,097 P=541,617,697 P=358,396,530
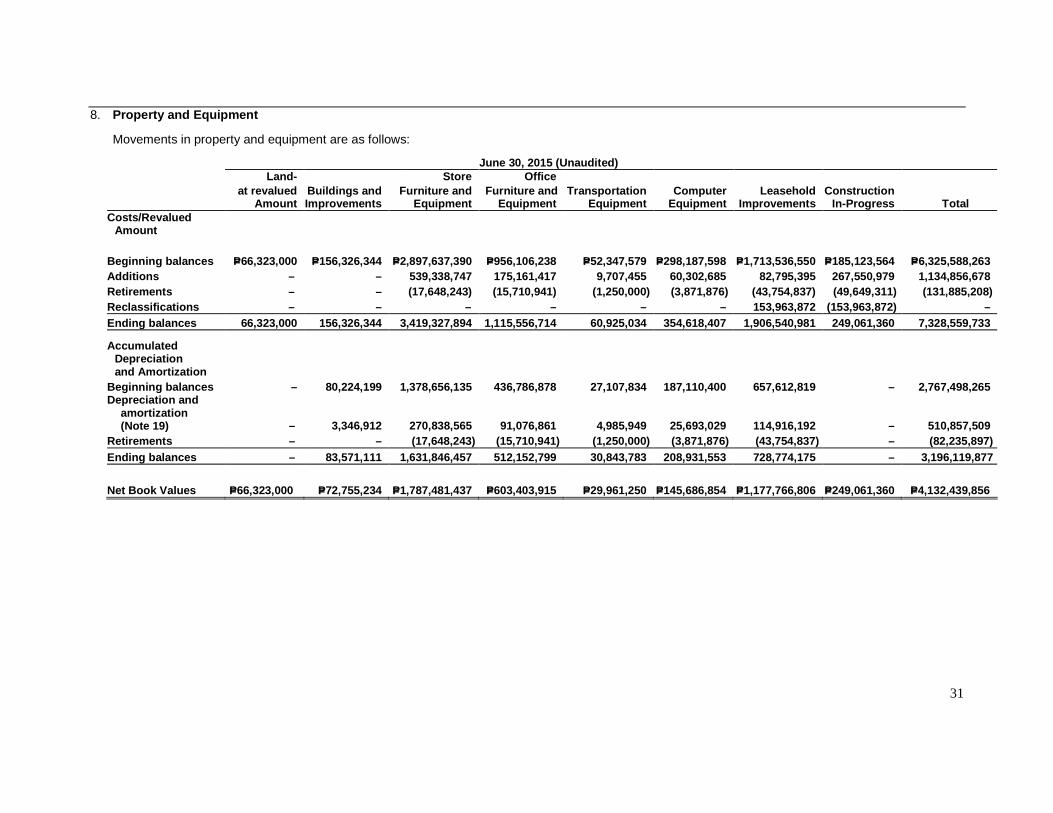
31
8. Property and Equipment Movements in property and equipment are as follows:
June 30, 2015 (Unaudited) Land- Store Office at revalued Buildings and Furniture and Furniture and Transportation Computer Leasehold Construction
Amount Improvements Equipment Equipment Equipment Equipment Improvements In-Progress Total Costs/Revalued
Amount
Beginning balances P=66,323,000 P=156,326,344 P=2,8 97,637,390 P=956,106,238 P=52,347,579 P=298,187,598 P=1,713,536,550 P=185,123,564 P=6,325,588,263 Additions – – 539,338,747 175,161,417 9,707,455 60, 302,685 82,795,395 267,550,979 1,134,856,678 Retirements – – (17,648,243) (15,710,941) (1,250,00 0) (3,871,876) (43,754,837) (49,649,311) (131,885,208) Reclassifications – – – – – – 153,963,872 (153,963, 872) – Ending balances 66,323,000 156,326,344 3,419,327,89 4 1,115,556,714 60,925,034 354,618,407 1,906,540,981 249,061,360 7,328,559,733
Accumulated Depreciation and Amortization
Beginning balances – 80,224,199 1,378,656,135 436,7 86,878 27,107,834 187,110,400 657,612,819 – 2,767,498,265 Depreciation and
amortization (Note 19) – 3,346,912 270,838,565 91,076,861 4,985,949 25,693,029 114,916,192 – 510,857,509
Retirements – – (17,648,243) (15,710,941) (1,250,000) (3,871,876) (43,754,837) – (82,235,897) Ending balances – 83,571,111 1,631,846,457 512,152, 799 30,843,783 208,931,553 728,774,175 – 3,196,119,877
Net Book Values P=66,323,000 P=72,755,234 P=1,787,4 81,437 P=603,403,915 P=29,961,250 P=145,686,854 P=1,177,766,806 P=249,061,360 P=4,132,439,856

32
December 31, 2014 (Audited)
Land- Store Office at revalued Buildings and Furniture and Furniture and Transportation Computer Leasehold Construction Amount Improvements Equipment Equipment Equipment Equipment Improvements In-Progress Total Costs/Revalued Amount
Beginning balances P=44,481,000 P=118,154,849 P=2,200,106,026 P=763,055,302 P=45,130,103 P=244,985,364 P=1,421,900,034 P=95,198,923 P=4,933,011,601 Additions – 9,397,840 746,231,018 265,953,317 10,688,290 66,548,549 222,127,663 332,626,429 1,653,573,106 Retirements – – (48,699,654) (72,902,381) (3,470,814) (13,346,315) (144,419,280) – (282,838,444) Reclassifications – 28,773,655 – – – – 213,928,133 (242,701,788) – Revaluation increment 21,842,000 – – – – – – – 21,842,000 Ending balances 66,323,000 156,326,344 2,897,637,390 956,106,238 52,347,579 298,187,598 1,713,536,550 185,123,564 6,325,588,263 Accumulated
Depreciation and Amortization
Beginning balances – 74,124,862 978,021,331 358,827,296 19,367,872 165,369,417 590,628,202 – 2,186,338,980
Depreciation and amortization (Note 19) – 4,058,141 449,334,458 150,730,603 10,103,916 35,087,298 213,445,093 – 862,759,509
Retirements – – (48,699,654) (72,771,021) (2,363,954) (13,346,315) (144,419,280) – (281,600,224) Reclassifications – 2,041,196 – – – – (2,041,196) – –
Ending balances – 80,224,199 1,378,656,135 436,786,878 27,107,834 187,110,400 657,612,819 – 2,767,498,265 Net Book Values P=66,323,000 P=76,102,145 P=1,518,981,255 P=519,319,360 P=25,239,745 P=111,077,198 P=1,055,923,731 P=185,123,564 P=3,558,089,998
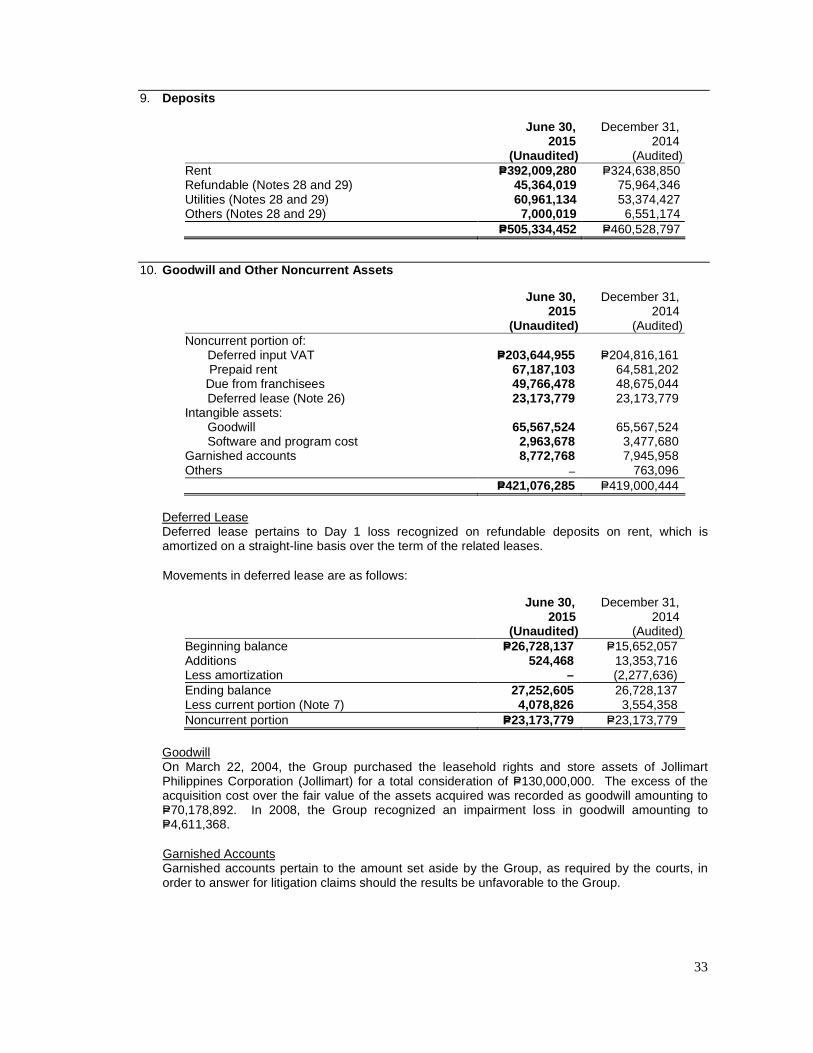
33
9. Deposits
June 30,
2015 December 31,
2014 (Unaudited) (Audited) Rent P=392,009,280 P=324,638,850 Refundable (Notes 28 and 29) 45,364,019 75,964,346 Utilities (Notes 28 and 29) 60,961,134 53,374,427 Others (Notes 28 and 29) 7,000,019 6,551,174 P=505,334,452 P=460,528,797
10. Goodwill and Other Noncurrent Assets
June 30,
2015 December 31,
2014 (Unaudited) (Audited) Noncurrent portion of: Deferred input VAT P=203,644,955 P=204,816,161 Prepaid rent 67,187,103 64,581,202 Due from franchisees 49,766,478 48,675,044 Deferred lease (Note 26) 23,173,779 23,173,779 Intangible assets: Goodwill 65,567,524 65,567,524 Software and program cost 2,963,678 3,477,680 Garnished accounts 8,772,768 7,945,958 Others – 763,096 P=421,076,285 P=419,000,444
Deferred Lease Deferred lease pertains to Day 1 loss recognized on refundable deposits on rent, which is amortized on a straight-line basis over the term of the related leases.
Movements in deferred lease are as follows:
June 30,
2015 December 31,
2014 (Unaudited) (Audited) Beginning balance P=26,728,137 P=15,652,057 Additions 524,468 13,353,716 Less amortization – (2,277,636) Ending balance 27,252,605 26,728,137 Less current portion (Note 7) 4,078,826 3,554,358 Noncurrent portion P=23,173,779 P=23,173,779
Goodwill On March 22, 2004, the Group purchased the leasehold rights and store assets of Jollimart Philippines Corporation (Jollimart) for a total consideration of P=130,000,000. The excess of the acquisition cost over the fair value of the assets acquired was recorded as goodwill amounting to P=70,178,892. In 2008, the Group recognized an impairment loss in goodwill amounting to P=4,611,368.
Garnished Accounts Garnished accounts pertain to the amount set aside by the Group, as required by the courts, in order to answer for litigation claims should the results be unfavorable to the Group.

34
11. Bank Loans
Bank loans represent unsecured Peso-denominated short-term borrowings from various local banks, payable in lump-sum in 2015 and 2014 with annual interest rates ranging from 2.50% to 3.30% as at June 30, 2015 and December 31, 2014, which are repriced monthly based on market conditions. The proceeds of these loans were used for the operations of the Group.
Movements in bank loans are as follows:
June 30,
2015 December 31,
2014 (Unaudited) (Audited) Beginning balance P=750,000,000 P=560,000,000 Availments 600,041,667 950,000,000 Payments (480,000,000) (760,000,000) Ending balance P=870,041,667 P=750,000,000
12. Accounts Payable and Accrued Expenses
June 30,
2015 December 31,
2014 (Unaudited) (Audited) Trade payable P=2,477,532,610 P=2,031,839,981 Utilities 87,612,852 90,223,127 Rent (Note 26) 64,901,518 65,729,071 Employee benefits 54,789,747 71,421,033 Advertising and promotion 40,074,499 41,339,695 Outsourced services 80,613,881 41,302,057 Bank charges 12,990,500 14,254,500 Security services 23,713,819 9,112,687 Interest (Notes 11 and 15) 1,013,611 1,058,750 Others 104,403,870 78,879,962 P=2,947,646,907 P=2,445,160,713
13. Other Current Liabilities
June 31,
2015 December 31,
2014 (Unaudited) (Audited)
Non-trade accounts payable P=229,558,266
P=441,307,059
Retention payable 91,883,760 81,784,397 Due to Franchisees 96,541,044 128,356,232 Output VAT 82,547,492 74,165,095 Withholding taxes 40,148,081 43,688,935 Royalty 18,975,949 19,330,605 Service fees payable 4,479,562 8,012,505 Current portion of deferred revenue on: Finance lease (Notes 16 and 26) 98,260 98,264
Exclusivity contract (Notes 16 and 31) 25,000,000 25,000,000 Others 7,644,214 31,979,546 P=596,876,628 P=853,722,638

35
Non-trade accounts payable pertains to payable to suppliers of goods or services that forms part of general and administrative expenses. These are noninterest-bearing and are due within one year.
14. Deposits Payable
June 30,
2015 December 31,
2014 (Unaudited) (Audited) Franchisees P=125,177,519 P=124,767,926 Service agreements 93,632,961 95,268,832 Rent 15,041,217 14,465,851 P=233,851,697 P=234,502,609
15. Cumulative Redeemable Preferred Shares
Cumulative redeemable preferred shares, which are redeemable at the option of the holder, represent the share of PSC-ERP through its trustee, BPI-AMTG, in SSHI’s net assets pertaining to preferred shares. PSC-ERP is entitled to an annual “Guaranteed Preferred Dividend” in the earnings of SSHI starting April 5, 2002, the date when the 25% of the subscription on preferred shares have been paid, in accordance with the Corporation Code.
16. Deferred Revenue
June 30,
2015 December 31,
2014 (Unaudited) (Audited) Deferred revenue on exclusivity contracts
(Note 31) P=12,500,000 P=25,000,000 Deferred revenue on finance lease (Note 26) – – Deferred revenue - others 2,335,665 1,552,651 P=14,835,665 P=26,552,651
17. Equity
Common Stock The Group was listed with the Philippine Stock Exchange on February 4, 1998 with total listed shares of 71,382,000 common shares consisting of 47,000,000 shares for public offering and 24,382,000 shares for private placement. The Group offered the share at a price of P=4.40. Below is the Company’s track record of the registration of securities:
Date of SEC order rendered effective or permit to sell/ Date of SEC approval Event
Authorized Capital Stock Issued shares
Issue price/ Par value
January 9, 1998 Outstanding common
shares 400,000,000 166,556,250
P=1.00
February 4, 1998 Listed shares: Public offering
400,000,000 47,000,000
4.40
Private placement 400,000,000 24,382,000 4.40 August 15, 2008 10% stock dividends 400,000,000 23,725,200 1.00 August 4, 2009 10% stock dividends 400,000,000 26,097,720 1.00 August 27, 2010 5% stock dividends 400,000,000 14,353,746 1.00 August 19, 2011 15% stock dividends 400,000,000 45,214,300 1.00 November 15, 2012 15% stock dividends 600,000,000 51,996,445 1.00 August 15, 2013 15% stock dividends 600,000,000 59,795,912 1.00 As at June 30,2015 and December 31,2014 459,121,573
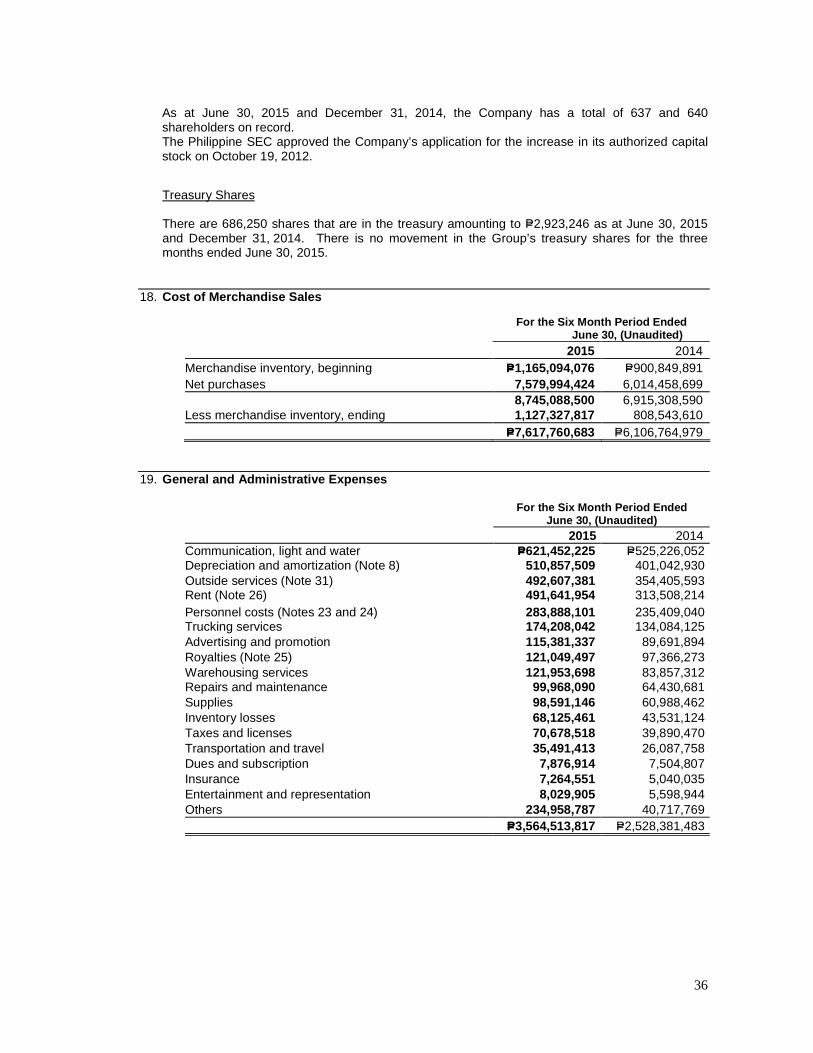
36
As at June 30, 2015 and December 31, 2014, the Company has a total of 637 and 640 shareholders on record. The Philippine SEC approved the Company’s application for the increase in its authorized capital stock on October 19, 2012.
Treasury Shares There are 686,250 shares that are in the treasury amounting to P=2,923,246 as at June 30, 2015 and December 31, 2014. There is no movement in the Group’s treasury shares for the three months ended June 30, 2015.
18. Cost of Merchandise Sales
For the Six Month Period Ended
June 30, (Unaudited) 2015 2014 Merchandise inventory, beginning P=1,165,094,076 P=900,849,891 Net purchases 7,579,994,424 6,014,458,699 8,745,088,500 6,915,308,590 Less merchandise inventory, ending 1,127,327,817 808,543,610 P=7,617,760,683 P=6,106,764,979
19. General and Administrative Expenses
For the Six Month Period Ended
June 30, (Unaudited) 2015 2014 Communication, light and water P=621,452,225 P=525,226,052 Depreciation and amortization (Note 8) 510,857,509 401,042,930 Outside services (Note 31) 492,607,381 354,405,593 Rent (Note 26) 491,641,954 313,508,214 Personnel costs (Notes 23 and 24) 283,888,101 235,409,040 Trucking services 174,208,042 134,084,125 Advertising and promotion 115,381,337 89,691,894 Royalties (Note 25) 121,049,497 97,366,273 Warehousing services 121,953,698 83,857,312 Repairs and maintenance 99,968,090 64,430,681 Supplies 98,591,146 60,988,462 Inventory losses 68,125,461 43,531,124 Taxes and licenses 70,678,518 39,890,470 Transportation and travel 35,491,413 26,087,758 Dues and subscription 7,876,914 7,504,807 Insurance 7,264,551 5,040,035 Entertainment and representation 8,029,905 5,598,944 Others 234,958,787 40,717,769 P=3,564,513,817 P=2,528,381,483

37
20. Marketing Income
For the Six Month Period Ended
June 30, (Unaudited) 2015 2014 Promotions P=168,581,854 P=111,821,045
Marketing support funds 82,844,136 36,315,759 P=251,425,990 P=148,136,804
21. Interest Expense
For the Six Month Period Ended
June 30, (Unaudited) 2015 2014 Guaranteed preferred dividends
(Note 15) 67,890 129,375 Interest on bank loans (Note 11) 13,743,774 P=7,133,659 P=13,811,664 P=7,263,034
22. Interest Income
For the Six Month Period Ended
June 30, (Unaudited) 2015 2014 Bank deposits (Note 4) P=924,365.99 P=1,259,581 P=924,365.99 P=1,259,581
23. Personnel Costs
For the Six Month Period Ended
June 30, (Unaudited) 2015 2014
Salaries and wages P=142,072,716 P=104,423,445 Employee benefits 130,318,482 119,244,736 Net retirement benefits cost (Note 24) 11,496,903 11,740,859
P=283,888,101 P=235,409,040 24. Retirement Benefits
The Group maintains a trusteed, non-contributory defined benefit retirement plan covering all qualified employees administered by a trustee bank under the supervision of the Board of Trustees of the plan. The Board of Trustees is responsible for investment of the assets. It defines the investment strategy as often as necessary, at least annually, especially in the case of significant market developments or changes to the structure of the plan participants. When defining the investment strategy, it takes account of the plans’ objectives, benefit obligations and risk capacity. The investment strategy is defined in the form of a long-term target structure (investment policy). The Board of Trustees delegates the implementation of the investment policy in accordance with the investment strategy as well as various principles and objectives to an Investment Committee, which also consists of members of the Board of Trustees, a Director and a Controller. The Controller of the fund is the one who oversees the entire investment process.
38
Under the existing regulatory framework, Republic Act 7641 requires a provision for retirement pay to qualified private sector employees in the absence of any retirement plan in the entity, provided however that the employee’s retirement benefits under any collective bargaining and other agreements shall not be less than those provided under the law. The law does not require minimum funding of the plan.
25. Related Party Transactions
Related party relationships exist when one party has the ability to control, directly or indirectly through one or more intermediaries, the other party or exercise significant influence over the other party in making financial and operating decisions. Such relationships also exist between and/or among entities which are under common control with the reporting enterprise, or between and/or among the reporting enterprises and their key management personnel, directors or its stockholders.
Transactions with related parties consist of:
a. PSC and CDI have transactions with PFI, a foundation with common key management of the Group, consisting of donations and noninterest-bearing advances pertaining primarily to salaries, taxes and other operating expenses initially paid by PSC for PFI. Donations payable to PFI is presented under “Others” in the “Other current liabilities” in the consolidated balance sheets (see Note 13).
26. Leases Operating Lease as Lessee a. PSC has various lease agreements with third parties relating to its store operations. Certain
agreements provide for the payment of rentals based on various schemes such as an agreed percentage of net sales for the month and fixed monthly rate.
b. In2012, CDI entered into a 2-year lease contract for the lease of a warehouse in Cebu commencing in April 2012 until April 2014. The lease has a renewal option and is subject to an annual escalation rate of 5%. Upon expiration in April 2014, CDI renewed the lease contract for another eight months from May to December 2014. On January 1, 2015, CDI again renewed the lease contract for one year from January to December 2015.
In 2011, CDI entered into a 10-year lease contract for the lease of its warehouse extension effective March 2011. The lease is subject to an annual escalation rate of 4.0% starting on the second year of the lease. The lease contract was transferred to PSC on January 1, 2014 and rent expenses for this lease agreement were recorded by PSC.
In 2005, CDI entered into a 15-year operating lease contract for the lease of its warehouse effective November 1, 2005.
On June 30, 2007, PSC has assumed the lease agreement for the warehouse and subleased the warehouse back to CDI. The lease has a renewal option and is subject to an escalation rate of 7.0% every after two years starting on the third year of the lease. In February 2013, CDI transferred the lease contract to PSC and the sublease was terminated. Rent expense related to the lease agreement was recorded by PSC.
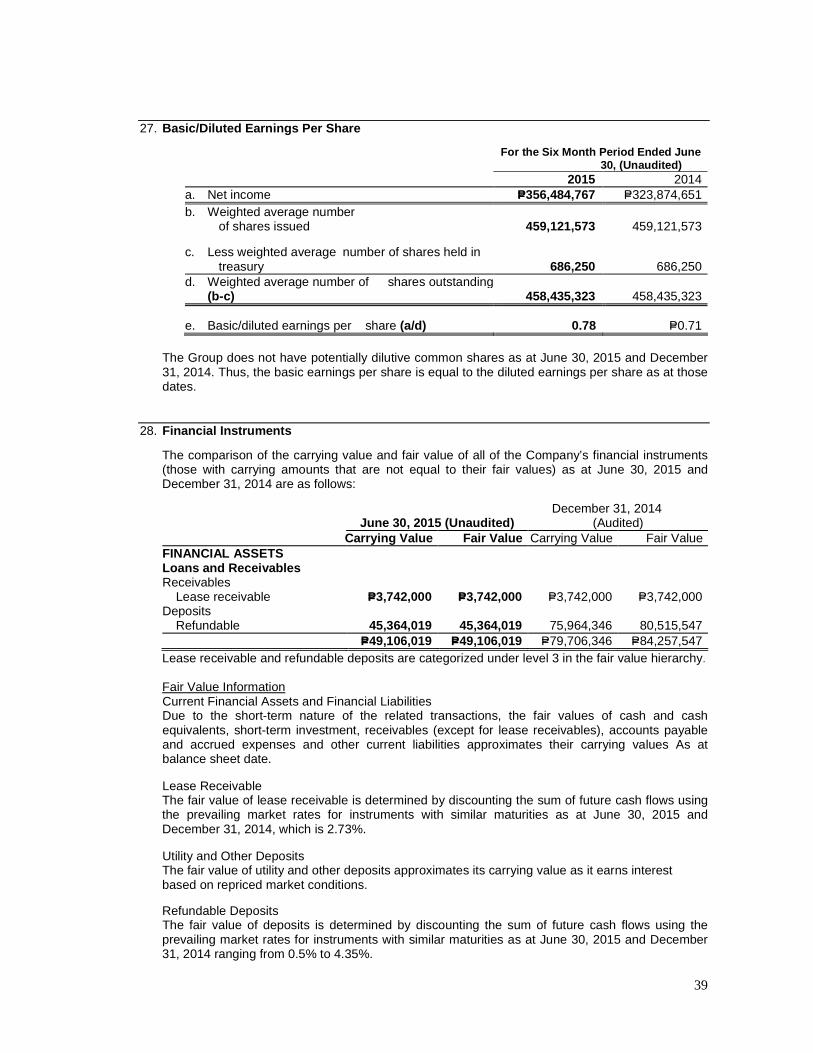
39
27. Basic/Diluted Earnings Per Share
For the Six Month Period Ended June
30, (Unaudited) 2015 2014 a. Net income P=356,484,767 P=323,874,651 b. Weighted average number
of shares issued 459,121,573 459,121,573
c. Less weighted average number of shares held in treasury 686,250 686,250
d. Weighted average number of shares outstanding (b-c) 458,435,323 458,435,323
e. Basic/diluted earnings per share (a/d) 0.78 P=0.71
The Group does not have potentially dilutive common shares as at June 30, 2015 and December 31, 2014. Thus, the basic earnings per share is equal to the diluted earnings per share as at those dates.
28. Financial Instruments
The comparison of the carrying value and fair value of all of the Company’s financial instruments (those with carrying amounts that are not equal to their fair values) as at June 30, 2015 and December 31, 2014 are as follows:
June 30, 2015 (Unaudited) December 31, 2014
(Audited) Carrying Value Fair Value Carrying Value Fair Value FINANCIAL ASSETS Loans and Receivables Receivables Lease receivable P=3,742,000 P=3,742,000 P=3,742,000 P=3,742,000 Deposits Refundable 45,364,019 45,364,019 75,964,346 80,515,547 P=49,106,019 P=49,106,019 P=79,706,346 P=84,257,547 Lease receivable and refundable deposits are categorized under level 3 in the fair value hierarchy. Fair Value Information Current Financial Assets and Financial Liabilities Due to the short-term nature of the related transactions, the fair values of cash and cash equivalents, short-term investment, receivables (except for lease receivables), accounts payable and accrued expenses and other current liabilities approximates their carrying values As at balance sheet date. Lease Receivable The fair value of lease receivable is determined by discounting the sum of future cash flows using the prevailing market rates for instruments with similar maturities as at June 30, 2015 and December 31, 2014, which is 2.73%. Utility and Other Deposits The fair value of utility and other deposits approximates its carrying value as it earns interest based on repriced market conditions. Refundable Deposits The fair value of deposits is determined by discounting the sum of future cash flows using the prevailing market rates for instruments with similar maturities as at June 30, 2015 and December 31, 2014 ranging from 0.5% to 4.35%.

40
Bank Loans The carrying value approximates fair value because of recent and monthly repricing of related interest based on market conditions.
Cumulative Redeemable Preferred Shares The carrying value approximates fair value because corresponding dividends on these shares that are charged as interest expense in profit or loss are based on recent treasury bill rates repriced annually at year end. Fair Value Hierarchy The Group uses the following hierarchy for determining and disclosing the fair value of financial instruments by valuation technique: • Level 1 - quoted (unadjusted) prices in active markets for identical assets or liabilities • Level 2 - valuation techniques for which the lowest level input that is significant to the fair
value measurement is directly or indirectly observable • Level 3 - valuation techniques for which the lowest level input that is significant to the fair
value measurement is unobservable As at June 30, 2015 and December 31, 2014, the Group has no financial instruments measured at fair value.
29. Financial Risk Management Objectives and Policies
The main risks arising from the Group’s financial instruments are credit risk, liquidity risk, interest rate risk and foreign exchange risk. The BOD reviews and approves policies for managing each of these risks. The BOD also created a separate board-level entity, which is the Audit Committee, with explicit authority and responsibility in managing and monitoring risks. The Audit Committee, which ensures the integrity of internal control activities throughout the Group, develops, oversees, checks and pre-approves financial management functions and systems in the areas of credit, market, liquidity, operational, legal and other risks of the Group, and crisis management. The Internal Audit Department and the External Auditor directly report to the Audit Committee regarding the direction, scope and coordination of audit and any related activities.
Listed below are the summarized risk identified by the BOD.
Credit Risk Credit risk is the risk that one party to a financial instrument will cause a financial loss to the other party by failing to discharge an obligation. The receivable balances are monitored on an ongoing basis with the result that the Group’s exposure to impairment is managed to a not significant level. The Group deals only with counterparty duly approved by the BOD.
The following tables provide information regarding the maximum credit risk exposure of the Group as at June 30, 2015 and December 31, 2014:

41
June 30, 2015 December 31, 2014 (Unaudited) (Audited) Cash and cash equivalents (excluding cash on hand) Cash in bank P=887,210,445 P=1,067,252,100 Cash equivalents 200,000,000 – 1,087,210,445 1,067,252,100 Short-term investment 10,884,130 10,884,130 Receivables Franchisees 189,252,722 402,860,061 Suppliers 285,352,046 143,596,222 Employees 17,000,461 16,666,383 Store operators 11,474,362 11,682,630 Rent 2,800,505 3,089,725 Due from PFI 3,775,351 3,525,452 Current portion of: Lease receivable 3,742,000 3,742,000 Notes receivable 990,917 990,917 Insurance receivable 10,632,939 1,155,417 Others 4,142,881 2,078,334 529,164,184 589,387,141 Deposits (Note 9) Utilities 60,961,134 53,374,427 Refundable Deposits 45,364,019 75,964,346 Others 7,000,019 6,551,174 113,325,172 135,889,947 Other noncurrent assets Noncurrent portion of: Due from franchisees 49,766,478 48,675,044 P=1,790,350,409 P=1,852,088,362
The following tables provide information regarding the credit risk exposure of the Group by classifying assets according to the Group’s credit ratings of debtors:
June 30, 2015 (Unaudited) Neither Past Due nor
Impaired
Standard Past Due High Grade Grade Or Impaired Total Cash and cash equivalents Cash in bank P=887,210,445 P=– P=– P=887,210,445 Cash equivalents 200,000,000 – – 200,000,000 1,087,210,445 – – 1,087,210,445 Short-term investment 10,884,130 – – 10,884,130 Receivables Franchisees – 189,038,380 214,342 189,252,722 Suppliers – 228,609,190 56,742,856 285,352,046 Employees – 16,460,540 539,921 17,000,461 Store operators – 11,108,561 365,801 11,474,362 Rent – 526,321 2,274,184 2,800,505 Due from PFI – 3,775,351 – 3,775,351 Current portion of: Lease receivable – 3,742,000 – 3,742,000 Notes receivable – 990,917 – 990,917 Insurance receivable – 10,632,939 – 10,632,939 Others – 4,142,881 – 4,142,881 – 469,027,080 60,137,104 529,164,184 Deposits Utilities – 60,961,134 – 60,961,134 Refundable – 45,364,019 – 45,428,482 Others – 7,000,019 – 7,000,019 – 113,325,172 – 113,325,172
(Forward)

42
Other noncurrent asset Noncurrent portion of Due From
Franchisees – 49,766,478 – 49,766,478
P=1,098,094,575 P=632,118,730 P=60,137,104 P=
1,790,414,872
December 31, 2014 (Audited)
Neither Past Due nor Impaired Past Due Standard Or High Grade Grade Impaired Total Cash and Cash Equivalents Cash in banks P=1,067,252,100 P=– P=– P=1,067,252,100 Cash equivalents – – – – 1,067,252,100 – – 1,067,252,100 Short-term investment 10,884,130 10,884,130 Receivables Franchisees – 402,860,061 214,342 403,074,403
Suppliers – 120,628,776 38,533,380 159,162,156 Employees – 16,666,383 539,921 17,206,304 Store operators – 11,682,630 365,801 12,048,431
Rent – 3,089,725 2,274,184 5,363,909 Due from PFI 3,525,452 3,525,452 Current portion of: Lease receivable – 3,742,000 – 3,742,000
Note receivable – 990,917 – 990,917 Insurance – 1,155,417 – 1,155,417 Others – 2,078,334 – 2,078,334
566,419,695 41,927,628 608,347,323 Deposits Utilities – 53,374,427 – 53,374,427 Refundable – 75,964,346 – 75,964,346 Others – 6,551,174 – 6,551,174 – 135,889,947 – 135,889,947 Other Noncurrent Asset Noncurrent portion of Due from
Franchisees – 48,675,044 – 48,675,044 – 48,675,044 – 48,675,044 P=1,078,136,230 P=750,984,686 P=41,927,628 P=1,871,048,544
The Group uses the following criteria to rate credit quality:
Class Description High Grade Financial assets that have a recognized foreign or local
third party rating or instruments which carry guaranty/collateral.
Standard Grade Financial assets of companies that have the apparent ability to satisfy its obligations in full.
The credit qualities of the financial assets were determined as follow:
Cash in banks and cash equivalents and short-term investment are classified as high grade, since these are deposited or transacted with reputable banks which have low probability of insolvency.
Receivables, deposits and other noncurrent asset are classified as standard grade, since these pertain to receivables considered as unsecured from third parties with good paying habits.
The following tables provide the analysis of financial assets that are past due but not impaired and past due and impaired:

43
June 30, 2015 (Unaudited)
Aging analysis of financial assets past due but
not impaired Past due
and
31 to 60
days 61 to 90
days >90 days Total Impaired Total Receivables: Franchisees P=– P=– P=– P=– P=214,342 P=214,342 Suppliers 1,785,242 8,408,300 30,983,380 41,176,92 2 15,565,934 56,742,856 Employees – – – – 539,921 539,921 Store operators – – – – 365,801 365,801 Rent – – – – 2,274,184 2,274,184 P=1,785,242 P=8,408,300 P=30,983,380 P=41,176,922 P=18,960,182 P=60,137,104
December 31, 2014 (Audited) Aging analysis of financial assets past due but not
impaired Past due and
31 to 60 days
61 to 90 days
> 90 days Total Impaired Total
Receivables: Franchisees P=– P=– P=– P=– P=214,342 P=214,342 Suppliers 995,763 4,689,937 17,281,746 22,967,446 15,565,934 38,533,380 Employees – – – – 539,921 539,921 Store operators – – – – 365,801 365,801 Rent – – – – 2,274,184 2,274,184 P=995,763 P=4,689,937 P=17,281,746 P=22,967,446 P=18,960,182 P=41,927,628
Receivables from suppliers are noninterest-bearing and are generally on 30 day to 90 day terms.
There are no significant concentrations of credit risk within the Group. Liquidity Risk Liquidity risk is the risk that an entity will encounter difficulty in meeting obligations associated with financial instruments. The Group seeks to manage its liquidity profile to be able to finance its capital expenditures and service its maturing debts. To cover for its financing requirements, the Group intends to use internally generated funds and sales of certain assets.
As part of its liquidity risk management program, the Group regularly evaluates projected and actual cash flow information and continuously assesses conditions in the financial markets for opportunities to pursue fund raising initiatives. The Group uses historical figures and experiences and forecasts of collections and disbursements.
These initiatives may include drawing of loans from the approved credit line intended for working capital and capital expenditures purposes and equity market issues.
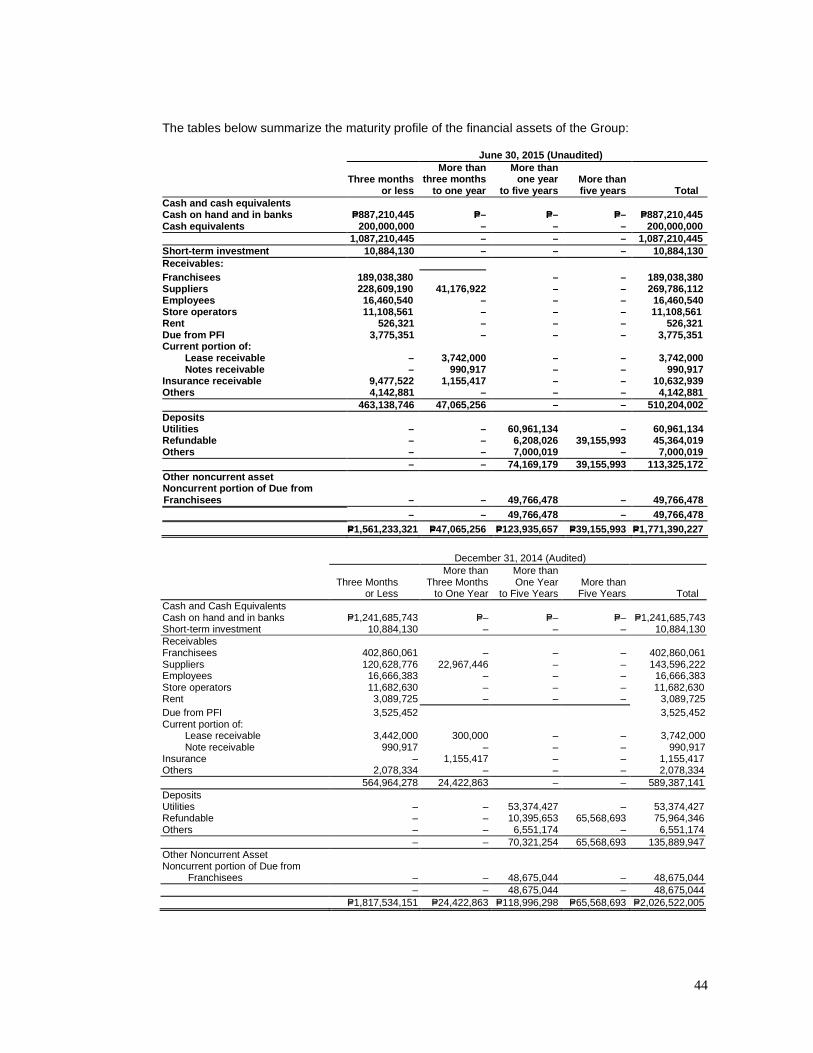
44
The tables below summarize the maturity profile of the financial assets of the Group: June 30, 2015 (Unaudited)
Three months More than
three months More than
one year More than or less to one year to five years five years Total Cash and cash equivalents Cash on hand and in banks P=887,210,445 P=– P=– P=– P=887,210,445 Cash equivalents 200,000,000 – – – 200,000,000 1,087,210,445 – – – 1,087,210,445 Short-term investment 10,884,130 – – – 10,884,130 Receivables: Franchisees 189,038,380 – – 189,038,380 Suppliers 228,609,190 41,176,922 – – 269,786,112 Employees 16,460,540 – – – 16,460,540 Store operators 11,108,561 – – – 11,108,561 Rent 526,321 – – – 526,321 Due from PFI 3,775,351 – – – 3,775,351 Current portion of: Lease receivable – 3,742,000 – – 3,742,000 Notes receivable – 990,917 – – 990,917 Insurance receivable 9,477,522 1,155,417 – – 10,632,939 Others 4,142,881 – – – 4,142,881 463,138,746 47,065,256 – – 510,204,002 Deposits Utilities – – 60,961,134 – 60,961,134 Refundable – – 6,208,026 39,155,993 45,364,019 Others – – 7,000,019 – 7,000,019 – – 74,169,179 39,155,993 113,325,172 Other noncurrent asset Noncurrent portion of Due from Franchisees – – 49,766,478 – 49,766,478 – – 49,766,478 – 49,766,478 P=1,561,233,321 P=47,065,256 P=123,935,657 P=39,155,993 P=1,771,390,227
December 31, 2014 (Audited)
Three Months More than
Three Months More than One Year More than
or Less to One Year to Five Years Five Years Total Cash and Cash Equivalents Cash on hand and in banks P=1,241,685,743 P=– P=– P=– P=1,241,685,743 Short-term investment 10,884,130 – – – 10,884,130 Receivables Franchisees 402,860,061 – – – 402,860,061 Suppliers 120,628,776 22,967,446 – – 143,596,222 Employees 16,666,383 – – – 16,666,383 Store operators 11,682,630 – – – 11,682,630 Rent 3,089,725 – – – 3,089,725 Due from PFI 3,525,452 3,525,452 Current portion of: Lease receivable 3,442,000 300,000 – – 3,742,000 Note receivable 990,917 – – – 990,917 Insurance – 1,155,417 – – 1,155,417 Others 2,078,334 – – – 2,078,334 564,964,278 24,422,863 – – 589,387,141 Deposits Utilities – – 53,374,427 – 53,374,427 Refundable – – 10,395,653 65,568,693 75,964,346 Others – – 6,551,174 – 6,551,174 – – 70,321,254 65,568,693 135,889,947 Other Noncurrent Asset Noncurrent portion of Due from
Franchisees – – 48,675,044 – 48,675,044 – – 48,675,044 – 48,675,044 P=1,817,534,151 P=24,422,863 P=118,996,298 P=65,568,693 P=2,026,522,005

45
The tables below summarize the maturity profile of the financial liabilities of the Group based on remaining undiscounted contractual obligations:
June 30, 2015 (Unaudited)
Three months
More than three
months More than or less to one year one year Total Bank loans P=120,041,667 P=750,000,000 P= 69,958,333 P=940,000,000
Accounts payable and accrued expenses
Trade payable P=2,477,532,610 – – P=2,477,532,610 Utilities 87,612,852 – – 87,612,852 Rent 64,901,518 – – 64,901,518
Employee benefits 54,789,747 – – 54,789,747 Advertising and promotion 40,074,499 – – 40,074,499 Outsourced services 80,613,881 – – 80,613,881 Bank charges 12,990,500 – – 12,990,500 Security services 23,713,819 – – 23,713,819 Interest 1,013,611 – – 1,013,611 Others 104,403,870 – – 104,403,870 P=2,947,646,907 – – P=2,947,646,907 Other current liabilities Non-trade accounts payable 229,558,266 – – 229,558, 266 Retention payable 10,099,363 81,784,397 – 91,883,760 Due to Franchisees – 96,541,044 96,541,044 Royalty 18,975,949 – – 18,975,949 Service fees payable – 4,479,562 – 4,479,562 Others 7,644,214 – – 7,644,214 266,277,792 182,805,003 – 449,082,795 Cumulative redeemable preferred shares 6,000,000 – – 6,000,000 P=3,339,966,366 P=932,805,003 – P=4,342,729,702
December 31, 2014 (Audited)
Three months
More than three
months More than or less to one year one year Total Bank loans P=650,000,000 P=100,000,000 P=– P=750,000,000 Accounts payable and accrued expenses Trade payable 2,031,839,981 – – 2,031,839,981 Utilities 90,223,127 – – 90,223,127 Rent 65,719,071 – – 65,729,071 Employee benefits 71,421,033 – – 71,421,033 Advertising and promotion 41,339,695 – – 41,339,695 Outsourced services 41,302,057 – – 41,302,057 Bank charges 14,254,500 – – 14,254,500 Security services 9,112,687 – – 9,112,687 Interest 1,058,750 – – 1,058,750 Others 78,879,962 – – 78,879,962 2,445,160,713 – – 2,445,160,713 Other current liabilities – – Non-trade accounts payable 41,686,571 399,620,488 441,307,059 Retention payable – 81,784,397 – 81,784,397 Due to Franchisees 128,356,232 128,356,232 Royalty 19,330,605 – – 19,330,605 Service fees payable – 8,012,505 – 8,012,505 Others – 13,805,862 – 13,805,862 61,017,176 631,579,484 – 692,596,660 Cumulative redeemable preferred shares 6,000,000 – – 6,000,000 P=3,162,177,889 P=731,579,484 P=– P=3,893,757,373
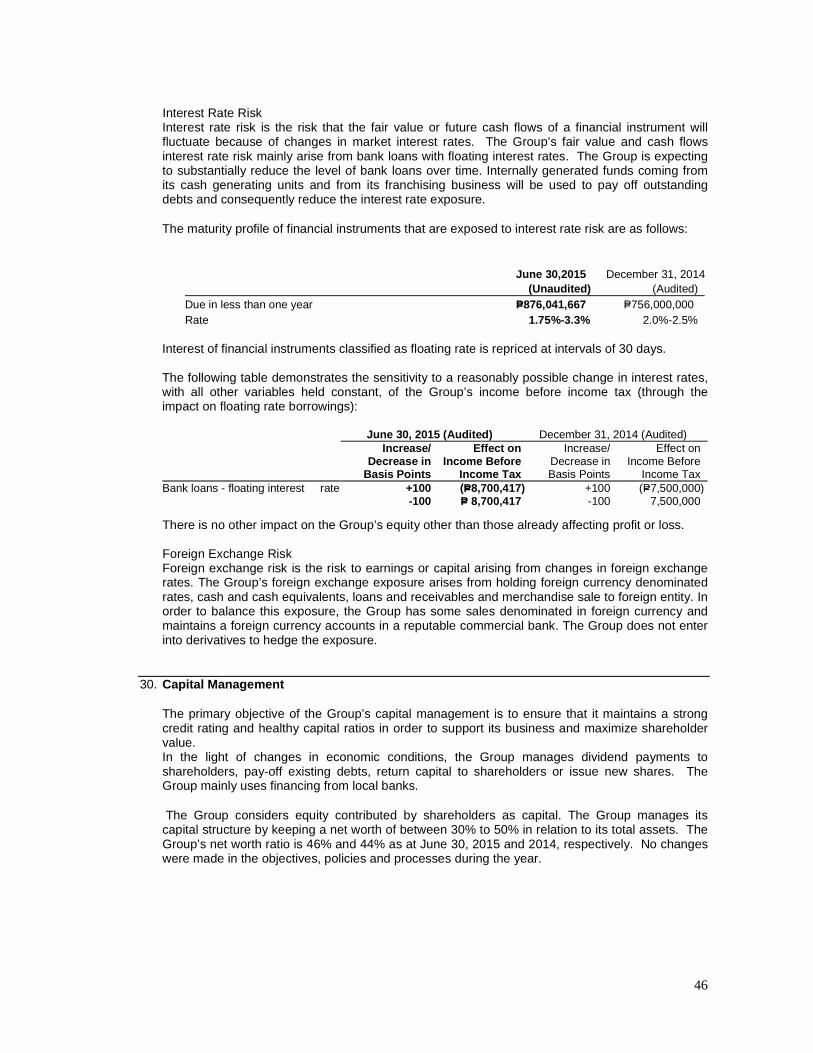
46
Interest Rate Risk Interest rate risk is the risk that the fair value or future cash flows of a financial instrument will fluctuate because of changes in market interest rates. The Group’s fair value and cash flows interest rate risk mainly arise from bank loans with floating interest rates. The Group is expecting to substantially reduce the level of bank loans over time. Internally generated funds coming from its cash generating units and from its franchising business will be used to pay off outstanding debts and consequently reduce the interest rate exposure.
The maturity profile of financial instruments that are exposed to interest rate risk are as follows:
June 30,2015 December 31, 2014 (Unaudited) (Audited) Due in less than one year P=876,041,667 P=756,000,000 Rate 1.75%-3.3% 2.0%-2.5%
Interest of financial instruments classified as floating rate is repriced at intervals of 30 days. The following table demonstrates the sensitivity to a reasonably possible change in interest rates, with all other variables held constant, of the Group’s income before income tax (through the impact on floating rate borrowings): June 30, 2015 (Audited) December 31, 2014 (Audited)
Increase/ Decrease in
Basis Points
Effect on Income Before
Income Tax
Increase/ Decrease in Basis Points
Effect on Income Before
Income Tax Bank loans - floating interest rate +100 (P=8,700,417) +100 (P=7,500,000) -100 P= 8,700,417 -100 7,500,000
There is no other impact on the Group’s equity other than those already affecting profit or loss.
Foreign Exchange Risk Foreign exchange risk is the risk to earnings or capital arising from changes in foreign exchange rates. The Group’s foreign exchange exposure arises from holding foreign currency denominated rates, cash and cash equivalents, loans and receivables and merchandise sale to foreign entity. In order to balance this exposure, the Group has some sales denominated in foreign currency and maintains a foreign currency accounts in a reputable commercial bank. The Group does not enter into derivatives to hedge the exposure.
30. Capital Management
The primary objective of the Group’s capital management is to ensure that it maintains a strong credit rating and healthy capital ratios in order to support its business and maximize shareholder value. In the light of changes in economic conditions, the Group manages dividend payments to shareholders, pay-off existing debts, return capital to shareholders or issue new shares. The Group mainly uses financing from local banks.
The Group considers equity contributed by shareholders as capital. The Group manages its capital structure by keeping a net worth of between 30% to 50% in relation to its total assets. The Group’s net worth ratio is 46% and 44% as at June 30, 2015 and 2014, respectively. No changes were made in the objectives, policies and processes during the year.

47
31. Significant Agreements
a. Franchise Agreements The Group has various store franchise agreements with third parties for the operation of certain stores. The agreement includes a one-time franchise fee payment and an annual 7-Eleven charge for the franchisee, which is equal to a certain percentage of the franchised store’s gross profit. Details follow:
For the Six Month Period Ended
June 30, (Unaudited) 2015 2014 Share in gross profit of franchisees P=883,643,638 743,419,158 Franchise fee 53,254,152 54,408,488 P=936,897,790 797,827,646
b. Service Agreements The Group has service agreements with third parties for the management and operation of certain stores. In consideration thereof, the store operator is entitled to a service fee based on a certain percentage of the store’s gross profit and operating expenses as stipulated in the service agreement. Service fees included under outside services shown as part of “Outside services” in “General and administrative expenses” account.
c. Commission Income The Group has entered into agreements with a phone card supplier and various third parties. Under the arrangements, the Group earns commission on the sale of phone cards and collection of bills payments based on a certain percentage of net sales and collections for the month and a fixed monthly rate. Commission income amounted to P=23 million, and P=18 million for the six months ended June 30, 2015 and 2014, respectively.
d. 2014 Exclusivity Contract In 2014, the Group has entered into a 3-year exclusivity contract with a third party ice cream distributor in the Philippines effective January 2014 to December 2016. The contract indicates that the third party ice cream distributor will exclusively supply all ice cream products of 7-Eleven stores. The Group received a one-time signing bonus amounting to P=75,000,000 upon the effectivity of the exclusivity supply contract amortized over three years.
e. Memorandum of Agreement (MOA) with Chevron Philippines, Inc. The Group has entered into MOA with Chevron Philippines, Inc. (CPI) on August 6, 2009, wherein CPI has granted the Group as authorized co-locator for a full term of three-years to establish operate and/or franchise its 7-Eleven stores in CPI service stations. Both parties have identified 22 CPI service stations, wherein the Group will give the Retailers of these service stations a Letter Offer to Franchise (LOF) 7-Eleven stores. Upon acceptance of the Retailers of the LOF, the Retailers will sign a Store Franchise Agreement (SFA) with the Group. If LOF is not accepted by one of the 22 original service stations identified, that service station will be replaced with another mutually acceptable service station site. Upon signing of the MOA, CPI executed a Caltex Retail Agreement with each of the 22 service station Retailers, which shall have a full term of three years and which will be co-terminus with the SFA.
As of June 30, (Unaudited) 2015 2014 Common stock P=459,121,573 P=459,121,573 Additional paid-in capital 293,525,037 293,525,037 Retained earnings 2,719,446,242 1,996,865,414 3,472,092,852 2,749,512,025 Less cost of shares held in treasury 2,923,246 2,923,246 3,469,169,606 2,746,588,778
Total assets P=8,415,057,167 P= 5,991,191,760
Net worth 41% 46%

48
32. Segment Reporting The Group considers the store operations as its only business segment based on its primary business activity. Franchising, renting of properties and commissioning on bills payment services are considered an integral part of the store operations. The Group’s identified operating segments below are consistent with the segments reported to the BOD, which is the Chief Operating Decision Maker of the Group.
The products and services from which the store operations derive its revenues from are as follows: • Merchandise sales • Franchise revenue • Marketing income • Rental income • Commission income • Interest income
The aforementioned revenues are all revenues from external customers.
The segment’s relevant financial information is as follows:
For the Six Months Ended
June 30, (Unaudited) 2015 2014 Revenue Revenue from merchandise sales P=10,129,318,090 P=7,986,453,643 Franchise revenue 936,897,790 797,827,646 Marketing income 251,425,990 148,136,804 Rental income 22,692,244 10,993,656 Commission income 23,492,885 18,422,844 Interest income 1,054,356 1,259,581 Other income 344,452,738 146,337,483 11,709,334,093 9,109,431,658 Expenses Cost of merchandise sales 7,617,760,683 6,106,764,979 General and administrative expenses: Depreciation and amortization 510,857,509 401,042,930 Others 3,053,167,020 2,127,338,553 Interest expense 13,811,664 7,263,034 Other expenses 2,613,689 4,158,452 11,198,210,565 8,646,567,948 Income Before Income Tax 511,123,528 462,863,710 Provision for Income Tax 154,638,761 138,989,056 Segment Profit 356,484,767 323,874,651 Segment Assets P=8,415,057,167 5,991,191,760 Segment Liabilities P=4,952,409,963 3,263,614,530
33. Provisions and Contingencies
The Group is a party to various litigations and claims. All cases are in the normal course of business and are not deemed to be considered as material legal proceedings. Further, the cases are either pending in courts or under protest, the outcome of which are not presently determinable. Management and its legal counsel believe that the liability, if any, that may result from the outcome of these litigations and claims will not materially affect their financial position or financial performance.
34. Note to Consolidated Statements of Cash Flows
The principal non-cash transaction of the Group under financing activities pertains to the issuance of stock dividends (see Note 17).
Related Documents


![COVER SHEET - Home - [EastWestBanker.com] · COVER SHEET SEC Registration Number A S 0 9 4 - 0 0 2 7 3 3 Company Name ... consumer loans still accounting for more than half of the](https://static.cupdf.com/doc/110x72/5e703362607f5317e7183658/cover-sheet-home-cover-sheet-sec-registration-number-a-s-0-9-4-0-0-2-7.jpg)


![Instrument 0 .f. (l 0p+ j of · Instrument Control Number Commonwealth of Virginia Land Record Instruments Cover Sheet-Form A LO(]t]][0.f. j(l Io/([I'E 0p+ j [ILS VLR Cover Sheet](https://static.cupdf.com/doc/110x72/5eab8bff484e1e7c823e49c3/instrument-0-f-l-0p-j-of-instrument-control-number-commonwealth-of-virginia.jpg)

