Journal of Biosciences and Medicines, 2014, 2, 25-36 Published Online May 2014 in SciRes. http://www.scirp.org/journal/jbm http://dx.doi.org/10.4236/jbm.2014.23005 How to cite this paper: Raîche, M., et al. (2014) Covariates of Disability-Profile Transitions in Older People Living at Home. Journal of Biosciences and Medicines, 2, 25-36. http://dx.doi.org/10.4236/jbm.2014.23005 Covariates of Disability-Profile Transitions in Older People Living at Home Michel Raîche 1 , Réjean Hébert 1,2 , Marie-France Dubois 1,2 , N’Deye Rokhaya Gueye 1,3 , Nicole Dubuc 1,2 1 Research Centre on Aging, Sherbrooke University Geriatrics Institute, Sherbrooke, Canada 2 Faculty of Medicine and Health Sciences, Université de Sherbrooke, Sherbrooke, Canada 3 Faculty of Arts & Faculty of sciences, Université de Saint-Boniface, Winnipeg, Canada Email: [email protected] , [email protected] , [email protected] , [email protected] , [email protected] Received January 2014 Abstract The objective of this study was to explore the relationship of sociodemographic, clinical, and health-services use-related variables with transitions between disability-based profiles. In a lon- gitudinal study of 1386 people aged 75 and over living in the community at baseline, disabilities were assessed annually for up to four years with the Functional Autonomy Measurement System (SMAF), which generates 14 Iso-SMAF profiles. These profiles are grouped into 4 disability states, which are predominant alterations in instrumental activities of daily living (IADLs), mobility, mental functions as well as severe and mixed disabilities. Continuous-time, multi-state Markov modeling was used to identify the factors associated with transitions made by older people be- tween these states and to institutionalization and death. Greater age and receiving help for ADL were associated with four transitions, while altered cognitive functions and hospitalization were associated with three, all involving more decline or less recovery. From mild IADL profiles, men have a higher risk of transitioning to intermediate predominantly mental profiles, while women are at higher risk of transitioning to intermediate predominantly mobility profiles. Unmet needs are associated with deterioration, from mild IADL to intermediate predominantly mobility pro- files. These results help understanding the complex progression of disabilities in older people. Keywords Aged, Disability Profiles, Transitions, Covariates, Multistate Model, Case-Mix Classification, Longitudinal 1. Introduction To help in planning health services for older people living at home, eight classifications involving disabilities have been developed over the last 15 years [1]-[8]. Very little, however, is known about transitions between the profiles in a classification; even less information is available about the factors associated with these transitions. The probabilities of transition (defined as going from a state to another) have only been studied [9] [10] for

Welcome message from author
This document is posted to help you gain knowledge. Please leave a comment to let me know what you think about it! Share it to your friends and learn new things together.
Transcript
Journal of Biosciences and Medicines, 2014, 2, 25-36 Published Online May 2014 in SciRes. http://www.scirp.org/journal/jbm http://dx.doi.org/10.4236/jbm.2014.23005
How to cite this paper: Raîche, M., et al. (2014) Covariates of Disability-Profile Transitions in Older People Living at Home. Journal of Biosciences and Medicines, 2, 25-36. http://dx.doi.org/10.4236/jbm.2014.23005
Covariates of Disability-Profile Transitions in Older People Living at Home Michel Raîche1, Réjean Hébert1,2, Marie-France Dubois1,2, N’Deye Rokhaya Gueye1,3, Nicole Dubuc1,2 1Research Centre on Aging, Sherbrooke University Geriatrics Institute, Sherbrooke, Canada 2Faculty of Medicine and Health Sciences, Université de Sherbrooke, Sherbrooke, Canada 3Faculty of Arts & Faculty of sciences, Université de Saint-Boniface, Winnipeg, Canada Email: [email protected], [email protected], [email protected],
[email protected], [email protected] Received January 2014
Abstract The objective of this study was to explore the relationship of sociodemographic, clinical, and health-services use-related variables with transitions between disability-based profiles. In a lon-gitudinal study of 1386 people aged 75 and over living in the community at baseline, disabilities were assessed annually for up to four years with the Functional Autonomy Measurement System (SMAF), which generates 14 Iso-SMAF profiles. These profiles are grouped into 4 disability states, which are predominant alterations in instrumental activities of daily living (IADLs), mobility, mental functions as well as severe and mixed disabilities. Continuous-time, multi-state Markov modeling was used to identify the factors associated with transitions made by older people be-tween these states and to institutionalization and death. Greater age and receiving help for ADL were associated with four transitions, while altered cognitive functions and hospitalization were associated with three, all involving more decline or less recovery. From mild IADL profiles, men have a higher risk of transitioning to intermediate predominantly mental profiles, while women are at higher risk of transitioning to intermediate predominantly mobility profiles. Unmet needs are associated with deterioration, from mild IADL to intermediate predominantly mobility pro-files. These results help understanding the complex progression of disabilities in older people.
Keywords Aged, Disability Profiles, Transitions, Covariates, Multistate Model, Case-Mix Classification, Longitudinal
1. Introduction To help in planning health services for older people living at home, eight classifications involving disabilities have been developed over the last 15 years [1]-[8]. Very little, however, is known about transitions between the profiles in a classification; even less information is available about the factors associated with these transitions.
The probabilities of transition (defined as going from a state to another) have only been studied [9] [10] for
M. Raîche et al.
26
two of these classifications: the “Health States Profiles” (HSPs) [8] and the Iso-SMAF profiles [5] (SMAF: Functional Autonomy Measurement System). The latter is regularly used in clinical settings in different coun-tries, but no study has presented its covariates associated with transitions between profiles. HSP classification included only four profiles and cannot be used for clinical and health-services planning purposes. HSPs transi-tions [9] were presented separately for women and men, but also separately for two consecutive periods (no overall annual transition estimates). There was considerable variation between the probabilities in these periods. Nevertheless, this is the only information available to date on factors associated with transitions between pro-files that include disabilities.
Use of services by older people has been linked to the eight classifications [1]-[8]. Their authors have stated their relevance to service planning. Knowledge about health-services use associated with profile transitions would be helpful in planning home services for older populations. Although older people with disabilities need many health services from many sources, the study of disability progression was never linked with the entire range of services used.
Knowledge about transitions and the associated covariates is needed to better understand what characterizes disability progression. Herein, we use the term “covariates” instead of risk or protective factors because profiles are not always ordered and the direction of change is not always positive or negative. Moving from a profile with predominant mobility problems to a profile with predominant cognitive problems or vice versa lies outside the traditional view of risk or protection. In profile transitions, it refers more to a change in the predominance of problems rather than a change in their severity.
Except for sex [9], covariates associated with transitions between different disability profiles are unknown. The factors associated with disability progression that have been identified in the main incidence studies could potentially be associated with disability-profile transitions. These include age [11]-[20]; sex [12] [14] [16]-[18] [20]; education [12] [14] [16]; living alone [15] [16]; cognitive impairment [15] [16] [20] [21]; depression [20] [21]; comorbidity [11] [12] [18] [21] [22]; social contacts [23]; self-perceived health [11] [15] [22]; initial level of disability [11] [15] [18]; and use of health services, such as hospitalization [11] [12], help for IADL [14], and visits to or from health professionals [24]. Unmet needs are also viewed as potential correlates of disability pro-gression [25] [26].
This study’s main objective was to explore the covariates associated with transitions for Iso-SMAF disability profiles (described below). They were variables previously shown to be related to change in disability and in-clude sociodemographic data, clinical factors, and health-services use.
2. Material and Methods 2.1. Source of the Data and Measures The PRISMA (Program of Research to Integrate Services for the Maintenance of Autonomy) [27] study fol-lowed 1501 people aged 75 and over living in the community and screened at risk of functional decline [28] in Quebec, Canada. Subjects were evaluated at baseline and every year while living in the community for up to four years, during years 2001-2006. Institutionalization in long-term-care facilities (LTCFs) and death were rec-orded throughout the study with their exact date. In Quebec, older people do not return home after LTCF institu-tionalization. Details about the PRISMA study are available elsewhere [29].
Disabilities were evaluated annually with the 29-item SMAF (French acronym for Functional Autonomy Measurement System) [30] covering five sectors of activity: ADLs [7 items], mobility [6], communication [3], mental functions [5], and IADLs [8], based on World Health Organization International classification of impairments, disabilities, and handicaps [31]. Each item was scored on a 5-level scale from 0 (independent) and 0.5 (with difficulty) to 3 (dependent), for a total score ranging from 0 to 87. The SMAF was administered by trained health professionals, who scored the individual’s functional ability after questioning them and proxies, observing and sometimes testing the subject. For each disability item, available resources to compensate for it were evaluated and a handicap score representing unmet needs was deducted. The instrument’s validity has been assessed in many studies [30] [32]-[34]. The link between the SMAF and the resources and costs in different settings (from home to long-term institution) has also been studied [35].
A case-mix classification, previously developed by cluster analysis of the 29 SMAF items [5], classifies people into 14 Iso-SMAF profiles (“Iso” means “equal”). The 14 Iso-SMAF profiles had been validated with different levels of required services [5]. They range from the mild disability profile 1 (needs help or supervision
M. Raîche et al.
27
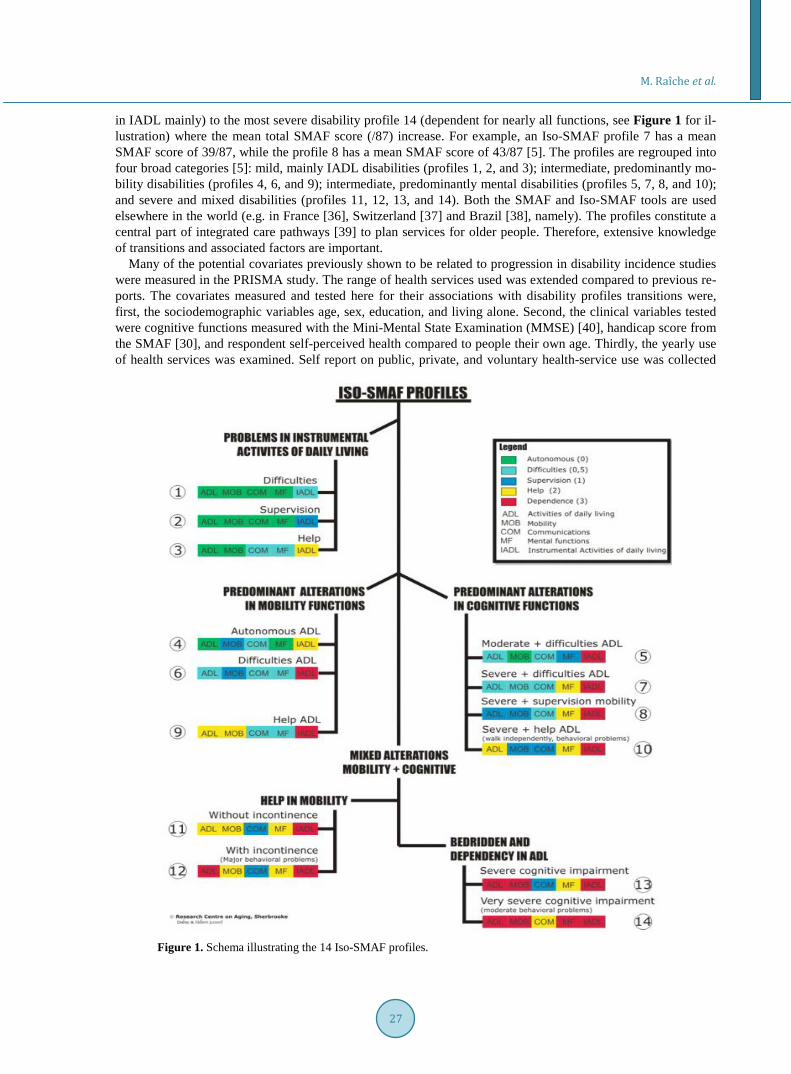
in IADL mainly) to the most severe disability profile 14 (dependent for nearly all functions, see Figure 1 for il-lustration) where the mean total SMAF score (/87) increase. For example, an Iso-SMAF profile 7 has a mean SMAF score of 39/87, while the profile 8 has a mean SMAF score of 43/87 [5]. The profiles are regrouped into four broad categories [5]: mild, mainly IADL disabilities (profiles 1, 2, and 3); intermediate, predominantly mo-bility disabilities (profiles 4, 6, and 9); intermediate, predominantly mental disabilities (profiles 5, 7, 8, and 10); and severe and mixed disabilities (profiles 11, 12, 13, and 14). Both the SMAF and Iso-SMAF tools are used elsewhere in the world (e.g. in France [36], Switzerland [37] and Brazil [38], namely). The profiles constitute a central part of integrated care pathways [39] to plan services for older people. Therefore, extensive knowledge of transitions and associated factors are important.
Many of the potential covariates previously shown to be related to progression in disability incidence studies were measured in the PRISMA study. The range of health services used was extended compared to previous re-ports. The covariates measured and tested here for their associations with disability profiles transitions were, first, the sociodemographic variables age, sex, education, and living alone. Second, the clinical variables tested were cognitive functions measured with the Mini-Mental State Examination (MMSE) [40], handicap score from the SMAF [30], and respondent self-perceived health compared to people their own age. Thirdly, the yearly use of health services was examined. Self report on public, private, and voluntary health-service use was collected
Figure 1. Schema illustrating the 14 Iso-SMAF profiles.

M. Raîche et al.
28
through bimonthly phone calls with calendar assistance, which proved highly reliable [41]. The variables rec-orded were emergency-department visits, hospitalizations, visits to day hospital or day center (geriatric rehabili-tation services), visits to and from health professionals (GPs, specialists, nurses, and other professionals), home help for ADL and IADL, and voluntary services. Two covariates were fixed in time (sex and education); all oth-ers were time-varying, as measured throughout the study. Since this analysis was based on PRISMA data [27] (quasi-experimental study), group (study/control) and recruitment wave were also considered as possible con-founders. Table 1 and Table 2 present the variables studied and their categories used in the analysis.
2.2. Statistical Analysis Multistate Markov models in continuous time were used to analyze the data. This method is used to describe the process in which an individual moves through a series of states in continuous time [42]-[52]. It considers the data, which represent observations of the process at arbitrary times (a “snapshot” of the process or “pan-el-observed” data). Interval censoring is therefore considered in the calculations.
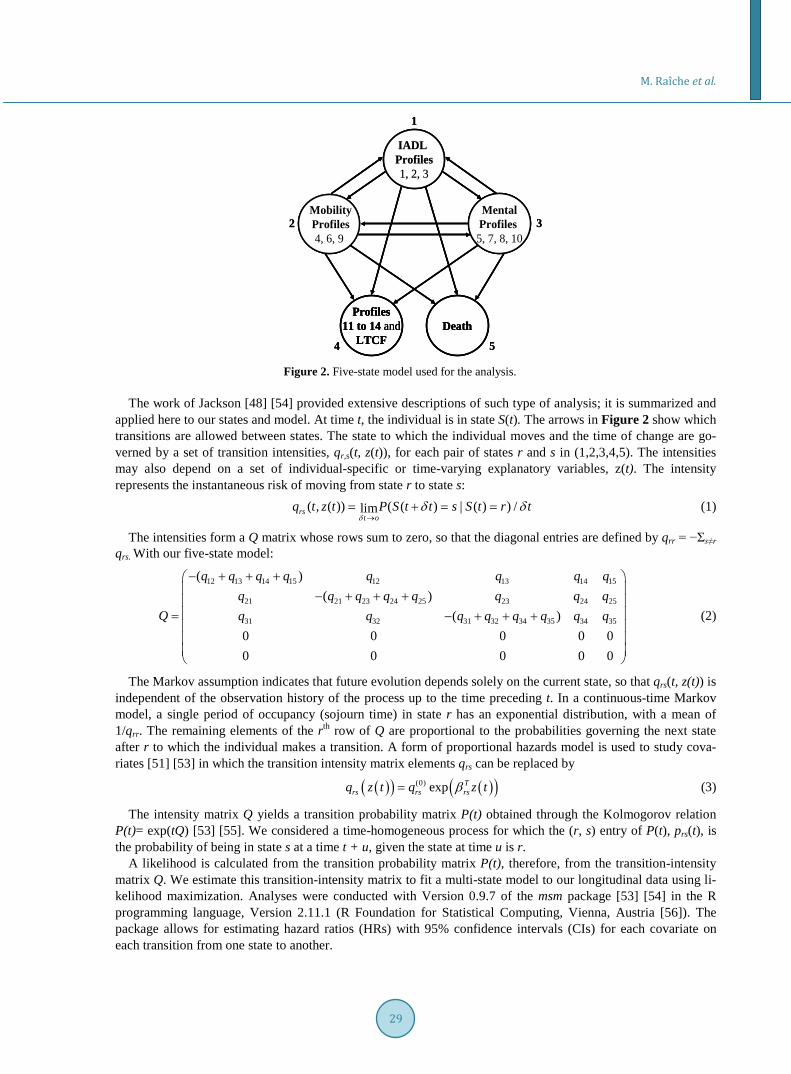
As a strategy to achieve convergence [48] [53] when studying covariates, the four broad Iso-SMAF profile categories were used in the analysis. Given the low prevalence of community-dwelling individuals in severe disability profiles 11 to 14, they were combined with “entry in LTCF” and this state was considered absorbing. In other words, transitions to this state were kept, but transitions from it were not estimated. Five states were therefore analyzed: 1) IADL profiles; 2) mobility profiles; 3) mental profiles; 4) severe profiles combined with LTCF entry (absorbing state); and 5) death (absorbing state). Figure 2 describes the 5-state model with circles representing states. Table 1. Description of personal and clinical variables.
Variable Age Sex Education Living alone Cognitive functions Handicap Self-perceiv
ed health Group Recruitment wave
Unit years 2 levels years 2 levels MMSE score
SMAF handicap
score 4 levels 2 levels 2 levels
Categories used in the analysis (*reference)
75 - 83/ 84+*
women*/ men 0 - 6*/7+ Yes/no* 0 - 23*/
24 - 30 0*/1+ Excellent* /other
Experimental* /comparison First*/second
% of the sample reference value 46.9% 62.8% 54.8% 73.4% 28.9% 41.0% 18.3% 50.9% 69.4%
% missing 0.0% 0.0% 0.8% 0.0% 0.7% 16.9% a 0.4% 0.0% 0.0%
Notes: MMSE = Mini-Mental State Examination; SMAF = French acronym for Functional Autonomy Measurement System. a. The handicap score was not measured at entry in the study for the first recruitment wave, which accounts for 841 missing data. There were no other missing data later in the study for the handicap score. Table 2. Description of variables of annual health-services use.
Variable ED visits Hospitali-zation PSEPFDa GP
visits Specialist MD visits
Nurse visits/ public
Nurse visits/ private
Professionalsb visits/ public
Professionalsb visits/ private
ADL help
IADL help
Voluntary services
Unit Number Days per year Number Number Number Number Number Number Number Hours Hours Number
Categories used in the
analysis (*reference)
0*/1+ 0 - 1*/2+ 0*/1+ 0 - 6*/7+ 0*/1+ 0*/1+ 0*/1+ 0*/1+ 0*/1+ 0*/1+ 0*/1+ 0*/1+
% of the sample
reference value
53.6% 70.0% 72.6% 75.1% 44.3% 61.6% 84.2% 74.3% 81.3% 56.6% 39.5% 84.9%
% missing c 28.3% 28.3% 28.3% 28.3% 28.3% 28.3% 28.3% 28.3% 28.3% 28.3% 28.3% 28.3%
Notes: ED = Emergency department; PSEPFD = Public services for the elders presenting functional decline; GP = General Practitioner; ADL = activ-ities of daily living; IADL = instrumental ADL. a. Public services for the elders presenting functional decline: public home-care services for ADL or IADL, day hospital or day center. b. Professionals other than MDs or nurses. c. The information on health-services use was not collected for the year preceding study entry. Consequently, information was missing for all 1386 subjects at baseline measure. There are only 22 other missing data during the study for service use (99.4% with complete data).
M. Raîche et al.
29
Figure 2. Five-state model used for the analysis.
The work of Jackson [48] [54] provided extensive descriptions of such type of analysis; it is summarized and applied here to our states and model. At time t, the individual is in state S(t). The arrows in Figure 2 show which transitions are allowed between states. The state to which the individual moves and the time of change are go-verned by a set of transition intensities, qr,s(t, z(t)), for each pair of states r and s in (1,2,3,4,5). The intensities may also depend on a set of individual-specific or time-varying explanatory variables, z(t). The intensity represents the instantaneous risk of moving from state r to state s:
( , ( )) ( ( ) | ( ) ) /limrst o
q t z t P S t t s S t r tδ
δ δ→
= + = = (1)
The intensities form a Q matrix whose rows sum to zero, so that the diagonal entries are defined by qrr = −Σs≠r qrs. With our five-state model:
12 13 14 15 12 13 14 15
21 21 23 24 25 23 24 25
31 32 31 32 34 35 34 35
( )( )
( )0 0 0 0 00 0 0 0 0
q q q q q q q qq q q q q q q q
Q q q q q q q q q
− + + + − + + + = − + + +
(2)
The Markov assumption indicates that future evolution depends solely on the current state, so that qrs(t, z(t)) is independent of the observation history of the process up to the time preceding t. In a continuous-time Markov model, a single period of occupancy (sojourn time) in state r has an exponential distribution, with a mean of 1/qrr. The remaining elements of the rth row of Q are proportional to the probabilities governing the next state after r to which the individual makes a transition. A form of proportional hazards model is used to study cova-riates [51] [53] in which the transition intensity matrix elements qrs can be replaced by
( )( ) ( )( )(0) exp Trs rs rsq z t q z tβ= (3)
The intensity matrix Q yields a transition probability matrix P(t) obtained through the Kolmogorov relation P(t)= exp(tQ) [53] [55]. We considered a time-homogeneous process for which the (r, s) entry of P(t), prs(t), is the probability of being in state s at a time t + u, given the state at time u is r.
A likelihood is calculated from the transition probability matrix P(t), therefore, from the transition-intensity matrix Q. We estimate this transition-intensity matrix to fit a multi-state model to our longitudinal data using li-kelihood maximization. Analyses were conducted with Version 0.9.7 of the msm package [53] [54] in the R programming language, Version 2.11.1 (R Foundation for Statistical Computing, Vienna, Austria [56]). The package allows for estimating hazard ratios (HRs) with 95% confidence intervals (CIs) for each covariate on each transition from one state to another.
IADL Profiles1, 2, 3
Profiles11 to 14 and
LTCFDeath
MentalProfiles 5, 7, 8, 10
MobilityProfiles4, 6, 9
1
2 3
4 5
IADL Profiles1, 2, 3
Profiles11 to 14 and
LTCFDeath
MentalProfiles 5, 7, 8, 10
MobilityProfiles4, 6, 9
IADL Profiles1, 2, 3
Profiles11 to 14 and
LTCFDeath
MentalProfiles 5, 7, 8, 10
MobilityProfiles4, 6, 9
1
2 3
4 5

M. Raîche et al.
30
2.3. Ethical Approval The study was approved by the University Institute of Geriatrics of Sherbrooke’s Ethics Review Board and all subjects signed approved consent forms.
3. Results 3.1. Transitions Observed The initial database contained 5173 states observed for 1501 subjects; 210 subjects (14%) were dropouts or losses to follow-up or moved out of the area [27]. Transitions from state 4 and participants with a single obser-vation were removed. The core data set contained 1386 participants with 4978 observations (yearly assessment, entry into LTCF, death; average of 3.6 observations by participant), generating 3592 observed transitions (from one state to the same or to another). Overall, during the study, 156 subjects were institutionalized (11.3%) and 269 died (19.4%).
3.2. Subjects Subject average baseline age was 83.1 years (range: 75 to 104); 62.5% of subjects were women. Forty-one per-cent lived in their own homes, 28% were tenants or boarders in apartments, and the remaining 31% were in pri-vate residences for older people; 23.5% considered they lived alone. Most subjects reported excellent (20%) or good (49%) self-perceived health. MMSE scores ranged from 0 to 30 with a mean of 24.5/30, while SMAF dis-ability scores ranged from 0 to 57 with a mean of 18.9/87. At study entry, 66.5% of the sample was in state 1 (IADL profiles), 21.9% in state 2 (mobility profiles), and 11.5% in state 3 (mental profiles).
3.3. Annual Transitions and Associated Covariates Table 3 shows the raw annual transition probabilities with 95% CIs between the five states of the model. These probabilities were not adjusted for any covariates. The annual probability of staying in a state was higher for mild IADL profiles than intermediate mobility or mental profiles. The probability of transitioning to severe pro-files or LTCF (state 4) was highest for mental profiles, while the probability of death was equal for mobility or mental profiles. Recovery to mild IADL profiles was low but present for both mobility and mental profiles.
The hazard ratios (HRs) with 95% CIs are presented in Table 4 for personal and clinical factors associated with at least one transition and in Table 5 for health-services use. The variables group (study/control), recruit-ment wave, and three health-services use variables were not significantly associated with any transition. Greater age and receiving help for ADL were significantly associated with 4 of the 12 transitions studied, involving more decline and less recovery. Altered cognitive functions and being hospitalized (≥2 days/year) were asso-ciated with 3 transitions related to decline. From mild profiles (state 1), the men were at higher risk (1/HR: 2.3, 95% CI 1.45, 3.56) of transitioning to intermediate mental profiles and to die (1/HR: 1.7, 95% CI 1.01, 2.94), Table 3. Matrix of Iso-SMAF profilesannual transitions probabilities for community-dwelling older adults at risk of func- tional decline.
To Froma
State 1 (IADL profiles)
State 2 (Mobility profiles)
State 3 (Mental profiles)
State 4 (Severe profile or LTCF entry)b
State 5 (Death)b
State 1 (IADL profiles) 0.79c 0.10 0.05 0.02 0.04
0.77, 0.81 0.09, 0.11 0.04, 0.06 0.02, 0.03 0.04, 0.05 State 2 (Mobility
profiles) 0.11 0.57 0.09 0.09 0.14
0.09, 0.13 0.54, 0.60 0.07, 0.11 0.08, 0.11 0.11, 0.16 State 3
(Mental profiles) 0.07 0.10 0.50 0.19 0.14
0.05, 0.10 0.09, 0.12 0.46, 0.54 0.15, 0.22 0.11, 0.17
Notes: IADL = instrumental activities of daily living; LTCF = long-term-care facilities. a. The left column represents the starting states; the top row represents the arrival states. b. Severe profiles (11-12-13-14) or LTCF, and death are absorbing states. c. Annual transitions probabilities are reported with 95% confidence intervals. Underlined and bolded diagonal values represent the probability of stability over 1 year.

M. Raîche et al.
31
Table 4. Personal and clinical factors associated with Iso-SMAF profiles transitions.
Covariate Age Sex Education Cognitive functions Handicap Self-perceived
health Category ≥84 Women 0 - 6 years MMSE score 0 - 23 Unmet needs Not excellent
From To HR CI HR CI HR CI HR CI HR CI HR CI State 1 State 2 1.99 1.49, 2.67 2.32 1.61, 3.36 0.85 0.64, 1.13 1.25 0.79, 1.98 2.52 1.77, 3.60 2.93 1.79, 4.78 (IADL) State 3 1.98 1.18, 3.32 0.44 0.28, 0.69 1.11 0.70, 1.76 7.34 4.67, 11.6 1.53 0.91, 2.56 1.13 0.68, 1.88
State 4a 0.49 0.0,b 0.55 0.21, 1.48 1.53 0.55, 4.23 1.02 0.03, 33.6 0.19 0, 11.3 1.07 0.29, 4.00 State 5a 1.02 0.49, 2.13 0.58 0.34, 0.99 1.98 1.14, 3.44 0.80 0.34, 1.85 0.86 0.43, 1.71 1.28 0.66, 2.48
State 2 State 1 0.42 0.26, 0.69 0.89 0.47, 1.68 0.65 0.40, 1.07 0.60 0.27, 1.34 0.88 0.48, 1.61 1.73 0.69, 4.31 (Mobility) State 3 1.09 0.65, 1.83 1.45 0.67, 3.14 1.83 1.09, 3.07 2.92 1.78, 4.78 0.76 0.44, 1.33 0.63 0.31, 1.25
State 4a 1.43 0.82, 2.50 0.69 0.42, 1.14 1.13 0.69, 1.87 2.13 1.34, 3.39 1.00 0.51, 1.94 0.80 0.39, 1.66 State 5a 1.10 0.70, 1.72 0.75 0.46, 1.24 1.03 0.67, 1.58 1.54 0.98, 2.41 1.01 0.56, 1.83 1.98 0.49, 1.99
State 3 State 1 0.38 0.05, 2.73 0.74 0.07, 8.50 0.44 0.07, 2.65 0.30 0.06, 1.35 0.85 0.09, 8.22 1.06 0.21, 5.21 (Mental) State 2 0.89 0.24, 3.37 1.51 0.22, 10.4 0.81 0.20, 3.38 0.41 0.15, 1.12 1.69 0.42, 6.82 0.64 0.22, 1.85
State 4a 1.40 0.88, 2.22 1.68 1.12, 2.53 0.99 0.63, 1.55 1.07 0.65, 1.76 1.15 0.70, 1.91 1.00 0.57, 1.76 State 5a 2.31 1.24, 4.29 0.90 0.50, 1.62 1.13 0.62, 2.06 1.28 0.45, 3.60 1.91 0.93, 3.91 1.56 0.65, 3.70
Notes: significant HR in bold; IADL = instrumental activities of daily living; LTCF = long-term-care facilities; HR = Hazard ratio; MMSE = Mini-Mental State Examination; SMAF = French acronym for Functional Autonomy Measurement System. a. State 4 (Severe profile or LTCF entry) and state 5 (death) are absorbing states. b. Very wide confidence interval due to few observed transitions combined with skewed covariate distribution in that specific transition. Table 5. Annualhealth-services use associated with Iso-SMAF profile transitions.
Covariatea ED visits Hospitalization PSEPFDb GP visits Nurse visits/ public
Nurse visits/ private ADL help IADL help
Category ≥ 1 ≥ 2 days ≥ 1 ≥ 7 ≥ 1 ≥ 1 ≥ 1 hour ≥ 1 hour From To HR CI HR CI HR CI HR CI HR CI HR CI HR CI HR CI
State 1 State 2 1.67 1.17, 2.38 1.66 1.11,
2.50 1.85 1.23, 2.79 1.29 0.87,
1.93 1.17 0.82, 1.67 1.60 1.02,
2.51 4.03 2.82, 5.75 2.96 1.75, 5.0
(IADL) State 3 0.66 0.32, 1.40 1.18 0.50,
2.81 1.18 0.51, 2.73 1.96 1.06,
3.59 0.99 0.53, 1.83 0.98 0.40,
2.43 0.79 0.29, 2.16 0.99 0.56,
1.74
State 4c 1.07 0.03, d 1.13 0.07,
17.4 0.27 0.0, d 0.94 0.05, 18.9 0.71 0.10,
4.89 0.45 0.02, 8.20 0.99 0.01,d 2.27 0.21, d
State 5c 1.93 1.03, 3.60 2.62 1.32,
5.21 1.18 0.45, 3.10 1.79 0.89,
3.60 2.01 1.02, 3.96 1.40 0.56,
3.48 1.17 0.45, 2.99 1.34 0.69,
2.63
State 2 State 1 1.30 0.68, 2.47 1.05 0.52,
2.14 0.75 0.39, 1.45 0.45 0.21,
0.96 1.28 0.67, 2.45 0.81 0.37,
1.78 0.50 0.26, 0.96 0.70 0.23,
2.13
(Mobility) State 3 1.30 0.71, 2.40 1.06 0.56,
2.0 0.92 0.51, 1.67 1.46 0.79,
2.71 0.85 0.46, 1.55 1.08 0.53,
2.18 1.15 0.63, 2.10 1.10 0.52,
2.33
State 4c 1.33 0.71, 2.47 0.69 0.33,
1.44 1.52 0.81, 2.84 1.20 0.65,
2.23 1.25 0.66, 2.37 2.21 1.20,
4.09 2.35 1.07, 5.16 1.71 0.76,
3.85
State 5c 1.79 0.99, 3.25 1.94 1.05,
3.59 1.35 0.73, 2.51 1.11 0.59,
2.06 1.39 0.77, 2.49 1.05 0.55,
2.01 2.07 1.02, 4.18 1.93 0.88,
4.24
State 3 State 1 1.37 0.16, 11.6 1.63 0.15,
18.1 0.48 0.06, 4.24 1.10 0.18,
6.84 0.57 0.06, 5.80 0.82 0.06,
12.0 0.64 0.03, 13.2 0.50 0.0,d
(Mental) State 2 1.18 0.25, 5.65 1.48 0.29,
7.54 0.91 0.23, 3.65 2.09 0.73,
5.96 0.77 0.16, 3.85 1.16 0.17,
8.04 1.53 0.14, 16.9 1.46 0.0,d
State 4c 0.90 0.53, 1.50 0.72 0.39,
1.32 1.18 0.70, 1.98 0.90 0.51,
1.58 0.69 0.41, 1.16 1.18 0.63,
2.21 1.73 0.98, 3.06 1.19 0.70,
2.05
State 5c 1.16 0.58, 2.31 1.00 0.46,
2.16 0.74 0.36, 1.51 1.01 0.47,
2.14 1.72 0.85, 3.45 0.93 0.41,
2.13 0.73 0.35, 1.49 0.60 0.27,
1.30
Notes: ADL = activities of daily living; IADL = instrumental ADL; LTCF = long-term-care facilities; HR = Hazard ratio; ED = Emergency depart-ment; PSEPFD = Public services for the elders presenting functional decline; GP = General practitioner. a. Variables not significantly associated with any transitions are not shown: voluntary services and visits to some professionals (specialists; professionals other than MDs or nurses working in pub-lic sector). b.Public services for the elders presenting functional decline: Public home-care services for ADL or IADL, day hospital or day center. c. State 4 (Severe profile or LTCF entry) and state 5 (death) are absorbing states. d. Very wide confidence interval due to few observed transitions com-bined with skewed covariate distribution in that specific transition.
M. Raîche et al.
32
while women were at higher risk of transitioning to intermediate mobility profiles (HR: 2.3, 95% CI 1.61, 3.36). Being younger, having 0 to 6 GP visits/year (as opposed to 7+), and not using services for ADL were the only 3 variables associated with recovery from intermediate mobility profiles to mild IADL profiles. Associations were found between 6 health-services-use-related variables and transitions from IADL profiles to mobility profiles, while 5 of these variables were also associated with transitions from any state to death. Despite many attempts, it was impossible to achieve convergence with 2 variables: living alone and visits to professionals other than MDs or nurses working in private sector.
4. Discussion 4.1. Overview This study aimed at exploring the covariates associated with transitions between different disability profiles. Firstly, the convergence of the analysis is evidence of the possible identification of covariates in a cohort of persons aged 75 or over. Secondly, the results highlight the study’s exploratory aspect. Despite many attempts, we did not obtain convergence of the analysis with more than 2 covariates studied simultaneously. Therefore, a final “multivariate” analysis could not be performed to include all the covariates associated with at least 1 tran-sition. This study constitutes a first step in exploring the link between disability-profile transitions and sociode-mographic, clinical, and health-services-use-related covariates in a community-dwelling older adult population at risk of functional decline.
Sex is the only covariate previously studied in association with profile transitions [9]. Despite the classifica-tion differences, results from Lafortune et al. with the “Health State Profiles” are coherent with ours in 2 transi-tions. They reported that the transition from their “cognitively impaired” profile to their “cognitively and physi-cally impaired” profile seemed greater for women than men. A transition from their “relatively healthy” profile to death also seemed greater for men than women in 1 of the 2 periods reported. Yet probabilities of transitions from “relatively healthy” to “physically impaired” or to “cognitively impaired” were similar for men and women in Lafortune’s study.
Since a certain hierarchy exists from state 1 (mild IADL profiles) to states 2 or 3 (intermediate mobility or mental) to state 4 (severe profiles 11 to 14 combined with LTCF entry), the direction of some associations ap-pears similar to what was generally reported in disability incidence studies in terms of increased severity. This is the case with age, where the oldest people were at greater risk for transitioning from mild to intermediate pro-files. From mental profiles, the oldest people had a greater risk of death; from mobility profiles, the youngest had a greater chance of recovering to mild IADL profiles. But being 84 or over was not associated with transi-tions between intermediate profiles and or with recovery from mental profiles.
Disability-profile transitions, however, yield differences for studying associated covariates compared to the literature on disability incidence studies. The presence of two intermediate states (mobility and mental profiles) allows for examining covariates of transitions to equivalent levels of disability but with different predominance. In incidence studies, less education was associated with a higher level of risk for increased disabilities [12] [14] [16]. We observed that low education was associated with transitions from IADL profiles to death, but also noted that low education was related to transitions from mobility profiles to mental profiles, which does not correspond to a net increase in disabilities.
As expected, low MMSE scoreswere associated with transition from mobility to mental profiles. Low MMSE scoreswere also associated with increasing profile severity (both from mild IADL and intermediate mobility profiles). A relationship between low cognitive functioning and a larger number of disabilities was also reported in incidence studies [15] [16] [20].
The SMAF handicap score [30] is a measure of unmet needs. The presence of at least one handicap is asso-ciated with transition from mild IADL profiles to intermediate mobility profiles. This confirms the association stated by Sands et al. [26] and LaPlante et al. [25], that an unmet need is associated with disability deterioration. Only one transition revealed a significant association, however. A self-perceived health response other than “excellent” was associated with transition from IADL profiles to mobility profiles. This is also coherent with previous associations reported between poor self-perceived health and increased disability [11] [22].
The causal aspect of health-services use versus disability state is ambiguous in longitudinal analyses, since these phenomena influence each other over time. A change in disabilities could cause a change in service use; the services received could influence disability progression. Health-services use seems to be more a marker of

M. Raîche et al.
33
disability severity as evidenced by associations previously reported between use of some services and disability progression [11] [12] [14] [24]. Overall, the relationships we found between transitions and health-services use were in this direction, i.e., more use was associated with state deterioration or less recovery. Use of four types of health-services was significantly associated with transition to death, two of which being acute services (ED vis-its and hospitalization). More types of health services were associated with the transition from IADL profiles to mobility profiles (six types of services) than to mental profiles (only visits to GPs). We did not find that a high level of home help for IADL had a protective effect for death, although others did [14].
Overall, more significant associations were observed for transitions from mild IADL profiles than from in-termediate profiles. This is a consequence of the large number of transitions observed from state 1 in the PRISMA study, and statistical power may have been too weak to detect associations with transitions from other states. For example, individuals with ≥ 1 visit to ED had an HR of 1.79 (95% CI: 0.99, 3.25) of transitioning from mobility profiles to death.
More research is needed to confirm these exploratory results. Understanding transitions and the factors related to transitions between profiles may provide opportunities to develop clinical approaches more adapted to the specific trajectory for each profile in the older disabled population. Future analyses will require larger cohorts to study covariates, but our preliminary results can be useful in planning future studies in terms of sample-size de-termination and relationships to expect.
4.2. Limitations and Strengths Potential covariates were not all measured in the PRISMA study. As a consequence, comorbidity, depression, and social contacts could not be investigated in our analysis. Our sample size (1386 participants with 3592 tran-sitions) did not allow for studying transitions to and from each of the 14 profiles separately, and covariates could not be analyzed simultaneously. Another limitation was our inability to study covariates associated with transi-tion probabilities from state 4 (severe profiles). In fact, most people corresponding to these severe profiles live in long-term-care settings and a study specifically targeting this group would yield more information. Lastly, it is difficult to compare our study to other disability-based classifications for transitions. Since disability-profile transitions themselves have seldom been reported to date and only sex has been studied, comparisons are very limited. The scant literature in this field is quite surprising considering the widespread use of some classifica-tions. This points to the need for evidence-based information.
This study also has strengths. The Iso-SMAF profiles are based on a thorough evaluation of disabilities. Both the classification (Iso-SMAF profiles) and evaluation tool (SMAF) had undergone many validation processes [5] [30] [32]-[34]. An extensive measure of disability may help identify different covariate associations [57]. The SMAF was administered in a research-based protocol (PRISMA), instead of using administrative data to esti-mate transitions. An extensive list of health services were measured and tested as covariates. The statistic-al-analysis method takes into account the continuous evolution of the disability process with intermittent obser-vation. The method also allows for obtaining HRs with 95% CIs to quantify the association of covariates with transitions.
5. Conclusion This study presented detailed results on covariates associated with transition probabilities of a disability-based classification. The classification being used in clinical settings, the results shed some light on factors associated with the progression of older people throughout the main categories of profiles. Studying disability-profile tran-sitions revealed associations similar to those reported in the literature on disability incidence studies. We were able to go further and examine correlates of transitions between two intermediate-profile categories with differ-ent predominance (mobility and mental) of disabilities. These might help understanding the complex progres-sion of disabilities in older people, and provide preliminary information on factors associated with transitions that should be considered in service planning (e.g. unmet needs linked to decline).
Acknowledgements We are very grateful to the older persons who participated in this study. Our thanks also go out to all the people who worked on the research project, to Rob Balshaw for showing the way to multi-state model analysis, and to
M. Raîche et al.
34
Chris Jackson for developing the msm package in R software. The PRISMA study was supported by the Canadian Institutes of Health Research, Quebec’s Ministry of Health and Social Services, the Estrie Regional Health and Social Services Agency, and the Université de Sherbrooke. The first author [M.R.] was supported for doctoral scholarships from the Canadian Institutes of Health Research, the FORMSAV network, and the Université de Sherbrooke.
References [1] Stineman, M.G., Ross, R.N., Fiedler, R., Granger, C.V. and Maislin, G. (2003) Functional Independence Staging:
Conceptual Foundation, Face Validity, and Empirical Derivation. Archives of Physical Medicine Rehabilitation, 84, 29-37. http://dx.doi.org/10.1053/apmr.2003.50061
[2] St Pierre, M. and Dombi, W.A. (2000) Home Health PPS: New Payment System, New Hope. Caring, 19, 6-11. [3] Wieland, D., Lamb, V., Wang, H., Sutton, S., Eleazer, G.P. and Egbert, J. (2000) Participants in the Program of
All-Inclusive Care for the Elderly (PACE) Demonstration: Developing Disease-Impairment-Disability Profiles. Gerontologist, 40, 218-227. http://dx.doi.org/10.1093/geront/40.2.218
[4] Manton, K.G., Stallard, E. and Corder, L.S. (1998) The Dynamics of Dimensions of Age-Related Disability 1982 to 1994 in the U.S. Elderly Population. Journals of Gerontology Series A: Medical Sciences, 53, B59-B70. http://dx.doi.org/10.1093/gerona/53A.1.B59
[5] Dubuc, N., Hébert, R., Desrosiers, J., Buteau, M. and Trottier, L. (2006) Disability-Based Classification System for Older People in Integrated Long-Term Care Services: The Iso-SMAF Profiles. Archives of Gerontology and Geriatrics, 42, 191-206. http://dx.doi.org/10.1016/j.archger.2005.07.001
[6] Coutton, V. (2000) The Mechanisms of AGGIR Grid. [Les Mécanismes De La Grille AGGIR.] Convention d’étude No 99/13/0019, Ministère de l’emploi et de la Solidarité, Direction de la Recherche, des Études, de l’évaluation et des Statistiques, Équipe INSERM, Démographie et Santé. Montpellier, France.
[7] Morris, J.N., Fries, B.E., Bernabei, R., Steel, K., Ikegami, N., Carpenter, I., Gilgen, R., DuPasquier, J.N., Frijters, D., Henrard, J.C., Hirdes, J. and Belleville-Taylor, P. (1999) RAI Home Care (RAI-HC) Assessment Manual© for Version 2.0; Primer on Use of the Minimum Data Set-Home Care (MDS-HC) Version 2.0© and the Client Assessment Proto-cols (CAPS). Hebrew Rehabilitation Center for Aged. Boston, MA.
[8] Lafortune, L., Beland, F., Bergman, H. and Ankri, J. (2009) Health State Profiles and Service Utilization in Commu-nity-Living Elderly. Medical Care, 47, 286-294. http://dx.doi.org/10.1097/MLR.0b013e3181894293
[9] Lafortune, L., Beland, F., Bergman, H. and Ankri, J. (2009) Health Status Transitions in Community-Living Elderly with Complex Care Needs: A Latent Class Approach. BMC Geriatrics, 9, 6. http://dx.doi.org/10.1186/1471-2318-9-6
[10] Raîche, M., Hébert, R., Dubois, M.F., Gueye, N.R. and Dubuc, N. (2012) Yearly Transitions of Disability Profiles in Older People Living at Home. Archives of Gerontology and Geriatrics, 55, 399-405. http://dx.doi.org/10.1016/j.archger.2011.12.007
[11] Mor, V., Wilcox, V., Rakowski, W. and Hiris, J. (1994) Functional Transitions among the Elderly: Patterns, Predictors, and Related Hospital Use. American Journal of Public Health, 84, 1274-1280. http://dx.doi.org/10.2105/AJPH.84.8.1274
[12] Peres, K., Verret, C., Alioum, A. and Barberger-Gateau, P. (2005) The Disablement Process: Factors Associated with Progression of Disability and Recovery in French Elderly People. Disability and Rehabilitation, 27, 263-276. http://dx.doi.org/10.1080/09638280400006515
[13] Rudberg, M.A., Parzen, M.I., Leonard, L.A. and Cassel, C.K. (1996) Functional Limitation Pathways and Transitions in Community-Dwelling Older Persons. Gerontologist, 36, 430-440. http://dx.doi.org/10.1093/geront/36.4.430
[14] Barberger-Gateau, P., Pérès, K., Lagalaye, L., Nikulin, M., Andrieu, S. and Alioum, A. (2005) Dementia and Func-tional Decline of older person [Démence et Perte d'autonomie Fonctionnelle du Sujet Âgé]. Revue Medicale Assurance Maladie, 36, 69-76.
[15] Hébert, R., Brayne, C. and Spiegelhalter, D. (1999) Factors Associated with Functional Decline and Improvement in a Very Elderly Community-Dwelling Population. American Journal of Epidemiology, 150, 501-510. http://dx.doi.org/10.1093/oxfordjournals.aje.a010039
[16] Deeg, D.J. (2005) Longitudinal Characterization of Course Types of Functional Limitations. Disability and Rehabilita-tion, 27, 253-261. http://dx.doi.org/10.1080/09638280400006507
[17] Beckett, L.A., Brock, D.B., Lemke, J.H., Mendes de Leon, C.F., Guralnik, J.M., Fillenbaum, G.G., Branch, L.G., Wetle, T.T. and Evans, D.A. (1996) Analysis of Change in Self-Reported Physical Function among Older Persons in Four Population Studies. American Journal of Epidemiology, 143, 766-778. http://dx.doi.org/10.1093/oxfordjournals.aje.a008814

M. Raîche et al.
35
[18] Dunlop, D.D., Hughes, S.L. and Manheim, L.M. (1997) Disability in Activities of Daily Living: Patterns of Change and a Hierarchy of Disability. American Journal of Public Health, 87, 378-383. http://dx.doi.org/10.2105/AJPH.87.3.378
[19] Ferrucci, L., Guralnik, J.M., Simonsick, E., Salive, M.E., Corti, C. and Langlois, J. (1996) Progressive Versus Catas-trophic Disability: A Longitudinal View of the Disablement Process. Journals of Gerontology Series A: Medical Sci-ences, 51, M123-M130. http://dx.doi.org/10.1093/gerona/51A.3.M123
[20] Beland, F. and Zunzunegui, M.V. (1999) Predictors of Functional Status in Older People Living at Home. Age and Ageing, 28, 153-159. http://dx.doi.org/10.1093/ageing/28.2.153
[21] Van Houwelingen, A.H., Cameron, I.D., Gussekloo, J., Putter, H., Kurrle, S., De Craen, A.J., Maier, A.B., Den Elzen, W.P. and Blom, J.W. (2014) Disability Transitions in the Oldest Old in the General Population. The Leiden 85-Plus Study. Age (Dordr), 36, 483-493. http://dx.doi.org/10.1007/s11357-013-9574-3
[22] Anderson, R.T., James, M.K., Miller, M.E., Worley, A.S. and Longino Jr., C.F. (1998) The Timing of Change: Patterns in Transitions in Functional Status among Elderly Persons. Journals of Gerontology Series B: Social Sciences, 53, S17-S27. http://dx.doi.org/10.1093/geronb/53B.1.S17
[23] Mendes de Leon, C.F., Glass, T.A., Beckett, L.A., Seeman, T.E., Evans, D.A. and Berkman, L.F. (1999) Social Net-works and Disability Transitions across Eight Intervals of Yearly Data in the New Haven Epese. Journals of Geron-tology Series B: Social Sciences, 54, S162-S172. http://dx.doi.org/10.1093/geronb/54B.3.S162
[24] Gill, T.M., Robison, J.T. and Tinetti, M.E. (1998) Difficulty and Dependence: Two Components of the Disability Con-tinuum among Community-Living Older Persons. Annals of Internal Medicine, 128, 96-101. http://dx.doi.org/10.7326/0003-4819-128-2-199801150-00004
[25] LaPlante, M.P., Kaye, H.S., Kang, T. and Harrington, C. (2004) Unmet Need for Personal Assistance Services: Esti-mating the Shortfall in Hours of Help and Adverse Consequences. Journals of Gerontology Series B: Social Sciences, 59, S98-S108. http://dx.doi.org/10.1093/geronb/59.2.S98
[26] Sands, L.P., Xu, H., Craig, B.A., Eng, C. and Covinsky, K.E. (2008) Predicting Change in Functional Status over Quarterly Intervals for Older Adults Enrolled in the PACE Community-Based Long-Term Care Program. Aging Clini-cal and Experimental Research, 20, 419-427. http://dx.doi.org/10.1007/BF03325147
[27] Hébert, R., Raîche, M., Dubois, M.F., Gueye, N.R., Dubuc, N. and Tousignant, M. (2010) Impact of PRISMA, a Coor-dination-Type Integrated Service Delivery System for Frail Older People in Quebec (Canada): A Quasi-Experimental Study. Journals of Gerontology Series B: Social Sciences, 65B, 107-118. http://dx.doi.org/10.1093/geronb/gbp027
[28] Hébert, R., Bravo, G., Korner-Bitensky, N. and Voyer, L. (1996) Predictive Validity of a Postal Questionnaire for Screening Community-Dwelling Elderly Individuals at Risk of Functional Decline. Age Ageing, 25, 159-167. http://dx.doi.org/10.1093/ageing/25.2.159
[29] Hébert, R., Dubois, M.F., Raîche, M. and Dubuc, N. (2008) The Effectiveness of the PRISMA Integrated Service De-livery Network: Preliminary Report on Methods and Baseline Data. International Journal of Integrated Care, 8, e1- e15.
[30] Hébert, R., Guilbeault, J., Desrosiers, J. and Dubuc, N. (2001) The Functional Autonomy Measurement System (SMAF): A Clinical-Based Instrument for Measuring Disabilities and Handicaps in Older People. Geriatrics Today: Journal Canadian Geriatric Society, 4, 141-147.
[31] World Health Organization (1980) International Classification of Impairments, Disabilities, and Handicaps: A Manual of Classification Relating to the Consequences of Disease. WHO.
[32] Hébert, R., Carrier, R. and Bilodeau, A. (1988) The Functional Autonomy Measurement System (SMAF): Description and Validation of an Instrument for the Measurement of Handicaps. Age and Ageing, 17, 293-302. http://dx.doi.org/10.1093/ageing/17.5.293
[33] Hébert, R., Spiegelhalter, D.J. and Brayne, C. (1997) Setting the Minimal Metrically Detectable Change on Disability Rating Scales. Archives of Physical Medicine and Rehabilitation, 78, 1305-1308. http://dx.doi.org/10.1016/S0003-9993(97)90301-4
[34] Desrosiers, J., Bravo, G., Hébert, R. and Dubuc, N. (1995) Reliability of the Revised Functional Autonomy Measure-ment System (SMAF) for Epidemiological Research. Age and Ageing, 24, 402-406. http://dx.doi.org/10.1093/ageing/24.5.402
[35] Hébert, R., Dubuc, N., Buteau, M., Desrosiers, J., Bravo, G., Trottier, L., St-Hilaire, C. and Roy, C. (2001) Resources and Costs Associated with Disabilities of Elderly People Living at Home and Institutions. Canadian Journal on Aging, 20, 1-21. http://dx.doi.org/10.1017/S0714980800012113
[36] Gervais, P., Hebert, R., Lamontagne, J. and Tousignant, M. (2011) Implementation of Functional Autonomy Meas-urement System: Barriers and Facilitators in Pise-Dordogne Project. Gériatrie Psychologie Neuropsychiatrie Vieillis-sement, 9, 417-428.

M. Raîche et al.
36
[37] Dubuc, N., Corbin, C., Beaudry, M., Delli-Colli, N. and Raiche, M. (2013) Development of Algorithms to Support De-cision-Making in Orienting Disabled in the Canton of Geneva's Health-Care System [Développement d’algorithmes de soutien à la décision d’orientation des personnes en perte d’autonomie dans le réseau de soins du Canton de Genève]. Santé Publique, 25, 179-192.
[38] Giacomin, K.C., Peixoto, S.V., Uchoa, E. and Lima-Costa, M.F. (2008) A Population-Based Study on Factors Associ-ated with Functional Disability among Older Adults in the Great Metropolitan Belo Horizonte, Minas Gerais State, Brazil. Cad Saude Publica, 24, 1260-1270. http://dx.doi.org/10.1590/S0102-311X2008000600007
[39] Dubuc, N., Bonin, L., Tourigny, A., Mathieu, L., Couturier, Y., Tousignant, M., Corbin, C., Delli-Colli, N. and Raiche, M. (2013) Development of Integrated Care Pathways: Toward a Care Management System to Meet the Needs of Frail and Disabled Community-Dwelling Older People. International Journal of Integrated Care, 13, e017.
[40] Folstein, M.F., Folstein, S.E. and McHugh, P.R. (1975) “Mini-Mental State”. A Practical Method for Grading the Cognitive State of Patients for the Clinician. Journal of Psychiatric Research, 12, 189-198. http://dx.doi.org/10.1016/0022-3956(75)90026-6
[41] Dubois, M.F., Raîche, M., Hébert, R. and Gueye, N.R. (2007) Assisted Self-Report of Health-Services Use Showed Excellent Reliability in a Longitudinal Study of Older Adults. Journal of Clinical Epidemiology, 60, 1040-1045. http://dx.doi.org/10.1016/j.jclinepi.2006.12.011
[42] Andersen, P.K. (1988) Multistate Models in Survival Analysis: A Study of Nephropathy and Mortality in Diabetes. Statistics in Medicine, 7, 661-670. http://dx.doi.org/10.1002/sim.4780070605
[43] Andersen, P.K., Esbjerg, S. and Sorensen, T.I. (2000) Multi-State Models for Bleeding Episodes and Mortality in Liver Cirrhosis. Statistics in Medicine, 19, 587-599. http://dx.doi.org/10.1002/(SICI)1097-0258(20000229)19:4<587::AID-SIM358>3.3.CO;2-S
[44] Andersen, P.K. and Keiding, N. (2002) Multi-State Models for Event History Analysis. Statistical Methods in Medical Research, 11, 91-115. http://dx.doi.org/10.1191/0962280202SM276ra
[45] Commenges, D. (1999) Multi-State Models in Epidemiology. Lifetime Data Analysis, 5, 315-327. http://dx.doi.org/10.1023/A:1009636125294
[46] Gentleman, R.C., Lawless, J.F., Lindsey, J.C. and Yan, P. (1994) Multi-State Markov Models for Analysing Incom-plete Disease History Data with Illustrations for Hiv Disease. Statistics in Medicine, 13, 805-821. http://dx.doi.org/10.1002/sim.4780130803
[47] Hougaard, P. (1999) Multi-State Models: A Review. Lifetime Data Analysis, 5, 239-264. http://dx.doi.org/10.1023/A:1009672031531
[48] Jackson, C.H., Sharples, L.D., Thompson, S.G., Duffy, S.W. and Couto, E. (2003) Multistate Markov Models for Dis-ease Progression with Classification Error. Journal of Royal Statistical Society, Series D: The Statistician, 52, 1-17. http://dx.doi.org/10.1111/1467-9884.00351
[49] Kay, R. (1986) A Markov Model for Analysing Cancer Markers and Disease States in Survival Studies. Biometrics, 42, 855-865. http://dx.doi.org/10.2307/2530699
[50] Keiding, N., Klein, J.P. and Horowitz, M.M. (2001) Multi-State Models and Outcome Prediction in Bone Marrow Transplantation. Statistics in Medicine, 20, 1871-1885. http://dx.doi.org/10.1002/sim.810
[51] Marshall, G. and Jones, R.H. (1995) Multi-State Models and Diabetic Retinopathy. Statistics in Medicine, 14, 1975- 1983. http://dx.doi.org/10.1002/sim.4780141804
[52] Therneau, T.M. and Grambsch, P.M. (2000) Modeling Survival Data: Extending the Cox Model. Springer-Verlag, New York.
[53] Jackson, C.H. (2010) Multi-State Modelling with R: The Msm Package. Version 0.9.7. http://cran.r-project.org/web/packages/msm/index.html
[54] Jackson, C.H. (2011) Multi-State Models for Panel Data: The Msm Package for R. Journal of Statistical Software, 38, 1-28.
[55] Cox, D.R. and Miller, H.D. (1965) The Theory of Stochastic Processes. John Wiley & Sons, New York. [56] R Development Core Team (2011) R 2.11.1: A Language and Environment for Statistical Computing. R Foundation
for Statistical Computing. Vienna, Austria. [57] LaPlante, M.P. (2010) The Classic Measure of Disability in Activities of Daily Living Is Biased by Age but an Ex-
panded IADL/ADL Measure Is Not. Journals of Gerontology Series B: Social Sciences, 65, 720-732. http://dx.doi.org/10.1093/geronb/gbp129
Related Documents