Institute for Global Environmental Strategies (IGES) Economic Analysis of Composting, Through Surabaya’s case: Application in Bangkok Bangkok Palace Hotel 6 November 2008 Toshizo Maeda Researcher, IGES Kitakyushu Office Kitakyushu Initiative for a Clean Environment IGES | http://www.iges.or.jp Kitakyushu Initiative for a Clean Environment http://kitakyushu.iges.or.jp/ Economic analyses of composting, through Surabaya’s case: Application in Bangkok 2 Contents: 1. Introduction of IGES 2. Introduction of Kitakyushu City 3. Introduction of Kitakyushu Initiative (KI) Programme 4. Surabaya’s community-based waste management 5. Application in Bangkok IGES | http://www.iges.or.jp Kitakyushu Initiative for a Clean Environment http://kitakyushu.iges.or.jp/ Economic analyses of composting, through Surabaya’s case: Application in Bangkok 3 1. Introduction of IGES • Institute for Global Environmental Strategies • Since 1998~ (10 year anniversary) • Offices: HQ (Kanagawa), Kansai, Kitakyushu, Tokyo, Bangkok, Beijing • Staff: Total 140 (researchers and supporting staff: 80) • Objective: International environmental policy development • Geographical area: Asia and the Pacific IGES | http://www.iges.or.jp Kitakyushu Initiative for a Clean Environment http://kitakyushu.iges.or.jp/ Economic analyses of composting, through Surabaya’s case: Application in Bangkok 4 2. Introduction of Kitakyushu City • Population: 1 million • Industrial city: Heavy pollution in the 60s • Recovery in 70s‐90s: Cleaner production, recycling park • Cost for recovery: USD8 billion (Bht280 billion) (1972‐1991) • International environmental cooperation: KITA (Kitakyushu Internat’l Techno‐cooperative Association) More than 5,000 trainees since 1980 • Environmental Model City in Japan 150% of city’s GHG emission reduction in Asian cities No. 1 in Environmental Capital Contest in Japan (2007, 2008) Photo courtesy of Kitakyushu City IGES | http://www.iges.or.jp Kitakyushu Initiative for a Clean Environment http://kitakyushu.iges.or.jp/ Economic analyses of composting, through Surabaya’s case: Application in Bangkok 5 3. Introduction of Kitakyushu Initiative (KI) Programme • Adopted at the Ministerial Conference on Environment and Development in Asia and the Pacific (MCED) in 2000 • Under UNESCAP • Inter‐city environmental cooperation network • Objective: urban environmental improvement, through capacity building of local governments Collection and replication of good practices • Scope: Urban environment • Area: Asia‐Pacific • Member cities: Over 60 cities from 18 countries IGES | http://www.iges.or.jp Kitakyushu Initiative for a Clean Environment http://kitakyushu.iges.or.jp/ Economic analyses of composting, through Surabaya’s case: Application in Bangkok 6 3. Introduction of Kitakyushu Initiative Programme‐2 Targeted themes: • Community‐based waste management (composting) • Improvement of final disposal site – Banning open dumping (Philippines, Indonesia) – Demand for low‐cost methods • Decentralised wastewater treatment – Sewerage system requires huge capital cost – Many good practices (BORDA‐Indonesia, USAID‐Philippines, Eco‐San, Jokaso, bio‐fertiliser plant in Nonthaburi) • Linking CSR activities with environmental management – Easy to replicate – Public parks, river bank protection, waste reduction campaign, biodiesel from used cooking oil, etc. Criteria: • Low‐cost, low‐tech • Community‐based • Easy to replicate • High demand

Welcome message from author
This document is posted to help you gain knowledge. Please leave a comment to let me know what you think about it! Share it to your friends and learn new things together.
Transcript
Institute for Global Environmental Strategies (IGES)
Economic Analysis of Composting, Through Surabaya’s case:Application in Bangkok
Bangkok Palace Hotel6 November 2008Toshizo MaedaResearcher, IGES Kitakyushu Office
Kitakyushu Initiative for a Clean Environment
IGES | http://www.iges.or.jp Kitakyushu Initiative for a Clean Environment http://kitakyushu.iges.or.jp/
Economic analyses of composting, through Surabaya’s case: Application in Bangkok
2
Contents:
1. Introduction of IGES
2. Introduction of Kitakyushu City
3. Introduction of Kitakyushu Initiative (KI) Programme
4. Surabaya’s community-based waste management
5. Application in Bangkok
IGES | http://www.iges.or.jp Kitakyushu Initiative for a Clean Environment http://kitakyushu.iges.or.jp/
Economic analyses of composting, through Surabaya’s case: Application in Bangkok
3
1. Introduction of IGES
• Institute for Global Environmental Strategies
• Since 1998~ (10 year anniversary)
• Offices: HQ (Kanagawa), Kansai, Kitakyushu, Tokyo,
Bangkok, Beijing
• Staff: Total 140 (researchers and supporting staff: 80)
• Objective: International environmental policy development
• Geographical area: Asia and the Pacific
IGES | http://www.iges.or.jp Kitakyushu Initiative for a Clean Environment http://kitakyushu.iges.or.jp/
Economic analyses of composting, through Surabaya’s case: Application in Bangkok
4
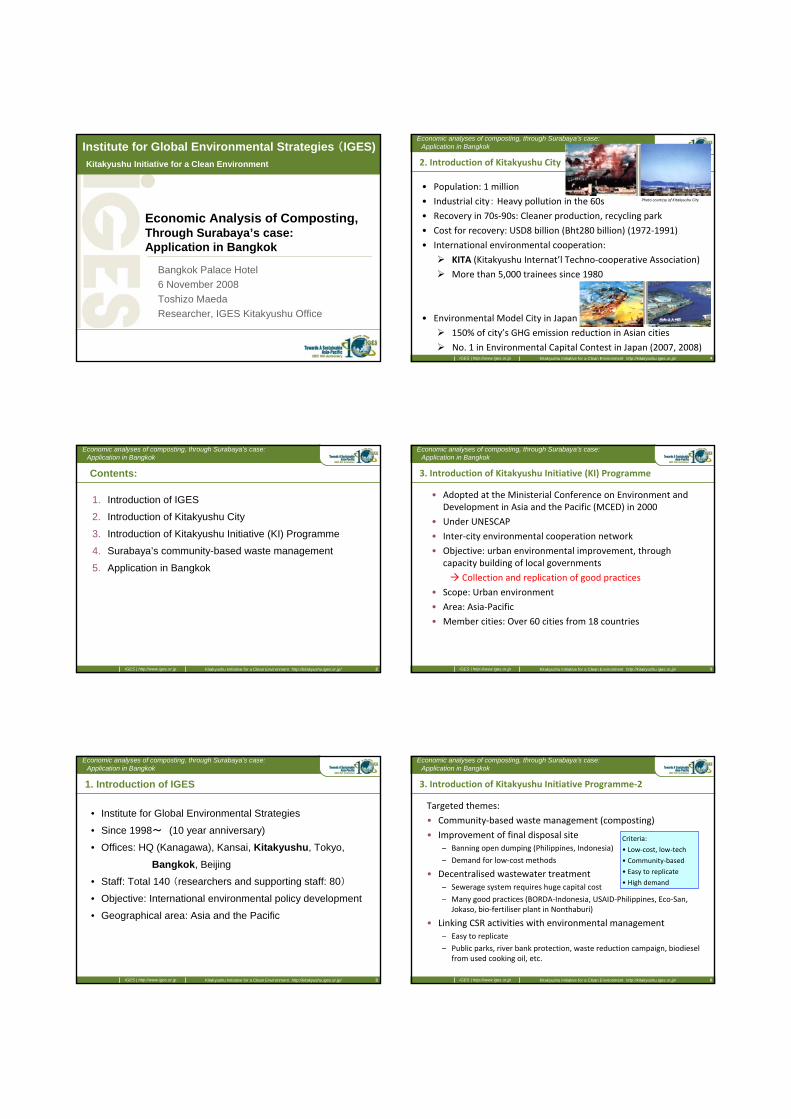
2. Introduction of Kitakyushu City
• Population: 1 million
• Industrial city: Heavy pollution in the 60s
• Recovery in 70s‐90s: Cleaner production, recycling park
• Cost for recovery: USD8 billion (Bht280 billion) (1972‐1991)
• International environmental cooperation:
KITA (Kitakyushu Internat’l Techno‐cooperative Association)
More than 5,000 trainees since 1980
• Environmental Model City in Japan
150% of city’s GHG emission reduction in Asian cities
No. 1 in Environmental Capital Contest in Japan (2007, 2008)
Photo courtesy of Kitakyushu City
IGES | http://www.iges.or.jp Kitakyushu Initiative for a Clean Environment http://kitakyushu.iges.or.jp/
Economic analyses of composting, through Surabaya’s case: Application in Bangkok
5
3. Introduction of Kitakyushu Initiative (KI) Programme
• Adopted at the Ministerial Conference on Environment and Development in Asia and the Pacific (MCED) in 2000
• Under UNESCAP
• Inter‐city environmental cooperation network
• Objective: urban environmental improvement, through capacity building of local governments
Collection and replication of good practices
• Scope: Urban environment
• Area: Asia‐Pacific
• Member cities: Over 60 cities from 18 countries
IGES | http://www.iges.or.jp Kitakyushu Initiative for a Clean Environment http://kitakyushu.iges.or.jp/
Economic analyses of composting, through Surabaya’s case: Application in Bangkok
6
3. Introduction of Kitakyushu Initiative Programme‐2
Targeted themes:
• Community‐based waste management (composting)
• Improvement of final disposal site– Banning open dumping (Philippines, Indonesia)
– Demand for low‐cost methods
• Decentralised wastewater treatment– Sewerage system requires huge capital cost
– Many good practices (BORDA‐Indonesia, USAID‐Philippines, Eco‐San, Jokaso, bio‐fertiliser plant in Nonthaburi)
• Linking CSR activities with environmental management– Easy to replicate
– Public parks, river bank protection, waste reduction campaign, biodieselfrom used cooking oil, etc.
Criteria:
• Low‐cost, low‐tech
• Community‐based
• Easy to replicate
• High demand

IGES | http://www.iges.or.jp Kitakyushu Initiative for a Clean Environment http://kitakyushu.iges.or.jp/
Economic analyses of composting, through Surabaya’s case: Application in Bangkok
7
4. Surabaya’s community‐based waste management
(1) Introduction of Surabaya City(2) Achievements(3) Main stakeholders(4) Background(5) Waste management system in Surabaya(6) Composting methods(7) Economic analysis(8) Social and environmental impacts(9) Remaining challenges(10) Replication in other cities(11) National policy
Basic info. of Surabaya
Analysis
How to expand more?
IGES | http://www.iges.or.jp Kitakyushu Initiative for a Clean Environment http://kitakyushu.iges.or.jp/
Economic analyses of composting, through Surabaya’s case: Application in Bangkok
8
(1) Introduction
Surabaya CitySurabaya City
Main cities where Surabaya’s composting practices were copied
Main cities where Surabaya’s composting practices were copied
TarakanTarakan
JombangJombang
http://www.lib.utexas.edu/maps/middle_east_and_asia/indonesia_pol_2002.pdfFigure‐1 Location of Surabaya City and replication of Surabaya’s practices in other cities
Population: 3 million
2nd largest in Indonesia
Centre of East Indonesia
Replication in 39 cities
Leading environmental city
IGES | http://www.iges.or.jp Kitakyushu Initiative for a Clean Environment http://kitakyushu.iges.or.jp/
Economic analyses of composting, through Surabaya’s case: Application in Bangkok
9
(2) Achievements
2
68
13
1
17,000
6,800
3,6001,40010
14,000
10,000
90
0
5
10
15
20
25
30
35
40
Jun-04
Oct-04
Feb-05
Jun-05
Oct-05
Feb-06
Jun-06
Oct-06
Feb-07
Jun-07
Oct-07
Feb-08
Jun-08
‐20,000
‐15,000
‐10,000
‐5,000
0
5,000
10,000
15,000
20,000
25,000
Number of distributedhousehold compost baskets
Number ofcompostingcentres
Cooperation between Surabayaand KITA started
Training inKitakyushu Cityfor 2 trainees
Development of anew compost method
PUSDAKOTA'scompost centre
Market wastecompost centre
Figure‐5 Number of household compost baskets and composting centres in SurabayaSource: Interviews with PUSDAKOTA on the number of household compost basket and Cleansing Department, Surabaya on the number of compost centres.
Number of household
compost baskets
Number of
composting centres
IGES | http://www.iges.or.jp Kitakyushu Initiative for a Clean Environment http://kitakyushu.iges.or.jp/
Economic analyses of composting, through Surabaya’s case: Application in Bangkok
10
(2) Achievements‐2 *Map copied from El Sena, Surabaya, Indonesia
Figure‐7 Location of composting centres in Surabaya
Location of
composting centres
IGES | http://www.iges.or.jp Kitakyushu Initiative for a Clean Environment http://kitakyushu.iges.or.jp/
Economic analyses of composting, through Surabaya’s case: Application in Bangkok
11
(2) Achievements‐3
1,300t/d
1,500-1,600t/d
2007
Figure‐6 Average daily amount of waste transported to Benowo Landfill, 2003‐2007Sourece: Data in 2007 from weigh bridge data at Benowo Landfill; 2003‐2005 from interviews with Cleansing Department staff
10% waste reduction in 3 years
(1,500t/day 1,300t/day)
1,500t/day (2005)1,500t/day (2005)
1,300t/day (2007)1,300t/day (2007)200t/day200t/day
IDR22.8 billion (USD2.3 million)IDR22.8 billion (USD2.3 million)
Cost saved: IDR3.5 billion (USD350,000)
Cost saved: IDR3.5 billion (USD350,000)
Solid waste management cost (2007):Collection/transport: IDR16.2 billion (USD1.6 million)Landfill management: IDR6.6 billion (USD0.7 million)
Solid waste management cost (2007):Collection/transport: IDR16.2 billion (USD1.6 million)Landfill management: IDR6.6 billion (USD0.7 million)
Figure‐12 Economic impact of 200t a day of waste reductionFigure‐12 Economic impact of 200t a day of waste reduction
200t/day waste reduction
= USD350,000/year cost saving
(Bht12 million/year)
IGES | http://www.iges.or.jp Kitakyushu Initiative for a Clean Environment http://kitakyushu.iges.or.jp/
Economic analyses of composting, through Surabaya’s case: Application in Bangkok
12
(2) Achievements‐4
120t/day120t/day
40t/day40t/day
40t/day40t/day
Total 200t/dayTotal 200t/day
Composting at each household:17,000 units sold by PUSDAKOTA20,000 units copied by communities (assumption)600 units of a communal type distributed by Cleansing Department,
which caters for about 5 households each (= 3,000 households)40,000 households x 1kg/day/household 40t/day
Composting at each household:17,000 units sold by PUSDAKOTA20,000 units copied by communities (assumption)600 units of a communal type distributed by Cleansing Department,
which caters for about 5 households each (= 3,000 households)40,000 households x 1kg/day/household 40t/day
Recycling of other dry wasteRecycling of other dry waste
Composting at 13 composting centres:Cleansing Department: 12 composting centres, 39t/d (=78m3/d)PUSDAKOTA: 1 composting centre, 1.4t/d
Composting at 13 composting centres:Cleansing Department: 12 composting centres, 39t/d (=78m3/d)PUSDAKOTA: 1 composting centre, 1.4t/d
Figure‐11 Amount of waste reduced by each measure
40t/d reduction by household composting,
40t/d reduction at composting centres,
80t/d waste reduction
Remaining 120t/d comes from
Reuse and Recycling.
1 ton of composting reduces
waste by 2.5 tons.

IGES | http://www.iges.or.jp Kitakyushu Initiative for a Clean Environment http://kitakyushu.iges.or.jp/
Economic analyses of composting, through Surabaya’s case: Application in Bangkok
13
(3) Main stakeholders
Surabaya CityCleansing Dept.
Unilever (Uli Peduli) & Java Post
Other NGOsCadres Pusdakota
Kitakyushu City KITA
Local GovernmentExternal agency
City‐to‐city cooperation
Environmental Cadre system (28,000 Cadres)
Supports forcampaigns
Operating 12 composting centresCatalytic role
PKK
NGO/CBO
Distribution of compost baskets
Purchase of compost baskets
“Green & Clean Campaign”Community‐based SWM
Running a community compost centreProvide composting trainings (over 80 times)
Surabaya City
Technical cooperationDev. of compost method
Private sector
Figure‐13 Roles and relationships of key stakeholders in Surabaya who promoted composting practices
1. Development of
composting methods
2. Operation of a composting centre
Provision of compost baskets
Provision of composting trainings
3. Operation of composting centres
Purchase of compost baskets
4. Distribution of compost baskets
Environmental education (Socialisation)
5. “Green & Clean” Campaign
Competition among communities
IGES | http://www.iges.or.jp Kitakyushu Initiative for a Clean Environment http://kitakyushu.iges.or.jp/
Economic Analyses of composting, through Surabaya’s case:Application in Bangkok
14
(3) Main stakeholders (KITA, Kitakyushu City)
Waste composition survey Shredding of waste Mixing with seed compost
Temperature measurement Fermentation and pH tests Explaining how to use baskets
to residents
(photo courtesy of KITA)
IGES | http://www.iges.or.jp Kitakyushu Initiative for a Clean Environment http://kitakyushu.iges.or.jp/
Economic Analyses of composting, through Surabaya’s case:Application in Bangkok
15
(3) Main stakeholders (PUSDAKOTA)
Segregated waste collection
from the community
Shredding at compost centre Fermentation
Household compost basketSelling compost
Green streets using compost
IGES | http://www.iges.or.jp Kitakyushu Initiative for a Clean Environment http://kitakyushu.iges.or.jp/
Economic Analyses of composting, through Surabaya’s case:Application in Bangkok
16
(3) Main stakeholders (KITA & PUSDAKOTA)
PUSDAKOTA’s compost centre: before and after KITA’s intervention
(photo courtesy of KITA)
IGES | http://www.iges.or.jp Kitakyushu Initiative for a Clean Environment http://kitakyushu.iges.or.jp/
Economic Analyses of composting, through Surabaya’s case:Application in Bangkok
17
(3) Main stakeholders (Cleansing Dept, Surabaya)
Parks became greener using compostStreets became greener using compost
Bratang Compost Centre Sonokwijenan Compost Centre Keputran Compost Centre
(Photos cited from “Sparking Parks in Surabaya”, Cleansing Department, Surabaya City, 2008)
IGES | http://www.iges.or.jp Kitakyushu Initiative for a Clean Environment http://kitakyushu.iges.or.jp/
Economic analyses of composting, through Surabaya’s case: Application in Bangkok
18
(3) Main stakeholders (PKK & Environmental Cadres)
Program pokok ke-9KELESTARIAN LINGKUNGAN HIDUP
Organic-unorganic waste sorting VICE CHAIRMAN OF PKK DIRECTLY GIVING TRAINING
9th main programENVIRONMENT PRESERVATION
Recycling trainings
Turn waste into blessing
9th main programENVIRONMENT PRESERVATION
(Photo courtesy of PKK Surabaya (top row) and Environmental Cadre of Tegalsari, Surabaya (bottom row)
Waste segregation training
Explaining how to use
compost baskets Manufacturing bags from waste
Meeting of Environmental Cadres Activities of Environmental Cadres Environmental Event

IGES | http://www.iges.or.jp Kitakyushu Initiative for a Clean Environment http://kitakyushu.iges.or.jp/
Economic analyses of composting, through Surabaya’s case: Application in Bangkok
19
(3) Main stakeholders (Green & Clean Campaign)
Award winning community
Award winning housewives group
Green street
Entrance to a community
Campaign sponsors
Products made from waste
IGES | http://www.iges.or.jp Kitakyushu Initiative for a Clean Environment http://kitakyushu.iges.or.jp/
Economic analyses of composting, through Surabaya’s case: Application in Bangkok
20
(3) Main stakeholders (Uli Peduli)
325 283 355
1,797
3171,500
19,871
5,684
0
500
1,000
1,500
2,000
2,500
3,000
3,500
4,000
4,500
5,000
2005 2006 2007 2008
‐20,000
‐15,000
‐10,000
‐5,000
0
5,000
10,000
15,000
20,000
25,000
Number of RTs participated in Green & Clean CampaignNumber of RTs participated in Green & Clean Campaign
Number of Environmental Cadres under Uli PeduliNumber of Environmental Cadres under Uli Peduli
(As of August 2008)(As of August 2008) Figure‐30 Number of RTs which participated in Green & Clean Campaign and the number of Environmental Cadres under Uli Peduli (source: Uli Peduli (2008))
Number of Environmental Cadres under Uli Peduli (Unilever) and participating
communities in Green & Clean Campaign
Total number of communities:
8,800
20% are participating
IGES | http://www.iges.or.jp Kitakyushu Initiative for a Clean Environment http://kitakyushu.iges.or.jp/
Economic analyses of composting, through Surabaya’s case: Application in Bangkok
21
(3) Main stakeholders
Surabaya CityCleansing Dept.
Unilever (Uli Peduli) & Java Post
Other NGOsCadres Pusdakota
Kitakyushu City KITA
Local GovernmentExternal agency
City‐to‐city cooperation
Environmental Cadre system (28,000 Cadres)
Supports forcampaigns
Operating 12 composting centresCatalytic role
PKK
NGO/CBO
Distribution of compost baskets
Purchase of compost baskets
“Green & Clean Campaign”Community‐based SWM
Running a community compost centreProvide composting trainings (over 80 times)
Surabaya City
Technical cooperationDev. of compost method
Private sector
Figure‐13 Roles and relationships of key stakeholders in Surabaya who promoted composting practices
1. Development of
composting methods
2. Operation of a composting centre
Provision of compost baskets
Provision of composting trainings
3. Operation of composting centres
Purchase of compost baskets
4. Distribution of compost baskets
Environmental education (Socialisation)
5. “Green & Clean” Campaign
Competition among communities
BMADistrict Offices
IGES | http://www.iges.or.jp Kitakyushu Initiative for a Clean Environment http://kitakyushu.iges.or.jp/
Economic Analyses of composting, through Surabaya’s case:Application in Bangkok
22
(4) Background
• Final disposal site was closed in 2001 due to opposition by residents. Waste filled the streets and drains.
• (uncompleted) Benowo Landfill started operation.
• Cooperation between Kitakyushu and Surabaya in 2001.
• Baseline survey on SWM by Kitakyushu in 2002.
• Cooperation between KITA and PUSDAKOTA in 2004.
Development of composting methods.
Photo‐1 Status in Surabaya in 2001 when Keputih Final Disposal Site was closed (Photo courtesy of PKK Surabaya)
What happened in 2001
Benowo Landfill: 800 scavengers; 35km from city centre; Surrounded by
fish ponds; no appropriate land for landfill; demand for waste reduction is high
IGES | http://www.iges.or.jp Kitakyushu Initiative for a Clean Environment http://kitakyushu.iges.or.jp/
Economic analyses of composting, through Surabaya’s case: Application in Bangkok
23
(5) Waste management system in Surabaya‐1
HouseholdsHouseholds
Street sweepingStreet sweeping
MarketsMarkets
Commercial sectorCommercial sector
HospitalsHospitals
IndustryIndustry
Temporal storage facilitiesTemporal storage facilities
12 Composting centres12 Composting centres
Benowo Landfill(1,500‐1,600t/d
before 2006,
1,300t/d in 2007)
Benowo Landfill(1,500‐1,600t/d
before 2006,
1,300t/d in 2007)
Figure‐2 Waste flow in SurabayaFigure‐2 Waste flow in Surabaya
IncinerationIncineration
Responsibility of Cleansing Department:Responsibility of Cleansing Department:
Compost for parks
Compost for parks
IncinerationIncineration
Recycling by waste pickersRecycling by waste pickersComposting centreComposting centre
120t/d120t/d
(7‐10t/d)*(7‐10t/d)*
30‐40t/d30‐40t/d
1.4t/d1.4t/d
* (0.3t/d): compost production* (0.3t/d): compost production
(0.3t/d)*(0.3t/d)*
• Cleansing & Landscaping Department is in charge of waste management.
• More than 1,000 staff. Waste management and park management.
• Total amount of waste: 2,200t/day??
• Only 1 landfill in a 3‐million pop city
• Area: 27ha (already 17ha is filled)
• Started operation in 2001 (7‐year old)
• Life span: 5 years more??
• Construction cost: USD6.5 million
(Bht230 million)
IGES | http://www.iges.or.jp Kitakyushu Initiative for a Clean Environment http://kitakyushu.iges.or.jp/
Economic analyses of composting, through Surabaya’s case: Application in Bangkok
24
(5) Waste management system in Surabaya‐2
Zero waste programme*IDR0.6 billion (2%)
Zero waste programme*IDR0.6 billion (2%)
Street sweepingIDR11.0 billion
(32%)
Street sweepingIDR11.0 billion
(32%)
Landfill managementIDR6.6 billion
(19%)
Landfill managementIDR6.6 billion
(19%)
Waste collection/ transportationIDR16.2 billion
(47%)
Waste collection/ transportationIDR16.2 billion
(47%)
Figure‐3 Breakdown of solid waste management cost in Surabaya, 2007Source: Cleansing and Landscaping Department, Surabaya, 2008
Figure‐3 Breakdown of solid waste management cost in Surabaya, 2007Source: Cleansing and Landscaping Department, Surabaya, 2008
* Zero waste programme includes O&M of compost centres and community empowerment activities (“socialization”) for waste reduction at source.
* Zero waste programme includes O&M of compost centres and community empowerment activities (“socialization”) for waste reduction at source.
Total cost: IDR34.4 billion (USD3.4 million)
Total cost: IDR34.4 billion (USD3.4 million)
• 47% for waste collection/transportation
• 29% for landfill management.
Only 2% for waste reduction campaign
Cost reduction by waste reduction.
42.1
77.5
55.8
54.6 9.5 12.6
63.0% 12.1% 12.3% 12.7%
0% 20% 40% 60% 80% 100%
Organic
Woods/bamboo
Street sweeping
Paper
Plasti c
Others
Cleansing Department (2007)Cleansing Department (2007)
Dinoyo (2002)*Dinoyo (2002)*
Wonokromo (2002)*Wonokromo (2002)*
Kembangkuning (2002)*Kembangkuning (2002)*
AverageAverage
* Source: KITA (2002)
Figure‐4 Waste composition in Surabaya* Source: KITA (2002)
Figure‐4 Waste composition in Surabaya
Organic waste is more than 50%.
Waste management
cost in 2007
Waste composition in Surabaya

IGES | http://www.iges.or.jp Kitakyushu Initiative for a Clean Environment http://kitakyushu.iges.or.jp/
Economic analyses of composting, through Surabaya’s case: Application in Bangkok
25
(6) Composting methods‐1
1
Organic waste
Compost
Rotting Fermenting
(3) Mixing seed compost withorganic waste and shredding
Mixing NM with rice bran and rice husks,and fermenting for 1‐2 weeks.
(2) Production of seed compost
A. Soaking local fermented foodsin sugared water for 3 days.
B. Soaking vegetables and fruits peels in salted water for 3 days.
(1) Collection of Native Microorganism (NM)
Features:1. Fast production cycle (1‐2 weeks) and less space requirement2. No foul smell (not rotting)3. Active microorganism in compost makes soil rich4. Low‐cost, low‐tech and labour intensive5. Using only local materials
3‐6 months
(4) Fermenting for 1‐2 weeks
Seed compost(5b)
(5a) Compost is ready for use(mixing compost with soil for 2 weeks before planting)
6. Income generation7. Improve household sanitation8. Improve solidarity of a community
Figure‐30 Flow and features of organic waste composting method in Surabaya (Takakura Method)
IGES | http://www.iges.or.jp Kitakyushu Initiative for a Clean Environment http://kitakyushu.iges.or.jp/
Economic analyses of composting, through Surabaya’s case: Application in Bangkok
26
(6) Composting methods‐2
Household compost baskets
Household compost baskets
Organic waste from fresh
produce markets
Organic waste from fresh
produce markets
Organic waste from householdsOrganic waste
from households
Community composting centre
Community composting centre
Market waste composting centreMarket waste
composting centre
Figure‐31 Types of composting methods in SurabayaFigure‐31 Types of composting methods in Surabaya
Takakura Home Method (THM)Takakura Home Method (THM)
Takakura SusunMethod (TSM)*Takakura SusunMethod (TSM)*
New Windrow Method
New Windrow Method
New Windrow Method
New Windrow Method
Means of compostingMeans of composting
Composting methods
Composting methods
(17,000 baskets distributed)(17,000 baskets distributed)
(PUSDAKOTA’s case)(PUSDAKOTA’s case)
(12 centres under Cleansing Dept)(12 centres under Cleansing Dept)
IGES | http://www.iges.or.jp Kitakyushu Initiative for a Clean Environment http://kitakyushu.iges.or.jp/
Economic Analyses of composting, through Surabaya’s case:Application in Bangkok
27
(6) Composting methods‐3Nonthaburi (Thailand)‐1
Source: Sustainable Environmental Management in Nonthaburi, Thailand
Construction cost: €120,000(Bht6 million)
6m3/day of waste
90 days for processing
Compost production: 5t/month
Income: Bht10,000/month
(USD290/month)
Selling price: Bht2,000/t (USD57/t)
IGES | http://www.iges.or.jp Kitakyushu Initiative for a Clean Environment http://kitakyushu.iges.or.jp/
Economic analyses of composting, through Surabaya’s case: Application in Bangkok
28
(6) Composting methods‐4Nonthaburi (Thailand)‐2
Source: Sustainable Environmental Management in Nonthaburi, Thailand
IGES | http://www.iges.or.jp Kitakyushu Initiative for a Clean Environment http://kitakyushu.iges.or.jp/
Economic Analyses of composting, through Surabaya’s case:Application in Bangkok
29
(6) Composting methods‐5Bago (Philippines)
Vermi composting
Changing to Takakura Method (2 weeks for fermenting)
3 months for processing
Household compost baskets
IGES | http://www.iges.or.jp Kitakyushu Initiative for a Clean Environment http://kitakyushu.iges.or.jp/
Economic analyses of composting, through Surabaya’s case: Application in Bangkok
30
(7) Economic analysis‐1
Landfill construction cost:
IDR65 billion* (USD6.5 million)
Collection/transportation cost (2007):IDR16.2 billion (USD1.6 million)
Landfill management cost (2007):IDR6.6 billion (USD0.7 million)
Solid waste management cost (2007):IDR22.8 billion (USD2.3 million)
X 1/(1,300t/d x 365days) = IDR48,000 (USD4.8) /t‐waste
X 1/(1,300t/d x 365days x 10years) = IDR14,000 (USD1.4) /t‐waste
Therefore, solid waste management cost including landfill construction cost per one tonne of waste is: IDR48,000/t + IDR14,000/t = IDR62,000/t‐waste (USD6.2/t‐waste)
Figure‐16 Solid waste management cost in Surabaya* Source: Interview with Cleansing Department (cited from KITA (2007))
Waste management cost in Surabaya
(collection and landfill mgmt)
USD2.3 million (Bht80 million, 2007)
Divided by 1,300t/d @ 365days:
USD4.8/t (Bht170/t)
Landfill construction cost:
USD6.5 million (Bht230 million)
Waste management cost:
USD6.2/t (Bht220/t)
Divided by 1,300t/d @365days @10years
USD1.4/t (Bht49/t)
IGES | http://www.iges.or.jp Kitakyushu Initiative for a Clean Environment http://kitakyushu.iges.or.jp/
Economic analyses of composting, through Surabaya’s case: Application in Bangkok
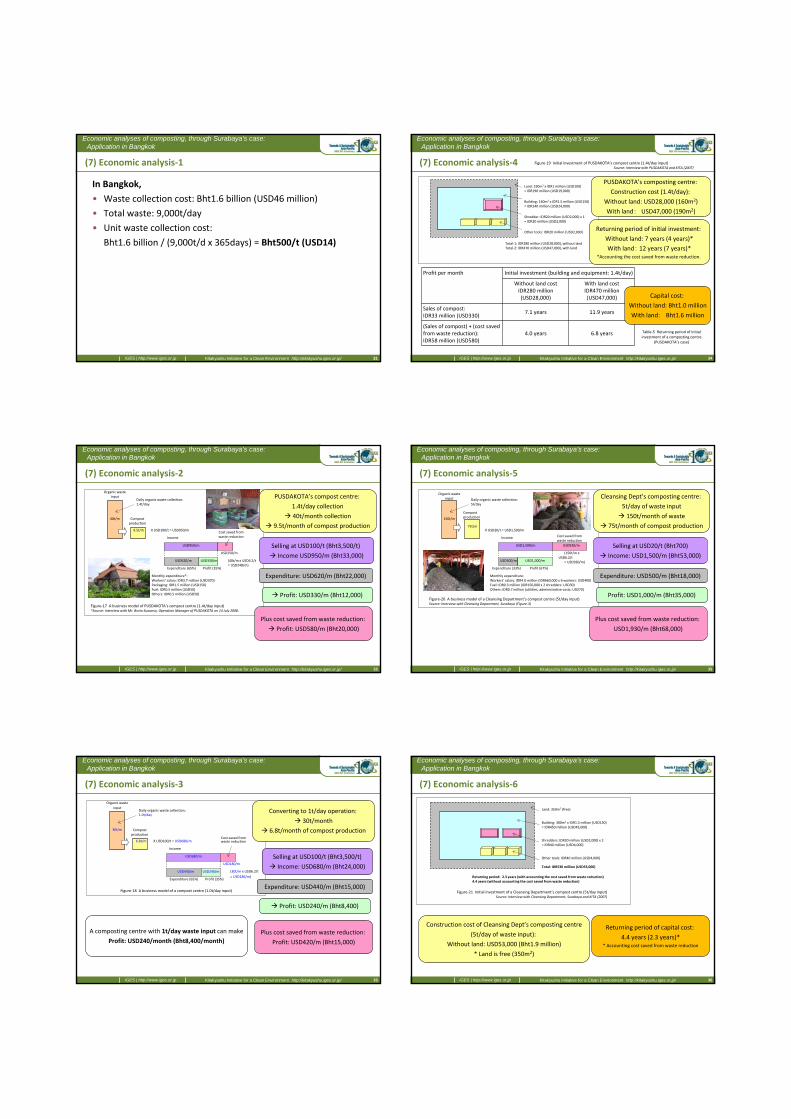
(7) Economic analysis‐1
In Bangkok,
• Waste collection cost: Bht1.6 billion (USD46 million)
• Total waste: 9,000t/day
• Unit waste collection cost:
Bht1.6 billion / (9,000t/d x 365days) = Bht500/t (USD14)
31
IGES | http://www.iges.or.jp Kitakyushu Initiative for a Clean Environment http://kitakyushu.iges.or.jp/
Economic analyses of composting, through Surabaya’s case: Application in Bangkok
32
(7) Economic analysis‐2
40t/m
9.5t/m X USD100/t = USD950/m
Organic waste input
Compost production
Income
Expenditure (65%)
USD950/m
USD250/m
USD330/mUSD620/m
Profit (35%)
Cost saved from waste reduction
Figure‐17 A business model of PUSDAKOTA’s compost centre (1.4t/day input)*Source: Interview with Mr. Broto Suwarso, Operation Manager of PUSDAKOTA on 14 July 2008.
Monthly expenditure*: Workers’ salary: IDR3.7 million (USD370)Packaging: IDR1.5 million (USD150)Fuel: IDR0.5 million (USD50)Others: IDR0.5 million (USD50)
(40t/m x USD6.2/t= USD248/m)
Daily organic waste collection: 1.4t/day
PUSDAKOTA’s compost centre:
1.4t/day collection
40t/month collection
9.5t/month of compost production
Selling at USD100/t (Bht3,500/t)
Income USD950/m (Bht33,000)
Expenditure: USD620/m (Bht22,000)
Profit: USD330/m (Bht12,000)
Plus cost saved from waste reduction:
Profit: USD580/m (Bht20,000)
IGES | http://www.iges.or.jp Kitakyushu Initiative for a Clean Environment http://kitakyushu.iges.or.jp/
Economic analyses of composting, through Surabaya’s case: Application in Bangkok
33
(7) Economic analysis‐3
30t/m
6.8t/m X USD100/t = USD680/m
Organic waste input
Compost production
Income
Expenditure (65%)
USD680/m
USD180/m
USD240/mUSD440/m
Profit (35%)
Cost saved from waste reduction
Figure‐18 A business model of a compost centre (1.0t/day input)
(30t/m x USD6.2/t= USD186/m)
Daily organic waste collection: 1.0t/day
Plus cost saved from waste reduction:
Profit: USD420/m (Bht15,000)
Profit: USD240/m (Bht8,400)
Expenditure: USD440/m (Bht15,000)
Selling at USD100/t (Bht3,500/t)
Income: USD680/m (Bht24,000)
Converting to 1t/day operation:
30t/month
6.8t/month of compost production
A composting centre with 1t/day waste input can make
Profit: USD240/month (Bht8,400/month)
IGES | http://www.iges.or.jp Kitakyushu Initiative for a Clean Environment http://kitakyushu.iges.or.jp/
Economic analyses of composting, through Surabaya’s case: Application in Bangkok
34
(7) Economic analysis‐4
Land: 190m2 x IDR1 million (USD100) = IDR190 million (USD19,000)
Building: 160m2 x IDR1.5 million (USD150) = IDR240 million (USD24,000)
Shredder: IDR20 million (USD2,000) x 1= IDR20 million (USD2,000)
Other tools: IDR20 million (USD2,000)
Total‐1: IDR280 million (USD28,000), without landTotal‐2: IDR470 million (USD47,000), with land
Figure‐19 Initial investment of PUSDAKOTA’s compost centre (1.4t/day input)Source: Interview with PUSDAKOTA and KITA (2007)
Table‐5 Returning period of initial investment of a composting centre
(PUSDAKOTA’s case)
Profit per month Initial investment (building and equipment: 1.4t/day)
Without land costIDR280 million (USD28,000)
With land costIDR470 million (USD47,000)
Sales of compost: IDR33 million (USD330)
7.1 years 11.9 years
(Sales of compost) + (cost saved from waste reduction): IDR58 million (USD580)
4.0 years 6.8 years
PUSDAKOTA’s composting centre:
Construction cost (1.4t/day):
Without land: USD28,000 (160m2)
With land: USD47,000 (190m2)
Returning period of initial investment:
Without land: 7 years (4 years)*
With land: 12 years (7 years)**Accounting the cost saved from waste reduction.
Capital cost:
Without land: Bht1.0 million
With land: Bht1.6 million
IGES | http://www.iges.or.jp Kitakyushu Initiative for a Clean Environment http://kitakyushu.iges.or.jp/
Economic analyses of composting, through Surabaya’s case: Application in Bangkok
35
(7) Economic analysis‐5
150t/m
75t/mX USD20/t = USD1,500/m
Organic waste input
Compost production
Income
Expenditure (33%)
USD1,500/m USD930/m
USD1,000/mUSD500/m
Profit (67%)
Cost saved from waste reduction
Figure‐20 A business model of a Cleansing Department’s compost centre (5t/day input)Source: Interview with Cleansing Department, Surabaya (Figure‐3)
Monthly expenditure: Workers’ salary: IDR4.0 million (IDR660,000 x 6 workers: USD400)Fuel: IDR0.3 million (IDR150,000 x 2 shredders: USD30)Others: IDR0.7 million (utilities, administrative costs: USD70)
(150t/m x USD6.2/t
= USD930/m)
Daily organic waste collection: 5t/day
Cleansing Dept’s composting centre:
5t/day of waste input
150t/month of waste
75t/month of compost production
Selling at USD20/t (Bht700)
Income: USD1,500/m (Bht53,000)
Expenditure: USD500/m (Bht18,000)
Profit: USD1,000/m (Bht35,000)
Plus cost saved from waste reduction:
USD1,930/m (Bht68,000)
IGES | http://www.iges.or.jp Kitakyushu Initiative for a Clean Environment http://kitakyushu.iges.or.jp/
Economic analyses of composting, through Surabaya’s case: Application in Bangkok
36
(7) Economic analysis‐6
Land: 350m2 (free)
Building: 300m2 x IDR1.5 million (USD150) = IDR450 million (USD45,000)
Shredders: IDR20 million (USD2,000) x 2= IDR40 million (USD4,000)
Other tools: IDR40 million (USD4,000)
Total: IDR530 million (USD53,000)
Figure‐21 Initial investment of a Cleansing Department’s compost centre (5t/day input)Source: Interview with Cleansing Department, Surabaya and KITA (2007)
Returning period: 2.3 years (with accounting the cost saved from waste reduction)4.4 years (without accounting the cost saved from waste reduction)
Construction cost of Cleansing Dept’s composting centre
(5t/day of waste input):
Without land: USD53,000 (Bht1.9 million)
* Land is free (350m2)
Returning period of capital cost:
4.4 years (2.3 years)** Accounting cost saved from waste reduction

IGES | http://www.iges.or.jp Kitakyushu Initiative for a Clean Environment http://kitakyushu.iges.or.jp/
Economic analyses of composting, through Surabaya’s case: Application in Bangkok
37
(7) Economic analysis‐7
Figure‐22 Economic analysis of Cleansing Department’s overall investment
Returning period: 1.1 years (= IDR6.8 billion / IDR5.9 billion)
IDR4.3 billion
IDR4.5 billionIDR1.4 billion
IDR1.5 billion
Socialisation campaignIDR0.3 billion
ShreddersIDR0.42 billion
Other toolsIDR0.24 billion
Composting centres: IDR5.0 billionHousehold composting
IDR1.8 billion
BuildingCompost baskets
Annual income: IDR5.9 billion (USD590,000)
Compost production Cost saved from waste reduction
Initial investment: IDR6.8 billion (USD680,000)
Cost of waste reduction campaign (3 years):
USD680,000 (Bht24 million)
Compost baskets: USD180,000 (Bht6 million)
Composting centres: USD500,000 (Bht18 million)
Annual income: USD590,000 (Bht21 million)
Compost selling: USD140,000 (Bht5 million)
Cost saved: USD450,000 (Bht16 million)
Returning period of capital cost: 1.1 years
IGES | http://www.iges.or.jp Kitakyushu Initiative for a Clean Environment http://kitakyushu.iges.or.jp/
Economic analyses of composting, through Surabaya’s case: Application in Bangkok
38
(7) Economic analysis‐8
30kg/m
6kg/m
Household organic waste 1kg/day of
organic waste generation
Compost production
Figure‐23 Income from household composting
X IDR700 (USD0.07)/kg = IDR4,200 (USD0.42) /month
Not enough economic incentive
But used for other benefits
Household economic analysis:
1kg of organic waste/day/household
30kg/month
6kg/month of compost (20% of input)
Purchasing price: USD0.07/kg (Bht2.5)
Income: USD0.42/m (Bht15)
Not by economic incentive.
Because of household
sanitary improvement
IGES | http://www.iges.or.jp Kitakyushu Initiative for a Clean Environment http://kitakyushu.iges.or.jp/
Economic analyses of composting, through Surabaya’s case: Application in Bangkok
(7) Economic analysis‐9
Distribution of household compost baskets: • 15,000 units distributed by Cleansing Dept in 3 years
• Distribution cost: USD10 (Bht300)/unit x 15,000 = USD150,000 (Bht5.2 million)
• Campaign cost: USD30,000 x 3 years = USD90,000 (Bht3.2 million)
• Total cost: USD240,000 (Bht8.4 million)
Benefit: • Waste reduction: 40t/day
• Cost saved from waste reduction: 40t/d x 365days x USD6.2/t
= USD90,000/year (Bht3.2 million)
= USD180,000/2years (Bht6.3 million)
= USD270,000/3years (Bht9.5 million)
• Suppose waste reduction impact was 100t/day (2.5 times),
USD230,000/year (Bht8 million)
39
IGES | http://www.iges.or.jp Kitakyushu Initiative for a Clean Environment http://kitakyushu.iges.or.jp/
Economic analyses of composting, through Surabaya’s case: Application in Bangkok
40
(8) Social and environmental impacts‐1
Photo‐4 PUSDAKOTA’s community: before and after (photo courtesy of KITA)Photo‐4 PUSDAKOTA’s community: before and after (photo courtesy of KITA)
Before:Before: After:After:
Better household environment.
Greener and cleaner streets.
Environmental education through composting.
Composting and handicraft production from waste by students
IGES | http://www.iges.or.jp Kitakyushu Initiative for a Clean Environment http://kitakyushu.iges.or.jp/
Economic analyses of composting, through Surabaya’s case: Application in Bangkok
41
(8) Social and environmental impacts‐2
Employment Production of herbs and vegetables by compost
Waste segregation and promotion of recyclingSelling compost
IGES | http://www.iges.or.jp Kitakyushu Initiative for a Clean Environment http://kitakyushu.iges.or.jp/
Economic analyses of composting, through Surabaya’s case: Application in Bangkok
42
(9) Remaining challenges
• Cleansing Department has setup 12 composting centres.
• But, there is only one community composting centre yet. NGOs and CBOs require financial supports to setup a composting centre. Local government can support financially utilisingthe cost saved from waste reduction.
• Guarantee of minimum price of compost.
• Promotion of usage of organic compost by farmers.
(Compost purchasing scheme and market expansion)
• 17,000 units of compost baskets were disseminated. 40,000 units including copied ones. 7% of total number of households (600,000). Further expansion?
• Further waste reduction is possible. 20% reduction?

IGES | http://www.iges.or.jp Kitakyushu Initiative for a Clean Environment http://kitakyushu.iges.or.jp/
Economic Analyses of composting, through Surabaya’s case:Application in Bangkok
43
(10) Replication in other cities
• 39 cities in Indonesia.
• 24,000 units of household compost baskets.
• Dissemination through NGO networks.
• Limited involvement of local governments.
How to promote more?
Economic analysis. Impact assessment. More seminars?
Involvement of the central government.
IGES | http://www.iges.or.jp Kitakyushu Initiative for a Clean Environment http://kitakyushu.iges.or.jp/
Economic analyses of composting, through Surabaya’s case: Application in Bangkok
44
(11) National policy in Indonesia
• Municipal Solid Waste Management Act (May 2008)
• National 3R Strategy (being developed by MOE)
• 3R Projects (implemented by Min. of Public Works)
• Solid Waste Management Task Force (SWM‐TF, under National Development Planning Agency (BAPPENAS))
• Apr‐Aug 2008: Research in Surabaya and other cities
• Aug 2008: National Workshop in Surabaya
• Nov 2008: Development of a National Programme with Min. of Public Works, BAPPENAS, MOE and JICA)
Development of a National Programme
to replicate Surabaya’s model in other cities
IGES | http://www.iges.or.jp Kitakyushu Initiative for a Clean Environment http://kitakyushu.iges.or.jp/
Economic Analyses of composting, through Surabaya’s case:Application in Bangkok
45
5. Application in Bangkok
• Model Districts: Din Daeng, Nongjok, Don Muang??
• Model communities: Amornpun & Ruamjaipatana (Don Muang), Utairat (Phayatai), Suan Prik (Bang Phlat)??
• Other NGOs??
• “Green & Clean Campaign” by a private company??
• Composting centres?? At On Nuch? (13 centres in Surabaya)
• Household compost baskets?? (17,000 units in Surabaya)
• Waste collection: 9,000t/day ….. (10% reduction in Surabaya)
• Waste collection cost: Bht1.8 billion (USD51 million) …….
• Distance to landfill: 100km (disposal cost Bht500/t)
Seminar in Bangkok in March 2009? Further replication in Thailand,
Viet Nam, Cambodia, Nepal…
What can be done in Bangkok?
IGES | http://www.iges.or.jp Kitakyushu Initiative for a Clean Environment http://kitakyushu.iges.or.jp/
Economic Analyses of composting, through Surabaya’s case:Application in Bangkok
Involvement of residents… is the cheapest way
46
Thank you!
15% waste reduction by 2012
– BMA Action Plan
Shredder: Bht50,000 only
Related Documents