COURSE: JUST 3900 TIPS FOR APLIA Developed By: Ethan Cooper (Lead Tutor) John Lohman Michael Mattocks Aubrey Urwick Chapter 9: The t Statistic

COURSE: JUST 3900 TIPS FOR APLIA Developed By: Ethan Cooper (Lead Tutor) John Lohman Michael Mattocks Aubrey Urwick Chapter 9: The t Statistic.
Dec 17, 2015
Welcome message from author
This document is posted to help you gain knowledge. Please leave a comment to let me know what you think about it! Share it to your friends and learn new things together.
Transcript

COURSE: JUST 3900TIPS FOR APLIA
Developed By: Ethan Cooper (Lead Tutor)
John LohmanMichael Mattocks
Aubrey Urwick
Chapter 9: The t Statistic

Key Terms: Don’t Forget Notecards
Hypothesis Test (p. 233) Null Hypothesis (p. 236) Alternative Hypothesis (p. 236) Alpha Level (level of significance) (pp. 238 & 245) Critical Region (p. 238) Estimated Standard Error (p. 286) t statistic (p. 286) Degrees of Freedom (p. 287) t distribution (p. 287) Confidence Interval (p. 300) Directional (one-tailed) Hypothesis Test (p. 304)

Formulas
Estimated Standard Error: t-Score Formula: estimated Cohen’s d: r2:

You May Need These Formulas
Sample Mean: Definitional Formula for SS: Computational Formula for SS: Sample Variance: Sample Standard Deviation:

When to Use the t Statistic
Question 1: Under what circumstances is a t statistic used instead of a z-score for a hypothesis test?

When to Use the t Statistic
Question 1 Answer: A t statistic is used instead of a z-score when the population
standard deviation (σ) and variance (σ2) are not known.

Estimated Standard Error
Question 2: A sample of n = 9 scores has a SS = 288.a) Compute the variance for the sample.
b) Compute the estimated standard error for the sample mean.
Estimated Standard Error
Question 2 Answer:

Possible Outcomes of a Hypothesis Test
Question 3: A researcher reports a t statistic with df = 20. How many individuals participated in the study?

Possible Outcomes of a Hypothesis Test
Question 3 Answer:

Two-Tailed Hypothesis Test Using the t Statistic
Question 4: A sample of n = 4 is selected from a population with a mean of µ = 40. A treatment is administered to the individuals in the sample and, after treatment, the sample has a mean of M = 44 and a variance of s2 = 16. Is this sample sufficient to conclude that the treatment has an
effect? (Use a two-tailed test with α = 0.05) If all other factors are held constant and the sample size is
increased to n = 16, is the sample sufficient to conclude that the treatment has a significant effect? (Use a two-tailed test with α = 0.05)
Two-Tailed Hypothesis Test Using the t Statistic
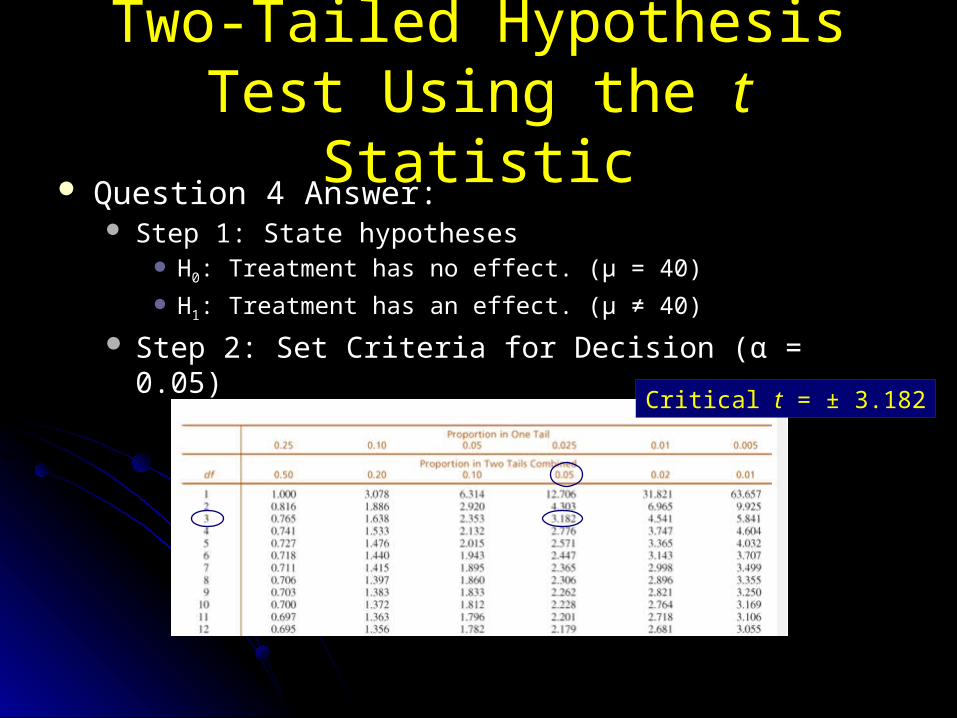
Question 4 Answer: Step 1: State hypotheses
H0: Treatment has no effect. (µ = 40)
H1: Treatment has an effect. (µ ≠ 40)
Step 2: Set Criteria for Decision (α = 0.05)
Critical t = ± 3.182

Two-Tailed Hypothesis Test Using the t Statistic
t = - 3.182 t = + 3.182
df = 3
t Distribution with α = 0.05 Critical regionCritical region

Two-Tailed Hypothesis Test Using the t Statistic
Question 4 Answer: Step 3: Compute sample statistic
a)

Two-Tailed Hypothesis Test Using the t Statistic
Critical regionCritical region
t = - 3.182 t = + 3.182
df = 3
t Distribution with α = 0.05
t = 2.00

Two-Tailed Hypothesis Test Using the t Statistic
Question 4 Answer Step 4: Make a decision
For a Two-tailed Test:
tsample (2.00) < tcritical (3.182) Thus, we fail to reject the null and cannot conclude that the
treatment has an effect.
If -3.182 < tsample < 3.182, fail to reject H0
If tsample ≤ -3.182 or tsample ≥ 3.182, reject H0

Two-Tailed Hypothesis Test Using the t Statistic
Question 4 Answer: Step 1: State hypotheses
H0: Treatment has no effect. (µ = 40)
H1: Treatment has an effect. (µ ≠ 40)
Step 2: Set Criteria for Decision (α = 0.05)Critical t = ± 2.131

Two-Tailed Hypothesis Test Using the t Statistic
t Distribution with α = 0.05
df = 15
t = - 2.131 t = + 2.131
Critical region Critical region
Two-Tailed Hypothesis Test Using the t Statistic
Question 4 Answer: Step 3: Compute sample statistic
a)
Two-Tailed Hypothesis Test Using the t Statistic
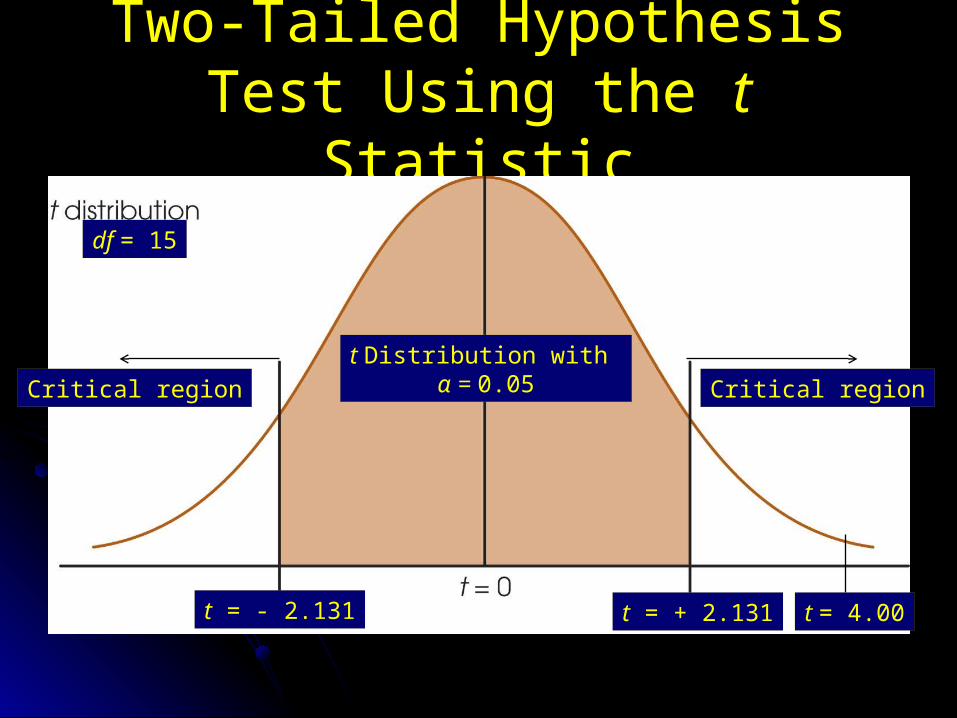
t Distribution with α = 0.05Critical region
t = - 2.131 t = + 2.131
Critical region
df = 15
t = 4.00
Two-Tailed Hypothesis Test Using the t Statistic
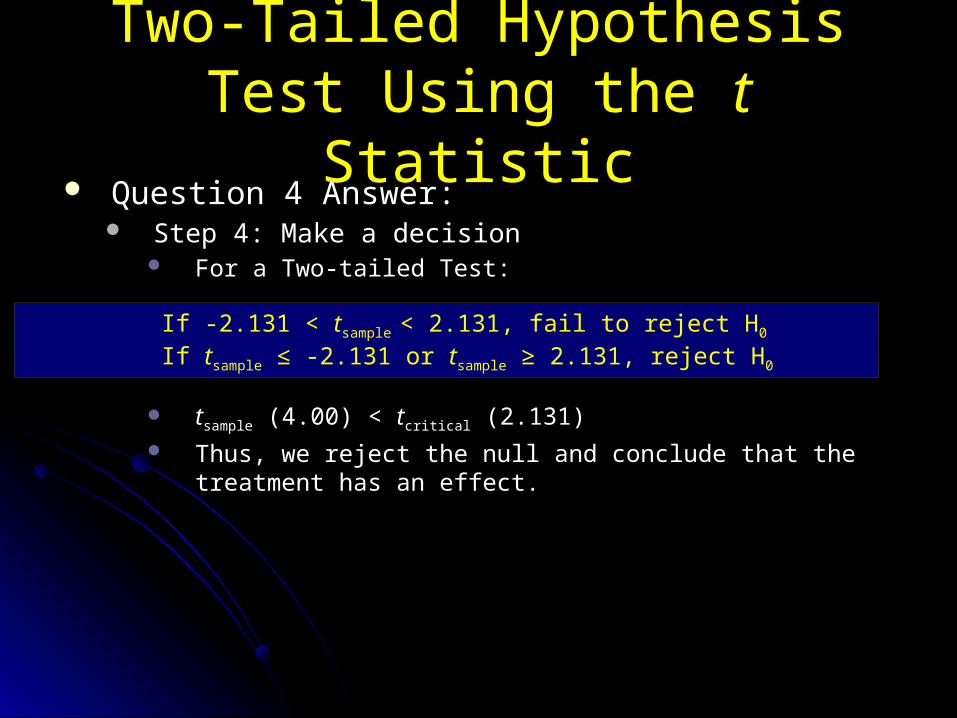
Question 4 Answer: Step 4: Make a decision
For a Two-tailed Test:
tsample (4.00) < tcritical (2.131) Thus, we reject the null and conclude that the treatment has an
effect.
If -2.131 < tsample < 2.131, fail to reject H0
If tsample ≤ -2.131 or tsample ≥ 2.131, reject H0

One-Tailed Hypothesis Test Using the t Statistic
Question 5: Dr. Johnson is conducting research on a new supplement that claims to improve physical performance. The average 40 yard dash time for college football players is µ = 4.65 seconds. A sample of n = 25 players is chosen to test this supplement. Each player is given the supplement, and, 1 hour later, 40 yard dash time is measured for each player. The average time for this sample is M = 4.57 seconds with SS = 3.6. Dr. Anderson would like to use a hypothesis test with α = 0.05 to evaluate the effectiveness of the supplement. Use a one-tailed test to determine whether the supplement
produces a significant decrease in 40 yard dash times.

One-Tailed Hypothesis Test Using the t Statistic
Question 5 Answer: Step 1: State hypotheses
H0: Supplement does not decrease 40 yard dash times. (µ ≥ 4.65)
H1: Supplement does decrease 40 yard dash times. (µ < 4.65)
Step 2: Set Criteria for Decision (α = 0.05)Critical t: -1.711

One-Tailed Hypothesis Test Using the t Statistic
df = 24
t Distribution with α = 0.05Critical region
t = -1.711
Because this is a one-tailed test‚there is only one critical region.

One-Tailed Hypothesis Test Using the t Statistic
Question 5 Answer: Step 3: Compute sample statistic
a)

One-Tailed Hypothesis Test Using the t Statistic
df = 24
t Distribution with α = 0.05Critical region
t = -1.711
Because this is a one-tailed test‚there is only one critical region.
t = -1.00

One-tailed Hypothesis Test
Question 5 Answer: Step 4: Make a decision
For a One-tailed Test:
tsample (-1.00) > tcritical (-1.711) Thus, we fail to reject the null and cannot conclude that the
supplement decreases 40 yard dash times.
If tsample > -1.711, fail to reject H0
If tsample ≤ -1.711, reject H0

Estimated Cohen’s d and r2
Question 6: A sample of n = 16 is selected from a population with a mean of µ = 80. A treatment is administered to the sample and, after treatment, the sample is found to be M = 86 with a standard deviation of s = 8.
a) Find estimated Cohen’s d.
b) Find r2.

Estimated Cohen’s d and r2
Question 6a Answer: estimated Cohen’s d: d = This is a medium to large effect.
Remember: This week in Aplia, if d falls between 0.2 and 0.5, it is a small to medium effect. If d falls between 0.5 and 0.8, it is a medium to large effect.

Estimated Cohen’s d and r2
Question 6b Answer:
Find t and df.
𝑑𝑓=𝑛−1=16−1=15
This is a large effect.
Confidence Intervals
Question 7: A sample of n = 16 is selected from a population with a mean of µ = 80. A treatment is administered to the sample and, after treatment, the sample is found to be M = 86 with a standard deviation of s = 8. Find the 95% confidence interval for the population mean after
treatment.

Confidence Intervals
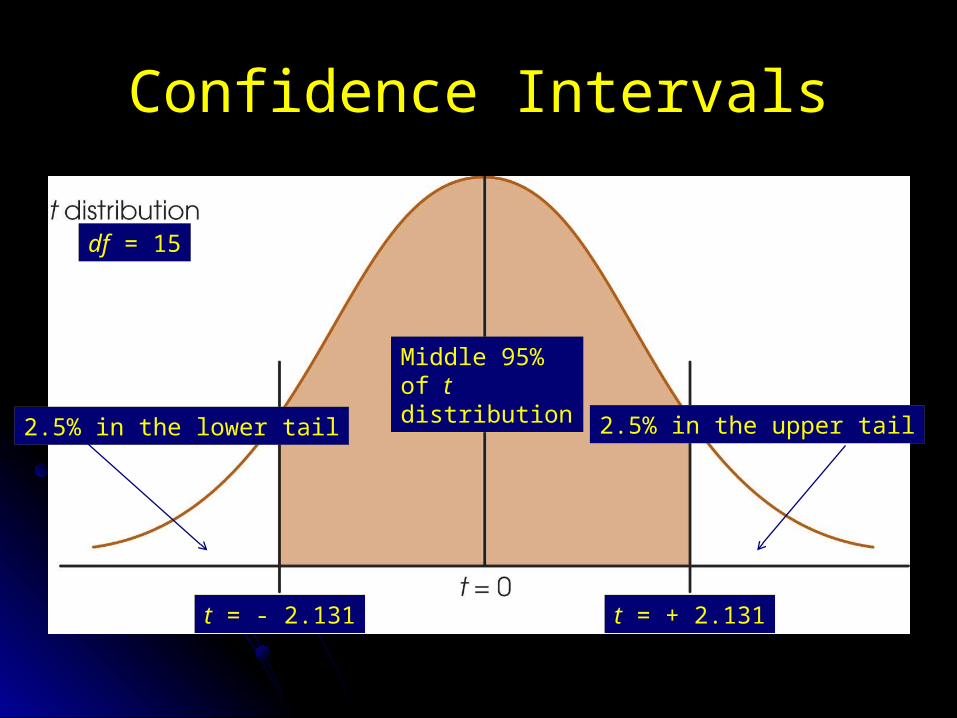
Question 7 Answer: Step #1: Look up the corresponding t values in the t distribution
table for scores that crop the middle 95% of the distribution. This means that you need to have 2.5% in each tail. Calculate the degrees of freedom for t : df = n – 1 = 16 -1 = 15 Now look up the values of t with 15 df for a 1 tail test at 0.025 or
a 2 tail test at 0.05: t = +/- 2.131
Confidence Intervals
Middle 95%of t distribution
t = + 2.131t = - 2.131
df = 15
2.5% in the lower tail 2.5% in the upper tail

Confidence Intervals
Step #2: Calculate the bounded values of the interval. To do this, you must use M and sM as obtained from the sample data and plug these values into the estimation formula: μ = M ± t*s
M
μ = M ± t*sM
= 86 +/- (2.131)*(2.00)
μlower = M - t*sM
= 86 - (2.131)*(2.00) = 81.738
μupper = M + t*sM
= 86 + (2.131)*(2.00) = 90.262

Confidence Intervals
Step #3: Summarize the findings
After treatment our population mean should fall between μ = 81.738 and μ = 90.262. We are 95% confident that the true population mean is located within this interval.
M = 8681.738 90.262
Value for lower boundary of 95%
confidence interval
Value for upper boundary of 95%
confidence interval
Values that fall in the middle of the 95% CI

Frequently Asked Questions FAQs
Will we be asked to remember formulas and concepts from past chapters? Like all math classes, statistics is a course that builds on itself as
the semester progresses. Therefore, it is entirely possible that either Aplia, the test, or both will expect you to remember formulas and concepts from previous chapters.
There is an example on the next slide.

Frequently Asked Questions FAQs
The following sample was obtained from a population with unknown parameters. Scores: 6, 12, 0, 3, 4
Compute the sample mean and standard deviation. Compute the estimated standard error for M.

Frequently Asked Questions FAQs
Sample Mean: Definitional Formula for SS:
X X - M (X – M)2
6 6 – 5 = 1 (1)2 = 1
12 12 – 5 = 7 (7)2 = 49
0 0 – 5 = -5 (-5)2 = 25
3 3 – 5 = -2 (-2)2 = 4
4 4 – 5 = -1 (-1)2 = 1
SS = 80

Frequently Asked Questions FAQs
Sample Variance: Sample Standard Deviation: Estimated Standard Error:
Related Documents


