Course Code : EECO101 Course Title: MICRO ECONOMICS UNIT – 1 Basic Concepts of Economics Case Study Title: - Decision-making at Asian Paints Decision-making the vision of Asian Paints (India) Ltd., is to become one of the top five Decorative coatings companies worldwide by leveraging its expertise in the higher growth emerging markets, simultaneously, the company intends to build long term value in the Industrial coatings business through alliances with established global partners. Asian Paints is India’s largest paint company and ranks among the top ten decorative coatings companies in the world today, with a turnover of ` 20.67 billions (USD 435 millions) and an enviable reputation in the Indian corporate world for Professionalism, Fast Track Growth, and Building Shareholder Equity. The October’ 2002 issue of Forbes Global magazine USA ranked Asian Paints among the 200 Best Small Companies in the World for 2002 and presented the ‘Best under Billion’ award, to the company. One of the country’s leading business magazines “Business Today” in Feb 2001 ranked Asian Paints as the Ninth Best Employer in India. A survey carried out by ’Economic Times’ In January 2000, ranked Asian Paints as the Fourth most admired company across industries in India. Among its various other achievements, Asian Paints is the only company in India to have won the prestigious Economic Times – Harvard Business School Association of India award on two separate occasions, once in the category of “Mini-Giants” and the other in “Private sector giants”. The major decisions taken by the company which helped it to achieve the set goals were: 1. Consumer Focus: The Company has come a long way since its small beginnings in 1942. Four friends who were willing to take on one of the world’s biggest, most famous paint companies operating in India at that time set it up as a partnership fi rm. Over the course of 25 years Asian Paints became a corporate force and India’s leading Paints Company. Driven by its strong consumer-focus and innovative spirit, the company has been the market leader in paints since 1938. Today it is double the size of any other paint company in India. 2. Wide Range of Products: Asian Paints manufactures a wide range of paints for Decorative and Industrial use. Vertical integration has seen it diversify into Specialty products such as Phthalic Anhydride and Pentaerythritol. Not only does Asian Paints offer customers a wide range of Decorative and Industrial paints, it even Custom-creates products to meet specific requirements. 3. International Tie-ups: To keep abreast of world technology and to protect its competitive edge, Asian Paints has from time to time entered into technology alliances with world leaders in the paint industry.

Welcome message from author
This document is posted to help you gain knowledge. Please leave a comment to let me know what you think about it! Share it to your friends and learn new things together.
Transcript

Course Code : EECO101
Course Title: MICRO ECONOMICS
UNIT – 1
Basic Concepts of Economics Case Study Title: - Decision-making at Asian Paints
Decision-making the vision of Asian Paints (India) Ltd., is to become one of the top five Decorative coatings companies worldwide by leveraging its expertise in the higher growth emerging markets, simultaneously, the company intends to build long term value in the Industrial coatings business through alliances with established global partners. Asian Paints is India’s largest paint company and ranks among the top ten decorative coatings companies in the world today, with a turnover of ` 20.67 billions (USD 435 millions) and an enviable reputation in the Indian corporate world for Professionalism, Fast Track Growth, and Building Shareholder Equity. The October’ 2002 issue of Forbes Global magazine USA ranked Asian Paints among the 200 Best Small Companies in the World for 2002 and presented the ‘Best under Billion’ award, to the company. One of the country’s leading business magazines “Business Today” in Feb 2001 ranked Asian Paints as the Ninth Best Employer in India. A survey carried out by ’Economic Times’ In January 2000, ranked Asian Paints as the Fourth most admired company across industries in India. Among its various other achievements, Asian Paints is the only company in India to have won the prestigious Economic Times – Harvard Business School Association of India award on two separate occasions, once in the category of “Mini-Giants” and the other in “Private sector giants”. The major decisions taken by the company which helped it to achieve the set goals were:
1. Consumer Focus: The Company has come a long way since its small beginnings in 1942. Four friends who were willing to take on one of the world’s biggest, most famous paint companies operating in India at that time set it up as a partnership fi rm. Over the course of 25 years Asian Paints became a corporate force and India’s leading Paints Company. Driven by its strong consumer-focus and innovative spirit, the company has been the market leader in paints since 1938. Today it is double the size of any other paint company in India. 2. Wide Range of Products: Asian Paints manufactures a wide range of paints for Decorative and Industrial use. Vertical integration has seen it diversify into Specialty products such as Phthalic Anhydride and Pentaerythritol. Not only does Asian Paints offer customers a wide range of Decorative and Industrial paints, it even Custom-creates products to meet specific requirements. 3. International Tie-ups: To keep abreast of world technology and to protect its competitive edge, Asian Paints has from time to time entered into technology alliances with world leaders in the paint industry.

It has a 50:50 joint venture with Pittsburgh Paints & Glass Industries (PPG) of USA, the world leader in automotive coatings, to meet the increasing demand of the Indian automotive industry.
RONW = Return On Net Worth ROCE = Return On Capital Employed PAT = Profit after Tax 4. Latest Technology: It has also drawn on the world’s latest technology for its manufacturing capabilities in areas like powder coatings and high-tech resins – thus ensuring that its product quality lives up to exacting international standards, even in the most sophisticated product categories. 5. Emphasis is on R&D: The Company places strong emphasis on its own in-house R&D, creating new opportunities by effectively harnessing indigenous creativity. The Asian Paints Research & Development Center in Mumbai has acquired the reputation of being one of the finest in South Asia. With its team of over 125 qualified scientists, it has been responsible for pioneering a number of new products and creating new categories of paints. The entire decorative range of the company has been developed by the R&D team. 6. State of the Art Plants: The Company boasts of state-of-the-art manufacturing plants at Bhandup in the state of Maharashtra; at Ankleshwar in the state of Gujarat; at Patancheru in the state of Andhra Pradesh; and at Kasna in the state of Uttar Pradesh. All the company’s plants have been certified for ISO 9001 – the quality accreditation. All the company’s plants have also received the ISO 14001 certificate for Environment Management Standard. The Phthalic Anhydride plant has been certified for ISO 9002 and ISO 14001 whereas the Penta plant has been certified for ISO 14001. The Penta plant will shortly receive its ISO 9002 certification. 7. Environment Friendly: In June 2002, Asian Paints plant in Patancheru was conferred “The Golden Peacock” award by the World Environment Foundation and the award for ’Excellence in Environment Management’ by the Government of Andhra Pradesh.
8. Emphasis on IT: Asian Paints was one of the first companies in India to extensively computerize its operations. In addition to computerized manufacturing, computers are used widely in the areas of distribution, inventory control and sophisticated MIS to derive benefits of faster market analysis for better decision making. It is a continuously evolving company deriving its cutting edge from the use of innovative IT solutions. All the locations of the company are integrated through the ERP solution. 9. World Wide Presence: Asian Paints operates in 23 countries across the world. It has manufacturing facilities in each of these countries and is the largest paints company in nine overseas markets. It is also India’s largest exporter of paints, exporting to over 15 markets in the Asia-Pacific region, the Middle East and Africa. In 12 markets it operates through its subsidiary, Berger International Limited and in Egypt through SCIB Chemical SAE. Further decisions that the company may consider are: 1. More focus on industrial paints, especially the automotive paints division 2. Manage the chemicals business more efficiently
3. Better marketing strategies to adopt top line growth in international operations 4. Reduce the input costs of production 5. Consolidate on the ‘colourworld’ and ‘home solutions’ initiatives to consolidate the leadership position in decorative paints segment. Question How does economics play a role in decision-making at Asian Paints? Ans. Analysis of economic variables allows the fi rm to make optimal business decisions. The concepts of economics like demand, supply, production, costs and macro economic variables that affect the entire economy play a vital role in decision-making.

UNIT – 2
Demand Analysis Case Study Title: - Micro Factors affecting Demand for Tanishq Products Price of Jewellery – Symbol of Quality Provided Price of a commodity is known to have a direct influence on demand for it. This follows from the Law of Demand. But in the case of Tanishq jewellery this does not hold true, making it an exception to the Law. This can be explained in terms of Veblen effect, where the price of a commodity is regarded as an indicator of its quality. Sometimes certain commodities are demanded just because they happen to be expensive or prestige goods, and hence have a “snob appeal”. These are generally luxury articles that are purchased by the rich as status symbols. The price of Tanishq jewellery is regarded by patrons as being the just cost of the purity and trustworthiness of the brand. Not only was Tanishq the first to offer branded jewellery in India, but it was also the first to introduce concepts such as testing the purity of jewellery through the Karat meter, a buyback guarantee as well as other exchange schemes. Each move by Tanishq has shown its confidence in its own product. This has in turn inspired confidence in its customers, who are loyal. Usually, when the price of gold bullion increases people tend to curb/postpone their purchases of gold ornaments. However, the demand for Tanishq jewellery is independent of this price factor because each piece of jewellery represents a promise of quality and purity, each piece is something different and new, each piece is something special. As such the income and substitution effects do not adversely affect the demand for Tanishq jewellery, and price has title impact overall. But it has also been observed that an escalation in the gold price, diamonds seem to have caught the fancy of the customer and the promotional offers are being designed to provide customers with significantly enhanced value. Designs Offered The average Indian has always been very discerning when it comes to the purchase of jewellery. However, with the spread of globalization customers want the best quality in terms of designs. Best quality is providing to meet the international standards. Creativity is the buzzword. Tanishq’s primary customer, the urban Indian woman, has come a long way. She is smart, educated, and confident of handling career and family, and looking to secure value for her money. Today’s urban women no longer wear jewellery only at weddings and formal occasions. They require trendy accessories that match her attire and reflect her personality. In this context the demand is vast and widespread in terms of prices. The women of today want the best of everything and have become more and more and more selective in their choices. The brand’s designs address the needs of the modern woman. Tanishq had crafted award-winning designs in 18 karat and 24 karat gold and gemstone jewellery. It’s new range looks beautiful and yet is affordable and feels light. Promotional Schemes With cutthroat competition in the market, every company comes up with schemes to woo the customers. These offers are all the more visible during the festival season. Purchase of jewellery can happen any time of the year like – for birthdays, anniversaries, gifting, impulse purchases, etc. and of course for marriages as well. Therefore, in absolute terms, there is no lean period for jewellery – the

jewellery market can be stimulated throughout the year through a host of well-designed marketing inputs. Tanishq to promote its brand comes up with all kinds of schemes like a jewellery exhibition which brings fresh talent to the forefront, launched a nationwide jewellery design competition on May 22nd 2004, ‘Get Gold free with Diamonds’ promotional offer across all 66 exclusive Tanishq boutiques in India. It’s also specially designed the three crowns for the Ponds Femina Miss India Contest this year. It reached out to the target group through exclusive working women’s meets, where well known career women spoke about issues relevant to working women. In addition, ‘Tanishq Collection-G’ ran joint promotions with brands such as L’Oreal and Wills Lifestyle, which it believed appeal to a similar set of consumers. Tanishq has successful stimulated demand for jewellery throughout the year through launches of new jewellery collections, a range of exchange programs and other offers (such as our recently concluded “Impure to Pure” exchange offer) and a number of in-store events. As a result of these efforts, even while the market for jewellery declined by more than 15% last year, Tanishq grew by 40% for the third successive year. Amongst the most recent initiatives of Tanishq has been the targeting of the wedding market by making special offers on wedding jewellery. This promotional scheme has had the masses thronging in, in very large numbers. It also got the 4th Annual Lycra Images Fashion Awards in the Jewellery category. Discounts Discounts play a major role in determining the demand for a product. Tanishq periodically offers discounts. In 2002 it offered a vast gamut of discounts in its showrooms in Bihar during the festival of Dhanteras resulting in sales of ` 5 crore in one particular store. During its fifth anniversary celebrations Tanishq offered discounts to customers, and the response was so overwhelming that extra security was called to handle the crowd even before the store opened. At select points of time in the year Tanishq also offers 20%-40% discount on making charges, which is also a large crowd puller. Guarantee Tanishq has managed to establish its position in the market because its quality products are backed by a guarantee certificate. Each item of jewellery that is sold is accompanied by a guarantee card that states the weight of the gold/platinum as well as the cartage of the gemstones used. In case of any discrepancy the company is liable for legal action. All diamonds used are VVS certified, and the platinum is passed by the official Platinum Authority of India. 100% purity backed by an ironclad guarantee is thus the hallmark of Tanishq jewellery. This is a major demand inducer as the traditional jewelers are increasingly fudging on such things. Question Analyse the role of other factors (other than price of products) in influencing the demand for Tanshiq’s products.

Caselet Title: - Transportation as a Derived Demand
In economic systems what takes place in one sector has impacts on another; demand for a good or service in one sector is derived from another. For instance, a consumer buying a good in a store will likely trigger the replacement of this product, which will generate demands for activities such as manufacturing, resource extraction and, of course, transport. What is different about transport is that it cannot exist alone and a movement cannot be stored. An unsold product can remain on the shelf of a store until a customer buys it (often with discount incentives), but an unsold seat on a flight or unused cargo capacity in the same flight remain unsold and cannot be brought back as additional capacity later. In this case an opportunity has been missed since the amount of transport being offered has exceeded the demand for it. The derived demand of transportation is often very difficult to reconcile with an equivalent supply and actually transport companies would prefer to have some additional capacity to accommodate unforeseen demand (often at much higher prices). There are two major types of derived transport demand: Direct derived demand: This refers to movements that are directly the outcome of economic activities, without which they would not take place. For instance, work-related activities commonly involve commuting between the place of residence and the workplace. There is a supply of work in one location (residence) and a demand of labor in another (workplace), transportation (commuting) being directly derived from this relationship. For freight transportation, all the components of a supply chain require movements of raw materials, parts and finished products on modes such as trucks, rail or containerships. Thus, transportation is directly the outcome of the functions of production and consumption. Indirect derived demand: Considers movements created by the requirements of other movements. The most obvious example is energy where fuel consumption from transportation activities must be supplied by an energy production system requiring movements from zones of extraction, to refineries and storage facilities and, finally, to places of consumption. Warehousing can also be labeled as an indirect derived demand since it is a non movement of a freight element. Warehousing exists because it is virtually impossible to move commodities instantly from where they are produced to where they are consumed. Transportation can also be perceived as an induced (or latent) demand which represents a demand response to a reduction in the price of a commodity. This is particularly the case in the context where the addition of transport infrastructures results in traffic increases due to higher levels of accessibility. Roadway congestion is partially the outcome of induced transport demand as additional road capacity results in mode shifts, route shifts, redistribution of trips, generation of new trips, and land use changes that create new trips as well as longer trips. However, the induced demand process does not always take place. For instance, additional terminal capacity does not necessarily guarantee additional traffic as freight forwarders are free to select terminals they transit their traffic through, such as it is the case for maritime shipping.

UNIT – 3
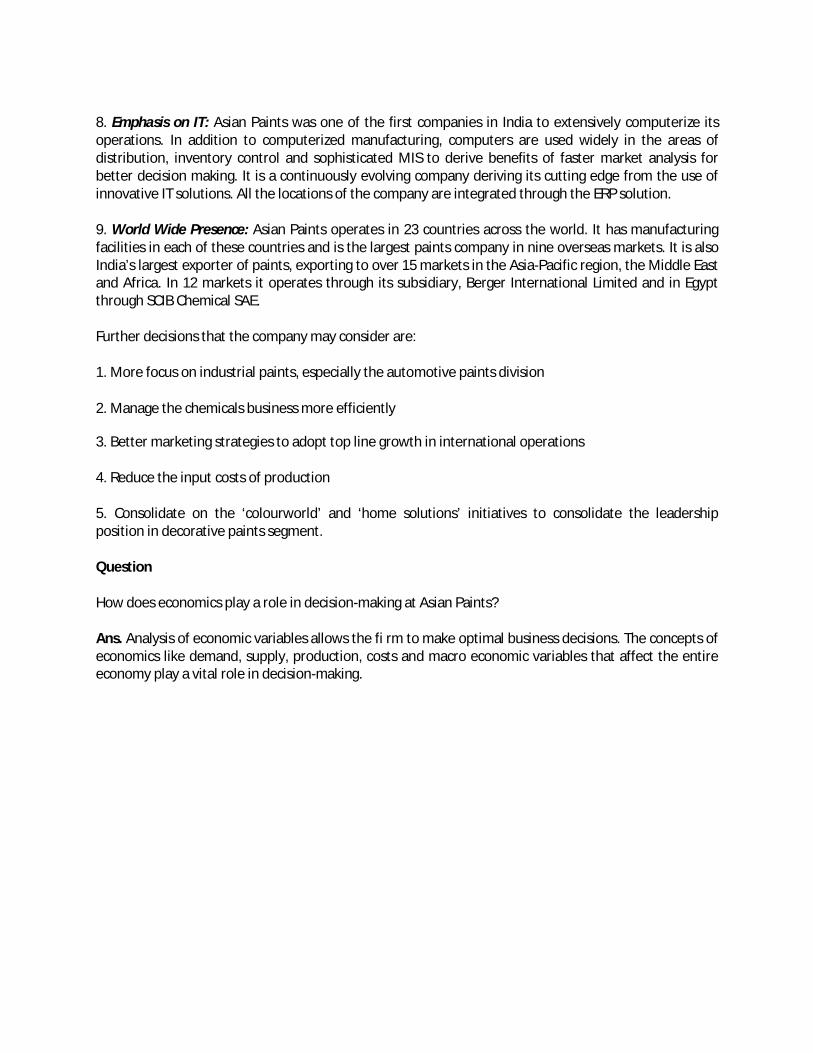
Supply and Market Equilibrium Case Study Title: - Demand – Supply and Price of Gold
Last month saw more housewives in the jewellery shops than in any month in the past. There were no big festivals, neither too many marriages. What attracted them was the fall in the price of gold. That was so the world over. Gold prices have been falling for nearly a decade now. Last week they had drifted to their lowest in the past 18 years. The highest price in the world market was reached in 1980 when it touched $850 an ounce, almost three times the present price. Indian buyers did not experience the full impact because of the restrictions on import of gold. These have been significantly eliminated and the price behavior in the domestic market now conforms to the international price. The fall in the price of gold has more to do with the change in demand. Gold has many uses, Jewellery is only of them. It is an industrial metal, a form of saving for the rainy day and an international reserve asset for most central banks. The lure of gold for ornaments remains almost intact. But as a form of saving or as reserve for the central banks, gold is no longer attractive. It is precisely this loss in trust that has caused the fall in the price of gold. Gold has become a bad investment. Anyone would weigh an asset in terms of the return it earns, the security it gives and the ready market it enjoys. The last is the best with gold. But with the price going down; investment in gold makes no sense. An investment of Rs. 1,000 in gold in India in 1990 would have fetched today Rs. 1,120. That gives a yield of less than 3 per cent. Not worth the game. The same investment in equity would have matured into Rs. 1,900 and in bank deposit Rs. 2,200. Gold is no longer a viable investment though the housewife may still buy gold partly for display and partly from ignorance about the alternative opportunities. The penchant for jewellery is much more in India and West Asia than in most other countries. The world demand for jewellery was 2,807 tones last year. Gold that was actually mined was only 1,350 tones. The balance came from sales by the central banks. The bankers are hard-nosed fellows and the new generation bankers even more so. For their predecessors gold meant total security. That was not without reasons. Countries had adopted gold standard and issue of currency had to have commensurate gold backing. The system had continued till the beginning of this century and in a modified form, even later. The final link with gold was given up in 1972, after the oil crisis, when the dollar ceased to be convertible into gold. But the gold hangover continued until the new generation bankers looked at gold only as an income generating asset. It had ceased to be one. Over the years, the central banks had piled up huge reserves of gold. These currently exceed 37,000 tonnes – equivalent to 12 years’ supply. When part of this gold began to come to the market, prices crashed. Netherlands possibly took the lead to empty the central bank coffers of gold. It sold 300 tonnes in four instalments to cut down its gold reserves by a fi fth. The big shock came when Australia slashed its reserves by two-thirds. It was a shock because Australia is a major producer of gold.

Argentina came out even more boldly and sold out its entire gold reserve of 124 tonnes for about $1.5 billion. Had it continued with gold, the central bank would have lost $1.5 million for every one per cent fall in the price of gold. With the shift from gold to US treasury bonds which are rated even higher than AAA the central bank would, instead, be earning an income of $80 a year. The real gold hoarders are the Swiss bankers. They are conservative and gold is the most prized asset for them. However, last October, a panel of experts suggested that the banks sell out a half of their reserves in gold. The report of the panel created big waves. The fear that the central banks will unload their stocks of gold caused panic. Gold prices crashed. The fall was the highest in any single day. It is not just the mismatch between demand and supply that forced prices to drop so sharply. Gold is a favorite with speculators. Even banks have been indulging in this lucrative activity. Quite a few American banks sold gold short in anticipation of the fall in price and earned a good packet. Speculation has made prices more volatile than what they would have been. Considering the oversupply position, it is the bears that hold the sway. Will gold prices recover? If they do gold would be a good investment. But they won’t. The demand for gold will now be almost exclusively for jewellery and, to a minor extent, for industrial use. Even that demand is dwindling because gold does not have a good resale value and has nearly ceased to be a status symbol for the rich. When most people understand this the demand for gold, even for jewellery, purposes will shrink. For the present, it may freeze at around 2,500 tonnes. There is no demand at all from the bankers for reserves or for investment. The supply will be from the mines from which 2,300 tonnes are dug out every year. On top of that there will be sale by the central banks. Even if 2 per cent of the world reserves are disposed off, nearly 700 tonnes of additional supply will enter the market. Again a mismatch between demand and supply is likely which will prevent prices from firming up. Gold has little future. By and by even its use for ornaments will die out. A bad investment and no longer kept for reserve, gold will be on par with other metals. The switch will be from gold to US treasury bonds for the banks and from gold to equity for the general public. In India, gold will survive a little longer until the public is acquainted with alternative investment opportunities. Eventually, gold is bound to lose its lustre.
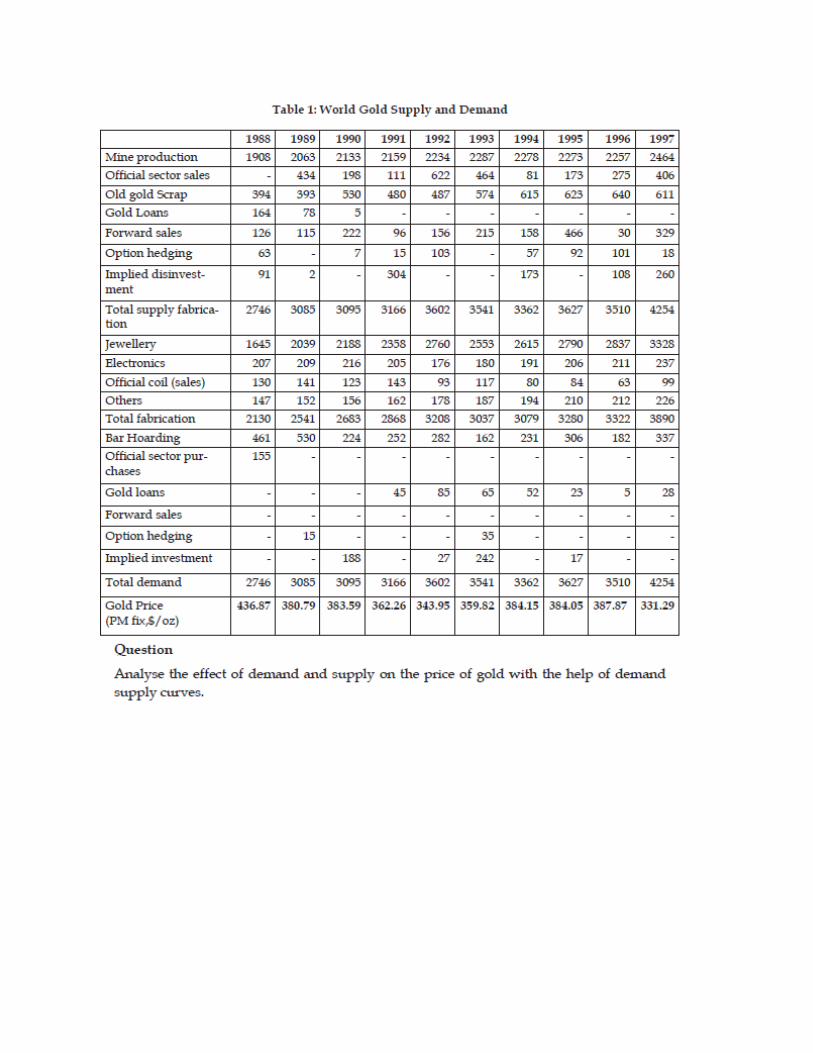
Caselet Title: - Nutmeg, Mace Prices Shoot up amid Supply Crunch
The annual growth in demand for nutmeg and mace is estimated at 5 to 10 per cent of late, they said. Whereas the production (without shells) was around 8,000 tonnes in 2008- 09, with shell was at 11,362 tonnes from 16,400 hectares. The weight of the shell comes to around 30 per cent, while that of mace is 10 per cent, they said. It is grown in the mid-lands of Kerala, especially on the banks of rivers, as it requires a deep, well-drained loamy sandy soil. Shade is required for the first two to three years. The optimal growing temperature is between 20-30°C and the annual rainfall should be between 1,500-2,500mm, Spices Board sources said. Kerala topped in area and production (13,494 ha/11,361 tonnes) of nutmeg and mace followed by Karnataka (136 ha/1,997 tonnes) and Andaman and Nicobar Islands (79 ha/4 tonnes) in 2006-07 according to the Board. Half the trees are male and do not produce fruit. Unfortunately, the sex of the plants cannot be determined until they are six to eight years old. However, budded plants which are able to bear fruits, are made available by the nurseries run by the Universities/Agricultural departments at a price, they said.

The principal import markets are the European Community, the US, Japan and India. Singapore and the Netherlands are the major re-exporters. The US is the biggest individual market for whole nutmegs. US importers prefer the East Indian type of deep brown, aromatic nutmeg and orange-red mace in their whole form. As the Indian production is below the demand, the country continues the import of both nutmeg and mace. Much of the imports are by the oleoresin industry, they said. During 2008-09, India imported 1,325 tonnes of nutmeg valid at ` 25.37 crore and 265 tonnes of mace worth ` 8.46 crore, they said. At the same time, the country has exported an estimated 3,275 tonnes of nutmeg and mace worth ` 91.87 crore. A good chunk of the Indian exports of this commodity is value-added items such as oleoresins, oil and in powdered form, they said. Nutmeg and mace, their oleoresins and essential oils are used in the food and beverage industries. Although whole nutmeg is available, ground nutmeg is more popular. The ground form is mainly used in the food processing industry, extraction industry sources said. Nutmeg is a standard seasoning in many Dutch dishes. Nutmeg and its oleoresin are used in the preparation of meat products, soups, sauces, baked foods, confectioneries, puddings, seasoning of meat and vegetables, to flavor milk dishes and punches. The fleshy outer cover of the fruit is crystallized or pickled or made into jellies, they said. Mace is sold either whole or as ground spice and is used in savoury dishes. It is used to flavour milk-based sauces and processed meats such as sausages. Soups, pickles and ketchup, pickles and chutneys are also seasoned with mace. Because of its aroma, the essential oil is used as a natural flavouring extract and is employed for flavouring food products and liquors. Nutmeg oil and mace oil are used mainly in flavouring soft drinks, canned foods and meat products. Nutmeg oil is used in cosmetics, men’s perfume and toiletries due to its aromatic properties Mace oil possesses almost identical “physico-chemical” and “organoleptic” properties as nutmeg oil. Mace oil is also used to a limited extent in perfumes and soaps. They are used in the pharmaceutical industries also, industry sources told Business Line. Nutmeg is produced in the tropical areas of Indonesia and the West Indies. The world production of nutmeg is about 25,000 tonnes a year. The global demand is also estimated at around this level, they said. The production of mace is about 3,000 tonnes. Indonesia and Grenada dominate production and export both products with a world market share of 75 per cent and 20 per cent respectively. The other producing countries include India, Malaysia, Papua New Guinea, Sri Lanka and a few Caribbean islands.

UNIT – 4
Elasticity of Demand Case Study Title :- Student’s Dilemma
A small state university is faced with a critical financial problem. At present tuition rates, the university is loosing ` 5 crores per year. The head of the university urges that there should be a 25% increase in tuition fee. Based on the total students enrolled, he projects that this increase would cover the ` 5 crores deficit in revenues. Student leaders protest but it falls on deaf ears. Students realise that their only hope is to demonstrate that the tuition hike is not in the best interest of the university. What can they do? Students find a journal article that discusses the price elasticity of demand for college education. The author estimates that the elasticity of enrollment at state universities is –1.3 with respect to tuition charges. That is, a 1% increase in tuition would decrease enrollments by 1.3%. The data are current. Based on the elasticity estimate, the students calculate that the proposed tuition hike of 25% would decrease enrollment by 32.5%. This would result in a decrease in total revenue even after tuition increase. The university is given this information and it is forced to withdraw its proposed hike and fi nd alternative ways to meet the deficit. Question
Evaluate the ultimate decision of the university to withdraw the proposed hike.

Caselet Title: - Price Gouging takes you Home
Picture this. It is raining and you are caught inside a mall after a long shopping expedition. The auto drivers want twice the “normal” fare to take you home. Is life unfair? Or is pure economics at play? You know that price is determined by demand and supply. If demand goes up with supply remaining same, prices ought to go up. And we know that the rain has increased the demand for autos — people who would have otherwise walked or travelled by public transport now want to hire an auto. The increased demand ought to increase the hire charges, considering the supply of autos remain the same. This does not, however, consider fairness of the price. You may argue that several people who cannot afford to hire an auto for the twice the “normal” fare will be priced out of the market. That is, of course, partially true. If the rates are way too high, very few will hire the auto. This denies the auto drivers a good chance to make more money. The sensitivity to price (or elasticity of demand) will ensure that there is no intense price gouging. The question still remains: Should auto drivers charge higher prices during rainy days or such other market conditions? Suppose autos ply only on metered rate. You will agree that driving on rainy days is more difficult than driving on other days. The risk for the auto driver is higher but his return (metered fare), the same. There is, hence, no incentive for auto drivers to work on rainy days. This would drive several autos out of the market. It means you can hire an auto at “normal” fare… if you are lucky enough to get one! So, consider price gouging (or call it free market pricing if you will) as a means to keep the autos’ supply high… enough to get you home, if you agree on the price. This does not, of course, justify unfair prices on regular days as well!
UNIT – 5
Consumer Behavior: Cardinal Approach Caselet Title: - Should Canada Legalise Marijuana?
The war on drugs is an expensive battle, as a great deal of resources go into catching those who buy or sell illegal drugs on the black market, prosecuting them in court, and housing them in jail. These costs seem particularly exorbitant when dealing with the drug marijuana, as it is widely used, and is likely no more harmful than currently legal drugs such as tobacco and alcohol. There’s another cost to the war on drugs, however, which is the revenue lost by governments who cannot collect taxes on illegal drugs. In a recent study for the Fraser Institute, Canada, Economist Stephen T. Easton attempted to calculate how much tax revenue the government of the country could gain by legalizing marijuana. The study estimates that the average price of 0.5 grams (a unit) of marijuana sold for $8.60 on the street, while its cost of production was only $1.70. In a free market, a $6.90 profit for a unit of marijuana would not last for long. Entrepreneurs noticing the great profits to be made in the marijuana market would start their own grow operations, increasing the supply of marijuana on the street, which would cause the street price of the drug to fall to a level much closer to the cost of production. Of course, this doesn’t happen because the product is illegal; the prospect of jail time deters many entrepreneurs and the occasional drug bust ensures that the supply stays relatively low. We can consider much of this $6.90 per unit of marijuana profit a risk-premium for participating in the underground economy. Unfortunately, this risk premium is making a lot of criminals, many of whom have ties to organized crime, very wealthy. Stephen T. Easton argues that if marijuana was legalized, we could transfer these excess profits caused by the risk-premium from these grow operations to the government: If we substitute a tax on marijuana cigarettes equal to the difference between the local production cost and the street price people currently pay – that is, transfer the revenue from the current producers and marketers (many of whom work with organized crime) to the government, leaving all other marketing and transportation issues aside we would have revenue of (say) $7 per [unit]. If you could collect on every cigarette and ignore the transportation, marketing, and advertising costs, this comes to over $2 billions on Canadian sales and substantially more from an export tax and you forego the costs of enforcement and deploy your policing assets elsewhere. One interesting thing to note from such a scheme is that the street price of marijuana stays exactly the same, so the quantity demanded should remain the same as the price is unchanged. However, it’s quite likely that the demand for marijuana would change from legalization. We saw that there was a risk in selling marijuana, but since drug laws often target both the buyer and the seller, there is also a risk (albeit smaller) to the consumer interested in buying marijuana. Legalization would eliminate this risk, causing the demand to rise. This is a mixed bag from a public policy standpoint: Increased marijuana use can have ill effects on the health of the population but the increased sales bring in more revenue for the government. However, if legalized, governments can control how much marijuana is consumed by increasing or decreasing the taxes on the product. There is a limit to this, however, as setting taxes too high will cause marijuana growers to sell on the black market to avoid excessive taxation.

When considering legalizing marijuana, there are many economic, health, and social issues we must analyze. One economic study will not be the basis of Canada’s public policy decisions, but Easton’s research does conclusively show that there are economic benefits in the legalization of marijuana. With governments scrambling to find new sources of revenue to pay for important social objectives such as health care and education expect to see the idea raised in Parliament sooner rather than later.

UNIT – 6
Consumer Behavior: Ordinal Approach Case Study Title: - Auto Industry — Economic Slowdown as a Determinant of Demand Automobile sector is taken as the indicator of a modern and liberalized industrial India. But as of now there is not much to write in praise of this star-studded sector with gleaming Fords, Astras and Cielos. There is a gloom in this sector as on date. The economic slowdown has led to unexpected downturn in demand. With the first quarter of the current financial year (1997-98) having ended, the ` 30,000 crores automobile industry has shown very little signs of a much hoped for recovery from the massive slowdown it registered last year. In fact it has shown continuous signs of a decline in growth with most segments cutting down production due to poor sales and inventory pile up. After witnessing whopping sales in 1995-96, the slowdown in the last fiscal year was viewed by many as the inevitable correction in growth. However, the continuing depressed condition has come as a dampener to the entire industry. After becoming a blue-chip industry soon after the government liberalised the economy, the automobile industry has been growing at break-neck pace, almost to the point of being dubbed an overhead industry. The 1995-96 financial years saw the industry grow by around 30%, the luxury car segment by nearly 130 per cent. Last year the growth rates came back to normal figures, registering a decline of over 10 per cent. Worst affected was the luxury car segment – from a 132% growth rate it registered a negative growth. Though experts were quick to dismiss last year’s poor performance, vis-à-vis 1995-96, as a correction, the continuing depressed conditions are beginning to worry manufacturers as inventories have started to pile up. With the general economy it showing signs of a lethargy the Chances of a speedy recovery by the automobile industry look anything but likely. Production and sale of vehicles has registered declining growths in the first two months of the financial year according to the latest data released by the Association of Automobile Manufacturers (AIAM). The only segment that was able to register any impressive growth, both in production and sales, was the motor cycles segment. Despite the strong growth of the solitary segment, the entire automobile industry showed a declining growth. While automobile production showed a negative two per cent growth the sales were dipping at a fraction over 0.6%. Worst affected were the scooter segment (production down 14% and sales down 9%) and mopeds (production down 13% and sales 11%). The poor sales of heavy commercial vehicles virtually sums up the performance of the automobile industry. The industry is peculiar in the sense that most of the sales here take place through hire purchase or financing. While the three major heavy truck manufacturers did not cut down production in the first two months, their sales were down by a massive 19.8 per cent. The entire industry was reeling under the liquidity crunch last year. The effects of this do not seem to have worn out as evident from sales figures. With the general economy not picking up, the demand for the heavy vehicles too has come down. In such a situation a cut in production might be very pronounced in the coming months in this segment.

The light commercial vehicle segment was no different either. Boosted by the sales of Tata ‘Sumo’ last year, the light commercial vehicle segment has already shown signs of its inability to sustain the tempo. Though ‘Sumo’ continued to do well and improve its market share, the players in this segment cut down production by about two per cent. However, the effect on sales was even more significant as it dipped by nearly 9.5 per cent. No different was the case of luxury cars either. Although the car segment as a whole was able to post a growth in sales of 2.6 per cent, for the second time in a row the luxury car segment was able to grow only in single digits. Now that the base has widened much more, the days of a double digit growth in any of these segments is a near impossibility.

UNIT – 7
Production Theory Case Study Title: - Cotton Board over Estimated Production The Southern India Mills’ Association (SIMA) said the Cotton Advisory Board (CAB’s) has over estimated the production and under estimated the consumption. According to industry experts any further export of cotton would surpass the quantity decided by Group of Ministers by two lakh bales. J Thulasidharan, chairman, SIMA said that CAB, at its first meeting held on January 6, 2011 has estimated the cotton production as 32.9 million bales and consumption as 27.5 million bales (including 2 million bales of non-mill consumption), retained the exportable surplus as 5.5 million bales and thus reducing the closing stock to 4.45 million bales as against the Group of Ministers (GoM) promised quantity of 5 million bales. He said, “CAB has over estimated the production and under estimated the consumption, textile mills would be forced to curtail their production for want of raw cotton from July onwards resulting abnormal increase in cotton and yarn price.” CAB has reported, cotton production in the northern region (Punjab, Haryana and Rajasthan) will be less than 4 million bales, which has been endorsed by the ginning and trading community. In the past several years, Maharashtra farmers have been selling sizable kapas in Gujarat to fetch higher income whereas in the current season, since the farmers are realising good prices in Maharashtra itself, trading of kapas to Gujarat has come down drastically. This will result in Gujarat crop to less than 10 million bales, he said, Thulasidharan said, in Maharashtra, both production and quality, has been affected from the fact of large scale arrivals of low micronnaire cotton. “This in turn is an indication of severe crop damage in this state, therefore Maharashtra crop would be only around 8 million bales as against the CAB estimate of 9.2 million bales”. On extra long staple (ELS) cotton production, he said, erratic weather condition and unseasonal rains have seriously affected the crop in Karnataka and Madhya Pradesh. Total DCH production may not cross even 125,000 bales, out of which sizeable quantity of arrivals is in the hands of exporters due to recent export clearance and grant of additional quota. With abnormally high ELS cotton prices (280 to 285 cents for PIMA and GIZA 88), Indian spinning sector will have serious setback in fine and superfine counts, said Thulasidharan. He further said the hoarding of ELS cotton by the exporters has increased the DCH 32 cotton price from ` 53,000 per candy to ` 70,000 in a span of 10 days (spot prices), an increase of 24 per cent. Thulasidharan estimated cotton production for the season 2010-11 will be only around 30.9 million bales. As far as cotton consumption is concerned, he stated, that Textile Commissioner Office has already estimated at 27.5 million bales for the current cotton season. “Non-submission of data to the Textile Commissioner’s office is a handicap in arriving at the consumption figure. If the consumption of non-reporting mills and also the capacity being added in the spinning sector, the requirement including non-mill consumption would exceed 28.5 million bales.” “Viewing the production and consumption data, any further export of cotton would seriously affect the entire textile value chain. Even with the current cotton position, mills will face shortage of cotton from July onwards thus resulting in abnormal increase in yarn prices, ultimately affecting the common man”.
The Association has sought the ministry of textiles to take up the matter suitably with the commerce and agriculture ministries and restrict the cotton export at 5.5 million bales and pointed out that the permitted quantity of export of cotton has already exceeded the quantity decided by Group of Ministers by 200,000 bales. Question Do you think that the estimates of Cotton Board are logical? Is it easy for the Board to estimate production and therefore estimate the total revenue and the marginal revenue?
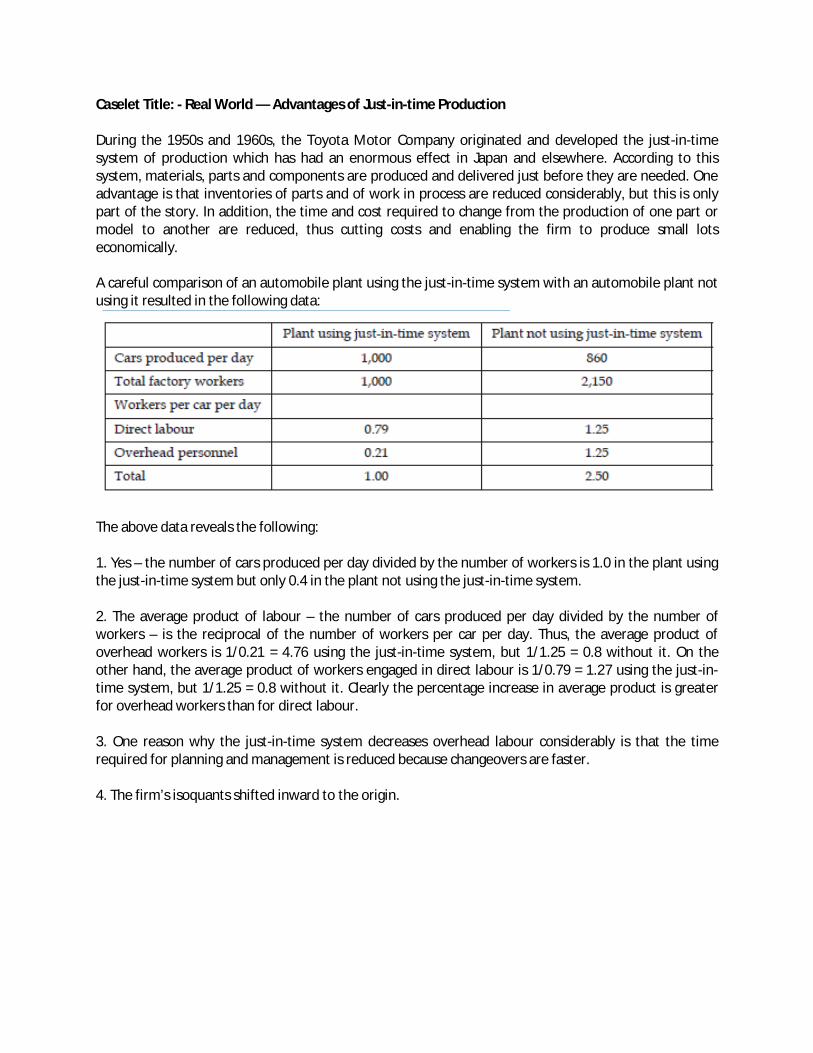
Caselet Title: - Real World — Advantages of Just-in-time Production During the 1950s and 1960s, the Toyota Motor Company originated and developed the just-in-time system of production which has had an enormous effect in Japan and elsewhere. According to this system, materials, parts and components are produced and delivered just before they are needed. One advantage is that inventories of parts and of work in process are reduced considerably, but this is only part of the story. In addition, the time and cost required to change from the production of one part or model to another are reduced, thus cutting costs and enabling the firm to produce small lots economically. A careful comparison of an automobile plant using the just-in-time system with an automobile plant not using it resulted in the following data:
The above data reveals the following: 1. Yes – the number of cars produced per day divided by the number of workers is 1.0 in the plant using the just-in-time system but only 0.4 in the plant not using the just-in-time system. 2. The average product of labour – the number of cars produced per day divided by the number of workers – is the reciprocal of the number of workers per car per day. Thus, the average product of overhead workers is 1/0.21 = 4.76 using the just-in-time system, but 1/1.25 = 0.8 without it. On the other hand, the average product of workers engaged in direct labour is 1/0.79 = 1.27 using the just-in-time system, but 1/1.25 = 0.8 without it. Clearly the percentage increase in average product is greater for overhead workers than for direct labour. 3. One reason why the just-in-time system decreases overhead labour considerably is that the time required for planning and management is reduced because changeovers are faster. 4. The firm’s isoquants shifted inward to the origin.

UNIT – 8
Laws of Production Case Study Title :- Productivity Side of Indian Industries Companies that attend to productivity and growth simultaneously manage cost reductions very differently from companies that focus on cost cutting alone and they drive growth very differently from companies that are obsessed with growth alone. It is the ability to cook sweet and sour that undergrids the remarkable performance of companies like Intel, GE, ABB and Canon. In the slow growth electro-technical business, ABB has doubled its revenues from $17 billions to $35 billions, largely by exploiting new opportunities in emerging markets. For example, it has built up a 46,000 employee organization in the Asia Pacific region, almost from scratch. But it has also reduced employment in North America and Western Europe by 54,000 people. It is the hard squeeze in the north and the west that generated the resources to support ABB’s massive investments in the east and the south. Everyone knows about the staggering ambition of the Ambanis, which has fuelled Reliance’s evolution into the largest private company in India. Reliance has built its spectacular rise on a similar ability to cook sweet and sour. What people may not be equally familiar with is the relentless focus on cost reduction and productivity growth that pervades the company. Reliance’s employee cost is 4 per cent of revenues, against 15-20 per cent of its competitors. Its sales and distribution cost, at 3 per cent of revenues, is about a third of global standards. It has continuously pushed down its cost for energy and utilities to 3 per cent of revenues, largely through 100 per cent captive power generation that costs the company 4.5 cents per kilowatt-hour; well below Indian utility costs, and about 30 per cent lower than the global average. Similarly, its capital cost is 25-30 per cent lower than its international peers due to its legendary speed in plant commissioning and its relentless focus on reducing the Weighted Average Cost of Capital (WACC) that, at 13 per cent, is the lowest of any major Indian firm. A Bias for Growth Comparing major Indian companies in key industries with their global competitors shows that Indian companies are running a major risk. They suffer from a profound bias for growth. There is nothing wrong with this bias, as Reliance has shown. The problem is most look more like Essar than Reliance. While they love the sweet of growth, they are unwilling to face the sour of productivity improvement. Nowhere is this more amply borne out than in the consumer goods industry where the Indian giant Hindustan Lever has consolidated to grow at over 50 per cent while its labour productivity declined by around 6 per cent per annum in the same period. Its strongest competitor, Nirma, also grew at over 25 per cent per annum in revenues but maintained its labour productivity relatively stable. Unfortunately, however, its Return on Capital Employed (ROCE) suffered by over 17 per cent. In contrast, Coca Cola, worldwide, grew at around 7 per cent, improved its labour productivity by 20 per cent and its return on capital employed by 6.7 per cent.

The story is very similar in the information technology sector where Infosys, NIIT and HCL achieve rates of growth of over 50 per cent which compares favourably with the world’s best companies that grew at around 30 per cent between 1994-95. NIIT, for example, strongly believes that growth is an impetus in itself. Its focus on growth has helped it double revenues every two years. Sustaining profitability in the face of such expansion is an extremely challenging task. For now, this is a challenge Indian infotech companies seem to be losing. The ROCE for three Indian majors fell by 7 per cent annually over 1994-96. At the same time IBM Microsoft and SAP managed to improve this ratio by 17 per cent. There are some exceptions, however. The cement industry, which has focused on productivity rather than on growth, has done very well in this dimension when compared to their global counterparts. While Mexico’s Cemex has grown about three times fast as India’s ACC, Indian cement companies have consistently delivered better results, not only on absolute profitability ratios, but also on absolute profitability growth. They show a growth of 24 per cent in return on capital employed while international players show only 8.4 per cent. Labour productivity, which actually fell for most industries over 1994-96, has improved at 2.5 per cent per annum for cement. The engineering industry also matches up to the performance standards of the best in the world. Companies like Cummins India has always pushed for growth as is evidenced by its 27 per cent rate of growth, but not at the cost of present and future profitability. The company shows a healthy excess of almost 30 per cent over WACC, displaying great future promise. BHEL, the public sector giant, has seen similar success and the share price rose by 25 per cent despite an indecisive sensex. The only note of caution: Indian engineering companies have not been able to improve labour productivity over time, while international engineering companies like ABB, Siemens and Cummins Engines have achieved about 13.5 per cent growth in labour productivity, on an average, in the same period. The pharmaceuticals industry is where the problems seem to be the worst, with growth emphasised at the cost of all other performance. They have been growing at over 22 per cent, while their ROCE fell at 15.9 per cent per annum and labour productivity at 7 per cent. Compare this with some of the best pharmaceutical companies of the world – Glaxo Wellcome, SmithKline Beecham and Pfizer –who have consistently achieved growth of 15-20 per cent, while improving returns on capital employed at about 25 per cent and labour productivity at 8 per cent. Ranbaxy is not an exception; the bias for growth at the cost of labour and capital productivity is also manifest in the performance of other Indian pharma companies. What makes this even worse is the Indian companies barely manage to cover their cost of capital, while their competitors worldwide such as Glaxo and Pfizer earn an average ROCE of 65 per cent. In the Indian textile industry, Arvind Mills was once the shining star. Like Reliance, it had learnt to cook sweet and sour. Between 1994 and 1996, it grew at an average of 30 per cent per annum to become the world’s largest denim producer. At the same time, it also operated a tight ship, improving labour productivity by 20 per cent. Despite the excellent performance in the past, there are warning signals for Arvind’s future. The excess over the WACC is only 1.5 per cent, implying it barely manages to satisfy its investors expectations of

return and does not really have a surplus to re-invest in the business. Apparently, investors also think so, for Arvind’s stock price has been falling since Q4 1994 despite such excellent results and, at the end of the first quarter of 1998, is less than ` 70 compared to ` 170 at the end of 1994. Unfortunately, Arvind’s deteriorating financial returns over the last few years is also typical of the Indian textile industry. The top three Indian companies actually showed a decline in their return ratios in contrast to the international majors. Nike, VF Corp and Coats Viyella showed a growth in their returns on capital employed of 6.2 per cent, while the ROCE of Grasim and Coats Viyella (India) fell by almost 2 per cent per annum. Even in absolute returns on assets or on capital employed, Indian companies fare a lot worse. While Indian textile companies just about cover their WACC, their international rivals earn about 8 per cent in excess of their cost of capital. Questions 1. Is Indian companies running a risk by not giving attention to cost cutting? 2. Discuss whether Indian Consumer goods industry is growing at the cost of future profitability. 3. Discuss capital and labour productivity in engineering context and pharmaceutical industries in India. 4. Is textile industry in India performing better than its global competitors?

Caselet Title: - Apache Aims to Double Adidas Shoe Production
Apache Footwear India, the manufacturer for Adidas shoes in India, aims to double production of shoes from its special economic zone (SEZ) here to 8 lakh pairs a month by 2014. At present, about four lakh pair of shoes are produced every month from the SEZ, located in Mambattu village of Nellore district. “We have a target to double the production of shoes to 8 lakh pairs per month by 2014,” Apache Footwear General Manager Phillip Chen said. The company’s SEZ, spread over 314 acres, recorded a turnover of ` 240 crore in 2010 and provides employment to about 6,300 people. The company also plans to set up a development centre and supply centre in the state. These centres would help reduce the time taken for production of shoes. “We are expecting that the turnover will increase to ` 300 crore this year,” Chen said, adding that a proposed supplier park will help the firm bring down the lead time for production from two months at present to just five days. Apache exports its shoes mainly to Europe, the US and Russia. Chen said the firm is also trying to convince Adidas to buy raw material from India. “We are importing the entire raw material mainly from China, Vietnam and Indonesia,” he added. Germany-based Adidas is a leading sports apparel and equipment manufacturer.
UNIT – 9
Cost Concepts Case Study Title: - PSEs: You Decide
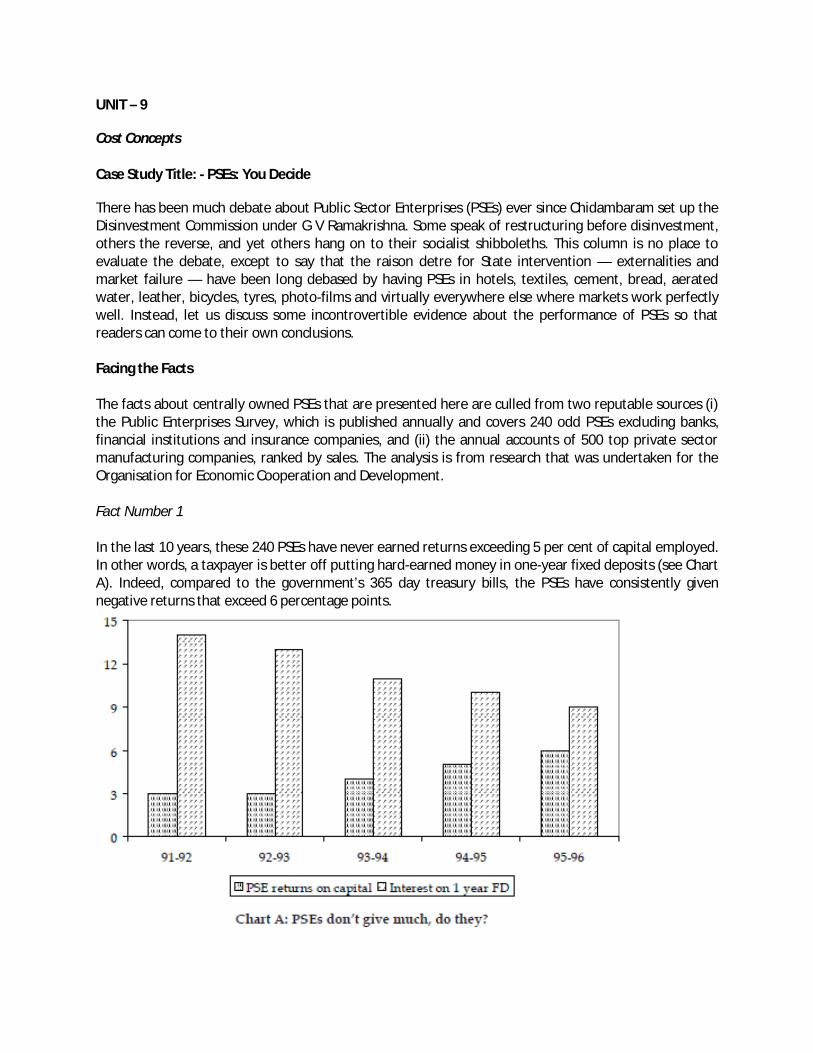
There has been much debate about Public Sector Enterprises (PSEs) ever since Chidambaram set up the Disinvestment Commission under G V Ramakrishna. Some speak of restructuring before disinvestment, others the reverse, and yet others hang on to their socialist shibboleths. This column is no place to evaluate the debate, except to say that the raison detre for State intervention — externalities and market failure — have been long debased by having PSEs in hotels, textiles, cement, bread, aerated water, leather, bicycles, tyres, photo-films and virtually everywhere else where markets work perfectly well. Instead, let us discuss some incontrovertible evidence about the performance of PSEs so that readers can come to their own conclusions. Facing the Facts The facts about centrally owned PSEs that are presented here are culled from two reputable sources (i) the Public Enterprises Survey, which is published annually and covers 240 odd PSEs excluding banks, financial institutions and insurance companies, and (ii) the annual accounts of 500 top private sector manufacturing companies, ranked by sales. The analysis is from research that was undertaken for the Organisation for Economic Cooperation and Development. Fact Number 1 In the last 10 years, these 240 PSEs have never earned returns exceeding 5 per cent of capital employed. In other words, a taxpayer is better off putting hard-earned money in one-year fixed deposits (see Chart A). Indeed, compared to the government’s 365 day treasury bills, the PSEs have consistently given negative returns that exceed 6 percentage points.

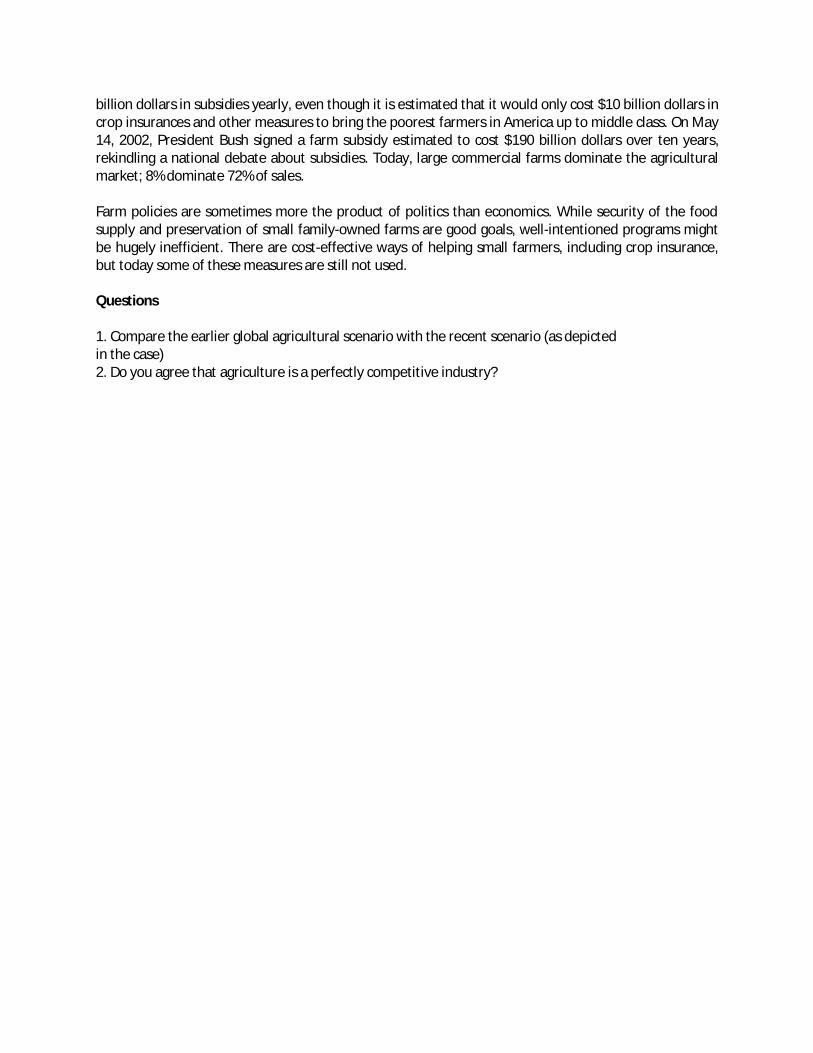
Fact Number 2 On the whole, these PSEs are far less profitable than comparable private sector companies. In the last fi ve years, the difference in net profits as a percentage of sales between PSEs as a whole and the private sector has been substantial, as Chart B shows. The divergence is even more dramatic if one nets out of the 14 PSEs which form the state-owned petroleum monopoly. Today, the difference in profitability between the private sector and non-petroleum PSEs is a staggering 6 percentage points. “So what?” comrades Surjeet and Yechuri would say. After all, PSEs were set up to augment the capital stock of the nation, promote balanced economic growth, foster employment and create centres of technical and managerial excellence. These involve social benefits, and only a benighted, Western-trained economist to the right Genghis Khan could use private profit calculus to evaluate the contribution of our PSEs. Fair enough. Let us not look at profitability, that base capitalist concept. Instead, let us look at costs, which even Enver Hoxha would have desired to minimise. Fact Number 3 PSEs as a whole are worse off even in terms of cost per rupee of sales. Chart C shows that PSEs suffer from an almost eight-point disadvantage in terms of fixed costs as a percentage of sales; the non-petroleum PSEs are worse off to the tune of almost 20 points.
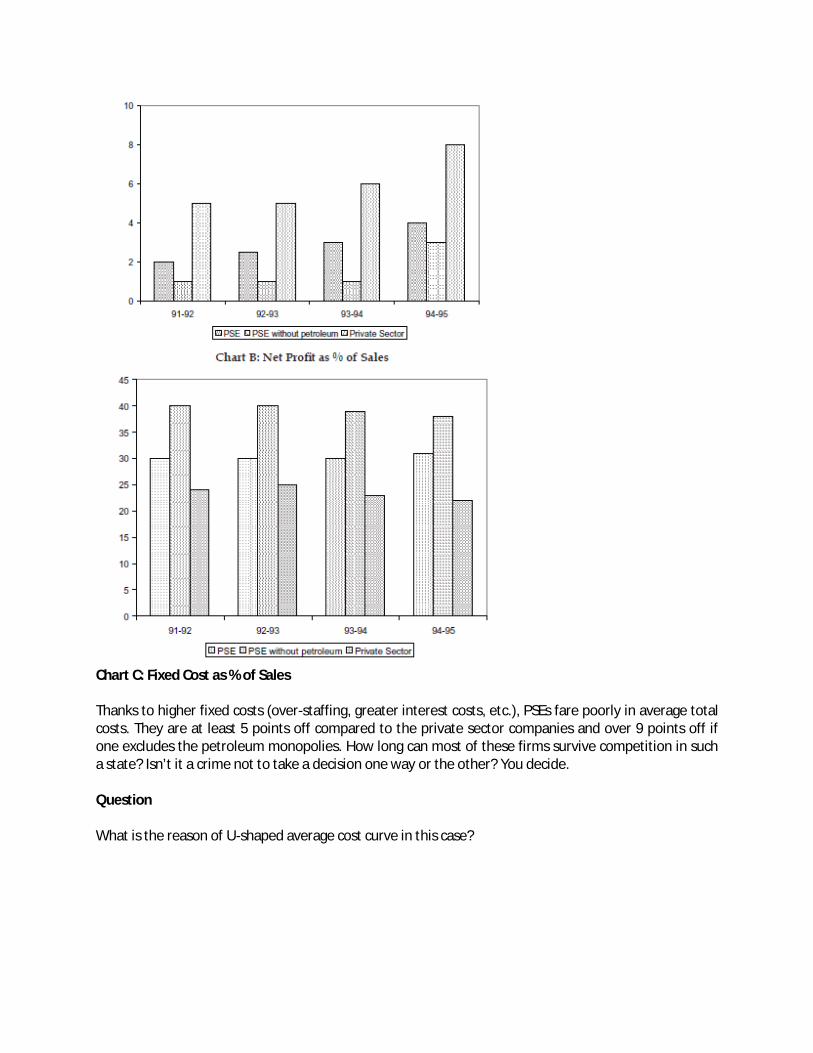
Chart C: Fixed Cost as % of Sales Thanks to higher fixed costs (over-staffing, greater interest costs, etc.), PSEs fare poorly in average total costs. They are at least 5 points off compared to the private sector companies and over 9 points off if one excludes the petroleum monopolies. How long can most of these firms survive competition in such a state? Isn’t it a crime not to take a decision one way or the other? You decide. Question What is the reason of U-shaped average cost curve in this case?

Caselet Title :- Input Costs and Profit Levels of Maruti Udyog Ltd (MUL)

UNIT – 10
Market Structure – Perfect Competition Case Study Title :- Economic Analysis of Agriculture Irony is the nature of the economics of agriculture; even as many in America still struggle with hunger, the government has been offering subsidies to the American farmer to artificially raise the price of produce, in some cases since 1933. History of Subsidies Because a typical farmer is so small compared to the entire market for the good he or she offers, they cannot affect the price of the good, or try to affect the price of good too efficaciously. Instead, they are referred to as ‘price takers’, who are forced to accept the market price. However, subsidies alter this economic situation to occasionally illogical results. At the end of World War I, farmers were rewarded by high prices as the government spent millions to rebuilt war-torn Europe. In fact, a small farmer who might have been almost forced to sell the farm before the war was in fact currently quite successful. However, in 1921, the nation fought through a recession as the farm goods they fervently produced outpaced demand, probably due to Europe’s quick agricultural recovery. American farmers now suffered, and continued to do so into 1922, where virtually every industry had recovered except for agriculture. Large lands that had been opened up to feed Europe’s millions pumped out more and more crops, but prices went lower and lower, and a surplus quickly accumulated that prevented prosperity. Rising Anger of Farmers Farmers could no longer meet the cost of production, and many were forced to leave their farms. Under neo-classical theory, this could be considered a frictional unemployment situation; as each farm increases production until it doesn’t take as many to cover the market, some of them should switch to other tasks. This ‘message of the market’ was a message of sadness for many farmers. During the Great Depression, farmers were especially hurt. For example, low dairy prices due to increased production meant that Midwestern dairy farmers were earning less than ever. Milk, as a highly spoilable good, is a good example of ‘perfect competition,’ when farmers can only earn the price the market tells them. Even dairy farm strikes were ineffective, like those as a part of the Farmer’s Holiday Association Strike of 1932 in Wisconsin and Iowa (some of these became violent as milk haulers and milkmen scuffed on the picket lines). Since the 1930s FDR worked to create a national program to guarantee income to farmers by enacting a significant number of measures to raise prices, beginning with the creation of the Agricultural Adjustment Administration in May 1933, which began the subsidy system that continues to this day, even though the AAA was declared unconstitutional in 1936. The AAA measures paid landowners to leave part of their land fallow. This did raise farmers’ incomes, but consumers were forced to endure high food prices during the worse years of the Depression. Subsidies to farmers have been a part of the American agricultural system ever since. Bill Clinton attempted to reduce payments and increase diversity of crops with the Freedom to Farm Act in 1994. In 2000, however, the Farm Security and Rural Investment Act restored the farming subsidies. While it is true that some farmers struggle, the government spent $30
billion dollars in subsidies yearly, even though it is estimated that it would only cost $10 billion dollars in crop insurances and other measures to bring the poorest farmers in America up to middle class. On May 14, 2002, President Bush signed a farm subsidy estimated to cost $190 billion dollars over ten years, rekindling a national debate about subsidies. Today, large commercial farms dominate the agricultural market; 8% dominate 72% of sales. Farm policies are sometimes more the product of politics than economics. While security of the food supply and preservation of small family-owned farms are good goals, well-intentioned programs might be hugely inefficient. There are cost-effective ways of helping small farmers, including crop insurance, but today some of these measures are still not used. Questions 1. Compare the earlier global agricultural scenario with the recent scenario (as depicted in the case) 2. Do you agree that agriculture is a perfectly competitive industry?

Caselet Title :- The Stock Market
The stock market is very close to a perfect competitive market. The price of a stock usually is determined by the market forces of demand and supply of the stock and individual buyers and sellers of the stock have little effect on price (they are pricetakers). Resources are mobile as stock is bought and sold frequently. Information about prices and quantities is readily available. Funds flow into stocks and resources flow into uses in which the rate of return. Thus stock prices provide the signal for efficient allocation of investment in the economy. However, imperfections occur here also though the stock market is very close to a perfect competition, for example, sale of huge amount of stocks by a large corporation will certainly affect (depress) the price of its stocks.

UNIT – 11
Monopoly Case Study Title :- Medical Monopoly Non-physician providers of medical care are in high demand in the United States. But licensure laws and federal regulations limit their scope of practice and restrict access to their services. The result has almost unavoidably been less choice and higher prices for consumers. Safety and consumer protection issues are often said to be the reasons for restricting non-physician services. But the restrictions appear not to be based on experimental findings. Studies have repeatedly shown that qualified non-physician providers – such as midwives, nurses, and chiropractors – can perform many health and medical services traditionally performed by physicians – with comparable health outcomes, lower costs, and high patient satisfaction. Licensure laws appear to be designed to limit the supply of health care providers and restrict competition to physicians from non-physician practitioners. The primary result is an increase in physician fees and income that drives up health care costs. At a time government is trying to cut health spending and improve access to health care, it is important to examine critically the extent to which government policies are responsible for rising health costs and the unavailability of health services. Eliminating the roadblocks to competition among health care providers could improve access to health services, lower health costs, and reduce government spending. Question Analyse the possible factors that have lead to this kind of situation.

Case Study Title :- In Curbing Anti-Dumping, Chinese Companies Sued For Monopoly in US. In a closely watched case that could test the reach of U.S. antitrust law, four Chinese companies face powerful evidence that they colluded to limit production and fix prices of vitamin C in the United States. The evidence is so convincing, in fact, that the defendants have not contested the allegations. But they still have a potentially solid legal defense: the Chinese Government made them do it. It’s a position that has been bolstered by the Chinese government itself, which made an official appearance in the case -- believed to be its first ever in a U.S. court -- to fi le briefs in support of the defendants. After more than six years of litigation, a Brooklyn federal judge is expected to decide soon whether the case can be decided without a trial. The legal theory underpinning the defendants’ argument is known as the foreign sovereign compulsion doctrine, which protects foreign companies that were compelled by their own government to break U.S. law. As Chinese companies increasingly become the target of antitrust lawsuits in the United States, the doctrine is expected to undergo more legal scrutiny. In addition to the vitamin C case, Chinese companies have raised the sovereign compulsion defense in two other price-fixing cases. The outcomes of those cases are not expected to have an immediate impact on U.S. trade relations with China, the largest supplier of goods imported into the United States. As China’s economic power continues to grow, however, the disputes could be a sign of more trade fights ahead. Shanker Singham, a partner at Squire, Sanders & Dempsey and the chairman of the International Roundtable on Trade and Competition Policy, said that a ruling for the defendants would undermine global competition. “It would be a declaration of war on the market system where business competition on the merits is the organizing economic principle,” Singham said. Pact Limits Export Volumes Until recently, Chinese companies have been known for low production costs that have benefited consumers worldwide, and only in the last five years have they been accused of coordinating production in an effort to raise prices. “The appearance of Chinese cartels that are hiding behind the state is a disturbing trend,” said John Connor, a professor at Purdue University specializing in antitrust law enforcement. Among the documents in the vitamin C case is a 2001 written production and price agreement among the four Chinese manufacturers, which together controlled around 60 percent of the world’s vitamin C market. The pact explicitly limited each company to a specific volume for export. According to the plaintiffs, after the agreement was made, spot prices for vitamin C shot to as high as $7 per kilogram in December 2002 from $2.50 per kilogram in December 2001. In an amicus brief filed in support of the defendants, China’s Ministry of Commerce argued that the vitamin C manufacturers were compelled by Chinese law to coordinate their production and pricing. It also argued that a ruling against the manufactures would “improperly penalize” them for “the sovereign acts of their government and would adversely affect implementations of China’s trade policy.”

The foreign sovereign compulsion defense has rarely been litigated and it has only been successful once, according to antitrust law experts. But the presence of the Chinese government in the vitamin C case could cause Judge Brian Cogan to look for a way to dismiss the case. “You can see why a judge would be reluctant to keep the case when it’s about foreign affairs and trade policy,” said Spencer Waller, director of the Institute for Consumer Antitrust Studies at Loyola University Chicago School of Law. No U.S. Action The Chinese government’s participation may explain why neither the U.S. Department of Justice nor the Federal Trade Commission has taken any action against the Chinese companies. According to enforcement guidelines that the government issued in 1995, the DOJ and FTC will not take action against a company if a foreign government makes a sufficiently detailed presentation that a specific law compelled the defendant’s actions. William Isaacson, a partner at Boies, Schiller & Flexner and the co-lead counsel for the plaintiffs, said that neither the Chinese government nor the defendants have been able to point to such a law. Isaacson and his law firm have a unique perspective on the vitamin C market. In the late 1990s, they investigated a vitamin C cartel among European and Japanese companies. Their probe led to U.S. prosecutions that resulted in more than $900 million in corporate fines and several guilty pleas. Isaacson said he is bewildered that the U.S. government has not contacted him for more information about his case against the Chinese companies. “I’ve never understood why they don’t want to find out what’s been happening.” The Department of Justice’s antitrust division and the FTC declined to comment. The plaintiffs, two U.S. buyers of vitamin C, alleged in one of their briefs that the defendants fixed prices without any help from the government. It was only after the defendants were accused of price fixing that they invoked their government’s involvement, according to the plaintiffs. For their part, the Chinese manufacturers say that China’s Ministry of Commerce directed an entity called the Chamber of Commerce of Medicines and Health Products Importers and Exporters to coordinate production. According to the brief submitted by the Ministry of Commerce, the action was taken in order to mitigate the exposure Chinese companies faced in potential antidumping investigations from other countries and to ensure China’s orderly transition to a market-driven economy. But that position could turn out to be problematic for China in a dispute with the United States at the World Trade Organization. In that proceeding, the United States has charged that China has played a role in limiting exports of certain raw materials, in violation of WTO rules. To bolster its case, the United States has pointed to China’s admission in the vitamin C case that in fact it is involved in setting production limits. The case is Animal Science Products and The Ranis Company v. Hebei Welcome Pharmaceutical Co. Ltd. et al, U.S. District Court for the Eastern District of New York, No. 05-00453. Question Do you think what China is doing is right?

Caselet Title :- De Beers : An Unregulated Monopoly
According to the New York Times (1986), the Central Selling Organisation, controlled by De Beers Consolidated Mines Ltd, is “probably the world’s most successful monopoly.” De Beers, founded in 1880 by Cecil Rhodes in South Africa, controlled over 99 per cent of world’s diamond production until about 1900. At present, the firm mines only about 15 per cent of the world’s diamonds, but it still controls the sales of over 80 per cent of the gem quality diamonds through its Central Selling Organisation which markets the output of other major producing countries like Zaire, the Soviet Union, Botswana, Namibia and Australia, as well as its own production. In the first half of 1989, its sales were over $2 billions. No one doubts that De Beers controls the price of diamonds. Buyers are offered small boxes of assorted diamonds at a price set by De Beers on “take it all or leave it” basis. Those that choose not to buy may have to wait some time before getting another opportunity. If the demand for diamond fails, as it did in early 1980s (when inflation slowed and diamonds as an investment lost much of their sparkle), De Beers stands ready to buy diamonds to support the price. Between 1979 and 1984, its stockpile of diamonds increased from about $360 million to about $2 billion. In the first half of 1992, its earnings fell by about 25 per cent because global recession had reduced the demand for diamonds. Besides limiting the quantity supplied, De Beers also works hard and cleverly to push the demand curve for diamonds to the right. An important part of its sales campaign has been to link diamonds and romance (according to its 50-year old slogan, “A Diamond is Forever”), of course, this has also been helpful in keeping diamonds once sold, off the market. A good that is drenched with lasting sentiment is less likely to be sold when times get tough. De Beers’s policies have paid off very substantial profits, but the consumer has paid higher prices than if the diamond market were competitive.

UNIT – 12
Monopolistic Competition Case Study Title :- The Motor Vehicle Repair and Servicing Industry The typical British small garage is stereotyped as untidy, messy, cluttered with hoists and equipment, with a few overall-clad figures working to the clatter of tools and blaring radio. This picture is quite different from that of the early years of the automobile. In those days, work on the car was the domain of the chauffeur or blacksmith, or the manufacturer if repairs were beyond both. This was to change following the Second World War. As the volume of cars grew so the motor repair sector began to expand, giving employment to the many mechanically trained ex-servicemen. The market grew so quickly that there was little chance of erecting entry barriers. For example, although there were moves to introduce specific (City and Guilds) qualifications for mechanics and thereby impose a degree of restricted entry on the industry, this was never fully established. The result is to be seen today. The motor vehicle repair industry has developed into a good example of a monopolistically competitive industry. In 2001, it was estimated that the MVR industry in the UK employed just over 170,000 people in about 44,000 businesses. The statistics also show that the industry is still dominated by small and medium-sized businesses (SMEs) with over half the workforce (~58%) employed in either zero-employee enterprises e.g. sole traders or partnerships, or businesses employing less than 10 people. Companies with less than 50 people accounted for approx. 83% of the workforce. The vehicle repair and servicing industry is diverse, being made up of general repairers, specialist repairers (i.e. bodywork, electrics), dealers and petrol stations. With so many garages, the industry has remained a highly competitive one. However, specialism and locality enable the various garages to maintain a fairly constant degree of control over their price. Questions 1. With reference to economic theory, explain why the motor vehicle repair industry might be regarded as “good example of a monopolistically competitive industry.” 2. The motor vehicle industry has been monopolistically competitive for many years. What are the specific features of the motor vehicle repair industry that have restricted the growth of large-scale operations, which might have led to a less competitive market structure.

Case Study Title :- Maruti facing Tough Competition The key issue for Maruti today is to sell at least the number of cars it sold last year (1998-99). Insiders in the company admit that it can’t. The reason: Hyundai, Daewoo and Telco all plan to hawk 60,000 cars by end of next April. And all of them are targeting the Zen or the Maruti 800, the two monopolists, and not the crowded luxury segment. And with the market expected to stagnate, by simple logic the newcomers will be grabbing a share only from Maruti. The threat from the new car makers is not an empty one. For instance, Hyundai plans to follow the policy of “enrichment” of the Zen. It intends to price its air conditioned model slightly lower than the Zen VX and top it by pricing the higher end model with power steering and windows just ` 10,000-15,000 more than the Zen VX. Similarly, Daewoo plans to woo buyers of the Maruti 800 air conditioned and the Zen by pricing its car under ` 3 lakhs. And Telco is all set to take on the 800 by offering a model at a slightly higher price. The scenario might worsen in 1999-2000 when Maruti would have added to capacity. By next year the three other car rivals will have the capacity to put 3.6 lakh cars a year on the road. Of course, they might not reach full capacity but even at a conservative estimate they would be selling over 1 lakh cars in 1999-2000. Assuming the market grows by 10 per cent, as some optimists predict, there will be more capacity chasing the 40,000 extra car consumers. Competition has already begun to put pressure on the company’s financials. For example, when Maruti launched the upgraded version of the Zen recently, it decided not to increase the cost of the car even though it had been hit both by the customs and excise duty hikes and the extra cost of the upgradation. That is a sharp reversal of its earlier practice of increasing Maruti 800 prices after it launched an upgrade. In fact, Maruti is not passing on the customs and excise increases for any model on to its customers. The cost increase on the Zen alone is ` 28,000 per car. As a result, Maruti has had to absorb ` 120 crores on this account plus ` 80 crores for upgradation. Worse, with the depreciation of the rupee, imported components will cost more leading to an extra outflow of over ` 40 crores. So the total extra tab that will immediately affect the bottom line will be ` 240 crores. On the other hand, cost savings for 1998-99 will account for over ` 100 crores – which means that more than a fifth of Maruti’s net profits last year will be wiped out. This year Maruti will save around ` 30 crores more – from ` 50 crores to ` 80 crores through improvements in techniques and another ` 50-60 crores through further indigenisation. And while negotiations are on with vendors to cut costs, insiders say this would probably be neutralised by Suzuki deciding to hike the price of components it supplies to its joint venture. Why India’s Largest Car Maker will be under threat from this fiscal.
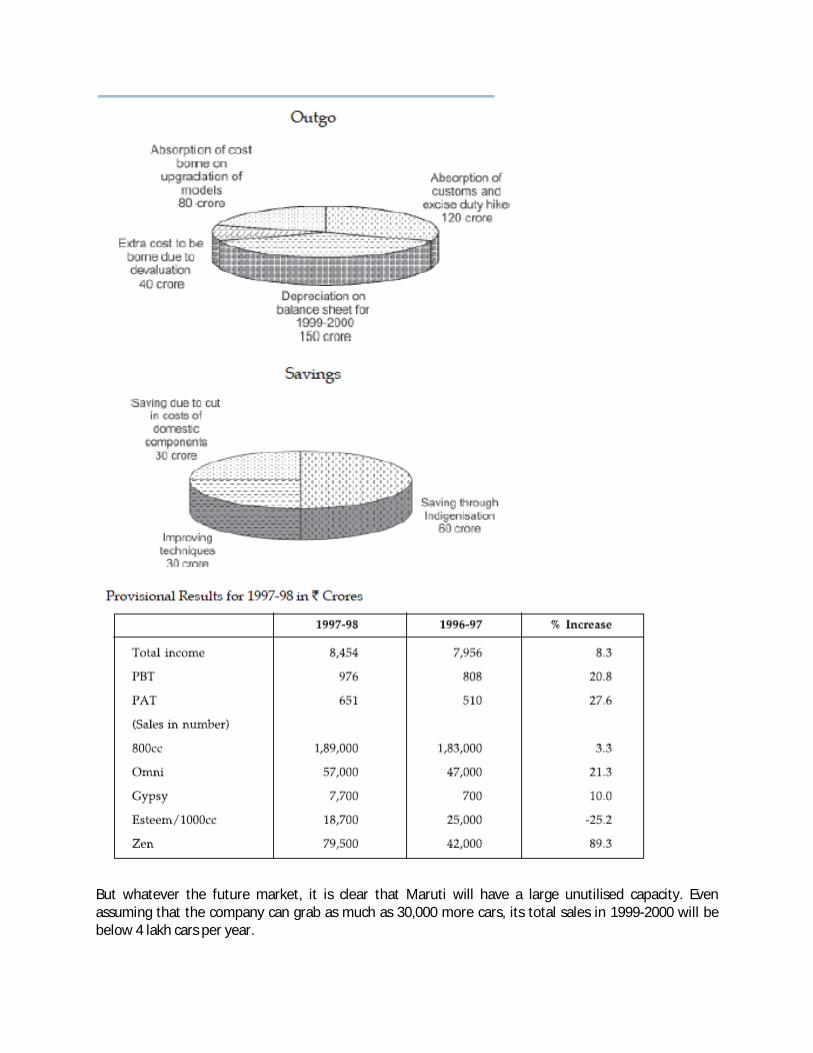
But whatever the future market, it is clear that Maruti will have a large unutilised capacity. Even assuming that the company can grab as much as 30,000 more cars, its total sales in 1999-2000 will be below 4 lakh cars per year.
But while the company builds up idle capacity with no new models it has to consider the depreciation costs of the new plant. This will dent the bottom line even more. According to Maruti, depreciation cost will go up ` 150 crores in 1999-2000. The options for Maruti are limited: it has to get its new cars on the roads as early as possible. One option that the board will consider is to import completely knocked down (CKD) kits of the new cars which will be available in Japan from October. But the cost of the CKDs will be prohibitive and Maruti will have to subsidise them, which would hit margins and profits. The alternative is for the Maruti board to convince the Japanese parent to subsidise the CKDs for a year before the model is indigenised. Either way, Maruti’s future is troubled (Business Standard, August 98). Question Discuss Maruti’s situation in the light of monopolistic competition.
Caselet Title :- Market Entry and the Vanilla Syndrome
In most categories of consumer products, there is one dominant segment; glucose in biscuits, cola in soft drinks, vanilla in ice creams. These are good categories, but the same thing can be extended to other product categories. Now the tendency is that when a new player wants to enter an established product category, he automatically looks at the dominant segment first. The MD and CEO, Ashok Jain, Cadbury Schweppes Beverages India Private Limited, calls it a “Vanilla trap”. He explains this as follows: “A trap because you, as the new entrant, can never come close to challenging the dominance of the biggest player in that vanilla segment. So what you get into is a syndrome: “Can I get two-to-three per cent market share in that segment?” The segment spells sheer volume, so this share would be larger than 15 per cent of some other segment in the category. That’s where the trap is. The segment’s Goliath is so big, you’ll get routed, like it or not. So what do you do instead? I suggest the “blackcurrant route”. A route where you take something else and make yourself dominant there, while getting a foot into the dominant segment as well (you can’t afford not to). And what’ll happen? While people will come for your blackcurrant, they will buy your vanilla. Your volumes will still come from your vanilla. But for top-of-mind consumer, the trademark blackcurrant is what will identify you. This is theory. It’s happened. I’ll give you three examples. When Cadbury India decided to extend to biscuits, it started off by challenging Parle in glucose, a segment where Parle’s strength is unmatched. Cadbury didn’t succeed. By the time it launched chocolate biscuits, it was too late. There was a lesson here, which was extended to ice creams, the next category Cadbury entered. The brand, Dollops, harped on its blackcurrant ice cream, didn’t talk vanilla at all, but the volumes came from vanilla anyway. Then take Britannia. For years, it tried to break Parle’s dominance in glucose biscuits, with little success. It then went in for a number of branded products that gave it an aura and gained it respect and attention. Little Hearts was so different, it gave Britannia distinction.And then, the company launched Tiger, a glucose biscuit. Tiger is now a very large brand in the glucose segment. You’ve got to have something that’s very specially your own. Otherwise, the consumer won’t pay you much attention and the trade won’t want to stock your products – why should it? The retailer looks Cadbury Schweppes’ way because of Crush and Canada Dry. Our largest volumes come from Sport Cola. The brand sells much more than Crush. Proves my point, doesn’t it? I say again: you can’t fight the dominant guy in the dominant segment. Get into his segment’s volumes indirectly, instead.”
UNIT – 13
Oligopoly Case Study Title: - Rumblings in the New York Skies The combination of United and Continental Airlines would upend the balance of power at New York’s airports. Continental was already the dominant player at Newark Liberty International Airport. But in merging with United, it gains a much bigger network of domestic routes and connections to the rest of the world that would leave its rivals in New York — Delta Air Lines and American Airlines — struggling to catch up. While the city would be just one of the 10 hubs of the new airline, the battle for control in New York offers a window into why United and Continental found a merger so attractive. All the major airlines have been looking for ways to regain the upper hand as air travel begins to rebound. And New York City was already a major focus of their attention. Its airports — Kennedy International, La Guardia and Newark — play a critical role in both domestic and international travel. Combined, they account for four of the top five domestic routes and constitute the biggest hub in the country for international flights. “It’s the most contested market there is,” said Gail Grimmett, the senior vice president at Delta Air Lines in charge of New York. “That’s because it’s the largest revenue pool.” A big piece of the battle is for business travelers, who account for the bulk of the industry’s profits. To woo them, airlines are introducing sommelier-chosen wines and fancy lie-fl at beds to their business cabins on international flights from New York. They are sprucing up shabby terminals and expanding their domestic networks from all three of the area’s airports. If the United-Continental merger succeeds, the new airline will have about a 55 percent share of domestic travelers and a 65 percent share of international travelers at Newark, where Continental has been building its lead for 10 years. Delta, meanwhile, which bought Northwest Airlines two years ago to become the nation’s top airline, has used its new muscle to expand its presence in both La Guardia and Kennedy. American, once the biggest airline in New York, has been losing ground. Until now, United has not been one of the city’s big players. All the competition for the New York market has kept air fares relatively low so far. But analysts cautioned that if an airline becomes too dominant at any one airport, there would be less pressure to keep the lid on prices. Such concerns could raise antitrust issues for United and Continental’s planned merger. The one major airline left out of all the jockeying in New York has been Southwest, which has struggled to establish a presence at La Guardia. The airline’s executives have expressed frustration at their
inability to expand in New York. “If you want to capture the business travelers you need to be in New York City,” said Whitney Eichinger, a spokeswoman for Southwest. The New York airports are the largest American gateway to Europe, accounting for a third of all passengers flying across the Atlantic. Those routes, in turn, capture 26 percent of all spending on business and first-class tickets, according to the International Air Transport Association. As part of the struggle for a piece of the trans-Atlantic market, the biggest American airlines have been lining up European partners through three major alliances — Sky Team, Star, and Oneworld. The alliances allow the airlines to coordinate prices, jointly schedule international flights and, sometimes, share revenue. They also help the airlines on both sides of the Atlantic attract more passengers to their own domestic networks. One of the most visible parts of the battle for New York is taking place in the front of the airplane. Delta, for example, is planning to spend $1.2 billion on improving its business and first-class cabins in the next three years and has started by introducing fl at-bed seats on flights from New York to London. Then there’s the battle for market share, particularly at La Guardia, the 70-year-old airport that last year ranked last in on-time arrivals but is favored by business travelers because it is the closest to Midtown Manhattan. Delta said last summer that it planned to trade 42 daily takeoff and landing rights, called slots, at Reagan National Airport in Washington for US Airways’ 125 pairs of slots at La Guardia. But the Transportation Department requested that the airlines divest 34 pairs to preserve competition. In response, Delta and US Airways offered to give up 20 pairs, which would still double Delta’s market share to about 40 percent at La Guardia. The department said that counter offer was still “insufficient,” but repeated it would approve the deal if the companies abided by its original ruling. The airlines said on May 4 2010 they would appeal the decision. American, which has been operating in New York for 80 years, is clearly threatened by its loss of market share. It responded to Delta’s move by saying it would collaborate with JetBlue on some routes and also add 31 new flights from Kennedy and La Guardia, including new routes to Minneapolis-St. Paul, Atlanta and Charlotte, N.C., on regional jets outfitted with new first-class seats. In a letter to employees after these announcements, Gerard J. Arpey, the chairman and chief executive of AMR, American’s parent company, said, “We are in a tough, important fight in New York — a fight we intend to win.” But while Delta has big plans to grow in New York, one sore point is its drab and cramped Terminal 3 at Kennedy, built in 1965 for Pan Am. It is now straining to accommodate Delta’s five million international passengers a year. The executive director of the Port Authority of New York and New Jersey, the agency that runs the city’s airport, has been critical of the terminal, describing it as unfit as a point of entry for overseas arrivals.

JetBlue, by contrast, opened a sleek, airy $743 million terminal at Kennedy last fall. And American has a new and modern terminal at Kennedy, too. Completed in 2007, it cost $1.3 billion. Delta executives concede they have a problem at Kennedy, and said they are working on a solution. “If you ask me what keeps me awake at night, this is it,” Ms. Grimmett said. “It’s an unpleasant experience, sometimes.” The third front in the battle for New York’s travelers is invisible to most passengers but potentially the most critical for airlines. In October, 2009, Continental defected from the Sky Team alliance, dominated by Delta and Air France, to join Star, the alliance established by United and Lufthansa. The switch provided Star with a badly needed New York hub. American, which is part of Oneworld with British Airways, is expecting to gain antitrust immunity for its Atlantic routes later this year and hopes to be in a better position to compete with the other two rivals. William S. Swelbar, a research engineer at the International Center for Air Transportation at the Massachusetts Institute of Technology, said New York was a major laboratory for the alliances. “New York is vital for each of the three alliances,” he said. “It’s a global game, and it is playing right in front of us.” Question Explain the oligopolistic market situation in the US aviation industry? How does the merger help in our better understanding of the market conditions?
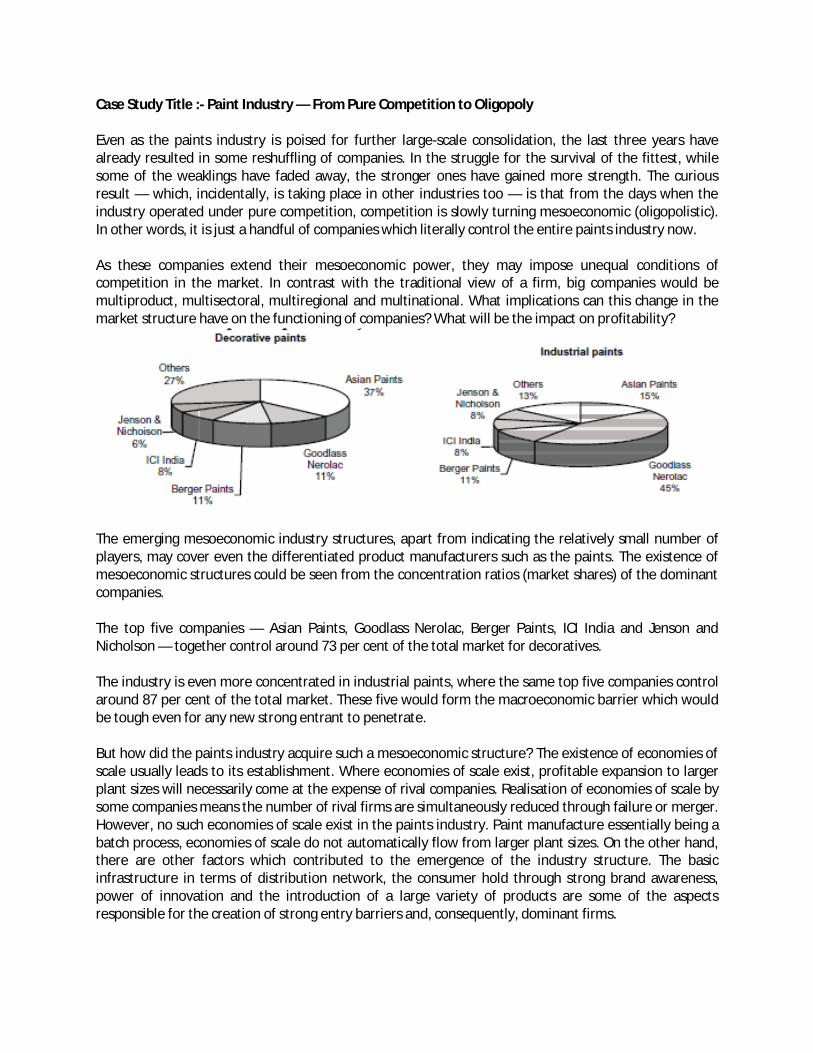
Case Study Title :- Paint Industry — From Pure Competition to Oligopoly Even as the paints industry is poised for further large-scale consolidation, the last three years have already resulted in some reshuffling of companies. In the struggle for the survival of the fittest, while some of the weaklings have faded away, the stronger ones have gained more strength. The curious result — which, incidentally, is taking place in other industries too — is that from the days when the industry operated under pure competition, competition is slowly turning mesoeconomic (oligopolistic). In other words, it is just a handful of companies which literally control the entire paints industry now. As these companies extend their mesoeconomic power, they may impose unequal conditions of competition in the market. In contrast with the traditional view of a firm, big companies would be multiproduct, multisectoral, multiregional and multinational. What implications can this change in the market structure have on the functioning of companies? What will be the impact on profitability?
The emerging mesoeconomic industry structures, apart from indicating the relatively small number of players, may cover even the differentiated product manufacturers such as the paints. The existence of mesoeconomic structures could be seen from the concentration ratios (market shares) of the dominant companies. The top five companies — Asian Paints, Goodlass Nerolac, Berger Paints, ICI India and Jenson and Nicholson — together control around 73 per cent of the total market for decoratives. The industry is even more concentrated in industrial paints, where the same top five companies control around 87 per cent of the total market. These five would form the macroeconomic barrier which would be tough even for any new strong entrant to penetrate. But how did the paints industry acquire such a mesoeconomic structure? The existence of economies of scale usually leads to its establishment. Where economies of scale exist, profitable expansion to larger plant sizes will necessarily come at the expense of rival companies. Realisation of economies of scale by some companies means the number of rival firms are simultaneously reduced through failure or merger. However, no such economies of scale exist in the paints industry. Paint manufacture essentially being a batch process, economies of scale do not automatically flow from larger plant sizes. On the other hand, there are other factors which contributed to the emergence of the industry structure. The basic infrastructure in terms of distribution network, the consumer hold through strong brand awareness, power of innovation and the introduction of a large variety of products are some of the aspects responsible for the creation of strong entry barriers and, consequently, dominant firms.
Regardless of how such structures have started emerging, one important phenomenon which may develop in the future is the mutual interdependence of companies. What it means in reality is that no company in the mesoeconomic industry may dare to alter its price policies without attempting to calculate the most likely reaction of its rivals. It is like playing a chess or a poker game. There is no way to know beforehand the best way to play your cards in a poker or a chess game because it depends on the way the other players play theirs. Players should pattern their actions according to the expected reactions of their rivals. What emerges out of the difficulty in assessing rival reaction is the rigidity in prices. Prices are expected to change less frequently in mesoeconomic structures than under pure or monopolistic competition. On the other extreme, a price change by one producer may spark off a price war as other producers come out with more drastic price changes. As an intermediate position, producers may collide with each other to bring about organized price changes. However, non-collusive mesoeconomies may seek to lead a quiet life and may adopt a live-and-let live policy. At the same time, collusive behavior, though difficult, cannot be ruled out. To reduce the uncertainties of price wars, producers may collide with each other and charge the maximum profit making price. For society, it would be more like a monopolist kind of market under the garb of competition. Yet another way to deal with uncertainties with respect to rival reactions would be collusion. Adopting a “follow the leader” policy may result in tacit collusion. This has often been witnessed in the paints industry — when one company comes out with a price change, it is followed by the other players. What all this indicates is that mesoeconomic companies shun price competition. But often such collusive behaviour is accompanied by non-price competition. This phenomenon has also been witnessed in the paints industry. The emphasis on non-price competition has its roots in two facts. One, price cuts can be quickly and easily met by a firm’s rivals who may promptly react to cancel out any potential gains in sales through matching price cuts. There is also the risk of price war. On the other hand, non-price competition is harmless and can be safely carried out without any side effects through product innovation, improvement in productive techniques and advertising gimmicks which may be difficult to replicate. This is exactly what the paints industry has been following for the last three years with the introduction of consumer-interactive marketing methods for advertising paints – ‘Insta Colour’ by Jenson & Nicholson, “Colour Solutions” by ICI India, “Colour Bank’ by Berger Paints and “Colour World’ by Asian Paints. ICI India’s generous offer to paint the Ananthpur Sahib could also be fitted into the category of non-price competition. And, second, mesoeconomic firms generally have the financial strength to support such advertising. But are such mesoeconomic structures economically efficient? Traditional view holds that being characterised by barriers to entry, mesoeconomic entitles can be expected to result in a restriction of output short of the point of lowest unit costs and a corresponding market price which yields substantial, if not maximum, economic profits. But Kenneth Galbraith, in his book American Capitalism, challenged this view by arguing that mesoeconomic firms, because of their inherent strengths, are necessary to ensure rapid technological growth. They have the necessary financial muscle to undertake innovations and research.
Empirical research on this aspect has been ambiguous. Though consensus opinion has it that big mesoeconomic industries are not big contributors to technological progress, there are quite a few exceptions. The paints industry has been one. The industry, recognising the need to differentiate itself from others, has been frequently introducing technologically innovative products. The introduction of interactive paints solutions, anti-bacterial exterior paints and washable plastic emulsion paints are just some of the innovations. It is of interest that some leading researchers in this field have tentatively concluded that technological progress in an industry may be determined more by the industry’s scientific character and “technological opportunities” rather than by its market structures. Question Identifying the factors contributing to the paint industry for becoming oligopoly.

Caselet Title :- Cartel on the Wings
While the Competition Commission of India is yet to progress on one alleged case of airline cartelisation — code sharing deal — by Kingfisher and Jet Airlines, our national carrier, Air India, barely escaped being prosecuted by the Korean Fair Trade Commission in a recent case of cartelisation in cargo freight. In May, 2010 the KFTC levied a record fine of more than $98 millions on 19 airlines in the biggest cartel case that it has handled. Fuel Surcharge Rates It was found that the airlines had conspired to raise fuel surcharge rates for air cargo to-and-from Korea between 1999 and 2007 in a concerted manner. The case included summoning 54 airline executives from all over the world for investigation and conducting a joint investigation with foreign competition authorities for the first time. The regulator found that the conspiracies took place on outbound shipments from Korea and inbound shipments to Korea from Hong Kong, Europe and Japan. The case showed that the airlines overcharged by $5.71 billions in the local market by imposing or increasing fuel surcharges during the eight-year period. The uncovering of airline cartels on fuel surcharge actually began in 2006, when European and US authorities investigated few airlines including British Airways. The investigation came at a time when the airlines were facing high fuel costs and competition from low-cost carriers. The situation deteriorated further in 2007, as more airlines were inspected and charged for various anti-competitive practices. European Commission charged several airlines for fixing freight service prices. British Airways had to pay billions of dollars in fines as the UK and the US competition authorities denounced it for price fixing during the period 2006-07. Diff cult to Detect Cartelisation is very difficult to detect and investigate for its inherently secretive nature. The task is more difficult in aviation industry because it operates across borders. As a consequence of liberalisation, many large airlines such as British Airways and Lufthansa are now privately owned. These are being increasingly scrutinised as they engage themselves in collusive agreements. In all the reported cartel cases, there was always one partner who spilled the beans with the hope of getting away with lesser penalty or what is called as leniency. In the case of British Airways, which was prosecuted in 2007, it was Virgin Airlines which cooperated with the authorities. Even in the Korean case, it was the Korean Airlines which applied for leniency by becoming the prosecuting agency’s ‘friend’. Such a provision for leniency now exists in all competition laws, including the one in India. In fact, leniency can be sought by more than one perpetrator as the enquiry moves on thus buttressing the prosecution’s case. The Australian Competition & Consumer Commission has to date named 15 airlines in its investigation and has already collected $38 million as fi nes while some of the cases are yet to be decided.

The damage that airline cargo cartels cause by raising the surcharge rates is huge as evident from the figures published by competition agencies. Consequently, the prices of goods transported also get overburdened from artificial hikes thus affecting consumer welfare adversely.
UNIT – 14
Pricing Decisions Case Study Title: - Real World: Changes Required in the Simple Cost-plus Pricing Method Many manufacturers base their prices on direct costs, adding an arbitrary percentage to cover overheads. In theory, such an approach will produce profits, but it can also price a product out of the market or lead to an overproduction of less profitable items at the expense of more profitable ones. The reason for this apparent contradiction is that traditional pricing methods often fail to consider the following essential factors: 1. The price of competing products; 2. The need for the maximum loading of production facilities throughout the year or an optimum utilisation of the plant and equipment at any given point of time; 3. The “restraining factors”. The shortcomings of the traditional pricing system can be illustrated best by an actual example. Let us assume that a manufacturer has, in his collection, two fabric designs made from the same yarn and that supplies of this raw material during a particular season are limited. Now, the customers show keen interest in both fabrics, and the marketer knows that he will not have enough yarn to meet all the orders. He will need to decide the product mix that will allow maximum profi t from a limited supply of yarn. If he uses traditional pricing systems, his decision will be based on the following (hypothetical) calculations:

Indeed, a more important advantage of this route is that it allows the marketer to make any price adjustment dictated by the market whilst knowing precisely what effect it will have on his profits! Let us assume a competitor offers a product similar to the fabric B used in the example, at a price of R 75. According to the traditional costing method, design A apparently becomes even more profitable to produce. But, again, the “restraining factor” – let us say, limited yarn supply in this case – combined with the contribution approach, reveals a different situation although the price of Design B is reduced by, say, R 2.40 per metre.
Profit Planning

To effectively apply the method of contribution, it is necessary to first determine which costs are variable and which costs are fixed. A further example illustrates how a garment marketer can make use of this technique (widely adopted in the far-East) to change the complexion of his bottom line. Style X produces an additional profit of R 24 per garment. But the capacity of the factory is limited by the number of workers and the number of workstations installed. On that basis, and because the labour content of style X is twice that of style Y, the relative revenue of the two styles is:
The obvious application of this new knowledge would be for the marketer to promote the sales of product Y in order to achieve greater volume and maximum utilisation of his capacity. He could well afford, for example, to reduce the sale price of product Y, should market forces so dictate, and still enjoy an extra contribution. Main Applications Although the examples provided here apply to the textile sector, they could just as easily be applied to any other industry. Only the “restraining factors” change according to the company’s activity and circumstances. In a machine shop, for example, the “restraining factors” could be the limitation of a category of CNC units; in a garment factory, the number of special machines needed for a given style, the area of cutting tables available, or just the amount the direct labour, i.e., man-hours needed to make one garment or another.
In each case, the concept of contribution, allied to that of the “restraining factor”, produces a costing analysis that reflects profit opportunities far more accurately than the traditional “cost plus” methods of pricing, enabling a marketer to polish his business plan. This flexibility can be extremely valuable when market conditions are difficult and a constant pressure on prices is being experienced. It is better to cut prices and maintain one’s market share than to cut output. A problem of receivables is better than a stockpile. Question Evaluate the effectiveness of cost based pricing methods.

Case Study Title :- Value Based Pricing: “We are not the cheapest but….” In this highly competitive online marketplace, it can be difficult to persuade customers to buy from you when you offer a similar product to your opposition but with a higher price tag. And trying to beat competitors on price alone is a cut-throat business, very risky and not recommended. It attracts bargain hunters ready to defect to competitors for a better deal. Using a value-pricing strategy is a better proposition because it attracts loyal customers. Why do customers buy designer-labeled clothes and luxury cars? Why are those items more expensive when they don’t cost so much more to make? The answer lies in the perceived value. Value is not an inherent attribute of the product but it commands a higher price. Customers do not buy features and benefits, they buy VALUE. Value is subjective. Value is a benefit but a benefit is not necessarily of value to all customers. For example, a vendor offers free installation and free updates for his software. Customer-A considers ‘free installation’ as ‘value’ because he has no technical knowledge and this will save him time and effort. Customer-B rates the free installation as ‘nice to have’ but the drawcard or ‘value’ is the free updates that will save him money in the long run. Customers do not assign value to the same benefits.
Related Documents