Coupling of remote sensing, field campaign, and mechanistic and empirical modeling to monitor spatiotemporal carbon dynamics of a Mediterranean watershed in a changing regional climate S. Berberoglu & C. Donmez & F. Evrendilek Received: 30 October 2014 /Accepted: 4 March 2015 # Springer International Publishing Switzerland 2015 Abstract The aim of this study was to simulate impacts of regional climate change in the 2070s on carbon (C) cycle of a Mediterranean watershed combining field measurements, Envisat MERIS and IKONOS data, and the Carnegie Ames Stanford Approach model. Sim- ulation results indicated that the present total C sink status (1.36 Mt C year -1 ) of Mediterranean ever- green needleleaf forest, grassland and cropland ecosystems is expected to weaken by 7.6 % in response to the climate change in the 2070s (Mt=10 12 g). This decreasing trend was mirrored in soil respiration (R H ), aboveground and below- ground net primary production (NPP), NEP, and net biome production (NBP). The decrease in NEP in the 2070s was the highest (21.9 %) for mixed forest where the smallest present C sink of 0.03 Mt C year -1 was estimated. The average present net ecosystem production (NEP) values were estimated at 110±15, 75±19, and 41±25 g Cm -2 years -1 in forest, grassland, and cropland, respectively, with a watershed-scale mean of 95± 30gCm -2 years -1 . The largest present C sink was in grassland, with a total C pool of 0.55 Mt C year -1 , through its greater spatial extent. Keywords Carbon sink . Global climate change . Mediterranean ecosystems . Process-based modeling . Spatiotemporal dynamics Introduction Human-induced alteration of local carbon (C) cycle across the world has cumulatively led to global climate change which in turn triggers a domino effect on eco- system structure and function (Wali et al. 1999; Evrendilek 2014). Arid and semi-arid lands including Mediterranean ecosystems cover 30 to 45 % of the global terrestrial surface (Asner et al. 2003) and can be particularly considered to be the hot spots of the world associated with climate change due to their increasing potential for desertification and C sequestration. Inter- connectedness and interdependencies of biogeochemi- cal cycles and ecosystem compartments require that preventive and mitigative measures be taken towards sustainability of ecosystem services such as food/feed production, and climatic/hydrological regulation at the local and regional scales (Lobell et al. 2002; Jian-Bing et al. 2006; Pandey et al. 2011). One of the main foci in the related literature has been not only on the quantifi- cation of feedbacks between C cycling and climate change for a better understanding but also on the integration of spatially and temporally explicit process-based models, data-driven models, remote sensing, and geographical information systems (GIS) for continuous monitoring. Environ Monit Assess (2015) 187:179 DOI 10.1007/s10661-015-4413-x S. Berberoglu : C. Donmez Division of Remote Sensing and GIS, Department of Landscape Architecture, Cukurova University, Adana, Turkey F. Evrendilek (*) Department of Environmental Engineering, Abant Izzet Baysal University, Bolu, Turkey e-mail: [email protected]

Welcome message from author
This document is posted to help you gain knowledge. Please leave a comment to let me know what you think about it! Share it to your friends and learn new things together.
Transcript
Coupling of remote sensing, field campaign, and mechanisticand empirical modeling to monitor spatiotemporal carbondynamics of a Mediterranean watershed in a changingregional climate
S. Berberoglu & C. Donmez & F. Evrendilek
Received: 30 October 2014 /Accepted: 4 March 2015# Springer International Publishing Switzerland 2015
Abstract The aim of this study was to simulate impactsof regional climate change in the 2070s on carbon (C)cycle of a Mediterranean watershed combining fieldmeasurements, Envisat MERIS and IKONOS data,and the Carnegie Ames Stanford Approach model. Sim-ulation results indicated that the present total C sinkstatus (1.36 Mt C year−1) of Mediterranean ever-green needleleaf forest, grassland and croplandecosystems is expected to weaken by 7.6 % inresponse to the climate change in the 2070s(Mt=1012 g). This decreasing trend was mirroredin soil respiration (RH), aboveground and below-ground net primary production (NPP), NEP, andnet biome production (NBP). The decrease in NEPin the 2070s was the highest (21.9 %) for mixedforest where the smallest present C sink of0.03 Mt C year−1 was estimated. The averagepresent net ecosystem production (NEP) valueswere estimated at 110±15, 75±19, and 41±25 gC m−2 years−1 in forest, grassland, and cropland,respectively, with a watershed-scale mean of 95±30 g C m−2 years−1. The largest present C sinkwas in grassland, with a total C pool of 0.55 Mt Cyear−1, through its greater spatial extent.
Keywords Carbon sink . Global climate change .
Mediterranean ecosystems . Process-basedmodeling .
Spatiotemporal dynamics
Introduction
Human-induced alteration of local carbon (C) cycleacross the world has cumulatively led to global climatechange which in turn triggers a domino effect on eco-system structure and function (Wali et al. 1999;Evrendilek 2014). Arid and semi-arid lands includingMediterranean ecosystems cover 30 to 45 % of theglobal terrestrial surface (Asner et al. 2003) and can beparticularly considered to be the hot spots of the worldassociated with climate change due to their increasingpotential for desertification and C sequestration. Inter-connectedness and interdependencies of biogeochemi-cal cycles and ecosystem compartments require thatpreventive and mitigative measures be taken towardssustainability of ecosystem services such as food/feedproduction, and climatic/hydrological regulation at thelocal and regional scales (Lobell et al. 2002; Jian-Binget al. 2006; Pandey et al. 2011). One of the main foci inthe related literature has been not only on the quantifi-cation of feedbacks between C cycling and climatechange for a better understanding but also on theintegration of spatially and temporally explicitprocess-based models, data-driven models, remotesensing, and geographical information systems(GIS) for continuous monitoring.
Environ Monit Assess (2015) 187:179 DOI 10.1007/s10661-015-4413-x
S. Berberoglu : C. DonmezDivision of Remote Sensing and GIS, Department ofLandscape Architecture, Cukurova University, Adana, Turkey
F. Evrendilek (*)Department of Environmental Engineering, Abant IzzetBaysal University, Bolu, Turkeye-mail: [email protected]
Process-based simulations coupled with remotelysensed data and GIS have enhanced the environmentalcapability of monitoring spatiotemporal dynamics of Ccycle. This integration offers an essential tool to repet-itively acquire environmental data at spatial, temporal,radiometric, and spectral resolutions appropriate toquantify patterns of human alterations of C cycling.Process-based biogeochemical models can be classifiedinto: (1) remote sensing-based models such as CarnegieAmes Stanford Approach (CASA) model (Potter et al.1993), GLObal Production Efficiency Model (GLO-PEM) (Prince and Goward 1995), Simple DiagnosticBiosphere Model (SDBM) (Knorr and Heimann 1995),Simple Interactive Biosphere model (SIB2) (Sellerset al. 1996), and Terrestrial Uptake and Release ofCarbon model (TURC) (Ruimy et al. 1996); (2) modelsthat simulate coupled biogeochemical cycles of C, ni-trogen (N), phosphorus (P), sulfur (S) or water (H2O)using a prescribed vegetation classification system suchas Biome BioGeochemical Cycle (BIOME-BGC) mod-el (Running et al. 2004), CENTURY model (Partonet al. 1993), and The Terrestrial Ecosystem Model(TEM) (McGuire et al. 2001); and (3) models thatsimulate dynamics of both plant functional typesand coupled biogeochemical cycles such as GlobalBiome (BIOME3) model (Haxeltine and Prentice1996), Dynamic Global Phytogeography model(Woodward et al. 1995), ORCHIDEE model(Krinner et al. 2005), and LPJ-GUESS model(Hickler et al. 2004).
Despite these advances, the magnitude, distribution,and dynamics of global C sinks and sources remain stilluncertain. One of the main reasons for this may beassociated with monitoring of local C sinks and sourcesdisproportionately across ecosystems at too coarse ortoo fine spatiotemporal resolutions (Running et al. 1999;Barford et al. 2001; Schnell et al. 2014). Adoption ofwatershed-scale monitoring, modeling, mapping, andmanagement may facilitate to bridge differences be-tween leaf- and globe-scale quantifications of biogeo-chemical dynamics. One of the understudied biomes interms of C cycle is the Mediterranean watersheds inTurkey as well as globally. The Mediterranean ecosys-tems are relatively more vulnerable to effects of climatechange due to their exposure to semi-arid conditions andsevere and prolonged human-induced pressures. Thereis a lack of experimental studies about as well as apressing need for model simulations at a relatively finespatial scale for such under-sampled Mediterranean
ecosystems through the coupling of regionally down-scaled future (2070s) climate (temperature and rainfall)projections, remotely sensed data, field campaigns, andprocess-based (mechanistic) and data-driven (empirical)modeling. The objective of this study was, therefore, toquantify impacts of regional climate change in the 2070son C cycle of an upper Mediterranean watershed syn-thesizing field measurements, remote sensing data, andthe CASA model.
Materials and methods
Description of study region
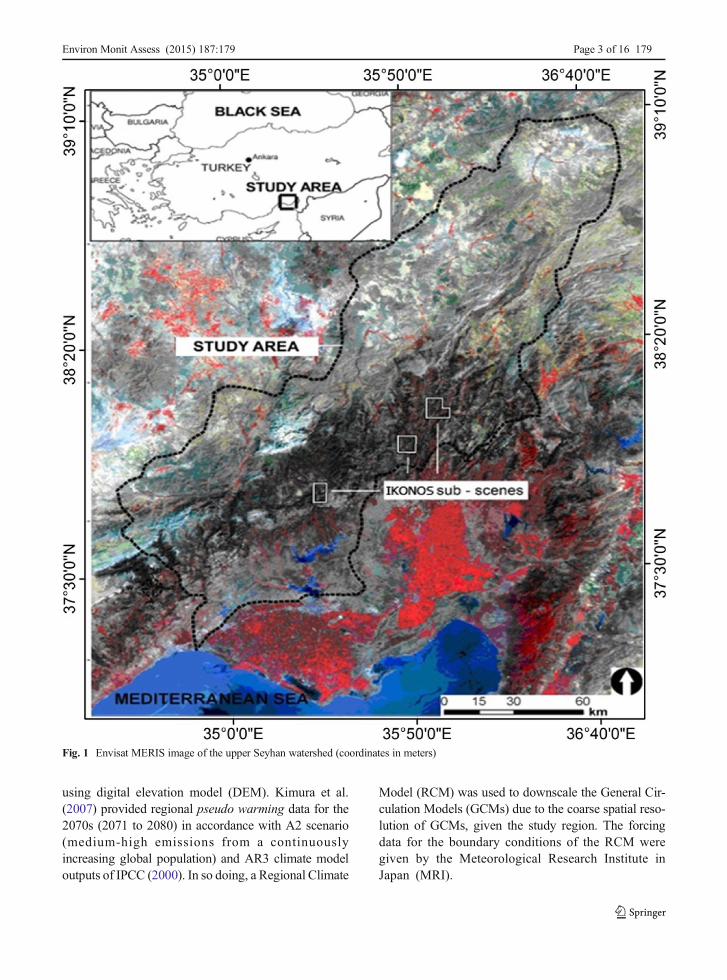
The upper Seyhan watershed is located in the TaurusMountain range of the southernMediterranean region ofTurkey and covers ca. 18,311 km2 (Fig. 1). Dominantforest cover of the study region is characterized by old-growth Mediterranean evergreen needleleaf forest withpure and mixed stands of the following dominant treespecies: Crimean pine (Pinus nigra), Lebanese cedar(Cedrus libani), Taurus fir (Abies cilicica), Turkish pine(Pinus brutia), and Juniper (Juniperus excelsa)(Evrendilek et al. 2006). Mixed forest is generally com-posed of P. brutia and P. nigra; P. brutia and J. excelsa;P. nigra and A. cilicica; and C. libani and A. cilicicastands. Mild and rainy winters and hot and dry summersare typical across the study region with a mean annualrainfall (MAP) of about 800 mm 75 % of which arereceived in autumn (September to November) and win-ter (December to March). Mean annual air temperature(MAT) is 19 °C with mean minimum and maximumvalues of 8 °C in January and 30 °C in July, respectively.Dominant soil types of the upper Seyhan watershed areleptosols for grasslands and forests and fluvisols/vertisols for croplands (Eswaran et al. 2011). The twomain soil texture categories of clay loam and light claycover 54 and 42 % of the study region, respectively(Eswaran et al. 2011).
Climate, remotely sensed, and ancillary data
Long-term climate data (1993–2004) of monthly rain-fall, air temperature, and solar radiation were compiledfrom 50 weather stations across the Seyhan watershedso as to represent the present regional climate condi-tions. The geostatistical interpolation of co-kriging wasused to map the climate variables on a monthly basis
179 Page 2 of 16 Environ Monit Assess (2015) 187:179
using digital elevation model (DEM). Kimura et al.(2007) provided regional pseudo warming data for the2070s (2071 to 2080) in accordance with A2 scenario(medium-high emissions from a continuouslyincreasing global population) and AR3 climate modeloutputs of IPCC (2000). In so doing, a Regional Climate
Model (RCM) was used to downscale the General Cir-culation Models (GCMs) due to the coarse spatial reso-lution of GCMs, given the study region. The forcingdata for the boundary conditions of the RCM weregiven by the Meteorological Research Institute inJapan (MRI).
Fig. 1 Envisat MERIS image of the upper Seyhan watershed (coordinates in meters)
Environ Monit Assess (2015) 187:179 Page 3 of 16 179
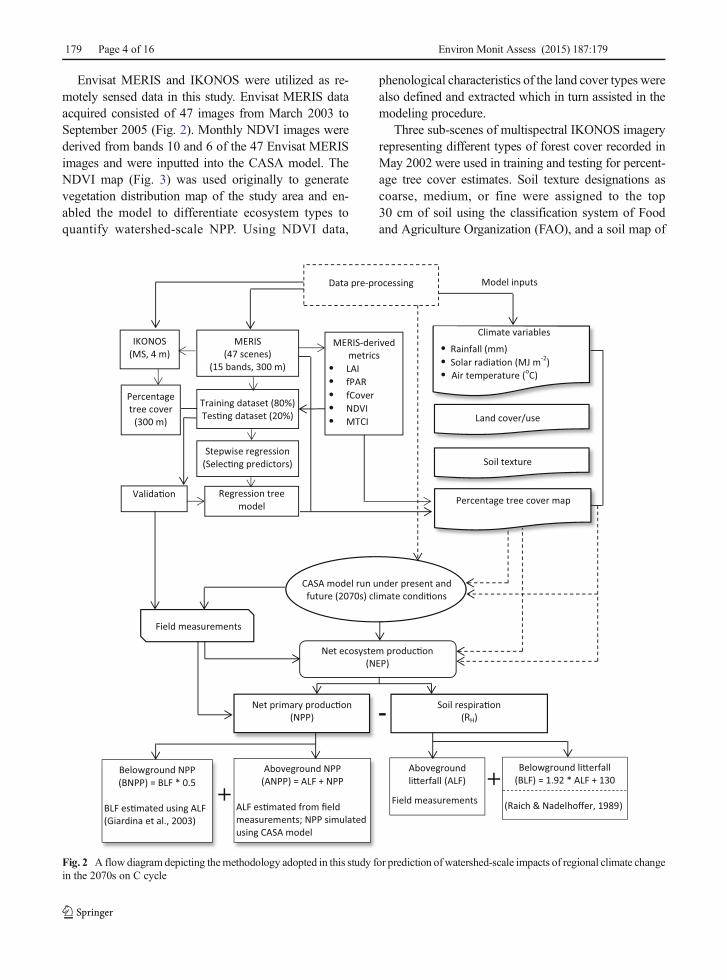
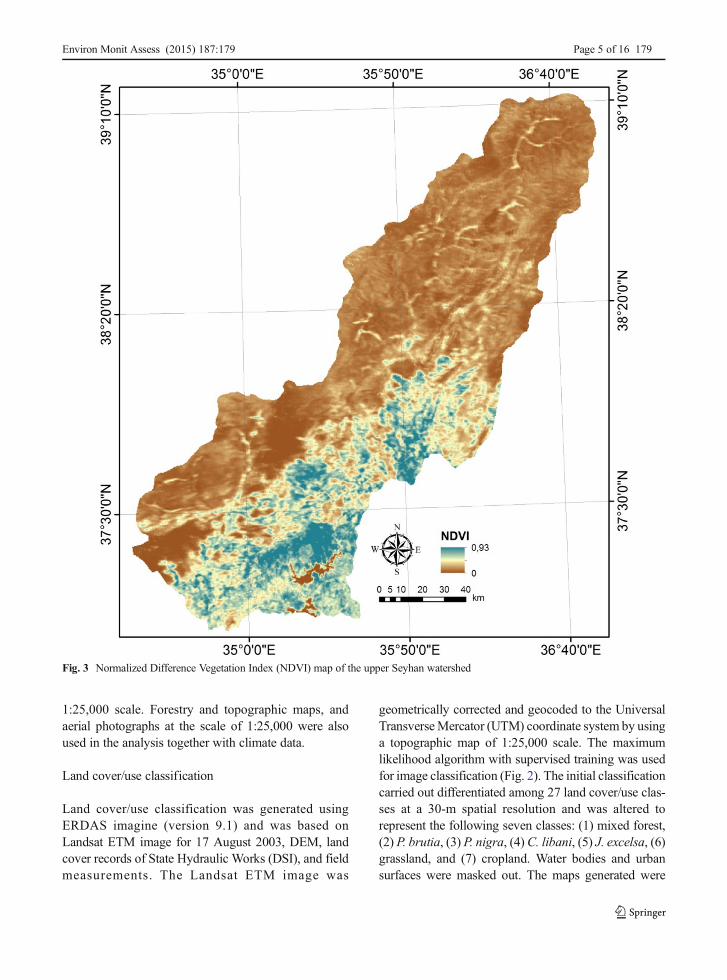
Envisat MERIS and IKONOS were utilized as re-motely sensed data in this study. Envisat MERIS dataacquired consisted of 47 images from March 2003 toSeptember 2005 (Fig. 2). Monthly NDVI images werederived from bands 10 and 6 of the 47 Envisat MERISimages and were inputted into the CASA model. TheNDVI map (Fig. 3) was used originally to generatevegetation distribution map of the study area and en-abled the model to differentiate ecosystem types toquantify watershed-scale NPP. Using NDVI data,
phenological characteristics of the land cover types werealso defined and extracted which in turn assisted in themodeling procedure.
Three sub-scenes of multispectral IKONOS imageryrepresenting different types of forest cover recorded inMay 2002 were used in training and testing for percent-age tree cover estimates. Soil texture designations ascoarse, medium, or fine were assigned to the top30 cm of soil using the classification system of Foodand Agriculture Organization (FAO), and a soil map of
Climate variables
Rainfall (mm)Solar radia�on (MJ m-2)Air temperature (oC)
Land cover/use
Soil texture
+
Net ecosystem produc�on(NEP)
+
Field measurements
Net primary produc�on (NPP)
Belowground NPP(BNPP) = BLF * 0.5
BLF es�mated using ALF (Giardina et al., 2003)
Aboveground NPP (ANPP) = ALF + NPP
ALF es�mated from field measurements; NPP simulated using CASA model
Soil respira�on(RH)
Aboveground li�erfall (ALF)
Field measurements
Belowground li�erfall(BLF) = 1.92 * ALF + 130
(Raich & Nadelhoffer, 1989)
IKONOS (MS, 4 m)
MERIS (47 scenes)
(15 bands, 300 m)
Percentage tree cover
(300 m)
MERIS-derived metrics LAIfPARfCoverNDVIMTCI
Training dataset (80%)Tes�ng dataset (20%)
Stepwise regression(Selec�ng predictors)
Regression tree model
Valida�on Percentage tree cover map
CASA model run under present and future (2070s) climate condi�ons
Data pre-processing Model inputs
-
Fig. 2 A flow diagram depicting themethodology adopted in this study for prediction of watershed-scale impacts of regional climate changein the 2070s on C cycle
179 Page 4 of 16 Environ Monit Assess (2015) 187:179
1:25,000 scale. Forestry and topographic maps, andaerial photographs at the scale of 1:25,000 were alsoused in the analysis together with climate data.
Land cover/use classification
Land cover/use classification was generated usingERDAS imagine (version 9.1) and was based onLandsat ETM image for 17 August 2003, DEM, landcover records of State Hydraulic Works (DSI), and fieldmeasurements. The Landsat ETM image was
geometrically corrected and geocoded to the UniversalTransverseMercator (UTM) coordinate system by usinga topographic map of 1:25,000 scale. The maximumlikelihood algorithm with supervised training was usedfor image classification (Fig. 2). The initial classificationcarried out differentiated among 27 land cover/use clas-ses at a 30-m spatial resolution and was altered torepresent the following seven classes: (1) mixed forest,(2) P. brutia, (3) P. nigra, (4) C. libani, (5) J. excelsa, (6)grassland, and (7) cropland. Water bodies and urbansurfaces were masked out. The maps generated were
Fig. 3 Normalized Difference Vegetation Index (NDVI) map of the upper Seyhan watershed
Environ Monit Assess (2015) 187:179 Page 5 of 16 179
then rasterized to a 30-m cell size using the nearestneighbor algorithm.
Percentage tree cover
Percentage tree canopy cover was estimated usingthe following five steps: (1) generation of a refer-ence dataset for percentage tree cover; (2) deriva-tion of metrics from Envisat MERIS data; (3)selection of predictor variables; (4) fitting regres-sion tree (RT) models; and (5) accuracy assess-ment (Donmez et al. 2015) (Fig. 2). A referencedataset for percentage tree cover was generatedusing multispectral IKONOS images at a 4-m spa-tial resolution to train the model. Three sub-scenesof IKONOS images were selected to representdifferent forest cover types and were classified as treeand non-tree pixels over an area of 120 km2. Classifica-tion results were then used to estimate percentage treecover at the spatial resolution of MERIS.
Fifteen spectral bands of Envisat MERIS data (390 to1040 nm), NDVI, leaf area index (LAI), fraction ofphotosynthetically active radiation (fPAR), fraction ofgreen vegetation cover per a unit area of horizontal soil(fCover), and MERIS terrestrial chlorophyll index(MTCI) were used as biophysical predictors in the mod-el. The ratio of reflectance difference between bands 10and 9 to reflectance difference between bands 9 and 8for Envisat MERIS is defined as MTCI (Dash andCurran 2006). Using the top of canopy land productsalgorithm (TOA_VEG version 3) developed by Weisset al. (2006), LAI, fPAR, and fCover were estimatedthrough the visualization and analyzing tool of theMERIS/(A)ATSR Toolbox (VISAT). A stepwise linearregression (SLR) method was used for the addition toRT model of the most significant predictors that explainpercentage tree cover (Helsel and Hirsch 1992).The entire IKONOS data were partitioned intotraining (1023 pixels) and testing (209 pixels)datasets. After the geometric and radiometric cor-rections of the IKONOS images, four models builtusing the SLR method were trained with the ref-erence data derived from the IKONOS images.Relationships between percentage tree cover andspectral values of Envisat MERIS were modeledusing the RT model. Finally, the predictive perfor-mance of the RT model was assessed comparingestimated versus measured values of percentagetree cover.
Aboveground litterfall
Monthly aboveground litterfall was collected from fiveforest stands. For sampling of forest litterfall, the fol-lowing forest stands with the highest canopy cover wereselected so as to best represent local forest conditions:P. nigra, C. libani, P. brutia, J. excelsa and mixed foreststands. Litterfall was sampled using five permanentcircular litterfall traps of 0.20 m2 per each stand. Theindividual traps at each site were set up for sampling on17 June, 25 July, 20 September, 23 October, 17 Novem-ber, and 24 December 2004. The composite sampleswere sorted into pine needles, small woody materials(e.g., bark, wood, and branches <1 cm diameter), repro-ductive structures (e.g., flowers, fruits, and cones), andunclassified materials (e.g., any material passingthrough a 2-mm sieve). The samples were weighedafter being oven-dried at 70 °C for 48 h until aconstant dry weight (DW) content was achieved.Aboveground litterfall addition to the soil from theevergreen needleleaf forest was expressed in Cunits using the ratio of 0.45 for the conversionof DW to C content (Evrendilek et al. 2006).Relationship between maximum canopy cover andlitterfall explored for each forest type in differentseasons showed that the litterfall measurementswere strongly correlated with canopy cover, spe-cies, and season. Thus, the field measurementslinked with canopy cover and land cover mapwere used to determine the spatial distribution ofaboveground litterfall over the entire study region.
Soil respiration
Soil respiration is defined as total CO2 effluxfrom soils as a function of decomposition andmineralization of soil organic matter by soilmicroorganisms and autotrophic respiration ofplant roots (Raich and Schlesinger 1992). Aswith NPP, RH is a major component of C cycleand can be assumed to equal above- and below-ground litter inputs at a steady state thus(Kirschbaum 1995):
RH ¼ ALFþ BLF ð1Þ
where BLF was estimated for mature forests as afunction of ALF (g C m−2 years−1) based on the
179 Page 6 of 16 Environ Monit Assess (2015) 187:179
following least square regression model (Raich andNadelhoffer 1989):
BLF ¼ 130þ 1:92� ALF ð2Þ
Net primary production
Monthly NPP was estimated using the CASA model asa function of downwelling PAR, NDVI, light use effi-ciency (ε), fPAR, and reduction factors as follows:
NPP ¼ f f PAR� ε� g Tð Þ � h Wð Þð Þ ð3Þwhere fPAR (MJ m−2 month−1) is a function of NDVIand downwelling PAR. Light use efficiency (g C MJ−1)is a potential ε value adjusted by such reduction factorsas temperature effect—g(T)—and water stress—h(W)—(Potter et al. 2003).
Net ecosystem production
Net ecosystem production (g C m−2 years−1) was esti-mated as follows:
NEP ¼ ANPPþ BNPPð Þ−RH ð4ÞFor a better quantification of NEP for the land cover/
use types under regional climate change, the followingmaps were generated at a 300-m resolution: (1) above-ground litterfall (ALF); (2) belowground litterfall(BLF); (3) RH; and (4) aboveground and belowgroundNPP (ANPP and BNPP). Half of BLF was assumed toequal BNPP which was in turn added to ANPP toestimate total NPP (Giardina et al. 2003) (Fig. 2).
Results and discussion
Land cover/use classification
The accuracy assessment of the classification was car-ried out using the systematic sampling method. First, atotal of 500 samples as the reference data were collectedusing GPS from the study area. Second, the class typeswere determined at the specific locations based onground-truth data. Finally, a comparison of the classtypes determined using the reference data versus thoseof the classified map was quantified using an errormatrix for the accuracy of the classification presentedin Table 1. Overall accuracy derived from the stratified
random sampling method image was 94 % for theclassified image with an overall kappa statistic of85 %, the proportion of agreement discounting what isexpected by chance alone.
Aboveground litterfall
The spatial distribution of aboveground litterfall foreach forest type was interpolated over the study regionas a linear function of percentage tree cover. The C inputto the soil from aboveground litterfall was assumed toreflect the maximum rates since the sampling plots forlitterfall were representative of the Mediterranean ever-green needleleaf forest with the highest fractional cano-py cover. Similarly, Matala et al. (2008) reported asignificant linear relationship between litterfall(kg ha−1) and basal area (m−2 ha−1) (r=0.84; p<0.01).The best-fit MLR models of aboveground litterfall as afunction of NPP, rainfall, and solar radiation were pre-sented in Table 2.
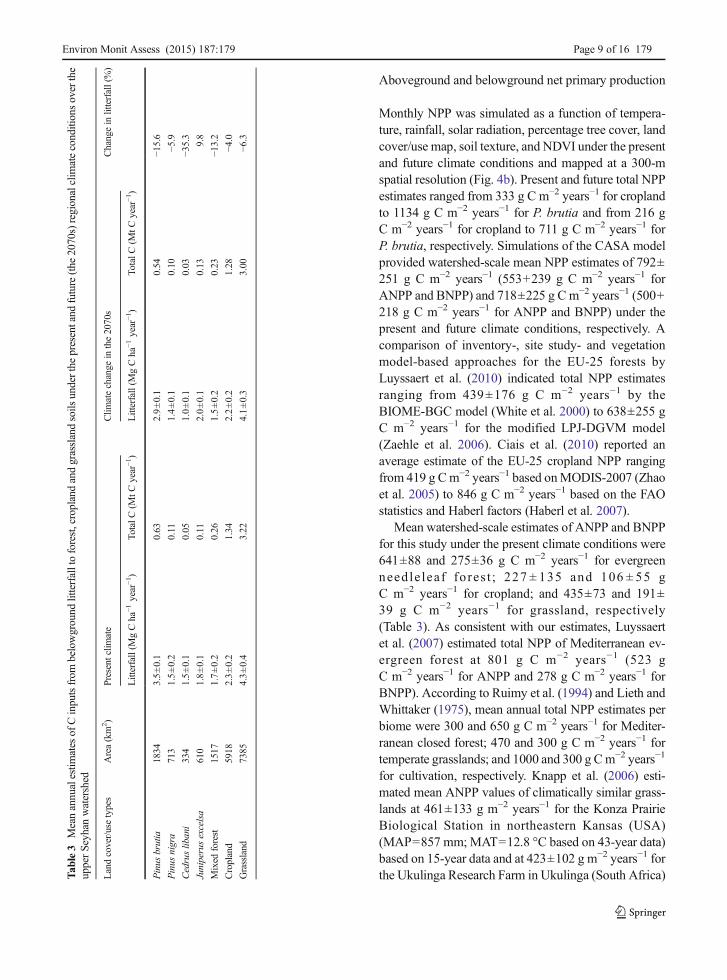
Annual aboveground litterfall across the study regionwas estimated to vary between 1.5 Mg C ha−1 forP. nigra and C. libani and 4.3 Mg C ha−1 for grasslandunder the present climate and between 1.0 Mg C ha−1
for C. libani and 4.1 Mg C ha−1 for grassland under theclimate change in the 2070s (Mg=106 g). Our findingswere consistent with the European and Asian dry forestswhich were reported to add litterfall to the soil annuallyin the range of 0.78 to 3.4MgC ha−1 (n=19) and of 0.45to 4.7MgC ha−1 (n=20), respectively (Chun-Jiang et al.2003). Future aboveground litterfall predictions for theclimate change in the 2070s based on the MLR modelsshowed a general decrease over the entire watershedexcept for J. excelsa (Table 3). The rate of decrease inaboveground litterfall estimated in response to theprojected climate change was the highest (35 %) forC. libani. Spatiotemporal changes in C input fromaboveground litterfall to the soils of the terrestrial Med-iterranean ecosystems between the present and futureclimate conditions are presented in Fig. 4a at a 300-mspatial resolution. Total aboveground litterfall for theupper watershed declined by 7.2 % from 5.7 to5.3 Mt C year−1 under the climate change in2070s (Mt=1012 g). Chun-Jiang et al. (2003) quan-tified that total aboveground litterfall values of 9±4.5 Mt C and 54±22.5 Mt C were transferredannually from the Asian and European dry foreststo the soils, respectively.
Environ Monit Assess (2015) 187:179 Page 7 of 16 179
Soil respiration
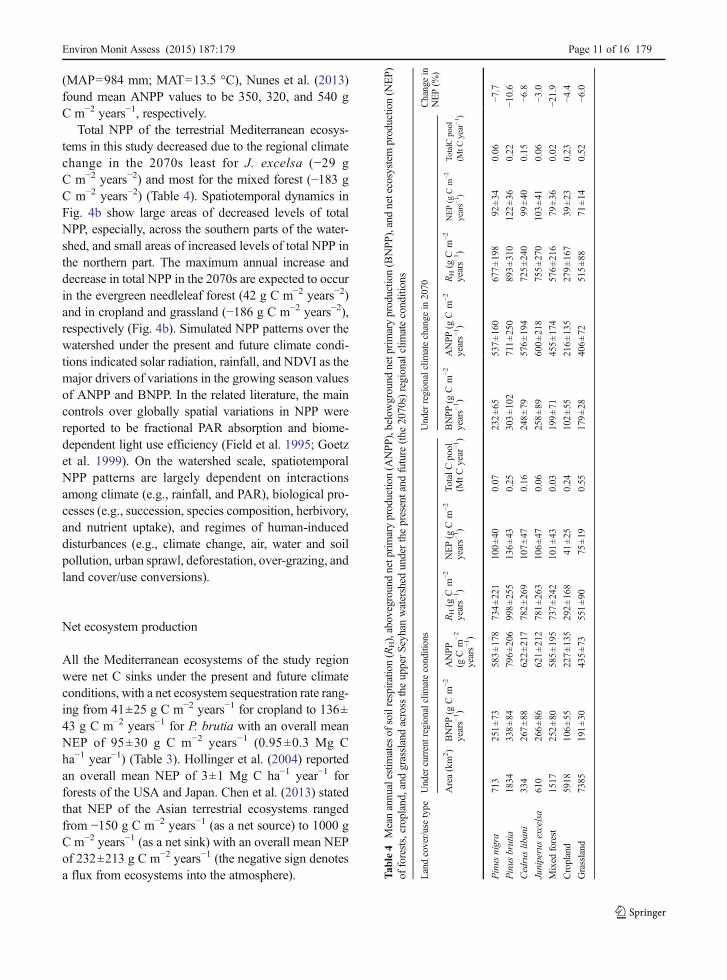
Mean RH rates of the terrestrial Mediterranean ecosys-tems across the study region under the present climateconditions ranged from 292±168 g C m−2 years−1 forcropland to 998±255 g C m−2 years−1 for P. brutia, withan overall mean RH of 696±221 g C m−2 years−1. Froma total of 88 flux sites (19 sites from ChinaFLUX, 37sites from AsiaFlux and 32 other sites), mean ecosystemrespiration (RE) of the Asian terrestrial ecosystems wasderived as 990±827 g C m−2 years−1 (Chen et al. 2013).The mean RH estimates of the Mediterranean terrestrialecosystems in this study and the Asian terrestrial eco-systems appear to be consistent as the Asian RE rate isthe sum of both RH and autotrophic respiration (RA).
Raich and Schlesinger (1992) estimated mean annualRH rates of 713±88 g C m−2 years−1 for Mediterraneanwoodlands (n=13) and 544±80 g C m−2 years−1 forcroplands (n=26). Luyssaert et al. (2007) reported amean RH rate of 574±98 g C m−2 years−1 for Mediter-ranean evergreen forest. Meta-analysis by Wang andFang (2009) indicated mean annual RH rates of 389.8±45.5 and 601.3±45.6 g C m−2 years−1 for temperate andtropical grasslands, respectively. As in close agreementwith the present study, long-term eddy covariance
measurements from 2001 to 2008 over an open grass-land in California (USA) under a Mediterranean climate(MAP=559 mm; MAT=16.3 °C) showed that RH ratesestimated from a carbon model (Ecosys) varied between397 g C m−2 years−1 in 2008 and 685 g C m−2 years−1 in2005, with a mean of 508±95 g C m−2 years−1 (Grantet al. 2012). As very close to the mean annual RH rate ofcropland in this study (292±168 g C m−2 years−1), Ciaiset al. (2010) reported a mean annual RH rate of 299 gC m−2 years−1 over the EU-25 croplands.
Soil respiration rates across the study region underthe climate change in the 2070s were, on average, foundto decrease by 9 % and varied between 279±167 gC m−2 years−1 for cropland and 893 ± 310 gC m−2 years−1 for P. brutia (Table 4). The decrease inRH relative to the present period in response to theclimate change in the 2070s ranged from 3 % forJ. excelsa to 22 % for mixed forest. Similarly, meta-analysis by Wang et al. (2014), on average, showed a16 % reduction in RH across Mediterranean ecosystems(n=3) versus a 12 % increase in RH across tundra,alpine, boreal, and temperate ecosystems in responseto global warming by 2 °C, suggesting that increasedtemperature alone exerts an opposing effect on RH incolder versus warmer climate.
Table 2 Multiple linear regression (MLR) models of annualaboveground litterfall (ALF, g C m−2 years−1) for five Mediterra-nean forest types in the upper Seyhan watershed as a function of
net primary production (NPP, g C m−2 years−1), rainfall (RF, mmyear−1), and solar radiation (SR, MJ year−1)
Forest types r2adj (%) MLR models
Pinus brutia 69.1 ALF=405+0.251NPP−1.92RF+4.81SRPinus nigra 64.5 ALF=228+0.100NPP−4.83RF−2.00SRCedrus libani 74.0 ALF=200+0.0217NPP+10.7RF+25.0SR
Juniperus excelsa 72.9 ALF=100+0.382NPP−1.94RF+1.57SRMixed forest 75.2 ALF=168+0.174NPP−6.64RF−6.24SR
Table 1 Accuracy assessmentstatistics of land cover/useclassification
Class types Producer’s accuracy (%) User’s accuracy (%) Kappa (%)
Water body 100 100 100
Rainfed agriculture 95 98 98
Irrigated agriculture 98 93 92
Bare ground 98 98 97
Grassland 100 100 100
Needleleaf forest 88 100 100
Deciduous forest 81 95 95
Total accuracy (%) 94 85
179 Page 8 of 16 Environ Monit Assess (2015) 187:179
Aboveground and belowground net primary production
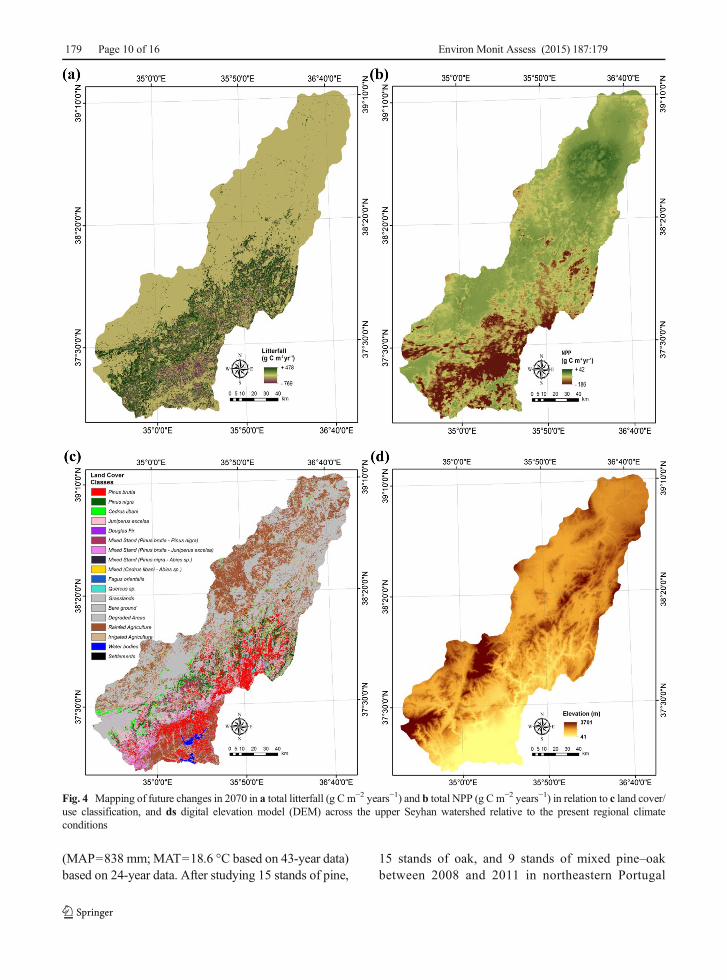
Monthly NPP was simulated as a function of tempera-ture, rainfall, solar radiation, percentage tree cover, landcover/use map, soil texture, and NDVI under the presentand future climate conditions and mapped at a 300-mspatial resolution (Fig. 4b). Present and future total NPPestimates ranged from 333 g C m−2 years−1 for croplandto 1134 g C m−2 years−1 for P. brutia and from 216 gC m−2 years−1 for cropland to 711 g C m−2 years−1 forP. brutia, respectively. Simulations of the CASA modelprovided watershed-scale mean NPP estimates of 792±251 g C m−2 years−1 (553+239 g C m−2 years−1 forANPP and BNPP) and 718±225 g Cm−2 years−1 (500+218 g C m−2 years−1 for ANPP and BNPP) under thepresent and future climate conditions, respectively. Acomparison of inventory-, site study- and vegetationmodel-based approaches for the EU-25 forests byLuyssaert et al. (2010) indicated total NPP estimatesranging from 439±176 g C m−2 years−1 by theBIOME-BGC model (White et al. 2000) to 638±255 gC m−2 years−1 for the modified LPJ-DGVM model(Zaehle et al. 2006). Ciais et al. (2010) reported anaverage estimate of the EU-25 cropland NPP rangingfrom 419 g Cm−2 years−1 based onMODIS-2007 (Zhaoet al. 2005) to 846 g C m−2 years−1 based on the FAOstatistics and Haberl factors (Haberl et al. 2007).
Mean watershed-scale estimates of ANPP and BNPPfor this study under the present climate conditions were641±88 and 275±36 g C m−2 years−1 for evergreenneedle leaf fores t ; 227 ± 135 and 106 ± 55 gC m−2 years−1 for cropland; and 435±73 and 191±39 g C m−2 years−1 for grassland, respectively(Table 3). As consistent with our estimates, Luyssaertet al. (2007) estimated total NPP of Mediterranean ev-ergreen forest at 801 g C m−2 years−1 (523 gC m−2 years−1 for ANPP and 278 g C m−2 years−1 forBNPP). According to Ruimy et al. (1994) and Lieth andWhittaker (1975), mean annual total NPP estimates perbiome were 300 and 650 g C m−2 years−1 for Mediter-ranean closed forest; 470 and 300 g C m−2 years−1 fortemperate grasslands; and 1000 and 300 g Cm−2 years−1
for cultivation, respectively. Knapp et al. (2006) esti-mated mean ANPP values of climatically similar grass-lands at 461±133 g m−2 years−1 for the Konza PrairieBiological Station in northeastern Kansas (USA)(MAP=857 mm; MAT=12.8 °C based on 43-year data)based on 15-year data and at 423±102 g m−2 years−1 forthe Ukulinga Research Farm in Ukulinga (South Africa)T
able3
Meanannualestim
ates
ofCinputsfrom
belowground
litterfalltoforest,croplandandgrasslandsoils
underthepresentand
future(the
2070s)regionalclim
ateconditionsoverthe
upperSeyhan
watershed
Landcover/usetypes
Area(km
2 )Presentclim
ate
Clim
atechange
inthe2070s
Changein
litterfall(%)
Litterfall(M
gCha
−1year−1)
TotalC
(MtC
year−1)
Litterfall(M
gCha
−1year−1)
TotalC
(MtC
year−1)
Pinus
brutia
1834
3.5±0.1
0.63
2.9±0.1
0.54
−15.6
Pinus
nigra
713
1.5±0.2
0.11
1.4±0.1
0.10
−5.9
Cedruslib
ani
334
1.5±0.1
0.05
1.0±0.1
0.03
−35.3
Juniperusexcelsa
610
1.8±0.1
0.11
2.0±0.1
0.13
9.8
Mixed
forest
1517
1.7±0.2
0.26
1.5±0.2
0.23
−13.2
Cropland
5918
2.3±0.2
1.34
2.2±0.2
1.28
−4.0
Grassland
7385
4.3±0.4
3.22
4.1±0.3
3.00
−6.3
Environ Monit Assess (2015) 187:179 Page 9 of 16 179
(MAP=838 mm; MAT=18.6 °C based on 43-year data)based on 24-year data. After studying 15 stands of pine,
15 stands of oak, and 9 stands of mixed pine–oakbetween 2008 and 2011 in northeastern Portugal
Fig. 4 Mapping of future changes in 2070 in a total litterfall (g C m−2 years−1) and b total NPP (g C m−2 years−1) in relation to c land cover/use classification, and ds digital elevation model (DEM) across the upper Seyhan watershed relative to the present regional climateconditions
179 Page 10 of 16 Environ Monit Assess (2015) 187:179
(MAP=984 mm; MAT=13.5 °C), Nunes et al. (2013)found mean ANPP values to be 350, 320, and 540 gC m−2 years−1, respectively.
Total NPP of the terrestrial Mediterranean ecosys-tems in this study decreased due to the regional climatechange in the 2070s least for J. excelsa (−29 gC m−2 years−2) and most for the mixed forest (−183 gC m−2 years−2) (Table 4). Spatiotemporal dynamics inFig. 4b show large areas of decreased levels of totalNPP, especially, across the southern parts of the water-shed, and small areas of increased levels of total NPP inthe northern part. The maximum annual increase anddecrease in total NPP in the 2070s are expected to occurin the evergreen needleleaf forest (42 g C m−2 years−2)and in cropland and grassland (−186 g C m−2 years−2),respectively (Fig. 4b). Simulated NPP patterns over thewatershed under the present and future climate condi-tions indicated solar radiation, rainfall, and NDVI as themajor drivers of variations in the growing season valuesof ANPP and BNPP. In the related literature, the maincontrols over globally spatial variations in NPP werereported to be fractional PAR absorption and biome-dependent light use efficiency (Field et al. 1995; Goetzet al. 1999). On the watershed scale, spatiotemporalNPP patterns are largely dependent on interactionsamong climate (e.g., rainfall, and PAR), biological pro-cesses (e.g., succession, species composition, herbivory,and nutrient uptake), and regimes of human-induceddisturbances (e.g., climate change, air, water and soilpollution, urban sprawl, deforestation, over-grazing, andland cover/use conversions).
Net ecosystem production
All the Mediterranean ecosystems of the study regionwere net C sinks under the present and future climateconditions, with a net ecosystem sequestration rate rang-ing from 41±25 g C m−2 years−1 for cropland to 136±43 g C m−2 years−1 for P. brutia with an overall meanNEP of 95±30 g C m−2 years−1 (0.95±0.3 Mg Cha−1 year−1) (Table 3). Hollinger et al. (2004) reportedan overall mean NEP of 3±1 Mg C ha−1 year−1 forforests of the USA and Japan. Chen et al. (2013) statedthat NEP of the Asian terrestrial ecosystems rangedfrom −150 g C m−2 years−1 (as a net source) to 1000 gC m−2 years−1 (as a net sink) with an overall mean NEPof 232±213 g C m−2 years−1 (the negative sign denotesa flux from ecosystems into the atmosphere). T
able4
Meanannualestim
ates
ofsoilrespiration(R
H),abovegroundnetprimaryproductio
n(A
NPP
),belowground
netprimaryproduction(BNPP
),andnetecosystem
productio
n(N
EP)
offorests,cropland,and
grasslandacross
theupperSeyhan
watershed
underthepresentand
future
(the
2070s)regionalclim
ateconditions
Landcover/usetype
Undercurrentregionalclim
ateconditions
Under
regionalclim
atechange
in2070
Changein
NEP(%
)
Area(km
2 )BNPP
(gCm
−2
years−
1 )ANPP
(gCm
−2
years−
1)
RH(g
Cm
−2
years−
1)
NEP(g
Cm
−2
years−
1 )To
talC
pool
(MtC
year−1)
BNPP
(gCm
−2
years−
1)
ANPP
(gCm
−2
years−
1 )RH(g
Cm
−2
years−
1 )NEP(g
Cm
−2
years−
1)
TotalC
pool
(MtC
year−1)
Pinus
nigra
713
251±73
583±178
734±221
100±40
0.07
232±65
537±160
677±198
92±34
0.06
−7.7
Pinus
brutia
1834
338±84
796±206
998±255
136±43
0.25
303±102
711±250
893±310
122±36
0.22
−10.6
Cedruslibani
334
267±88
622±217
782±269
107±47
0.16
248±79
576±194
725±240
99±40
0.15
−6.8
Juniperusexcelsa
610
266±86
621±212
781±263
106±47
0.06
258±89
600±218
755±270
103±41
0.06
−3.0
Mixed
forest
1517
252±80
585±195
737±242
101±43
0.03
199±71
455±174
576±216
79±36
0.02
−21.9
Cropland
5918
106±55
227±135
292±168
41±25
0.24
102±55
216±135
279±167
39±23
0.23
−4.4
Grassland
7385
191±30
435±73
551±90
75±19
0.55
179±28
406±72
515±88
71±14
0.52
−6.0
Environ Monit Assess (2015) 187:179 Page 11 of 16 179
Based on a total of 88 flux sites, an overall meanNEPof the Asian forests was estimated at 274±207 gC m−2 years−1 (Chen et al. 2013) which is about 2.5times higher than that (110±15 g C m−2 years−1) of theMediterranean evergreen needleleaf forests in this study.This difference is most likely to stem frombiogeoclimatically broad coverage of different Asianforest ecosystems. Luyssaert et al. (2010) reported meanNEP estimates of the EU-25 forests ranging from 19±6 g C m−2 years−1 by LPJ-DGVM (Sitch et al. 2003) to200±52 g C m−2 years−1 by site studies. Powell et al.(2008) estimated an annual NEP for naturally regener-ated mixed stands of longleaf pine (Pinus palustrisMill.) and slash pine (Pinus elliottii var. elliottiiEngelm.) in the range of 158 to 192 g C m−2 years−1
after 4 years of eddy covariance measurements in northFlorida (MAP=1228 mm; MAT=19 °C). AmeriFluxdata-derived NEP for Mediterranean evergreen forest(Adenostoma sp. and Ceanothus sp.) of Sky Oaks inCalifornia (USA) (MAP=491 mm; MAT=12.2 °C) wasfound to vary between 60 and 67 g C m−2 years−1
depending on the stand age (Falge et al. 2002). Nineyears of eddy covariance measurements over an ever-green Mediterranean forest (Quercus ilex) in southernFrance (MAP=907 mm; MAT=13.5 °C) led to NEPvalues of 149 to 451 g C m−2 years−1 (Allard et al.2008). NEP estimates of Mediterranean forests were70 g C m−2 years−1 for Q. ilex forest in Italy (MAP=588 mm; MAT=15.9 °C) (Miglietta and Peressotti1999), between 20 and 140 g C m−2 years−1 for mixedQ. ilex and Q. suber forest in Portugal (MAP=669 mm;MAT=16 °C) (Pereira et al. 2007), and between 56 and115 g C m−2 years−1 for Quercus douglasii forest inCalifornia (USA) (MAP=562 mm;MAT=16.5 °C) (Maet al. 2007).
Mean grassland NEP estimate of 75 ± 19 gC m−2 years−1 over the study region in the presentclimate declined by 6 % to 71±14 g C m−2 years−1 inresponse to climate change in the 2070s. Maximumsource and sink (NEP) values of C3 grasslands globallywere estimated to range from −300 to 500 gC m−2 years−1, respectively, based on a decade of eddycovariance measurements (Peichl et al. 2013). Schulzeet al. (2010) quantified the mean NEP of the Europeangrasslands as 57±34 g C m−2 years−1 from flux towermeasurements. On average, Peichl et al. (2013) quanti-fied grassland NEP as 222±104 g C m−2 years−1 for themaritime climate, 64±70 g C m−2 years−1 for the Med-iterranean climate and 60±98 g C m−2 years−1 for cold-
temperate climate. Ma et al. (2007) reported that long-term eddy covariance-based NEP values for the Medi-terranean grassland in California (USA) (MAP=562 mm; MAT=16.5 °C) changed from a net sink of88±61 g C m−2 years−1 to a net source of −189±51 gC m−2 years−1 between 2000 and 2006. A grazed Med-iterranean C3/C4 grassland in southern Portugal(MAP=669 mm; MAT=15.5 °C) acted as a net sourceof −49 g C m−2 years−1 between 2004 and 2005 and as anet sink of 190 g C m−2 years−1 between 2005 and 2006(Aires et al. 2008). Eddy covariance measurements ofgrassland NEP in the Little Washita watershed of south-west Oklahoma (USA) (MAP=760 mm; MAT=16 °C)under the climate conditions very similar to that of theupper Seyhan watershed resulted in NEP values of 41and 118 g C m−2 years−1 in the growing seasons of 1996and 1997, respectively (Falge et al. 2002). Multiple-yeareddy covariance observations for different cropsshowed croplands to have mean annual NEP valuesranging from 34 to 193 g C m−2 years−1 (Anthoniet al. 2004; Aubinet et al. 2009).
Total C pool of the entire terrestrial ecosystems in theupper Seyhan watershed was estimated at 1.36 Mega-tons (Mt) C year−1 (Mt=1012 g). The projection ofregional climate change in the 2070s showed an overalldecrease in the terrestrial NEP of the study region whichwas the most dramatic (−21.9 %) for the mixed forest(Table 4). Globally, grassland covers 20 to 40% (26.8 to56 million km2) of the world’s land area depending onthe grassland definition and is a significant componentof the global C cycle (Suttie et al. 2005). Similarly,covering 40 % of the total land area and having thelargest contribution (0.55 Mt C year−1) to total C pool(1.36 Mt C year−1) of the study region, grassland playedthe most significant role in the local C cycle of thewatershed for the present and future climate.
Unlike NEP, net biome production (NBP) takes intoaccount human-induced losses and gains of ecosystemC, and hence, better represents the net amount of atmo-spheric CO2 sequestered in ecosystem components suchas vegetation and soil in the long-term. As a function ofthe mean forest NPP (916±124 g C m−2 years−1) in thestudy region, and the mean C sequestration ratio of NBPto NPP for the EU-25 forests (0.15±0.05) by Luyssaertet al. (2010), the mean NBP value of the Mediterraneanevergreen needleleaf forests was estimated at 137±19 gC m−2 years−1 under the present climate and 124±20 gC m−2 years−1 under the future climate. The meanpresent and future forest NBP estimates of this study
179 Page 12 of 16 Environ Monit Assess (2015) 187:179
are within the European forest NBP between 70 and160 g C m−2 years−1 (Janssens et al. 2003). The meancropland and grassland NBP of the study region wasestimated at 10±6 and 81±13 g C m−2 years−1 based onthe maximum and mean ratios of NBP to NPP for theEU-25 cropland (0.03) and grassland (0.13) as presentedby Ciais et al. (2010), respectively. As close to the meancropland NBP in this study, the ORCHIDEE-STICSmodel (Gervois et al. 2008) provided a mean NBPestimate of 15±15 g C m−2 years−1 for the EU-25cropland over the period of 1990 to 1999. Soussanaet al. (2007) inferred a mean grassland NBP estimateof 104±73 g C m−2 years−1 (in the range of 12 gC m−2 years−1 in Hungary to 1479 g C m−2 years−1 inDenmark) from nine sites along a major climatic gradi-ent over Europe for 2 years (MAP=500 mm in Hungaryto 1313 mm in France; MAT=6.3 °C in Italy to 10.5 °Cin Hungary). The mean NBP values of the three mainMediterranean ecosystems (evergreen needleleaf forest,cropland, and grassland) and their corresponding landcoverage give a watershed-scale NBP estimate of1.34 Tg C year−1 in this study (Tg=1012 g). Thiswatershed-scale NBP estimate corresponds to 0.048,0.079, 0.168, and 0.498 % of the total global (2.8 PgC year−1), Eurasia (1.7 Pg C year−1), North America(0.8 Pg C year−1), and EU-25 (270 Tg C year−1) terres-trial NBP values, respectively (Schimel et al. 2001;Schulze et al. 2010) (Pg=1015 g).
It is clear from the above discussion that all ourwatershed-scale estimates about aboveground litterfall,RH, NPP, NEP, and NBP of the terrestrial Mediterraneanecosystems fall within a reasonable range of the existingstudies. The use of Envisat MERIS data in the CASAmodel appeared to predict spatiotemporal dynamics ofC cycle at a high spatial resolution better than that ofmultitemporal images with a coarse-to-moderate spatialresolution such as MODIS (Nemani et al. 2009) andAVHRR (Kennedy et al. 2009). However, uncertaintiesassociated with the estimates of the present study stemfrom other controls on C cycle that were not taken intoaccount such as herbivory, management practices, non-uniform disturbance regimes including land use/coverconversions, and/or atmospheric aerosol loadings. Abetter understanding of the impact of these controls onterrestrial C cycle is required to reduce uncertaintieswith the quantification of spatiotemporal dynamics ofecosystem C gain and loss. For example, consumptionof NPP by herbivory was reported to account generallyfor less than 10 % of NPP in forests, except when insect
outbreaks may consume 50 % of NPP (Schowalter et al.1986). Carbon sink/source capacity of ecosystems alsodepends on local management practices and land usestrategies such as conservation tillage and residue prac-tices, and retention of old-growth forests and understoryvegetation (Wali et al. 1999; Evrendilek andWali 2004).Chen and Zhuang (2014) found that the atmosphericaerosol loading enhanced GPP (130.0±4.1 Pg Cyear−1), RA (66.5±0.6 Pg C year−1), RH (52.1±1.8 PgC year−1), NPP (63.5±3.6 Pg C year−1) and NEP (11.4±4.5 Pg C year−1) of the global terrestrial ecosystem overthe period of 2003 to 2010 relative to the baseline values(without the effect of the aerosol loadings on C cycle) ofGPP (125.1±5.2 Pg C year−1), RA (65.4±1.0 Pg Cyear−1), RH (52.2±2.0 Pg C year−1), NPP (59.7±4.3Pg C year−1), and NEP (7.5±4.7 Pg C year−1).
Conclusions
The Mediterranean ecosystems are one of the hot spotsof the earth due to their supply of life-supporting eco-system services as well as their exposure to severe,intense, and prolonged human-induced disturbances.High-resolution and meso-scale monitoring studies areneeded for tailoring environmental management strate-gies towards strengthening C sink status of the Mediter-ranean ecosystems. Satellite-based ecosystem modelingwith Envisat MERIS and IKONOS data proved to bepromising in mapping C sink/source patterns and incapturing high variability of the Mediterranean condi-tions in response to regional climate change in the2070s. Simulation estimates of C budget componentsin this study agreed well with observations and esti-mates of the related literature within their respectiveerror bounds. With the climate change in the 2070s, awatershed-scale mean decrease was inferred in C inputto the soil from aboveground litterfall by 9.0 %, BNPPby 9.7 %, ANPP by10.2 %, RH by 9.4 %, NEP by9.1 %, and NBP by 10.1 % relative to the presentclimate conditions. Water limitation appears to be themain driver of the decrease of different magnitudes inNEP patterns of the study region except in northernhighland regions where evapotranspiration rates arenot the main limiting factor. As far as uncertainty asso-ciated with the regional C model projections is con-cerned, the implications of using the latest IPCC AR5climate scenarios including improvements inrepresenting clouds and radiative forcings, and land-
Environ Monit Assess (2015) 187:179 Page 13 of 16 179
atmosphere feedbacks that will be approved andadopted towards the end of 2014 need to be exploredfor regionally modeled C flux simulations in the futurestudies. Likewise, satellite-observed canopy NDVI andfPAR data under future climate conditions should beused in the future studies since vegetation structure,and canopy cover are responsive to climate change.
Acknowledgments We are grateful to the Scientific and Tech-nological Research Council (TUBITAK) of Turkey (TOVAG-JPN-04-103O011), and Research Institute for Humanity and Na-ture of Japan (RIHN) for funding this research project. We wouldlike to thank valuable comments of two anonymous reviewerswhich significantly improved an earlier version of the manuscript.
Conflict of interest The authors declare that they have no con-flict of interest.
References
Aires, L., Pio, C., & Pereira, J. (2008). Carbon dioxide exchangeabove a Mediterranean C3/C4 grassland during two climato-logically contrasting years.Global Change Biology, 14, 539–555.
Allard, V., Ourcival, J. M., Rambal, S., Joffre, R., & Rocheteau, A.(2008). Seasonal and annual variation of carbon exchange inan evergreenMediterranean forest in southern France.GlobalChange Biology, 14, 714–725.
Anthoni, P. M., Freibauer, A., Kolle, O., & Schulze, E. D. (2004).Winter wheat carbon exchange in Thuringia, Germany.Agricultural and Forest Meteorology, 121, 55–67.
Asner, G. P., Archer, S., & Hughes, R. F. (2003). Net changes inregional woody vegetation cover and carbon storage in Texasdrylands, 1937–1999. Global Change Biology, 9, 316–335.
Aubinet, M., Moureaux, C., Bodson, B., Dufranne, D., Heinesch,B., Suleau, M., et al. (2009). Carbon sequestration by a cropover a 4-year sugar beet/winter wheat/seed potato/winterwheat rotation cycle. Agricultural and Forest Meteorology,149, 407–418.
Barford, C. C., Wofsy, S. C., Goulden, M. L., Munger, J. W., Pyle,E. H., Urbanski, S. P., et al. (2001). Factors controlling long-and short-term sequestration of atmospheric CO2 in a mid-latitude forest. Science, 294, 1688–1691.
Chen, M., & Zhuang, Q. (2014). Evaluating aerosol direct radia-tive effects on global terrestrial ecosystem carbon dynamicsfrom 2003 to 2010. Tellus, B66, 21808.
Chen, Z., Yu, G., Ge, J., Sun, X., Hirano, T., Saigusa, N., et al.(2013). Temperature and precipitation control of the spatialvariation of terrestrial ecosystem carbon exchange in theAsian region. Agricultural and Forest Meteorology, 182–183, 266–276.
Chun-Jiang, L., Ilvesniemi, H., Berg, B., Kutsch, W., Yu-Sheng,Y., Xiang-Qing, M., et al. (2003). Aboveground litterfall inEurasian forests. Journal of Forestry Research, 14, 27–34.
Ciais, P., Wattenbach, M., Vuichard, N., Smith, P., Piao, S.L., Don, A., et al. (2010). The European carbon bal-ance. part 2: croplands. Global Change Biology, 16,1409–1428.
Dash, J., & Curran, P. J. (2006). Relationship between herbicideconcentration during the 1960s and 1970s and the contem-porary MERIS terrestrial chlorophyll index (MTCI) forsouthern Vietnam. International Journal of GeographicalInformation Science, 20, 929–939.
Donmez, C., Berberoglu, S., Erdogan, M. A., Tanriover, A. A., &Cilek, A. (2015). Response of the regression tree model tohigh resolution remote sensing data for predicting percenttree cover in a Mediterranean ecosystem. EnvironmentalMonitoring & Assessment, 187, 4 (in press).
Eswaran, H., Berberoglu, S., Cangir, C., Boyraz, D., Zucca, C.,Ozevren, E., et al. (2011). The anthroscape approach insustainable land use, sustainable land management: learn-ing from the past for the future. New York: Springer.
Evrendilek, F. (2014). Modeling net ecosystem CO2 exchangeusing temporal neural networks after wavelet denoising.Geographical Analysis, 46, 37–52.
Evrendilek, F., & Wali, M. K. (2004). Changing global climate:historical carbon and nitrogen budgets and projected re-sponses of Ohio’s cropland ecosystems. Ecosystems, 7,381–392.
Evrendilek, F., Berberoglu, S., Taskinsu-Meydan, S., &Yilmaz, E.(2006). Quantifying carbon budgets of conifer Mediterraneanforest ecosystems, Turkey. Environmental Monitoring &Assessment, 119, 527–543.
Falge, E., Baldocchi, D., Tenhunen, J., Aubinet, M., Bakwin, P.,Berbigier, P., et al. (2002). Seasonality of ecosystem respira-tion and gross primary production as derived fromFLUXNET measurements. Agricultural and ForestMeteorology, 113, 53–74.
Field, C. B., Randerson, J. T., &Malmstrom, C.M. (1995). Globalnet primary production: combining ecology and remote sens-ing. Remote Sensing of Environment, 51, 74–88.
Gervois, S., Ciais, P., Noblet-Ducoudre, N., Brisson, N.,Vuichard, N., & Viovy, N. (2008). The carbon andwater balance of European croplands throughout the20th century. Global Biogeochemical Cycles, 22,GB2022.
Giardina, C. P., Ryan, M. G., Binkley, D., & Fownes, J. H. (2003).Primary production and carbon allocation in relation to nu-trient supply in a tropical experimental forest.Global ChangeBiology, 9, 1438–1450.
Goetz, S. J., Prince, S. D., Goward, N. S., Thawley, M. M., &Small, J. (1999). Satellite remote sensing of primary produc-tion: an improved production efficiency modeling approach.Ecological Modeling, 122, 239–255.
Grant, R. F., Baldocchi, D. D., & Ma, S. (2012). Ecologicalcontrols on net ecosystem productivity of a seasonally dryannual grassland under current and future climates: model-ling with Ecosys. Agricultural and Forest Meteorology, 152,189–200.
Haberl, H., Erb, K. H., Krausmann, F., Gaube, V.,Bondeau, A., Plutzar, C., et al. (2007). Quantifyingand mapping the human appropriation of net primaryproduct ion in Ear th ’s te r res t r ia l ecosys tems.Proceedings of the National Academy of Sciences ofthe United States of America, 104, 12942–12945.
179 Page 14 of 16 Environ Monit Assess (2015) 187:179
Haxeltine, A., & Prentice, I. C. (1996). BIOME3: an equilibriumbiosphere model based on ecophysiological constraints, re-source availability and competition among plant functionaltypes. Global Biogeochemical Cycles, 10, 693–709.
Helsel, D. R., & Hirsch, R.M. (1992). Statistical methods in waterresources. Amsterdam: Elsevier.
Hickler, T., Smith, B., Sykes, M. T., Davis, M., Sugita, S., &Walker, K. (2004). Using a generalized vegetation model tosimulate vegetation dynamics in northeastern USA. Ecology,85, 519–530.
Hollinger, D. Y., Aber, J., Dail, B., Davidson, E. A., Goltz, S. M.,Hughes, H., et al. (2004). Spatial and temporal variability inforest-atmosphere CO2 exchange. Global Change Biology,10, 1689–1706.
IPCC. (2000). Special report on emissions scenarios. Cambridge:Cambridge University Press.
Janssens, I. A., Freibauer, A., Ciais, P., Smith, P., Nabuurs, G. J.,Folberth, G., et al. (2003). Europe’s terrestrial biosphereabsorbs 7 to 12 % of European anthropogenic CO2 emis-sions. Science, 300, 1538–1542.
Jian-Bing, W., Du-Ning, X., Xing-Yi, Z., Xiu-Zhen, L., & Xiao-Yu, L. (2006). Spatial variability of soil organic carbon inrelation to environmental factors of a typical small watershedin the Black Soil region, Northeast China. EnvironmentalMonitoring & Assessment, 121, 597–613.
Kennedy, R. E., Townsend, P. A., Gross, J. E., Cohen, W. B.,Bolstad, P., Wang, Y. Q., et al. (2009). Remote sensingchange detection tools for natural resource managers: under-standing concepts and tradeoffs in the design of landscapemonitoring projects. Remote Sensing of Environment, 113,1382–1396.
Kimura, F., Kitoh, A., Sumi, A., Asanuma, J., & Yatagai, A.(2007). Downscaling of the global warming projections toTurkey. The Final Report of ICCAP (Impact of ClimateChanges on Agricultural Production System in Arid Areas),Research Institute for Humanity and Nature.
Kirschbaum, M. U. F. (1995). The temperature dependence of soilorganic matter decomposition and the effect of globalwarming on soil organic carbon storage. Soil Biology &Biochemistry, 27, 753–760.
Knapp, A. K., Burns, C. E., Fynn, R. W., Kirkman, K. P.,Morris, C. D., & Smith, M. D. (2006). Convergenceand contingency in production–precipitation relation-ships in North American and South African C4 grass-lands. Oecologia, 149, 456–464.
Knorr, W., & Heimann, M. (1995). Impact of drought stress andother factors on seasonal land biosphere CO2 exchange stud-ied through an atmospheric tracer transport model. Tellus, 47,471–489.
Krinner, G., Viovy, N., de Noblet-Ducoudré, N., Ogée, J., Polcher,J., Friedlingstein, P., et al. (2005). A dynamic global vegeta-tion model for studies of the coupled atmosphere-biospheresystem. Global Biogeochemical Cycles, 19, GB1015.
Lieth, H., & Whittaker, R. (1975). Primary productivity of thebiosphere. New York: Springer.
Lobell, D. B., Hicke, J. A., Asner, G. P., Field, C. B., Tucker, C. J.,& Los, S. O. (2002). Satellite estimates of productivity andlight use efficiency in United States agriculture, 1982–1998.Global Change Biology, 8, 722–735.
Luyssaert, S., Inglima, I., Jung, M., Richardson, A. D.,Reichsteins, M., Papale, D., et al. (2007). CO2 balance of
boreal, temperate, and tropical forests derived from a globaldatabase. Global Change Biology, 13, 2509–2537.
Luyssaert, S., Ciais, P., Piao, S. L., Schulze, E.-D., Jung, M.,Zaehle, S., et al. (2010). The European carbon balance. Part3: forests. Global Change Biology, 16, 1429–1450.
Ma, S., Baldocchi, D. D., Xu, L., & Hehn, T. (2007). Inter-annualvariability in carbon dioxide exchange of an oak/grass savan-na and open grassland in California. Agricultural and ForestMeteorology, 147, 157–171.
Matala, J., Kellomäki, S., & Nuutinen, T. (2008). Litterfall inrelation to volume growth of trees: analysis based on litera-ture. Scandinavian Journal of Forest Research, 23, 194–202.
McGuire, A. D., Sitch, S., Clein, J. S., Dargaville, R., Esser, G.,Foley, J., et al. (2001). Carbon balance of the terrestrialbiosphere in the twentieth century: analyses of CO2, climateand land-use effects with four process-based ecosystemmodels. Global Biogeochemical Cycles, 15, 183–206.
Miglietta, F., & Peressotti, A. (1999). Summer drought reducescarbon fluxes in Mediterranean forest. Global ChangeNewsletter, 39, 15–16.
Nemani, R., Hashimoto, H., Votava, P., Melton, F., Wang, W.,Michaelis, A., et al. (2009). Monitoring and forecasting eco-system dynamics using the terrestrial observation and predic-tion system (TOPS). Remote Sensing of Environment, 113,1497–1509.
Nunes, L., Lopes, D., Castro, R. F., & Gower, S. T. (2013).Aboveground biomass and net primary production of pine,oak and mixed pine–oak forests on the Vila Real district,Portugal. Forest Ecology & Management, 305, 38–47.
Pandey, D., Agrawal, M., & Pandey, J. S. (2011). Carbon foot-print: current methods of estimation. EnvironmentalMonitoring & Assessment, 178, 135–160.
Parton, W. J., Scurlock, J. M. O., & Ojima, D. S. (1993).Observations and modeling of biomass and soil organicmatter dynamics for the grassland biome worldwide.Global Biogeochemical Cycles, 7, 785–809.
Peichl, M., Sonnentag, O., Wohlfahrt, G., Flanagan, L. B.,Baldocchi, D. D., Kiely, G., et al. (2013). Convergence ofpotential net ecosystem production among contrasting C3grasslands. Ecology Letters, 16, 502–512.
Pereira, J. S., Mateus, J. A., Aires, L.M., Pita, G., Pio, C., David, J.S., et al. (2007). Net ecosystem carbon exchange in threecontrasting Mediterranean ecosystems—the effect ofdrought. Biogeosciences, 4, 1–12.
Potter, C. S., Randerson, J. T., Field, C. B., Matson, P. A.,Vitousek, P. M., Mooney, H. A., et al. (1993). Terrestrialecosystem production: a process model based on globalsatellite and surface data. Global Biogeochemical Cycles, 7,811–841.
Potter, C. S., Klooster, S., Myneni, R., Genovese, V., Tan, P. N., &Kumar, V. (2003). Continental-scale comparisons of terres-trial carbon sinks estimated from satellite data and ecosystemmodeling 1982–1998. Global and Planetary Change, 39,201–213.
Powell, H. L., Gholz, K. L., Clark, G., Starr, W. P., Cropper, J. R.,& Martin, T. A. (2008). Carbon exchange of a mature,naturally regenerated pine forest in North Florida. GlobalChange Biology, 14, 2523–2538.
Prince, S. D., & Goward, S. N. (1995). Global net primary pro-duction: a remote sensing approach. Journal ofBiogeography, 22, 815–835.
Environ Monit Assess (2015) 187:179 Page 15 of 16 179
Raich, J. W., & Nadelhoffer, K. J. (1989). Belowground carbonallocation in forest ecosystems: global trends. Ecology, 70,1346–1354.
Raich, J. W., & Schlesinger, W. H. (1992). The global carbondioxide flux in soil respiration and its relationship to vegeta-tion and climate. Tellus, B44, 81–99.
Ruimy, A., Saugier, B., & Dedieu, G. (1994). Methodology for theestimation of terrestrial net primary production from remotelysensed data. Journal of Geophysical Research, 99,5263–5283.
Ruimy, A., Dedieu, G., & Saugier, B. (1996). TURC: a diagnosticmodel of continental gross primary productivity and netprimary productivity. Global Biogeochemical Cycles, 10,269–286.
Running, S. W., Baldocchi, D. D., Turner, D. P., Gower, S. T.,Bakwin, P. S., & Hibbard, K. A. (1999). A global terrestrialmonitoring network integrating tower fluxes, flask sampling,ecosystem modeling and EOS satellite data. Remote Sensingof Environment, 70, 108–127.
Running, S., Ramakrishna, R., Nemani, F., Heinsch, A.,Maosheng, Z., Reeves, M., et al. (2004). A continuoussatellite-derivedmeasure of global terrestrial primary produc-tion. BioScience, 54, 547–560.
Schimel, D. S., House, J. I., Hibbard, K. A., Bousquet, P., Ciais, P.,Peylin, P., et al. (2001). Recent patterns and mechanisms ofcarbon exchange by terrestrial ecosystems. Nature,414, 169–172.
Schnell, S., Altrell, D., Stahl, G., & Kleinn, C. (2014). Thecontribution of trees outside forests to national tree biomassand carbon stocks—a comparative study across three conti-nents. Environmental Monitoring & Assessment, 187, 4197.
Schowalter, T. D., Hargrove, W. W., & Crossley, D. A. (1986).Herbivory in forested ecosystems. Annual Review ofEntomology, 31, 177–196.
Schulze, E. D., Ciais, P., Luyssaert, S., Schrumpf, M., Janssens, I.A., Thiruchittampalam, B., et al. (2010). The European car-bon balance: part 4: integration of carbon and other trace-gasfluxes. Global Change Biology, 16, 1451–1469.
Sellers, P. J., Randall, D. A., & Collatz, G. J. (1996). A revisedland surface parameterization (SiB2) for atmospheric GCMs:part I: model formulation. Journal of Climate, 9, 676–705.
Sitch, S., Smith, B., Prentice, I. C., Arneth, A., Bondeau, A.,Cramer, W., et al. (2003). Evaluation of ecosystem dynamics,plant geography and terrestrial carbon cycling in the LPJdynamic global vegetation model. Global Change Biology,9, 161–185.
Soussana, J. F., Allard, V., Pilegaard, K., Ambus, P., Amman, C.,Campbell, C., et al. (2007). Full accounting of the greenhousegas (CO2, N2O, CH4) budget of nine European grasslandsites. Agriculture, Ecosystems & Environment, 121,121–134.
Suttie, J. M., Reynolds, S. G., & Batello, C. (2005).Grasslands ofthe world. FAO Plant Production and Protection Series, FAO.
Wali, M. K., Evrendilek, F., West, T., Watts, S., Pant, D., Gibbs,H., et al. (1999). Assessing terrestrial ecosystem sustainabil-ity: usefulness of regional carbon and nitrogen models.Nature & Resources, 35, 20–33.
Wang, W., & Fang, J. (2009). Soil respiration and human effectson global grasslands. Global and Planetary Change,67, 20–28.
Wang, X., Liu, L., Piao, S., Janssens, I. A., Tang, J., Liu, W., et al.(2014). Soil respiration under climate warming: differentialresponse of heterotrophic and autotrophic respiration.GlobalChange Biology, 20, 3229–3237.
Weiss, M., Baret, F., Pavageau, K., Béal, D., Berthelot, B., &Regner, P. (2006). Top of canopy land products(TOA_VEG). Contract ESA AO/1-4233/02/I-LG.
White, A. M., Thornton, P. E., Running, S. W., & Nemani, R. R.(2000). Parameterization and sensitivity analysis of theBIOME-BGC terrestrial ecosystem model: net primary pro-duction controls. Earth Interactions, 4, 85.
Woodward, F. I., Smith, T. M., & Emanuel, W. R. (1995). A globalland primary productivity and phytogeography model.Global Biogeochemical Cycles, 9(471), 490.
Zaehle, S., Sitch, S., Prentice, I. C., Liski, J., Cramer, W., Erhard,M., et al. (2006). The importance of age-related decline inforest NPP for modeling regional carbon balances.Ecological Applications, 16, 1555–1574.
Zhao, M., Heinsch, F. A., Nemani, R. R., & Running, S. W.(2005). Improvements of the MODIS terrestrial gross andnet primary production global data set. Remote Sensing ofEnvironment, 95, 164–176.
179 Page 16 of 16 Environ Monit Assess (2015) 187:179
Related Documents