Journal of Chromatography A, 811 (1998) 1–34 Review Coupling of column liquid chromatography and Fourier transform infrared spectrometry * G.W. Somsen , C. Gooijer, N.H. Velthorst, U.A.Th. Brinkman Department of General and Analytical Chemistry, Vrije Universiteit, De Boelelaan 1083, 1081 HV Amsterdam, The Netherlands Received 22 December 1997; received in revised form 7 April 1998; accepted 7 April 1998 Abstract This paper provides an extensive overview of the literature on the coupling of column liquid chromatography (LC) and Fourier transform infrared spectrometry (FT-IR). Flow-cell-based FT-IR detection and early solvent-elimination interfaces for LC–FT-IR are discussed in brief. A comprehensive description is given of interface systems which use spraying to induce rapid eluent evaporation, and which essentially represent the state-of-the-art in LC–FT-IR. Fundamental aspects of FT-IR detection of deposited compounds are considered with special attention to the use of FT-IR microscopy. Finally, the interface systems suitable for reversed-phase LC are summarized and evaluated. The overview shows that solvent- elimination techniques can provide good sensitivity and enhanced spectral quality, and suggests that LC–FT-IR may well become a widely applicable technique for the unambiguous identification of trace-level sample constituents. 1998 Elsevier Science B.V. All rights reserved. Keywords: Reviews; Fourier transform infrared spectrometry; Infrared spectrometry; Liquid chromatography–Fourier transform infrared spectrometry; Detection, LC; Interfaces, LC–FT-IR; Instrumentation Contents 1. Introduction ............................................................................................................................................................................ 2 2. Flow cell LC–FT-IR ............................................................................................................................................................... 3 3. Early solvent-elimination interfaces .......................................................................................................................................... 5 4. Spray-type interfaces ............................................................................................................................................................... 8 4.1. Thermospray interface ..................................................................................................................................................... 8 4.2. Particle beam interface .................................................................................................................................................... 10 4.3. Electrospray interface ...................................................................................................................................................... 12 4.4. Pneumatic nebulizers....................................................................................................................................................... 14 4.5. Ultrasonic nebulizers ....................................................................................................................................................... 19 5. FT-IR detection of deposited compounds .................................................................................................................................. 20 5.1. Substrates and IR modes.................................................................................................................................................. 22 5.1.1. Diffuse reflectance .............................................................................................................................................. 22 * Corresponding author. Corresponding address: Department of Analytical Chemistry and Toxicology, University of Groningen, Antonius Deusinglaan 1, 9713 AV Groningen, Netherlands. 0021-9673 / 98 / $19.00 1998 Elsevier Science B.V. All rights reserved. PII: S0021-9673(98)00291-X

Welcome message from author
This document is posted to help you gain knowledge. Please leave a comment to let me know what you think about it! Share it to your friends and learn new things together.
Transcript
Journal of Chromatography A, 811 (1998) 1–34
Review
Coupling of column liquid chromatography and Fourier transforminfrared spectrometry
*G.W. Somsen , C. Gooijer, N.H. Velthorst, U.A.Th. BrinkmanDepartment of General and Analytical Chemistry, Vrije Universiteit, De Boelelaan 1083, 1081 HV Amsterdam, The Netherlands
Received 22 December 1997; received in revised form 7 April 1998; accepted 7 April 1998
Abstract
This paper provides an extensive overview of the literature on the coupling of column liquid chromatography (LC) andFourier transform infrared spectrometry (FT-IR). Flow-cell-based FT-IR detection and early solvent-elimination interfacesfor LC–FT-IR are discussed in brief. A comprehensive description is given of interface systems which use spraying toinduce rapid eluent evaporation, and which essentially represent the state-of-the-art in LC–FT-IR. Fundamental aspects ofFT-IR detection of deposited compounds are considered with special attention to the use of FT-IR microscopy. Finally, theinterface systems suitable for reversed-phase LC are summarized and evaluated. The overview shows that solvent-elimination techniques can provide good sensitivity and enhanced spectral quality, and suggests that LC–FT-IR may wellbecome a widely applicable technique for the unambiguous identification of trace-level sample constituents. 1998Elsevier Science B.V. All rights reserved.
Keywords: Reviews; Fourier transform infrared spectrometry; Infrared spectrometry; Liquid chromatography–Fouriertransform infrared spectrometry; Detection, LC; Interfaces, LC–FT-IR; Instrumentation
Contents
1. Introduction ............................................................................................................................................................................ 22. Flow cell LC–FT-IR ............................................................................................................................................................... 33. Early solvent-elimination interfaces .......................................................................................................................................... 54. Spray-type interfaces ............................................................................................................................................................... 8
4.1. Thermospray interface..................................................................................................................................................... 84.2. Particle beam interface .................................................................................................................................................... 104.3. Electrospray interface...................................................................................................................................................... 124.4. Pneumatic nebulizers....................................................................................................................................................... 144.5. Ultrasonic nebulizers....................................................................................................................................................... 19
5. FT-IR detection of deposited compounds .................................................................................................................................. 205.1. Substrates and IR modes.................................................................................................................................................. 22
5.1.1. Diffuse reflectance .............................................................................................................................................. 22
*Corresponding author. Corresponding address: Department of Analytical Chemistry and Toxicology, University of Groningen, AntoniusDeusinglaan 1, 9713 AV Groningen, Netherlands.
0021-9673/98/$19.00 1998 Elsevier Science B.V. All rights reserved.PI I : S0021-9673( 98 )00291-X
2 G.W. Somsen et al. / J. Chromatogr. A 811 (1998) 1 –34
5.1.2. Reflection–absorption.......................................................................................................................................... 225.1.3. IR transmission ................................................................................................................................................... 22
5.2. Analyte morphology........................................................................................................................................................ 235.3. Microscopic FT-IR detection ........................................................................................................................................... 24
5.3.1. Absorbance and spot size ..................................................................................................................................... 265.3.2. S /N ratio and spot size ........................................................................................................................................ 265.3.3. Improvement of S /N ratio .................................................................................................................................... 275.3.4. Optimum detection.............................................................................................................................................. 27
6. Conclusions ............................................................................................................................................................................ 286.1. Spray and deposition characteristics ................................................................................................................................. 286.2. Flow-rate and water content of the eluent ......................................................................................................................... 296.3. Gradient elution .............................................................................................................................................................. 306.4. Use of buffers ................................................................................................................................................................. 306.5. Analyte detectability ....................................................................................................................................................... 306.6. Spectral quality............................................................................................................................................................... 316.7. Applicability................................................................................................................................................................... 31
References .................................................................................................................................................................................. 32
1. Introduction the combination of gas chromatography (GC) andFT-IR is a well established technique and various
Most organic compounds have a large number of systems are commercially available. Three essential-relatively narrow absorption bands in the mid-in- ly different types of GC–FT-IR interfaces can befrared (IR) spectral region. These absorptions are distinguished [2]. In the most commonly used set-up,highly specific and can give detailed structural the GC column effluent flows through a heatedinformation about a particular compound. By itself, light-pipe and vapour-phase spectra are collected inthe entire IR spectrum of an organic compound real time at 1-s intervals. Light-pipe-based systemsprovides a unique fingerprint, which can be readily are instrumentally simple, but due to the shortdistinguished from the absorption patterns of other residence time in the flow cell components should becompounds. This means that when reference spectra present in the 10–100 ng range for useful spectra toare available, most compounds can be unambiguous- be generated. This inherent sensitivity limitation hasly identified on the basis of their IR spectra. These been addressed by the use of interfaces in which thefeatures make IR spectrometry a potentially strong chromatogram is stored on a low-temperature sub-technique for the characterization of chromatograph- strate prior to IR detection. One type of storageic peaks. However, compared with UV–visible ab- interface involves the use of matrix isolation spec-sorbance, extinction coefficients in IR are rather low, trometry. Each GC peak is trapped in an argonand the analyte concentration needed for IR detection matrix which is condensed on a continuously rotatedtherefore often is large with respect to the con- metallic substrate held at 13 K. After the separationcentration usually injected into a gas or liquid is complete, the argon track is rotated into the IRchromatograph. Furthermore, the direct coupling of a beam and reflection–absorption measurements arechromatographic instrument and an IR spectrometer made. Identifiable spectra can be recorded for sub-nggenerally requires the construction of special flow amounts of analytes. In the alternative ‘‘cryo-trap-cells or the development of suitable interfaces. ping’’ interface, the compounds separated by GC are
IR detection in chromatography became feasible in directly deposited on a liquid-nitrogen-cooled IR-the 1970s with the introduction of the Fourier transparent window which moves through an IRtransform (FT) technique [1]. Compared with disper- beam which is focused by microscope optics. The IRsive spectrometers, FT-IR instruments show an en- transmission of the window is measured continuous-hanced sensitivity and a complete IR spectrum can ly so that the analyte spectra are obtained withinbe recorded within 1 s. The latter feature enables IR seconds after deposition. Minimum identifiable quan-detection to be performed in an on-line mode. Today, tities of about 100 pg have been reported using this
G.W. Somsen et al. / J. Chromatogr. A 811 (1998) 1 –34 3
technique [3]. The latter method has been combined the LC eluent is continuously monitored, and spec-with on-line solid-phase extraction (SPE) for the tral data are collected on the fly and stored through-IR-based identification of constituents present in out the entire chromatographic run. During or afteraqueous samples at the sub-mg/ l level [4]. the run the spectra and/or IR chromatogram are
Compared with GC–FT-IR, the development of computed, and absorption due to the eluent iscoupled column liquid chromatography–FT-IR (LC– subtracted. Band broadening caused by detection isFT-IR) has proceeded much slower, and its viability easily minimized in a flow cell design.has even been questioned [5,6]. However, progress Unfortunately, the invariably significant absorp-in interfacing techniques during the past 5–10 years tion of the incident IR radiation by the LC eluenthas brought LC–FT-IR to a stage of real analytical leads to serious limitations of the flow cell approach.utility and the first commercial interfaces were Firstly, analyte absorption bands may be completelyintroduced [7,8]. In the earliest combinations of LC obscured by the most intense eluent absorptions. Inand FT-IR [9,10], flow cells were used in a fashion other words, in flow cell LC–FT-IR the spectralanalogous to LC with on-line UV absorption de- information that can be obtained is limited andtection. In 1979, interfacing difficulties related to the depends on the window provided by the eluent used.IR absorptions of the eluent prompted Kuehl and Ill-considered subtraction of strong solvent bandsGriffiths [11] to develop the first useful solvent- may even lead to the erroneous conclusion that thereelimination based LC–FT-IR system in which the is no absorption of the analyte in the correspondingeluent is evaporated prior to IR detection. Since then spectral regions. Secondly, gradient elution cannot betwo approaches can be discerned in LC–FT-IR, viz., applied because accurate spectral subtraction isthe flow-cell (or on-line) approach and the solvent- virtually impossible when the composition of theelimination (or semi on-line) approach. In the latter eluent is changing. Thirdly, the signal-to-noise ratiocase, an interface is used which effects evaporation is reduced at any wavelength where solvent absorp-of the eluent and deposition of the analytes on a tion is appreciable. Finally, the path length of thesubstrate suitable for IR detection. In the contempor- flow cell has to be limited in order to ensure thatary practice of LC–FT-IR both approaches are sufficient energy reaches the detector. For organicapplied, but since the flow-cell procedure cannot get solvents the path length rarely exceeds 0.5 mmaround the limitations posed by the presence of the which, bearing in mind Beer’s law, seriously reduceseluent, it has developed into a special-purpose meth- analyte detectability. For aqueous eluents the largestod with restricted applicability. Solvent-elimination tolerable path length is even much shorter, i.e., abouttechniques have shown to be much more versatile 30 mm, which implies that a practical combination ofand to yield interference-free spectral information for reversed-phase (RP) LC and FT-IR via a flow cell isconsiderably smaller amounts of analytes. In other quite unrealistic. Another drawback of flow cellwords, if the objective of LC–FT-IR is the un- measurements is that the use of signal averaging,ambiguous identification of low-level constituents of which can be exploited to improve the signal-to-complex mixtures, semi on-line coupling obviously noise ratio, is limited due to the short analysis timeis ‘‘the way to go’’. available under dynamic conditions.
To clarify the rationale of semi on-line LC–FT-IR, In order to minimize the problems associated withthe general characteristics of flow-cell LC–FT-IR eluent absorption, the choice of solvents in flow cellwill be discussed in the next section; further details LC–FT-IR is generally limited to chlorinated alkanescan be found in several review papers [12–15]. or deuterated solvents. These solvents leave rela-
tively wide windows in the spectrum, although eventhese inevitably obscure part of the spectral finger-
212. Flow cell LC–FT-IR print region (1200–700 cm ). The use of a smallpercentage of a more polar solvent in the eluent, as is
The simplest way to couple LC and FT-IR is to let quite common in normal-phase LC, may alreadythe column effluent pass directly through a flow cell prohibit effective detection. Due to the small opticalwith IR-transparent windows. The IR transmission of path length, the absolute detection limits in on-line
4 G.W. Somsen et al. / J. Chromatogr. A 811 (1998) 1 –34
LC–FT-IR are in the (high) mg range, which fre- the FT-IR spectrometer is used as a selective andquently implies that analyte concentrations of 1–10 quantitative detector which monitors one analyte-g / l have to be injected to obtain identifiable spectra. specific absorption band. This means that, like inOn the one hand, such high analyte levels may lead SEC, the choice of carrier solvent is less demanding:to column overload – on the other, they are not the solvent should not spectrally interfere with thefrequently encountered in real-life samples. marker band of the analyte. In flow cell FIA–FT-IR
Despite the described limitations and restrictions, interesting improvements in both analyte detectabili-flow cell LC–FT-IR has been and still is applied as a ty and compatibility with aqueous samples have beensimple and low-cost method to obtain structural accomplished by Garrigues and co-workersinformation about major constituents of mixtures [21,22,30], who applied on-line solid-phase extrac-[12,13]. In recent years, research in on-line FT-IR tion (SPE). Large volumes (100–500 ml) of waterdetection was mainly confined to size-exclusion containing the pesticide carbaryl were preconcen-chromatography (SEC) [16–19] and flow-injection trated on an SPE cartridge containing C -modified18
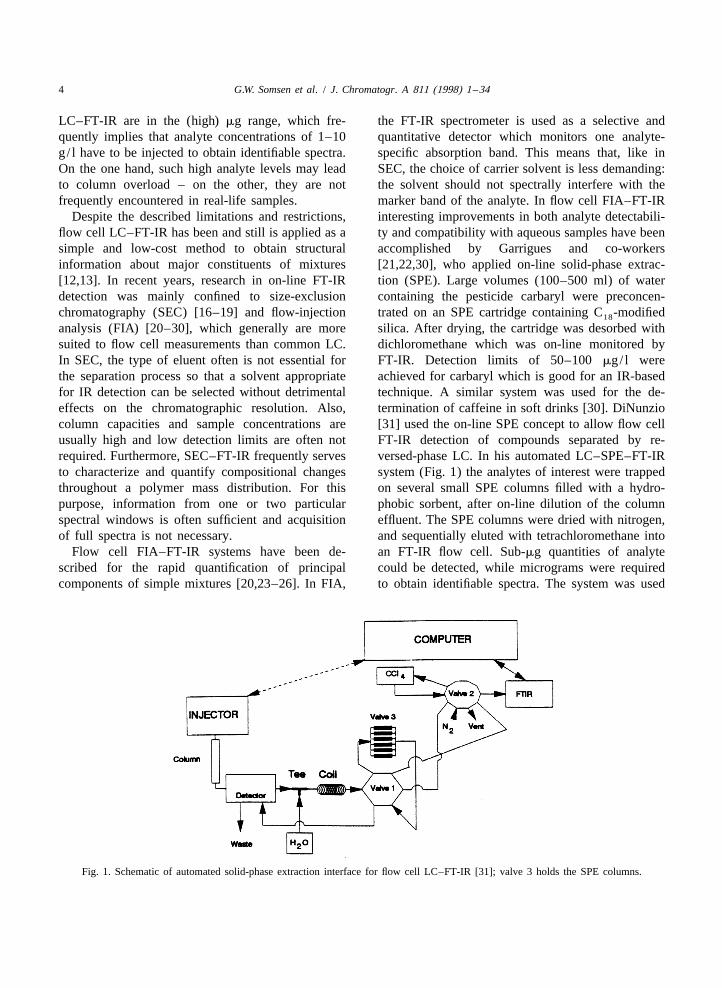
analysis (FIA) [20–30], which generally are more silica. After drying, the cartridge was desorbed withsuited to flow cell measurements than common LC. dichloromethane which was on-line monitored byIn SEC, the type of eluent often is not essential for FT-IR. Detection limits of 50–100 mg/ l werethe separation process so that a solvent appropriate achieved for carbaryl which is good for an IR-basedfor IR detection can be selected without detrimental technique. A similar system was used for the de-effects on the chromatographic resolution. Also, termination of caffeine in soft drinks [30]. DiNunziocolumn capacities and sample concentrations are [31] used the on-line SPE concept to allow flow cellusually high and low detection limits are often not FT-IR detection of compounds separated by re-required. Furthermore, SEC–FT-IR frequently serves versed-phase LC. In his automated LC–SPE–FT-IRto characterize and quantify compositional changes system (Fig. 1) the analytes of interest were trappedthroughout a polymer mass distribution. For this on several small SPE columns filled with a hydro-purpose, information from one or two particular phobic sorbent, after on-line dilution of the columnspectral windows is often sufficient and acquisition effluent. The SPE columns were dried with nitrogen,of full spectra is not necessary. and sequentially eluted with tetrachloromethane into
Flow cell FIA–FT-IR systems have been de- an FT-IR flow cell. Sub-mg quantities of analytescribed for the rapid quantification of principal could be detected, while micrograms were requiredcomponents of simple mixtures [20,23–26]. In FIA, to obtain identifiable spectra. The system was used
Fig. 1. Schematic of automated solid-phase extraction interface for flow cell LC–FT-IR [31]; valve 3 holds the SPE columns.
G.W. Somsen et al. / J. Chromatogr. A 811 (1998) 1 –34 5
for the characterization of isomers and degradation analysis (DRIFT). The concentrated effluent wasproducts in pharmaceutical samples. deposited (ca. 3 drops per cup) on the KCl surface
As has been outlined above, the major obstacle to and residual solvent was removed by passing nitro-the use of flow cell LC–FT-IR is the IR absorption gen gas through the cups. The carousel rotated theof the eluent. An elegant solution to this problem cups into the FT-IR spectrometer where pure, identi-would be the elimination of the eluent prior to the IR fiable spectra could be recorded for sub-mg amountsmeasurement of the analytes. This indirect approach of analyte. Since with this system aqueous eluentsinvolves the use of a solvent-evaporation interface could not be eliminated effectively and since water,that deposits the separated compounds on an IR- of course, is not compatible with the KCl substrate, acompatible substrate. Since the late 1970s, the semi modification was introduced to allow the use ofon-line coupling of LC and FT-IR has been pursued RPLC [35]. Prior to entering the concentrator tube,by several research groups, which designed a variety the aqueous effluent was on-line extracted withof interface concepts. These systems will be dis- dichloromethane. After on-line phase separation, thecussed in the next sections, with a cursory descrip- organic phase containing the extracted analytes wastion of the interfaces developed in an early stage. directed through the concentrator to the DRIFT
The principal goal of FT-IR detection in LC is the carousel. The results obtained did not differ essen-identification (not quantification) of unknown com- tially from those obtained for NPLC. Conroy et al.pounds. Therefore, throughout this paper the analyte [36] adopted the carousel-DRIFT method for usedetectability of the various LC–FT-IR systems will with narrow-bore NPLC by reducing the sample cupbe expressed as minimum identifiable mass and/or diameter from 4.5 to 2 mm. Because of the decreasedconcentration (injected). That is, identification limits flow-rate (20–50 ml /min), the concentrator could berather than detection limits will be given. Detection omitted and the LC effluent dropped directly into thelimits commonly are based on the most intense cups. Subsequent DRIFT analysis yielded identifica-absorption band only, while an IR-based identifica- tion limits in the 10–100 ng range.tion obviously requires several bands to be detected. Using a similar set-up, Kalasinsky et al. [37,38]According to the criterion formulated for residue coupled both narrow-bore NPLC and RPLC withanalysis, at least six well-defined bands should be DRIFT. The KCl deposition substrate was held eitherpresent in the IR spectrum in order to reliably in a ‘‘train’’ of compartments or in a continuousidentify a compound [32]. trough. Aqueous eluents could be used by on-line
conversion of the water into methanol and acetonevia a reaction with 2,29-dimethoxypropane (DMP)
3. Early solvent-elimination interfaces which was added post-column. To facilitate evapora-tion, the organic solvents were sprayed on the
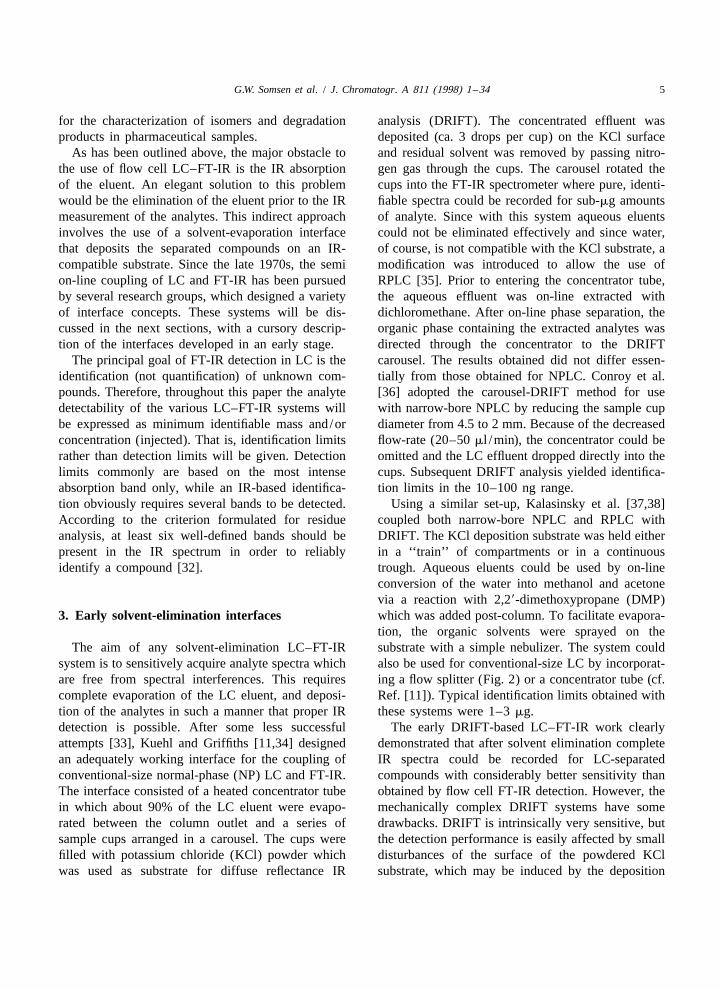
The aim of any solvent-elimination LC–FT-IR substrate with a simple nebulizer. The system couldsystem is to sensitively acquire analyte spectra which also be used for conventional-size LC by incorporat-are free from spectral interferences. This requires ing a flow splitter (Fig. 2) or a concentrator tube (cf.complete evaporation of the LC eluent, and deposi- Ref. [11]). Typical identification limits obtained withtion of the analytes in such a manner that proper IR these systems were 1–3 mg.detection is possible. After some less successful The early DRIFT-based LC–FT-IR work clearlyattempts [33], Kuehl and Griffiths [11,34] designed demonstrated that after solvent elimination completean adequately working interface for the coupling of IR spectra could be recorded for LC-separatedconventional-size normal-phase (NP) LC and FT-IR. compounds with considerably better sensitivity thanThe interface consisted of a heated concentrator tube obtained by flow cell FT-IR detection. However, thein which about 90% of the LC eluent were evapo- mechanically complex DRIFT systems have somerated between the column outlet and a series of drawbacks. DRIFT is intrinsically very sensitive, butsample cups arranged in a carousel. The cups were the detection performance is easily affected by smallfilled with potassium chloride (KCl) powder which disturbances of the surface of the powdered KClwas used as substrate for diffuse reflectance IR substrate, which may be induced by the deposition
6 G.W. Somsen et al. / J. Chromatogr. A 811 (1998) 1 –34
Fig. 2. Splitter-based LC–DRIFT system that uses 2,2-dimethoxypropane (DMP) for the handling of aqueous eluents [37,38].
process. KCl is very hygroscopic and the presence of XRF spectrometer, and moving it through the X-raywater can therefore cause a major spectral interfer- beam. In this way the metals could be selectivelyence. Furthermore, to avoid sample spreading, the detected. Finally the analyte spots were scraped offsubstrate has to be held in (many) discrete cups the plate and directly inserted in the ion source of awhich implies that the chromatogram is not continu- mass spectrometer which yielded characteristic elec-ously analysed but in fractions. The mandatory tron-impact spectra of the complexes.refilling of these cups after every chromatographic A modification of the buffer-memory interfacerun was later denoted as ‘‘excessively time-consum- involved the replacement of the linearly moving KBring’’ and ‘‘not acceptable’’ [39]. plate by a KBr disc that was rotated during deposi-
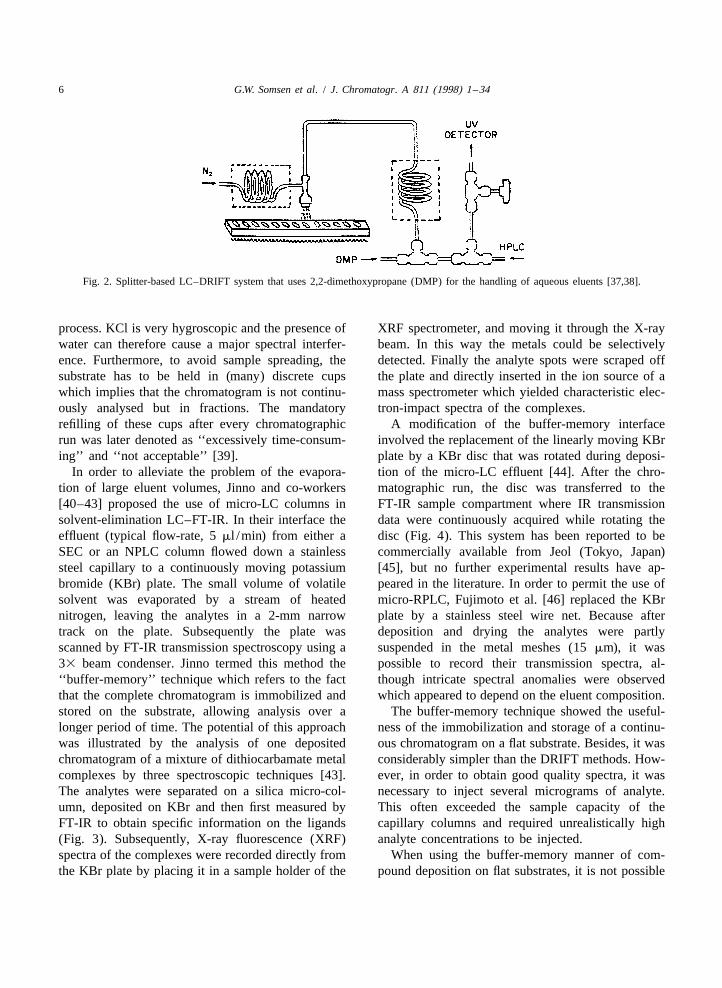
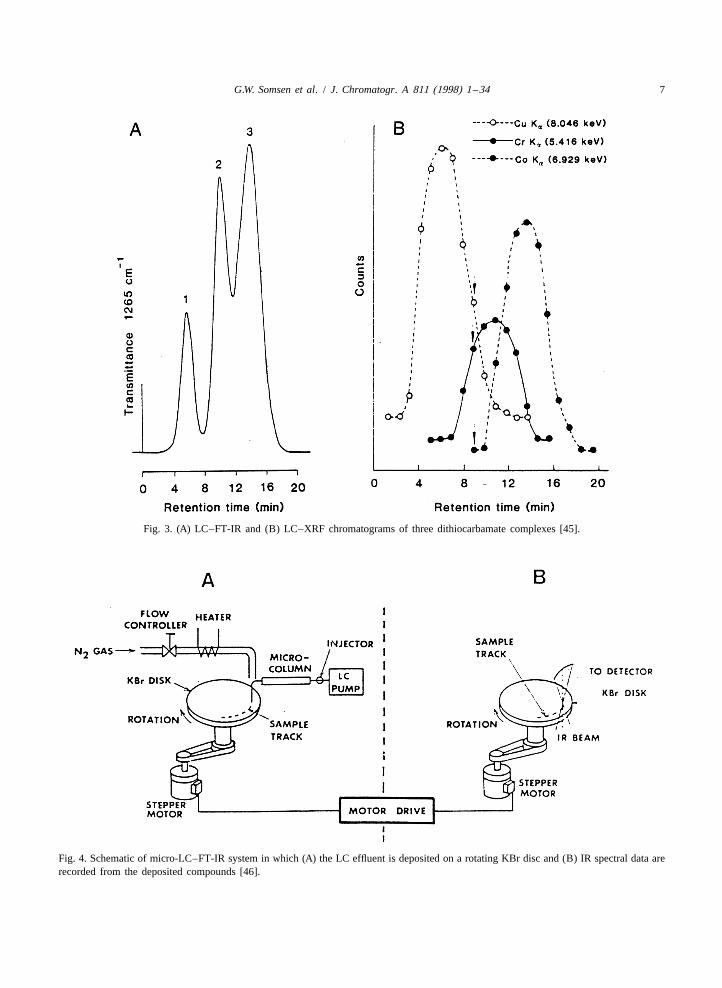
In order to alleviate the problem of the evapora- tion of the micro-LC effluent [44]. After the chro-tion of large eluent volumes, Jinno and co-workers matographic run, the disc was transferred to the[40–43] proposed the use of micro-LC columns in FT-IR sample compartment where IR transmissionsolvent-elimination LC–FT-IR. In their interface the data were continuously acquired while rotating theeffluent (typical flow-rate, 5 ml /min) from either a disc (Fig. 4). This system has been reported to beSEC or an NPLC column flowed down a stainless commercially available from Jeol (Tokyo, Japan)steel capillary to a continuously moving potassium [45], but no further experimental results have ap-bromide (KBr) plate. The small volume of volatile peared in the literature. In order to permit the use ofsolvent was evaporated by a stream of heated micro-RPLC, Fujimoto et al. [46] replaced the KBrnitrogen, leaving the analytes in a 2-mm narrow plate by a stainless steel wire net. Because aftertrack on the plate. Subsequently the plate was deposition and drying the analytes were partlyscanned by FT-IR transmission spectroscopy using a suspended in the metal meshes (15 mm), it was33 beam condenser. Jinno termed this method the possible to record their transmission spectra, al-‘‘buffer-memory’’ technique which refers to the fact though intricate spectral anomalies were observedthat the complete chromatogram is immobilized and which appeared to depend on the eluent composition.stored on the substrate, allowing analysis over a The buffer-memory technique showed the useful-longer period of time. The potential of this approach ness of the immobilization and storage of a continu-was illustrated by the analysis of one deposited ous chromatogram on a flat substrate. Besides, it waschromatogram of a mixture of dithiocarbamate metal considerably simpler than the DRIFT methods. How-complexes by three spectroscopic techniques [43]. ever, in order to obtain good quality spectra, it wasThe analytes were separated on a silica micro-col- necessary to inject several micrograms of analyte.umn, deposited on KBr and then first measured by This often exceeded the sample capacity of theFT-IR to obtain specific information on the ligands capillary columns and required unrealistically high(Fig. 3). Subsequently, X-ray fluorescence (XRF) analyte concentrations to be injected.spectra of the complexes were recorded directly from When using the buffer-memory manner of com-the KBr plate by placing it in a sample holder of the pound deposition on flat substrates, it is not possible
G.W. Somsen et al. / J. Chromatogr. A 811 (1998) 1 –34 7
Fig. 3. (A) LC–FT-IR and (B) LC–XRF chromatograms of three dithiocarbamate complexes [45].
Fig. 4. Schematic of micro-LC–FT-IR system in which (A) the LC effluent is deposited on a rotating KBr disc and (B) IR spectral data arerecorded from the deposited compounds [46].
8 G.W. Somsen et al. / J. Chromatogr. A 811 (1998) 1 –34
to eliminate organic or aqueous eluents at flow-rates applied method of solvent elimination and not onabove 5 ml /min without the compounds becoming history, LC column dimensions [12,13] or substratespread over too large an area of the substrate surface. used.To achieve a more viable coupling of LC and FT-IR,the use of solvent-elimination interfaces with en- 4.1. Thermospray interfacehanced evaporation power is essential. Ideally, theinterface should be able to almost instantaneously In the thermospray interface (TSP) the LC eluentevaporate the eluent, whether organic or aqueous, is led through a directly heated vaporizer tube. In theand to deposit the analytes as compact spots on a tube, part of the liquid evaporates to an expandingsubstrate that is easy to handle and clean, and can be vapour which causes nebulization of the remainingused repeatedly. Since in on-line LC–MS the sol- effluent; as a result, a mist of desolvating dropletsvent-elimination problem is similar, it is not surpris- emerges from the end of the tube. When using theing that several LC–MS interface concepts have TSP in LC–MS, up to 2 ml /min of aqueous solventsbeen applied to combine LC and FT-IR. At this can be introduced into the MS vacuum system. In thepoint, however, a marked difference between the TSP-based LC–FT-IR systems reported so far,operation of MS and FT-IR interfaces should be nebulization is performed at atmospheric pressure.noted. In an LC–MS interface the eluent is common- Still, if the deposition substrate is heated, eluently nebulized into a divergent plume of small droplets flow-rates of 0.5–1 ml /min can be used.in order to enhance solvent evaporation as much as In 1986, Griffiths and Conroy [47] reported pre-possible. In LC–FT-IR, however, next to eluent liminary results on the use of a TSP device forevaporation the interface also should provide com- RPLC–FT-IR, but the interface was not described inpound deposition into narrow spots, the latter aspect detail. A mixture of phenol and three substitutedbeing extremely important because it largely de- phenols was separated on a C -bonded silica col-18
termines the degree of extra band broadening and the umn with water–methanol (98:2, v /v) at 0.8 ml /minIR sensitivity that can be achieved. Needless to say, as eluent, and the analytes were deposited onthere is a distinct challenge in the simultaneous diamond powder via a TSP. KCl powder could notexecution of complete eluent evaporation and com- be used as DRIFT substrate; because the TSP did notpact analyte deposition. completely evaporate the eluent, the residual water
The solvent-elimination interfaces reported in the affected the KCl and obscured a large part of thelast decade all use some kind of spraying to induce analyte spectra. Heating of the diamond powderrapid eluent evaporation. As will be described in the allowed evaporation of the residual eluent, andnext section, LC–FT-IR systems have been de- satisfactory spectra of the three substituted phenolsveloped that are able to directly eliminate aqueous were obtained when mg amounts were injected.eluents and some of these allow IR detection of Phenol itself, however, could not be detected, proba-(sub-) ng amounts of analyte. bly because at the applied TSP temperature of ca.
1508C it evaporated together with the eluent. Im-proved analyte detectability was achieved by cou-
4. Spray-type interfaces pling the TSP to a narrow-bore LC column and usingaqueous eluents with 15% methanol at a flow-rate of
In the more recent LC–FT-IR systems, interfaces 20–50 ml /min [47]. With the earlier describedare used that break up the LC eluent stream into DRIFT carousel [36] with microcups filled withsmall droplets to facilitate solvent evaporation. Some diamond powder, identification limits of 10–20 ngdesigns incorporate existing (commercial) equip- (injected) were obtained for several substitutedment, while others have been built from scratch. phenols, but, again, phenol could not be detected.Hitherto, two of these interfaces have been adapted Jansen [48] used a TSP in combination with aby an instrument manufacturer and have appeared in moving-belt system to achieve FT-IR detection forthe marketplace [7,8]. The following classification of SEC and RPLC. With a laboratory-made TSP, thethe LC–FT-IR interfaces is primarily based on the SEC effluent was sprayed on a 13-mm wide stainless

G.W. Somsen et al. / J. Chromatogr. A 811 (1998) 1 –34 9
Fig. 5. Schematic of thermospray-moving belt interface for LC–FT-IR; 15moving stainless steel tape; 25thermospray interface;35infrared lamp; 45diffuse reflectance cell mounted in the sample compartment of the FT-IR spectrometer [48].
steel tape which moves through an adapted IR efficiently, but as much as 100 mg of each additivediffuse-reflectance accessory mounted in the sample had to be injected to obtain good quality spectra.compartment of the FT-IR spectrometer (Fig. 5). It The TSP-moving belt interface was also used bydoes not become clear from the paper whether pure Robertson et al. [49–51], mainly for RPLC–FT-IR.diffuse-reflectance spectra were acquired, which In a preliminary study [49] four amino acids wereseems unlikely, or reflection–absorption-type spec- separated using a purely aqueous eluent at 0.5 ml /tra. Most of the eluent was eliminated directly by the min. When operating the laboratory-made TSP atTSP and residual solvent, if any, was evaporated off 2808C, the integrity of the chromatographic sepa-the tape by an infrared lamp as the tape moved ration could be maintained during deposition, andtowards the spectrometer at a speed of 1.25 cm/min. identifiable IR-reflectance spectra of the analytesThe immobilized chromatogram was monitored con- were recorded. Next, the interface design was furthertinuously and solvent-interference-free spectra were optimized and the analyte–deposition efficiency andrecorded. The practicality of the system was demon- analytical potential were studied [50]. The TSPstrated by analysing several simple polymer samples temperature (range tested, 150–1908C) and the TSP(20–80 mg injected) by SEC–FT-IR with dichloro- height above the moving tape (5–25 mm) weremethane or tetrahydrofurane as eluent at a flow-rate optimized in order to obtain deposited spots thatof 0.5–1 ml /min. Some low-molecular-mass mono- matched the IR beam (ca. 2 mm) of the DRIFTmers were not deposited (and thus could not be accessory. In this way analyte identification could bedetected), because they were evaporated by the TSP. achieved down to concentrations of 50 mg/ml orThe characterization of two Irganox-type polymer about 2.5 mg injected. The system was used for theadditives which were separated by RPLC using an separation, detection and characterization of non-UV-eluent with 30% (v/v) water, was also shown. The absorbing compounds such as saccharides and ali-aqueous eluent (0.5 ml /min) could be handled phatic carboxylic acids. However, with saccharides
10 G.W. Somsen et al. / J. Chromatogr. A 811 (1998) 1 –34
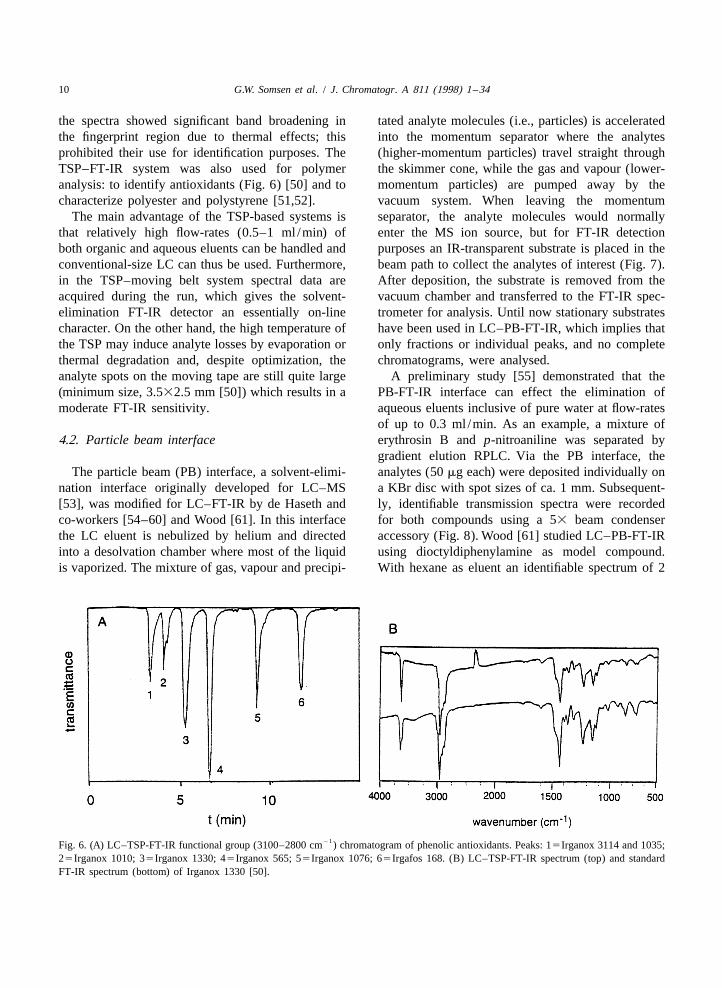
the spectra showed significant band broadening in tated analyte molecules (i.e., particles) is acceleratedthe fingerprint region due to thermal effects; this into the momentum separator where the analytesprohibited their use for identification purposes. The (higher-momentum particles) travel straight throughTSP–FT-IR system was also used for polymer the skimmer cone, while the gas and vapour (lower-analysis: to identify antioxidants (Fig. 6) [50] and to momentum particles) are pumped away by thecharacterize polyester and polystyrene [51,52]. vacuum system. When leaving the momentum
The main advantage of the TSP-based systems is separator, the analyte molecules would normallythat relatively high flow-rates (0.5–1 ml /min) of enter the MS ion source, but for FT-IR detectionboth organic and aqueous eluents can be handled and purposes an IR-transparent substrate is placed in theconventional-size LC can thus be used. Furthermore, beam path to collect the analytes of interest (Fig. 7).in the TSP–moving belt system spectral data are After deposition, the substrate is removed from theacquired during the run, which gives the solvent- vacuum chamber and transferred to the FT-IR spec-elimination FT-IR detector an essentially on-line trometer for analysis. Until now stationary substratescharacter. On the other hand, the high temperature of have been used in LC–PB-FT-IR, which implies thatthe TSP may induce analyte losses by evaporation or only fractions or individual peaks, and no completethermal degradation and, despite optimization, the chromatograms, were analysed.analyte spots on the moving tape are still quite large A preliminary study [55] demonstrated that the(minimum size, 3.532.5 mm [50]) which results in a PB-FT-IR interface can effect the elimination ofmoderate FT-IR sensitivity. aqueous eluents inclusive of pure water at flow-rates
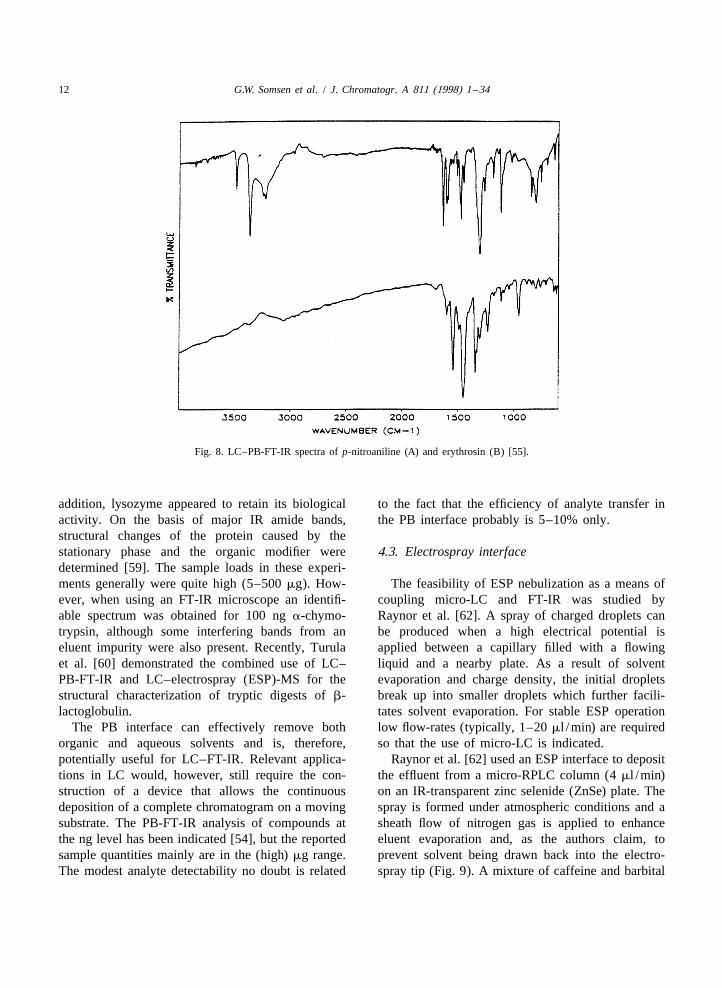
of up to 0.3 ml /min. As an example, a mixture of4.2. Particle beam interface erythrosin B and p-nitroaniline was separated by
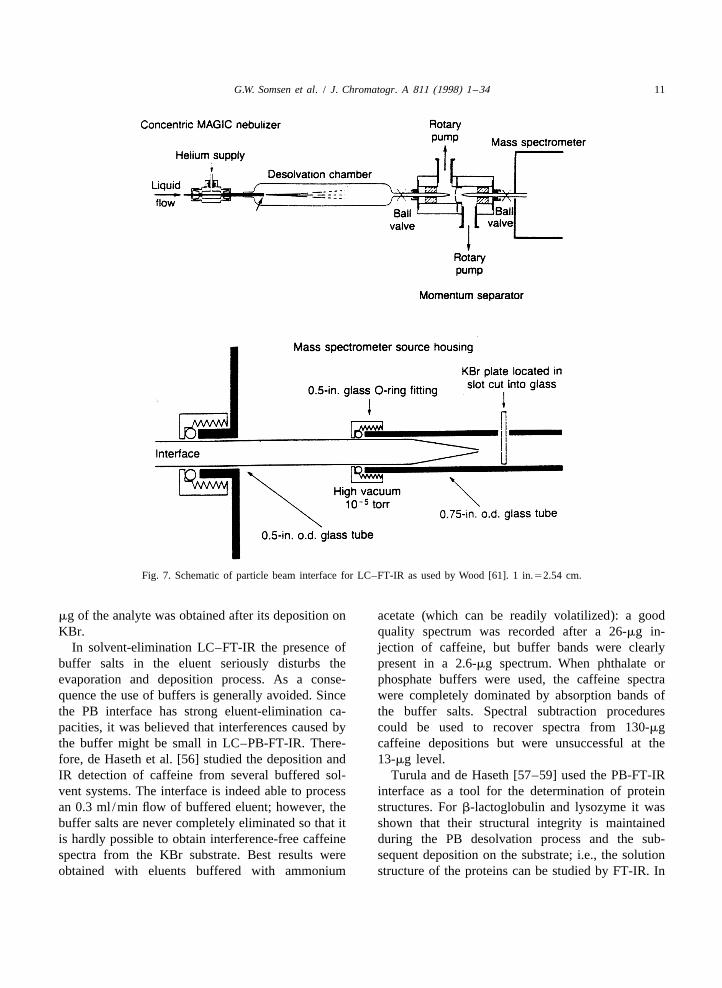
gradient elution RPLC. Via the PB interface, theThe particle beam (PB) interface, a solvent-elimi- analytes (50 mg each) were deposited individually on
nation interface originally developed for LC–MS a KBr disc with spot sizes of ca. 1 mm. Subsequent-[53], was modified for LC–FT-IR by de Haseth and ly, identifiable transmission spectra were recordedco-workers [54–60] and Wood [61]. In this interface for both compounds using a 53 beam condenserthe LC eluent is nebulized by helium and directed accessory (Fig. 8). Wood [61] studied LC–PB-FT-IRinto a desolvation chamber where most of the liquid using dioctyldiphenylamine as model compound.is vaporized. The mixture of gas, vapour and precipi- With hexane as eluent an identifiable spectrum of 2
21Fig. 6. (A) LC–TSP-FT-IR functional group (3100–2800 cm ) chromatogram of phenolic antioxidants. Peaks: 15Irganox 3114 and 1035;25Irganox 1010; 35Irganox 1330; 45Irganox 565; 55Irganox 1076; 65Irgafos 168. (B) LC–TSP-FT-IR spectrum (top) and standardFT-IR spectrum (bottom) of Irganox 1330 [50].
G.W. Somsen et al. / J. Chromatogr. A 811 (1998) 1 –34 11
Fig. 7. Schematic of particle beam interface for LC–FT-IR as used by Wood [61]. 1 in.52.54 cm.
mg of the analyte was obtained after its deposition on acetate (which can be readily volatilized): a goodKBr. quality spectrum was recorded after a 26-mg in-
In solvent-elimination LC–FT-IR the presence of jection of caffeine, but buffer bands were clearlybuffer salts in the eluent seriously disturbs the present in a 2.6-mg spectrum. When phthalate orevaporation and deposition process. As a conse- phosphate buffers were used, the caffeine spectraquence the use of buffers is generally avoided. Since were completely dominated by absorption bands ofthe PB interface has strong eluent-elimination ca- the buffer salts. Spectral subtraction procedurespacities, it was believed that interferences caused by could be used to recover spectra from 130-mgthe buffer might be small in LC–PB-FT-IR. There- caffeine depositions but were unsuccessful at thefore, de Haseth et al. [56] studied the deposition and 13-mg level.IR detection of caffeine from several buffered sol- Turula and de Haseth [57–59] used the PB-FT-IRvent systems. The interface is indeed able to process interface as a tool for the determination of proteinan 0.3 ml /min flow of buffered eluent; however, the structures. For b-lactoglobulin and lysozyme it wasbuffer salts are never completely eliminated so that it shown that their structural integrity is maintainedis hardly possible to obtain interference-free caffeine during the PB desolvation process and the sub-spectra from the KBr substrate. Best results were sequent deposition on the substrate; i.e., the solutionobtained with eluents buffered with ammonium structure of the proteins can be studied by FT-IR. In
12 G.W. Somsen et al. / J. Chromatogr. A 811 (1998) 1 –34
Fig. 8. LC–PB-FT-IR spectra of p-nitroaniline (A) and erythrosin (B) [55].
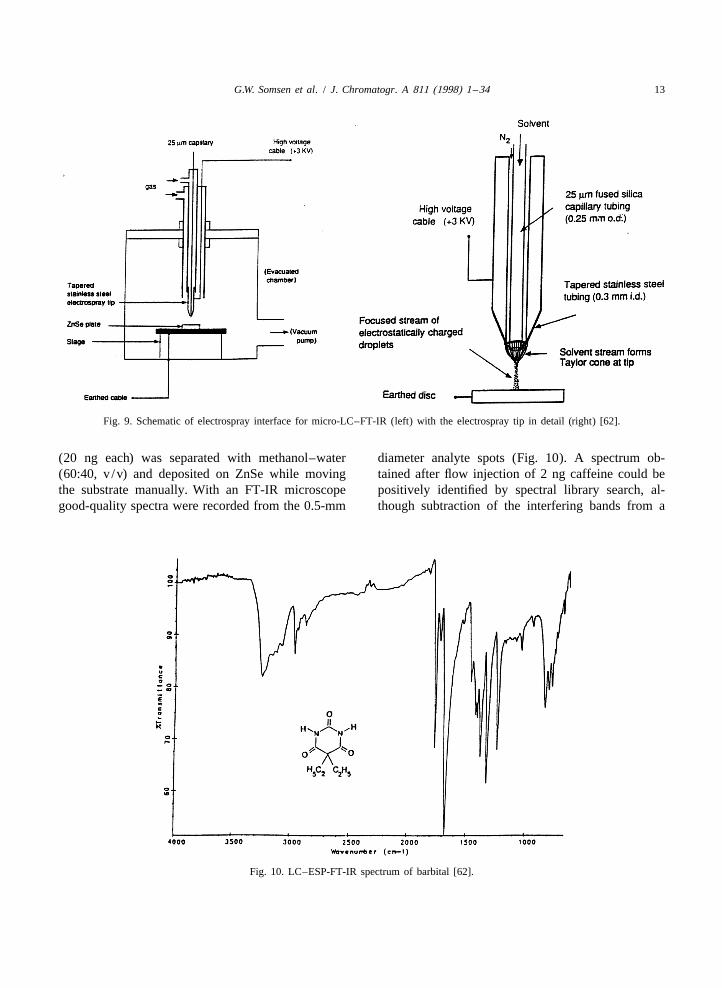
addition, lysozyme appeared to retain its biological to the fact that the efficiency of analyte transfer inactivity. On the basis of major IR amide bands, the PB interface probably is 5–10% only.structural changes of the protein caused by thestationary phase and the organic modifier were 4.3. Electrospray interfacedetermined [59]. The sample loads in these experi-ments generally were quite high (5–500 mg). How- The feasibility of ESP nebulization as a means ofever, when using an FT-IR microscope an identifi- coupling micro-LC and FT-IR was studied byable spectrum was obtained for 100 ng a-chymo- Raynor et al. [62]. A spray of charged droplets cantrypsin, although some interfering bands from an be produced when a high electrical potential iseluent impurity were also present. Recently, Turula applied between a capillary filled with a flowinget al. [60] demonstrated the combined use of LC– liquid and a nearby plate. As a result of solventPB-FT-IR and LC–electrospray (ESP)-MS for the evaporation and charge density, the initial dropletsstructural characterization of tryptic digests of b- break up into smaller droplets which further facili-lactoglobulin. tates solvent evaporation. For stable ESP operation
The PB interface can effectively remove both low flow-rates (typically, 1–20 ml /min) are requiredorganic and aqueous solvents and is, therefore, so that the use of micro-LC is indicated.potentially useful for LC–FT-IR. Relevant applica- Raynor et al. [62] used an ESP interface to deposittions in LC would, however, still require the con- the effluent from a micro-RPLC column (4 ml /min)struction of a device that allows the continuous on an IR-transparent zinc selenide (ZnSe) plate. Thedeposition of a complete chromatogram on a moving spray is formed under atmospheric conditions and asubstrate. The PB-FT-IR analysis of compounds at sheath flow of nitrogen gas is applied to enhancethe ng level has been indicated [54], but the reported eluent evaporation and, as the authors claim, tosample quantities mainly are in the (high) mg range. prevent solvent being drawn back into the electro-The modest analyte detectability no doubt is related spray tip (Fig. 9). A mixture of caffeine and barbital
G.W. Somsen et al. / J. Chromatogr. A 811 (1998) 1 –34 13
Fig. 9. Schematic of electrospray interface for micro-LC–FT-IR (left) with the electrospray tip in detail (right) [62].
(20 ng each) was separated with methanol–water diameter analyte spots (Fig. 10). A spectrum ob-(60:40, v /v) and deposited on ZnSe while moving tained after flow injection of 2 ng caffeine could bethe substrate manually. With an FT-IR microscope positively identified by spectral library search, al-good-quality spectra were recorded from the 0.5-mm though subtraction of the interfering bands from a
Fig. 10. LC–ESP-FT-IR spectrum of barbital [62].

14 G.W. Somsen et al. / J. Chromatogr. A 811 (1998) 1 –34
siliceous impurity was required. Stable ESP con- with 33 beam condensing optics. Reflection–absorp-ditions were achieved with hexane, dichloromethane, tion (R–A) spectra of the analytes are continuouslyacetonitrile, methanol and several aqueous solvents, recorded and an FT-IR chromatogram can be con-but problems were reported for pure water. Until structed. The performance of the system was testednow there have been no further studies on LC–ESP- with a mixture of polycyclic aromatic compoundsFT-IR. (PACs) (200–800 ng each) which were separated on
a 1-mm I.D. silica column with hexane–dichlorome-4.4. Pneumatic nebulizers thane (75:25, v /v) as eluent at 30 ml /min. The
separation was nicely maintained during depositionIn a pneumatic nebulizer a high-speed gas flow is and spectra of good intensity were obtained, al-
used to disrupt the liquid surface and to form small though some differences with conventional KBrdroplets which are dispersed by the gas. Organic transmission spectra were observed. The authorssolvents can be rapidly evaporated by pneumatic attributed the deviations primarily to the Christiansennebulization, while direct removal of aqueous sol- effect. The identification limit for anthracene wasvents is possible when the nebulizer gas is heated. 125 ng injected on the column.Pneumatic nebulization has been used in several In order to accomplish elimination of aqueoussolvent-elimination LC–FT-IR designs, among solvents, Gagel and Biemann [64] improved thewhich are the most successful so far. The PB nebulizer design. The syringe needle was placedinterface, which in principle is a pneumatic nebulizer inside a nozzle through which heated nitrogen gasas well, was discussed separately (Section 4.2) flowed at a temperature of 40–808C. The extrabecause the general design of this modified LC–MS nitrogen enhances solvent evaporation and focusesinterface is quite different from the custom-made the spray onto a 0.5–1.5 mm region. With this set-up,LC–FT-IR interfaces discussed in this section. eluents containing up to 55% water could be handled
Gagel and Biemann [63] reported a nebulizer- at 30 ml /min, and by programming the nitrogen gasbased LC–FT-IR method which involved continuous temperature gradient elution could also be performeddeposition of the effluent from a narrow-bore NPLC (Fig. 12). The RPLC separation and FT-IR identifi-column on a rotating IR-reflective disc. The effluent cation of a number of isomeric naphthalenediolswas mixed with nitrogen gas and led into a syringe (500 ng each) was demonstrated and an identificationneedle from which a fine spray emerged on to the limit of 31 ng (injected) was obtained for phenan-surface of an aluminium mirror which resulted in a threnequinone. The recorded R–A spectra showed1–2 mm wide deposition track (Fig. 11). The anomalies such as baseline curvature, distortions ofimmobilized chromatogram was analysed by rotating the bands on the high-frequency side and excessivethe disc in the sample compartment of an FT-IR broadening of the O–H stretch bands. These spectralspectrometer equipped with a reflectance accessory problems could be partially solved by replacing the
Fig. 11. Schematic of the narrow-bore LC–FT-IR system of Gagel and Biemann [63]; (A) side view during deposition; (B) top view ofcollection mirror.

G.W. Somsen et al. / J. Chromatogr. A 811 (1998) 1 –34 15
Fig. 12. LC–FT-IR chromatogram (Gram–Schmidt) recorded after deposition of a gradient elution separation of a mixture of (1) caffeine,(2) 2,7-dihydroxynaphthalene, (3) phenanthrenequinone, (4) carbazole, (5) anthrone, (6) 9-nitroanthracene and (7) anthracene [64].
original aluminium disc by a 2-mm thick IR-trans- bacterial agent, in toothpaste. Samples were sepa-parent germanium disc, the rear surface of which rated by conventional-size RPLC and 5% of thewas coated with (IR-reflective) aluminium [65]. The column effluent was immobilized on the disc. Theauthors claimed that the germanium layer prevents identification limit for triclosan was at the low-mginterference of the incident and reflected IR beam at level (on disc), i.e., 25–50 mg injected on-column.the disc surface, thus minimizing spectral degrading Lange et al. [71] constructed a simple but effectiveeffects. concentric flow nebulizer (CFN) for the coupling of
A commercially available LC–FT-IR interface narrow-bore LC and FT-IR. It consists of twobased on the pneumatic nebulizer design of Gagel concentric fused-silica capillaries. The LC columnand Biemann is produced by Lab Connections effluent is led through the inner capillary (50 mm(Marlborough, MA, USA) under the name LC I.D.3150 mm O.D.) and helium gas through theTransform (100 and 400 Series). The instrument outer capillary (1.7 mm I.D.) which is wrapped withconsists of a sample collection module for deposition heating wire [Fig. 13 (top)]. The hot gas serves toof the chromatogram and an optics module for R–A evaporate the solvent and to focus the spray emerg-analysis of the collection disc. So far the commercial ing from the inner tube. In a preliminary study [72]interface has been mainly applied in the field of this type of interface was used for NPLC withSEC–FT-IR [66–69]. The essentials of these poly- powdered KCl substrates, while in RPLC an IR-mer-composition characterization studies are summa- transparent ZnSe window was used. To enhance therized in Table 1. Jordan et al. [70] used the LC elimination of aqueous eluents, the CFN was placedTransform for the identification of triclosan, an anti- in a vacuum chamber [Fig. 13 (bottom)]. Finally,
16 G.W. Somsen et al. / J. Chromatogr. A 811 (1998) 1 –34
Table 1aUse of the LC transform series 100 interface for SEC–FT-IR
Sample Concentration Injection volume Eluent Flow-rate (ml /min) Ref.(mg/ml) (ml)
Column Interface
EP copolymer 3–5 0.2 TCB 0.5 0.15 [66]Polystyrene–PMMA 1–6 0.2 THF 1 0.07 [67]Styrene–butadiene rubber – – THF – – [68]PC–ABS; HIPS 1 0.15 THF – 0.1 [69]a Abbreviations: EP5ethylene–propylene; PMMA5poly(methyl methacrylate); PC–ABS5polycarbonate–acrylonitrile–butadiene–styrene;HIPS5high-impact polystyrene rubber; TCB5trichlorobenzene; THF5tetrahydrofuran; –5not stated.
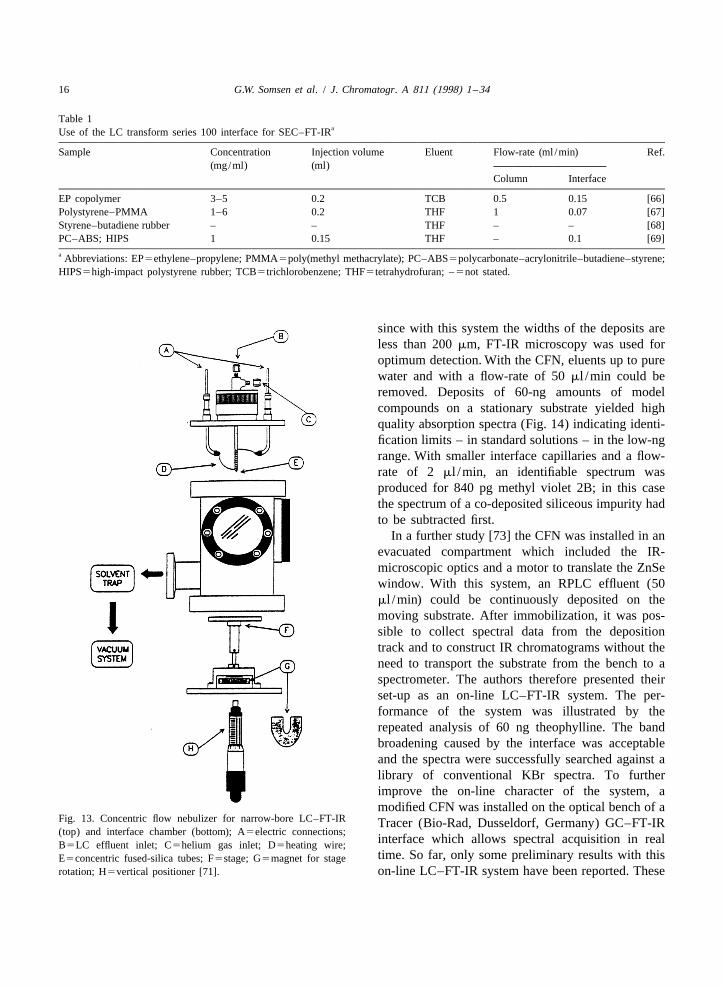
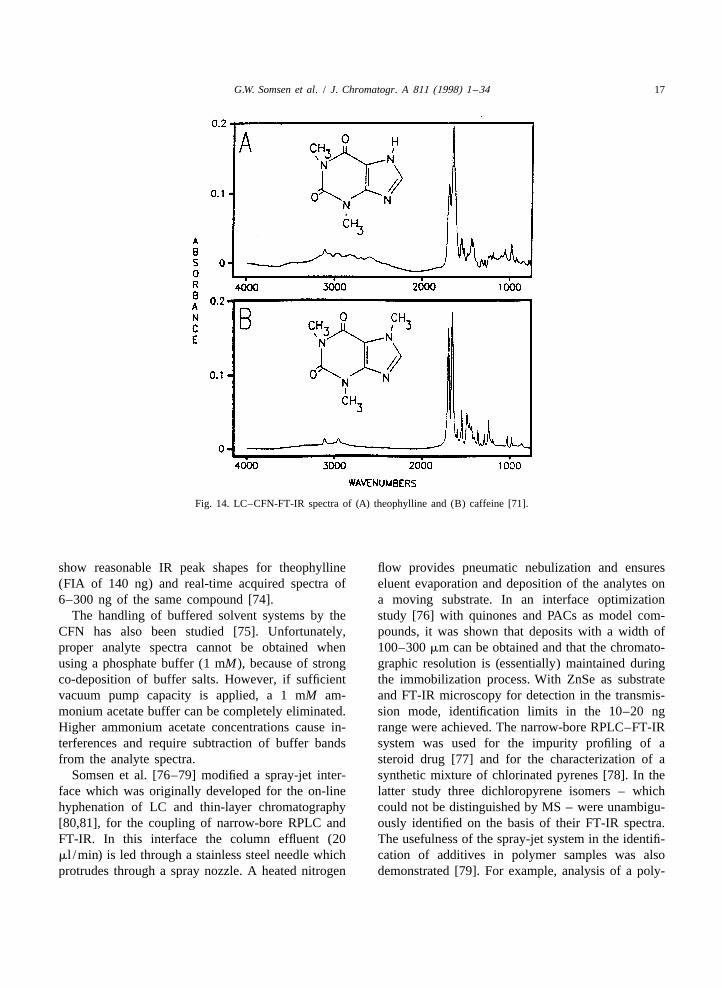
since with this system the widths of the deposits areless than 200 mm, FT-IR microscopy was used foroptimum detection. With the CFN, eluents up to purewater and with a flow-rate of 50 ml /min could beremoved. Deposits of 60-ng amounts of modelcompounds on a stationary substrate yielded highquality absorption spectra (Fig. 14) indicating identi-fication limits – in standard solutions – in the low-ngrange. With smaller interface capillaries and a flow-rate of 2 ml /min, an identifiable spectrum wasproduced for 840 pg methyl violet 2B; in this casethe spectrum of a co-deposited siliceous impurity hadto be subtracted first.
In a further study [73] the CFN was installed in anevacuated compartment which included the IR-microscopic optics and a motor to translate the ZnSewindow. With this system, an RPLC effluent (50ml /min) could be continuously deposited on themoving substrate. After immobilization, it was pos-sible to collect spectral data from the depositiontrack and to construct IR chromatograms without theneed to transport the substrate from the bench to aspectrometer. The authors therefore presented theirset-up as an on-line LC–FT-IR system. The per-formance of the system was illustrated by therepeated analysis of 60 ng theophylline. The bandbroadening caused by the interface was acceptableand the spectra were successfully searched against alibrary of conventional KBr spectra. To furtherimprove the on-line character of the system, amodified CFN was installed on the optical bench of a
Fig. 13. Concentric flow nebulizer for narrow-bore LC–FT-IR Tracer (Bio-Rad, Dusseldorf, Germany) GC–FT-IR(top) and interface chamber (bottom); A5electric connections;
interface which allows spectral acquisition in realB5LC effluent inlet; C5helium gas inlet; D5heating wire;time. So far, only some preliminary results with thisE5concentric fused-silica tubes; F5stage; G5magnet for stage
rotation; H5vertical positioner [71]. on-line LC–FT-IR system have been reported. These
G.W. Somsen et al. / J. Chromatogr. A 811 (1998) 1 –34 17
Fig. 14. LC–CFN-FT-IR spectra of (A) theophylline and (B) caffeine [71].
show reasonable IR peak shapes for theophylline flow provides pneumatic nebulization and ensures(FIA of 140 ng) and real-time acquired spectra of eluent evaporation and deposition of the analytes on6–300 ng of the same compound [74]. a moving substrate. In an interface optimization
The handling of buffered solvent systems by the study [76] with quinones and PACs as model com-CFN has also been studied [75]. Unfortunately, pounds, it was shown that deposits with a width ofproper analyte spectra cannot be obtained when 100–300 mm can be obtained and that the chromato-using a phosphate buffer (1 mM), because of strong graphic resolution is (essentially) maintained duringco-deposition of buffer salts. However, if sufficient the immobilization process. With ZnSe as substratevacuum pump capacity is applied, a 1 mM am- and FT-IR microscopy for detection in the transmis-monium acetate buffer can be completely eliminated. sion mode, identification limits in the 10–20 ngHigher ammonium acetate concentrations cause in- range were achieved. The narrow-bore RPLC–FT-IRterferences and require subtraction of buffer bands system was used for the impurity profiling of afrom the analyte spectra. steroid drug [77] and for the characterization of a
Somsen et al. [76–79] modified a spray-jet inter- synthetic mixture of chlorinated pyrenes [78]. In theface which was originally developed for the on-line latter study three dichloropyrene isomers – whichhyphenation of LC and thin-layer chromatography could not be distinguished by MS – were unambigu-[80,81], for the coupling of narrow-bore RPLC and ously identified on the basis of their FT-IR spectra.FT-IR. In this interface the column effluent (20 The usefulness of the spray-jet system in the identifi-ml /min) is led through a stainless steel needle which cation of additives in polymer samples was alsoprotrudes through a spray nozzle. A heated nitrogen demonstrated [79]. For example, analysis of a poly-
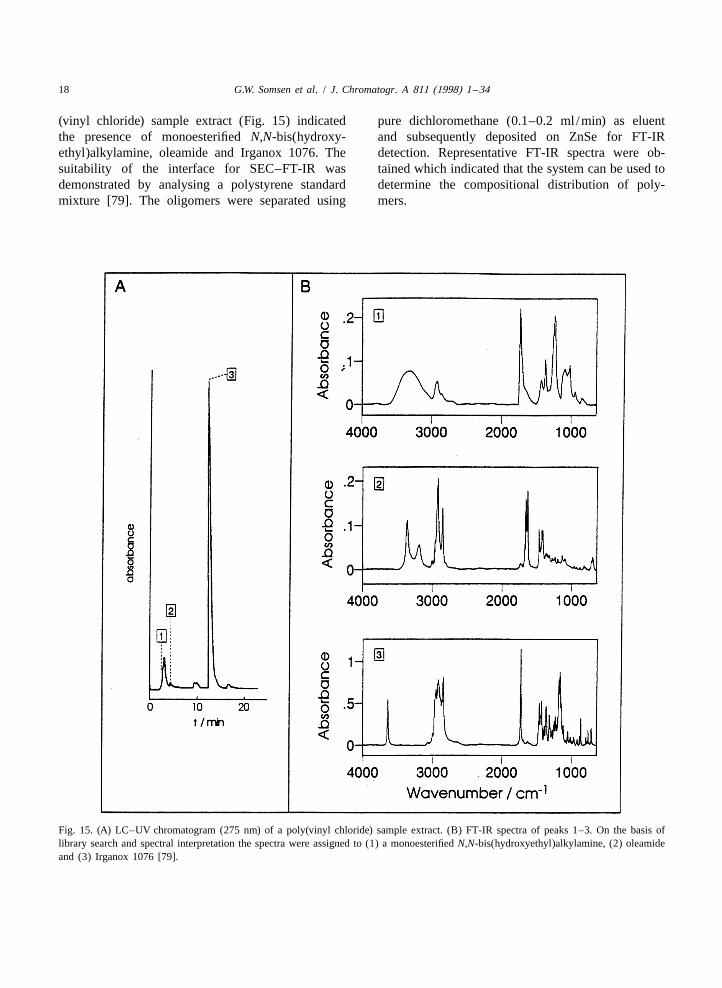
18 G.W. Somsen et al. / J. Chromatogr. A 811 (1998) 1 –34
(vinyl chloride) sample extract (Fig. 15) indicated pure dichloromethane (0.1–0.2 ml /min) as eluentthe presence of monoesterified N,N-bis(hydroxy- and subsequently deposited on ZnSe for FT-IRethyl)alkylamine, oleamide and Irganox 1076. The detection. Representative FT-IR spectra were ob-suitability of the interface for SEC–FT-IR was tained which indicated that the system can be used todemonstrated by analysing a polystyrene standard determine the compositional distribution of poly-mixture [79]. The oligomers were separated using mers.
Fig. 15. (A) LC–UV chromatogram (275 nm) of a poly(vinyl chloride) sample extract. (B) FT-IR spectra of peaks 1–3. On the basis oflibrary search and spectral interpretation the spectra were assigned to (1) a monoesterified N,N-bis(hydroxyethyl)alkylamine, (2) oleamideand (3) Irganox 1076 [79].
G.W. Somsen et al. / J. Chromatogr. A 811 (1998) 1 –34 19
When RPLC is applied, the spray-jet LC–FT-IR quality FT-IR chromatograms and analyte spectrasystem is limited with regard to the LC flow-rate were recorded at the low-mg/ l level (Fig. 17). When(20–30 ml /min), the water content of the eluent (up the sample volume was increased to 1.0 ml, theto 20%, v/v) and the handling of buffered eluents. In identification limits were improved to 10–160 mg/ l.order to take away these limitations, an on-lineliquid–liquid extraction (LLE) module consisting of 4.5. Ultrasonic nebulizersa phase segmentor, an extraction coil and a phaseseparator, was inserted between the LC column In an ultrasonic nebulizer a spray is formed byoutlet and the spray-jet interface [82]. Dichlorome- depositing the LC effluent on a transducer that isthane, which can be effectively eliminated by the vibrating at ultrasonic frequencies. The vibrationsinterface, was used as extraction solvent. The re- cause the solvent to break up into small, desolvatingsulting LC–LLE–FT-IR system can handle eluents droplets which are transported by a carrier gaswith high water percentages (20–100%, v/v) at towards a substrate. Such a system was used byflow-rates up to 0.2 ml /min so that 2-mm I.D. LC Castles et al. [86] to continuously deposit the effluentcolumns – a more common dimension in LC – can from a narrow-bore RPLC column on diamondbe used. Furthermore, the eluent may now contain powder held in a moving trough. After deposition thenon-volatile buffer salts which cannot be directly through was translated through the optics of aeliminated by an evaporation interface (cf. Sections DRIFT accessory. A two-component mixture was4.2 and 4.4). Since the salts are not extracted, analysed and FT-IR chromatograms were con-phosphate-buffered eluents (0.01 M) can be used structed. Spectra of satisfactory quality were ob-without causing interferences [82,83]. With large- tained for 3-mg injections, which indicates thatvolume injection, FT-IR detection of test compounds identification limits will be on the order of 1 mg. Insuch as phenylureas and quinones was achieved at some instances, the complete and direct evaporationthe sub-mg/ l level. The detectability of the analytes of the eluent by the ultrasonic nebulizer was notexpressed in concentration units, in the initial sam- achieved because the vibrating surface was notples, was further improved by incorporation of on- uniformly effective and occasionally large dropletsline SPE for analyte enrichment. It was demonstrated were formed which wetted the surface of the powder.that with SPE–LC–LLE–FT-IR triazine herbicides, Dekmezian and Morioka [87] developed an inter-including several isomers, can be identified at the face for high-temperature SEC–FT-IR; in order tolow-mg/ l level in river water (Fig. 16) [83]. enhance solvent evaporation, an ultrasonic nebulizer
In an alternative approach to improve the com- was incorporated [88]. The nebulizer, which ispatibility of the spray-jet interface with RPLC, the placed in a vacuum chamber, was used to spray theeluent flow-rate was reduced to 2 ml /min, i.e., SEC effluent on a fraction collector which holds a setmicro-LC was applied [84,85]. Under these con- of heated KBr discs. The discs were subsequentlyditions, complete evaporation of aqueous eluents analysed by conventional FT-IR transmission spec-could be achieved, but to obtain a useful spray, the trometry. With trichlorobenzene as SEC eluent, theaddition of excess make-up liquid (20 ml /min of system was applied to the determination of com-methanol) to the micro-LC effluent was necessary. positional changes of ethylene–propylene rubbersBecause of the surplus of methanol, the performance through changes of the molecular mass distribution.of the interface becomes essentially independent of A block polymer reaction product was also analysed.the water content of the eluent; that is, the system An interface comprising an ultrasonic nebulizer inallows the use of gradient elution. The inherently a vacuum chamber is used by Lab Connections inmoderate concentration sensitivity of micro-LC was their LC Transform 300 Series [7]. This commercialovercome by using a micro-pre-column for on-line device sprays the chromatographic effluent on atrace enrichment. The potential of the complete rotating germanium collection disc, which is thensystem was studied with triazines and pyrene as test evaluated by FT-IR using an R–A optics module (cf.compounds. With a 40-ml sample volume, good- Section 4.4). The system has been used for the
20 G.W. Somsen et al. / J. Chromatogr. A 811 (1998) 1 –34
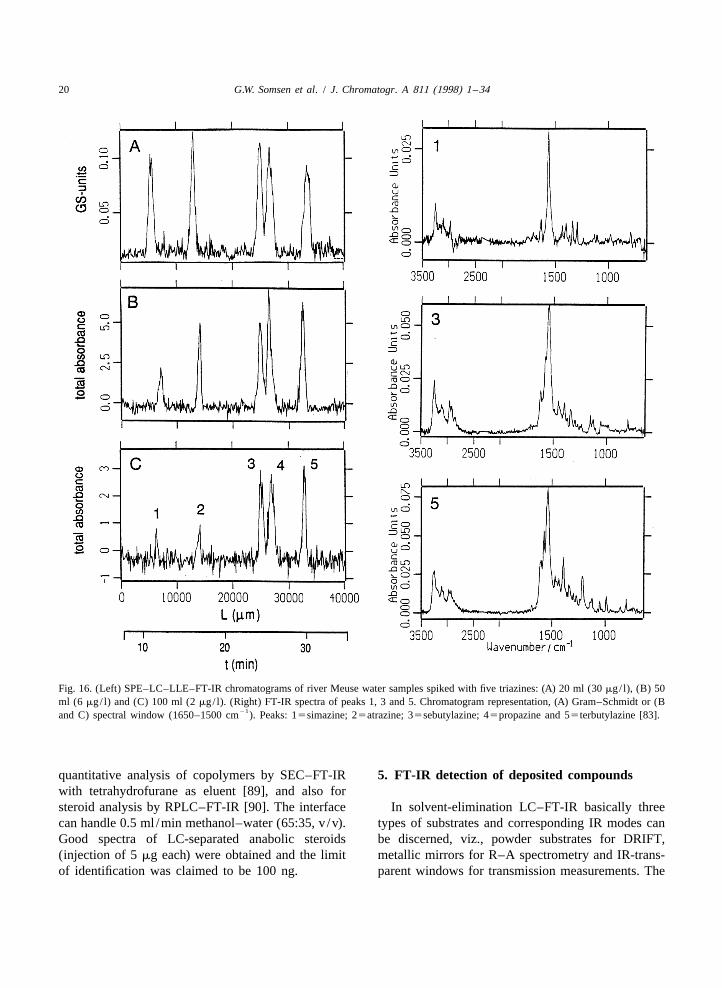
Fig. 16. (Left) SPE–LC–LLE–FT-IR chromatograms of river Meuse water samples spiked with five triazines: (A) 20 ml (30 mg/ l), (B) 50ml (6 mg/ l) and (C) 100 ml (2 mg/ l). (Right) FT-IR spectra of peaks 1, 3 and 5. Chromatogram representation, (A) Gram–Schmidt or (B
21and C) spectral window (1650–1500 cm ). Peaks: 15simazine; 25atrazine; 35sebutylazine; 45propazine and 55terbutylazine [83].
quantitative analysis of copolymers by SEC–FT-IR 5. FT-IR detection of deposited compoundswith tetrahydrofurane as eluent [89], and also forsteroid analysis by RPLC–FT-IR [90]. The interface In solvent-elimination LC–FT-IR basically threecan handle 0.5 ml /min methanol–water (65:35, v /v). types of substrates and corresponding IR modes canGood spectra of LC-separated anabolic steroids be discerned, viz., powder substrates for DRIFT,(injection of 5 mg each) were obtained and the limit metallic mirrors for R–A spectrometry and IR-trans-of identification was claimed to be 100 ng. parent windows for transmission measurements. The
G.W. Somsen et al. / J. Chromatogr. A 811 (1998) 1 –34 21
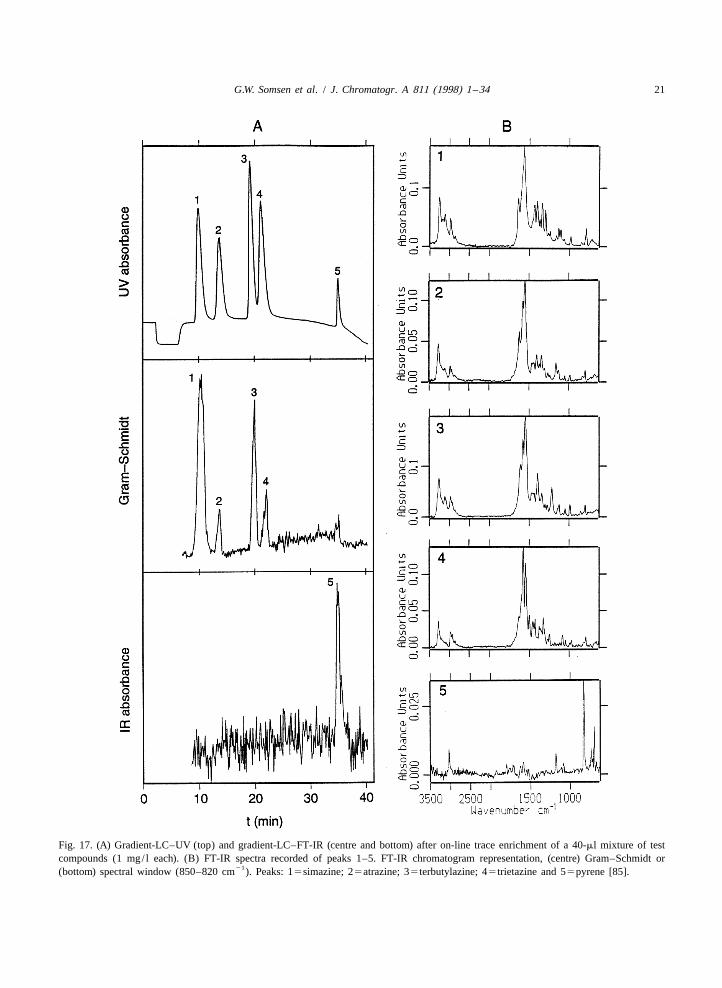
Fig. 17. (A) Gradient-LC–UV (top) and gradient-LC–FT-IR (centre and bottom) after on-line trace enrichment of a 40-ml mixture of testcompounds (1 mg/ l each). (B) FT-IR spectra recorded of peaks 1–5. FT-IR chromatogram representation, (centre) Gram–Schmidt or
21(bottom) spectral window (850–820 cm ). Peaks: 15simazine; 25atrazine; 35terbutylazine; 45trietazine and 55pyrene [85].
22 G.W. Somsen et al. / J. Chromatogr. A 811 (1998) 1 –34
analytical utility of these substrates is discussed in common DRIFT substrates such as KCl powderthe next section, followed by a brief description of cannot be used in combination with aqueous eluents.the influence of analyte morphology on spectral In view of the overriding importance of RPLC, thisquality. The usefulness of FT-IR microscopy for is a very serious restriction. To allow the use ofsensitive IR detection of deposited analytes will be aqueous solvents, some authors have used diamonddiscussed in Section 5.3. powder as DRIFT substrate, but it never has become
really popular, because it is expensive (and thus not5.1. Substrates and IR modes disposable) and not as easy to clean as flat substrates.
5.1.1. Diffuse reflectance 5.1.2. Reflection–absorptionDRIFT detection of analytes on KCl powder was Substrates suitable for FT-IR detection by R–A
used in early solvent-elimination LC–FT-IR designs such as front-surface aluminium mirrors, are compat-but as, in time, effective analyte deposition on flat ible with aqueous eluents and are easy to handle.and smooth substrates became feasible, other, more However, analyte deposition on this type of substrateconvenient detection modes were preferred. In the is not simple because solvent that hits the substrateearly interfaces, the eluent was not completely will easily spread over the hard and smooth reflectiveevaporated and a small part reached the substrate. surface. Therefore these substrates can only be usedKCl powders can tolerate some residual organic effectively in combination with an interface that hassolvent without the analytes being spread over a a strong solvent evaporation capacity like pneumaticlarge surface as would occur on a smooth substrate nebulizers. As far as spectroscopic aspects arelike a KBr plate. Because DRIFT as such is one of concerned, during the R–A measurement of a de-the most sensitive IR modes, sub-mg identification posited analyte spot, the IR beam travels through thelimits could be achieved when the residual solvent sample, reflects off the mirror surface and passeswas evaporated quickly from the powder. If the through the sample a second time on its way to theeluent is not removed rapidly (e.g., when it is not detector. The band intensities in the R–A spectrumhighly volatile), it can draw analyte away from the therefore will be largely governed by a double-passKCl powder surface into the substrate. As a conse- transmittance mechanism, so that data analogous toquence part of the sample will escape detection, transmission data are obtained. Useful R–A spectrabecause the effective penetration depth of a DRIFT have been recorded for compounds separated bymeasurement is not more than 100 mm. To overcome RPLC. However, several authors [63–65,76,92] havethis problem, Fraser et al. [72,91] successfully reported evidence of band asymmetry and spectralapplied diffuse transmittance spectrometry instead of distortions. Fuoco et al. [92] indicated that aspectsDRIFT, using a layer of KCl powder on an IR such as specular and diffuse reflection from thetransparent substrate. analyte, thickness and microcrystallinity of the spot,
The main limitations of DRIFT detection in LC– and optical characteristics of the substrate (may)FT-IR, however, only show up during application. affect the shape and intensity of R–A spectral bandsFirstly, in DRIFT factors such as sample homo- obtained from analytes on metallic substrates. Ingeneity, sample load and compactness of the powder order to reduce spectral distortions, Gagel andlayer, exert a significant influence on the (repro- Biemann [65] proposed the use of an IR-transparentducibility of the) spectral data. These factors are not germanium disc with a reflective backing as deposi-easy to control in LC–FT-IR. Secondly, to assure tion substrate for R–A measurements (see Sectionproper DRIFT detection, careful preparation of the 4.4). This type of disc is applied by Lab Connectionspowder substrate is a prerequisite; reorientation of in their commercially available LC–FT-IR inter-the DRIFT matrix as a result of sample deposition faces.may lead to a poor background compensation. Fillingof cups or trays with the powder substrate may be 5.1.3. IR transmissionvery time-consuming and tedious and has to be Until now, the most favourable results in LC–FT-repeated for every LC–FT-IR analysis. Finally, IR have been obtained with IR-transparent deposition
G.W. Somsen et al. / J. Chromatogr. A 811 (1998) 1 –34 23
substrates that allow straightforward transmission covering two herbicide classes (triazines and phenyl-measurements. In principle a number of materials ureas). Further study on this subject is indicated,such as barium fluoride, zinc sulphide and silicon is particularly because for the acceptance of FT-IR as auseful as substrate, but so far only KBr and ZnSe useful detection technique in LC, reliable (auto-windows have actually been applied. Since the LC mated) identification of spectra is extremely im-eluent is rarely eliminated completely before the portant.substrate is reached (deposition by the particle beam ZnSe windows and front-surface mirrors are rela-interface being the exception), KBr usually cannot be tively expensive and, therefore, the repeated use ofused in combination with RPLC. Instead, ZnSe is a one substrate is common practice in LC–FT-IR onwater-resistant, inert material and is transparent over flat substrates. In other words, the possibility to cleanpractically the complete mid-IR region. Since the substrates effectively between analyses is of impor-ZnSe surface is both smooth and hard, solvent tance. ZnSe is inert and deposited compounds can beelimination has to be fast to achieve proper analyte removed simply and quickly with e.g., water, al-deposition. From compounds deposited on ZnSe, cohol, acetone and/or a wetted piece of soft tissuegood-quality transmission spectra can be recorded paper. The cleaning of aluminium mirrors is morewhich exhibit symmetrical band profiles. In a com- delicate: the thin metal layer is fragile and can beparative study on deposition substrates, Fuoco et al. damaged easily by rubbing. When the available[92] found that, when the size of the sample spot is substrate surface is used efficiently, several chro-small and microscopic optics are used for measure- matograms can be deposited on a single substratement, the sensitivity of transmission spectrometry is and the cleaning frequency can be minimized. Thehigher than that of diffuse reflectance measurements. capacity of the substrate depends on its size and theThe authors also concluded that the use of flat width of the deposition trace. With optimum solvent-IR-transparent windows for transmission measure- elimination interfaces narrow spot widths are ob-ments causes fewer spectral artifacts than the use of tained and in principle the chromatograms can beflat metallic substrates for R–A measurements. This collected in parallel lines, spaced 1–2 mm apart.observation was experimentally confirmed by Som- Using a typical 60330 mm substrate, this impliessen et al. [76] who used a ZnSe window and an that 14–29 lines (representing a total chromatograph-aluminium mirror as deposition substrate. ic time of 6–13 h) can be stored before the substrate
As has been demonstrated in many studies has to be cleaned again.[62,71,73,75–79,82,83], spectra obtained by solvent-elimination LC–FT-IR on ZnSe, generally closely 5.2. Analyte morphologyresemble conventional KBr disc transmission spec-tra. This is very important, because existing spectral The quality and appearance of the LC–FT-IRlibraries can then be used for identification purposes. spectra will also be influenced by the morphology ofCommonly, commercially available library pro- the deposited analytes. The characteristics of thegrammes are used to automatedly and quickly retri- deposits will primarily depend on parameters such aseve reference spectra that match or resemble the eluent composition, evaporation rate, temperatureanalyte spectra recorded on ZnSe. So far in LC–FT- and nature of the substrate and the analytes. DuringIR, the choice of search algorithms for spectral solvent elimination some compounds will form niceretrieval has been quite arbitrary, and various algo- crystals while others will deposit as an amorphousrithms have been used. However, in a study on the layer. For instance, the decanyl and undecanyl estersLC–FT-IR analysis of herbicides in river water, of testosterone exhibit ‘‘amorphous’’ spectraSomsen et al. [83] showed that the performance of (broadened bands) after deposition on ZnSe [77].such search procedures can be quite different. A These spectra differ from ‘‘crystalline’’ spectrasearch routine based on the matching of spectral (sharp bands) which usually are present in spectralpeak frequencies only, was found to be most suitable libraries. Also, some analytes will deposit as ato identify the analytes at the trace level. This smooth film, whereas others may form irregularconclusion was based on a data set of 45 spectra clusters. This phenomenon has been observed during
24 G.W. Somsen et al. / J. Chromatogr. A 811 (1998) 1 –34
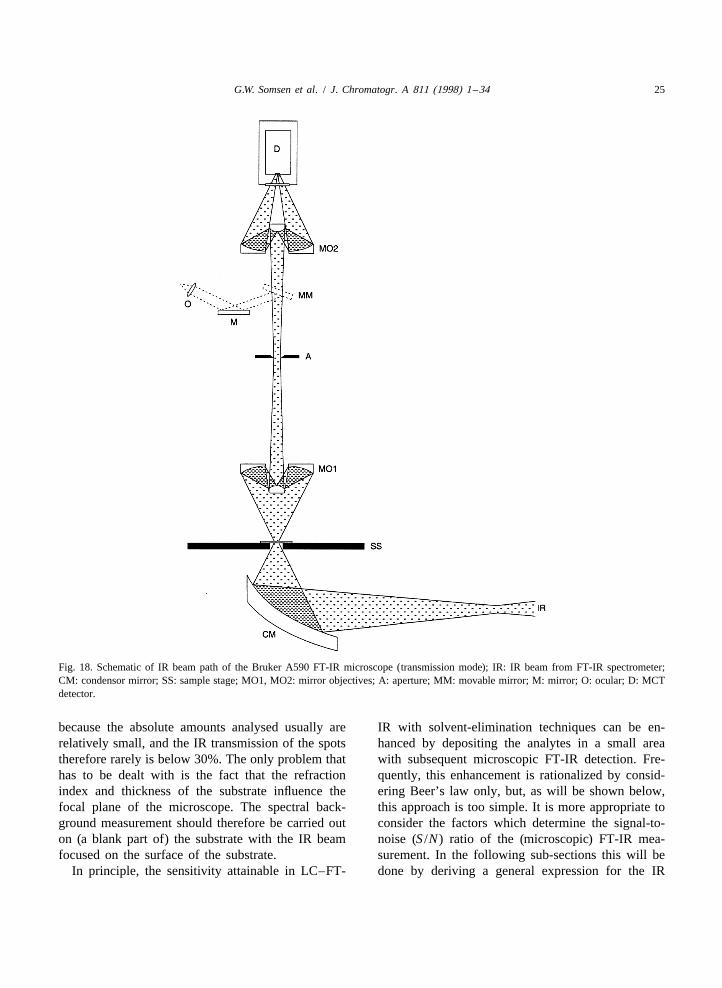
the LC–FT-IR analysis of herbicides in river water (CM). The IR light transmitted by the sample is[83]: triazines were deposited as homogeneous spots, collected by a Cassegrain objective (MO1). Thewhile the spots of phenylureas revealed the presence objective produces an image of the sample with aof small, isolated domains. Despite these mor- 153 magnification, and a circular or rectangularphological differences, the recorded analyte spectra aperture (A) of variable size is placed in this imageresembled the corresponding KBr spectra. When the plane. The aperture permits selection of the samplespot thickness exceeds a certain level, the effect of region of interest. The radiation passing through thescattering may become apparent; it usually leads to aperture is focused on a small area mercury–cad-sloping of the spectral baseline since the scatter mium–telluride (MCT) detector (D) by another 153
intensity depends on the IR frequency. A compound Cassegrain lens (MO2), which yields a 1:1 projec-may also exhibit polymorphism so that mutually tion of the sample region. The microscope can also(slightly) different spectra can be obtained for the be used with visible light. In this case, the lightsame compound. For example, some marked differ- passing through the aperture is directed to a binocu-ences were observed in the LC–FT-IR spectra of the lar viewer, so that the sample can be inspectedpolymer additive Irganox 1076 [79], which appeared visually. Moreover, the visible mode allows theto depend on the time of recording the spectra, viz., desired region of the sample to be centred in theimmediately or one day after deposition on ZnSe. viewing field and to adjust the aperture to theLange et al. [71] showed that during the evaporation / appropriate size. This is an important advantage of adeposition process, saccharin may be converted into microscope over conventional beam condensing op-its sodium salt, even though no salts are present in tics in which the sampling area cannot be checkedthe eluent. visually. Another drawback of a beam condenser is
In general, FT-IR detection of deposited com- that it is commonly used with the standard detectorpounds on IR-transparent substrates does not pose of the FT-IR spectrometer, i.e., the detector is notserious problems. However, from the above it should optimized for small samples.be clear that analyte morphology and/or transforma- The FT-IR microscope is generally applied totion should always be taken into consideration during obtain structural information from tiny particles suchthe interpretation of spectra obtained by solvent- as small flakes, single fibers or even single cells.elimination LC–FT-IR. FT-IR microscopy can also be used for the in situ
characterization of inhomogeneities and/or various5.3. Microscopic FT-IR detection layers of macroscopic samples. Examples can be
found in books devoted to the IR microspectrometryIn order to increase the usefulness of FT-IR of small samples and sample areas [93–95]. In FT-
detection in LC, optimization of the analyte detec- IR microscopy, high spatial resolution is commonlytability is essential. In solvent-elimination LC–FT-IR essential in order to effectively isolate particles orthe identification limits usually improve when the sample regions of interest. This implies that diffrac-width of the analyte spots is decreased (see below for tion effects caused by the aperture should be givenexplanation). A prerequisite for this gain in detec- careful consideration. The thickness of the sampletability is the use of the appropriate detector and also is a matter of concern, because it may seriouslysampling optics. Optimum solvent-elimination inter- limit the optical throughput of the microscope.faces can produce analyte spots with a width as small Fortunately, in solvent-elimination LC–FT-IR theseas 100–300 mm. For deposits of this size, the focus potential difficulties are usually absent. In mostof a conventional beam condenser is too large and cases, the width of the analyte deposition spotsthe use of an FT-IR microscope is indicated. dictates an aperture diameter of 100 mm or more, so
As an example, Fig. 18 shows the schematic that aperture diffraction effects are negligible. Theoptical diagram of the Bruker A590 FT-IR micro- demands on spatial resolution are not severe either,scope. In the transmission mode of operation, the IR since the spot length is normally large with respect tobeam is focused onto a sample at the microscope the aperture size. Furthermore, throughput lossesstage (SS) by means of an off-axis condenser mirror caused by the sample are modest in LC–FT-IR,
G.W. Somsen et al. / J. Chromatogr. A 811 (1998) 1 –34 25
Fig. 18. Schematic of IR beam path of the Bruker A590 FT-IR microscope (transmission mode); IR: IR beam from FT-IR spectrometer;CM: condensor mirror; SS: sample stage; MO1, MO2: mirror objectives; A: aperture; MM: movable mirror; M: mirror; O: ocular; D: MCTdetector.
because the absolute amounts analysed usually are IR with solvent-elimination techniques can be en-relatively small, and the IR transmission of the spots hanced by depositing the analytes in a small areatherefore rarely is below 30%. The only problem that with subsequent microscopic FT-IR detection. Fre-has to be dealt with is the fact that the refraction quently, this enhancement is rationalized by consid-index and thickness of the substrate influence the ering Beer’s law only, but, as will be shown below,focal plane of the microscope. The spectral back- this approach is too simple. It is more appropriate toground measurement should therefore be carried out consider the factors which determine the signal-to-on (a blank part of) the substrate with the IR beam noise (S /N) ratio of the (microscopic) FT-IR mea-focused on the surface of the substrate. surement. In the following sub-sections this will be
In principle, the sensitivity attainable in LC–FT- done by deriving a general expression for the IR

26 G.W. Somsen et al. / J. Chromatogr. A 811 (1998) 1 –34
absorbance of an analyte spot and the S /N ratio of transmittance, T, and absorbance, A, at a certainthe absorbance measurement. Discussion of the latter wavenumber are obtained by measuring the intensityparameters will show that the good sensitivity of of the reference (or background) signal, E and theR
FT-IR microscopic detection essentially results from sample signal, E , and applying the well-knownS
the low noise level of the IR detectors in FT-IR relationship:microscopes. ES
]A 5 2 log T 5 2 log (3)S DER5.3.1. Absorbance and spot sizeIf it is assumed that there is no uncertainty inBeer’s law relates the absorbance, A, of a pure
measuring E , the S /N ratio or A /s of the ab-compound at a certain wavenumber, to its absorp- R A
sorbance measurement is given by [96]:tivity, a (ml /mg mm), at that wavenumber, theoptical thickness, b (mm), and the concentration (or 2 E T ln TA R
] ]]]]density), c (mg/ml), according to: 5 (4)s sA S
A 5 abc (1)where s is the noise or uncertainty in absorbance,A
and s the noise in E . Actually, A /s is somewhatS S AIf it is assumed that a given mass, m (mg), of an smaller because of the uncertainty in measuring ERanalyte is deposited as a cylinder with diameter, d [96], but Eq. (4) gives a good approximation which2(mm), cross-sectional area, A (mm ), height (i.e.S suffices for the present discussion. In order to writeoptical thickness), b and volume, V (ml), A can be
A /s as a function of analyte spot diameter d, E andA Rexpressed as:T should be expressed in terms of d. From Eqs. (2)and (3) it readily follows that for a cylindrical spotV m am 4am
] ] ] ]]A 5 a ? ? 5 5 (2)2 of fixed mass:A V A pdS S
22A 2k / dT 5 10 5 10 (5)From Eq. (2) it follows that the analyte absor-bance is inversely proportional to the sample area. 2where k (mm ) is a constant. If it is assumed that theThus, in order to optimize the sensitivity, deposition
IR beam is uniform and that round apertures are usedof the analyte on as small an area as possible seems
to adjust the beam size to the spot size, it followsadvantageous. However, in order to effect such an
that E is proportional to the spot area, A , or:R Sincrease in absorbance, it is necessary that the2diameter of the focused IR beam equals the diameter E 5 k9d (6)R
of the analyte spot, so that no blank substrate22where k9 (mm ) is a constant for a given opticalcontributes to the measurement. With an FT-IR
system. Substitution of Eqs. (5) and (6) in Eq. (4)microscope, adjustment of the size of the interrogat-yields:ing beam is accomplished by use of apertures which
22k / dreduce the IR beam to the appropriate size (see A 2.3kk910] ]]]]5 (7)above). In other words, part of the IR radiance iss sA Srejected by the aperture, which implies that a de-
crease of the analyte spot diameter is accompanied and thusby a decrease of the power received at the detector. A k
] ]This loss of energy will adversely affect the S /N log 5 0.36 1 log (kk9) 2 log (s ) 2 (8)S D S 2s dAratio of the IR measurement [1]. Hence, the S /Nratio of the IR absorption experiment rather than the In IR absorption spectrometry, the relatively highabsorbance should be considered as a function of detector noise, s , is dominant at all analyticalD
analyte spot diameter. This will be done below. signal levels, so that s equals s . Consequently, sS D D
can be considered constant for a given detectorregardless of the magnitude of E and T, so that Eq.5.3.2. S /N ratio and spot size R
(8) reduces to:In an actual FT-IR transmission measurement, the
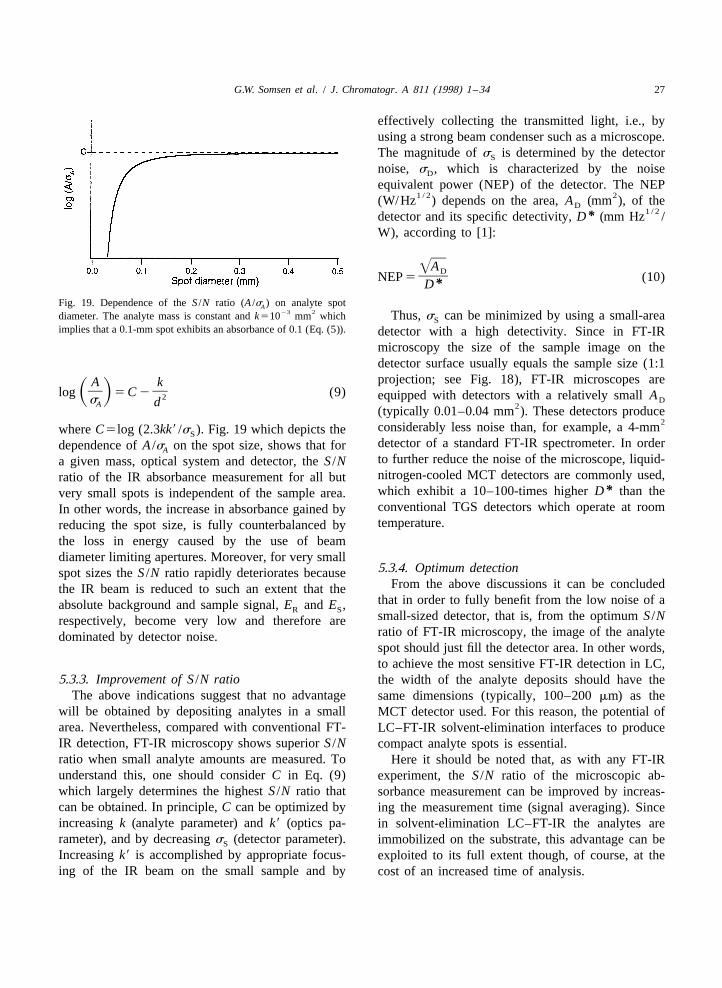
G.W. Somsen et al. / J. Chromatogr. A 811 (1998) 1 –34 27
effectively collecting the transmitted light, i.e., byusing a strong beam condenser such as a microscope.The magnitude of s is determined by the detectorS
noise, s , which is characterized by the noiseD
equivalent power (NEP) of the detector. The NEP1 / 2 2(W/Hz ) depends on the area, A (mm ), of theD
1 / 2*detector and its specific detectivity, D (mm Hz /W), according to [1]:
]Aœ D
]]NEP 5 (10)*DFig. 19. Dependence of the S /N ratio (A /s ) on analyte spotA
23 2diameter. The analyte mass is constant and k510 mm which Thus, s can be minimized by using a small-areaSimplies that a 0.1-mm spot exhibits an absorbance of 0.1 (Eq. (5)). detector with a high detectivity. Since in FT-IR
microscopy the size of the sample image on thedetector surface usually equals the sample size (1:1projection; see Fig. 18), FT-IR microscopes areA k
] ]log 5 C 2 (9)S D equipped with detectors with a relatively small A2 Ds dA 2(typically 0.01–0.04 mm ). These detectors produce2considerably less noise than, for example, a 4-mmwhere C5log (2.3kk9 /s ). Fig. 19 which depicts theS
detector of a standard FT-IR spectrometer. In orderdependence of A /s on the spot size, shows that forAto further reduce the noise of the microscope, liquid-a given mass, optical system and detector, the S /Nnitrogen-cooled MCT detectors are commonly used,ratio of the IR absorbance measurement for all but
*which exhibit a 10–100-times higher D than thevery small spots is independent of the sample area.conventional TGS detectors which operate at roomIn other words, the increase in absorbance gained bytemperature.reducing the spot size, is fully counterbalanced by
the loss in energy caused by the use of beamdiameter limiting apertures. Moreover, for very small
5.3.4. Optimum detectionspot sizes the S /N ratio rapidly deteriorates becauseFrom the above discussions it can be concludedthe IR beam is reduced to such an extent that the
that in order to fully benefit from the low noise of aabsolute background and sample signal, E and E ,R Ssmall-sized detector, that is, from the optimum S /Nrespectively, become very low and therefore areratio of FT-IR microscopy, the image of the analytedominated by detector noise.spot should just fill the detector area. In other words,to achieve the most sensitive FT-IR detection in LC,
5.3.3. Improvement of S /N ratio the width of the analyte deposits should have theThe above indications suggest that no advantage same dimensions (typically, 100–200 mm) as the
will be obtained by depositing analytes in a small MCT detector used. For this reason, the potential ofarea. Nevertheless, compared with conventional FT- LC–FT-IR solvent-elimination interfaces to produceIR detection, FT-IR microscopy shows superior S /N compact analyte spots is essential.ratio when small analyte amounts are measured. To Here it should be noted that, as with any FT-IRunderstand this, one should consider C in Eq. (9) experiment, the S /N ratio of the microscopic ab-which largely determines the highest S /N ratio that sorbance measurement can be improved by increas-can be obtained. In principle, C can be optimized by ing the measurement time (signal averaging). Sinceincreasing k (analyte parameter) and k9 (optics pa- in solvent-elimination LC–FT-IR the analytes arerameter), and by decreasing s (detector parameter). immobilized on the substrate, this advantage can beS
Increasing k9 is accomplished by appropriate focus- exploited to its full extent though, of course, at theing of the IR beam on the small sample and by cost of an increased time of analysis.
28 G.W. Somsen et al. / J. Chromatogr. A 811 (1998) 1 –34
6. Conclusions RPLC, the more recent research in the field ofLC–FT-IR has concentrated on the development of
In this paper, the literature on LC–FT-IR has been interfaces which are suitable for the elimination ofreviewed with emphasis on coupling techniques in aqueous eluents. The characteristics of the RPLC–which the eluent is eliminated and analytes are FT-IR systems described in the literature are summa-deposited on a substrate prior to IR detection. In rized in Tables 2 and 3; they list systems in whichprinciple, FT-IR detection can also be carried out in the column effluent is sent directly to the solvent-an on-line mode using flow cells, but in the past elimination interface and systems in which – prior toyears it has convincingly been demonstrated that solvent evaporation – a reagent, extractant or solventsemi on-line coupling is the approach of choice in is added on-line to the LC effluent to facilitate theLC–FT-IR. Compared with flow cell techniques, elimination of the aqueous eluent, respectively.FT-IR detection procedures based on analyte deposi- Basically, the RPLC–FT-IR systems based on ther-tion offer a number of advantages. These include the mospray, particle beam and ultrasonic nebulizationpossibility (i) to record spectra over the entire mid- can handle relatively high flows of aqueous eluentsIR region without interference from the eluent, (ii) to (0.3–1 ml /min) and allow the use of conventional-perform ‘‘post-run’’ signal averaging and (iii) to size LC, which evidently is an advantage. However,contain a relatively large part of the chromatographic due to diffuse spray characteristics and/or a lowpeak within the IR beam. As a result, the solvent- efficiency of the analyte transfer to the substrate,elimination approach provides an analytical set-up these systems often exhibit identification limits (ex-which features increased sensitivity and enhanced pressed as mass injected) which are at the bestspectral quality, two important conditions for the moderate (100 ng) and often unfavourable (1–10reliable identification of (low-level) sample con- mg); therefore, their analytical applicability is lim-stituents which is the primary objective of LC–FT- ited. The best results (0.5–5 ng injected) are ob-IR. Not surprisingly, the commercial LC–FT-IR tained with pneumatic and electrospray nebulizers,systems which are presently available [7,8], are especially in combination with ZnSe substrates. Thesolvent-elimination devices. electrospray interface appears to be promising for
Interestingly, also in GC–FT-IR and supercritical use in micro-LC–FT-IR, but until now its perform-fluid chromatography (SFC)–FT-IR, analyte-de- ance has been described in a single paper only.position-based methods have proven to be more Considerably more attention has been devoted tosensitive and versatile than flow cell-based tech- LC–FT-IR systems based on pneumatic nebulizers.niques. This observation prompted Griffiths to pro- Hence, some of the important aspects of thesepose a unified approach to chromatography–FT-IR systems, which represent the state-of-the-art, will beinterfacing, and the development of a single FT-IR summarized below.detection system capable of handling effluents fromdifferent chromatographic techniques was announced[97–100]. Indeed, mutually similar interfaces have 6.1. Spray and deposition characteristicsbeen developed for the coupling of GC [3], SFC[101] and LC [71,76] with FT-IR, in which the The pneumatic interfaces combine rapid solventcolumn effluent is deposited directly on a moving elimination with a relatively narrow spray. The latterIR-transparent substrate and transmission spectra are aspect allows analytes to be deposited on ZnSe in arecorded under an FT-IR microscope. However, the narrow trace (width, ,300 mm), so that transmissionexperimental conditions required to achieve elimina- detection by FT-IR microscope can be applied totion of gas, supercritical fluid or liquid, and to trap achieve mass sensitivities in the low- or even sub-ngvolatile or non-volatile analytes are evidently quite range. It is noteworthy that with a microscopedifferent. In other words, despite the analogy in (typical detection area, 150 mm3150 mm), only partapproach, dedicated optimization of the interfaces for of the injected amount of analyte is actually analysedeach type of chromatography will still be necessary. because the length of a deposited spot is dictated by
Since the major part of LC analyses involves the width of the chromatographic peak and therefore
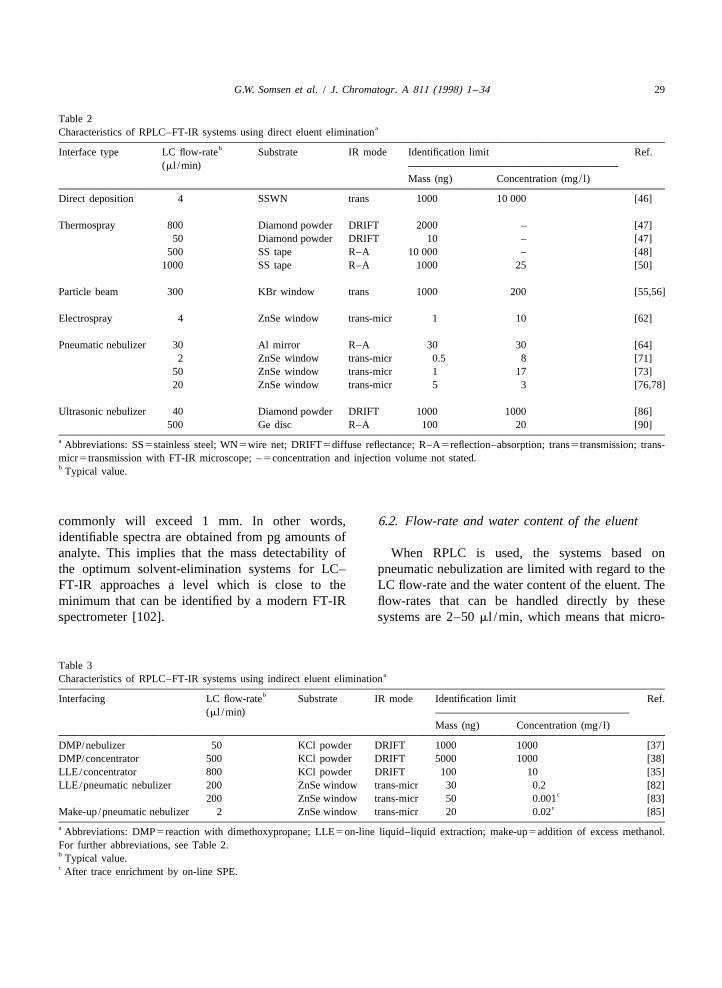
G.W. Somsen et al. / J. Chromatogr. A 811 (1998) 1 –34 29
Table 2aCharacteristics of RPLC–FT-IR systems using direct eluent elimination
bInterface type LC flow-rate Substrate IR mode Identification limit Ref.(ml /min)
Mass (ng) Concentration (mg/ l)
Direct deposition 4 SSWN trans 1000 10 000 [46]
Thermospray 800 Diamond powder DRIFT 2000 – [47]50 Diamond powder DRIFT 10 – [47]
500 SS tape R–A 10 000 – [48]1000 SS tape R–A 1000 25 [50]
Particle beam 300 KBr window trans 1000 200 [55,56]
Electrospray 4 ZnSe window trans-micr 1 10 [62]
Pneumatic nebulizer 30 Al mirror R–A 30 30 [64]2 ZnSe window trans-micr 0.5 8 [71]
50 ZnSe window trans-micr 1 17 [73]20 ZnSe window trans-micr 5 3 [76,78]
Ultrasonic nebulizer 40 Diamond powder DRIFT 1000 1000 [86]500 Ge disc R–A 100 20 [90]
a Abbreviations: SS5stainless steel; WN5wire net; DRIFT5diffuse reflectance; R–A5reflection–absorption; trans5transmission; trans-micr5transmission with FT-IR microscope; –5concentration and injection volume not stated.b Typical value.
commonly will exceed 1 mm. In other words, 6.2. Flow-rate and water content of the eluentidentifiable spectra are obtained from pg amounts ofanalyte. This implies that the mass detectability of When RPLC is used, the systems based onthe optimum solvent-elimination systems for LC– pneumatic nebulization are limited with regard to theFT-IR approaches a level which is close to the LC flow-rate and the water content of the eluent. Theminimum that can be identified by a modern FT-IR flow-rates that can be handled directly by thesespectrometer [102]. systems are 2–50 ml /min, which means that micro-
Table 3aCharacteristics of RPLC–FT-IR systems using indirect eluent elimination
bInterfacing LC flow-rate Substrate IR mode Identification limit Ref.(ml /min)
Mass (ng) Concentration (mg/ l)
DMP/nebulizer 50 KCl powder DRIFT 1000 1000 [37]DMP/concentrator 500 KCl powder DRIFT 5000 1000 [38]LLE/concentrator 800 KCl powder DRIFT 100 10 [35]LLE/pneumatic nebulizer 200 ZnSe window trans-micr 30 0.2 [82]
c200 ZnSe window trans-micr 50 0.001 [83]cMake-up/pneumatic nebulizer 2 ZnSe window trans-micr 20 0.02 [85]
a Abbreviations: DMP5reaction with dimethoxypropane; LLE5on-line liquid–liquid extraction; make-up5addition of excess methanol.For further abbreviations, see Table 2.b Typical value.c After trace enrichment by on-line SPE.
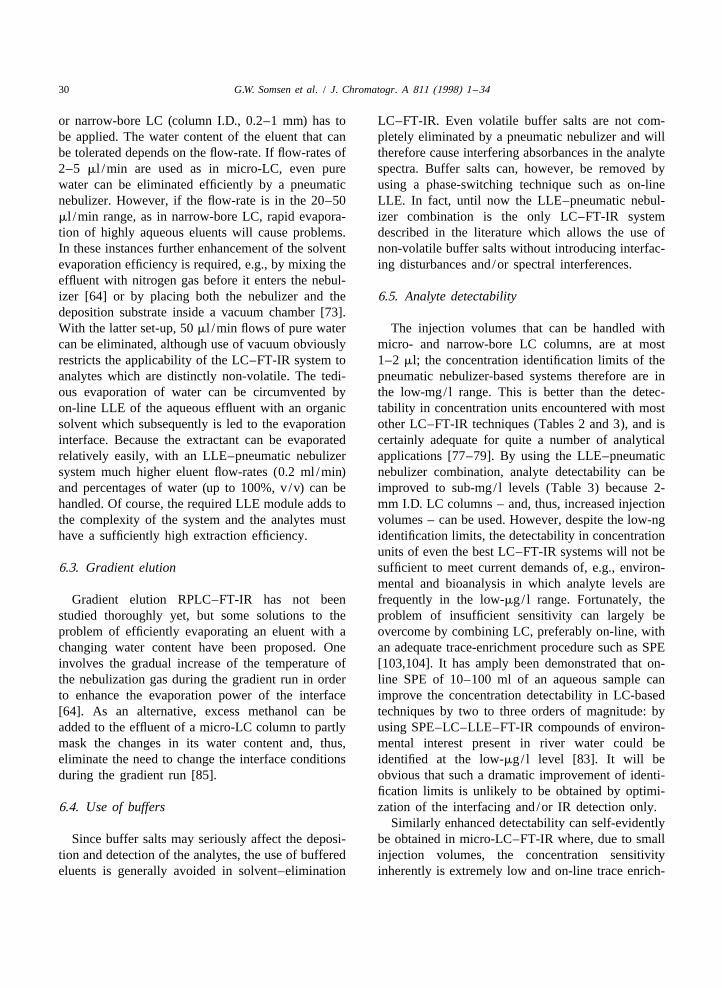
30 G.W. Somsen et al. / J. Chromatogr. A 811 (1998) 1 –34
or narrow-bore LC (column I.D., 0.2–1 mm) has to LC–FT-IR. Even volatile buffer salts are not com-be applied. The water content of the eluent that can pletely eliminated by a pneumatic nebulizer and willbe tolerated depends on the flow-rate. If flow-rates of therefore cause interfering absorbances in the analyte2–5 ml /min are used as in micro-LC, even pure spectra. Buffer salts can, however, be removed bywater can be eliminated efficiently by a pneumatic using a phase-switching technique such as on-linenebulizer. However, if the flow-rate is in the 20–50 LLE. In fact, until now the LLE–pneumatic nebul-ml /min range, as in narrow-bore LC, rapid evapora- izer combination is the only LC–FT-IR systemtion of highly aqueous eluents will cause problems. described in the literature which allows the use ofIn these instances further enhancement of the solvent non-volatile buffer salts without introducing interfac-evaporation efficiency is required, e.g., by mixing the ing disturbances and/or spectral interferences.effluent with nitrogen gas before it enters the nebul-izer [64] or by placing both the nebulizer and the 6.5. Analyte detectabilitydeposition substrate inside a vacuum chamber [73].With the latter set-up, 50 ml /min flows of pure water The injection volumes that can be handled withcan be eliminated, although use of vacuum obviously micro- and narrow-bore LC columns, are at mostrestricts the applicability of the LC–FT-IR system to 1–2 ml; the concentration identification limits of theanalytes which are distinctly non-volatile. The tedi- pneumatic nebulizer-based systems therefore are inous evaporation of water can be circumvented by the low-mg/ l range. This is better than the detec-on-line LLE of the aqueous effluent with an organic tability in concentration units encountered with mostsolvent which subsequently is led to the evaporation other LC–FT-IR techniques (Tables 2 and 3), and isinterface. Because the extractant can be evaporated certainly adequate for quite a number of analyticalrelatively easily, with an LLE–pneumatic nebulizer applications [77–79]. By using the LLE–pneumaticsystem much higher eluent flow-rates (0.2 ml /min) nebulizer combination, analyte detectability can beand percentages of water (up to 100%, v/v) can be improved to sub-mg/ l levels (Table 3) because 2-handled. Of course, the required LLE module adds to mm I.D. LC columns – and, thus, increased injectionthe complexity of the system and the analytes must volumes – can be used. However, despite the low-nghave a sufficiently high extraction efficiency. identification limits, the detectability in concentration
units of even the best LC–FT-IR systems will not be6.3. Gradient elution sufficient to meet current demands of, e.g., environ-
mental and bioanalysis in which analyte levels areGradient elution RPLC–FT-IR has not been frequently in the low-mg/ l range. Fortunately, the
studied thoroughly yet, but some solutions to the problem of insufficient sensitivity can largely beproblem of efficiently evaporating an eluent with a overcome by combining LC, preferably on-line, withchanging water content have been proposed. One an adequate trace-enrichment procedure such as SPEinvolves the gradual increase of the temperature of [103,104]. It has amply been demonstrated that on-the nebulization gas during the gradient run in order line SPE of 10–100 ml of an aqueous sample canto enhance the evaporation power of the interface improve the concentration detectability in LC-based[64]. As an alternative, excess methanol can be techniques by two to three orders of magnitude: byadded to the effluent of a micro-LC column to partly using SPE–LC–LLE–FT-IR compounds of environ-mask the changes in its water content and, thus, mental interest present in river water could beeliminate the need to change the interface conditions identified at the low-mg/ l level [83]. It will beduring the gradient run [85]. obvious that such a dramatic improvement of identi-
fication limits is unlikely to be obtained by optimi-6.4. Use of buffers zation of the interfacing and/or IR detection only.
Similarly enhanced detectability can self-evidentlySince buffer salts may seriously affect the deposi- be obtained in micro-LC–FT-IR where, due to small
tion and detection of the analytes, the use of buffered injection volumes, the concentration sensitivityeluents is generally avoided in solvent–elimination inherently is extremely low and on-line trace enrich-
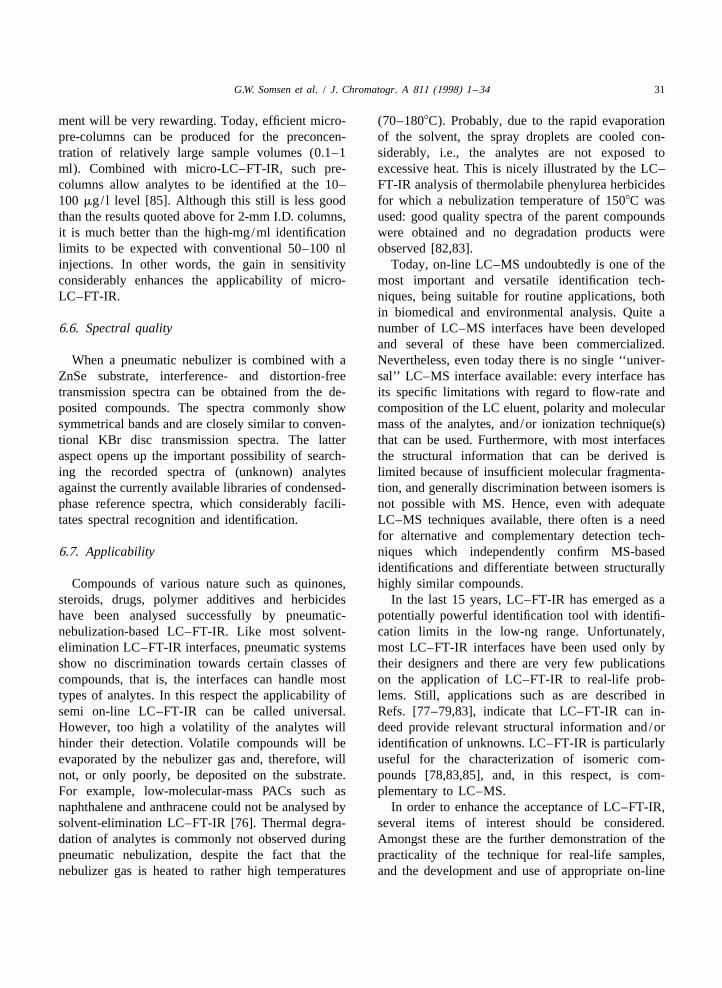
G.W. Somsen et al. / J. Chromatogr. A 811 (1998) 1 –34 31
ment will be very rewarding. Today, efficient micro- (70–1808C). Probably, due to the rapid evaporationpre-columns can be produced for the preconcen- of the solvent, the spray droplets are cooled con-tration of relatively large sample volumes (0.1–1 siderably, i.e., the analytes are not exposed toml). Combined with micro-LC–FT-IR, such pre- excessive heat. This is nicely illustrated by the LC–columns allow analytes to be identified at the 10– FT-IR analysis of thermolabile phenylurea herbicides100 mg/ l level [85]. Although this still is less good for which a nebulization temperature of 1508C wasthan the results quoted above for 2-mm I.D. columns, used: good quality spectra of the parent compoundsit is much better than the high-mg/ml identification were obtained and no degradation products werelimits to be expected with conventional 50–100 nl observed [82,83].injections. In other words, the gain in sensitivity Today, on-line LC–MS undoubtedly is one of theconsiderably enhances the applicability of micro- most important and versatile identification tech-LC–FT-IR. niques, being suitable for routine applications, both
in biomedical and environmental analysis. Quite a6.6. Spectral quality number of LC–MS interfaces have been developed
and several of these have been commercialized.When a pneumatic nebulizer is combined with a Nevertheless, even today there is no single ‘‘univer-
ZnSe substrate, interference- and distortion-free sal’’ LC–MS interface available: every interface hastransmission spectra can be obtained from the de- its specific limitations with regard to flow-rate andposited compounds. The spectra commonly show composition of the LC eluent, polarity and molecularsymmetrical bands and are closely similar to conven- mass of the analytes, and/or ionization technique(s)tional KBr disc transmission spectra. The latter that can be used. Furthermore, with most interfacesaspect opens up the important possibility of search- the structural information that can be derived ising the recorded spectra of (unknown) analytes limited because of insufficient molecular fragmenta-against the currently available libraries of condensed- tion, and generally discrimination between isomers isphase reference spectra, which considerably facili- not possible with MS. Hence, even with adequatetates spectral recognition and identification. LC–MS techniques available, there often is a need
for alternative and complementary detection tech-6.7. Applicability niques which independently confirm MS-based
identifications and differentiate between structurallyCompounds of various nature such as quinones, highly similar compounds.
steroids, drugs, polymer additives and herbicides In the last 15 years, LC–FT-IR has emerged as ahave been analysed successfully by pneumatic- potentially powerful identification tool with identifi-nebulization-based LC–FT-IR. Like most solvent- cation limits in the low-ng range. Unfortunately,elimination LC–FT-IR interfaces, pneumatic systems most LC–FT-IR interfaces have been used only byshow no discrimination towards certain classes of their designers and there are very few publicationscompounds, that is, the interfaces can handle most on the application of LC–FT-IR to real-life prob-types of analytes. In this respect the applicability of lems. Still, applications such as are described insemi on-line LC–FT-IR can be called universal. Refs. [77–79,83], indicate that LC–FT-IR can in-However, too high a volatility of the analytes will deed provide relevant structural information and/orhinder their detection. Volatile compounds will be identification of unknowns. LC–FT-IR is particularlyevaporated by the nebulizer gas and, therefore, will useful for the characterization of isomeric com-not, or only poorly, be deposited on the substrate. pounds [78,83,85], and, in this respect, is com-For example, low-molecular-mass PACs such as plementary to LC–MS.naphthalene and anthracene could not be analysed by In order to enhance the acceptance of LC–FT-IR,solvent-elimination LC–FT-IR [76]. Thermal degra- several items of interest should be considered.dation of analytes is commonly not observed during Amongst these are the further demonstration of thepneumatic nebulization, despite the fact that the practicality of the technique for real-life samples,nebulizer gas is heated to rather high temperatures and the development and use of appropriate on-line
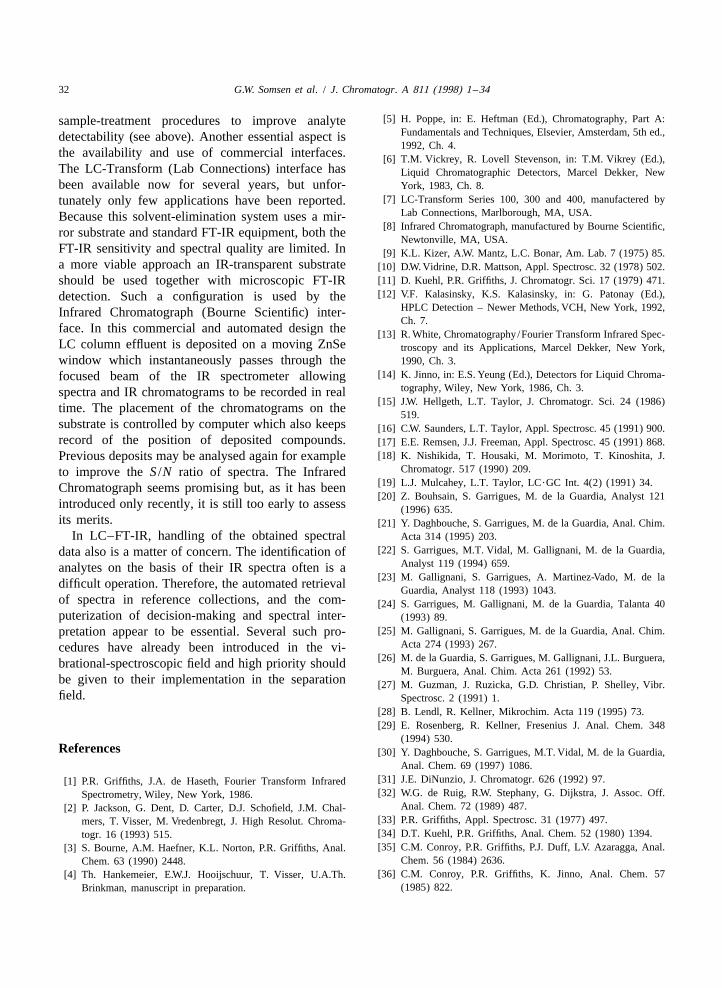
32 G.W. Somsen et al. / J. Chromatogr. A 811 (1998) 1 –34
[5] H. Poppe, in: E. Heftman (Ed.), Chromatography, Part A:sample-treatment procedures to improve analyteFundamentals and Techniques, Elsevier, Amsterdam, 5th ed.,detectability (see above). Another essential aspect is1992, Ch. 4.
the availability and use of commercial interfaces. [6] T.M. Vickrey, R. Lovell Stevenson, in: T.M. Vikrey (Ed.),The LC-Transform (Lab Connections) interface has Liquid Chromatographic Detectors, Marcel Dekker, Newbeen available now for several years, but unfor- York, 1983, Ch. 8.
[7] LC-Transform Series 100, 300 and 400, manufactered bytunately only few applications have been reported.Lab Connections, Marlborough, MA, USA.Because this solvent-elimination system uses a mir-
[8] Infrared Chromatograph, manufactured by Bourne Scientific,ror substrate and standard FT-IR equipment, both theNewtonville, MA, USA.
FT-IR sensitivity and spectral quality are limited. In [9] K.L. Kizer, A.W. Mantz, L.C. Bonar, Am. Lab. 7 (1975) 85.a more viable approach an IR-transparent substrate [10] D.W. Vidrine, D.R. Mattson, Appl. Spectrosc. 32 (1978) 502.
[11] D. Kuehl, P.R. Griffiths, J. Chromatogr. Sci. 17 (1979) 471.should be used together with microscopic FT-IR[12] V.F. Kalasinsky, K.S. Kalasinsky, in: G. Patonay (Ed.),detection. Such a configuration is used by the
HPLC Detection – Newer Methods, VCH, New York, 1992,Infrared Chromatograph (Bourne Scientific) inter-Ch. 7.
face. In this commercial and automated design the [13] R. White, Chromatography/Fourier Transform Infrared Spec-LC column effluent is deposited on a moving ZnSe troscopy and its Applications, Marcel Dekker, New York,window which instantaneously passes through the 1990, Ch. 3.
[14] K. Jinno, in: E.S. Yeung (Ed.), Detectors for Liquid Chroma-focused beam of the IR spectrometer allowingtography, Wiley, New York, 1986, Ch. 3.spectra and IR chromatograms to be recorded in real
[15] J.W. Hellgeth, L.T. Taylor, J. Chromatogr. Sci. 24 (1986)time. The placement of the chromatograms on the519.
substrate is controlled by computer which also keeps [16] C.W. Saunders, L.T. Taylor, Appl. Spectrosc. 45 (1991) 900.record of the position of deposited compounds. [17] E.E. Remsen, J.J. Freeman, Appl. Spectrosc. 45 (1991) 868.
[18] K. Nishikida, T. Housaki, M. Morimoto, T. Kinoshita, J.Previous deposits may be analysed again for exampleChromatogr. 517 (1990) 209.to improve the S /N ratio of spectra. The Infrared
[19] L.J. Mulcahey, L.T. Taylor, LC?GC Int. 4(2) (1991) 34.Chromatograph seems promising but, as it has been[20] Z. Bouhsain, S. Garrigues, M. de la Guardia, Analyst 121
introduced only recently, it is still too early to assess (1996) 635.its merits. [21] Y. Daghbouche, S. Garrigues, M. de la Guardia, Anal. Chim.
In LC–FT-IR, handling of the obtained spectral Acta 314 (1995) 203.[22] S. Garrigues, M.T. Vidal, M. Gallignani, M. de la Guardia,data also is a matter of concern. The identification of
Analyst 119 (1994) 659.analytes on the basis of their IR spectra often is a[23] M. Gallignani, S. Garrigues, A. Martinez-Vado, M. de ladifficult operation. Therefore, the automated retrieval
Guardia, Analyst 118 (1993) 1043.of spectra in reference collections, and the com- [24] S. Garrigues, M. Gallignani, M. de la Guardia, Talanta 40puterization of decision-making and spectral inter- (1993) 89.
[25] M. Gallignani, S. Garrigues, M. de la Guardia, Anal. Chim.pretation appear to be essential. Several such pro-Acta 274 (1993) 267.cedures have already been introduced in the vi-
[26] M. de la Guardia, S. Garrigues, M. Gallignani, J.L. Burguera,brational-spectroscopic field and high priority shouldM. Burguera, Anal. Chim. Acta 261 (1992) 53.
be given to their implementation in the separation [27] M. Guzman, J. Ruzicka, G.D. Christian, P. Shelley, Vibr.field. Spectrosc. 2 (1991) 1.
[28] B. Lendl, R. Kellner, Mikrochim. Acta 119 (1995) 73.[29] E. Rosenberg, R. Kellner, Fresenius J. Anal. Chem. 348
(1994) 530.References [30] Y. Daghbouche, S. Garrigues, M.T. Vidal, M. de la Guardia,
Anal. Chem. 69 (1997) 1086.[31] J.E. DiNunzio, J. Chromatogr. 626 (1992) 97.[1] P.R. Griffiths, J.A. de Haseth, Fourier Transform Infrared[32] W.G. de Ruig, R.W. Stephany, G. Dijkstra, J. Assoc. Off.Spectrometry, Wiley, New York, 1986.
Anal. Chem. 72 (1989) 487.[2] P. Jackson, G. Dent, D. Carter, D.J. Schofield, J.M. Chal-[33] P.R. Griffiths, Appl. Spectrosc. 31 (1977) 497.mers, T. Visser, M. Vredenbregt, J. High Resolut. Chroma-[34] D.T. Kuehl, P.R. Griffiths, Anal. Chem. 52 (1980) 1394.togr. 16 (1993) 515.[35] C.M. Conroy, P.R. Griffiths, P.J. Duff, L.V. Azaragga, Anal.[3] S. Bourne, A.M. Haefner, K.L. Norton, P.R. Griffiths, Anal.
Chem. 56 (1984) 2636.Chem. 63 (1990) 2448.[36] C.M. Conroy, P.R. Griffiths, K. Jinno, Anal. Chem. 57[4] Th. Hankemeier, E.W.J. Hooijschuur, T. Visser, U.A.Th.
(1985) 822.Brinkman, manuscript in preparation.

G.W. Somsen et al. / J. Chromatogr. A 811 (1998) 1 –34 33
[37] K.S. Kalasinsky, J.A.S. Smith, V.F. Kalasinsky, Anal. Chem. [70] S.L. Jordan, L.T. Taylor, B. McPherson, H.T. Rasmussen, J.57 (1985) 1969. Chromatogr. A 755 (1996) 211.
[38] V.F. Kalasinsky, K.G. Whitehead, R.C. Kenton, J.A.S. Smith, [71] A.J. Lange, P.R. Griffiths, D.J.J. Fraser, Anal. Chem. 63K.S. Kalasinsky, J. Chromatogr. Sci. 25 (1987) 273. (1991) 782.
[39] P.R. Griffiths, S.L. Pentoney Jr., A. Giorgetti, K.H. Shafer, [72] D.J.J. Fraser, K.L. Norton, P.R. Griffiths, in: R.G. Mes-Anal. Chem. 58 (1986) 1349A. serschmidt, M.A. Harthcock (Eds.), Infrared Microspectros-
copy – Theory and Applications, Marcel Dekker, New York,[40] K. Jinno, C. Fujimoto, J. High Resolut. Chromatogr., Chro-1988, Ch. 14.matogr. Commun. 4 (1981) 532.
[73] P.R. Griffiths, A.J. Lange, J. Chromatogr. Sci. 30 (1992) 93.[41] K. Jinno, C. Fujimoto, Y. Hirata, Appl. Spectrosc. 36 (1982)67. [74] J. Yang, P.R. Griffiths, SPIE 2089 (1993) 336.
[42] K. Jinno, C. Fujimoto, D. Ishii, J. Chromatogr. 239 (1982) [75] A.J. Lange, P.R. Griffiths, Appl. Spectrosc. 47 (1993) 403.625. [76] G.W. Somsen, R.J. van de Nesse, C. Gooijer, U.A.Th.
[43] C. Fujimoto, K. Jinno, Y. Hirata, J. Chromatogr. 258 (1983) Brinkman, N.H. Velthorst, T. Visser, P.R. Kootstra, A.P.J.M.81. de Jong, J. Chromatogr. 552 (1991) 635.
[44] C. Fujimoto, T. Morita, K. Jinno, S. Ochiai, Chromato- [77] G.W. Somsen, C. Gooijer, U.A.Th. Brinkman, N.H. Velthorst,graphia 23 (1987) 512. T. Visser, Appl. Spectrosc. 46 (1992) 1514.
[45] C. Fujimoto, K. Jinno, Trends Anal. Chem. 8 (1989) 90. [78] G.W. Somsen, L.P.P. van Stee, C. Gooijer, U.A.Th. Brink-man, N.H. Velthorst, T. Visser, Anal. Chim. Acta 290 (1994)[46] C. Fujimoto, T. Oosuka, K. Jinno, Anal. Chim. Acta 178269.(1985) 159.
[79] G.W. Somsen, E.J.E. Rozendom, C. Gooijer, U.A.Th. Brink-[47] P.R. Griffiths, C.M. Conroy, Adv. Chromatogr. 25 (1986)man, N.H. Velthorst, Analyst 121 (1996) 1069.105.
[80] J.W. Hofstraat, S. Griffioen, R.J. van de Nesse, U.A.Th.[48] J.A.J. Jansen, Fresenius J. Anal. Chem. 337 (1990) 398.Brinkman, C. Gooijer, N.H. Velthorst, J. Planar Chromatogr.[49] A.M. Robertson, L. Wylie, D. Littlejohn, R.J. Watling, C.J.1 (1988) 220.Dowle, Anal. Proc. 28 (1991) 8.
[81] R.J. van de Nesse, G.J.M. Hoogland, H. de Moel, C. Gooijer,[50] A.M. Robertson, D. Littlejohn, M. Brown, C.J. Dowle, J.U.A.Th. Brinkman, N.H. Velthorst, J. Chromatogr. 552Chromatogr. 588 (1991) 15.(1991) 613.[51] A.M. Robertson, D. Farnan, D. Littlejohn, M. Brown, C.J.
[82] G.W. Somsen, E.W.J. Hooijschuur, C. Gooijer, U.A.Th.Dowle, Anal. Proc. 30 (1993) 268.Brinkman, N.H. Velthorst, T. Visser, Anal. Chem. 68 (1996)[52] M.M. Mottaleb, B.G. Cooksey, D. Littlejohn, Fresenius J.746.Anal. Chem. 358 (1997) 536.
[83] G.W. Somsen, I. Jagt, C. Gooijer, N.H. Velthorst, U.A.Th.[53] R.C. Willoughby, R.F. Browner, Anal. Chem. 56 (1984)Brinkman, T. Visser, J. Chromatogr. A 756 (1996) 145.2626.
[84] M.J. Vredenbregt, G.J. ten Hove, A.P.J.M. de Jong, T. Visser,[54] R.M. Robertson, J.A. de Haseth, R.F. Browner, Mikrochim.G.W. Somsen, Mikrochim. Acta, Suppl. 14 (1997) 725.Acta II (1988) 199.
[85] T. Visser, M.J. Vredenbregt, G.J. ten Hove, A.P.J.M. de Jong,[55] R.M. Robertson, J.A. de Haseth, J.D. Kirk, R.F. Browner,G.W. Somsen, Anal. Chim. Acta 342 (1997) 151.Appl. Spectrosc. 42 (1988) 1365.
[86] M.A. Castles, L.V. Azarraga, L.A. Carreira, Appl. Spectrosc.[56] R.M. Robertson, J.A. de Haseth, R.F. Browner, Appl.40 (1986) 673.Spectrosc. 44 (1990) 8.
[87] A.H. Dekmezian, T. Morioka, Anal. Chem. 61 (1989) 458.[57] V.E. Turula, J.A. de Haseth, Appl. Spectrosc. 48 (1994)[88] A.H. Dekmezian, T. Morioka, C.E. Camp, J. Polym. Sci. B1255.
28 (1990) 1903.[58] J.A. de Haseth, V.E. Turula, Mikrochim. Acta, Suppl. 14[89] J.L. Dwyer, A.E. Chapman, X. Liu, LC?GC Int. 8 (1995)(1997) 109.
704.[59] V.E. Turula, J.A. de Haseth, Anal. Chem. 68 (1996) 629.[90] M.X. Liu, J.L. Dwyer, Appl. Spectrosc. 50 (1996) 348.[60] V.E. Turula, R.T. Bishop, R.D. Ricker, J.A. de Haseth, J.[91] D.J.J. Fraser, K.L. Norton, P.R. Griffiths, Anal. Chem. 62Chromatogr. A 763 (1997) 91.
(1990) 308.[61] D.J. Wood, Spectrosc. Int. 2(3) (1990) 36.[92] R. Fuoco, S.L. Pentoney Jr., P.R. Griffiths, Anal. Chem. 61[62] M.W. Raynor, K.D. Bartle, B.W. Cook, J. High Resolut.
(1989) 2212.Chromatogr. 15 (1992) 361.[93] H.J. Humecki (Ed.), Practical Guide to Infrared Microspec-[63] J.J. Gagel, K. Biemann, Anal. Chem. 58 (1986) 2184.
troscopy, Marcel Dekker, New York, 1995.[64] J.J. Gagel, K. Biemann, Anal. Chem. 59 (1987) 1266.[94] P.B. Roush (Ed.), The Design, Sample Handling, and Appli-[65] J.J. Gagel, K. Biemann, Mikrochim. Acta II (1988) 185.
cations of Infrared Microscopes, ASTM, Philadelphia, PA,[66] L.M. Wheeler, J.N. Willis, Appl. Spectrosc. 47 (1993) 1128.1987.[67] T.C. Schunk, S.T. Balke, P. Cheung, J. Chromatogr. A 661
[95] R.G. Messerschmidt, M.A. Harthcock (Eds.), Infrared Mi-(1994) 227.crospectroscopy – Theory and Applications, Marcel Dekker,[68] J. Dwyer, Am. Lab. May (1994) 22.New York, 1988.[69] M.V. Pellow-Jarman, M.J.J. Hetem, presented at the 4th
[96] J.D. Ingle, Jr., S.R. Crouch, Spectrochemical Analysis,International Symposium on Hyphenated Techniques inPrentice-Hall, Englewood Cliffs, NJ, 1988, Ch. 5.Chromatography, Bruges, 1996.

34 G.W. Somsen et al. / J. Chromatogr. A 811 (1998) 1 –34
[97] P.R. Griffiths, S.L. Pentoney, G.L. Pariente, K.L. Norton, [101] K.L. Norton, P.R. Griffiths, J. Chromatogr. A 703 (1995)Mikrochim. Acta III (1987) 47. 383.
[98] P.R. Griffiths, A.M. Haefner, K.L. Norton, D.J.J. Fraser, D. [102] C.L. Putzig, M.A. Leugers, M.L. McKelvy, G.E. Mitchell,Pyo, H. Makishima, J. High Resolut. Chromatogr. 12 (1989) R.A. Nyquist, R.R. Papenfuss, L. Yurga, Anal. Chem. 66119. (1994) 26R.
[99] K.L. Norton, A.J. Lange, P.R. Griffiths, J. High Resolut. ´[103] D. Barcelo, M.-C. Hennion, Anal. Chim. Acta 318 (1995)Chromatogr. 14 (1991) 226. 1.
[100] P.R. Griffiths, K.L. Norton, A.J. Lange, Mikrochem. J. 46 [104] U.A.Th. Brinkman, J. Chromatogr. A 665 (1994) 217.(1992) 261.
Related Documents