COUNTY PROFILE: Clinton County, Indiana http://www.healthdata.org Clinton County, Indiana | page 1 US COUNTY PERFORMANCE The Institute for Health Metrics and Evaluation (IHME) at the University of Washington analyzed the performance of all 3,142 US counties or county-equivalents in terms of life expectancy at birth, mortality rates for select causes, alcohol use, smoking prevalence, obesity prevalence, and recommended physical activity using novel small area estimation techniques and the most up-to-date county-level information. Explore more results using the interactive US Health Map data visualization (http://vizhub.healthdata.org/subnational/usa). FINDINGS: LIFE EXPECTANCY Sex Clinton County Indiana National National rank % change 1980-2014 Female 80.2 80.0 81.5 1660 +4.0 Male 75.6 75.3 76.7 1606 +6.5 life expectancy at birth (years), 2014 Fig. 1: Female life expectancy, 2014 Fig. 2: Male life expectancy, 2014 FINDINGS: ALL-CAUSE MORTALITY Sex Clinton County Indiana National National rank % change 1980-2014 Female 757.9 748.0 667.8 1845 -17.2 Male 1035.8 1050.9 930.1 1735 -25.9 rate per 100,000 population, age-standardized, 2014 Fig. 3: Female all-cause mortality, 2014 Fig. 4: Male all-cause mortality, 2014

Welcome message from author
This document is posted to help you gain knowledge. Please leave a comment to let me know what you think about it! Share it to your friends and learn new things together.
Transcript
COUNTY PROFILE: Clinton County, Indiana
http://www.healthdata.org Clinton County, Indiana | page 1
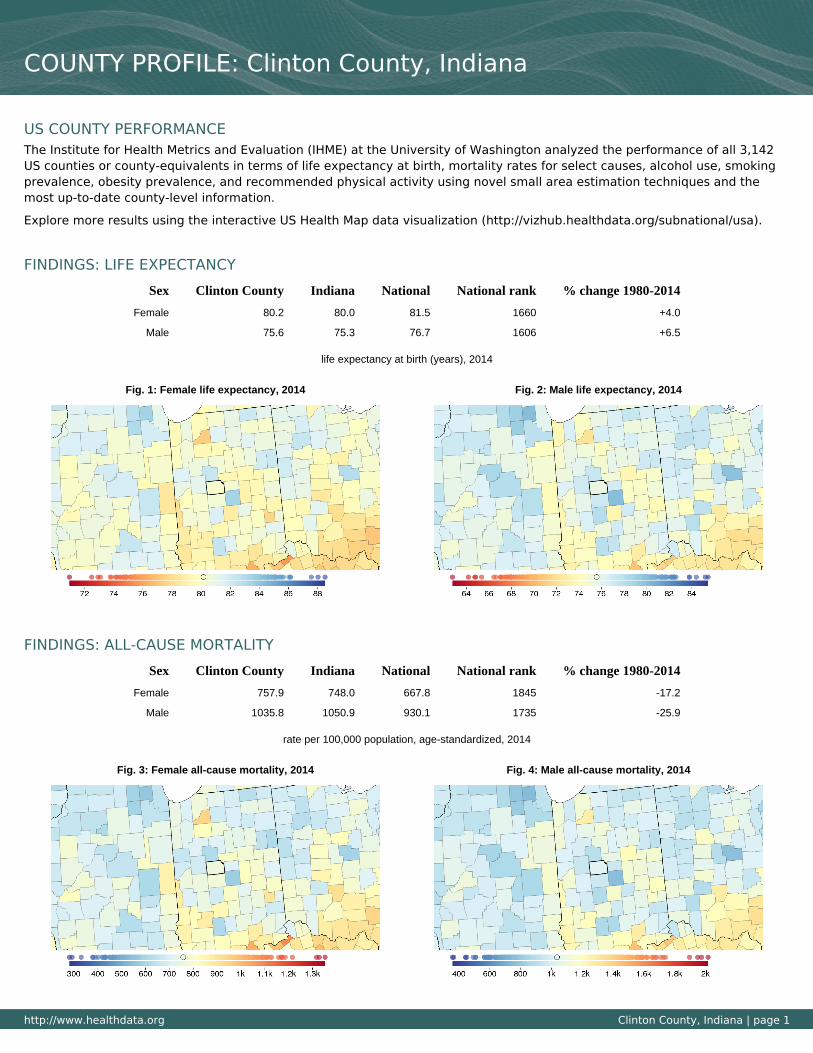
US COUNTY PERFORMANCEThe Institute for Health Metrics and Evaluation (IHME) at the University of Washington analyzed the performance of all 3,142US counties or county-equivalents in terms of life expectancy at birth, mortality rates for select causes, alcohol use, smokingprevalence, obesity prevalence, and recommended physical activity using novel small area estimation techniques and themost up-to-date county-level information.
Explore more results using the interactive US Health Map data visualization (http://vizhub.healthdata.org/subnational/usa).
FINDINGS: LIFE EXPECTANCY
Sex Clinton County Indiana National National rank % change 1980-2014
Female 80.2 80.0 81.5 1660 +4.0
Male 75.6 75.3 76.7 1606 +6.5
life expectancy at birth (years), 2014
Fig. 1: Female life expectancy, 2014 Fig. 2: Male life expectancy, 2014
FINDINGS: ALL-CAUSE MORTALITY
Sex Clinton County Indiana National National rank % change 1980-2014
Female 757.9 748.0 667.8 1845 -17.2
Male 1035.8 1050.9 930.1 1735 -25.9
rate per 100,000 population, age-standardized, 2014
Fig. 3: Female all-cause mortality, 2014 Fig. 4: Male all-cause mortality, 2014
http://www.healthdata.org Clinton County, Indiana | page 2
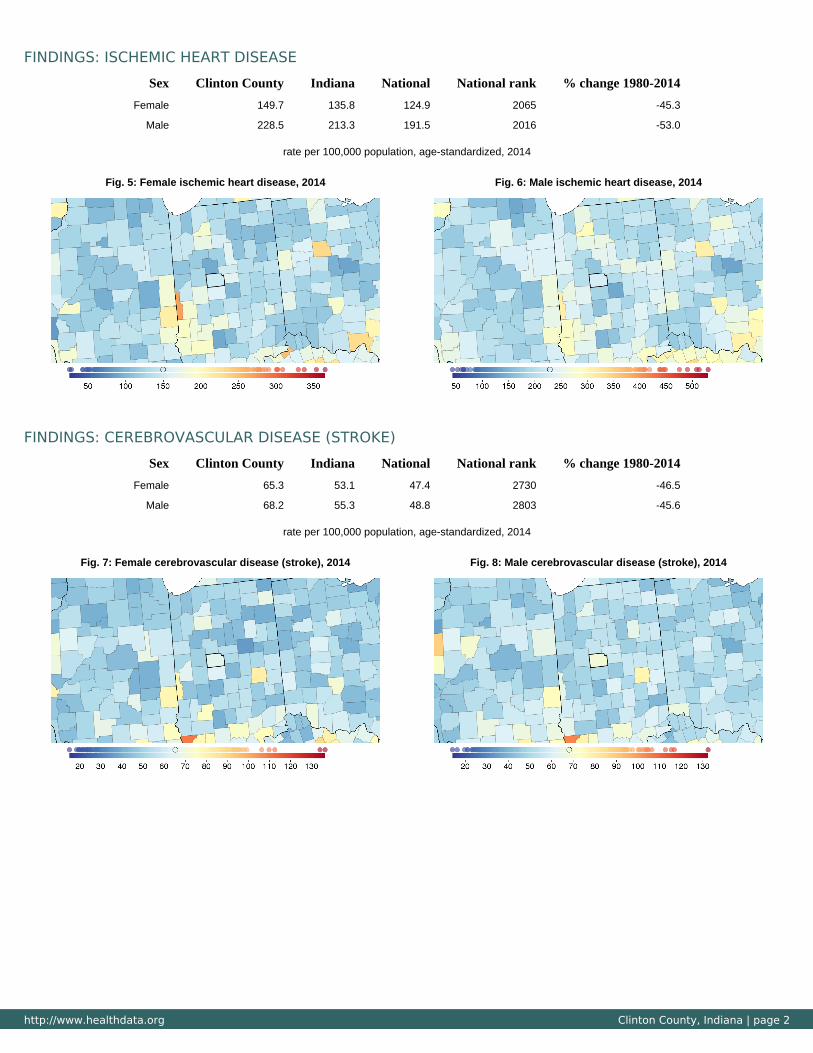
FINDINGS: ISCHEMIC HEART DISEASE
Sex Clinton County Indiana National National rank % change 1980-2014
Female 149.7 135.8 124.9 2065 -45.3
Male 228.5 213.3 191.5 2016 -53.0
rate per 100,000 population, age-standardized, 2014
Fig. 5: Female ischemic heart disease, 2014 Fig. 6: Male ischemic heart disease, 2014
FINDINGS: CEREBROVASCULAR DISEASE (STROKE)
Sex Clinton County Indiana National National rank % change 1980-2014
Female 65.3 53.1 47.4 2730 -46.5
Male 68.2 55.3 48.8 2803 -45.6
rate per 100,000 population, age-standardized, 2014
Fig. 7: Female cerebrovascular disease (stroke), 2014 Fig. 8: Male cerebrovascular disease (stroke), 2014
http://www.healthdata.org Clinton County, Indiana | page 3
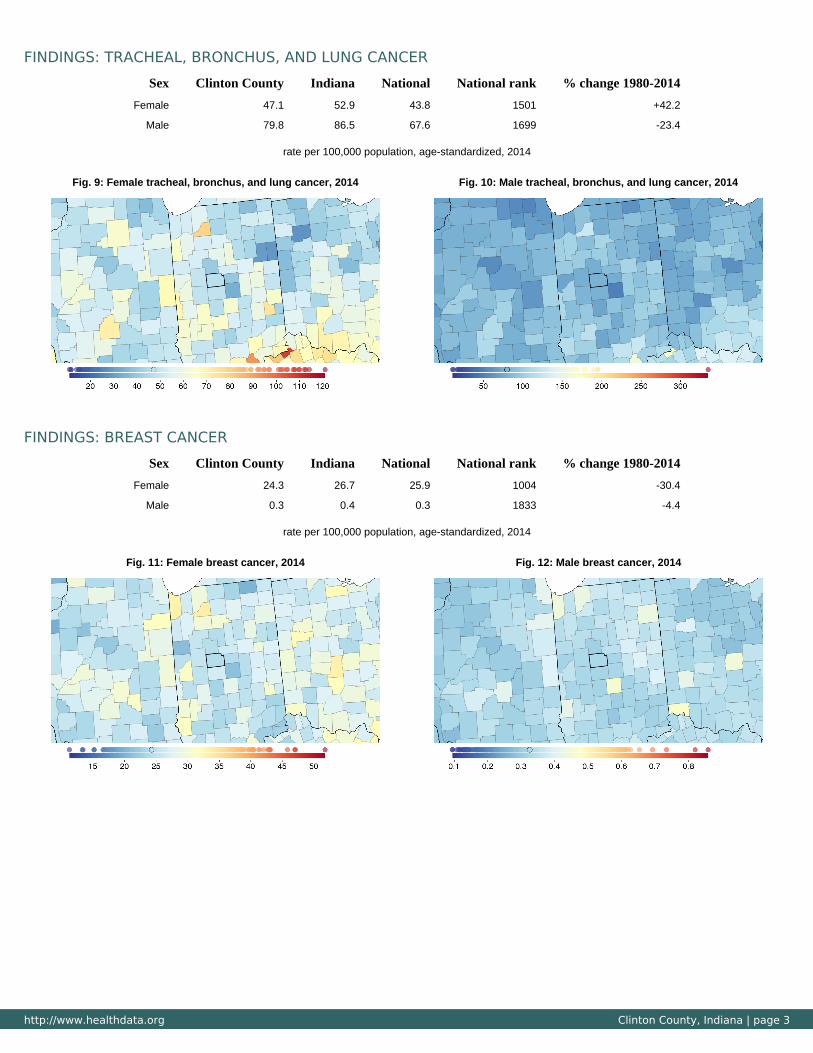
FINDINGS: TRACHEAL, BRONCHUS, AND LUNG CANCER
Sex Clinton County Indiana National National rank % change 1980-2014
Female 47.1 52.9 43.8 1501 +42.2
Male 79.8 86.5 67.6 1699 -23.4
rate per 100,000 population, age-standardized, 2014
Fig. 9: Female tracheal, bronchus, and lung cancer, 2014 Fig. 10: Male tracheal, bronchus, and lung cancer, 2014
FINDINGS: BREAST CANCER
Sex Clinton County Indiana National National rank % change 1980-2014
Female 24.3 26.7 25.9 1004 -30.4
Male 0.3 0.4 0.3 1833 -4.4
rate per 100,000 population, age-standardized, 2014
Fig. 11: Female breast cancer, 2014 Fig. 12: Male breast cancer, 2014
http://www.healthdata.org Clinton County, Indiana | page 4
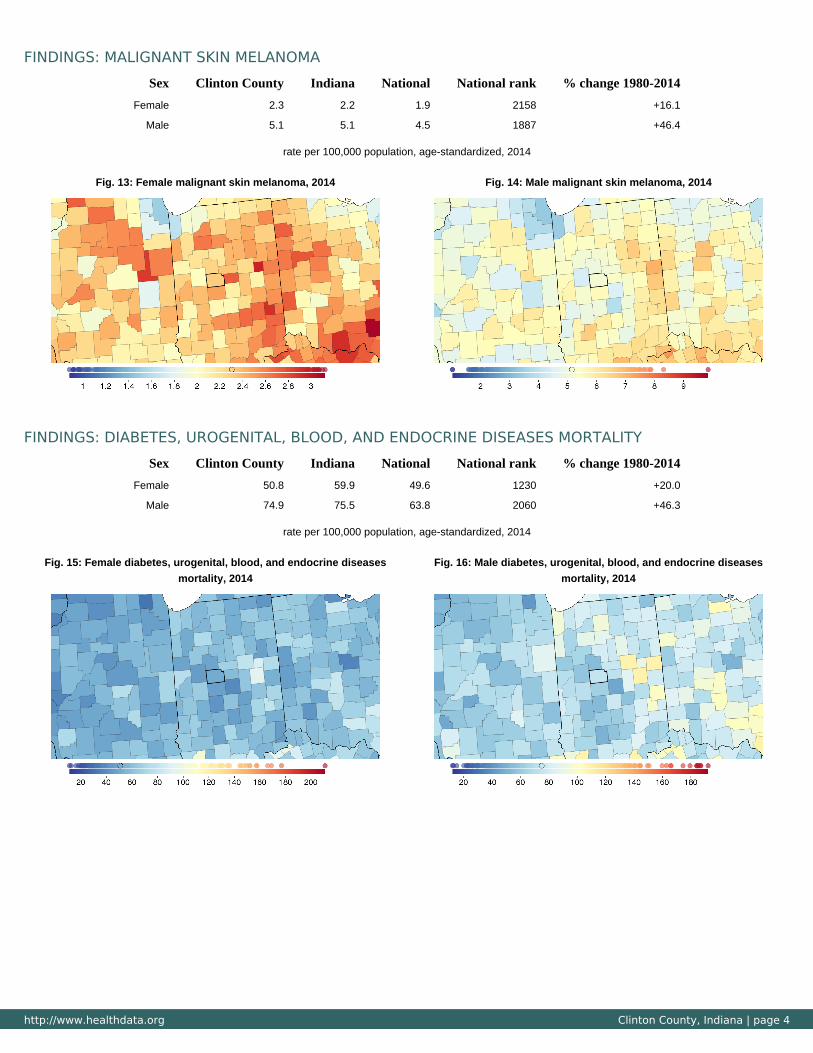
FINDINGS: MALIGNANT SKIN MELANOMA
Sex Clinton County Indiana National National rank % change 1980-2014
Female 2.3 2.2 1.9 2158 +16.1
Male 5.1 5.1 4.5 1887 +46.4
rate per 100,000 population, age-standardized, 2014
Fig. 13: Female malignant skin melanoma, 2014 Fig. 14: Male malignant skin melanoma, 2014
FINDINGS: DIABETES, UROGENITAL, BLOOD, AND ENDOCRINE DISEASES MORTALITY
Sex Clinton County Indiana National National rank % change 1980-2014
Female 50.8 59.9 49.6 1230 +20.0
Male 74.9 75.5 63.8 2060 +46.3
rate per 100,000 population, age-standardized, 2014
Fig. 15: Female diabetes, urogenital, blood, and endocrine diseases
mortality, 2014
Fig. 16: Male diabetes, urogenital, blood, and endocrine diseases
mortality, 2014
http://www.healthdata.org Clinton County, Indiana | page 5
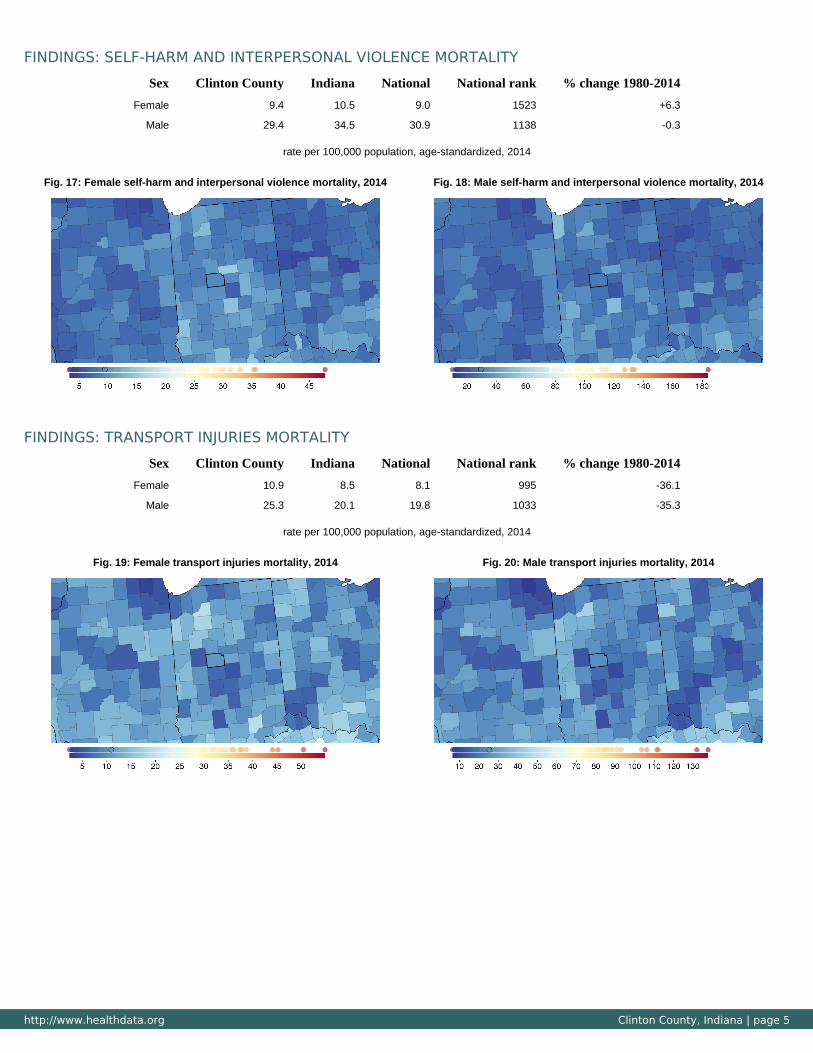
FINDINGS: SELF-HARM AND INTERPERSONAL VIOLENCE MORTALITY
Sex Clinton County Indiana National National rank % change 1980-2014
Female 9.4 10.5 9.0 1523 +6.3
Male 29.4 34.5 30.9 1138 -0.3
rate per 100,000 population, age-standardized, 2014
Fig. 17: Female self-harm and interpersonal violence mortality, 2014 Fig. 18: Male self-harm and interpersonal violence mortality, 2014
FINDINGS: TRANSPORT INJURIES MORTALITY
Sex Clinton County Indiana National National rank % change 1980-2014
Female 10.9 8.5 8.1 995 -36.1
Male 25.3 20.1 19.8 1033 -35.3
rate per 100,000 population, age-standardized, 2014
Fig. 19: Female transport injuries mortality, 2014 Fig. 20: Male transport injuries mortality, 2014
http://www.healthdata.org Clinton County, Indiana | page 6
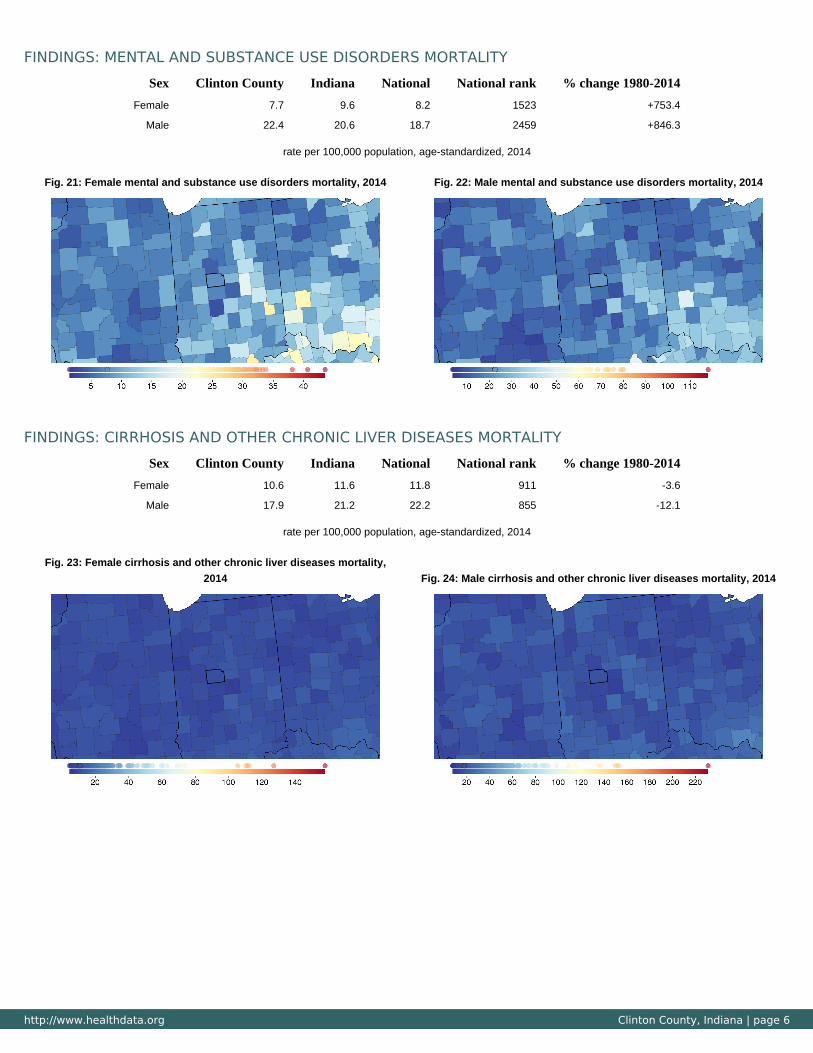
FINDINGS: MENTAL AND SUBSTANCE USE DISORDERS MORTALITY
Sex Clinton County Indiana National National rank % change 1980-2014
Female 7.7 9.6 8.2 1523 +753.4
Male 22.4 20.6 18.7 2459 +846.3
rate per 100,000 population, age-standardized, 2014
Fig. 21: Female mental and substance use disorders mortality, 2014 Fig. 22: Male mental and substance use disorders mortality, 2014
FINDINGS: CIRRHOSIS AND OTHER CHRONIC LIVER DISEASES MORTALITY
Sex Clinton County Indiana National National rank % change 1980-2014
Female 10.6 11.6 11.8 911 -3.6
Male 17.9 21.2 22.2 855 -12.1
rate per 100,000 population, age-standardized, 2014
Fig. 23: Female cirrhosis and other chronic liver diseases mortality,
2014 Fig. 24: Male cirrhosis and other chronic liver diseases mortality, 2014
http://www.healthdata.org Clinton County, Indiana | page 7
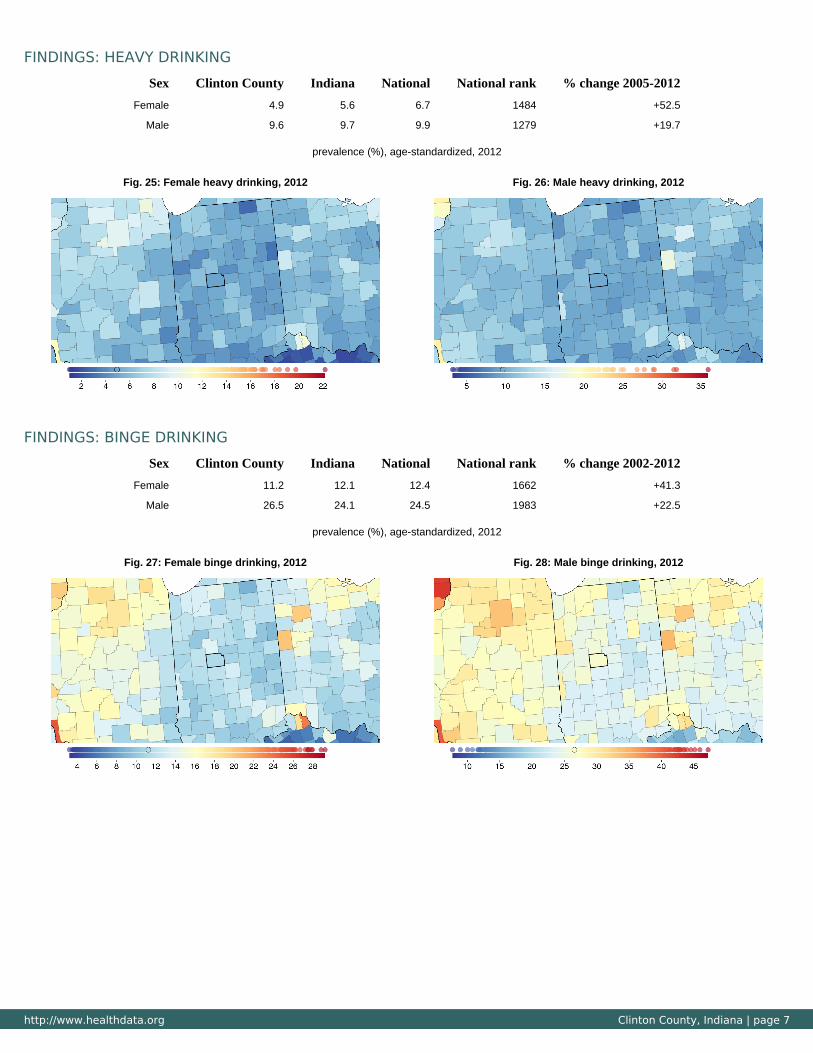
FINDINGS: HEAVY DRINKING
Sex Clinton County Indiana National National rank % change 2005-2012
Female 4.9 5.6 6.7 1484 +52.5
Male 9.6 9.7 9.9 1279 +19.7
prevalence (%), age-standardized, 2012
Fig. 25: Female heavy drinking, 2012 Fig. 26: Male heavy drinking, 2012
FINDINGS: BINGE DRINKING
Sex Clinton County Indiana National National rank % change 2002-2012
Female 11.2 12.1 12.4 1662 +41.3
Male 26.5 24.1 24.5 1983 +22.5
prevalence (%), age-standardized, 2012
Fig. 27: Female binge drinking, 2012 Fig. 28: Male binge drinking, 2012
http://www.healthdata.org Clinton County, Indiana | page 8
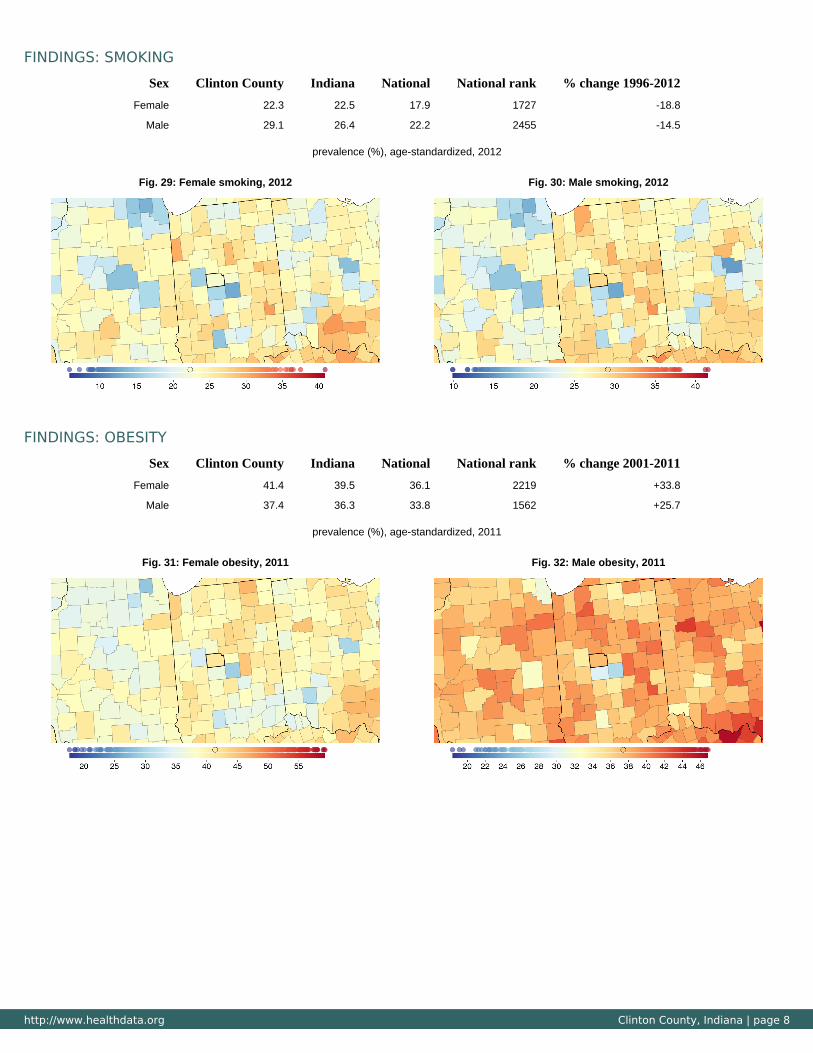
FINDINGS: SMOKING
Sex Clinton County Indiana National National rank % change 1996-2012
Female 22.3 22.5 17.9 1727 -18.8
Male 29.1 26.4 22.2 2455 -14.5
prevalence (%), age-standardized, 2012
Fig. 29: Female smoking, 2012 Fig. 30: Male smoking, 2012
FINDINGS: OBESITY
Sex Clinton County Indiana National National rank % change 2001-2011
Female 41.4 39.5 36.1 2219 +33.8
Male 37.4 36.3 33.8 1562 +25.7
prevalence (%), age-standardized, 2011
Fig. 31: Female obesity, 2011 Fig. 32: Male obesity, 2011
http://www.healthdata.org Clinton County, Indiana | page 9
Institute for Health Metrics and Evaluation2301 Fifth Ave., Suite 600Seattle, WA 98121 USA
Telephone: +1-206-897-2800E-mail: [email protected]
Institute for Health Metrics and Evaluation (IHME),US County Profile: Clinton County, Indiana.Seattle, WA: IHME, 2016.
CITATION:
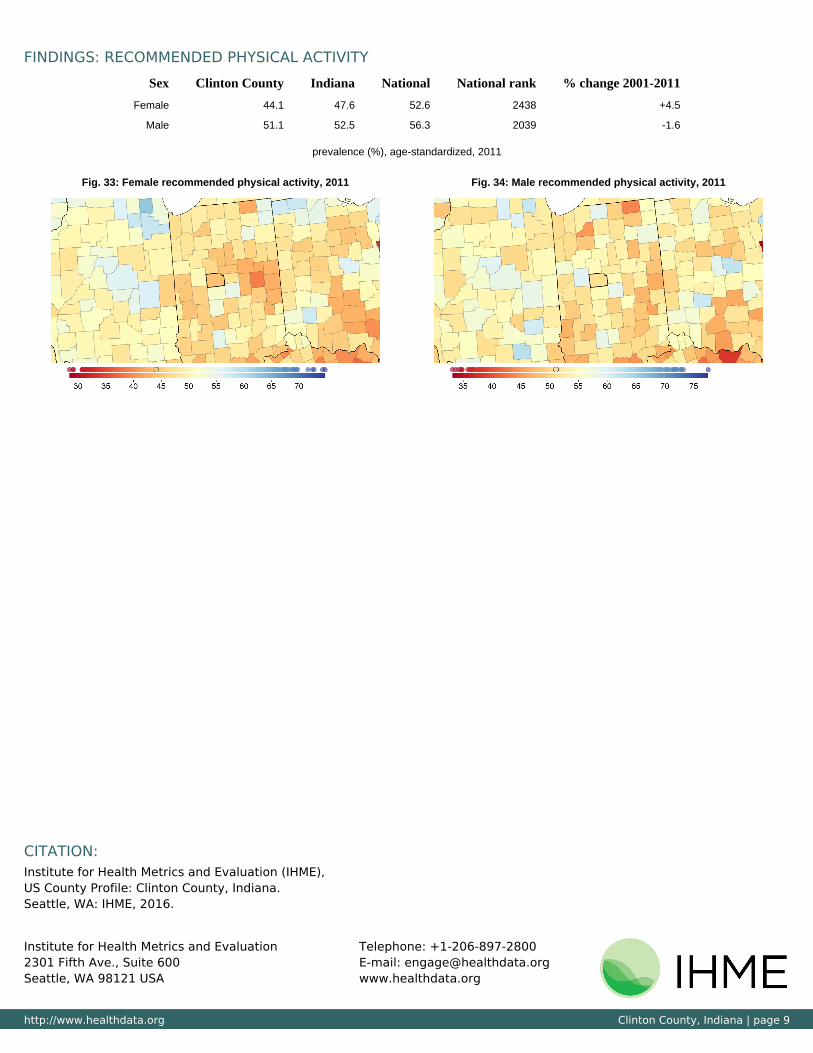
FINDINGS: RECOMMENDED PHYSICAL ACTIVITY
Sex Clinton County Indiana National National rank % change 2001-2011
Female 44.1 47.6 52.6 2438 +4.5
Male 51.1 52.5 56.3 2039 -1.6
prevalence (%), age-standardized, 2011
Fig. 33: Female recommended physical activity, 2011 Fig. 34: Male recommended physical activity, 2011
Related Documents