Country Report South America – March 2015

Country report South America - march 2015
Jul 21, 2015
Welcome message from author
This document is posted to help you gain knowledge. Please leave a comment to let me know what you think about it! Share it to your friends and learn new things together.
Transcript
Country ReportSouth America – March 2015

Contents
2
Atradius STAR Political Risk Rating 3
South American main economies
Argentina 4
Brazil 7
Chile 10
Colombia 12
Peru 15

3
South American Countries: STAR Political Risk Rating*:
Argentina: 8 (High Risk) - Stable
Brazil: 4 (Moderate-Low Risk) - Negative
Chile: 3 (Moderate-Low Risk) - Stable
Colombia: 4 (Moderate-Low Risk) - Stable
Peru: 4 (Moderate-Low Risk) - Negative
* The STAR rating runs on a scale from 1 to 10, where 1 represents the lowest risk and 10 the highest risk.
The 10 rating steps are aggregated into five broad categories to facilitate their interpretation in terms of credit quality. Starting from the most benign part of the quality spectrum, these categories range from ‘Low Risk’, ‘Moderate-Low Risk’, ‘Moderate Risk’, ‘Moderate-High Risk’ to ‘High Risk’, with a separate grade reserved for ‘Very High Risk.’
In addition to the 10-point scale, rating modifiers are associated with each scale step: ‘Positive’, ‘Stable’, and ‘Negative’. These rating modifiers allow further granularity and differentiate more finely between countries in terms of risk.
For further information about the Atradius STAR rating, please click here.

Argentina
Key indicators 2012 2013 2014 2015* 2016*
Real GDP growth (y-on-y, % change) 0.8 2.9 -1.6 -0.7 1.7
Inflation (y-on-y, % change) 25.3 23.7 39.6 37.7 47.2
Real private consumption 4.3 4.3 -1.2 0.1 2.1(y-on-y, % change)
Real exports of goods & non-factor -5.6 -3.9 -8.4 -1.9 3.8services (y-on-y, % change)
Fiscal balance (% of GDP) -2.0 -1.9 -2.6 -2.7 -1.5
Current account/GDP (%) -0.2 -0.8 -1.1 -1.5 -1.0
Foreign debt/GDP (%) 22 22 26 25 28
Foreign debt/export of goods and 136 138 156 156 152services (%)
Short-term debt/international reserves (%) 65 80 83 89 93
International reserves (in months of 7.0 4.5 4.8 4.7 4.7merchandise imports)
* forecast Sources: IHS Global Insight, EIU, IMF
4
Brazil: 29.2 %
China: 13.0 %
USA: 15.2 %
Germany: 4.8 %
Mexico: 2.9 %
Brazil: 20.2 %
China: 6.8 %
USA: 5.3 %
Chile: 4.4 %
Venezuela: 2.8 %
Main import sources (2013, % of total)
Main export markets (2013, % of total)
Mounting troubles for the government
President Kirchner faces increasing troubles due to the dire state of the eco-nomy and her business unfriendly economic policies (see below) and allegations that her government and the intelligence agency covered up the involvement of Iran in a bomb attack on a Jewish Centre in Buenos Aires in 1994 in exchange for favourable trade deals with Iran. Social unrest is increasing, raising the alrea-dy high risks to political stability.
It is expected that there will be no major policy change before the presidential and general elections due to be held in October 2015. After having served two terms already President Kirchner is constitutionally prohibited from running again.
Political situationHead of state/government:President Christina Fernandez de Kirchner (since December 2007)
Government type:Republic
Population:42 million (est.)

5
Access to global capital markets remains blocked
Argentina went into sovereign default on July 30th, 2014, after the government failed to secure a settlement with litigant hold-out creditors in line with a US court ruling. This ruling effectively prohibits Argentina from making payments to restructured bond holders without also paying the hold-outs in full. So far, Argentina has missed two payments on its restructured bonds (although it did make the July payment to its trustee bank in New York, that payment did not reach bondholders due to legal injunctions).
The default has derailed the government’s efforts to improve its relations with international investors in the wake of rapidly declining international reserves and deterioration of the economic performance. With no resolution of the di-sagreement between the Argentine government and holdout creditors expected in the near future, the country will continue to be shut out of global capital mar-kets (Argentina has no access to capital markets since its default in 2001).
The default has resulted in another round of interventionist policy measures: In order to preserve official reserves, the government has restricted import pay-ments further and has tightened financial regulations, including forcing banks to sell their dollar holdings. To limit inflationary pressures, the government has implemented a new law to control prices, set profit margins and prevent supply shortages. Additional measures to boost the dollar supply can be expected. These may include regulations to force exporters to sell their dollar holdings and to curb tourism-related outflows. The Argentinian government has targeted some large international companies, accusing them of fiscal evasion and other offenses that appear driven by a need to raise revenue, but which the business community perceives as unfair harassment. Not surprisingly, some international companies are partially closing their plants or even leaving the country entirely due to lack of imported parts needed to complete production cycles.
Economic contraction continues
The debt default, increasing interventionist policies and decreased prices for commodities (especially soy beans) have exacerbated Argentina´s economic cri-sis. The economy contracted 1.6 % in 2014, and this negative trend is expected to continue in 2015, as exchange and price controls are forcing producers to scale back their activities. Unemployment is expected to rise to more than 11 % in 2015 and inflationary pressures to remain high. Domestic consumption conti-nues to suffer from low consumer confidence and widespread fear of job losses.
The Argentinian peso still remains substantially overvalued, and the risk of a steep and uncontrolled peso adjustment remains very high, given declining official reserves, lack of access to capital following the sovereign default and still substantial external arrears (interest arrears amount to about USD 15 billion). It is expected that in any case a currency depreciation will take place after the next presidential election in October 2015, which could trigger an increase in the already high inflation rate to more than 40 % in 2016.
Official reserves were at 4.8 months of imports in 2014, still above the threshold of three months, due to lower imports and oil prices, which somewhat mitigated the effect of lower prices for Argentina´s export commodities on the external accounts. Official reserves are however insufficient to cover the external refi-nancing needs.
Economic situation
3
2
1
0
-1
-2
2012 2013 2014 2015f 2016fSource: EIU, IMF
0.8
2.9
-1.6
-0.7
1.7
Real GDP growth (%)
The risk of a steep and uncontrolled peso adjustment remains very high.
50
40
30
20
10
0
2012 2013 2014 2015f 2016fSource: EIU, IMF
25.3 23.7
39.6
47.2
Inflation (%)
37.7

6
Increasing payment delays and defaults among importers
The unofficial USD exchange rate is almost 60 % higher than the official rate. This is making the availability of USD and other currencies very scarce for importers – regardless of the presence of an import contract/license – and puts further strain on businesses´ profitability if the peso devalues. The increasing shortage of foreign exchange for Argentine importers has already led to increa-sed payment delays and even defaults. Therefore caution is advised for expor-ters to Argentina. While they might have had good payment experiences in the past, the situation has worsened.
It is expected that the current government will launch additional business-un-friendly actions if fiscal conditions deteriorate further – increasing the risk of an even steeper recession and an uncontrolled currency devaluation. No policy improvements are expected before the presidential and parliamentary elections in October 2015 – i.e. only after a new government takes office at the end of the year. The same goes for a final settlement with Argentina´s hold out creditors. As long as there is no settlement Argentina´s financial situation will remain precarious.
2012 2013 2014 2015f 2016fSource: EIU, IMF
International reserves (in months of merchandise imports)
20
15
10
5
0
7.0
4.5 4.74.8 4.7

Brazil
7
China: 17.1 %
USA: 16.7 %
Argentina: 7.6 %
Germany: 6.3 %
South Korea: 4.0 %
China: 19.0 %
USA: 10.3 %
Argentina: 8.1 %
The Netherlands 7.2 %
Japan: 3.3 %
Main import sources (2013, % of total)
Main export markets (2013, % of total)
Good
Fair
Poor
Bleak
Excellent
Brazil industries performance outlook
Agriculture
Electronics/ICT
Automotive/Transport
Financial Services
Chemicals/Pharma
Food
Construction
Machines/Engineering
ConstructionMaterials
ConsumerDurables
Paper Services Steel TextilesMetals
March 2015
Key indicators 2012 2013 2014 2015* 2016*
Real GDP growth (y-on-y, % change) 1.0 2.5 0.1 0.3 1.5
Inflation (y-on-y, % change) 5.4 6.2 6.3 6.8 5.4
Real private consumption 3.2 1.8 1.1 0.3 1.8(y-on-y, % change)
Real exports of goods & non-factor 0.5 2.5 2.2 1.9 4.9services (y-on-y, % change)
Fiscal balance (% of GDP) -2.4 -3.2 -6.5 -4.8 -4.0
Current account/GDP (%) -2.4 -3.6 -4.1 -4.2 -4.1
Foreign debt/GDP (%) 20 22 25 30 32
Foreign debt/export of goods and 150 166 200 209 218services (%)
Short-term debt/international reserves (%) 9 11 15 15 17
International reserves (in months of 19.4 17.6 19.0 18.9 18.4merchandise imports)
* forecast Sources: IHS Global Insight, EIU, IMF

8
Growth in 2015 will remain subdued
Brazil’s large, diversified economy has underperformed since 2011 and even experienced a technical recession in H1 of 2014. Growth slowed down in 2014, mainly due to weak domestic and foreign demand and decreased commodity prices. Domestic demand has been adversely affected by decreasing consumer and business confidence in response to an unbalanced economic policy mix and increased state intervention under the first Rousseff administration. Additionally major supply side constraints (low investment and savings ratios, weak infra-structure, complex business and regulatory environment) had an adverse effect. The Brazilian economy is expected to grow only 0.3 % in 2015 after 0.2 % in 2014, as the much needed return to more orthodox economic policies will negatively weigh on growth in the short-term.
Relatively high inflation expected to persist
Fiscal policy has been quite expansionary in recent years, as investment to exploit the huge offshore oil fields, the 2014 FIFA World Cup and the 2016 Olympics fuelled public sector spending. The budget deficit increased to 3.2 % of GDP in 2014 and is forecast to increase to more than 6% of GDP in 2015. At 63 % of GDP, government debt was already fairly high in 2014, and is forecast to increase further in 2015, to 65 % of GDP. Most of the debt is domestically finan-ced in local currency at an average maturity of seven years.
Private consumption, which is Brazil´s main contributor to growth, is adversely affected by the adoption of austerity measures necessary to restore govern-ment finances. The steps have included boosting taxes and regulating prices, which have caused inflation to accelerate again in the short-term. To slow price increases, the Central Bank has raised the SELIC benchmark interest rate (its
Economic situation
0
-2
-4
-6
-8
-10
2012 2013 2014 2015f 2016fSource: EIU, IMF
-2.4-3.2
-6.5
-4.8-4.0
Fiscal balance (% of GDP)
5
4
3
2
1
0
2012 2013 2014 2015f 2016fSource: EIU, IMF
1.0
2.5
0.1 0.3
1.5
Real GDP growth (%)
A massive corruption scandal casts its shadow
In the October 2014 run-off presidential election Dilma Rousseff of the Wor-kers´ Party (Partido dos Trabalhadores, PT) was re-elected by a small margin of 51.6 % of the votes. This also mirrored public disappointment with her economic management as Brazilian GDP growth decelerated.
Rousseff´s first action after her re-election signalled a hopeful return to more orthodox macroeconomic policies, i.e. to combat inflation and to trim the budget deficit. In order to regain confidence in fiscal policy and stave off the growing risk of Brazil losing its investment grade rating from the major credit rating agencies, finance minister Guido Mantega was replaced by Joaquim Levy, a well-respected, orthodox economist, who already served under the admini-stration of president Lula and significantly improved government finances at that time.
However, since late 2014 the administration and the ruling Workers´ Party have come under pressure due to a massive corruption scandal: state prosecutors alleged leading construction and other businesses paid a huge amount of bribes to high-ranking officials of the state oil company Petrobras and certain politi-cians, mainly from the Workers´ Party, in return for contracts. Dozens of senior managers of Petrobras and other companies have been arrested in the mean-time.
Political situationHead of state/government:President Dilma Rousseff (since January 2011)
Form of government:A broad coalition, comprising the left-wing Workers’ Party (PT) and the centrist Democratic Movement Party (PMDB)
Population:202.8 million (est.)

9
overnight lending rate) four times since October 2014, to 12.75 %, the highest level in more than three years.
However, increased interest rates and high household indebtedness hamper private consumption growth and are expected to continue to do so in 2015. Both business and consumer confidence have been negatively affected by the Petrobras corruption scandal, which has severe consequences for the construc-tion and energy industries as well as, due to the scandal, new investments are being put on hold and many companies may face financial difficulties. Inflation is expected to remain above 6 % (the Central Banks´s target rate) in 2015. To further combat inflation, but also to prevent a further weakening of the exchan-ge rate, the Central Bank is expected to keep the SELIC at a high level.
Growth-enhancing structural reforms - reducing bureaucracy and corruption and improving education - are urgently needed to improve Brazil’s earnings capacity. An expansion of the currently more orthodox economic policy would also help to generate higher growth rates in the long-term. However, it remains uncertain if President Rousseff will continue to support more orthodox policies given that the adjustments will be politically painful. Social discontent over the poor quality of public services, corruption, and the weak state of the economy has already grown.
Still vulnerable to changing investors’ sentiment
Brazil remains vulnerable to changing investors’ sentiment, due to a relatively high stock of portfolio investment inflows (160 % of international reserves). This weakness became evident in mid-2013, when rumours that the US Federal Reserve would end its expansionary monetary policy led to investors withdra-wing short-term capital from Brazil. This put pressure on Brazil’s international reserves and exchange rate, with the Real strongly depreciating against the USD. Following a rebound at the end of 2014, in early 2015, the Brazilian real has again come under depreciation pressure.
Strong external fundamentals and good shock resistance
Brazil´s external financial situation is expected to remain strong. External debt is still quite low and liquidity is more than sufficient to cover imports (more than 18 months) and external refinancing needs. The current account deficit is expected to remain stable in 2015, at 4.2 % of GDP as decreasing export receipts are more or less counterbalanced by declining imports.
Brazil´s earning capacity is set to improve in the long-term, as there are large offshore pre-salt oil reserves (i.e. located below the deep layers of rock and salt off Brazil’s coast) estimated to be 50 billion barrels. More exploration of these resources could turn Brazil into one of the largest oil-producers in the world. However, this would require large investments in the highly complex and capi-tal-intensive deep water developments. For these to materialise, Brazil would have to improve its business environment.
2012 2013 2014 2015f 2016fSource: EIU, IMF
Inflation (%)10
8
6
4
2
0
5.46.2
6.86.3
5.4
2012 2013 2014 2015f 2016fSource: EIU, IMF
Foreign debt/GDP (%)50
40
30
20
10
0
20 22
3025
32
2012 2013 2014 2015f 2016fSource: EIU, IMF
Current account/GDP (%)0
-1
-2
-3
-4
-5
-2.4
-3.6
-4.2-4.1 -4.1

Chile
10
USA: 21.5 %
China: 20.9 %
Brazil: 6.8 %
Argentina: 5.3 %
Germany: 4.0 %
China: 24.8 %
USA: 12.7 %
Japan: 9.9 %
Brazil: 5.7 %
South Korea: 5.5 %
Main import sources (2013, % of total)
Main export markets (2013, % of total)
Good
Fair
Poor
Bleak
Excellent
Chile industries performance outlook
Agriculture
Electronics/ICT
Automotive/Transport
Financial Services
Chemicals/Pharma
Food
Construction
Machines/Engineering
ConstructionMaterials
ConsumerDurables
Paper Services Steel TextilesMetals
March 2015
Key indicators 2012 2013 2014 2015* 2016*
Real GDP growth (y-on-y, % change) 5.5 4.2 1.7 2.7 3.7
Inflation (y-on-y, % change) 3.0 1.8 4.4 3.2 3.0
Real private consumption 5.9 5.6 2.3 2.5 3.3(y-on-y, % change)
Real exports of goods & non-factor 1.1 4.2 1.9 2.8 2.5services (y-on-y, % change)
Fiscal balance (% of GDP) 0.7 -0.6 -2.1 -2.3 -1.8
Current account/GDP (%) -3.4 -3.4 -1.5 -1.6 -1.6
Foreign debt/GDP (%) 44 47 50 59 60
Foreign debt/export of goods and 122 136 151 159 157services (%)
Short-term debt/international reserves (%) 55 50 46 44 47
International reserves (in months of 6.3 6.0 6.6 6.9 6.4merchandise imports)
* forecast Sources: IHS Global Insight, EIU, IMF

11
Resilient to economic downturns
Chile’s open economy is highly dependent on copper exports (accounting for more than 50 % of export earnings) and on the global financial cycle (due to its large internationally integrated financial sector). However, the economy´s shock resistance is strong, given prudent macroeconomic and financial policies and low public debt (less than 20 % of GDP). Taking into account Chile´s Sovereign Wealth Fund the state is even a net creditor. Those strengths enable the exchan-ge rate to act as a shock absorber should there be a serious economic down-turns and if there is volatility in global financial markets. The Chilean business environment is one of the best in the region and the government continues to stimulate foreign investment with its economic policy. A good infrastructure is a major asset, while regional and multilateral trade agreements have led to a solid increase in foreign trade.
Higher growth expected in 2015
In 2014 the economy struggled with some short-term challenges stemming from the end of the global commodity boom (especially lower imports from China) and lower domestic demand, affecting both investments and consumpti-on. Real GDP growth slowed to 1.7 % last year, and inflation increased to 4.3 % on the back of several interest rate cuts in H2 of 2014 intended to stimula-te the economy. Inflation is expected to decrease again and economic growth to increase again (up 2.7 %) in 2015 due to expansionary policies to boost domestic demand, new mining activity and some recovery of external demand. However, given the expected lower demand for copper in the coming years – at least compared to previous years - investment in the country‘s mining sector should be lower than before.
Chile´s banking sector is relatively large (assets exceeding 200 % of GDP), but healthy, well-regulated and sufficiently capitalized (with a capital adequacy ratio of 13.5 %). The credit quality is good, with low nonperforming loans.
The country´s external economic position is solid, with a low current account deficit, due to lower imports and decreased oil prices (Chile is a net-importer of oil). External debt has increased somewhat, but is mostly longterm and easily manageable (with debt service of 25 % of exports of goods and services; 60 % of the debt is related to the non-financial corporate sector). External liquidity is sufficient, and access to capital markets is good.
Economic situation
10
8
6
4
2
0
2012 2013 2014 2015f 2016fSource: EIU, IMF
5.54.2
1.72.7
3.7
Real GDP growth (%)
2
1
0
-1
-2
-3
2012 2013 2014 2015f 2016fSource: EIU, IMF
0.7
-0.6
-2.1 -2.3-1.8
Fiscal balance (% of GDP)
Stable – government has a broad majority in parliament
In March 2014 Michelle Bachelet, who was already in power between 2006 and 2010, took over the presidency from Sebastian Piñera. Bachelet prevailed in the 2013 presidential election by promising to foster inclusive growth and to reduce social inequality. Since her inauguration she has launched an ambitious policy agenda with reforms in several important areas, including taxation, education, productivity, and energy. President Bachelet succeeded to secure parliamentary approval of her tax reform (increase of corporate tax rate), and is expected to focus on education reform and changes to labour laws in the short-term future. Currently her administration is backed by a comfortable majority of the cen-tre-left Nueva Mayoría coalition in both houses of Congress (68 out of 120 seats in the House of Deputies and 21 out of 38 seats in the Senate).
Political situationHead of state/government:President Michelle Bachelet (since March 2014)
Government type:Republic
Population:17.7 million (est.)
0
-1
-2
-3
-4
-5
2012 2013 2014 2015f 2016fSource: EIU, IMF
-3.4 -3.4
-1.5 -1.6 -1.6
Current account (% of GDP)

Colombia
12
USA: 27. 7 %
China: 17.5 %
Mexico: 9.3 %
Brazil: 4.4 %
Germany: 3.7 %
USA: 31.8 %
China: 8.7 %
Panama: 5.5 %
India: 5.1 %
Spain: 4.9 %
Main import sources (2013, % of total)
Main export markets (2013, % of total)
Good
Fair
Poor
Bleak
Excellent
Colombia industries performance outlook
Agriculture
Electronics/ICT
Automotive/Transport
Financial Services
Chemicals/Pharma
Food
Construction
Machines/Engineering
ConstructionMaterials
ConsumerDurables
Paper Services Steel TextilesMetals
March 2015
Key indicators 2012 2013 2014 2015* 2016*
Real GDP growth (y-on-y, % change) 4.0 4.7 4.8 3.8 4.3
Inflation (y-on-y, % change) 3.2 2.0 2.9 3.6 3.4
Real private consumption 4.4 4.2 4.8 4.3 4.1(y-on-y, % change)
Real exports of goods & non-factor 6.1 5.4 0.7 5.3 5.7services (y-on-y, % change)
Fiscal balance (% of GDP) 0.4 -0.9 -1.8 -2.1 -1.3
Current account/GDP (%) -3.0 -3.4 -4.4 -6.4 -4.5
Foreign debt/GDP (%) 21 24 26 32 31
Foreign debt/export of goods and 113 134 151 175 161services (%)
Short-term debt/international reserves (%) 29 26 25 31 32
International reserves (in months of 7.4 8.5 9.4 9.5 9.6merchandise imports)
* forecast Sources: IHS Global Insight, EIU, IMF

13
Strong economic performance
Given its wide range of mineral and agricultural commodities, Colombia is one of South America´s most attractive investment locations. This, together with buoyant private consumption and exports (helped by the deliberate extension of bilateral and multilateral free trade agreements) has led to annual GDP growth rates of more than 4 % since 2011. Structural GDP growth is underpinned by a good and further improving business climate and a growing middle class. Ho-wever, poverty and unemployment remain high, and the poor infrastructure and high corruption remain issues that hamper the economy.
In 2015, growth is expected to slow down somewhat (to 3.8 %) due to lower commodity prices, while robust domestic demand should sustain growth. A further decrease in commodity prices, however, remains a downside risk, given Colombia´s dependency on coal and energy exports. Inflation is also set to increase, but forecast to remain within the Central Bank´s target range of 2-4 %. The banking sector is well managed, well capitalised and profitable.
Prudent economic policies – but structural reforms needed
Sound economic policies have contributed to a much improved earnings capa-city and economic resilience. The fiscal policy is prudent, helped by a structural fiscal balance rule, with nominal budget deficits reduced to less than 2 % of GDP and primary budget surpluses. Government debt is stable at around 40 % of GDP. Monetary policy was tightened in 2014, with the interest rate currently at 4.5 % (up from 3.25 % in March 2014). The exchange rate is flexible and super-vision is effective. However, in order to improve fiscal flexibility a reform of the complicated tax system would help to tackle the large informal economy and to improve local government finances. In order to promote sustainable long-term economic growth, job growth promotion, social reforms and infrastructure improvement would be necessary.
Economic situation
5
4
3
2
1
0
2012 2013 2014 2015f 2016fSource: EIU, IMF
3.2
2.0
2.9
3.63.4
Inflation (%)
10
8
6
4
2
0
2012 2013 2014 2015f 2016fSource: EIU, IMF
4.04.7 4.8
3.8 4.3
Real GDP growth (%)
Improved, but still not stable security situation
For more than five decades Colombia’s state authority has been challenged by (drug-financed) guerrilla groups. In 2002 former President Uribe finally step-ped up the fight against those forces, supported by the US. This more robust strategy was successful, as since then the guerrilla movement has lost territory and military strength, resulting in an improved security situation. That said, the guerrillas have not yet been completely defeated. Incumbent President Santos has started negotiations with the main guerrilla group FARC, but a final settle-ment has not been reached yet.
Despite significant economic progress, Colombia still has high poverty and ine-quality rates, especially in rural areas. Public discontent about the slow pace of tackling long-lasting social issues has grown. Given the lack of a peace accord, a sudden deterioration of the security situation could have a marked effect on business, investor and consumer confidence.
Political situationHead of state/government:President Juan Manuel Santos (since August 2010; re-elected in 2014)
Government type:Republic
Population:49.5 million (est.)
2
1
0
-1
-2
-3
2012 2013 2014 2015f 2016fSource: EIU, IMF
0.4
-0.9
-1.8-2.1
-1.3
Fiscal balance (% of GDP)

14
Solid external fundamentals
Colombia’s external economic position is solid. Foreign debt amounted to a manageable 26 % of GDP in 2014. The international liquidity position is sound and supported by an excellent reputation in the financial markets and a precau-tionary IMF Flexible Credit Line of USD 5.8 billion. The Colombian peso came under depreciation pressure last year by financial market volatility (caused by an earlier expected monetary policy normalisation in the US). However, the effects remained manageable.
Despite diversification of Colombia’s exports (with respect to goods and markets), the trade position has deteriorated in 2014, caused by declining oil exports due to pipeline repairs and lower commodity prices. This has resulted in an increase in the current account deficit to 4.4 % in 2014, which is forecast to widen further in 2015. However, those deficits remain manageable and can be easily financed by capital inflows, especially foreign direct investments. Interna-tional reserves are expected to remain above 9 months of import cover in 2015.
50
40
30
20
10
0
2012 2013 2014 2015f 2016fSource: EIU, IMF
2124 26
32 31
Foreign debt/GDP (%)
0
-2
-4
-6
-8
-10
2012 2013 2014 2015f 2016fSource: EIU, IMF
-3.0 -3.4-4.4
-6.4
-4.5
Current account (% of GDP)

Peru
15
USA: 26.2 %
China: 16.1 %
Brazil: 5.6 %
Argentina 5.0 %
Ecuador: 4.5 %
USA: 17.7 %
China: 17.1 %
Switzerland: 7.2 %
Canada: 6.7 %
Japan: 5.0 %
Main import sources (2013, % of total)
Main export markets (2013, % of total)
Good
Fair
Poor
Bleak
Excellent
Peru industries performance outlook
Agriculture
Electronics/ICT
Automotive/Transport
Financial Services
Chemicals/Pharma
Food
Construction
Machines/Engineering
ConstructionMaterials
ConsumerDurables
Paper Services Steel TextilesMetals
March 2015
Key indicators 2012 2013 2014 2015* 2016*
Real GDP growth (y-on-y, % change) 5.9 5.7 2.7 4.4 5.1
Inflation (y-on-y, % change) 3.7 2.8 3.2 2.8 3.2
Real private consumption 6.1 5.3 4.5 4.9 4.6(y-on-y, % change)
Real exports of goods & non-factor 3.7 -0.9 -3.6 1.5 2.0services (y-on-y, % change)
Fiscal balance (% of GDP) 2.2 0.9 -0.2 -0.4 0.1
Current account/GDP (%) -3.1 -4.4 -4.8 -4.8 -4.6
Foreign debt/GDP (%) 27 27 28 26 25
Foreign debt/export of goods and 103 115 132 128 115services (%)
Short-term debt/international reserves (%) 14 10 7 6 6
International reserves (in months of 18.1 18.4 19.1 18.3 17.2merchandise imports)
* forecast Sources: IHS Global Insight, EIU, IMF
16
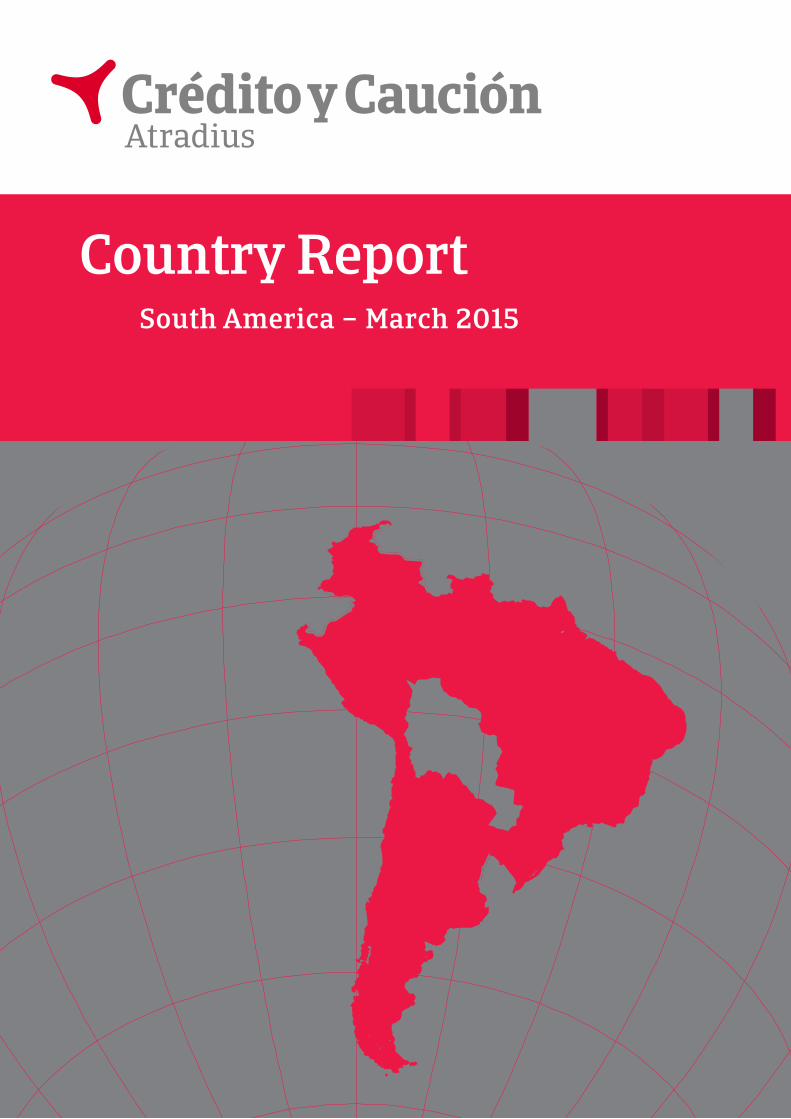
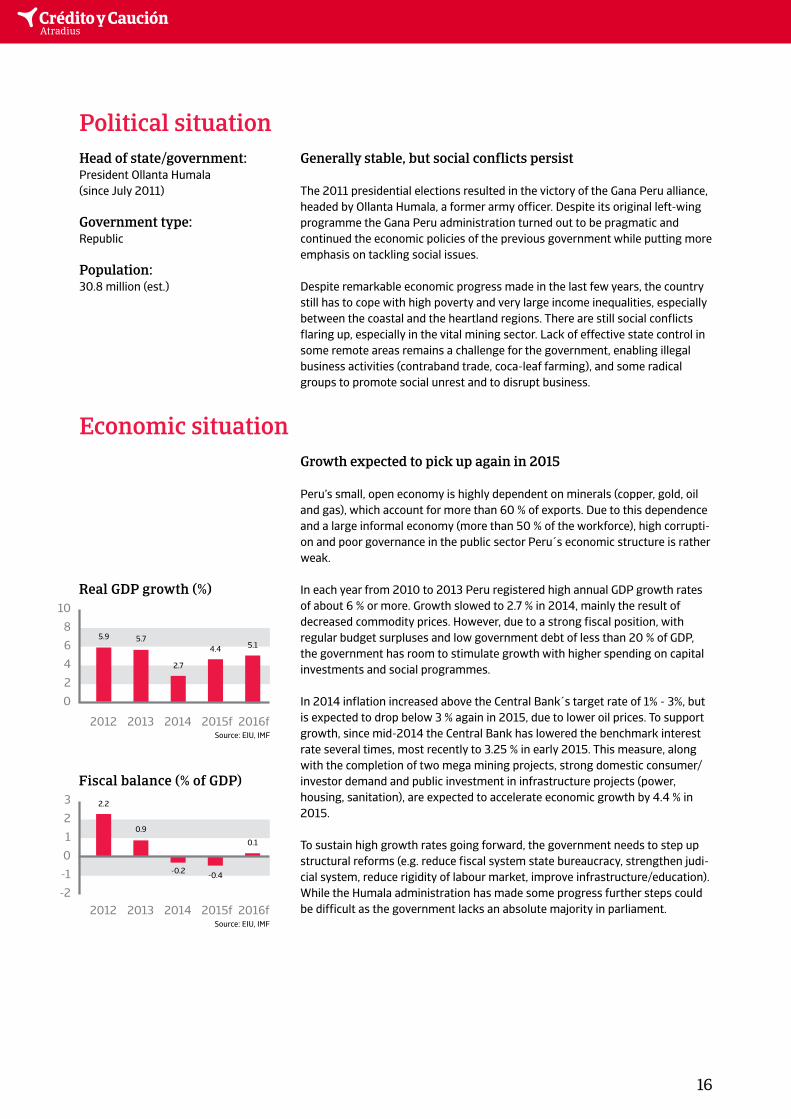
Growth expected to pick up again in 2015
Peru’s small, open economy is highly dependent on minerals (copper, gold, oil and gas), which account for more than 60 % of exports. Due to this dependence and a large informal economy (more than 50 % of the workforce), high corrupti-on and poor governance in the public sector Peru´s economic structure is rather weak.
In each year from 2010 to 2013 Peru registered high annual GDP growth rates of about 6 % or more. Growth slowed to 2.7 % in 2014, mainly the result of decreased commodity prices. However, due to a strong fiscal position, with regular budget surpluses and low government debt of less than 20 % of GDP, the government has room to stimulate growth with higher spending on capital investments and social programmes.
In 2014 inflation increased above the Central Bank´s target rate of 1% - 3%, but is expected to drop below 3 % again in 2015, due to lower oil prices. To support growth, since mid-2014 the Central Bank has lowered the benchmark interest rate several times, most recently to 3.25 % in early 2015. This measure, along with the completion of two mega mining projects, strong domestic consumer/investor demand and public investment in infrastructure projects (power, housing, sanitation), are expected to accelerate economic growth by 4.4 % in 2015.
To sustain high growth rates going forward, the government needs to step up structural reforms (e.g. reduce fiscal system state bureaucracy, strengthen judi-cial system, reduce rigidity of labour market, improve infrastructure/education). While the Humala administration has made some progress further steps could be difficult as the government lacks an absolute majority in parliament.
Economic situation
3
2
1
0
-1
-22012 2013 2014 2015f 2016f
Source: EIU, IMF
2.2
0.9
-0.2 -0.4
0.1
Fiscal balance (% of GDP)
Generally stable, but social conflicts persist
The 2011 presidential elections resulted in the victory of the Gana Peru alliance, headed by Ollanta Humala, a former army officer. Despite its original left-wing programme the Gana Peru administration turned out to be pragmatic and continued the economic policies of the previous government while putting more emphasis on tackling social issues.
Despite remarkable economic progress made in the last few years, the country still has to cope with high poverty and very large income inequalities, especially between the coastal and the heartland regions. There are still social conflicts flaring up, especially in the vital mining sector. Lack of effective state control in some remote areas remains a challenge for the government, enabling illegal business activities (contraband trade, coca-leaf farming), and some radical groups to promote social unrest and to disrupt business.
Political situationHead of state/government:President Ollanta Humala (since July 2011)
Government type:Republic
Population:30.8 million (est.)
10
8
6
4
2
0
2012 2013 2014 2015f 2016fSource: EIU, IMF
5.9 5.7
2.7
4.4 5.1
Real GDP growth (%)

17
Solid external financial position
Peru’s liquidity situation is very strong, with international reserves amounting to more than 18 months of import cover - more than sufficient to cover external financing needs. Solvency is under control, despite increased external borrowing by the private sector, as foreign debt is expected to amount to 26 % of GDP in 2015 and debt service is manageable at 15 %. The current account deficits are moderate and to a large extent, but no longer fully, covered by foreign direct investments in the mineral/mining sector. The solid liquidity and solvency ratio bolster Peru´s resilience against external economic shocks.
Some risks persist
Main risks to Peru´s economic outlook are a hard landing of the Chinese eco-nomy and growing social unrest in the mining sector, which would negatively affect the investment climate. At the same time Peru’s small, but well-capitali-sed and supervised financial sector is highly dollarized (i.e., the USD is preferred in large transactions and in savings, leaving it exposed to potential currency risk.
50
40
30
20
10
0
2012 2013 2014 2015f 2016fSource: EIU, IMF
27 27 28 26 25
Foreign debt/GDP

Paseo de la Castellana, 4
28046 Madrid
T. +34 914 326 300
F. +34 914 326 501
creditoycaucion.es
DisclaimerThis report is provided for information purposes only and is not intended as a recommendation as to particular transactions, investments or strategies in any way to any reader. Readers must make their own independent decisions, commercial or otherwise, regarding the information provided. While we have made every attempt to ensure that the information contained in this report has been obtained from reliable sources, Atradius is not responsible for any errors or omissions, or for the results obtained from the use of this information. All information in this report is provided ’as is’, with no guarantee of completeness, accuracy, timeliness or of the results obtained from its use, and without warranty of any kind, express or implied. In no event will Atradius, its related partnerships or corporations, or the partners, agents or employees thereof, be liable to you or anyone else for any decision made or action taken in reliance on the information in this report or for any consequential, special or similar damages, even if advised of the possibility of such damages.
Copyright Atradius N.V. 2015
Related Documents