Country overview slides Econ. 312/512

Country overview slides Econ. 312/512. Population distribution by major world region, estimates & projections, 1800 -2050 (%) Region180018501900195020002050.
Dec 20, 2015
Welcome message from author
This document is posted to help you gain knowledge. Please leave a comment to let me know what you think about it! Share it to your friends and learn new things together.
Transcript

Country overview slidesEcon. 312/512
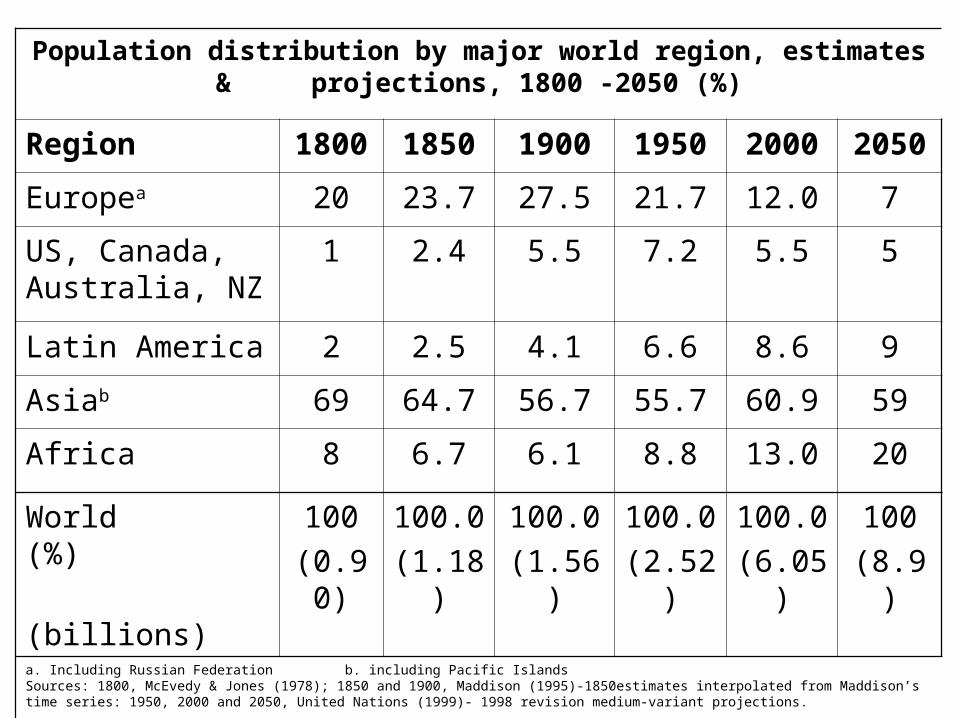
Population distribution by major world region, estimates & projections, 1800 -2050 (%)
Region 1800 1850 1900 1950 2000 2050
Europea 20 23.7 27.5 21.7 12.0 7
US, Canada, Australia, NZ
1 2.4 5.5 7.2 5.5 5
Latin America 2 2.5 4.1 6.6 8.6 9
Asiab 69 64.7 56.7 55.7 60.9 59
Africa 8 6.7 6.1 8.8 13.0 20
World (%)
(billions)
100
(0.90)
100.0
(1.18)
100.0
(1.56)
100.0
(2.52)
100.0
(6.05)
100
(8.9)
a. Including Russian Federation b. including Pacific IslandsSources: 1800, McEvedy & Jones (1978); 1850 and 1900, Maddison (1995)-1850estimates interpolated from Maddison’s time series: 1950, 2000 and 2050, United Nations (1999)- 1998 revision medium-variant projections.

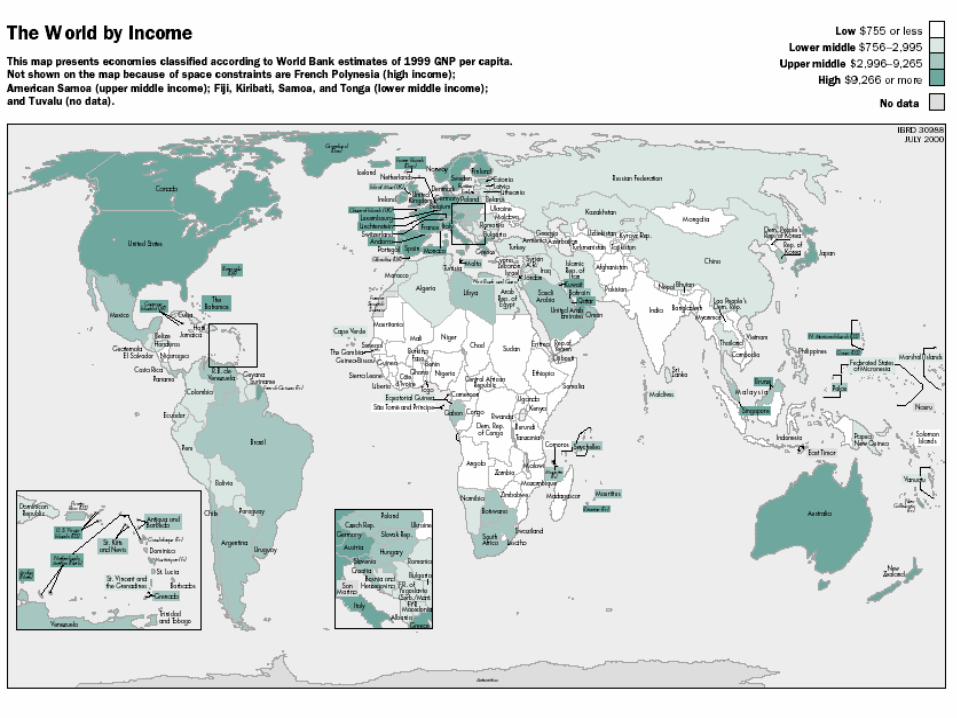
The distribution of HIV/AIDS around the world,
end of 2000
Region Adults & Children
newly infected with HIV
Adults & Children
living with HIV/AIDS
Adult HIV/AIDS
Prevalence Rate
Number % Number % %
Sub-Saharan Africa 3,800,000 71.4 25,300,000 70.1 8.8
South & South-East Asia 780,000 14.6 5,800,000 16.1 0.6
Latin America 150,000 2.8 1,400,000 3.9 0.5
East Asia & Pacific 130,000 2.4 640,000 1.8 0.1
East. Europe & Central Asia 250,000 4.7 700,000 1.9 0.4
Caribbean 60,000 1.1 390,000 1.1 2.3
North Africa & Middle East 80,000 1.5 400,000 1.1 0.2
North America 45,000 0.8 920,000 2.5 0.6
Western Europe 30,000 0.6 540,000 1.5 0.2
Australia & New Zealand 500 0.0 15,000 0.0 0.1
Total 5,300,000 100 36,100,000 100
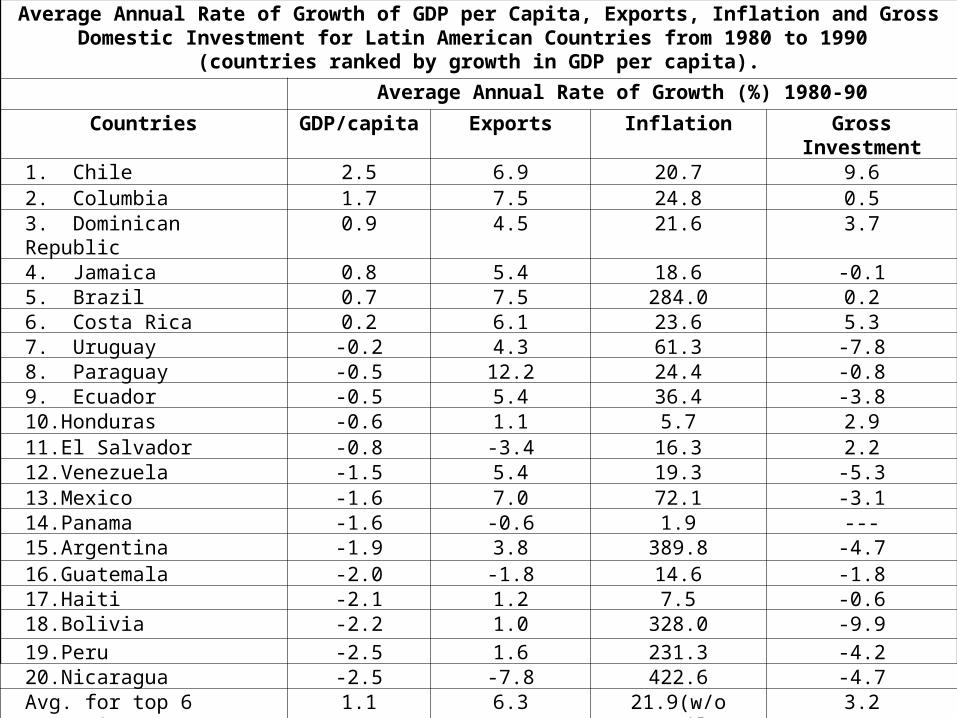
Average Annual Rate of Growth of GDP per Capita, Exports, Inflation and Gross Domestic Investment for Latin American Countries from 1980 to 1990
(countries ranked by growth in GDP per capita).
Average Annual Rate of Growth (%) 1980-90
Countries GDP/capita Exports Inflation Gross Investment1. Chile 2.5 6.9 20.7 9.62. Columbia 1.7 7.5 24.8 0.53. Dominican Republic 0.9 4.5 21.6 3.74. Jamaica 0.8 5.4 18.6 -0.15. Brazil 0.7 7.5 284.0 0.26. Costa Rica 0.2 6.1 23.6 5.37. Uruguay -0.2 4.3 61.3 -7.88. Paraguay -0.5 12.2 24.4 -0.89. Ecuador -0.5 5.4 36.4 -3.810.Honduras -0.6 1.1 5.7 2.911.El Salvador -0.8 -3.4 16.3 2.212.Venezuela -1.5 5.4 19.3 -5.313.Mexico -1.6 7.0 72.1 -3.114.Panama -1.6 -0.6 1.9 ---15.Argentina -1.9 3.8 389.8 -4.716.Guatemala -2.0 -1.8 14.6 -1.817.Haiti -2.1 1.2 7.5 -0.618.Bolivia -2.2 1.0 328.0 -9.9
19.Peru -2.5 1.6 231.3 -4.220.Nicaragua -2.5 -7.8 422.6 -4.7Avg. for top 6 countriesAvg. for middle 8 countriesAvg. for bottom 6 countries
1.1-0.9-2.2
6.33.9
-0.9
21.9(w/o Brazil)29.7
232.6
3.2-2.2
-4.3
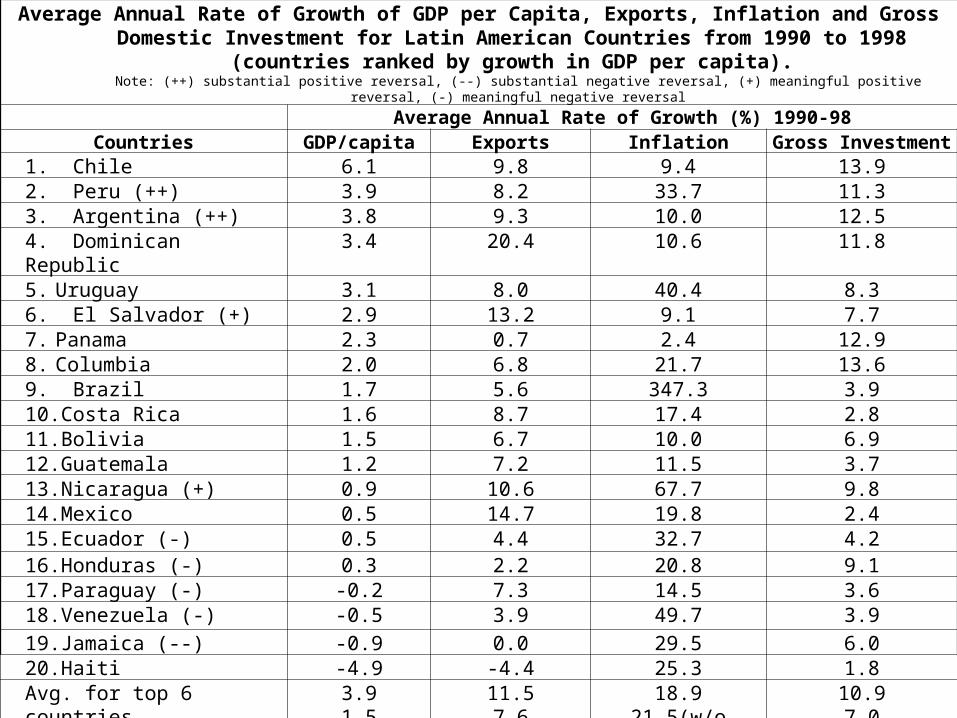
Average Annual Rate of Growth of GDP per Capita, Exports, Inflation and Gross Domestic Investment for Latin American Countries from 1990 to 1998
(countries ranked by growth in GDP per capita). Note: (++) substantial positive reversal, (--) substantial negative reversal, (+) meaningful positive reversal, (-) meaningful negative reversal
Average Annual Rate of Growth (%) 1990-98Countries GDP/capita Exports Inflation Gross Investment
1. Chile 6.1 9.8 9.4 13.92. Peru (++) 3.9 8.2 33.7 11.33. Argentina (++) 3.8 9.3 10.0 12.54. Dominican Republic 3.4 20.4 10.6 11.85. Uruguay 3.1 8.0 40.4 8.36. El Salvador (+) 2.9 13.2 9.1 7.77. Panama 2.3 0.7 2.4 12.98. Columbia 2.0 6.8 21.7 13.69. Brazil 1.7 5.6 347.3 3.910.Costa Rica 1.6 8.7 17.4 2.811.Bolivia 1.5 6.7 10.0 6.912.Guatemala 1.2 7.2 11.5 3.713.Nicaragua (+) 0.9 10.6 67.7 9.814.Mexico 0.5 14.7 19.8 2.415.Ecuador (-) 0.5 4.4 32.7 4.216.Honduras (-) 0.3 2.2 20.8 9.117.Paraguay (-) -0.2 7.3 14.5 3.618.Venezuela (-) -0.5 3.9 49.7 3.919.Jamaica (--) -0.9 0.0 29.5 6.020.Haiti -4.9 -4.4 25.3 1.8Avg. for top 6 countriesAvg. for middle 8 countriesAvg. for bottom 6 countries
3.91.5-0.8
11.57.6
2.2
18.921.5(w/o Brazil)
28.9
10.97.0
4.8
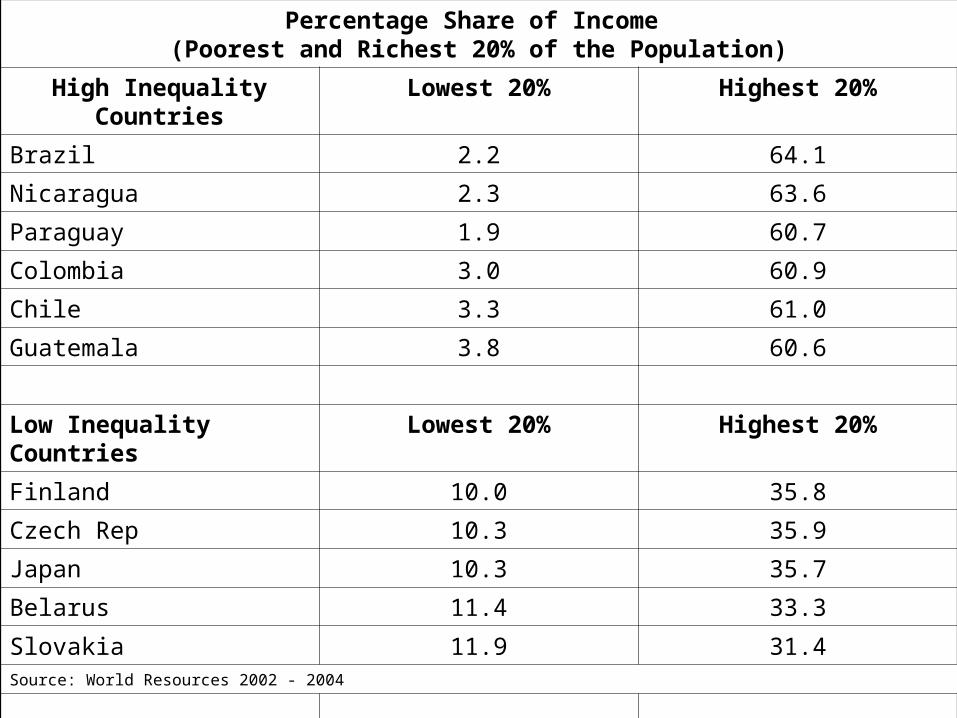
Percentage Share of Income (Poorest and Richest 20% of the Population)
High Inequality Countries Lowest 20% Highest 20%
Brazil 2.2 64.1
Nicaragua 2.3 63.6
Paraguay 1.9 60.7
Colombia 3.0 60.9
Chile 3.3 61.0
Guatemala 3.8 60.6
Low Inequality Countries Lowest 20% Highest 20%
Finland 10.0 35.8
Czech Rep 10.3 35.9
Japan 10.3 35.7
Belarus 11.4 33.3
Slovakia 11.9 31.4Source: World Resources 2002 - 2004
United States 4.8 45.2
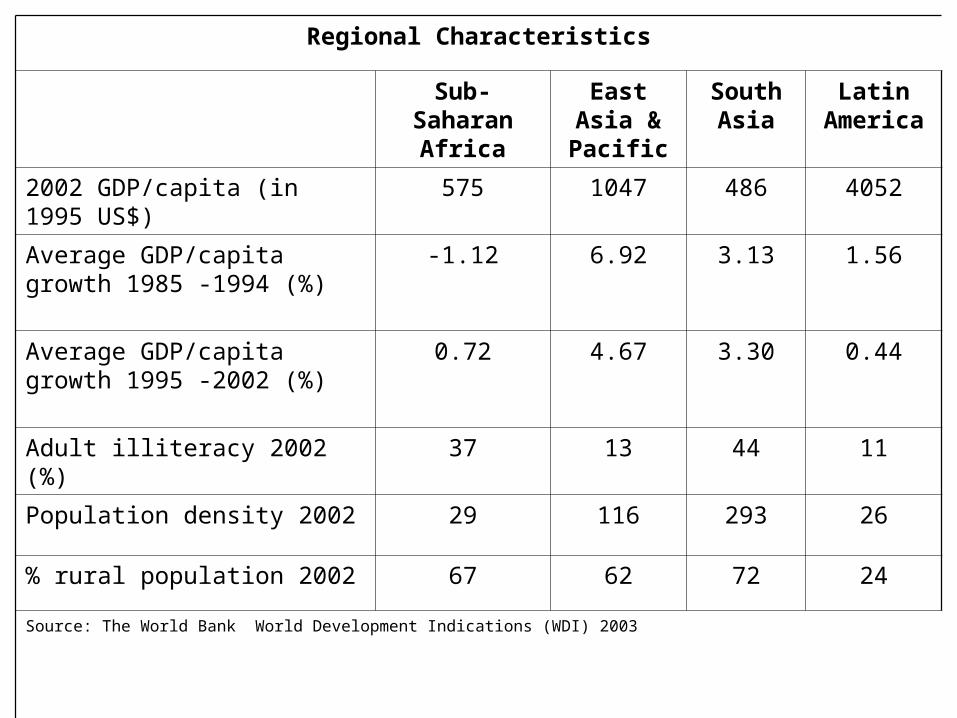
Regional Characteristics
Sub-Saharan Africa
East Asia & Pacific
South Asia
Latin America
2002 GDP/capita (in 1995 US$) 575 1047 486 4052
Average GDP/capita growth 1985 -1994 (%)
-1.12 6.92 3.13 1.56
Average GDP/capita growth 1995 -2002 (%)
0.72 4.67 3.30 0.44
Adult illiteracy 2002 (%) 37 13 44 11
Population density 2002 29 116 293 26
% rural population 2002 67 62 72 24
Source: The World Bank World Development Indications (WDI) 2003

Democracy, Liberal Democracy, and “Free” States by Region (and Cultural Grouping), 1999 - 2000
Region Number of Countries
Number of Democracies (% of total)
“Free” States (% of total)
Liberal Democracies (% of total)
Western Europe and Anglophone states
28 28 (100%) 28 (100%) 28 (100%)
Latin America and Caribbean
33 29 (88%) 20 (70%) 16 (48%)
South America 12 11 (92%) 6 (50%) 4 (33%)
East Central Europe and Baltic States
15 14 (93%) 10 (67%) 9 (60%)
Former Soviet Union (less Baltics)
12 5 (42%)4 (33%) *
0 0
Asia (East, SE, South) 26 12 (46%) 8 (31%) 3 (12%)
Pacific Island 11 10 (91%) 9 (82%) 9 (82%)
Africa (Sub-Sahara) 48 20 (42%)16 (33%) *
8 (17%) 5 (10%)
Middle East-North Africa 19 2 (11%) 1 (5%) 1 (5%)
Total 192 120 (63%)115 (69%) *
85 (44%) 71 (37%)
Arab Countries 16 0 0 0
Predominantly Muslim Countries
41 8 (20%)5 (12%) *
1 (2%) 0
Source: 1999 Freedom House survey; Journal of Democracy, January 2000, pp. 187-200
*Indicates a regime classification of the author that differs from that of Freedom House (FH). Freedom House rates Djibouti, the Kyrgyz Republic, Liberia, Niger, and Sierra Leone
as electoral democracies, but all five to have levels of coercion and fraud that make the electoral process less than free and fair. Other countries rated as electoral
democracies have only dubiously democratic elections, including Russia, Nigeria, and Indonesia.
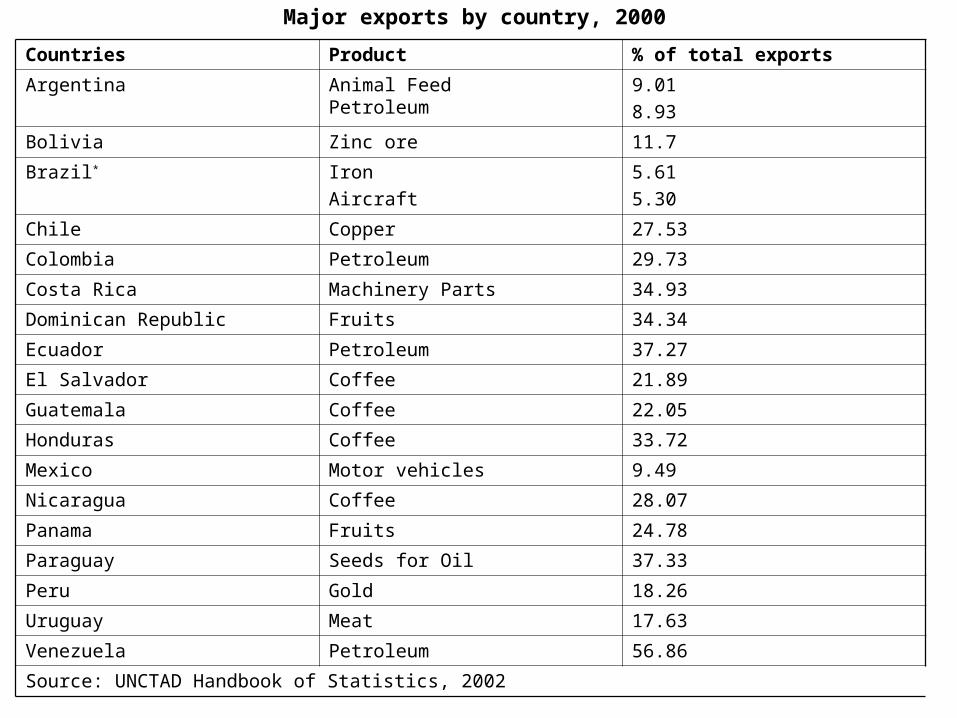
Major exports by country, 2000
Countries Product % of total exports
Argentina Animal FeedPetroleum
9.01
8.93
Bolivia Zinc ore 11.7
Brazil* Iron
Aircraft
5.61
5.30
Chile Copper 27.53
Colombia Petroleum 29.73
Costa Rica Machinery Parts 34.93
Dominican Republic Fruits 34.34
Ecuador Petroleum 37.27
El Salvador Coffee 21.89
Guatemala Coffee 22.05
Honduras Coffee 33.72
Mexico Motor vehicles 9.49
Nicaragua Coffee 28.07
Panama Fruits 24.78
Paraguay Seeds for Oil 37.33
Peru Gold 18.26
Uruguay Meat 17.63
Venezuela Petroleum 56.86
Source: UNCTAD Handbook of Statistics, 2002
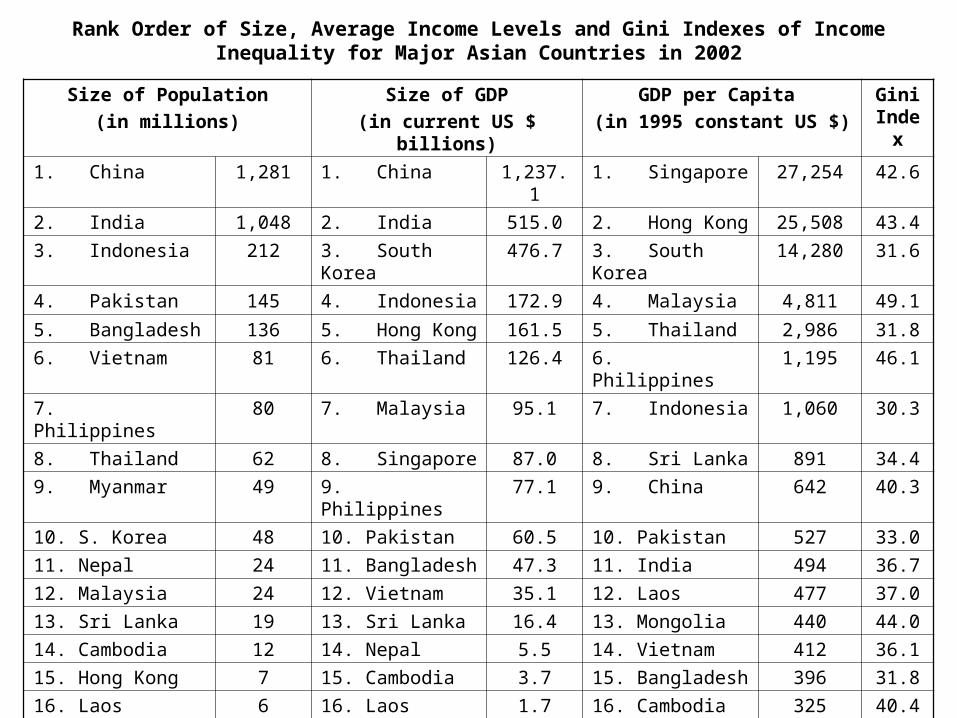
Rank Order of Size, Average Income Levels and Gini Indexes of Income Inequality for Major Asian Countries in 2002
Size of Population
(in millions)
Size of GDP
(in current US $ billions)
GDP per Capita
(in 1995 constant US $)
Gini Index
1. China 1,281 1. China 1,237.1 1. Singapore 27,254 42.6
2. India 1,048 2. India 515.0 2. Hong Kong 25,508 43.4
3. Indonesia 212 3. South Korea 476.7 3. South Korea 14,280 31.6
4. Pakistan 145 4. Indonesia 172.9 4. Malaysia 4,811 49.1
5. Bangladesh 136 5. Hong Kong 161.5 5. Thailand 2,986 31.8
6. Vietnam 81 6. Thailand 126.4 6. Philippines 1,195 46.1
7. Philippines 80 7. Malaysia 95.1 7. Indonesia 1,060 30.3
8. Thailand 62 8. Singapore 87.0 8. Sri Lanka 891 34.4
9. Myanmar 49 9. Philippines 77.1 9. China 642 40.3
10. S. Korea 48 10. Pakistan 60.5 10. Pakistan 527 33.0
11. Nepal 24 11. Bangladesh 47.3 11. India 494 36.7
12. Malaysia 24 12. Vietnam 35.1 12. Laos 477 37.0
13. Sri Lanka 19 13. Sri Lanka 16.4 13. Mongolia 440 44.0
14. Cambodia 12 14. Nepal 5.5 14. Vietnam 412 36.1
15. Hong Kong 7 15. Cambodia 3.7 15. Bangladesh 396 31.8
16. Laos 6 16. Laos 1.7 16. Cambodia 325 40.4
17. Mongolia 2 17. Mongolia 1.3 17. Nepal 241 36.7
East Asia & Pacific 1,838 1,802.1 1,047
South Asia 1,401 655.0 486Source: World Development Indicators database
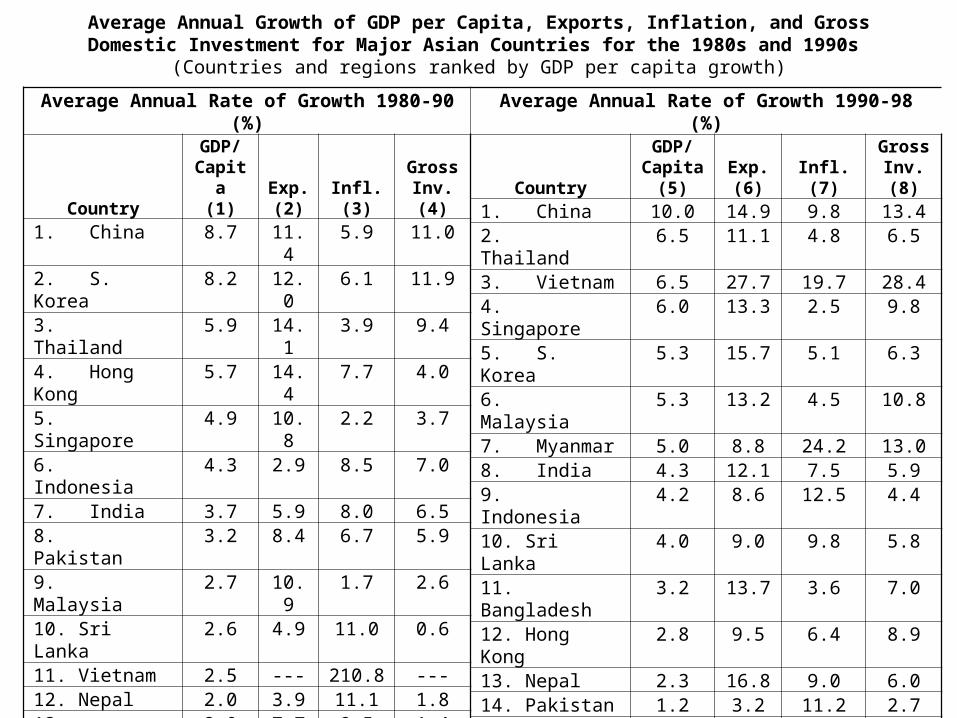
Average Annual Growth of GDP per Capita, Exports, Inflation, and Gross Domestic Investment for Major Asian Countries for the 1980s and 1990s
(Countries and regions ranked by GDP per capita growth)
Average Annual Rate of Growth 1980-90 (%)
Country
GDP/Capita
(1)Exp.(2)
Infl.(3)
GrossInv.(4)
1. China 8.7 11.4 5.9 11.02. S. Korea 8.2 12.0 6.1 11.93. Thailand 5.9 14.1 3.9 9.44. Hong Kong 5.7 14.4 7.7 4.05. Singapore 4.9 10.8 2.2 3.76. Indonesia 4.3 2.9 8.5 7.07. India 3.7 5.9 8.0 6.58. Pakistan 3.2 8.4 6.7 5.99. Malaysia 2.7 10.9 1.7 2.610. Sri Lanka 2.6 4.9 11.0 0.611. Vietnam 2.5 --- 210.8 ---12. Nepal 2.0 3.9 11.1 1.813. Bangladesh 2.0 7.7 9.5 1.414. Mongolia -1.2 --- -1.6 1.715. Philippines -1.4 3.5 14.9 -2.1
Region % % % %1. East Asia 5.3 12.6 6.6 7.12. S.E. Asia 3.4 8.4 6.2* 4.13. South Asia 2.7 6.1 9.2 3.2
* without VietnamSources: World Development Reports 1997 and 1999,
Average Annual Rate of Growth 1990-98 (%)
Country
GDP/Capita
(5)Exp.(6)
Infl.(7)
GrossInv.(8)
1. China 10.0 14.9 9.8 13.42. Thailand 6.5 11.1 4.8 6.53. Vietnam 6.5 27.7 19.7 28.44. Singapore 6.0 13.3 2.5 9.85. S. Korea 5.3 15.7 5.1 6.36. Malaysia 5.3 13.2 4.5 10.87. Myanmar 5.0 8.8 24.2 13.08. India 4.3 12.1 7.5 5.99. Indonesia 4.2 8.6 12.5 4.410. Sri Lanka 4.0 9.0 9.8 5.811. Bangladesh 3.2 13.7 3.6 7.012. Hong Kong 2.8 9.5 6.4 8.913. Nepal 2.3 16.8 9.0 6.014. Pakistan 1.2 3.2 11.2 2.715. Philippines 1.1 11.0 8.5 4.416. Mongolia 0.5 --- 78.4 ---Region % % % %1. S.E. Asia 4.9 13.4 11.01 11.02. East Asia 4.6 13.3 7.1* 9.23. South Asia 3.0 11.0 6.2 5.5
* without MongoliaWorld Bank, Washington, D.C.
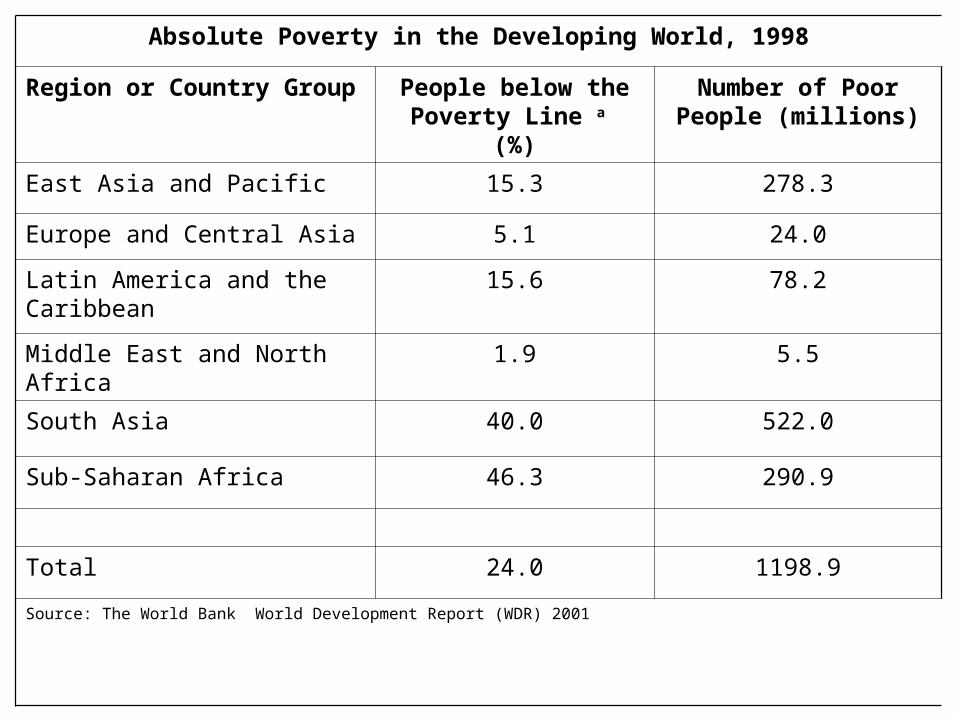
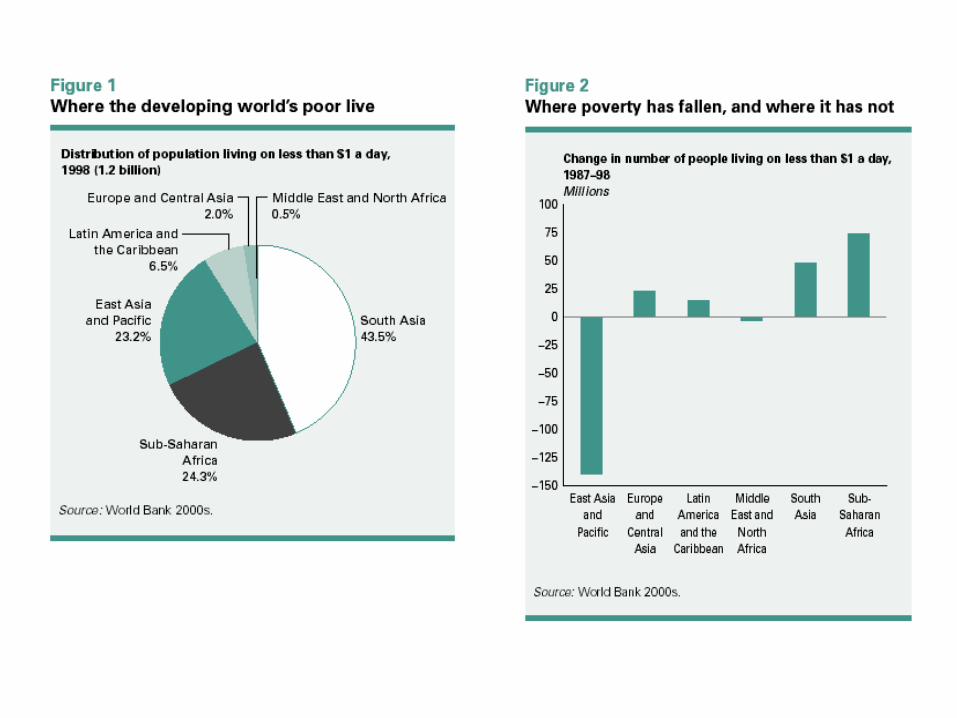
Absolute Poverty in the Developing World, 1998
Region or Country Group People below the Poverty Line a
(%)
Number of Poor People (millions)
East Asia and Pacific 15.3 278.3
Europe and Central Asia 5.1 24.0
Latin America and the Caribbean
15.6 78.2
Middle East and North Africa 1.9 5.5
South Asia 40.0 522.0
Sub-Saharan Africa 46.3 290.9
Total 24.0 1198.9
Source: The World Bank World Development Report (WDR) 2001
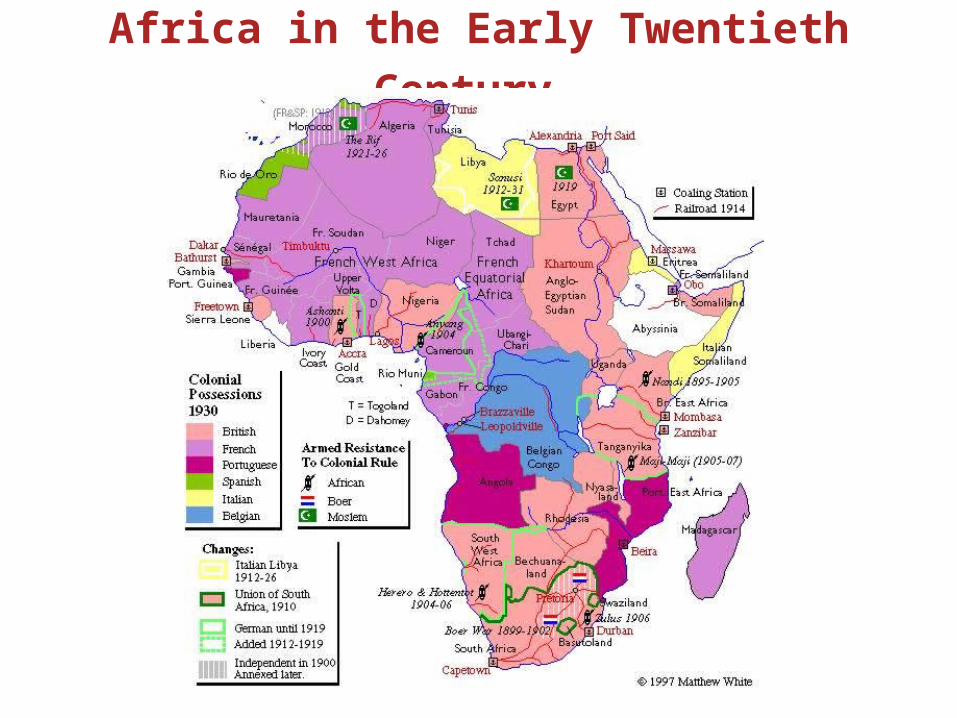
Africa in the Early Twentieth Century
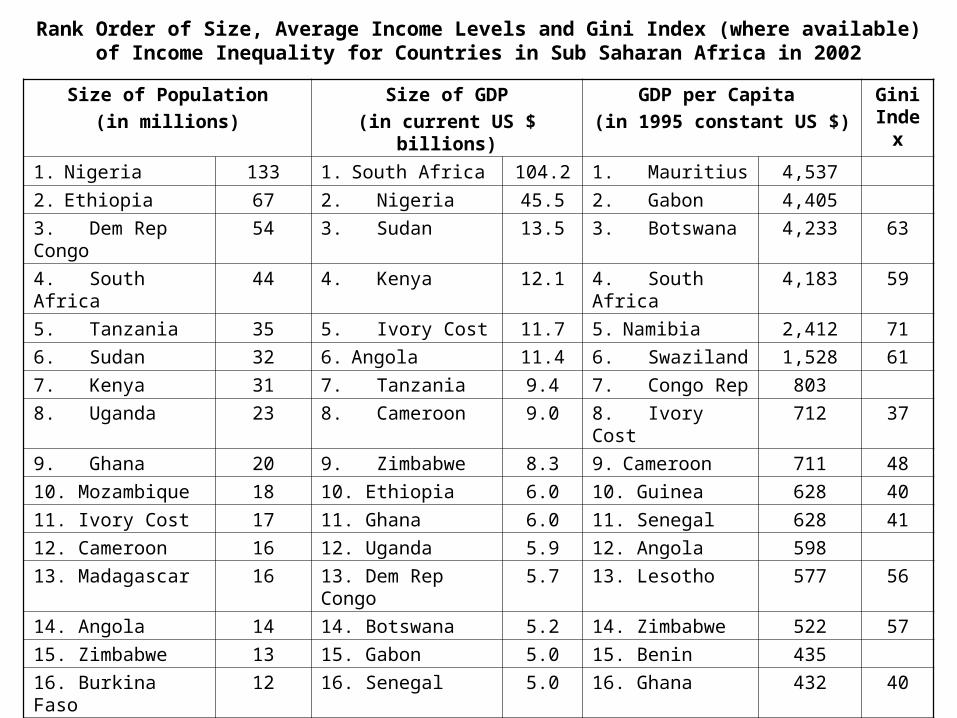
Rank Order of Size, Average Income Levels and Gini Index (where available) of Income Inequality for Countries in Sub Saharan Africa in 2002
Size of Population
(in millions)
Size of GDP
(in current US $ billions)
GDP per Capita
(in 1995 constant US $)
Gini Index
1. Nigeria 133 1. South Africa 104.2 1. Mauritius 4,537
2. Ethiopia 67 2. Nigeria 45.5 2. Gabon 4,405
3. Dem Rep Congo 54 3. Sudan 13.5 3. Botswana 4,233 63
4. South Africa 44 4. Kenya 12.1 4. South Africa 4,183 59
5. Tanzania 35 5. Ivory Cost 11.7 5. Namibia 2,412 71
6. Sudan 32 6. Angola 11.4 6. Swaziland 1,528 61
7. Kenya 31 7. Tanzania 9.4 7. Congo Rep 803
8. Uganda 23 8. Cameroon 9.0 8. Ivory Cost 712 37
9. Ghana 20 9. Zimbabwe 8.3 9. Cameroon 711 48
10. Mozambique 18 10. Ethiopia 6.0 10. Guinea 628 40
11. Ivory Cost 17 11. Ghana 6.0 11. Senegal 628 41
12. Cameroon 16 12. Uganda 5.9 12. Angola 598
13. Madagascar 16 13. Dem Rep Congo 5.7 13. Lesotho 577 56
14. Angola 14 14. Botswana 5.2 14. Zimbabwe 522 57
15. Zimbabwe 13 15. Gabon 5.0 15. Benin 435
16. Burkina Faso 12 16. Senegal 5.0 16. Ghana 432 40
17. Niger 12 17. Madagascar 4.5 17. Zambia 410 53
Sub-Saharan Africa 688 318.6 575Source: World Development Indicators database
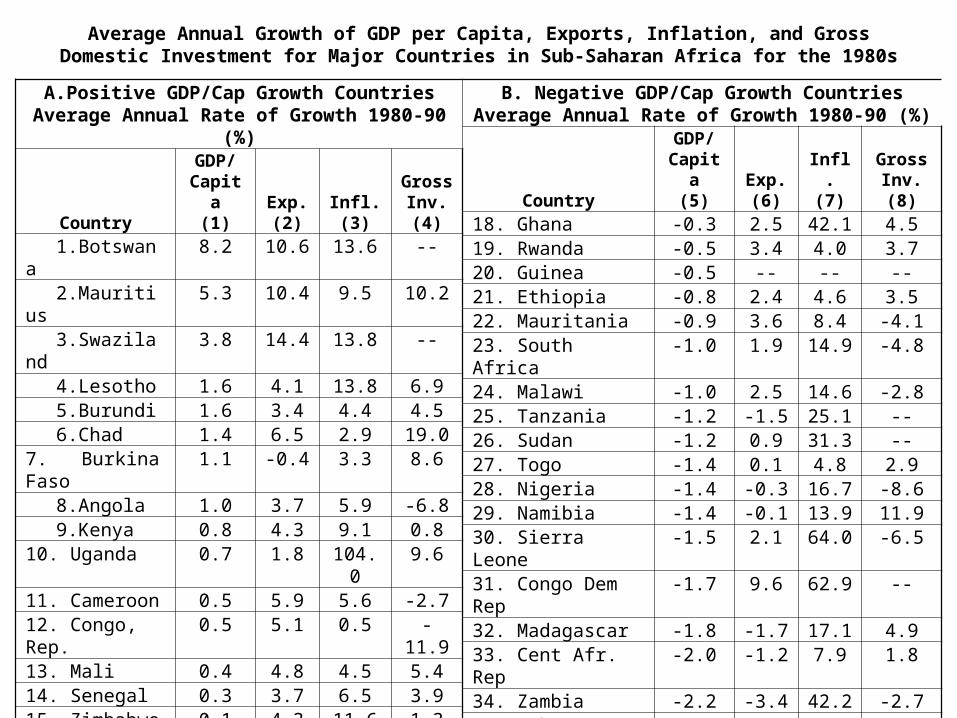
Average Annual Growth of GDP per Capita, Exports, Inflation, and Gross Domestic Investment for Major Countries in Sub-Saharan Africa for the 1980s
A.Positive GDP/Cap Growth CountriesAverage Annual Rate of Growth 1980-90 (%)
Country
GDP/Capita
(1)Exp.(2)
Infl.(3)
GrossInv.(4)
1.Botswana 8.2 10.6 13.6 --2.Mauritius 5.3 10.4 9.5 10.23.Swaziland 3.8 14.4 13.8 --4.Lesotho 1.6 4.1 13.8 6.95.Burundi 1.6 3.4 4.4 4.56.Chad 1.4 6.5 2.9 19.0
7. Burkina Faso
1.1 -0.4 3.3 8.6
8.Angola 1.0 3.7 5.9 -6.89.Kenya 0.8 4.3 9.1 0.8
10. Uganda 0.7 1.8 104.0 9.611. Cameroon 0.5 5.9 5.6 -2.712. Congo, Rep. 0.5 5.1 0.5 -11.913. Mali 0.4 4.8 4.5 5.414. Senegal 0.3 3.7 6.5 3.915. Zimbabwe 0.1 4.3 11.6 1.316. Benin 0.1 -2.4 1.3 -6.217. Mozambique 0.1 -6.8 38.3 -2.5
Sources: World Development Reports 1998/99 and
B. Negative GDP/Cap Growth CountriesAverage Annual Rate of Growth 1980-90 (%)
Country
GDP/Capita
(5)Exp.(6)
Infl.(7)
GrossInv.(8)
18. Ghana -0.3 2.5 42.1 4.519. Rwanda -0.5 3.4 4.0 3.720. Guinea -0.5 -- -- --21. Ethiopia -0.8 2.4 4.6 3.522. Mauritania -0.9 3.6 8.4 -4.123. South Africa -1.0 1.9 14.9 -4.824. Malawi -1.0 2.5 14.6 -2.825. Tanzania -1.2 -1.5 25.1 --26. Sudan -1.2 0.9 31.3 --27. Togo -1.4 0.1 4.8 2.928. Nigeria -1.4 -0.3 16.7 -8.629. Namibia -1.4 -0.1 13.9 11.930. Sierra Leone -1.5 2.1 64.0 -6.531. Congo Dem Rep -1.7 9.6 62.9 --32. Madagascar -1.8 -1.7 17.1 4.933. Cent Afr. Rep -2.0 -1.2 7.9 1.834. Zambia -2.2 -3.4 42.2 -2.735. Gabon -2.7 3.0 1.9 -4.636. Ivory Cost -2.9 1.9 2.8 -28.837. Niger -3.2 -2.9 1.9 -5.9Sub Saharan Africa -0.5 2.4 10.5 -4.01999/2000, World Bank, Washington, D.C.
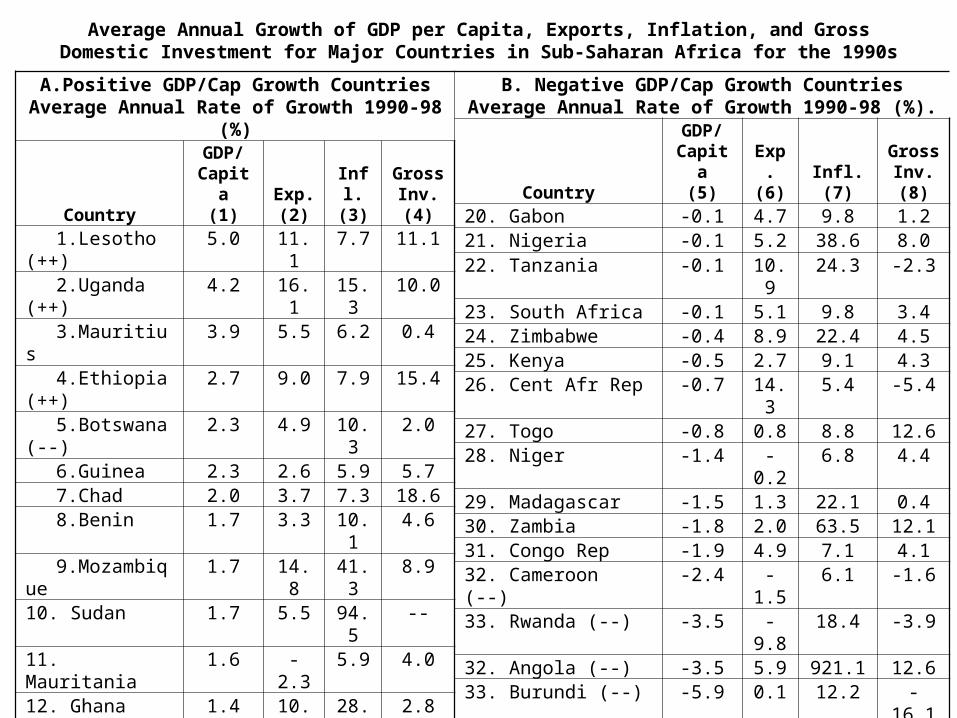
Average Annual Growth of GDP per Capita, Exports, Inflation, and Gross Domestic Investment for Major Countries in Sub-Saharan Africa for the 1990s
A.Positive GDP/Cap Growth CountriesAverage Annual Rate of Growth 1990-98 (%)
Country
GDP/Capita
(1)Exp.(2)
Infl.(3)
GrossInv.(4)
1.Lesotho (++)
5.0 11.1 7.7 11.1
2.Uganda (++)
4.2 16.1 15.3 10.0
3.Mauritius 3.9 5.5 6.2 0.44.Ethiopia (+
+)2.7 9.0 7.9 15.4
5.Botswana (--)
2.3 4.9 10.3 2.0
6.Guinea 2.3 2.6 5.9 5.77.Chad 2.0 3.7 7.3 18.68.Benin 1.7 3.3 10.1 4.69.Mozambiqu
e1.7 14.8 41.3 8.9
10. Sudan 1.7 5.5 94.5 --11. Mauritania 1.6 -2.3 5.9 4.012. Ghana 1.4 10.2 28.6 2.813. Malawi 1.1 4.7 32.8 -8.014. Mali 0.9 9.2 9.2 1.515. Namibia 0.8 5.4 9.5 4.116. Burking Faso 0.7 -0.8 6.6 4.117. Ivory Cost 0.4 4.5 8.7 18.018. Senegal 0.4 2.3 6.1 2.219. Swaziland (--) 0.2 9.7 12.8 --(++) = substantial improvement from previous decade(--) = substantial deterioration from previous decade
Sources: World Development Reports 1998/99 and
B. Negative GDP/Cap Growth CountriesAverage Annual Rate of Growth 1990-98 (%).
Country
GDP/Capita
(5)Exp.(6)
Infl.(7)
GrossInv.(8)
20. Gabon -0.1 4.7 9.8 1.221. Nigeria -0.1 5.2 38.6 8.022. Tanzania -0.1 10.9 24.3 -2.323. South Africa -0.1 5.1 9.8 3.424. Zimbabwe -0.4 8.9 22.4 4.525. Kenya -0.5 2.7 9.1 4.326. Cent Afr Rep -0.7 14.3 5.4 -5.427. Togo -0.8 0.8 8.8 12.628. Niger -1.4 -0.2 6.8 4.429. Madagascar -1.5 1.3 22.1 0.430. Zambia -1.8 2.0 63.5 12.131. Congo Rep -1.9 4.9 7.1 4.132. Cameroon (--) -2.4 -1.5 6.1 -1.633. Rwanda (--) -3.5 -9.8 18.4 -3.932. Angola (--) -3.5 5.9 921.1 12.633. Burundi (--) -5.9 0.1 12.2 -16.134. Sierra Leone(--) -7.2 -9.4 32.5 -13.335. Congo Dem Rep (--)
-8.3 -5.5 1423.1 -3.5
Sub Saharan Afr. -0.1 4.6 12.0 4.21999/2000, World Bank, Washington, D.C.
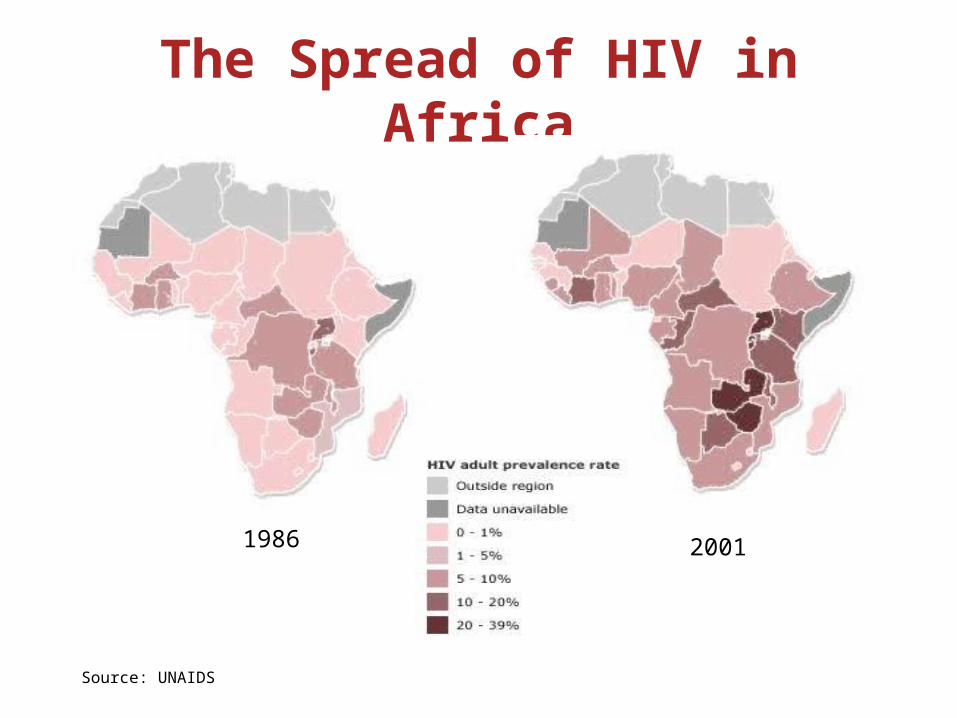
The Spread of HIV in Africa
1986 2001
Source: UNAIDS
Related Documents


![Parallel-Beam Backprojection: an FPGA …...More data and computation is needed for 3D cone-beam FBP. Yu’s PC based system [10] can reconstruct the 512^3 data from 288*512^2 projections](https://static.cupdf.com/doc/110x72/5f70dfe0343bd638886a2a3c/parallel-beam-backprojection-an-fpga-more-data-and-computation-is-needed-for.jpg)