The economic impact of cluster munition contamination in Lebanon

Welcome message from author
This document is posted to help you gain knowledge. Please leave a comment to let me know what you think about it! Share it to your friends and learn new things together.
Transcript
The economic impact of cluster munition contamination in Lebanon
Report by: Greg Crowther
Editor: Richard Moyes, Landmine Action
Commissioning editor: Simon Conway, Director, Landmine Action
The research and report publication funded by the UNDP Bureau of Crisis Prevention and Recovery / UNOPS.
Many people gave up valuable time and energy in support of the research and report-writing process. The UNMACC
in South Lebanon were extremely helpful in hosting two separate visits to Lebanon, securing travel permission and
organising field visits. The author would like to thank two UNMACC staff in particular – Allen Kelly, who coordinated
the planning and organisational support during two visits, and Rana Elias, who gave up a lot of time to assist in
navigating and understanding the GIS-IMSMA database. Field staff at the Mines Advisory Group, Norwegian Peoples
Aid and Handicap International also provided valuable inputs into the research process and hosted several field visits.
Finally, the people of southern Lebanon were extremely generous and welcoming hosts, represented by the numerous
farmers who gave up time to explain how cluster munition contamination had affected them and their families.
Additional thanks to: Portia Stratton, Dave Greenhalgh
Published in May 2008 by Landmine Action, 89 Albert Embankment, London SE1 7TP
www.landmineaction.org
Clarifications or corrections from all interested parties are most welcome.
Copyright © Landmine Action 2008
British Library Cataloguing in Publication Data.
A catalogue record of this report is available from the British Library.
ISBN-10: 0-9551923-8-2
ISBN-13: 978-0-9551923-8-8
Landmine Action is a company limited by guarantee. Registered in England and Wales no. 3895803.
Printed by www.calverts.coop
counting the cost: the economic impact of cluster munition contamination in lebanon 1
Contents
Executive summary . . . . . . . . . . . . . . . . . . . . . . . . . . . . . . . . . . . . . . . . . . . . . . . . . . . . . . . . . . . . . . . . . . . .3
Part 1. Introduction . . . . . . . . . . . . . . . . . . . . . . . . . . . . . . . . . . . . . . . . . . . . . . . . . . . . . . . . . . . . . . . . . . . .71.1 Objective and structure of the report
1.2 Administrative areas in Lebanon
1.3 Overview of the conflict
1.4 Conflict-related damage assessments
1.5 Agriculture in southern Lebanon
1.6 Cluster munition contamination in southern Lebanon
Part 2. Cluster munition contamination and agriculture . . . . . . . . . . . . . . . . . . . . . . . . . . . . . . . .102.1 Information required to determine agricultural losses
2.2 Existing assessments regarding the impact of cluster munitions on agricultural production
2.3 Land use in cleared and uncleared areas
2.4 Land denial and deliberate use of contaminated land
2.5 Crop yields and values
2.6 Economic impact of cluster munitions on agricultural production
2.7 Economic impact of cluster munitions on producers
Part 3. The mine action response to cluster munition contamination . . . . . . . . . . . . . . . . . . .183.1 Introduction
3.2 Mine action capacities deployed
3.3 Outputs and clearance results
3.4 Clearance methodologies and residual risk
3.5 The cost and economic impact of mine action activities
Part 4. The impact of deaths and injuries . . . . . . . . . . . . . . . . . . . . . . . . . . . . . . . . . . . . . . . . . . . . . .224.1 Number of deaths and injuries due to cluster munitions
4.2 Breakdown of victims by munition, activity, age and gender
4.3 Estimating the economic impact of death and injuries from cluster munitions
Annexes . . . . . . . . . . . . . . . . . . . . . . . . . . . . . . . . . . . . . . . . . . . . . . . . . . . . . . . . . . . . . . . . . . . . . . . . . . . . . .26Annex A Selected list of information sources
Annex B The agricultural sector in southern Lebanon
Annex C Methodology used in assessing land
Annex D Results of land use assessment
Annex E The relationship between land contamination and land denial
Annex F Price and yield estimates for various crops
Annex G Production losses due to cluster munition contamination by caza
Annex H Production losses due to cluster munition contamination by crop
Annex I Economic losses due to cluster munition contamination for individual producers
Annex J Expended, allocated and required funding for cluster munition related activities
Notes . . . . . . . . . . . . . . . . . . . . . . . . . . . . . . . . . . . . . . . . . . . . . . . . . . . . . . . . . . . . . . . . . . . . . . . . . . . . . . . . .55
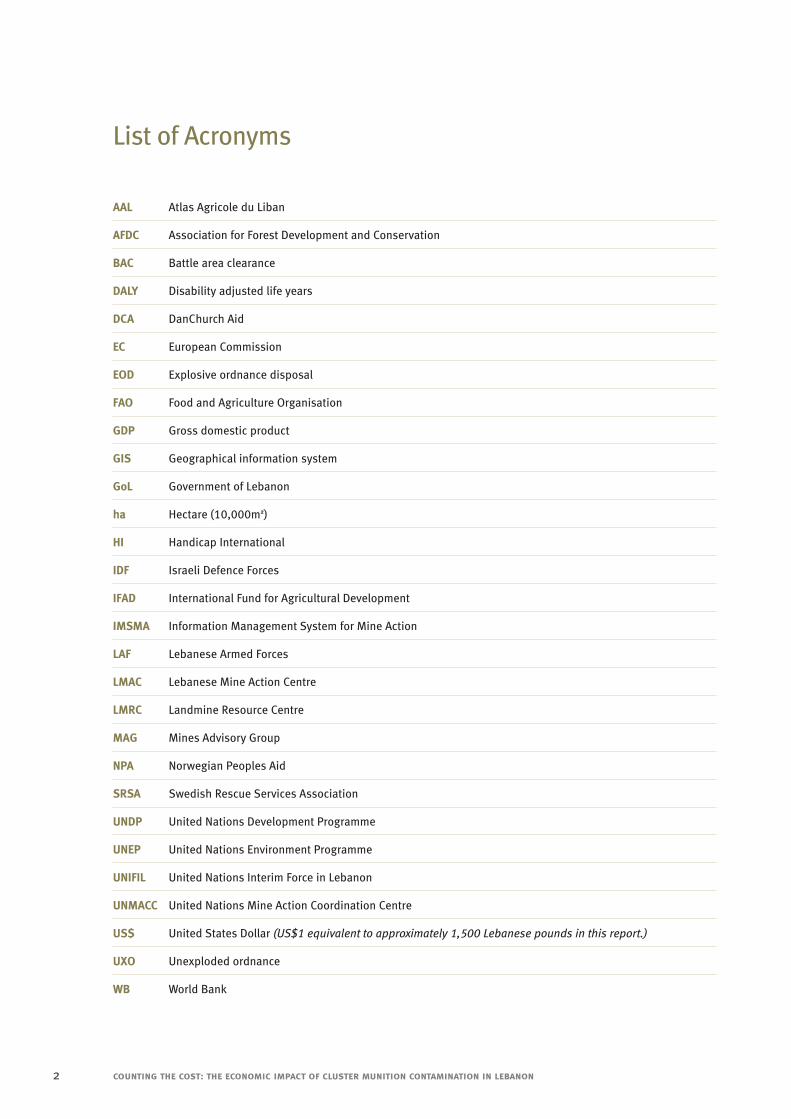
List of Acronyms
AAL Atlas Agricole du Liban
AFDC Association for Forest Development and Conservation
BAC Battle area clearance
DALY Disability adjusted life years
DCA DanChurch Aid
EC European Commission
EOD Explosive ordnance disposal
FAO Food and Agriculture Organisation
GDP Gross domestic product
GIS Geographical information system
GoL Government of Lebanon
ha Hectare (10,000m2)
HI Handicap International
IDF Israeli Defence Forces
IFAD International Fund for Agricultural Development
IMSMA Information Management System for Mine Action
LAF Lebanese Armed Forces
LMAC Lebanese Mine Action Centre
LMRC Landmine Resource Centre
MAG Mines Advisory Group
NPA Norwegian Peoples Aid
SRSA Swedish Rescue Services Association
UNDP United Nations Development Programme
UNEP United Nations Environment Programme
UNIFIL United Nations Interim Force in Lebanon
UNMACC United Nations Mine Action Coordination Centre
US$ United States Dollar (US$1 equivalent to approximately 1,500 Lebanese pounds in this report.)
UXO Unexploded ordnance
WB World Bank
2 counting the cost: the economic impact of cluster munition contamination in lebanon
This report seeks to estimate and project the economic cost of cluster munition contamination resulting from the 2006
conflict in Lebanon. It focuses on three areas:
❥ The cost of lost agricultural production specifically caused by cluster munition contamination;
❥ The cost of responding to cluster munition contamination through internationally assisted
clearance and risk reduction operations;
❥ The economic cost of deaths and injuries directly resulting from this contamination.
Different methodologies and assumptions have been used in approaching these issues – resulting in upper and lower
estimates of the cost. The methodologies and assumptions adopted are explained in detail in the report and its
annexes. For all three areas of analysis, additional costs will have been incurred, and will continue to be incurred,
as a result of cluster munition contamination which cannot be estimated in a reasonable or systematic way based
on available data.
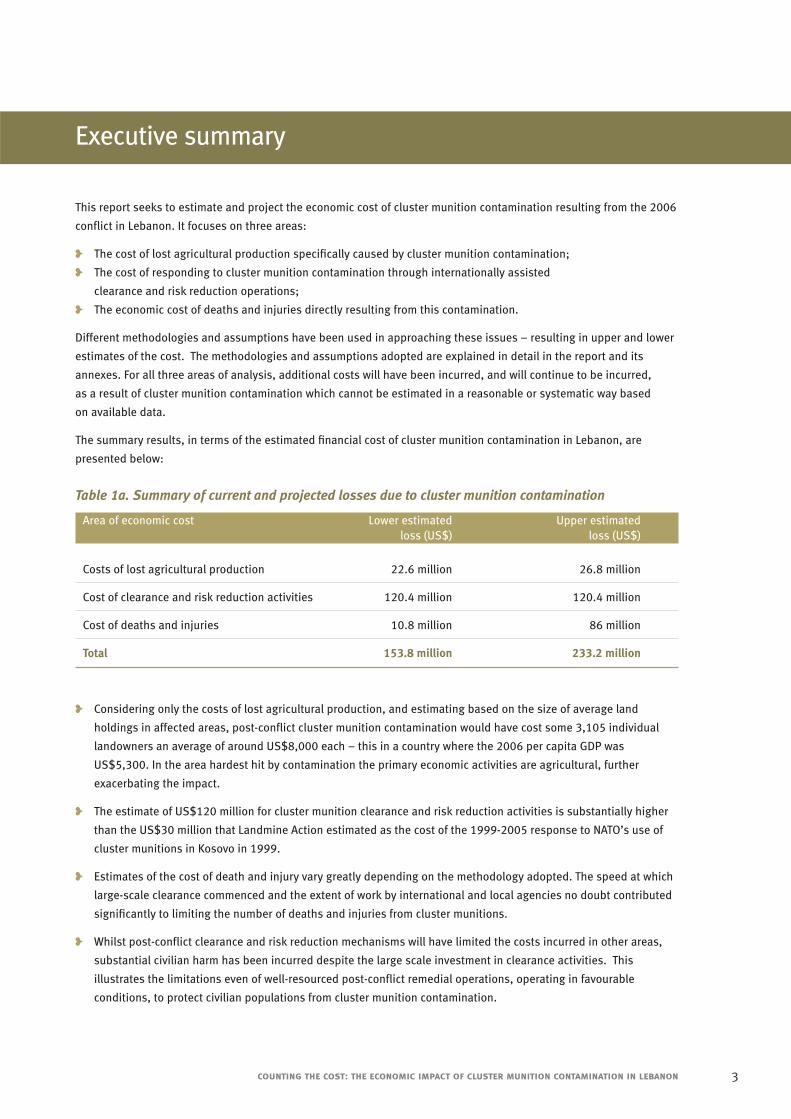
The summary results, in terms of the estimated financial cost of cluster munition contamination in Lebanon, are
presented below:
Table 1a. Summary of current and projected losses due to cluster munition contamination
Area of economic cost Lower estimated Upper estimatedloss (US$) loss (US$)
Costs of lost agricultural production 22.6 million 26.8 million
Cost of clearance and risk reduction activities 120.4 million 120.4 million
Cost of deaths and injuries 10.8 million 86 million
Total 153.8 million 233.2 million
❥ Considering only the costs of lost agricultural production, and estimating based on the size of average land
holdings in affected areas, post-conflict cluster munition contamination would have cost some 3,105 individual
landowners an average of around US$8,000 each – this in a country where the 2006 per capita GDP was
US$5,300. In the area hardest hit by contamination the primary economic activities are agricultural, further
exacerbating the impact.
❥ The estimate of US$120 million for cluster munition clearance and risk reduction activities is substantially higher
than the US$30 million that Landmine Action estimated as the cost of the 1999-2005 response to NATO’s use of
cluster munitions in Kosovo in 1999.
❥ Estimates of the cost of death and injury vary greatly depending on the methodology adopted. The speed at which
large-scale clearance commenced and the extent of work by international and local agencies no doubt contributed
significantly to limiting the number of deaths and injuries from cluster munitions.
❥ Whilst post-conflict clearance and risk reduction mechanisms will have limited the costs incurred in other areas,
substantial civilian harm has been incurred despite the large scale investment in clearance activities. This
illustrates the limitations even of well-resourced post-conflict remedial operations, operating in favourable
conditions, to protect civilian populations from cluster munition contamination.
Executive summary
counting the cost: the economic impact of cluster munition contamination in lebanon 3
❥ There is no doubt that in terms of post-conflict civilian casualties and the ongoing impact on agricultural
production, cluster munitions have had a negative impact of a different magnitude to that presented by other
weapons used during the conflict. This is also reflected in the scale and focus of the clearance and risk-reduction
operations undertaken. More detailed data on the quantity of other ordnance used, and analysis of the
comparative military effectiveness of cluster munitions and other types of ordnance in this context, would
be necessary in order to better contextualise this conclusion. This data has not so far been made available
by the Government of Israel.
Cost of lost agricultural production
In order to determine a monetary value for the impact of cluster munition contamination on agriculture, land use
in 332 areas cleared and recorded in the Information Management System for Mine Action (IMSMA) database
was assessed, and the findings extrapolated for the estimated 480 tasks remaining at the time the research
was conducted. The key findings of this land use assessment were as follows:
❥ An estimated 3,897 ha of land was contaminated by cluster munitions as a result of the conflict in
July-August 2006;
❥ Agricultural land was the most widely contaminated type of land, with 2,596 ha of such land affected.
This represents 4.8% of all agricultural land in southern Lebanon;
❥ The most severely affected districts (caza) were Sour (7.2% of agricultural land affected, or 1,008 ha),
Bent Jbeil, (7% of agricultural land affected, or 533 ha) and Nabatieh (5.9% of agricultural land
affected, or 635 ha);
❥ The most heavily affected crops were olives, with 894 ha of olive groves contaminated, followed by
cereal crops, tobacco and citrus fruits, all with over 400 ha of land contaminated.
The research process noted that contamination of land by cluster munitions in Lebanon does not, as is sometimes
assumed, lead inevitably to complete land denial. A proportion of agricultural producers choose to access some
contaminated land despite the risk this represents. There are many factors involved in the decision to use
contaminated land, and once this decision has been made a range of risk management techniques have been
adopted by agricultural producers in an effort to manage and reduce the threat level from unexploded submunitions.
In this analysis it is estimated that between 15% and 30% of contaminated land has been and will be utilised by
producers in advance of it being formally cleared.
By factoring in this use of contaminated land, and drawing on government figures regarding crop yields, prices and
seasons, the report suggests lower and upper estimates for the direct economic cost of lost agricultural production.
The key results from this process are as follows:
❥ The total value of current and projected lost agricultural production ranges from US$22.6 million
to US$26.8 million;
❥ Losses in the three caza of Sour, Nabatieh and Bent Jbeil account for just over 80% of all estimated losses;
❥ Losses in olive production are estimated at between US$10milion and US$12 million, just under half of total
agricultural losses. Citrus fruit production losses were also substantial, at between US$4-5 million;
❥ Based on patterns of landholding, these losses can be estimated to have affected approximately 3,105
individual producers at an average loss, per producer, equivalent to approximately US$8,000.
4 counting the cost: the economic impact of cluster munition contamination in lebanon
❥ In addition to the agricultural losses estimated here, which represent the projected income not achieved due to
lost production, there are additional economic impacts to the agricultural sector not captured by this research,
including but not limited to:
— Individuals and companies providing goods and services to farmers that for a period lost approximately
10% of their customer base;
— Wholesalers and exporters have fewer goods to purchase and sell on;
— Certain crops, particularly fruit and olive trees, have been damaged due to neglect during the period in
which land was inaccessible, and yields will be reduced for several years;
— The total amount of money within farming communities is reduced, decreasing demand for other services;
— Lower levels of production for personal use lead to greater dependence on food imports, and subsequently
higher levels of vulnerability to increased food prices.
Cost of clearance and risk reduction activities
The financial impact of cluster munition contamination in Lebanon is also examined in terms of the cost of mitigating
and removing the threat through clearance and risk reduction activities. The key findings in this section of the report
are as follows:
❥ International funding to establish and run the initial cluster munition response programme in 2006–07 is
estimated at US$80 million;
❥ Based on a projected end date of June 2009 for clearance of all impacted areas, a further US$40 million will
be required to maintain the existing capacity. Of this, an estimated US$10 million has already been committed
to clearance organisations. Although some teams are addressing minefields and unexploded ordnance (including
cluster munitions) that pre-dated the 2006 conflict, the great majority of resources are tackling the immediate
and urgent problem of cluster munition contamination from 2006;
❥ A combination of factors – including a small and accessible geographical area, national and international military
capacity, a pre-existing UN coordination cell, established mine action operators and the availability of regional
expertise – meant that the clearance operation was established extremely swiftly. This contributed to a rapid drop
in casualty rates following an immediate post ceasefire increase and undoubtedly served to greatly mitigate the
impact of cluster munition contamination. The response of the international mine action organisations, the
national actors involved in mine action, and the international donors who supported the work should be
recognised and commended.
❥ The cost of responding to cluster munition contamination includes additional expenditure not captured in this
report, such as:
— The direct costs borne by the government in funding the clearance activities of the Lebanese Armed Forces;
— Beyond the end of the internationally funded clearance programme there will be a need for ongoing
explosive ordnance disposal, risk education and victim assistance activities due to the level of residual
risk: southern Lebanon is unlikely to be completely free of cluster munitions for many years.
cluster munitions: a survey of legal responses 5
Cost of deaths and injuries
Finally, the report provides an estimated financial cost of the deaths and injuries resulting from cluster munitions,
based on a methodology adapted directly from a World Bank study conducted in 2007. The key findings in this
section are as follows:
❥ Using a public health methodology for assessing the cost of diseases, accidents and so on, the estimated
economic impact of cluster munitions in terms of lost output and income is between US$10.8 million and
US$86 million;
❥ The lower estimate is based on a simple measure of the value of an individual life using GDP per capita. The upper
estimate uses a methodology which incorporates individuals’ willingness to accept the likelihood of injury or death
when undertaking any given activity in order to identify a monetary value for life based on “willingness to pay”;
❥ There a number of other costs not captured with regards to cluster munition victims, including:
— Direct costs of health care, both in terms of emergency care and long-term rehabilitation;
— The psychological and emotional impact of suffering either a loss of a family member, or of being
a victim of a cluster munition incident;
— The cost of domestic care provided to victims, particularly child victims, which may see parents
or relatives forced to leave paid employment to work full time as carers for their family members.
Conclusions
The economic costs identified in this report are a burden borne by different groups. Significant expenditure on post-
conflict clearance and risk reduction operations has been made by international governments in an effort to assist
those communities affected by cluster munitions. The cost of these operations is substantial, but it is shared across
a wide community of nations for whom such assistance is feasible without impact to the services they provide to their
own domestic populations. If this ‘loss’ is to be conceptualised in practical terms it might be better to consider the
‘opportunity cost’ that without cluster munition use a substantial proportion of US$120 million could have been
spent on other humanitarian or development needs, including in Lebanon itself which suffered a range of severe
humanitarian and development setbacks in the wake of the 2006 conflict.
However, this expenditure on cluster munition clearance has not prevented direct economic impacts on the population
of southern Lebanon. This analysis suggests that between US$33 million and US$122 million in economic losses
will have been borne in this area as a direct result of cluster munition use. Here the costs fall much more heavily
on individuals and families. Lost agricultural production and death, injury and disability to individuals all serve to
reinforce poverty in communities already amongst the poorest in the country. All of these costs are in addition to
the broader economic and social dislocation caused by the conflict.
It is still asserted in some quarters that cluster munitions are essentially the same as other weapons in the humanitarian
problems that they cause both during and after conflict. For this reason it is argued that no substantial legal controls
need to be developed to limit the humanitarian effects of these particular weapons. It is notable that in terms of
post-conflict deaths and injuries, contaminated agricultural land and the prioritisation of clearance activities, cluster
munitions in Lebanon clearly stand out from the rest of the weapons used in the conflict as having an indiscriminate
and enduring impact on the civilian population. In contrast to the problems caused, no evidence has been provided
that this use of cluster munitions achieved a direct military advantage that could justify this civilian cost.
6 counting the cost: the economic impact of cluster munition contamination in lebanon
1.1 Objective and structure of the report
This report aims to quantify the economic consequences of cluster munition contamination resulting from the 2006
conflict for the people of southern Lebanon and those organisations, institutions and states that provided assistance
to them. The extent of cluster munition use during the 2006 conflict has been widely reported, as have the
implications of that use in the context of international humanitarian law.1 This report stems from a desire to assess
and quantify the cost of cluster munition contamination in three areas: the cost of agricultural land denial, the cost of
clearance and the cost for victims. This report examines these three areas and posits estimated costs that have been
incurred for each.
Part 1 of the report contextualises the assessment, providing a brief overview of the conflict as well as outlining some
of the broad costs incurred as a result. It goes on to summarise the importance of the agricultural sector in Lebanon,
and then looks at cluster munition contamination resulting from the war in terms of the extent of this contamination,
its impact on agriculture and some limitations regarding the existing data on the type of land affected by cluster
munitions.
In Part 2 the report examines in detail the impact of unexploded submunitions on agricultural production in Lebanon,
examining issues such as the types of land contaminated, crops affected by cluster munitions, and the deliberate use
of contaminated land by agricultural producers. The report then goes on to examine the mine action response to
cluster munition contamination in Part 3, describing the capacities deployed, outputs, methodologies used and the
total projected cost of establishing and running the capacity required to remove the threat from cluster munitions.
Finally, in Part 4 of the report, an overview of the impact of cluster munitions on the civilian population in terms of
victims is provided, and a public health approach is used to estimate the economic cost of deaths and injuries.
It should be noted that the main body of the report contains summaries of the research and analysis conducted
as part of the assessment process. More detailed information on the various aspects regarding cluster munition
contamination in Lebanon and its impact on agriculture, public health and the mine action response are available
in the annexes of the report.
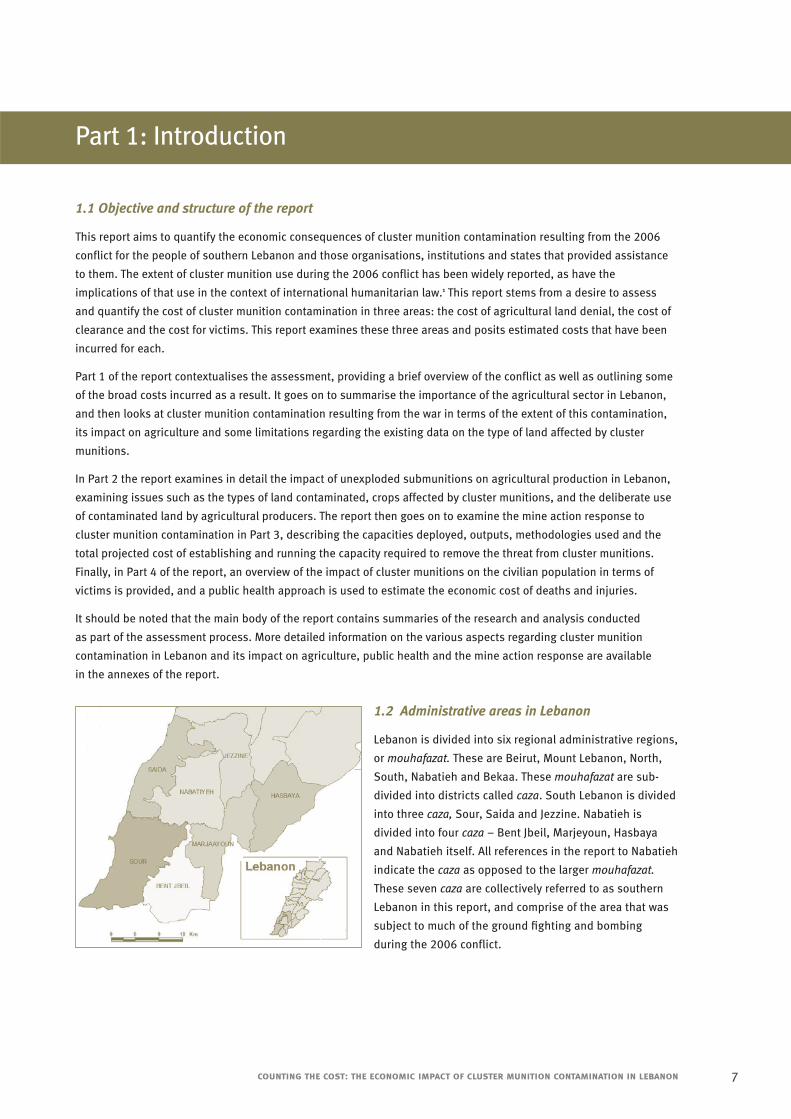
1.2 Administrative areas in Lebanon
Lebanon is divided into six regional administrative regions,
or mouhafazat. These are Beirut, Mount Lebanon, North,
South, Nabatieh and Bekaa. These mouhafazat are sub-
divided into districts called caza. South Lebanon is divided
into three caza, Sour, Saida and Jezzine. Nabatieh is
divided into four caza – Bent Jbeil, Marjeyoun, Hasbaya
and Nabatieh itself. All references in the report to Nabatieh
indicate the caza as opposed to the larger mouhafazat.
These seven caza are collectively referred to as southern
Lebanon in this report, and comprise of the area that was
subject to much of the ground fighting and bombing
during the 2006 conflict.
counting the cost: the economic impact of cluster munition contamination in lebanon 7
Part 1: Introduction
1.3 Overview of the conflict
The 2006 conflict between Hezbollah and Israel, although short, had a significant impact on Lebanon as a whole, and
hit the south of the country, where much of the bombing was focused, particularly hard. The country was subject to an
air and sea blockade for more than a month, almost 1,200 people were killed and more than 4,400 injured,2 and the
war temporarily displaced up to one million people who fled the fighting. NGO and U.N. operations in the south were
suspended and the majority of international staff in these agencies and in private companies were evacuated.
Although hostilities were over by mid-August, and a
U.N. Security Council Resolution adopted that provided additional UNIFIL troops to monitor the ceasefire, the impact
with regards to the social, political and economic structure of Lebanon has been significant and enduring. Tourism is
reported to have slumped, insecurity is leading to increased emigration, and national politics remain deadlocked with
no president and elections having been postponed 18 times since August 2007.
Along with the direct impact of the conflict on the economy and infrastructure of Lebanon, there has been an ongoing
impact from cluster munitions, which were used in significant quantities and many of which failed to explode. These
unexploded munitions have contaminated many populated areas and large amounts of agricultural and pasture land
in the south of the country.
1.4 Conflict-related damage assessments
A number of studies have attempted to assess the overall impact of the conflict and apply a monetary value to the loss of
trade and production, damage to infrastructure and assets, and the environmental degradation resulting from the war.
Four assessments that took place very shortly after the war attempted to quantify the total cost of the conflict to the
Lebanese economy. A Government of Lebanon report, based on individual ministry estimates and an assessment
carried out by an international consulting firm with the national Council for Reconstruction and Development,
estimated total direct damages to infrastructure and economic activities at U.S.$2.8 billion,3 of which U.S.$537 million
was identified as being required to fund basic reconstruction of key infrastructure and re-establish basic services.4
An EC assessment placed a figure of between U.S.$1 billion and U.S.$1.8 billion on the damage to public and private
property.5 Finally, a World Bank Impact Assessment indicated the war resulted in U.S.$2.4 billion of direct damage
and U.S.$700 million of indirect damages.6
In addition to these reports looking at the total direct cost of the conflict, a series of thematic and sectoral damage
assessments have been conducted by various agencies. These examine the direct and ongoing impact of the conflict
on areas such as agriculture, forests and fisheries, as well as thematic aspects such as environmental degradation
and impact on rural livelihoods. A list of these assessments is provided in Annex A.
1.5 Agriculture in southern Lebanon
Agriculture is an intrinsic and dominant feature of the economic and social fabric of southern Lebanon. Significant
numbers of households produce a variety of crops for both personal consumption and for sale in the local, national
and international markets. Whilst many households have a variety of income sources, agricultural produce represents
a relatively dependable source of income, and personal use of produce decreases total household expenditure on food
items and reduces vulnerability to increases in food prices. The agricultural sector received extensive direct damage
during the conflict and suffered significant losses as a result of the disruption to harvesting and tending of crops and
the abandonment of livestock.
The agricultural economy in southern Lebanon is a source of livelihood not only for farmers, but also for landowners,
salaried and temporary agricultural workers, wholesalers, buyers, exporters, and individuals providing goods and
support services to agricultural producers such as owners of tractors, stores selling agricultural goods and so on. A
more detailed overview of the main characteristics of the agricultural sector in Lebanon can be found at Annex B.
8 counting the cost: the economic impact of cluster munition contamination in lebanon
1.6 Cluster munition contamination in southern Lebanon
A key feature of the 2006 conflict was the heavy air, sea and ground bombardment of Lebanon by Israeli forces, and
particularly the extensive and intensive use of cluster munitions.7 The propensity of the weapon to produce large
quantities of unexploded ordnance,8 combined with its use in a limited geographical area,9 means that the resulting
contamination has had a significant post-conflict impact.
Many munitions were fired at residential and agricultural areas,10 which led to a high number of deaths and injuries in
the immediate aftermath of the conflict11 and has resulted in continued problems for reconstruction, rehabilitation and
development activities. Contaminated agricultural and pasture land has resulted in lack of access to farm and grazing
land for agricultural producers and livestock herders.
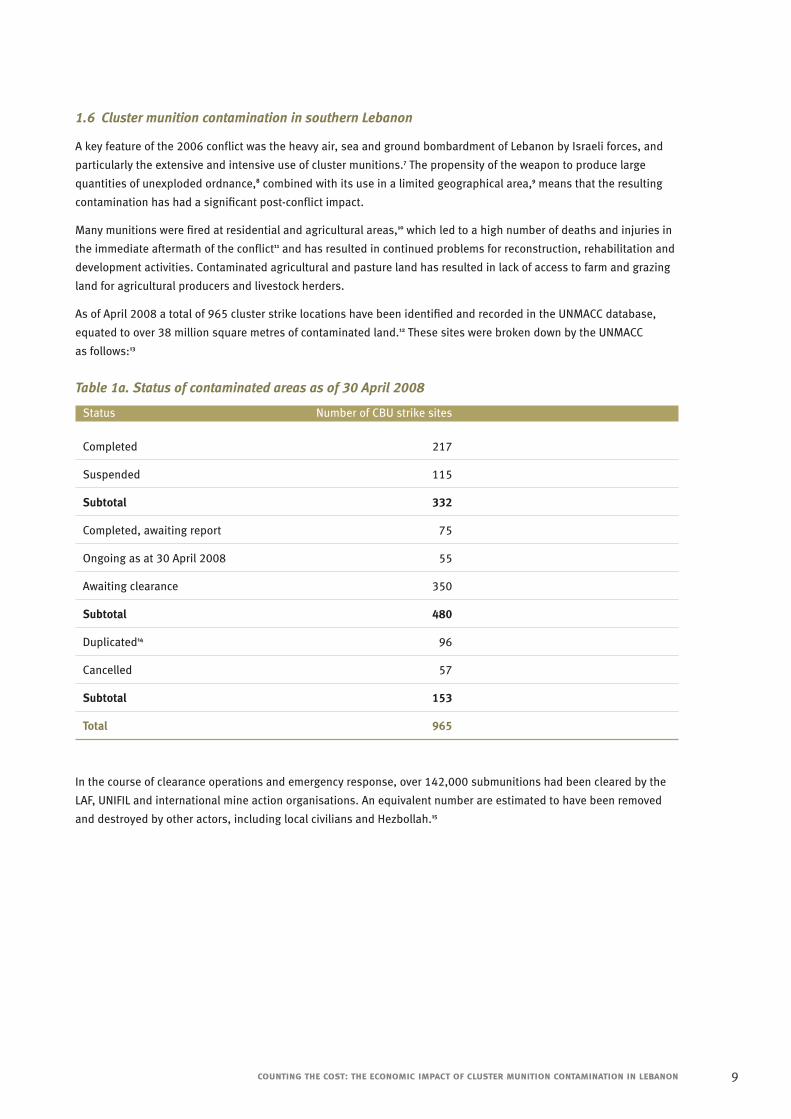
As of April 2008 a total of 965 cluster strike locations have been identified and recorded in the UNMACC database,
equated to over 38 million square metres of contaminated land.12 These sites were broken down by the UNMACC
as follows:13
Table 1a. Status of contaminated areas as of 30 April 2008
Status Number of CBU strike sites
Completed 217
Suspended 115
Subtotal 332
Completed, awaiting report 75
Ongoing as at 30 April 2008 55
Awaiting clearance 350
Subtotal 480
Duplicated14 96
Cancelled 57
Subtotal 153
Total 965
In the course of clearance operations and emergency response, over 142,000 submunitions had been cleared by the
LAF, UNIFIL and international mine action organisations. An equivalent number are estimated to have been removed
and destroyed by other actors, including local civilians and Hezbollah.15
counting the cost: the economic impact of cluster munition contamination in lebanon 9
2.1 Information required to determine agricultural losses
A major part of the research conducted for this report focused on identifying the impact on agricultural production
from cluster munition contamination. The research was undertaken in order to identify several figures:
❥ An estimate of the amount of agricultural land contaminated and now cleared, reported and entered into
the IMSMA database, broken down by location, crop type and date of clearance;
❥ An estimate of the amount of agricultural land contaminated and not cleared, or cleared but not entered
into the IMSMA database, broken down by location and crop type;
❥ An estimated date for the clearance of agricultural land still contaminated;
❥ An assessment regarding how many producers were choosing to deliberately access contaminated land;
❥ An assessment of average yields, product prices and harvest seasons for various crops.
The methods used and the results of these assessments are presented briefly below. More detailed descriptions
of methodologies applied and a detailed breakdown of the results can be found in the relevant annexes.
2.2 Existing assessments regarding the impact of cluster munitions on agricultural production
Several damage assessments have attempted to quantify the specific impact of cluster munitions on agriculture.
A United Nations Environment Programme (UNEP) report,16 for example, states that agricultural areas represent 62%
of all land affected by cluster munitions, or 2,007 ha. A report by the Food and Agriculture Organisation (FAO)17 states
that 26% of all agricultural land in the south has been affected by cluster munitions, based on information obtained
from the National Demining Office.18 This is equated to 9,450 ha of land, broken down to 1,800 ha of citrus and
banana plantations, 7,400 of field crops and 250 ha of olive groves.
Neither of these reports attempts to place a cost on this contamination in terms of lost production. A report by the
World Bank,19 however, does estimate and quantify production losses due to cluster munition contamination. It
bases these figures on the approximate amount of land contaminated and therefore made inaccessible over a two-year
period.20 Using LMAC data on affected areas the report identifies between 5,689 ha and 14,224 ha of agricultural land
as having been contaminated, and assumes that contamination is evenly distributed across crop categories in South
Lebanon and Nabatieh. The report acknowledges that it is “difficult to quantify the total area of inaccessible
agricultural lands”,21 but provides a range of between US$40 million and US$94 million of lost agricultural production
over two years.
These reports base their assessments on estimates made by UNDP, UNMACC or LMAC regarding the extent of cluster
munition contamination and the type of land affected. These estimates were made soon after the end of the conflict
and are significantly larger than those presented in the current report. This led to an over-statement of the impact of
cluster munitions on agriculture in previous assessments.22
More up-to-date information is now available regarding the extent of cluster munition contamination in southern
Lebanon (i.e. the total number of suspect areas and their approximate size). However there are significant limitations
with regards to this data that make assessing the type of land that has been contaminated, and therefore identifying
and quantifying the impact of that contamination, extremely difficult.
10 counting the cost: the economic impact of cluster munition contamination in lebanon
Part 2: Cluster munition contamination and agriculture
Firstly, cluster munition contaminated areas have not been subject to a comprehensive survey. The emergency survey
conducted by the UNMACC immediately following the conflict identified several hundred suspected strike sites, but
collected limited information regarding these areas.23 Land use in these areas has not been specified as part of the
existing survey process
Secondly, land use on completed clearance tasks is not identified in a consistent and detailed manner. Once clearance
tasks have been conducted a Completion Report (or a Suspension Report24) is submitted to the UNMACC, but these
reports are limited in terms of the information they provide regarding land use. Although there is a specific section
that enables land use to be identified, the options are limited and the reports have been inconsistently completed.25
Whilst the site sketch attached to the reports identifies the boundaries of the cleared area,26 there is no requirement
to identify or provide measurements for each type of land use within the clearance site.
In order to provide an accurate figure for the economic impact of cluster munition contamination on agriculture,
therefore, a more thorough assessment of land use in contaminated areas was required. This assessment formed a
central part of the research conducted for this report.
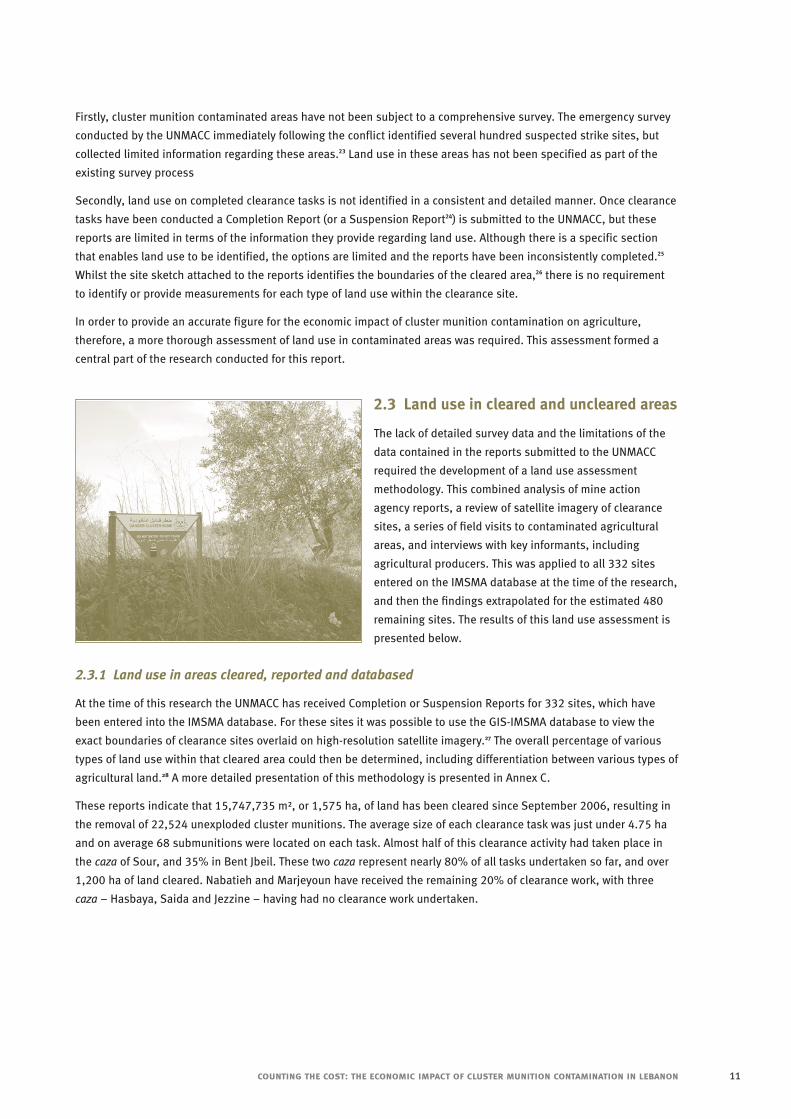
2.3 Land use in cleared and uncleared areas
The lack of detailed survey data and the limitations of the
data contained in the reports submitted to the UNMACC
required the development of a land use assessment
methodology. This combined analysis of mine action
agency reports, a review of satellite imagery of clearance
sites, a series of field visits to contaminated agricultural
areas, and interviews with key informants, including
agricultural producers. This was applied to all 332 sites
entered on the IMSMA database at the time of the research,
and then the findings extrapolated for the estimated 480
remaining sites. The results of this land use assessment is
presented below.
2.3.1 Land use in areas cleared, reported and databased
At the time of this research the UNMACC has received Completion or Suspension Reports for 332 sites, which have
been entered into the IMSMA database. For these sites it was possible to use the GIS-IMSMA database to view the
exact boundaries of clearance sites overlaid on high-resolution satellite imagery.27 The overall percentage of various
types of land use within that cleared area could then be determined, including differentiation between various types of
agricultural land.28 A more detailed presentation of this methodology is presented in Annex C.
These reports indicate that 15,747,735 m², or 1,575 ha, of land has been cleared since September 2006, resulting in
the removal of 22,524 unexploded cluster munitions. The average size of each clearance task was just under 4.75 ha
and on average 68 submunitions were located on each task. Almost half of this clearance activity had taken place in
the caza of Sour, and 35% in Bent Jbeil. These two caza represent nearly 80% of all tasks undertaken so far, and over
1,200 ha of land cleared. Nabatieh and Marjeyoun have received the remaining 20% of clearance work, with three
caza – Hasbaya, Saida and Jezzine – having had no clearance work undertaken.
counting the cost: the economic impact of cluster munition contamination in lebanon 11
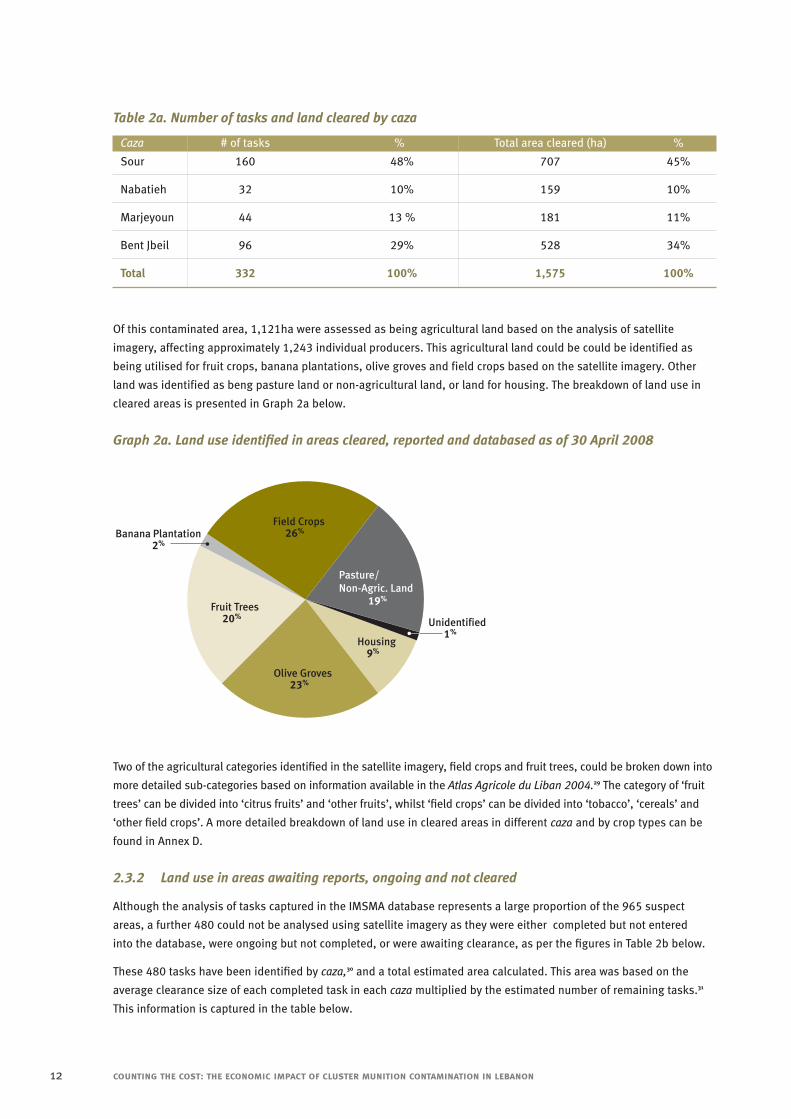
Table 2a. Number of tasks and land cleared by caza
Caza # of tasks % Total area cleared (ha) %
Sour 160 48% 707 45%
Nabatieh 32 10% 159 10%
Marjeyoun 44 13 % 181 11%
Bent Jbeil 96 29% 528 34%
Total 332 100% 1,575 100%
Of this contaminated area, 1,121ha were assessed as being agricultural land based on the analysis of satellite
imagery, affecting approximately 1,243 individual producers. This agricultural land could be could be identified as
being utilised for fruit crops, banana plantations, olive groves and field crops based on the satellite imagery. Other
land was identified as beng pasture land or non-agricultural land, or land for housing. The breakdown of land use in
cleared areas is presented in Graph 2a below.
Graph 2a. Land use identified in areas cleared, reported and databased as of 30 April 2008
Two of the agricultural categories identified in the satellite imagery, field crops and fruit trees, could be broken down into
more detailed sub-categories based on information available in the Atlas Agricole du Liban 2004.29 The category of ‘fruit
trees’ can be divided into ‘citrus fruits’ and ‘other fruits’, whilst ‘field crops’ can be divided into ‘tobacco’, ‘cereals’ and
‘other field crops’. A more detailed breakdown of land use in cleared areas in different caza and by crop types can be
found in Annex D.
2.3.2 Land use in areas awaiting reports, ongoing and not cleared
Although the analysis of tasks captured in the IMSMA database represents a large proportion of the 965 suspect
areas, a further 480 could not be analysed using satellite imagery as they were either completed but not entered
into the database, were ongoing but not completed, or were awaiting clearance, as per the figures in Table 2b below.
These 480 tasks have been identified by caza,30 and a total estimated area calculated. This area was based on the
average clearance size of each completed task in each caza multiplied by the estimated number of remaining tasks.31
This information is captured in the table below.
12 counting the cost: the economic impact of cluster munition contamination in lebanon
Housing9%
Olive Groves23%
Fruit Trees20%
Banana Plantation2%
Field Crops26%
Pasture/Non-Agric. Land
19%
Unidentified1%
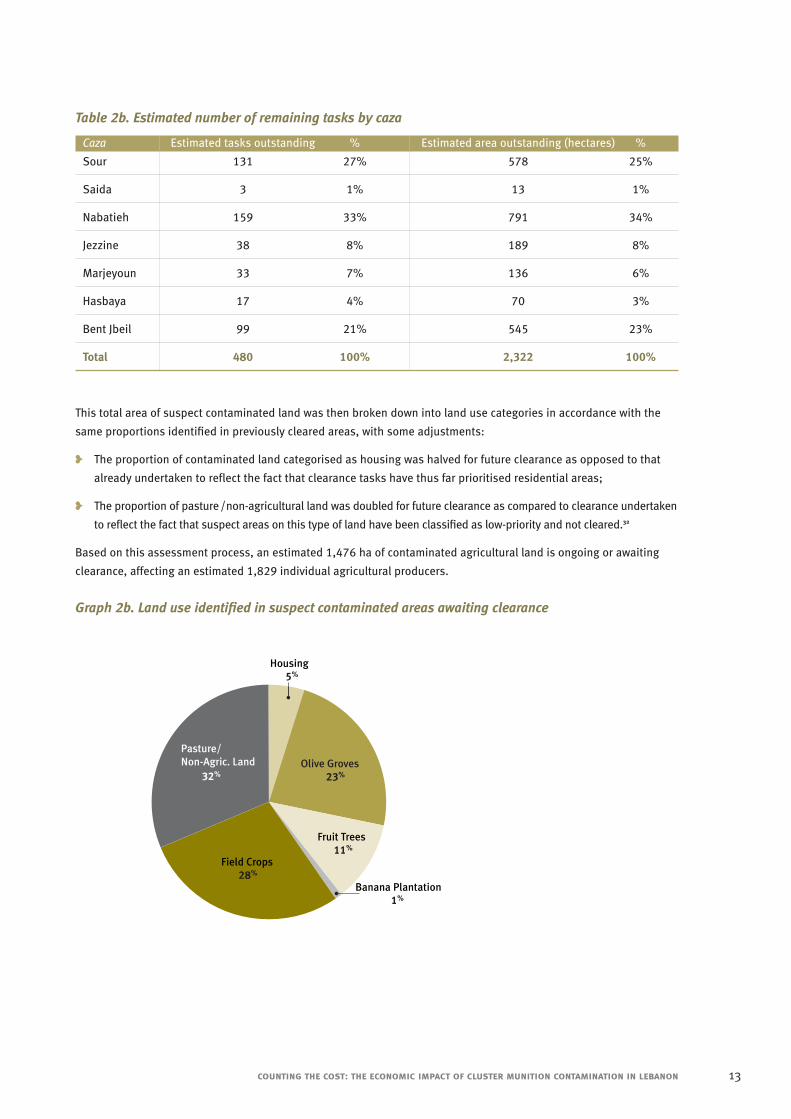
Table 2b. Estimated number of remaining tasks by caza
Caza Estimated tasks outstanding % Estimated area outstanding (hectares) %
Sour 131 27% 578 25%
Saida 3 1% 13 1%
Nabatieh 159 33% 791 34%
Jezzine 38 8% 189 8%
Marjeyoun 33 7% 136 6%
Hasbaya 17 4% 70 3%
Bent Jbeil 99 21% 545 23%
Total 480 100% 2,322 100%
This total area of suspect contaminated land was then broken down into land use categories in accordance with the
same proportions identified in previously cleared areas, with some adjustments:
❥ The proportion of contaminated land categorised as housing was halved for future clearance as opposed to that
already undertaken to reflect the fact that clearance tasks have thus far prioritised residential areas;
❥ The proportion of pasture / non-agricultural land was doubled for future clearance as compared to clearance undertaken
to reflect the fact that suspect areas on this type of land have been classified as low-priority and not cleared.32
Based on this assessment process, an estimated 1,476 ha of contaminated agricultural land is ongoing or awaiting
clearance, affecting an estimated 1,829 individual agricultural producers.
Graph 2b. Land use identified in suspect contaminated areas awaiting clearance
counting the cost: the economic impact of cluster munition contamination in lebanon 13
Housing 5%
Olive Groves 23%
Fruit Trees11%
Banana Plantation1%
Field Crops28%
Pasture/Non-Agric. Land
32%
2.3.3 Contaminated areas as a percentage of all agricultural land
Based on the figures above, a total of 2,596 ha of agricultural land in southern Lebanon is estimated to have been
contaminated by cluster munitions, equating to 4.8% of total agricultural land in this area. This figure is, however,
higher for individual caza and for different crops. For example more than 7% of all agricultural land in Sour and
Bent Jbeil was contaminated by cluster munitions. Over 10% of citrus orchards in Sour, 11% of the tobacco land
in Bent Jbeil and almost 10% of olive groves in Nabatieh were contaminated.
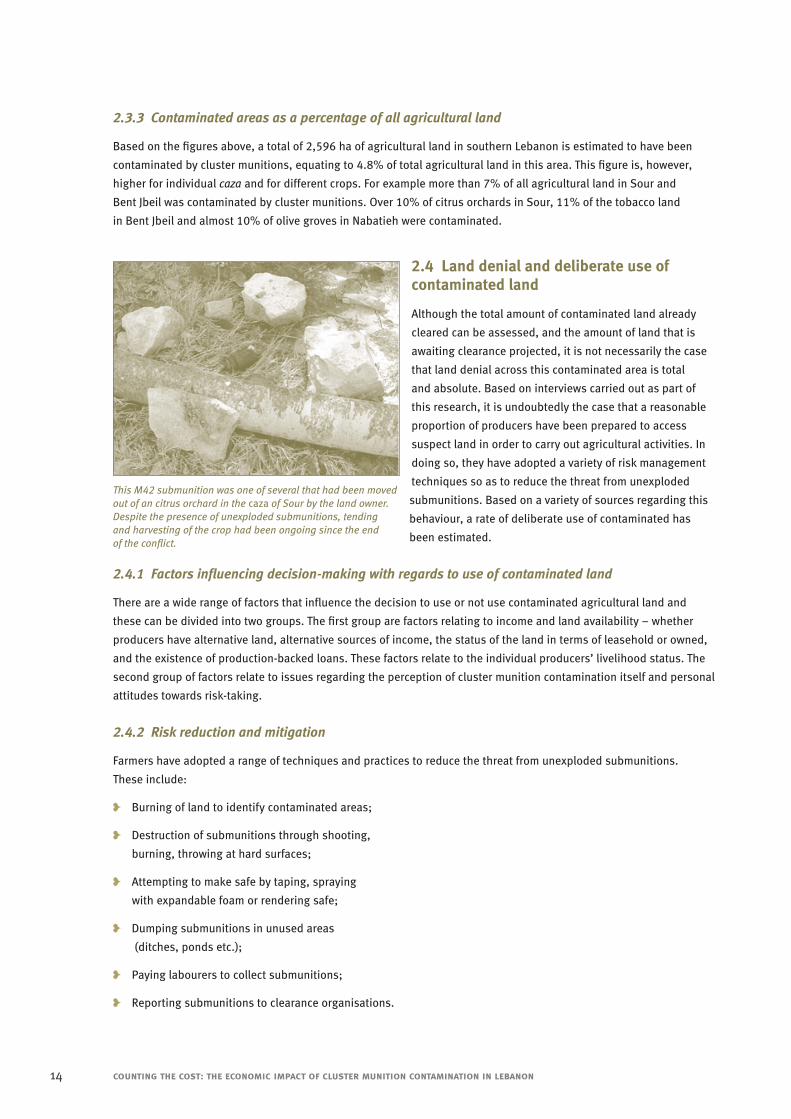
2.4 Land denial and deliberate use ofcontaminated land
Although the total amount of contaminated land already
cleared can be assessed, and the amount of land that is
awaiting clearance projected, it is not necessarily the case
that land denial across this contaminated area is total
and absolute. Based on interviews carried out as part of
this research, it is undoubtedly the case that a reasonable
proportion of producers have been prepared to access
suspect land in order to carry out agricultural activities. In
doing so, they have adopted a variety of risk management
techniques so as to reduce the threat from unexploded
submunitions. Based on a variety of sources regarding this
behaviour, a rate of deliberate use of contaminated has
been estimated.
2.4.1 Factors influencing decision-making with regards to use of contaminated land
There are a wide range of factors that influence the decision to use or not use contaminated agricultural land and
these can be divided into two groups. The first group are factors relating to income and land availability – whether
producers have alternative land, alternative sources of income, the status of the land in terms of leasehold or owned,
and the existence of production-backed loans. These factors relate to the individual producers’ livelihood status. The
second group of factors relate to issues regarding the perception of cluster munition contamination itself and personal
attitudes towards risk-taking.
2.4.2 Risk reduction and mitigation
Farmers have adopted a range of techniques and practices to reduce the threat from unexploded submunitions.
These include:
❥ Burning of land to identify contaminated areas;
❥ Destruction of submunitions through shooting,
burning, throwing at hard surfaces;
❥ Attempting to make safe by taping, spraying
with expandable foam or rendering safe;
❥ Dumping submunitions in unused areas
(ditches, ponds etc.);
❥ Paying labourers to collect submunitions;
❥ Reporting submunitions to clearance organisations.
14 counting the cost: the economic impact of cluster munition contamination in lebanon
This M42 submunition was one of several that had been movedout of an citrus orchard in the caza of Sour by the land owner.Despite the presence of unexploded submunitions, tending and harvesting of the crop had been ongoing since the end of the conflict.
2.4.3 Assessing the extent of deliberate use of contaminated land
A number of information sources were used to assess the extent of deliberate use of contaminated land. These
included direct interviews with farmers conducted during field visits, post-clearance assessment reports, information
from MAG community liaison assessments, and analysis of Completion/Suspension Reports. Based on this analysis
the extent of deliberate access and use of contaminated agricultural land is estimated at between 5% and 15% in
the period up to March 2007, and then at between 15% and 30% in subsequent years. Full details regarding these
information sources and this analysis are provided in Annex E.
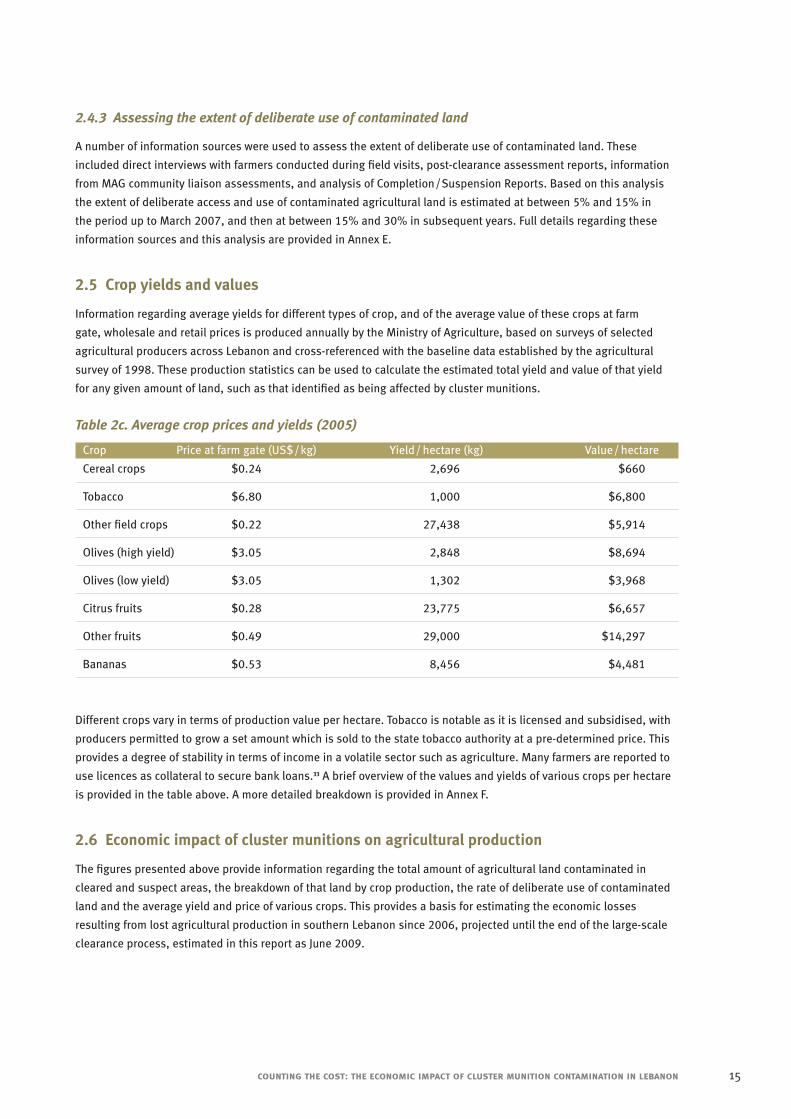
2.5 Crop yields and values
Information regarding average yields for different types of crop, and of the average value of these crops at farm
gate, wholesale and retail prices is produced annually by the Ministry of Agriculture, based on surveys of selected
agricultural producers across Lebanon and cross-referenced with the baseline data established by the agricultural
survey of 1998. These production statistics can be used to calculate the estimated total yield and value of that yield
for any given amount of land, such as that identified as being affected by cluster munitions.
Table 2c. Average crop prices and yields (2005)
Crop Price at farm gate (US$/kg) Yield/ hectare (kg) Value/ hectare
Cereal crops $0.24 2,696 $660
Tobacco $6.80 1,000 $6,800
Other field crops $0.22 27,438 $5,914
Olives (high yield) $3.05 2,848 $8,694
Olives (low yield) $3.05 1,302 $3,968
Citrus fruits $0.28 23,775 $6,657
Other fruits $0.49 29,000 $14,297
Bananas $0.53 8,456 $4,481
Different crops vary in terms of production value per hectare. Tobacco is notable as it is licensed and subsidised, with
producers permitted to grow a set amount which is sold to the state tobacco authority at a pre-determined price. This
provides a degree of stability in terms of income in a volatile sector such as agriculture. Many farmers are reported to
use licences as collateral to secure bank loans.33 A brief overview of the values and yields of various crops per hectare
is provided in the table above. A more detailed breakdown is provided in Annex F.
2.6 Economic impact of cluster munitions on agricultural production
The figures presented above provide information regarding the total amount of agricultural land contaminated in
cleared and suspect areas, the breakdown of that land by crop production, the rate of deliberate use of contaminated
land and the average yield and price of various crops. This provides a basis for estimating the economic losses
resulting from lost agricultural production in southern Lebanon since 2006, projected until the end of the large-scale
clearance process, estimated in this report as June 2009.
counting the cost: the economic impact of cluster munition contamination in lebanon 15
This projected end date is based on the figures provided by UNMACC and detailed in Table 2a above, showing that 55
sites ongoing and a further 350 awaiting clearance as of end of April 2008. Between January and December 2007 an
average of 26 sites were completed each month. If the remaining tasks are completed at the same rate it is reasonable
to assume that the majority of these 405 tasks will be completed by mid–2009.34
By combining this information with the date when sites were completed, or in the case of uncleared areas, the
estimated completion date, and referring this to the agricultural year in terms of planting and harvest periods, the
total number of seasons of production that have been and will be lost can be ascertained.
Using yield and price estimates it is then possible to extrapolate the total lost yield and the value of that yield for
each type of crop. Finally, by factoring in the estimated lower and upper ranges of deliberate access of contaminated
land, thus taking into account rates of land denial as opposed to simply land contamination, a final estimate can be
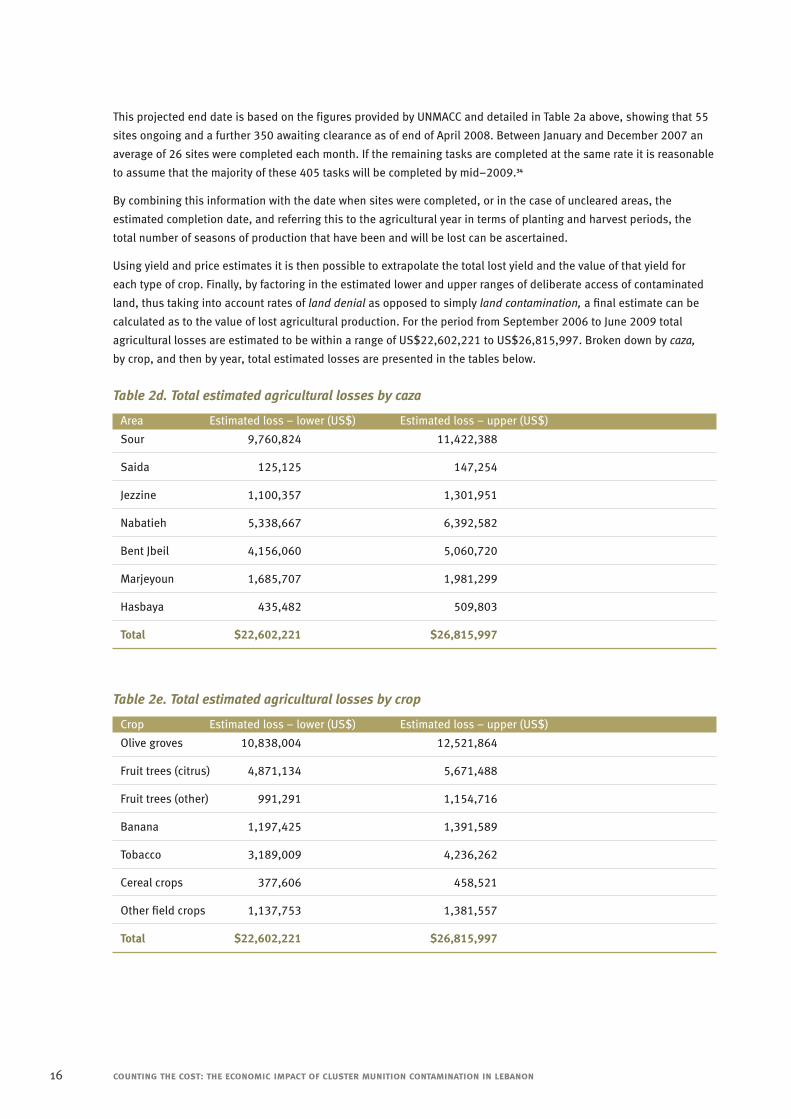
calculated as to the value of lost agricultural production. For the period from September 2006 to June 2009 total
agricultural losses are estimated to be within a range of US$22,602,221 to US$26,815,997. Broken down by caza,
by crop, and then by year, total estimated losses are presented in the tables below.
Table 2d. Total estimated agricultural losses by caza
Area Estimated loss – lower (US$) Estimated loss – upper (US$)
Sour 9,760,824 11,422,388
Saida 125,125 147,254
Jezzine 1,100,357 1,301,951
Nabatieh 5,338,667 6,392,582
Bent Jbeil 4,156,060 5,060,720
Marjeyoun 1,685,707 1,981,299
Hasbaya 435,482 509,803
Total $22,602,221 $26,815,997
Table 2e. Total estimated agricultural losses by crop
Crop Estimated loss – lower (US$) Estimated loss – upper (US$)
Olive groves 10,838,004 12,521,864
Fruit trees (citrus) 4,871,134 5,671,488
Fruit trees (other) 991,291 1,154,716
Banana 1,197,425 1,391,589
Tobacco 3,189,009 4,236,262
Cereal crops 377,606 458,521
Other field crops 1,137,753 1,381,557
Total $22,602,221 $26,815,997
16 counting the cost: the economic impact of cluster munition contamination in lebanon
counting the cost: the economic impact of cluster munition contamination in lebanon 17
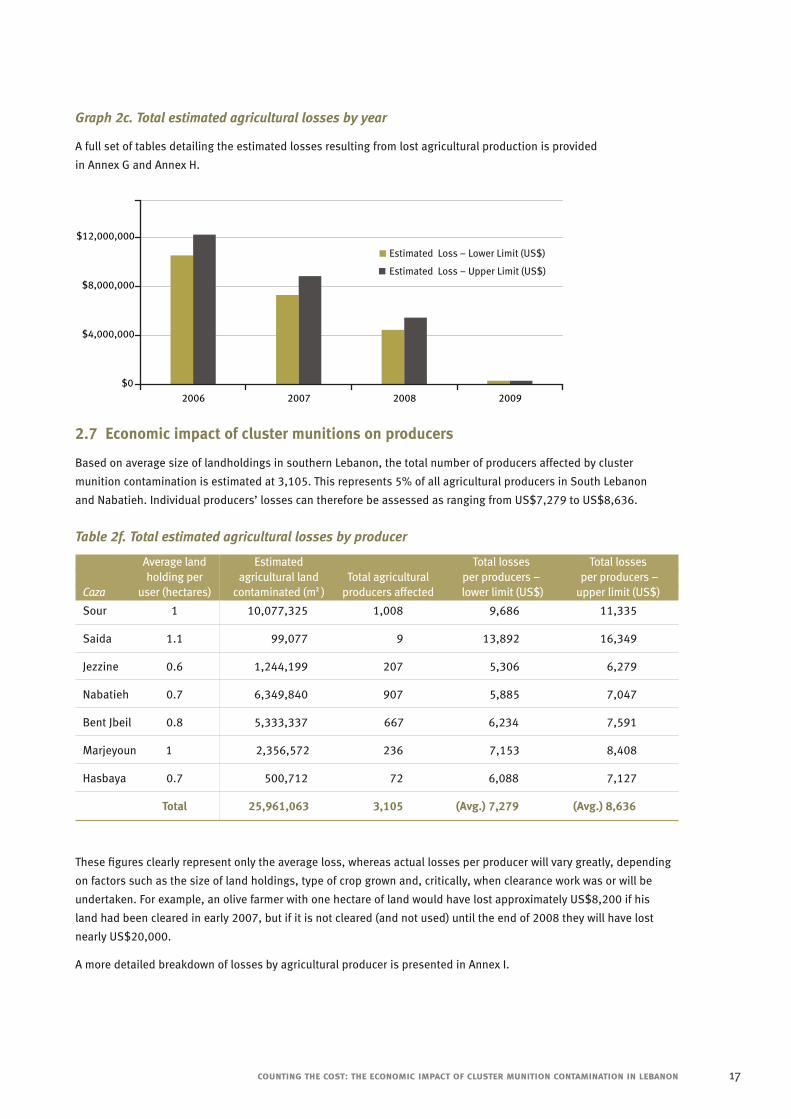
Graph 2c. Total estimated agricultural losses by year
A full set of tables detailing the estimated losses resulting from lost agricultural production is provided
in Annex G and Annex H.
2.7 Economic impact of cluster munitions on producers
Based on average size of landholdings in southern Lebanon, the total number of producers affected by cluster
munition contamination is estimated at 3,105. This represents 5% of all agricultural producers in South Lebanon
and Nabatieh. Individual producers’ losses can therefore be assessed as ranging from US$7,279 to US$8,636.
Table 2f. Total estimated agricultural losses by producer
Average land Estimated Total losses Total losses holding per agricultural land Total agricultural per producers – per producers –
Caza user (hectares) contaminated (m2 ) producers affected lower limit (US$) upper limit (US$)
Sour 1 10,077,325 1,008 9,686 11,335
Saida 1.1 99,077 9 13,892 16,349
Jezzine 0.6 1,244,199 207 5,306 6,279
Nabatieh 0.7 6,349,840 907 5,885 7,047
Bent Jbeil 0.8 5,333,337 667 6,234 7,591
Marjeyoun 1 2,356,572 236 7,153 8,408
Hasbaya 0.7 500,712 72 6,088 7,127
Total 25,961,063 3,105 (Avg.) 7,279 (Avg.) 8,636
These figures clearly represent only the average loss, whereas actual losses per producer will vary greatly, depending
on factors such as the size of land holdings, type of crop grown and, critically, when clearance work was or will be
undertaken. For example, an olive farmer with one hectare of land would have lost approximately US$8,200 if his
land had been cleared in early 2007, but if it is not cleared (and not used) until the end of 2008 they will have lost
nearly US$20,000.
A more detailed breakdown of losses by agricultural producer is presented in Annex I.
$0
$4,000,000
$8,000,000
$12,000,000
2006 2007 2008 2009
Estimated Loss – Lower Limit (US$)
Estimated Loss – Upper Limit (US$)
18 counting the cost: the economic impact of cluster munition contamination in lebanon
3.1 Introduction
The intensive use of cluster munitions in Lebanon by Israeli forces resulted in an extremely high density of unexploded
submunitions across southern Lebanon. The mine action response to this humanitarian crisis was swift and significant
in its scope. Due to the established coordination capacities (both national and UN), existing clearance capacities,
the presence of UN and Lebanese armed forces and the timely disbursement of funding by the international donor
community, there was a rapid and structured response to cluster munition contamination. Explosive Ordnance
Disposal (EOD) teams and Battle area clearance (BAC) teams were mobilised and had commenced clearance
operations within days of the end of hostilities.
The UNMACC acted as the UN Mine Action Focal Point for other UN agencies, conducted a rapid emergency survey
aimed at identifying all suspect contaminated areas, and was responsible for coordinating and accrediting all
international mine action agencies seeking to work in the country, as well as taking ongoing responsibility for
tasking and quality assurance.
3.2 Mine action capacities deployed
To deal with such widespread cluster munition contamination, agencies established BAC teams able to conduct
thorough but relatively quick visual searches of affected areas. BAC teams also had the capacity to search below
ground, as it quickly became apparent that unexploded munitions had buried themselves into softer ground in many
areas. By October 2006, only two months after the ceasefire, there were four international organisations deploying a
total of 34 BAC teams. The number of teams peaked at 60 in October 2007, and as of March 2008 stood at 50 teams,
operated by seven international mine clearance organisations.35 In addition to BAC teams, a wide range of additional
clearance assets were mobilised. These included:
❥ Lebanese Armed Forces: The LAF conducted significant amounts of EOD and visual search following the conflict.
The LAF and the UNMACC have established strong coordination structures with regards to quality assurance,
survey, completion reports and handovers;
❥ UNIFIL troops: UNIFIL provided troop capacity to the UNMACC as additional clearance assets for both EOD
and clearance work;
❥ EOD teams: Several organisations established a number of EOD teams to respond to requests for emergency
clearance of submunitions and deal with reports of munitions in areas that had not yet received full clearance
capacities;
❥ Regional and international expertise: the rapid scale-up of operations required a high level of international
supervisory capacity. Some agencies were able to draw on “regional” expertise – Mines Advisory Group (MAG)
deployed 16 senior national staff from within their Iraq programme, who were considered critical to the success
of the clearance programme.36 Other agencies, such as Dan-Church Aid (DCA) and Norwegian Peoples Aid (NPA),
deployed staff from Kosovo and Bosnia;
❥ Short-term international deployments: The New Zealand Defence Forces seconded one BAC team for a period of
12 months, and SRSA mobilised an Icelandic EOD team for a period of approximately 6 months.
Part 3: The mine action response to cluster munition contamination
counting the cost: the economic impact of cluster munition contamination in lebanon 19
The ability to deploy a range of assets in such a short period of time with a specific focus on cluster munitions was
undoubtedly an important factor in the rapid reduction in the accident rate in the period up to December 2006. It is
likely that if similar levels of contamination were to occur in an environment that did not have recourse to this range
of assets there would be far greater rates of deaths and injuries and a much more prolonged period of land denial.
3.3 Outputs and clearance results
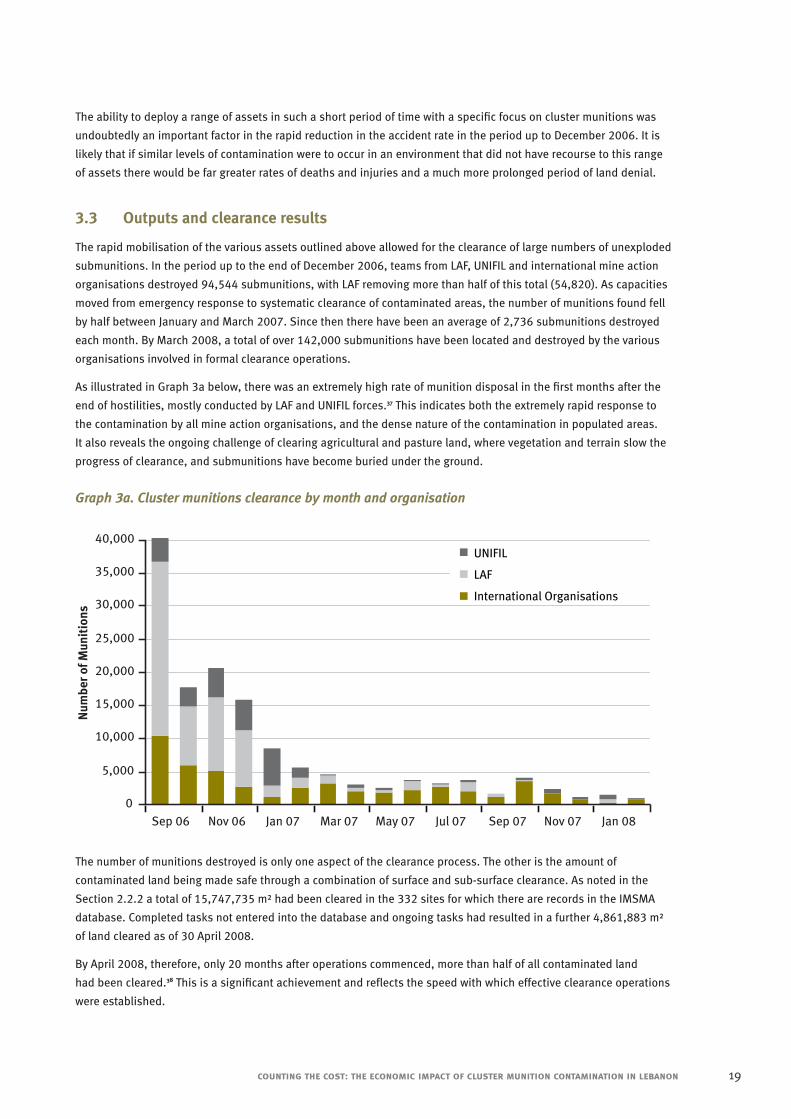
The rapid mobilisation of the various assets outlined above allowed for the clearance of large numbers of unexploded
submunitions. In the period up to the end of December 2006, teams from LAF, UNIFIL and international mine action
organisations destroyed 94,544 submunitions, with LAF removing more than half of this total (54,820). As capacities
moved from emergency response to systematic clearance of contaminated areas, the number of munitions found fell
by half between January and March 2007. Since then there have been an average of 2,736 submunitions destroyed
each month. By March 2008, a total of over 142,000 submunitions have been located and destroyed by the various
organisations involved in formal clearance operations.
As illustrated in Graph 3a below, there was an extremely high rate of munition disposal in the first months after the
end of hostilities, mostly conducted by LAF and UNIFIL forces.37 This indicates both the extremely rapid response to
the contamination by all mine action organisations, and the dense nature of the contamination in populated areas.
It also reveals the ongoing challenge of clearing agricultural and pasture land, where vegetation and terrain slow the
progress of clearance, and submunitions have become buried under the ground.
Graph 3a. Cluster munitions clearance by month and organisation
The number of munitions destroyed is only one aspect of the clearance process. The other is the amount of
contaminated land being made safe through a combination of surface and sub-surface clearance. As noted in the
Section 2.2.2 a total of 15,747,735 m² had been cleared in the 332 sites for which there are records in the IMSMA
database. Completed tasks not entered into the database and ongoing tasks had resulted in a further 4,861,883 m²
of land cleared as of 30 April 2008.
By April 2008, therefore, only 20 months after operations commenced, more than half of all contaminated land
had been cleared.38 This is a significant achievement and reflects the speed with which effective clearance operations
were established.
0
5,000
10,000
15,000
20,000
25,000
30,000
35,000
40,000
Sep 06 Nov 06 Jan 07 Mar 07 May 07 Jul 07 Sep 07 Nov 07 Jan 08
Num
ber o
f Mun
itio
ns
UNIFIL
LAF
International Organisations
3.4 Clearance methodologies and residual risk
The clearance methodology adopted in Lebanon has seen sites approached with a combination of visual search,
instrument-aided visual search, and full instrumental search. These are also known as surface and sub-surface
searches. The amount of land subject to sub-surface search in the 332 sites indicated above is 4,926,589 m²,
leaving 10,820,756 m² of cleared land subject to only visual or instrument-aided visual search. However a
reasonably significant proportion of submunitions are found beneath the surface, approximately 38% in a
sample of sites subject to both surface and sub-surface search. This proportion increases significantly for areas
contaminated with BLU-63 submunitions.39
The clearance planning process requires that a series of factors are taken into account when deciding to conduct
either surface or sub-surface searches on any given contaminated area. These include assessments of terrain, soil
conditions, vegetation, type of bomblet, intended land use and so on. However on any areas (except hard surfaces
such as tarmac or concrete) that have only been searched using a surface methodology, a higher level of residual
risk will naturally remain than on areas where sub-surface search has been conducted.40
3.5 The cost and economic impact of mine action activities
3.5.1 Cost of clearance
Establishing and running a large-scale clearance programme requires a significant amount of funding in order to
undertake initial procurement of capital items, to deploy international staff and establish the administrative and
logistical infrastructure required to commence mine action operations. Once a capacity has been established,
further funds are required for the ongoing running costs, such as salaries, expendable stores and training. The
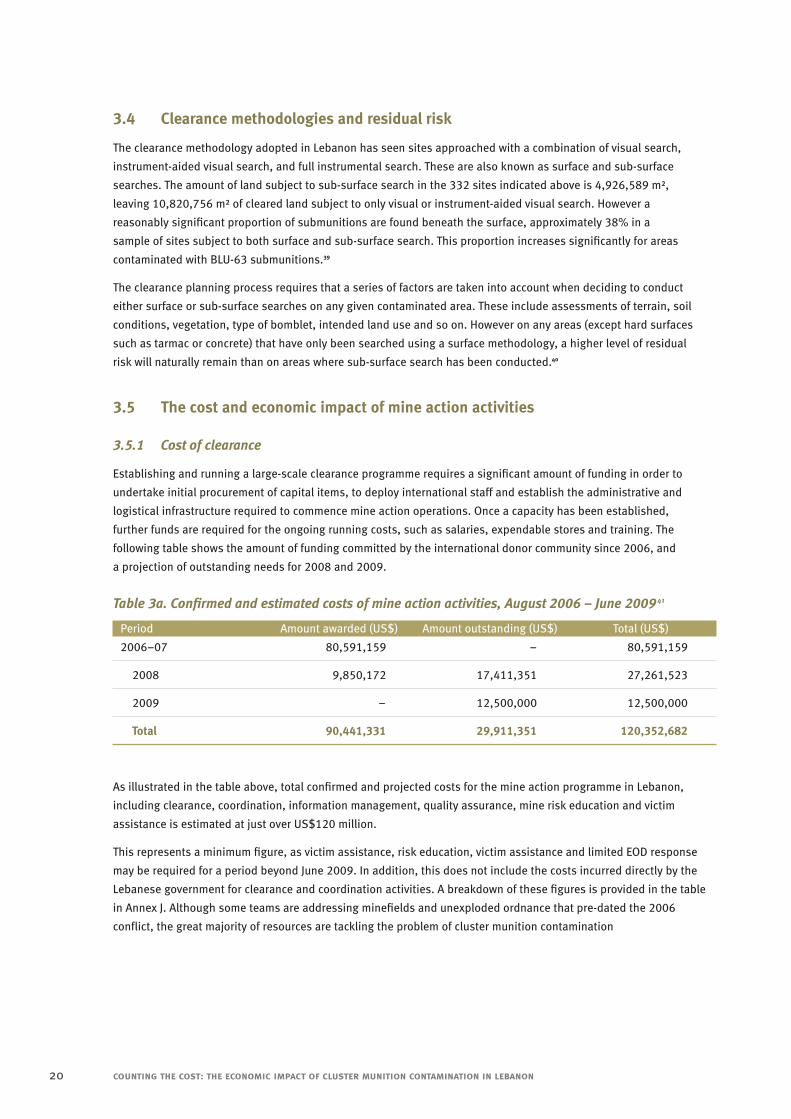
following table shows the amount of funding committed by the international donor community since 2006, and
a projection of outstanding needs for 2008 and 2009.
Table 3a. Confirmed and estimated costs of mine action activities, August 2006 – June 2009 41
Period Amount awarded (US$) Amount outstanding (US$) Total (US$)
2006–07 80,591,159 – 80,591,159
2008 9,850,172 17,411,351 27,261,523
2009 – 12,500,000 12,500,000
Total 90,441,331 29,911,351 120,352,682
As illustrated in the table above, total confirmed and projected costs for the mine action programme in Lebanon,
including clearance, coordination, information management, quality assurance, mine risk education and victim
assistance is estimated at just over US$120 million.
This represents a minimum figure, as victim assistance, risk education, victim assistance and limited EOD response
may be required for a period beyond June 2009. In addition, this does not include the costs incurred directly by the
Lebanese government for clearance and coordination activities. A breakdown of these figures is provided in the table
in Annex J. Although some teams are addressing minefields and unexploded ordnance that pre-dated the 2006
conflict, the great majority of resources are tackling the problem of cluster munition contamination
20 counting the cost: the economic impact of cluster munition contamination in lebanon
3.5.2 Implications for the local economy
The impact of such a large-scale clearance programme on the local economy is quite extensive, and can be identified
in three main areas:
❥ Direct economic inputs from salaries
❥ Direct economic impact from expenditure on local products
❥ Other indirect impacts (positive and negative)
Based on figures obtained during the research process regarding staff numbers, salary levels and projected capacities,
it is estimated that some US$22.7 million has been or will be transferred to the local community through salary
payments. Expenditure on local goods and services, including items such as office and house rental, the purchase
of expendable stores (such as stationary, marking materials for clearance sites etc.) is estimated at US$2.6 million.
These figures are conservative, but on this basis we can estimate that, by the end of large scale clearance operations,
as much as 20% of all funding provided for cluster munition clearance in Lebanon will have gone directly into the
local economy.
There are a number of other ways in which the establishment of a large-scale clearance capacity impacts on the
local economy, but which are beyond the scope of this report to examine in any detail. However it is worth noting
that indirect impacts can be both positive and negative.
counting the cost: the economic impact of cluster munition contamination in lebanon 21
4.1 Number of deaths and injuries due to cluster munitions
Data collection on mine and UXO victims is conducted by all agencies involved in mine action in Lebanon, and held by
the UNMACC and the LMAC. The data analysed in this section was provided by the UNMACC.
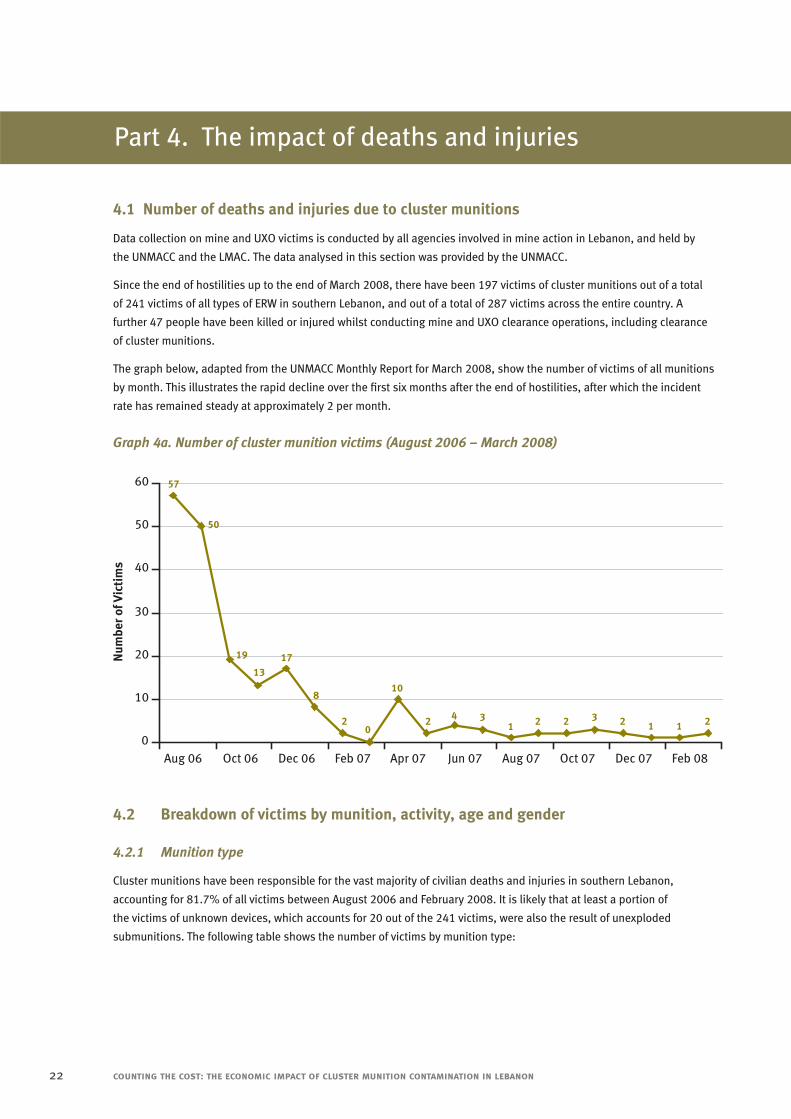
Since the end of hostilities up to the end of March 2008, there have been 197 victims of cluster munitions out of a total
of 241 victims of all types of ERW in southern Lebanon, and out of a total of 287 victims across the entire country. A
further 47 people have been killed or injured whilst conducting mine and UXO clearance operations, including clearance
of cluster munitions.
The graph below, adapted from the UNMACC Monthly Report for March 2008, show the number of victims of all munitions
by month. This illustrates the rapid decline over the first six months after the end of hostilities, after which the incident
rate has remained steady at approximately 2 per month.
Graph 4a. Number of cluster munition victims (August 2006 – March 2008)
4.2 Breakdown of victims by munition, activity, age and gender
4.2.1 Munition type
Cluster munitions have been responsible for the vast majority of civilian deaths and injuries in southern Lebanon,
accounting for 81.7% of all victims between August 2006 and February 2008. It is likely that at least a portion of
the victims of unknown devices, which accounts for 20 out of the 241 victims, were also the result of unexploded
submunitions. The following table shows the number of victims by munition type:
22 counting the cost: the economic impact of cluster munition contamination in lebanon
Part 4. The impact of deaths and injuries
1317
8
20
10
2 4 31 2 2 3 2 1 1 2
57
50
19
0
10
20
30
40
50
60
Aug 06 Oct 06 Dec 06 Feb 07 Apr 07 Jun 07 Aug 07 Oct 07 Dec 07 Feb 08
Num
ber
of V
icti
ms
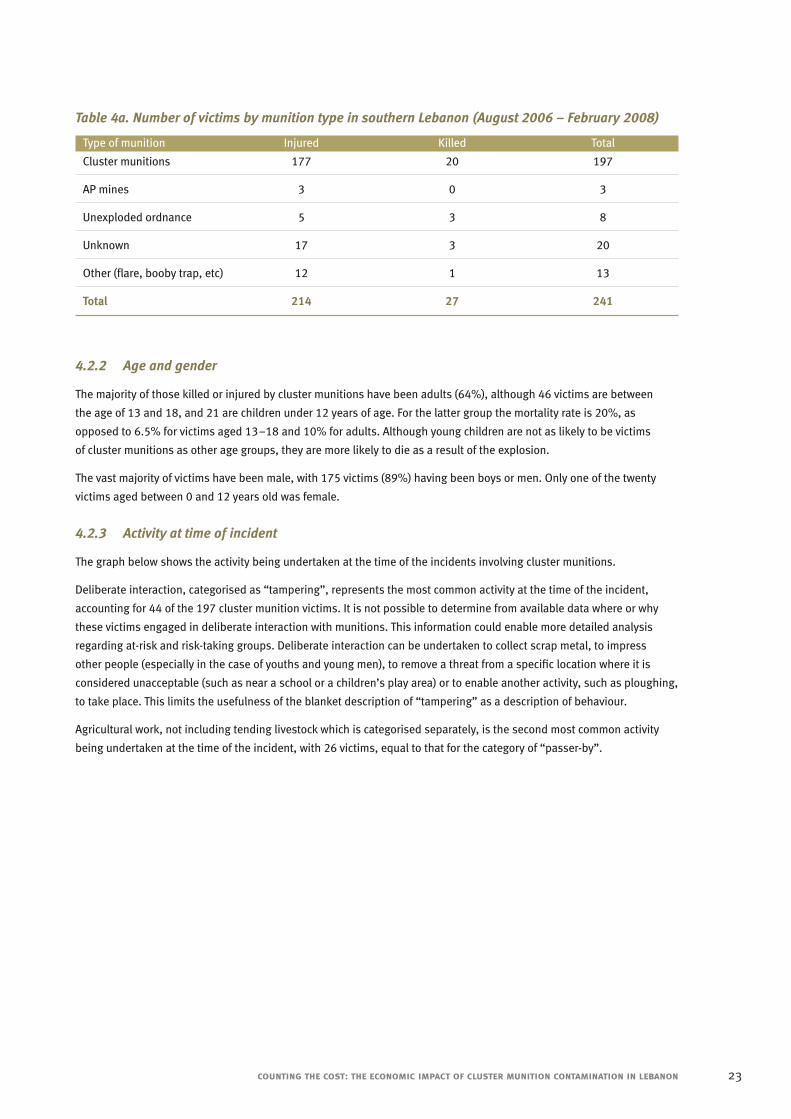
Table 4a. Number of victims by munition type in southern Lebanon (August 2006 – February 2008)
Type of munition Injured Killed Total
Cluster munitions 177 20 197
AP mines 3 0 3
Unexploded ordnance 5 3 8
Unknown 17 3 20
Other (flare, booby trap, etc) 12 1 13
Total 214 27 241
4.2.2 Age and gender
The majority of those killed or injured by cluster munitions have been adults (64%), although 46 victims are between
the age of 13 and 18, and 21 are children under 12 years of age. For the latter group the mortality rate is 20%, as
opposed to 6.5% for victims aged 13–18 and 10% for adults. Although young children are not as likely to be victims
of cluster munitions as other age groups, they are more likely to die as a result of the explosion.
The vast majority of victims have been male, with 175 victims (89%) having been boys or men. Only one of the twenty
victims aged between 0 and 12 years old was female.
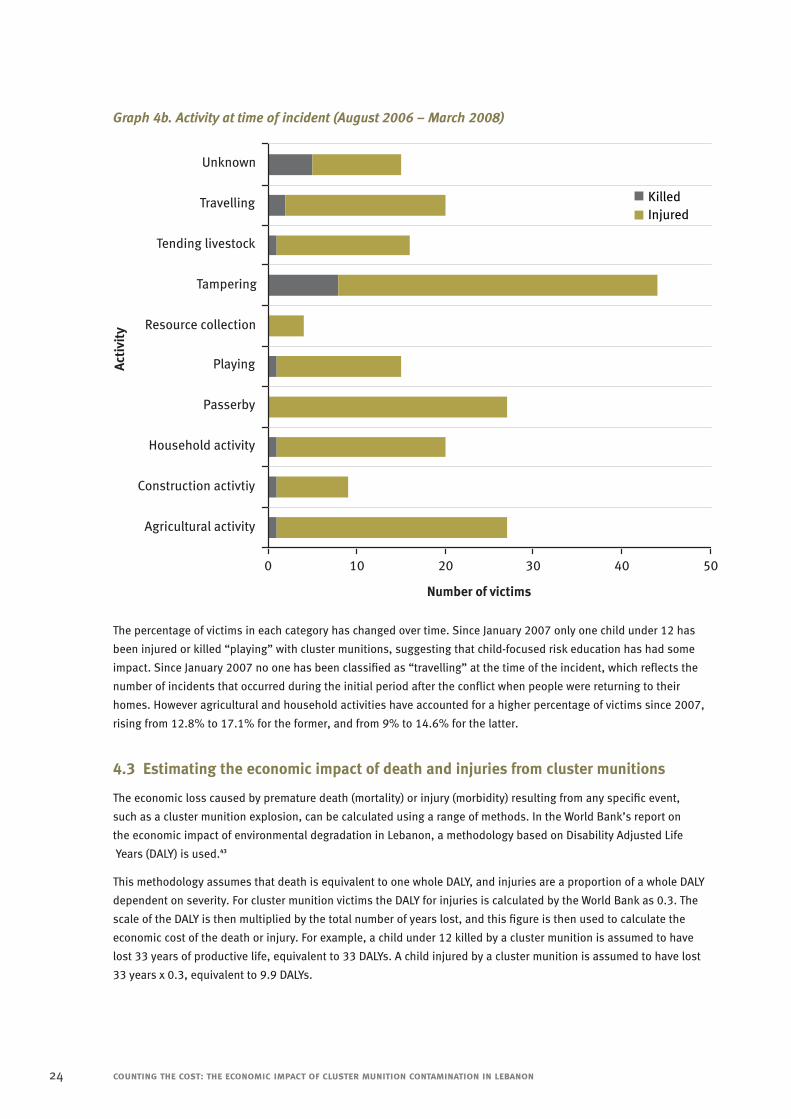
4.2.3 Activity at time of incident
The graph below shows the activity being undertaken at the time of the incidents involving cluster munitions.
Deliberate interaction, categorised as “tampering”, represents the most common activity at the time of the incident,
accounting for 44 of the 197 cluster munition victims. It is not possible to determine from available data where or why
these victims engaged in deliberate interaction with munitions. This information could enable more detailed analysis
regarding at-risk and risk-taking groups. Deliberate interaction can be undertaken to collect scrap metal, to impress
other people (especially in the case of youths and young men), to remove a threat from a specific location where it is
considered unacceptable (such as near a school or a children’s play area) or to enable another activity, such as ploughing,
to take place. This limits the usefulness of the blanket description of “tampering” as a description of behaviour.
Agricultural work, not including tending livestock which is categorised separately, is the second most common activity
being undertaken at the time of the incident, with 26 victims, equal to that for the category of “passer-by”.
counting the cost: the economic impact of cluster munition contamination in lebanon 23
24 counting the cost: the economic impact of cluster munition contamination in lebanon
Graph 4b. Activity at time of incident (August 2006 – March 2008)
The percentage of victims in each category has changed over time. Since January 2007 only one child under 12 has
been injured or killed “playing” with cluster munitions, suggesting that child-focused risk education has had some
impact. Since January 2007 no one has been classified as “travelling” at the time of the incident, which reflects the
number of incidents that occurred during the initial period after the conflict when people were returning to their
homes. However agricultural and household activities have accounted for a higher percentage of victims since 2007,
rising from 12.8% to 17.1% for the former, and from 9% to 14.6% for the latter.
4.3 Estimating the economic impact of death and injuries from cluster munitions
The economic loss caused by premature death (mortality) or injury (morbidity) resulting from any specific event,
such as a cluster munition explosion, can be calculated using a range of methods. In the World Bank’s report on
the economic impact of environmental degradation in Lebanon, a methodology based on Disability Adjusted Life
Years (DALY) is used.43
This methodology assumes that death is equivalent to one whole DALY, and injuries are a proportion of a whole DALY
dependent on severity. For cluster munition victims the DALY for injuries is calculated by the World Bank as 0.3. The
scale of the DALY is then multiplied by the total number of years lost, and this figure is then used to calculate the
economic cost of the death or injury. For example, a child under 12 killed by a cluster munition is assumed to have
lost 33 years of productive life, equivalent to 33 DALYs. A child injured by a cluster munition is assumed to have lost
33 years x 0.3, equivalent to 9.9 DALYs.
0 10 20 30 40 50
Agricultural activity
Construction activtiy
Household activity
Passerby
Playing
Resource collection
Tampering
Tending livestock
Travelling
Unknown
Acti
vity
Number of victims
Killed
Injured
counting the cost: the economic impact of cluster munition contamination in lebanon 25
The value per DALY can be calculated based on different rates. The World Bank use a lower level equivalent to GDP
per capita for 2006 (US$5,300). The upper level is based on a more complex formula which calculates the value of
a statistical life based on a “willingness-to-pay” methodology. The “willingness-to-pay” method is derived from the
perceived value that people place on risk of death judged by decisions made with regards to salary and types of
employment. A figure derived from a study conducted in the United States has been adjusted to reflect the GDP
per capita difference with Lebanon, giving a figure of US$42,000 per DALY on the “willingness-to-pay” scale.
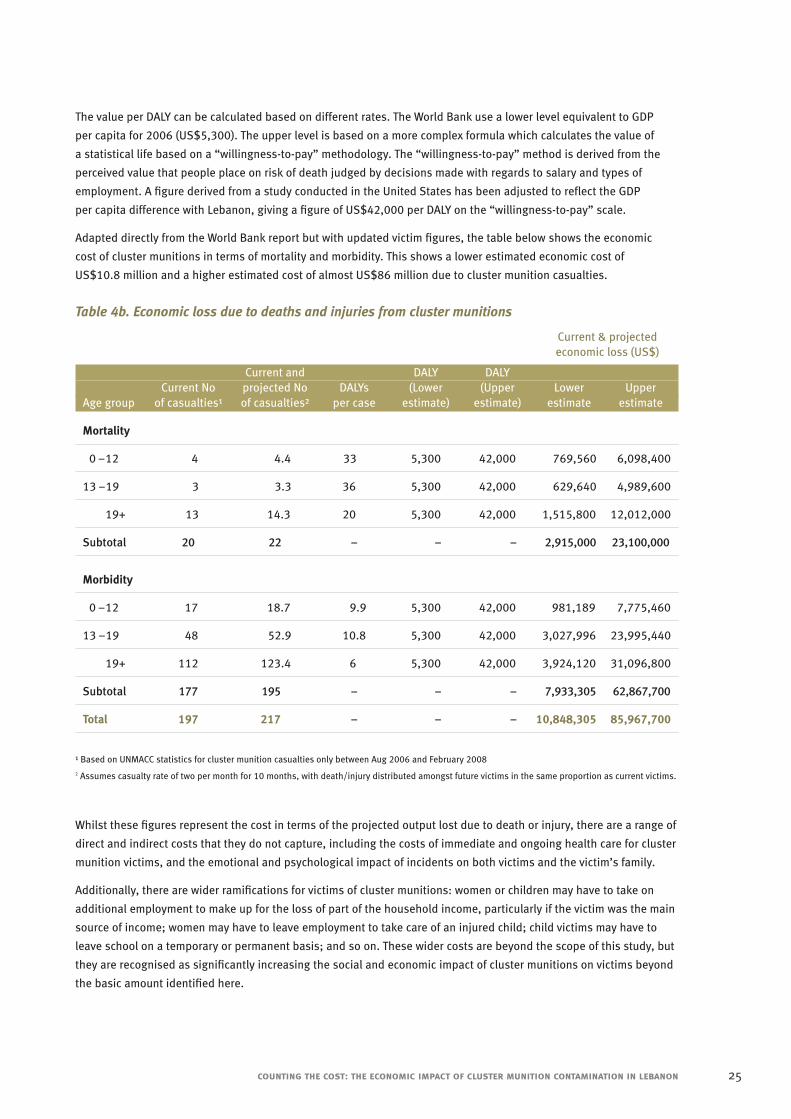
Adapted directly from the World Bank report but with updated victim figures, the table below shows the economic
cost of cluster munitions in terms of mortality and morbidity. This shows a lower estimated economic cost of
US$10.8 million and a higher estimated cost of almost US$86 million due to cluster munition casualties.
Table 4b. Economic loss due to deaths and injuries from cluster munitions
Current & projected economic loss (US$)
Current and DALY DALYCurrent No projected No DALYs (Lower (Upper Lower Upper
Age group of casualties¹ of casualties² per case estimate) estimate) estimate estimate
Mortality
0 –12 4 4.4 33 5,300 42,000 769,560 6,098,400
13 –19 3 3.3 36 5,300 42,000 629,640 4,989,600
19+ 13 14.3 20 5,300 42,000 1,515,800 12,012,000
Subtotal 20 22 – – – 2,915,000 23,100,000
Morbidity
0 –12 17 18.7 9.9 5,300 42,000 981,189 7,775,460
13 –19 48 52.9 10.8 5,300 42,000 3,027,996 23,995,440
19+ 112 123.4 6 5,300 42,000 3,924,120 31,096,800
Subtotal 177 195 – – – 7,933,305 62,867,700
Total 197 217 – – – 10,848,305 85,967,700
¹ Based on UNMACC statistics for cluster munition casualties only between Aug 2006 and February 20082 Assumes casualty rate of two per month for 10 months, with death/injury distributed amongst future victims in the same proportion as current victims.
Whilst these figures represent the cost in terms of the projected output lost due to death or injury, there are a range of
direct and indirect costs that they do not capture, including the costs of immediate and ongoing health care for cluster
munition victims, and the emotional and psychological impact of incidents on both victims and the victim’s family.
Additionally, there are wider ramifications for victims of cluster munitions: women or children may have to take on
additional employment to make up for the loss of part of the household income, particularly if the victim was the main
source of income; women may have to leave employment to take care of an injured child; child victims may have to
leave school on a temporary or permanent basis; and so on. These wider costs are beyond the scope of this study, but
they are recognised as significantly increasing the social and economic impact of cluster munitions on victims beyond
the basic amount identified here.
26 counting the cost: the economic impact of cluster munition contamination in lebanon
Annex A: Selected list of information sourcesA.1 Damage and impact assessments
1. JRC/EUSC (2006) Rapid Preliminary Damage Assessment, undertaken by the Joint Research Centre/
European Union Satellite Centre, Brussels
2. FAO (2006) Damage and Early Recovery Needs Assessment of Agriculture, Fisheries and Forestry,
Food and Agriculture Organisation, Rome
3. IFAD (2006) Analyse des moyens d’existence et du genre suite aux dommages de guerre dans les zones
rurales pauvres, International Fund for Agricultural Development, Rome44
4. UNEP (2007) Lebanon: Post-conflict Environment Assessment, United Nations Environment Programme, Nairobi
5. Association for Forests Development and Conservation/UNDP (2007) War Impact on Forest Resources and Olive
Groves in south Lebanon, AFDC, Beirut
6. World Bank (2007) Post-conflict Social and Livelihoods Assessment in Lebanon, World Bank/
Ministry of Social Affairs, Beirut
7. World Bank, (October 2007) Economic Assessment of Environmental Degradation Due to the July 2006
Hostilities, Report No. 39787-LB, Sustainable Development Department, Middle East and North Africa Section,
World Bank, Washington
A.2 Cluster munition use in Lebanon
1. Landmine Action (2003), Cluster munitions in Lebanon, Landmine Action, London. N.B. This report refers to
cluster munitions used prior to 2006
2. Landmine Action (2006), Foreseeable Harm: the use and impact of cluster munitions in Lebanon: 2006,
Landmine Action, London
3. Mukhtar, H., Salem, P. & Wareham, S. (2006) Cluster Bombs: The Case of Lebanon. Report of a humanitarian
delegation to Lebanon of representatives of Australians for Lebanon and the Medical Association for Prevention
of War (Australia).
4. UN OCHA (2006) Lasting Legacy: The Deadly Impact of Cluster Bombs in Southern Lebanon,
U.N. Office for the Coordination of Humanitarian Affairs, Beirut.
5. Human Rights Watch (2007), Flooding South Lebanon: Israel’s Use of Cluster Munitions in Lebanon
in July and August 2006, Human Rights Watch, New York.
A.3 General information regarding cluster munitions
1. Prokosch, E. (1995) The Technology of Killing, Zed Books, London.
2. Landmine Action (2006), Failure to protect: A case for the prohibition of cluster munitions, London.
4. C. King Associates Ltd, Norwegian Defence Research Establishment and Norwegian People’s Aid (2007)
M85: an analysis of reliability, Norwegian Peoples Aid, Oslo
5. ICRC (2007) Expert Meeting on Humanitarian, Military, Technical and Legal Challenges of Cluster Munitions,
counting the cost: the economic impact of cluster munition contamination in lebanon 27
International Committee of the Red Cross, Geneva
A.4 Background reports on Lebanon
1. ICG (2007) Lebanon at a Tripwire, ICG Policy Briefing, International Crisis Group, Brussels/Beirut
2. ICG, Israel/Hizbollah/Lebanon: Avoiding renewed conflict, ICG Middle East Report N°59,
International Crisis Group, Brussels/Beirut
3. ICG, Hizbollah And The Lebanese Crisis, ICG Middle East Report N°69 – 10, International Crisis Group,
Brussels/Beirut
4. Government of Lebanon (2004), Millennium Development Goals: Lebanon Report 2003
5. Government of Lebanon (2004), Atlas Agricole du Liban (2004), Ministry of Agriculture, Beirut
6. Government of Lebanon (2007), Agricultural Statistics 2005, Directorate of Studies and Coordination,
Ministry of Agriculture, Beirut.
A.5 Interviews and key informants
Maya Aoun, Director de Projet, AVSI
Dr. Christina Bennike, Programme Manage, DanChurchAid
Lindza Berbari, Program Coordinator, IOCC
Mikael Bold, Operations Officer, UNMACC South Lebanon
Chris Clark, Programme Manager, UNMACC South Lebanon
Rana Elias, IMSMA Programme Officer, UNMACC South Lebanon
Dalya Farran, Media and Post Clearance Officer, UNMACC South Lebanon
Colonel Fehmi, LMAC Representative, Lebanese Armed Forces
Catherine Isabelle Fleming, Transitional Programme Officer, UNMACC South Lebanon
Tekimiti Gilbert, Chief of Operations, UNMACC South Lebanon
Andy Gleeson, Technical Operations Manager, MAG
Johan den Haan, Operations Manager, BACTEC International
Mohammed Haida, Olive Farmer, Nabatieh
Mark Holyroyd, Chief of Operations, Handicap International
Ibrahim Jaffal, Landowner, Nabatieh
Mohammed Jaffal, Landowner, Nabatieh
Alan Kelly, Planning Officer, UNMACC South Lebanon
Abbas Khreibani, Tobacco Farmer, Nabatieh
Leyla Moubayed, Country Representative, International Relief and Development
Amer Musanavic, Technical Manager, Norwegian Peoples Aid
Ezat Musselamany, Citrus Farmer, Sour
Dr. Hussein Nasrallah, Director, Coordination and Studies Unit, Ministry of Agriculture
Rami Osayaran, Citrus Farmer, Nabatieh
Siaad Osayaran, Citrus Producer, Nabatieh
Mohammed Osayaran, Citrus Producer, Nabatieh
Amira Zeidan, Community Liaison Manager, MAG
Ibrahim Salaam, Olive Farmer, Nabatieh
Rami Samain, Emergency Coordinator, Food and Agriculture Organisation
Khaled Yamout, Landmine Action Program Coordinator, NPA
Moussa Yassin, Olive Farmer, Nabatieh
Annex B: The agricultural sector in southern Lebanon
B.1 Overview
Agriculture is a central features of the economic and social fabric of southern Lebanon. Significant numbers of
households produce a variety of crops for both personal consumption and for sale in the local, national and
international markets. Whilst many households have a variety of income sources, agricultural produce represents
a relatively dependable source of income, and personal use of produce decreases total household expenditure on
food items and reduces vulnerability to increases in food prices. Key feature of the agricultural sector in southern
Lebanon are examined below.
B.2 Size, scope and character of agricultural sector
No comprehensive national agricultural land use survey has taken place since 1998, which was compiled into the
Atlas Agricole du Liban of 2004.45 However, production and price statistics have been gathered on an annual basis
since 2001, the most recent available year being for 2005. Based on this information the following observations
can be made regarding the size and scope of the agricultural sector in southern Lebanon.
B.2.1 Amount of land under production
South Lebanon and Nabatieh represent 12% and 11% respectively of the total agricultural land in use in Lebanon
(55,597 ha out of a total of 248,000 hectares).46 The amount of land that is used for agricultural production as a
proportion of all land is particularly high in the areas around Tyre and Nabatieh, with many districts reporting more
than 40% of all land used for agriculture.47
The average land holding in South Lebanon and Nabatieh is 1 ha and 0.8 ha respectively,48 with more than 75% of
producers using less than 1 ha of land.49 This is lower than the national average, reflecting the fact that the majority
of large-scale commercial farming takes place in the centre and north of the country.
B.2.2 Number of agricultural producers
There are an estimated 29,504 agricultural producers in the mouhafazat of South Lebanon, and 30,307 in Nabatieh,50
out of a total population of 747,477. This represents just over 30% of the total number of agricultural producers in
Lebanon. 35% of producers in South Lebanon and 27% of those in Nabatieh are entirely dependent on agriculture
for their livelihoods, with the remainder having other sources of income.51
B.2.3 Commercial and personal production
More than 85% of total agricultural land in South Lebanon and 80% of land in Nabatieh is farmed for commercial
purposes. However the 9,683 ha, or 17% of all agricultural land, that is farmed for personal use supports 50% of
all farmers.52 This reflects the extent and importance of small-scale production for families as an alternative to using
limited income for the purchase of food.
Whilst the majority of agricultural land is in production by the owner, a reasonably high proportion of land is either
leased or in use by someone other than the owner – 25% in Nabatieh and 19% in South Lebanon.53
28 counting the cost: the economic impact of cluster munition contamination in lebanon
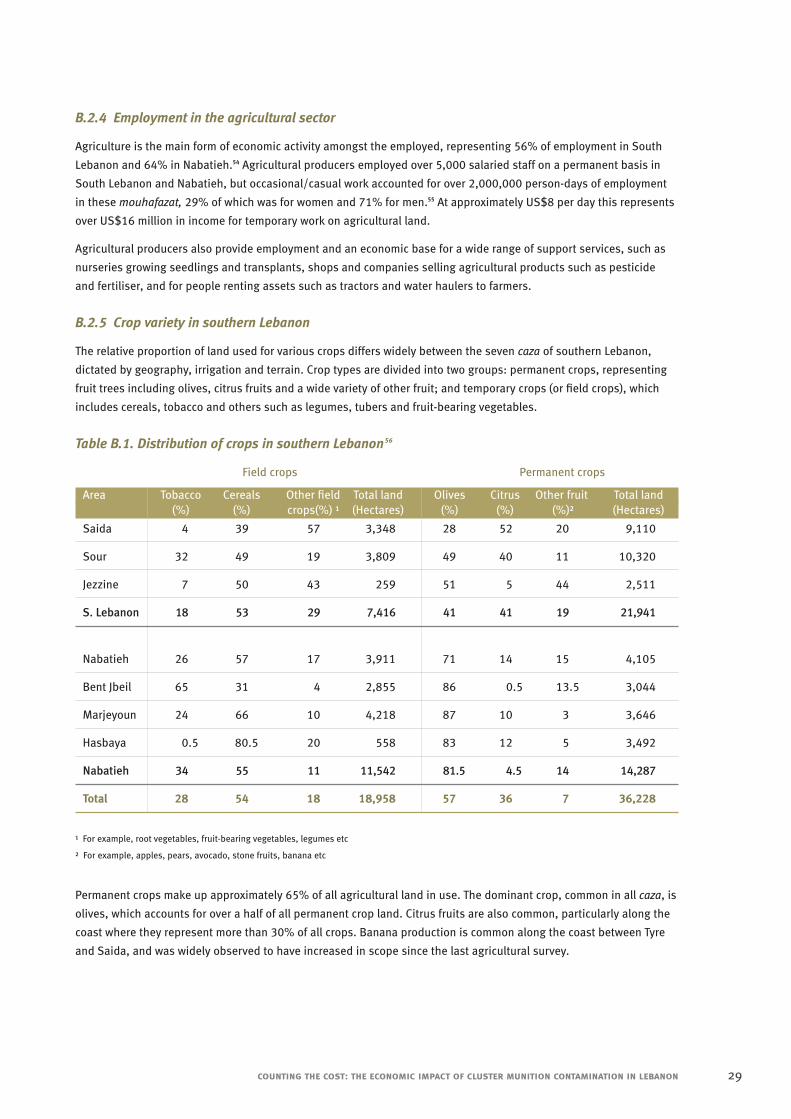
B.2.4 Employment in the agricultural sector
Agriculture is the main form of economic activity amongst the employed, representing 56% of employment in South
Lebanon and 64% in Nabatieh.54 Agricultural producers employed over 5,000 salaried staff on a permanent basis in
South Lebanon and Nabatieh, but occasional/casual work accounted for over 2,000,000 person-days of employment
in these mouhafazat, 29% of which was for women and 71% for men.55 At approximately US$8 per day this represents
over US$16 million in income for temporary work on agricultural land.
Agricultural producers also provide employment and an economic base for a wide range of support services, such as
nurseries growing seedlings and transplants, shops and companies selling agricultural products such as pesticide
and fertiliser, and for people renting assets such as tractors and water haulers to farmers.
B.2.5 Crop variety in southern Lebanon
The relative proportion of land used for various crops differs widely between the seven caza of southern Lebanon,
dictated by geography, irrigation and terrain. Crop types are divided into two groups: permanent crops, representing
fruit trees including olives, citrus fruits and a wide variety of other fruit; and temporary crops (or field crops), which
includes cereals, tobacco and others such as legumes, tubers and fruit-bearing vegetables.
Table B.1. Distribution of crops in southern Lebanon56
Field crops Permanent crops
Area Tobacco Cereals Other field Total land Olives Citrus Other fruit Total land(%) (%) crops(%) ¹ (Hectares) (%) (%) (%)² (Hectares)
Saida 4 39 57 3,348 28 52 20 9,110
Sour 32 49 19 3,809 49 40 11 10,320
Jezzine 7 50 43 259 51 5 44 2,511
S. Lebanon 18 53 29 7,416 41 41 19 21,941
Nabatieh 26 57 17 3,911 71 14 15 4,105
Bent Jbeil 65 31 4 2,855 86 0.5 13.5 3,044
Marjeyoun 24 66 10 4,218 87 10 3 3,646
Hasbaya 0.5 80.5 20 558 83 12 5 3,492
Nabatieh 34 55 11 11,542 81.5 4.5 14 14,287
Total 28 54 18 18,958 57 36 7 36,228
¹ For example, root vegetables, fruit-bearing vegetables, legumes etc
² For example, apples, pears, avocado, stone fruits, banana etc
Permanent crops make up approximately 65% of all agricultural land in use. The dominant crop, common in all caza, is
olives, which accounts for over a half of all permanent crop land. Citrus fruits are also common, particularly along the
coast where they represent more than 30% of all crops. Banana production is common along the coast between Tyre
and Saida, and was widely observed to have increased in scope since the last agricultural survey.
counting the cost: the economic impact of cluster munition contamination in lebanon 29
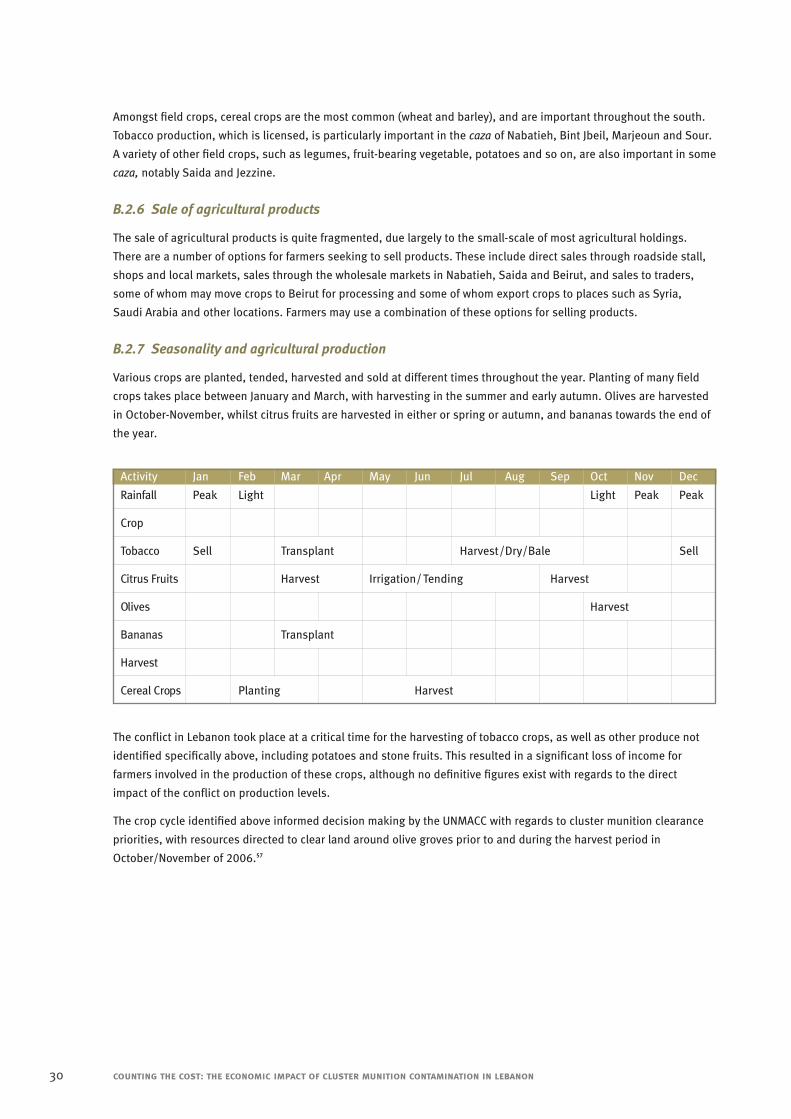
Amongst field crops, cereal crops are the most common (wheat and barley), and are important throughout the south.
Tobacco production, which is licensed, is particularly important in the caza of Nabatieh, Bint Jbeil, Marjeoun and Sour.
A variety of other field crops, such as legumes, fruit-bearing vegetable, potatoes and so on, are also important in some
caza, notably Saida and Jezzine.
B.2.6 Sale of agricultural products
The sale of agricultural products is quite fragmented, due largely to the small-scale of most agricultural holdings.
There are a number of options for farmers seeking to sell products. These include direct sales through roadside stall,
shops and local markets, sales through the wholesale markets in Nabatieh, Saida and Beirut, and sales to traders,
some of whom may move crops to Beirut for processing and some of whom export crops to places such as Syria,
Saudi Arabia and other locations. Farmers may use a combination of these options for selling products.
B.2.7 Seasonality and agricultural production
Various crops are planted, tended, harvested and sold at different times throughout the year. Planting of many field
crops takes place between January and March, with harvesting in the summer and early autumn. Olives are harvested
in October-November, whilst citrus fruits are harvested in either or spring or autumn, and bananas towards the end of
the year.
Activity Jan Feb Mar Apr May Jun Jul Aug Sep Oct Nov Dec
Rainfall Peak Light Light Peak Peak
Crop
Tobacco Sell Transplant Harvest/ Dry/ Bale Sell
Citrus Fruits Harvest Irrigation/ Tending Harvest
Olives Harvest
Bananas Transplant
Harvest
Cereal Crops Planting Harvest
The conflict in Lebanon took place at a critical time for the harvesting of tobacco crops, as well as other produce not
identified specifically above, including potatoes and stone fruits. This resulted in a significant loss of income for
farmers involved in the production of these crops, although no definitive figures exist with regards to the direct
impact of the conflict on production levels.
The crop cycle identified above informed decision making by the UNMACC with regards to cluster munition clearance
priorities, with resources directed to clear land around olive groves prior to and during the harvest period in
October/November of 2006.57
30 counting the cost: the economic impact of cluster munition contamination in lebanon
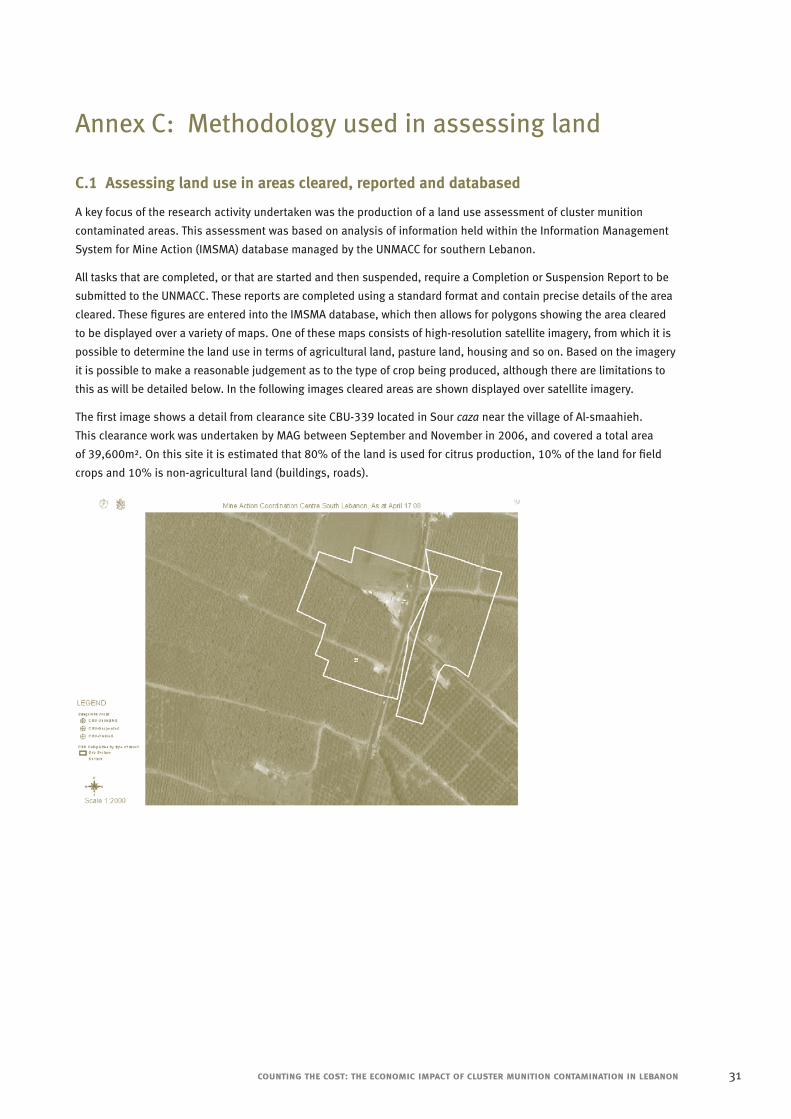
Annex C: Methodology used in assessing land use
C.1 Assessing land use in areas cleared, reported and databased
A key focus of the research activity undertaken was the production of a land use assessment of cluster munition
contaminated areas. This assessment was based on analysis of information held within the Information Management
System for Mine Action (IMSMA) database managed by the UNMACC for southern Lebanon.
All tasks that are completed, or that are started and then suspended, require a Completion or Suspension Report to be
submitted to the UNMACC. These reports are completed using a standard format and contain precise details of the area
cleared. These figures are entered into the IMSMA database, which then allows for polygons showing the area cleared
to be displayed over a variety of maps. One of these maps consists of high-resolution satellite imagery, from which it is
possible to determine the land use in terms of agricultural land, pasture land, housing and so on. Based on the imagery
it is possible to make a reasonable judgement as to the type of crop being produced, although there are limitations to
this as will be detailed below. In the following images cleared areas are shown displayed over satellite imagery.
The first image shows a detail from clearance site CBU-339 located in Sour caza near the village of Al-smaahieh.
This clearance work was undertaken by MAG between September and November in 2006, and covered a total area
of 39,600m². On this site it is estimated that 80% of the land is used for citrus production, 10% of the land for field
crops and 10% is non-agricultural land (buildings, roads).
counting the cost: the economic impact of cluster munition contamination in lebanon 31
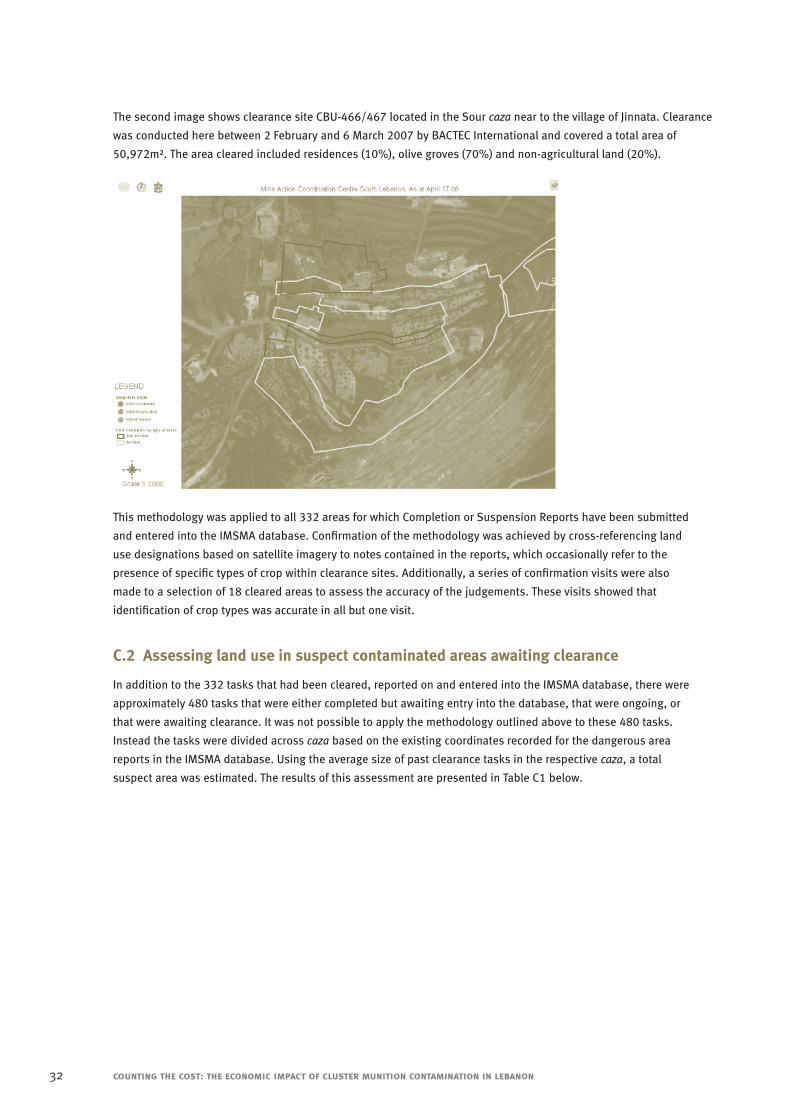
The second image shows clearance site CBU-466/467 located in the Sour caza near to the village of Jinnata. Clearance
was conducted here between 2 February and 6 March 2007 by BACTEC International and covered a total area of
50,972m². The area cleared included residences (10%), olive groves (70%) and non-agricultural land (20%).
This methodology was applied to all 332 areas for which Completion or Suspension Reports have been submitted
and entered into the IMSMA database. Confirmation of the methodology was achieved by cross-referencing land
use designations based on satellite imagery to notes contained in the reports, which occasionally refer to the
presence of specific types of crop within clearance sites. Additionally, a series of confirmation visits were also
made to a selection of 18 cleared areas to assess the accuracy of the judgements. These visits showed that
identification of crop types was accurate in all but one visit.
C.2 Assessing land use in suspect contaminated areas awaiting clearance
In addition to the 332 tasks that had been cleared, reported on and entered into the IMSMA database, there were
approximately 480 tasks that were either completed but awaiting entry into the database, that were ongoing, or
that were awaiting clearance. It was not possible to apply the methodology outlined above to these 480 tasks.
Instead the tasks were divided across caza based on the existing coordinates recorded for the dangerous area
reports in the IMSMA database. Using the average size of past clearance tasks in the respective caza, a total
suspect area was estimated. The results of this assessment are presented in Table C1 below.
32 counting the cost: the economic impact of cluster munition contamination in lebanon
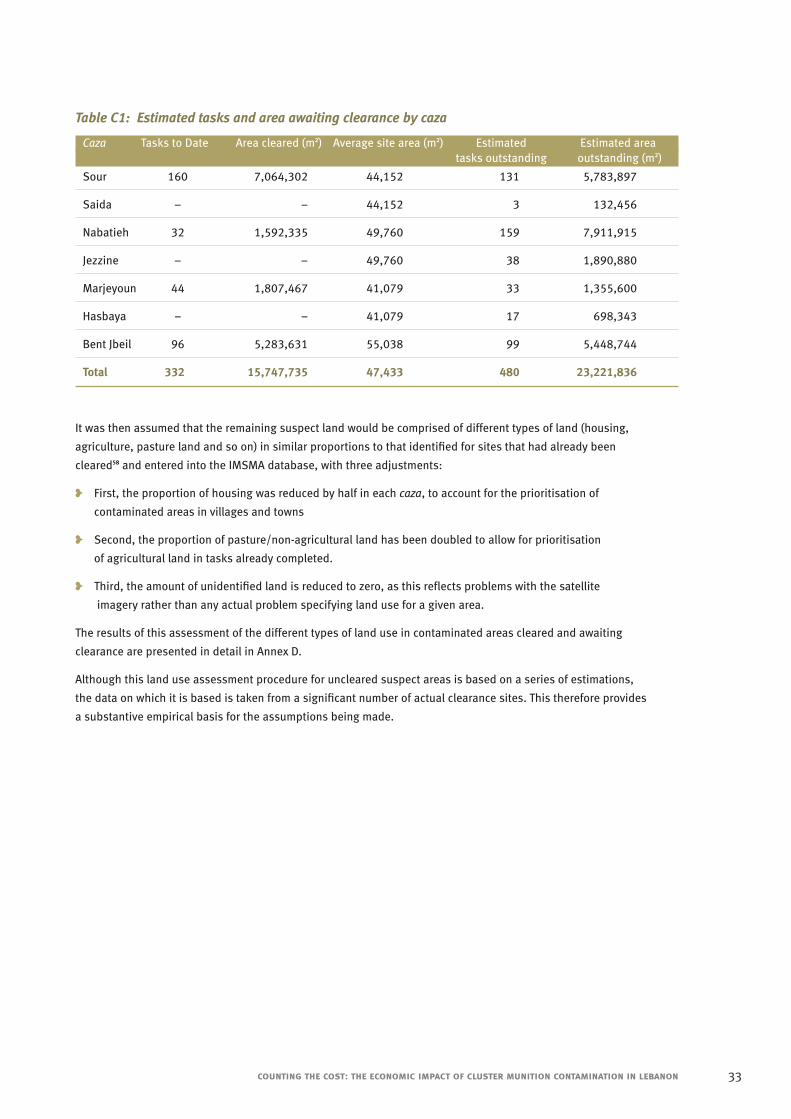
Table C1: Estimated tasks and area awaiting clearance by caza
Caza Tasks to Date Area cleared (m2) Average site area (m2) Estimated Estimated areatasks outstanding outstanding (m2)
Sour 160 7,064,302 44,152 131 5,783,897
Saida – – 44,152 3 132,456
Nabatieh 32 1,592,335 49,760 159 7,911,915
Jezzine – – 49,760 38 1,890,880
Marjeyoun 44 1,807,467 41,079 33 1,355,600
Hasbaya – – 41,079 17 698,343
Bent Jbeil 96 5,283,631 55,038 99 5,448,744
Total 332 15,747,735 47,433 480 23,221,836
It was then assumed that the remaining suspect land would be comprised of different types of land (housing,
agriculture, pasture land and so on) in similar proportions to that identified for sites that had already been
cleared58 and entered into the IMSMA database, with three adjustments:
❥ First, the proportion of housing was reduced by half in each caza, to account for the prioritisation of
contaminated areas in villages and towns
❥ Second, the proportion of pasture/non-agricultural land has been doubled to allow for prioritisation
of agricultural land in tasks already completed.
❥ Third, the amount of unidentified land is reduced to zero, as this reflects problems with the satellite
imagery rather than any actual problem specifying land use for a given area.
The results of this assessment of the different types of land use in contaminated areas cleared and awaiting
clearance are presented in detail in Annex D.
Although this land use assessment procedure for uncleared suspect areas is based on a series of estimations,
the data on which it is based is taken from a significant number of actual clearance sites. This therefore provides
a substantive empirical basis for the assumptions being made.
counting the cost: the economic impact of cluster munition contamination in lebanon 33
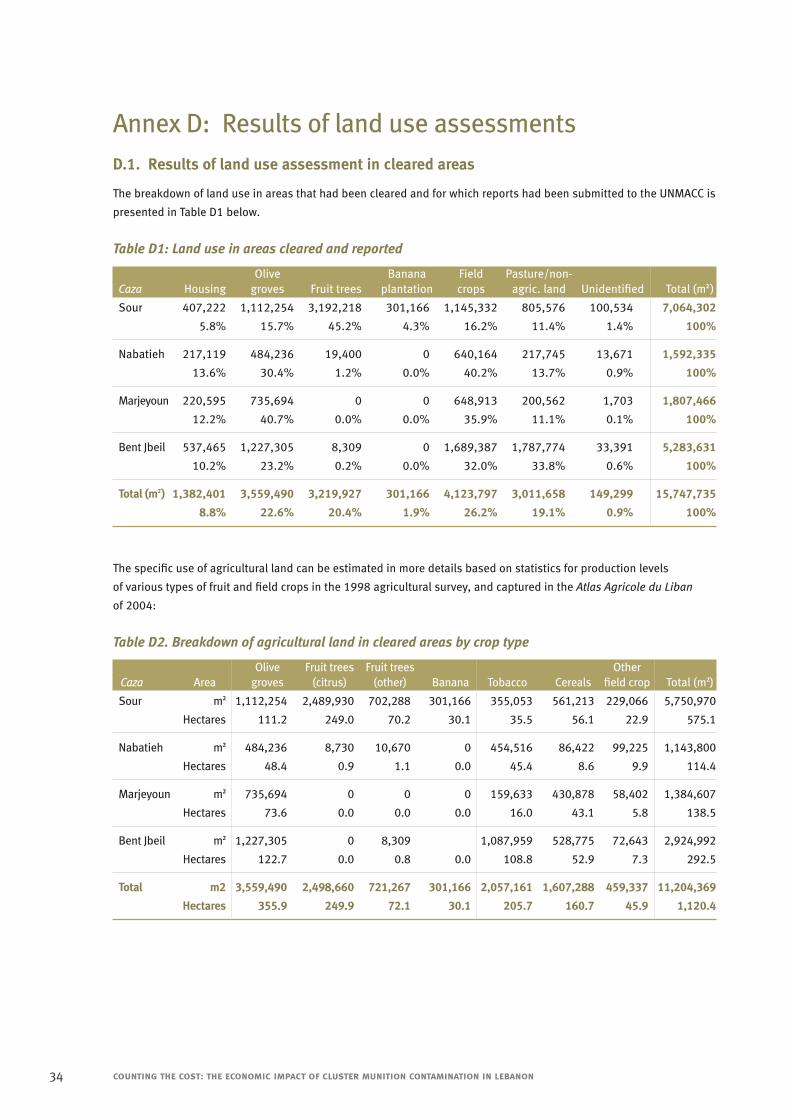
Annex D: Results of land use assessmentsD.1. Results of land use assessment in cleared areas
The breakdown of land use in areas that had been cleared and for which reports had been submitted to the UNMACC is
presented in Table D1 below.
Table D1: Land use in areas cleared and reported
Olive Banana Field Pasture/non-Caza Housing groves Fruit trees plantation crops agric. land Unidentified Total (m2)
Sour 407,222 1,112,254 3,192,218 301,166 1,145,332 805,576 100,534 7,064,302
5.8% 15.7% 45.2% 4.3% 16.2% 11.4% 1.4% 100%
Nabatieh 217,119 484,236 19,400 0 640,164 217,745 13,671 1,592,335
13.6% 30.4% 1.2% 0.0% 40.2% 13.7% 0.9% 100%
Marjeyoun 220,595 735,694 0 0 648,913 200,562 1,703 1,807,466
12.2% 40.7% 0.0% 0.0% 35.9% 11.1% 0.1% 100%
Bent Jbeil 537,465 1,227,305 8,309 0 1,689,387 1,787,774 33,391 5,283,631
10.2% 23.2% 0.2% 0.0% 32.0% 33.8% 0.6% 100%
Total (m2) 1,382,401 3,559,490 3,219,927 301,166 4,123,797 3,011,658 149,299 15,747,735
8.8% 22.6% 20.4% 1.9% 26.2% 19.1% 0.9% 100%
The specific use of agricultural land can be estimated in more details based on statistics for production levels
of various types of fruit and field crops in the 1998 agricultural survey, and captured in the Atlas Agricole du Liban
of 2004:
Table D2. Breakdown of agricultural land in cleared areas by crop type
Olive Fruit trees Fruit trees Other Caza Area groves (citrus) (other) Banana Tobacco Cereals field crop Total (m2)
Sour m2 1,112,254 2,489,930 702,288 301,166 355,053 561,213 229,066 5,750,970
Hectares 111.2 249.0 70.2 30.1 35.5 56.1 22.9 575.1
Nabatieh m2 484,236 8,730 10,670 0 454,516 86,422 99,225 1,143,800
Hectares 48.4 0.9 1.1 0.0 45.4 8.6 9.9 114.4
Marjeyoun m2 735,694 0 0 0 159,633 430,878 58,402 1,384,607
Hectares 73.6 0.0 0.0 0.0 16.0 43.1 5.8 138.5
Bent Jbeil m2 1,227,305 0 8,309 1,087,959 528,775 72,643 2,924,992
Hectares 122.7 0.0 0.8 0.0 108.8 52.9 7.3 292.5
Total m2 3,559,490 2,498,660 721,267 301,166 2,057,161 1,607,288 459,337 11,204,369
Hectares 355.9 249.9 72.1 30.1 205.7 160.7 45.9 1,120.4
34 counting the cost: the economic impact of cluster munition contamination in lebanon
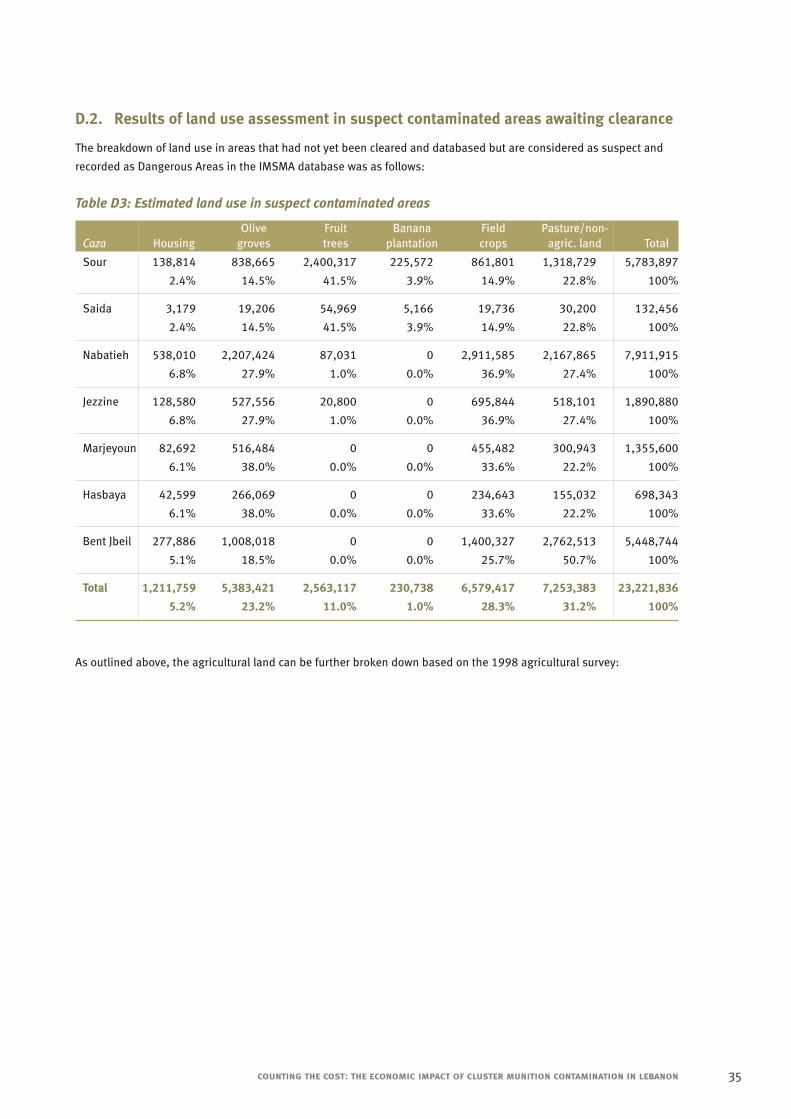
D.2. Results of land use assessment in suspect contaminated areas awaiting clearance
The breakdown of land use in areas that had not yet been cleared and databased but are considered as suspect and
recorded as Dangerous Areas in the IMSMA database was as follows:
Table D3: Estimated land use in suspect contaminated areas
Olive Fruit Banana Field Pasture/non-Caza Housing groves trees plantation crops agric. land Total
Sour 138,814 838,665 2,400,317 225,572 861,801 1,318,729 5,783,897
2.4% 14.5% 41.5% 3.9% 14.9% 22.8% 100%
Saida 3,179 19,206 54,969 5,166 19,736 30,200 132,456
2.4% 14.5% 41.5% 3.9% 14.9% 22.8% 100%
Nabatieh 538,010 2,207,424 87,031 0 2,911,585 2,167,865 7,911,915
6.8% 27.9% 1.0% 0.0% 36.9% 27.4% 100%
Jezzine 128,580 527,556 20,800 0 695,844 518,101 1,890,880
6.8% 27.9% 1.0% 0.0% 36.9% 27.4% 100%
Marjeyoun 82,692 516,484 0 0 455,482 300,943 1,355,600
6.1% 38.0% 0.0% 0.0% 33.6% 22.2% 100%
Hasbaya 42,599 266,069 0 0 234,643 155,032 698,343
6.1% 38.0% 0.0% 0.0% 33.6% 22.2% 100%
Bent Jbeil 277,886 1,008,018 0 0 1,400,327 2,762,513 5,448,744
5.1% 18.5% 0.0% 0.0% 25.7% 50.7% 100%
Total 1,211,759 5,383,421 2,563,117 230,738 6,579,417 7,253,383 23,221,836
5.2% 23.2% 11.0% 1.0% 28.3% 31.2% 100%
As outlined above, the agricultural land can be further broken down based on the 1998 agricultural survey:
counting the cost: the economic impact of cluster munition contamination in lebanon 35
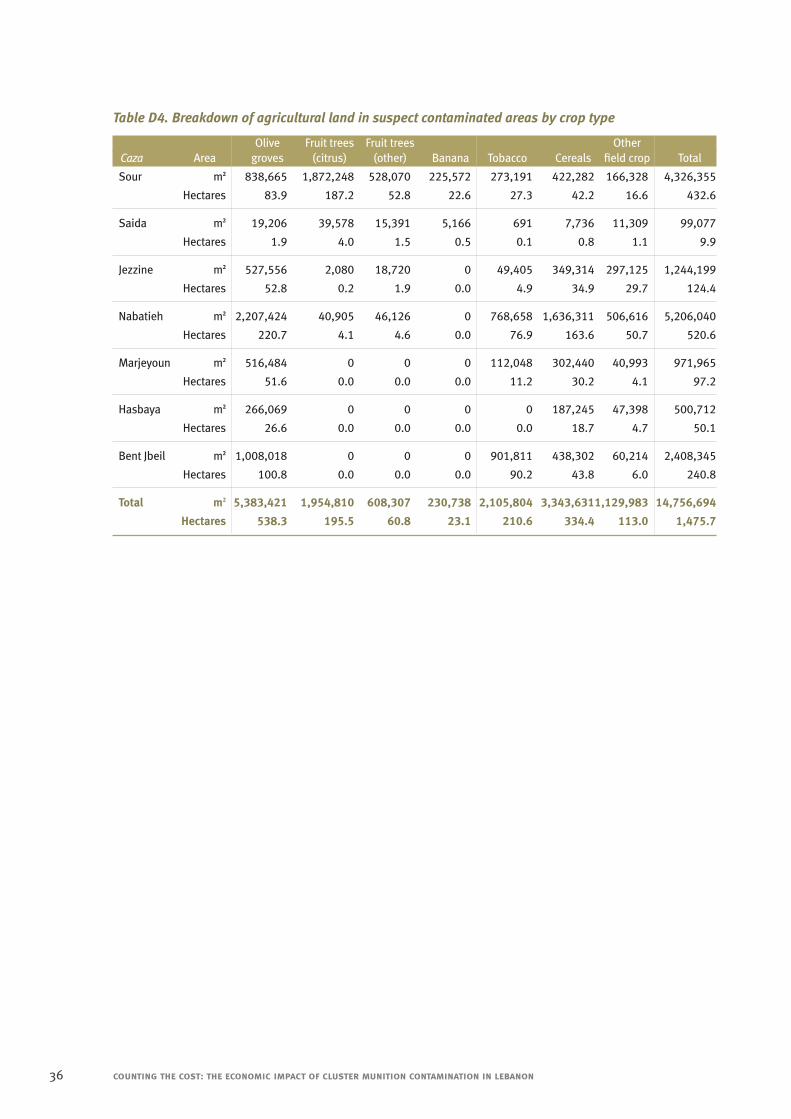
Table D4. Breakdown of agricultural land in suspect contaminated areas by crop type
Olive Fruit trees Fruit trees Other Caza Area groves (citrus) (other) Banana Tobacco Cereals field crop Total
Sour m2 838,665 1,872,248 528,070 225,572 273,191 422,282 166,328 4,326,355
Hectares 83.9 187.2 52.8 22.6 27.3 42.2 16.6 432.6
Saida m2 19,206 39,578 15,391 5,166 691 7,736 11,309 99,077
Hectares 1.9 4.0 1.5 0.5 0.1 0.8 1.1 9.9
Jezzine m2 527,556 2,080 18,720 0 49,405 349,314 297,125 1,244,199
Hectares 52.8 0.2 1.9 0.0 4.9 34.9 29.7 124.4
Nabatieh m2 2,207,424 40,905 46,126 0 768,658 1,636,311 506,616 5,206,040
Hectares 220.7 4.1 4.6 0.0 76.9 163.6 50.7 520.6
Marjeyoun m2 516,484 0 0 0 112,048 302,440 40,993 971,965
Hectares 51.6 0.0 0.0 0.0 11.2 30.2 4.1 97.2
Hasbaya m2 266,069 0 0 0 0 187,245 47,398 500,712
Hectares 26.6 0.0 0.0 0.0 0.0 18.7 4.7 50.1
Bent Jbeil m2 1,008,018 0 0 0 901,811 438,302 60,214 2,408,345
Hectares 100.8 0.0 0.0 0.0 90.2 43.8 6.0 240.8
Total m2 5,383,421 1,954,810 608,307 230,738 2,105,804 3,343,6311,129,983 14,756,694
Hectares 538.3 195.5 60.8 23.1 210.6 334.4 113.0 1,475.7
36 counting the cost: the economic impact of cluster munition contamination in lebanon
Annex E: The relationship between land contaminationand land denial
E.1 Sources of information regarding land use
A number of sources have been identified in an effort to try and quantify the level of land use in cluster munition
contaminated areas since August 2006. These are as follows:
a. UNMACC Post-Clearance Assessments
b. MAG Community Liaison Data
c. Direct Field Research
d. Analysis of Suspension/Completion Reports
e. Mine Action Operators
The information gathered from each of these sources, and the key observations and findings with regard to use of
contaminated land, are presented below.
■ UNMACC Post-Clearance Assessment: The UN coordination centre in southern Lebanon has recently commenced
a project to assess the impact of cluster munition clearance activities. This has followed on from previous efforts to
assess the impact of minefield clearance, and has adapted some of the same forms and methodology for conducting
the assessment. By using a combination of village data and information regarding individual cleared areas, the
assessment identifies issues such as key local development needs, confidence in the use of cleared land, change
in the use of land from before and after clearance, and any reasons that people are choosing not to use cleared land.
The assessment also attempts to determine if land was being used prior to clearance taking place.
■ As of March 2008, the assessment process had interviewed 20 landowners whose land had been subject to
clearance activities. Of those, only 2 had been using contaminated land prior to clearance taking place. It should
be noted that the land belonging to these landowners had been cleared shortly after the end of hostilities.
■ MAG Community Liaison Data: MAG is an international mine action agency and has been working in southern
Lebanon since 2002. A key part of MAG’s work is the assessment of contaminated areas prior to clearance by
community liaison teams in order to prioritise according to needs.
■ The MAG CL teams provided detailed information on two contaminated villages in Nabatieh (Zawtar West and
Adhseet). Both of these locations had multiple cluster munition strikes, with 43 identified contaminated areas
in total. Of these, only 11 have been cleared as of March 2008. Figures from MAG village assessments indicate
the following with regards to 32 sites that have not yet been cleared:
❥ In 16 of the suspect contaminated areas, only a small proportion of the area is being used. This
almost certainly reflects local knowledge regarding the actual extent of the contaminated area;
❥ Land use in is above 50% on 9 of the 32 sites, all but one of which are used for a variety of
agricultural activities (tobacco, wheat, olives);
❥ On all 26 sites where there is any land use at all, 17 are used for agriculture, 5 are used
for a combination of agriculture and housing, and 3 are used for housing, and 1 is used
for resource collection.
counting the cost: the economic impact of cluster munition contamination in lebanon 37
These figures indicate that land use in suspect areas is frequently based on a local assessment regarding the
precise area contaminated by submunitions, and is driven by need. Where people are using only a small part
of the land it is often for housing, with the remaining land that would normally be used for agricultural production
remaining untouched. On sites where land is being used for agricultural activities, very few are using a large
percentage of the suspect area, and are therefore almost certainly using a particular area that they have
determined to be free of cluster munitions.
It should be noted that the initial suspect areas are very rough estimation based on the early emergency survey
conducted immediately after the conflict in 2006. More precise boundaries of the suspect area are established
following a comprehensive technical reconnaissance and subsequent development of a clearance plan. This often
relies on information gathered from farmers regarding the locations in which they have seen cluster munitions. In
areas where only part of the land is being used, it suggests very strongly that producers have assessed where they
consider to be safe and have placed only this land in use.
Based on these figures, there are only 8 sites out of 32, or 25%, that show high levels of land use in suspect
areas. It is likely that these producers have decided to taken the decision to use contaminated land and adopted
one or more of the coping strategies identified above to mitigate and manage the risk.
■ Direct Research and Interviews: The third source of information regarding land use in contaminated areas comes
from interviews conducted with agricultural producers during field research conducted in March/April 2008. A
total of 14 farmers whose land was suspected to be contaminated by cluster munitions were interviewed in a
number of contaminated areas in Nabatieh, Sour and Bent Jbeil. Clearance was underway on 3 of these sites
at the time of the interviews. The main findings from these interviews were as follows:
❥ Four producers confirmed that they were using land prior to clearance being conducted;
❥ Two other producers were using part of the land after identifying which areas contained
submunitions and avoiding that part of land. One other had started using land after the LAF
had removed some munitions, despite knowing that there could be more on the site;
❥ The remaining seven farmers were not using the suspect land and were awaiting clearance.
The farmers that had decided not to use land all indicated an alternative source of income, whether it was
remittances from close relatives, the availability of other land that was not contaminated or the ability to engage
in other income generating activities, including working as labourers on other farms.
Although based on a limited sample, this research indicates that land use in known contaminated areas took
place in 28% of cases. These farmers had engaged in a variety of methods to reduce the risk, including payment
of labourers to remove munitions from orange groves and reporting munitions on a case-by-case basis as they
were identified.
■ Analysis of Suspension / Completion Reports: A fourth source of information regarding land use in contaminated
areas is that contained in the Completion Reports used by the UNMACC to collect final data on clearance tasks.
In these reports there are frequent indications as to whether some or all of the land was in use at the time of
clearance, and for what purpose. On many of these tasks the owner indicates a refusal to allow clearance
activities to take place, usually due to the damage that will be sustained to crops that have been planted,
referred to as “disclaimed land”. In this case the owner will be required to sign a formal letter indicating they
accept the risk of submunitions being found in that area. The area is mapped as part of the Completion Report
using GPS and distance and bearing measurements, and entered into the GIS-IMSMA database.
■ Of the 332 clearance sites that have been entered into the database, 5.8% contained areas of “disclaimed
land”. This figure represents the minimum number of sites on which agricultural production was taking place
either prior to or during clearance activities. It is very likely that other producers, particularly those with olive
groves or orchards, would permit clearance as the clearance process would be unlikely to impact on these types
of crops in the same way that it does on field crops such as tobacco or wheat.
38 counting the cost: the economic impact of cluster munition contamination in lebanon
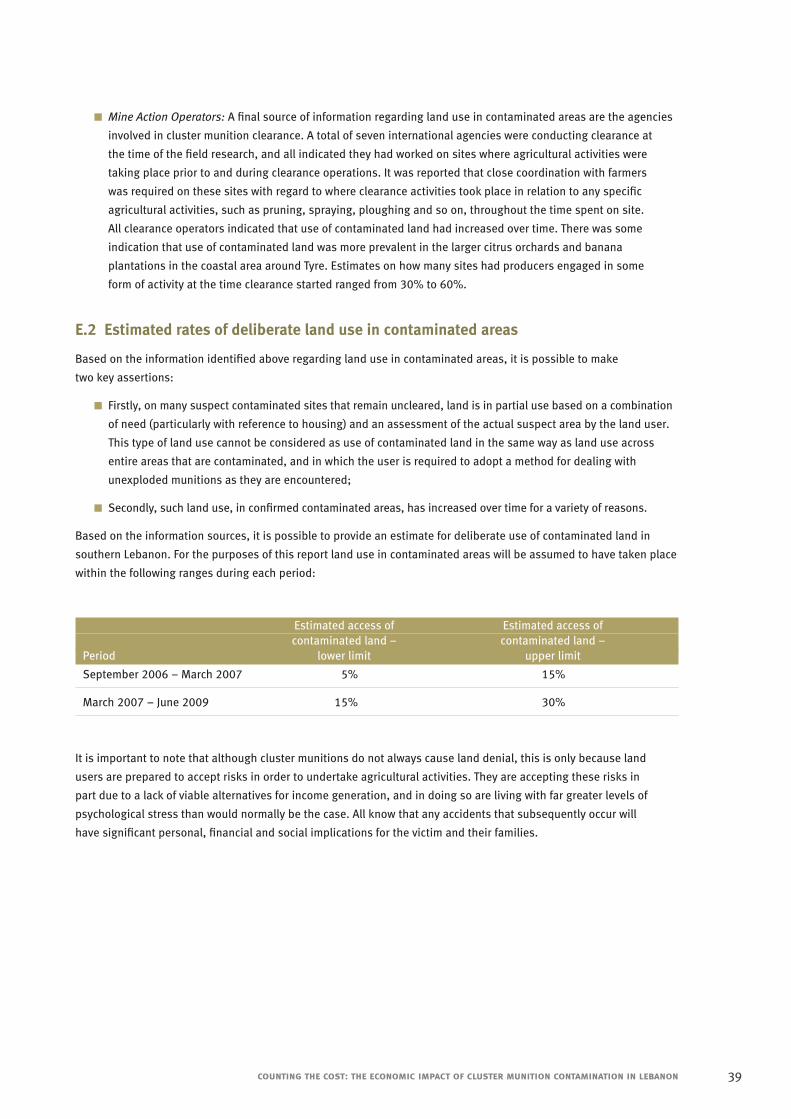
■ Mine Action Operators: A final source of information regarding land use in contaminated areas are the agencies
involved in cluster munition clearance. A total of seven international agencies were conducting clearance at
the time of the field research, and all indicated they had worked on sites where agricultural activities were
taking place prior to and during clearance operations. It was reported that close coordination with farmers
was required on these sites with regard to where clearance activities took place in relation to any specific
agricultural activities, such as pruning, spraying, ploughing and so on, throughout the time spent on site.
All clearance operators indicated that use of contaminated land had increased over time. There was some
indication that use of contaminated land was more prevalent in the larger citrus orchards and banana
plantations in the coastal area around Tyre. Estimates on how many sites had producers engaged in some
form of activity at the time clearance started ranged from 30% to 60%.
E.2 Estimated rates of deliberate land use in contaminated areas
Based on the information identified above regarding land use in contaminated areas, it is possible to make
two key assertions:
■ Firstly, on many suspect contaminated sites that remain uncleared, land is in partial use based on a combination
of need (particularly with reference to housing) and an assessment of the actual suspect area by the land user.
This type of land use cannot be considered as use of contaminated land in the same way as land use across
entire areas that are contaminated, and in which the user is required to adopt a method for dealing with
unexploded munitions as they are encountered;
■ Secondly, such land use, in confirmed contaminated areas, has increased over time for a variety of reasons.
Based on the information sources, it is possible to provide an estimate for deliberate use of contaminated land in
southern Lebanon. For the purposes of this report land use in contaminated areas will be assumed to have taken place
within the following ranges during each period:
Estimated access of Estimated access of contaminated land – contaminated land –
Period lower limit upper limit
September 2006 – March 2007 5% 15%
March 2007 – June 2009 15% 30%
It is important to note that although cluster munitions do not always cause land denial, this is only because land
users are prepared to accept risks in order to undertake agricultural activities. They are accepting these risks in
part due to a lack of viable alternatives for income generation, and in doing so are living with far greater levels of
psychological stress than would normally be the case. All know that any accidents that subsequently occur will
have significant personal, financial and social implications for the victim and their families.
counting the cost: the economic impact of cluster munition contamination in lebanon 39
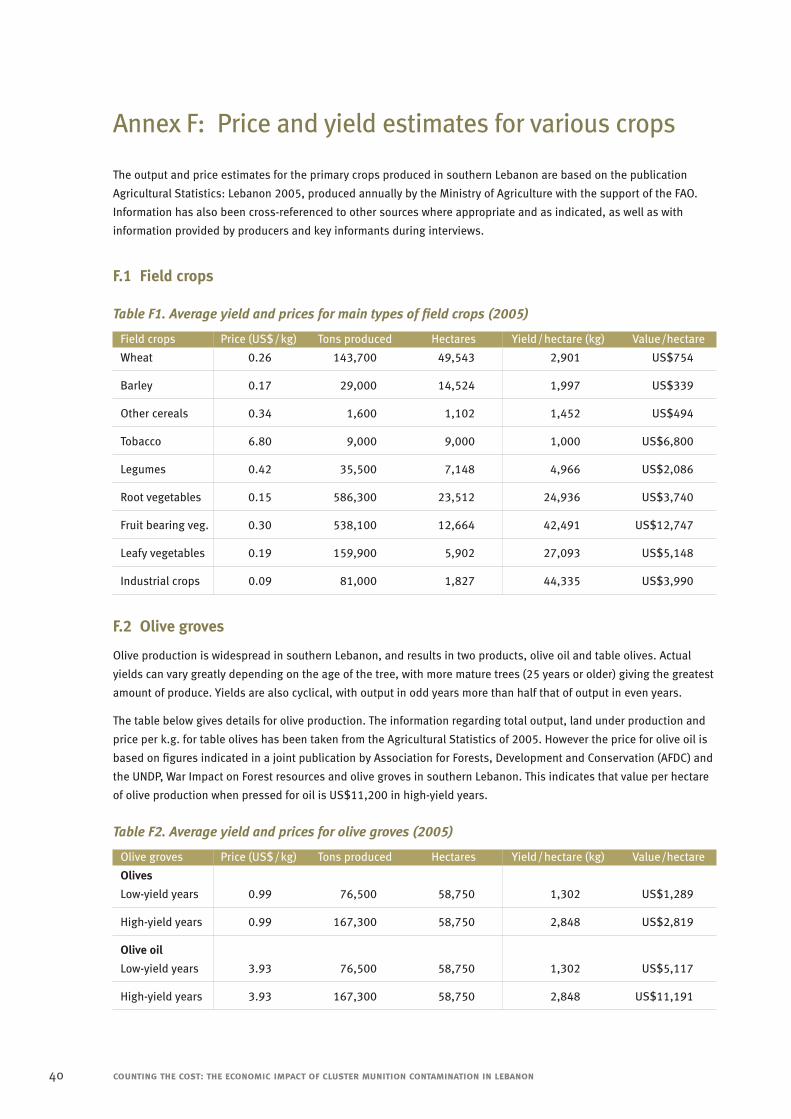
Annex F: Price and yield estimates for various crops
The output and price estimates for the primary crops produced in southern Lebanon are based on the publication
Agricultural Statistics: Lebanon 2005, produced annually by the Ministry of Agriculture with the support of the FAO.
Information has also been cross-referenced to other sources where appropriate and as indicated, as well as with
information provided by producers and key informants during interviews.
F.1 Field crops
Table F1. Average yield and prices for main types of field crops (2005)
Field crops Price (US$/kg) Tons produced Hectares Yield/hectare (kg) Value/hectare
Wheat 0.26 143,700 49,543 2,901 US$754
Barley 0.17 29,000 14,524 1,997 US$339
Other cereals 0.34 1,600 1,102 1,452 US$494
Tobacco 6.80 9,000 9,000 1,000 US$6,800
Legumes 0.42 35,500 7,148 4,966 US$2,086
Root vegetables 0.15 586,300 23,512 24,936 US$3,740
Fruit bearing veg. 0.30 538,100 12,664 42,491 US$12,747
Leafy vegetables 0.19 159,900 5,902 27,093 US$5,148
Industrial crops 0.09 81,000 1,827 44,335 US$3,990
F.2 Olive groves
Olive production is widespread in southern Lebanon, and results in two products, olive oil and table olives. Actual
yields can vary greatly depending on the age of the tree, with more mature trees (25 years or older) giving the greatest
amount of produce. Yields are also cyclical, with output in odd years more than half that of output in even years.
The table below gives details for olive production. The information regarding total output, land under production and
price per k.g. for table olives has been taken from the Agricultural Statistics of 2005. However the price for olive oil is
based on figures indicated in a joint publication by Association for Forests, Development and Conservation (AFDC) and
the UNDP, War Impact on Forest resources and olive groves in southern Lebanon. This indicates that value per hectare
of olive production when pressed for oil is US$11,200 in high-yield years.
Table F2. Average yield and prices for olive groves (2005)
Olive groves Price (US$/kg) Tons produced Hectares Yield/hectare (kg) Value/hectare
Olives
Low-yield years 0.99 76,500 58,750 1,302 US$1,289
High-yield years 0.99 167,300 58,750 2,848 US$2,819
Olive oil
Low-yield years 3.93 76,500 58,750 1,302 US$5,117
High-yield years 3.93 167,300 58,750 2,848 US$11,191
40 counting the cost: the economic impact of cluster munition contamination in lebanon
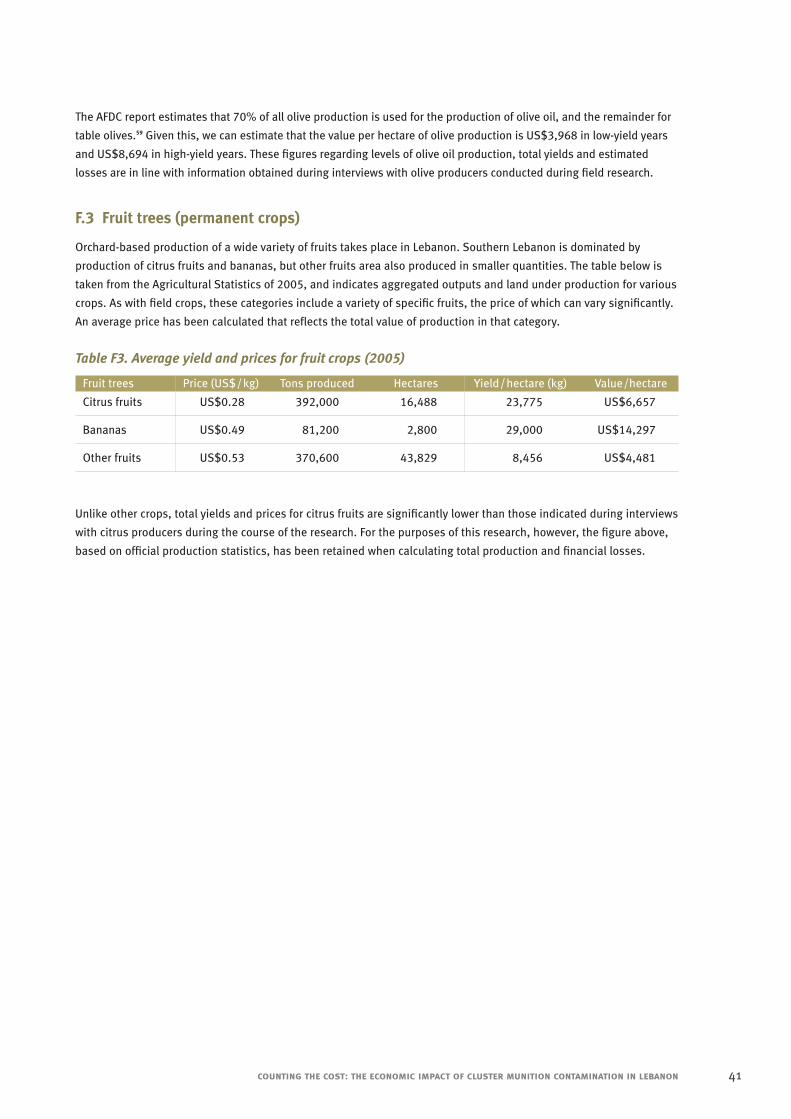
The AFDC report estimates that 70% of all olive production is used for the production of olive oil, and the remainder for
table olives.59 Given this, we can estimate that the value per hectare of olive production is US$3,968 in low-yield years
and US$8,694 in high-yield years. These figures regarding levels of olive oil production, total yields and estimated
losses are in line with information obtained during interviews with olive producers conducted during field research.
F.3 Fruit trees (permanent crops)
Orchard-based production of a wide variety of fruits takes place in Lebanon. Southern Lebanon is dominated by
production of citrus fruits and bananas, but other fruits area also produced in smaller quantities. The table below is
taken from the Agricultural Statistics of 2005, and indicates aggregated outputs and land under production for various
crops. As with field crops, these categories include a variety of specific fruits, the price of which can vary significantly.
An average price has been calculated that reflects the total value of production in that category.
Table F3. Average yield and prices for fruit crops (2005)
Fruit trees Price (US$/kg) Tons produced Hectares Yield/hectare (kg) Value/hectare
Citrus fruits US$0.28 392,000 16,488 23,775 US$6,657
Bananas US$0.49 81,200 2,800 29,000 US$14,297
Other fruits US$0.53 370,600 43,829 8,456 US$4,481
Unlike other crops, total yields and prices for citrus fruits are significantly lower than those indicated during interviews
with citrus producers during the course of the research. For the purposes of this research, however, the figure above,
based on official production statistics, has been retained when calculating total production and financial losses.
counting the cost: the economic impact of cluster munition contamination in lebanon 41
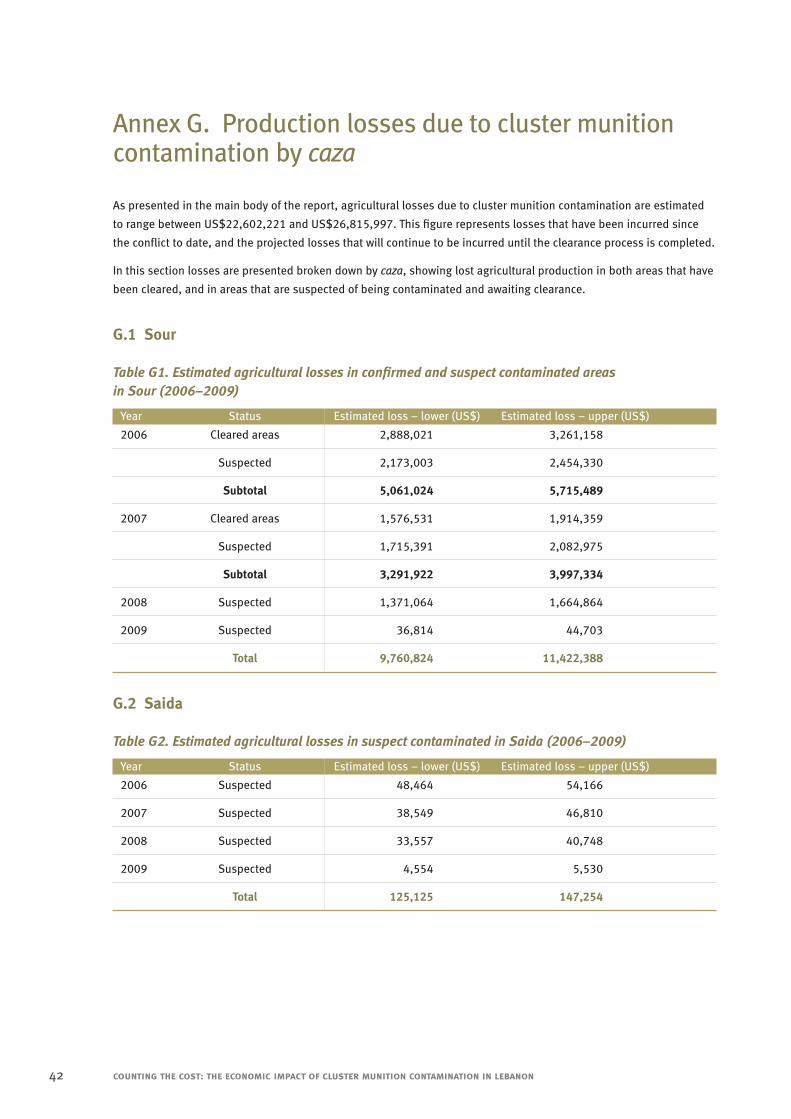
Annex G. Production losses due to cluster munitioncontamination by caza
As presented in the main body of the report, agricultural losses due to cluster munition contamination are estimated
to range between US$22,602,221 and US$26,815,997. This figure represents losses that have been incurred since
the conflict to date, and the projected losses that will continue to be incurred until the clearance process is completed.
In this section losses are presented broken down by caza, showing lost agricultural production in both areas that have
been cleared, and in areas that are suspected of being contaminated and awaiting clearance.
G.1 Sour
Table G1. Estimated agricultural losses in confirmed and suspect contaminated areas in Sour (2006–2009)
Year Status Estimated loss – lower (US$) Estimated loss – upper (US$)
2006 Cleared areas 2,888,021 3,261,158
Suspected 2,173,003 2,454,330
Subtotal 5,061,024 5,715,489
2007 Cleared areas 1,576,531 1,914,359
Suspected 1,715,391 2,082,975
Subtotal 3,291,922 3,997,334
2008 Suspected 1,371,064 1,664,864
2009 Suspected 36,814 44,703
Total 9,760,824 11,422,388
G.2 Saida
Table G2. Estimated agricultural losses in suspect contaminated in Saida (2006–2009)
Year Status Estimated loss – lower (US$) Estimated loss – upper (US$)
2006 Suspected 48,464 54,166
2007 Suspected 38,549 46,810
2008 Suspected 33,557 40,748
2009 Suspected 4,554 5,530
Total 125,125 147,254
42 counting the cost: the economic impact of cluster munition contamination in lebanon
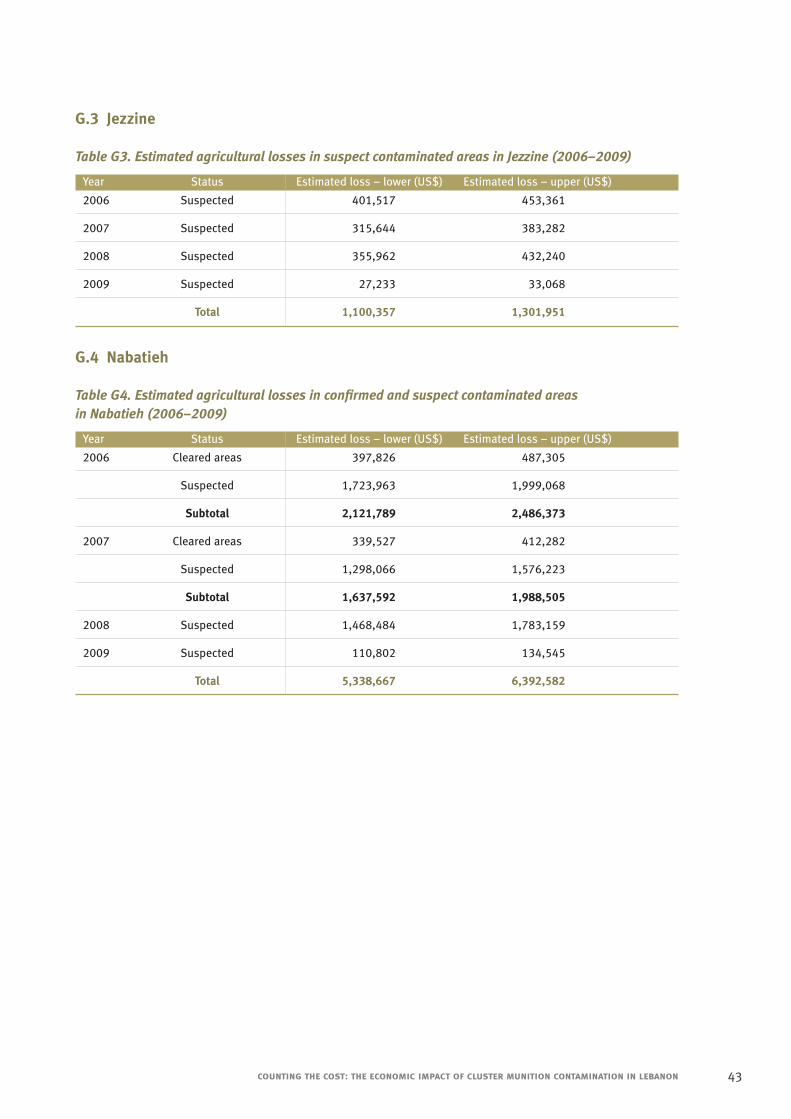
G.3 Jezzine
Table G3. Estimated agricultural losses in suspect contaminated areas in Jezzine (2006–2009)
Year Status Estimated loss – lower (US$) Estimated loss – upper (US$)
2006 Suspected 401,517 453,361
2007 Suspected 315,644 383,282
2008 Suspected 355,962 432,240
2009 Suspected 27,233 33,068
Total 1,100,357 1,301,951
G.4 Nabatieh
Table G4. Estimated agricultural losses in confirmed and suspect contaminated areas in Nabatieh (2006–2009)
Year Status Estimated loss – lower (US$) Estimated loss – upper (US$)
2006 Cleared areas 397,826 487,305
Suspected 1,723,963 1,999,068
Subtotal 2,121,789 2,486,373
2007 Cleared areas 339,527 412,282
Suspected 1,298,066 1,576,223
Subtotal 1,637,592 1,988,505
2008 Suspected 1,468,484 1,783,159
2009 Suspected 110,802 134,545
Total 5,338,667 6,392,582
counting the cost: the economic impact of cluster munition contamination in lebanon 43
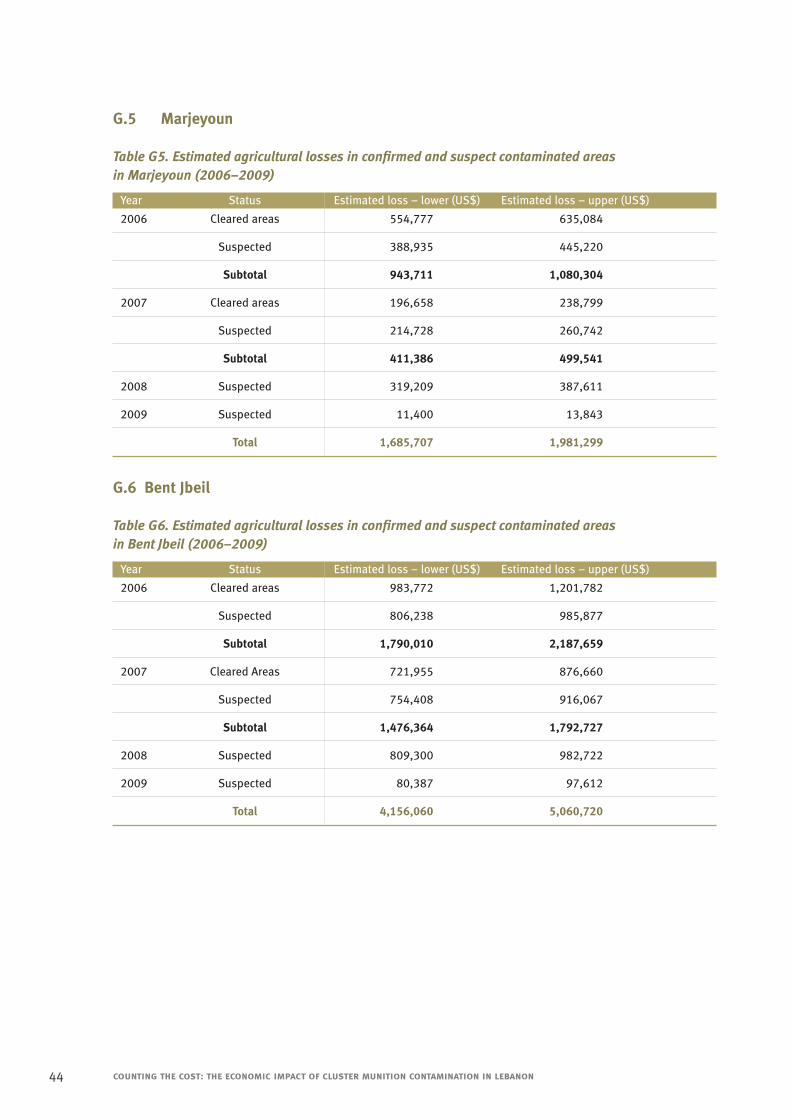
G.5 Marjeyoun
Table G5. Estimated agricultural losses in confirmed and suspect contaminated areas in Marjeyoun (2006–2009)
Year Status Estimated loss – lower (US$) Estimated loss – upper (US$)
2006 Cleared areas 554,777 635,084
Suspected 388,935 445,220
Subtotal 943,711 1,080,304
2007 Cleared areas 196,658 238,799
Suspected 214,728 260,742
Subtotal 411,386 499,541
2008 Suspected 319,209 387,611
2009 Suspected 11,400 13,843
Total 1,685,707 1,981,299
G.6 Bent Jbeil
Table G6. Estimated agricultural losses in confirmed and suspect contaminated areas in Bent Jbeil (2006–2009)
Year Status Estimated loss – lower (US$) Estimated loss – upper (US$)
2006 Cleared areas 983,772 1,201,782
Suspected 806,238 985,877
Subtotal 1,790,010 2,187,659
2007 Cleared Areas 721,955 876,660
Suspected 754,408 916,067
Subtotal 1,476,364 1,792,727
2008 Suspected 809,300 982,722
2009 Suspected 80,387 97,612
Total 4,156,060 5,060,720
44 counting the cost: the economic impact of cluster munition contamination in lebanon
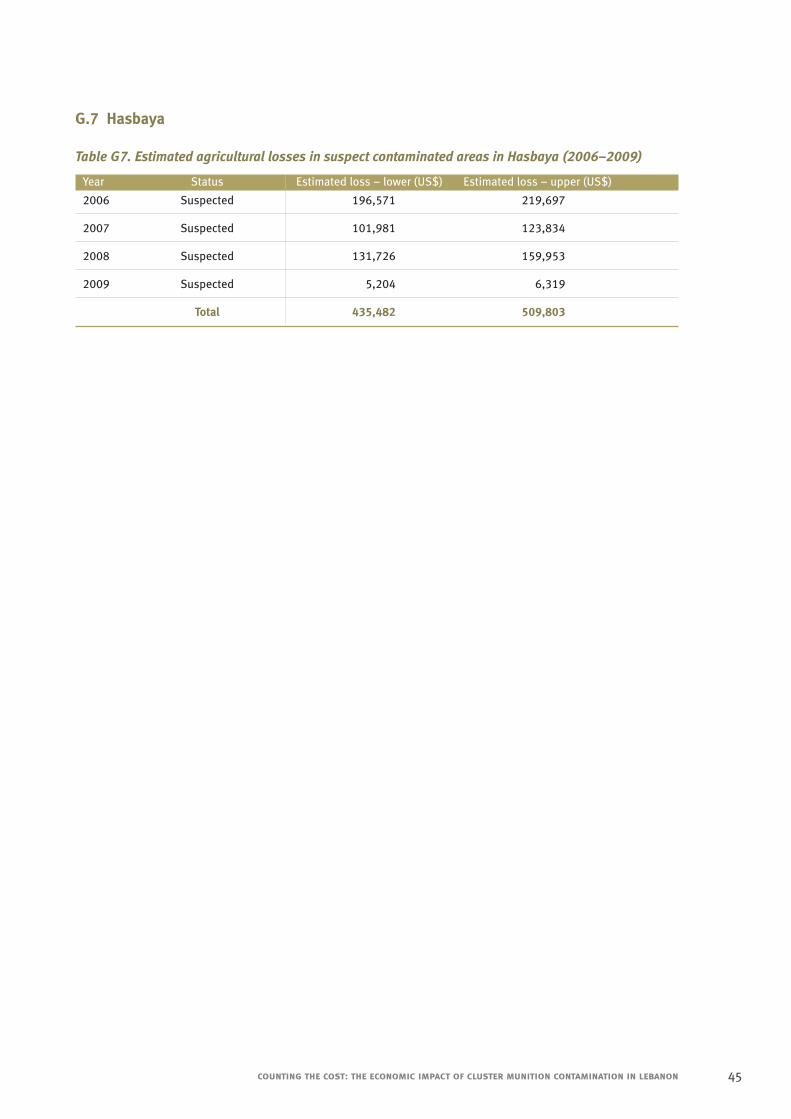
G.7 Hasbaya
Table G7. Estimated agricultural losses in suspect contaminated areas in Hasbaya (2006–2009)
Year Status Estimated loss – lower (US$) Estimated loss – upper (US$)
2006 Suspected 196,571 219,697
2007 Suspected 101,981 123,834
2008 Suspected 131,726 159,953
2009 Suspected 5,204 6,319
Total 435,482 509,803
counting the cost: the economic impact of cluster munition contamination in lebanon 45
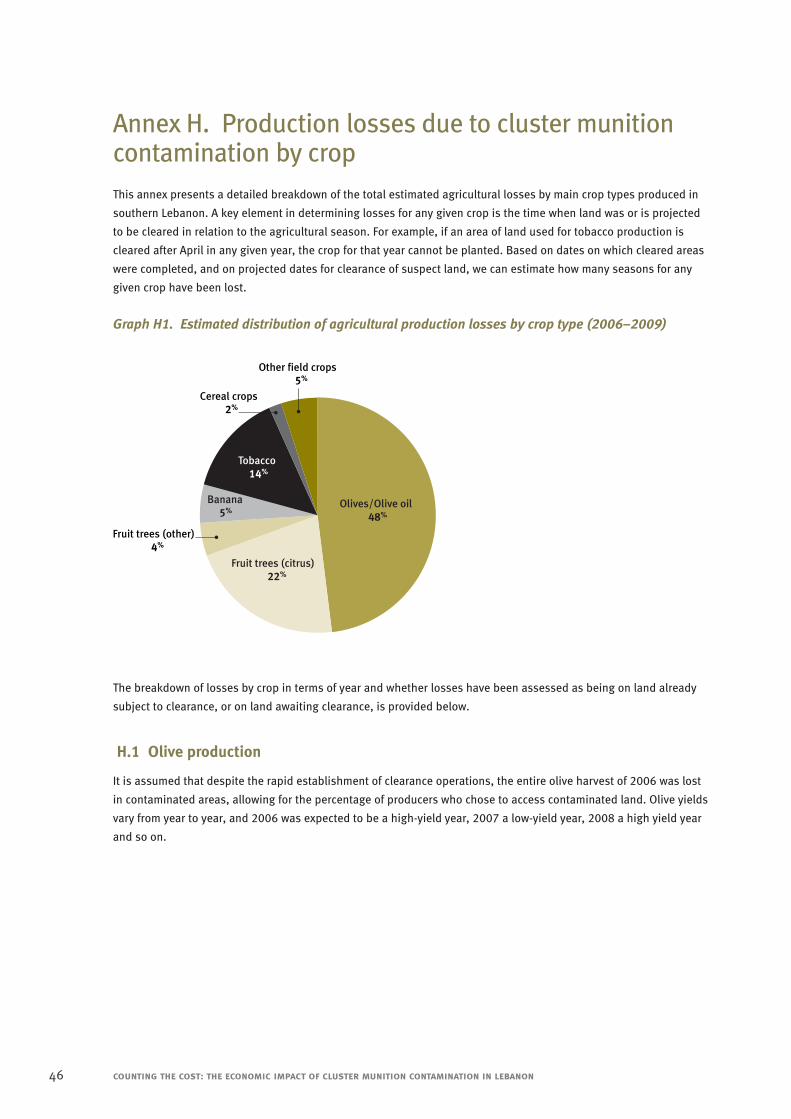
Annex H. Production losses due to cluster munitioncontamination by cropcontamination by cropThis annex presents a detailed breakdown of the total estimated agricultural losses by main crop types produced in
southern Lebanon. A key element in determining losses for any given crop is the time when land was or is projected
to be cleared in relation to the agricultural season. For example, if an area of land used for tobacco production is
cleared after April in any given year, the crop for that year cannot be planted. Based on dates on which cleared areas
were completed, and on projected dates for clearance of suspect land, we can estimate how many seasons for any
given crop have been lost.
Graph H1. Estimated distribution of agricultural production losses by crop type (2006–2009)
The breakdown of losses by crop in terms of year and whether losses have been assessed as being on land already
subject to clearance, or on land awaiting clearance, is provided below.
H.1 Olive production
It is assumed that despite the rapid establishment of clearance operations, the entire olive harvest of 2006 was lost
in contaminated areas, allowing for the percentage of producers who chose to access contaminated land. Olive yields
vary from year to year, and 2006 was expected to be a high-yield year, 2007 a low-yield year, 2008 a high yield year
and so on.
46 counting the cost: the economic impact of cluster munition contamination in lebanon
Olives/Olive oil48%
Fruit trees (citrus)22%
Fruit trees (other)4%
Banana5%
Tobacco14%
Other field crops5%
Cereal crops2%
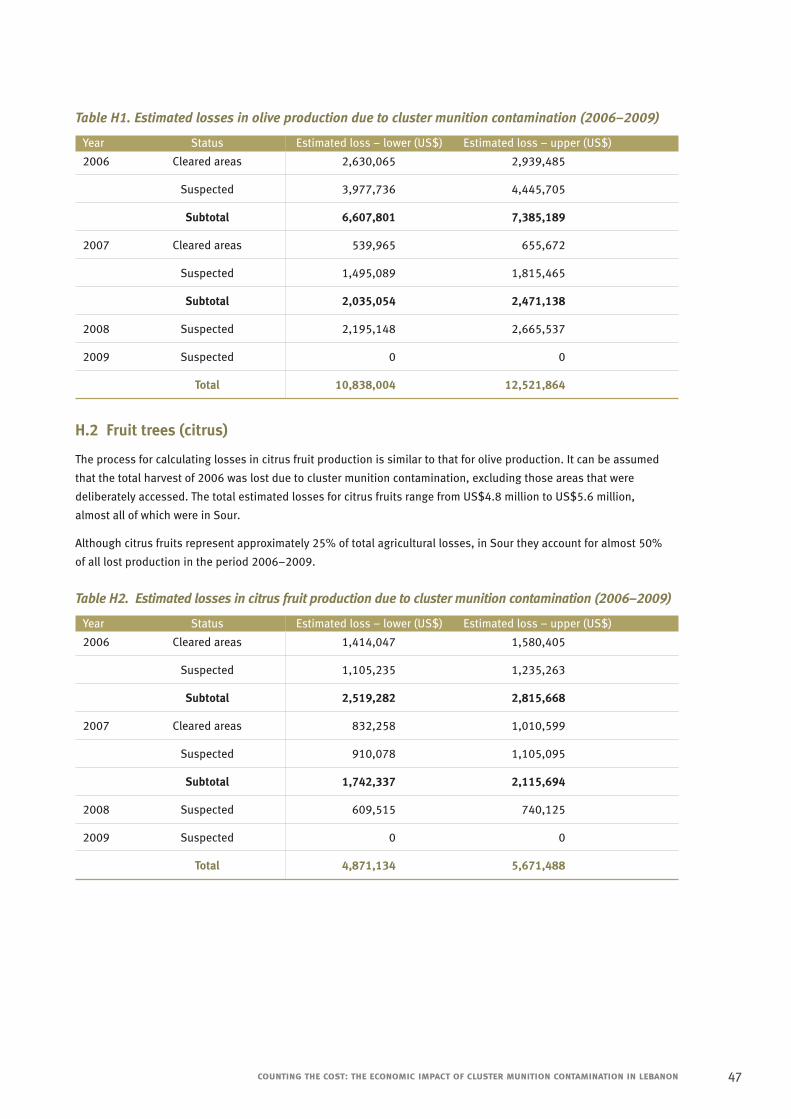
Table H1. Estimated losses in olive production due to cluster munition contamination (2006–2009)
Year Status Estimated loss – lower (US$) Estimated loss – upper (US$)
2006 Cleared areas 2,630,065 2,939,485
Suspected 3,977,736 4,445,705
Subtotal 6,607,801 7,385,189
2007 Cleared areas 539,965 655,672
Suspected 1,495,089 1,815,465
Subtotal 2,035,054 2,471,138
2008 Suspected 2,195,148 2,665,537
2009 Suspected 0 0
Total 10,838,004 12,521,864
H.2 Fruit trees (citrus)
The process for calculating losses in citrus fruit production is similar to that for olive production. It can be assumed
that the total harvest of 2006 was lost due to cluster munition contamination, excluding those areas that were
deliberately accessed. The total estimated losses for citrus fruits range from US$4.8 million to US$5.6 million,
almost all of which were in Sour.
Although citrus fruits represent approximately 25% of total agricultural losses, in Sour they account for almost 50%
of all lost production in the period 2006–2009.
Table H2. Estimated losses in citrus fruit production due to cluster munition contamination (2006–2009)
Year Status Estimated loss – lower (US$) Estimated loss – upper (US$)
2006 Cleared areas 1,414,047 1,580,405
Suspected 1,105,235 1,235,263
Subtotal 2,519,282 2,815,668
2007 Cleared areas 832,258 1,010,599
Suspected 910,078 1,105,095
Subtotal 1,742,337 2,115,694
2008 Suspected 609,515 740,125
2009 Suspected 0 0
Total 4,871,134 5,671,488
counting the cost: the economic impact of cluster munition contamination in lebanon 47
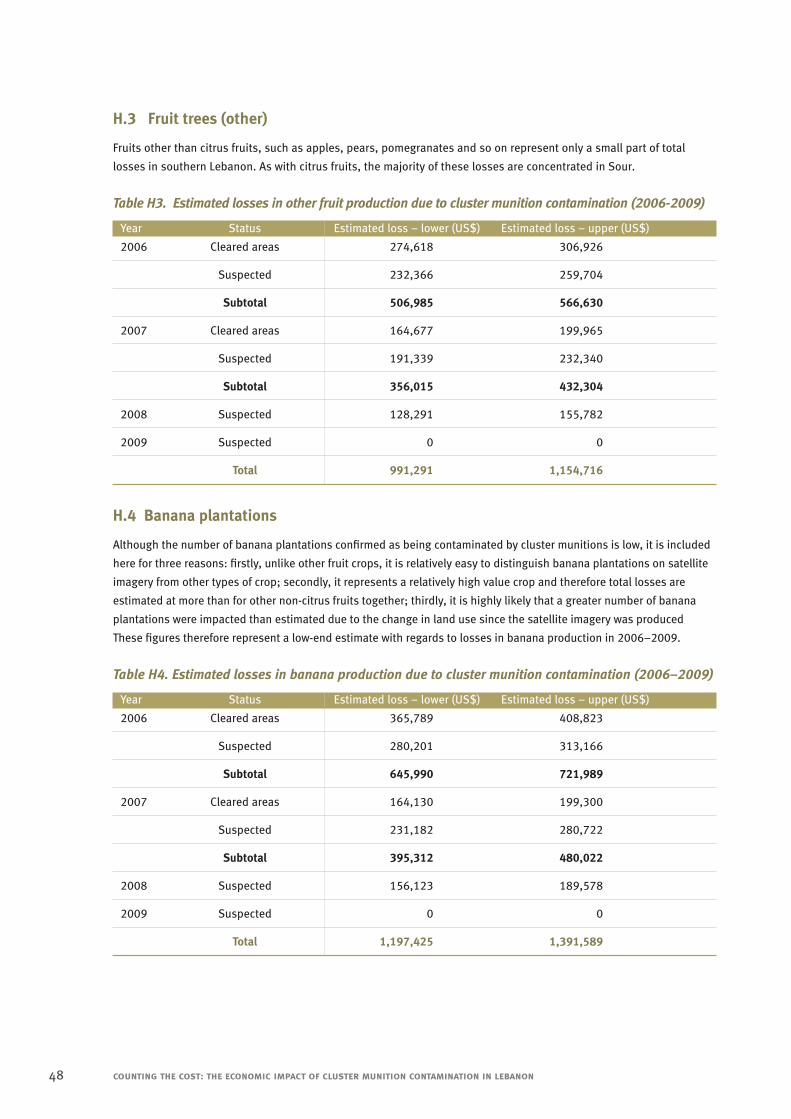
H.3 Fruit trees (other)
Fruits other than citrus fruits, such as apples, pears, pomegranates and so on represent only a small part of total
losses in southern Lebanon. As with citrus fruits, the majority of these losses are concentrated in Sour.
Table H3. Estimated losses in other fruit production due to cluster munition contamination (2006-2009)
Year Status Estimated loss – lower (US$) Estimated loss – upper (US$)
2006 Cleared areas 274,618 306,926
Suspected 232,366 259,704
Subtotal 506,985 566,630
2007 Cleared areas 164,677 199,965
Suspected 191,339 232,340
Subtotal 356,015 432,304
2008 Suspected 128,291 155,782
2009 Suspected 0 0
Total 991,291 1,154,716
H.4 Banana plantations
Although the number of banana plantations confirmed as being contaminated by cluster munitions is low, it is included
here for three reasons: firstly, unlike other fruit crops, it is relatively easy to distinguish banana plantations on satellite
imagery from other types of crop; secondly, it represents a relatively high value crop and therefore total losses are
estimated at more than for other non-citrus fruits together; thirdly, it is highly likely that a greater number of banana
plantations were impacted than estimated due to the change in land use since the satellite imagery was produced
These figures therefore represent a low-end estimate with regards to losses in banana production in 2006–2009.
Table H4. Estimated losses in banana production due to cluster munition contamination (2006–2009)
Year Status Estimated loss – lower (US$) Estimated loss – upper (US$)
2006 Cleared areas 365,789 408,823
Suspected 280,201 313,166
Subtotal 645,990 721,989
2007 Cleared areas 164,130 199,300
Suspected 231,182 280,722
Subtotal 395,312 480,022
2008 Suspected 156,123 189,578
2009 Suspected 0 0
Total 1,197,425 1,391,589
48 counting the cost: the economic impact of cluster munition contamination in lebanon
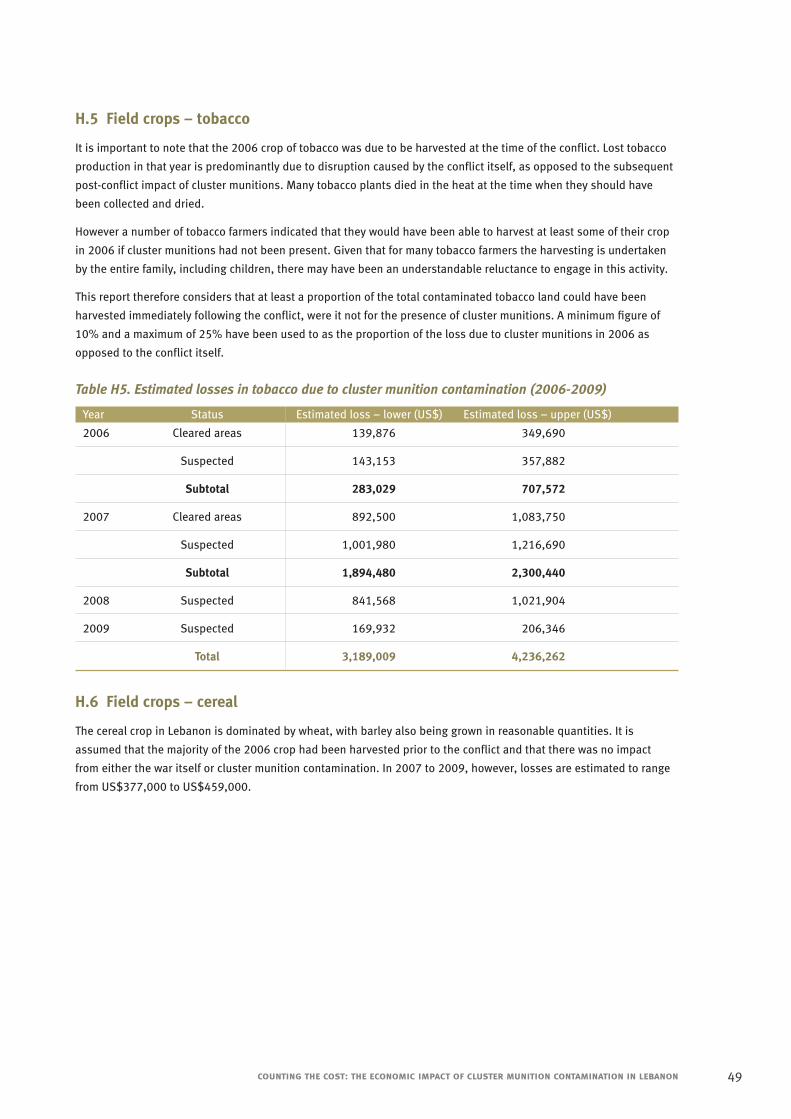
H.5 Field crops – tobacco
It is important to note that the 2006 crop of tobacco was due to be harvested at the time of the conflict. Lost tobacco
production in that year is predominantly due to disruption caused by the conflict itself, as opposed to the subsequent
post-conflict impact of cluster munitions. Many tobacco plants died in the heat at the time when they should have
been collected and dried.
However a number of tobacco farmers indicated that they would have been able to harvest at least some of their crop
in 2006 if cluster munitions had not been present. Given that for many tobacco farmers the harvesting is undertaken
by the entire family, including children, there may have been an understandable reluctance to engage in this activity.
This report therefore considers that at least a proportion of the total contaminated tobacco land could have been
harvested immediately following the conflict, were it not for the presence of cluster munitions. A minimum figure of
10% and a maximum of 25% have been used to as the proportion of the loss due to cluster munitions in 2006 as
opposed to the conflict itself.
Table H5. Estimated losses in tobacco due to cluster munition contamination (2006-2009)
Year Status Estimated loss – lower (US$) Estimated loss – upper (US$)
2006 Cleared areas 139,876 349,690
Suspected 143,153 357,882
Subtotal 283,029 707,572
2007 Cleared areas 892,500 1,083,750
Suspected 1,001,980 1,216,690
Subtotal 1,894,480 2,300,440
2008 Suspected 841,568 1,021,904
2009 Suspected 169,932 206,346
Total 3,189,009 4,236,262
H.6 Field crops – cereal
The cereal crop in Lebanon is dominated by wheat, with barley also being grown in reasonable quantities. It is
assumed that the majority of the 2006 crop had been harvested prior to the conflict and that there was no impact
from either the war itself or cluster munition contamination. In 2007 to 2009, however, losses are estimated to range
from US$377,000 to US$459,000.
counting the cost: the economic impact of cluster munition contamination in lebanon 49
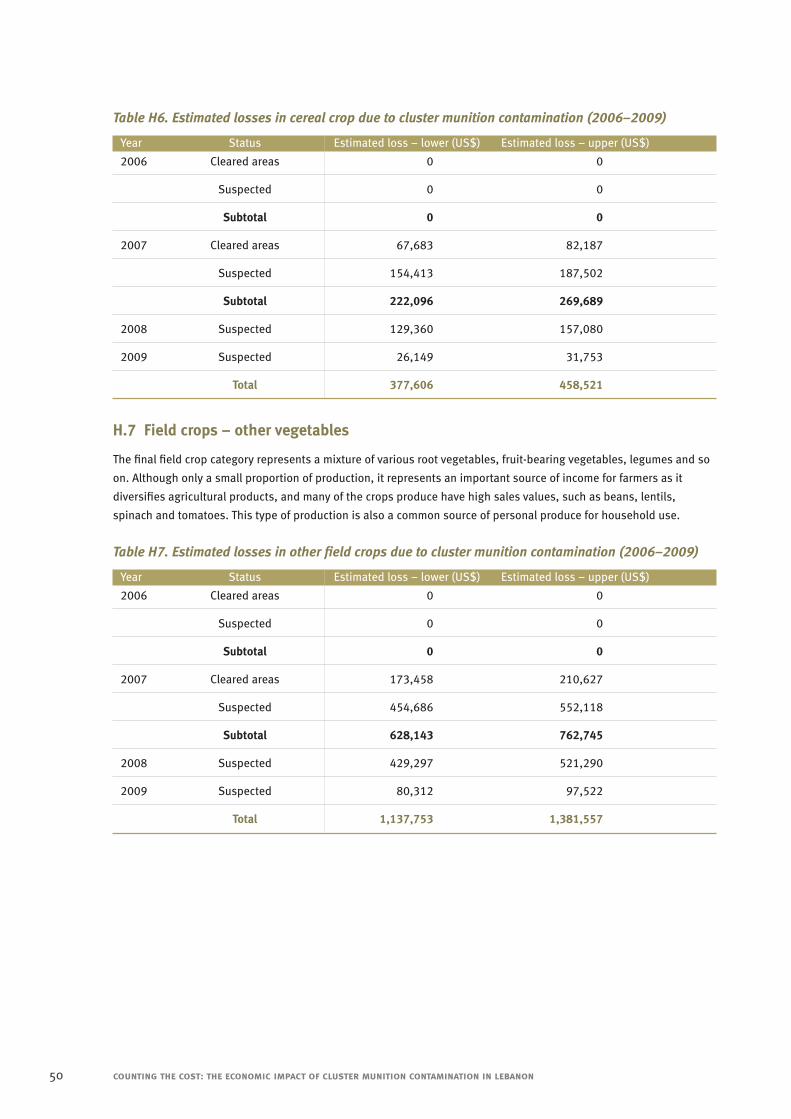
Table H6. Estimated losses in cereal crop due to cluster munition contamination (2006–2009)
Year Status Estimated loss – lower (US$) Estimated loss – upper (US$)
2006 Cleared areas 0 0
Suspected 0 0
Subtotal 0 0
2007 Cleared areas 67,683 82,187
Suspected 154,413 187,502
Subtotal 222,096 269,689
2008 Suspected 129,360 157,080
2009 Suspected 26,149 31,753
Total 377,606 458,521
H.7 Field crops – other vegetables
The final field crop category represents a mixture of various root vegetables, fruit-bearing vegetables, legumes and so
on. Although only a small proportion of production, it represents an important source of income for farmers as it
diversifies agricultural products, and many of the crops produce have high sales values, such as beans, lentils,
spinach and tomatoes. This type of production is also a common source of personal produce for household use.
Table H7. Estimated losses in other field crops due to cluster munition contamination (2006–2009)
Year Status Estimated loss – lower (US$) Estimated loss – upper (US$)
2006 Cleared areas 0 0
Suspected 0 0
Subtotal 0 0
2007 Cleared areas 173,458 210,627
Suspected 454,686 552,118
Subtotal 628,143 762,745
2008 Suspected 429,297 521,290
2009 Suspected 80,312 97,522
Total 1,137,753 1,381,557
50 counting the cost: the economic impact of cluster munition contamination in lebanon
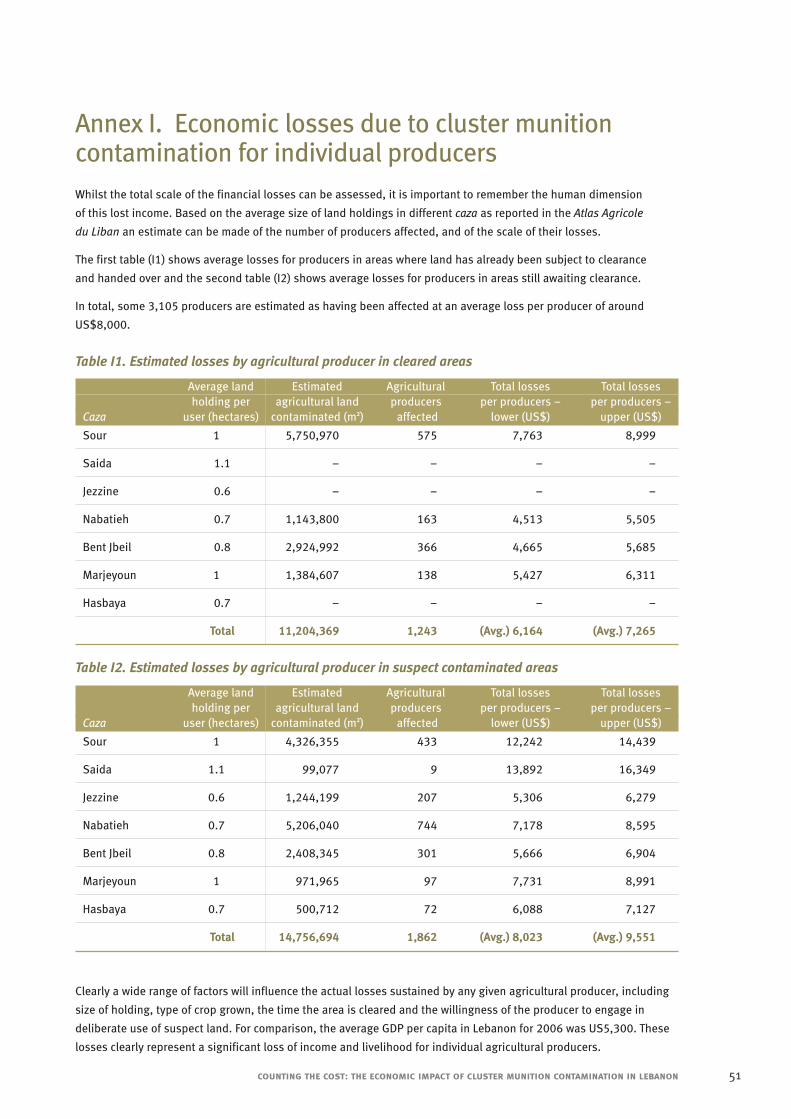
Annex I. Economic losses due to cluster munitioncontamination for individual producersWhilst the total scale of the financial losses can be assessed, it is important to remember the human dimension
of this lost income. Based on the average size of land holdings in different caza as reported in the Atlas Agricole
du Liban an estimate can be made of the number of producers affected, and of the scale of their losses.
The first table (I1) shows average losses for producers in areas where land has already been subject to clearance
and handed over and the second table (I2) shows average losses for producers in areas still awaiting clearance.
In total, some 3,105 producers are estimated as having been affected at an average loss per producer of around
US$8,000.
Table I1. Estimated losses by agricultural producer in cleared areas
Average land Estimated Agricultural Total losses Total lossesholding per agricultural land producers per producers – per producers –
Caza user (hectares) contaminated (m2) affected lower (US$) upper (US$)
Sour 1 5,750,970 575 7,763 8,999
Saida 1.1 – – – –
Jezzine 0.6 – – – –
Nabatieh 0.7 1,143,800 163 4,513 5,505
Bent Jbeil 0.8 2,924,992 366 4,665 5,685
Marjeyoun 1 1,384,607 138 5,427 6,311
Hasbaya 0.7 – – – –
Total 11,204,369 1,243 (Avg.) 6,164 (Avg.) 7,265
Table I2. Estimated losses by agricultural producer in suspect contaminated areas
Average land Estimated Agricultural Total losses Total lossesholding per agricultural land producers per producers – per producers –
Caza user (hectares) contaminated (m2) affected lower (US$) upper (US$)
Sour 1 4,326,355 433 12,242 14,439
Saida 1.1 99,077 9 13,892 16,349
Jezzine 0.6 1,244,199 207 5,306 6,279
Nabatieh 0.7 5,206,040 744 7,178 8,595
Bent Jbeil 0.8 2,408,345 301 5,666 6,904
Marjeyoun 1 971,965 97 7,731 8,991
Hasbaya 0.7 500,712 72 6,088 7,127
Total 14,756,694 1,862 (Avg.) 8,023 (Avg.) 9,551
Clearly a wide range of factors will influence the actual losses sustained by any given agricultural producer, including
size of holding, type of crop grown, the time the area is cleared and the willingness of the producer to engage in
deliberate use of suspect land. For comparison, the average GDP per capita in Lebanon for 2006 was US5,300. These
losses clearly represent a significant loss of income and livelihood for individual agricultural producers.
counting the cost: the economic impact of cluster munition contamination in lebanon 51
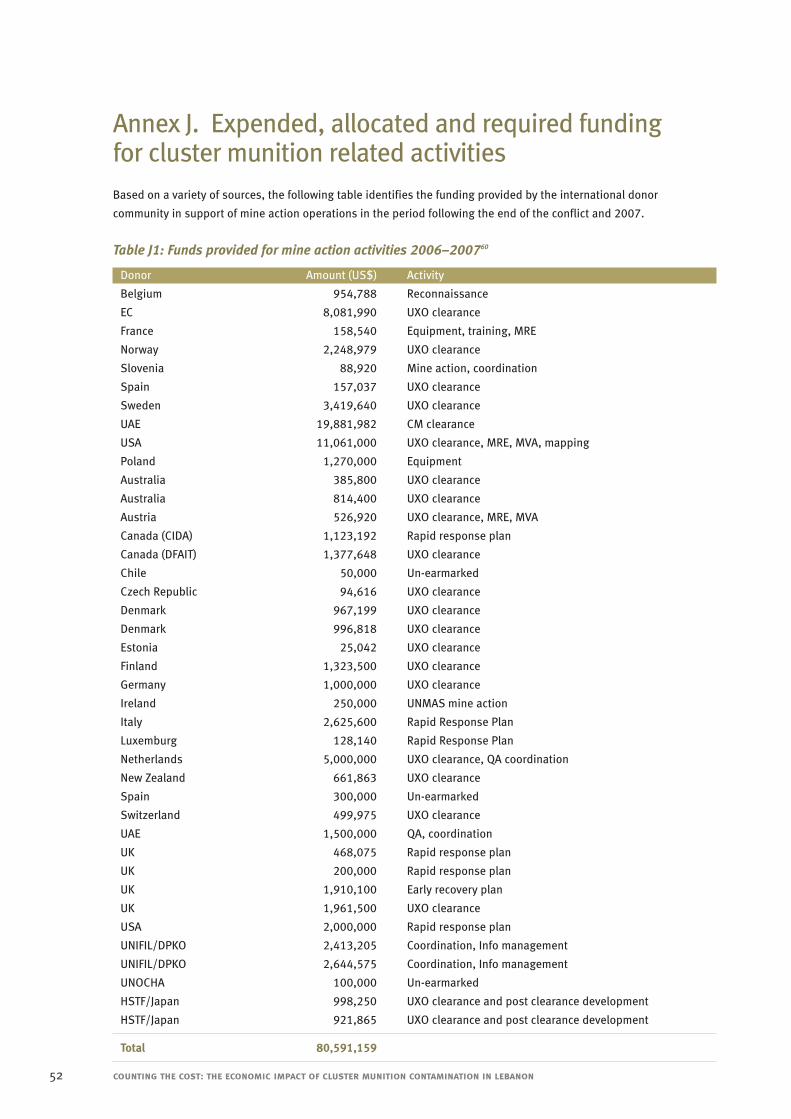
Annex J. Expended, allocated and required funding for cluster munition related activitiesBased on a variety of sources, the following table identifies the funding provided by the international donor
community in support of mine action operations in the period following the end of the conflict and 2007.
Table J1: Funds provided for mine action activities 2006–200760
Donor Amount (US$) Activity
Belgium 954,788 Reconnaissance
EC 8,081,990 UXO clearance
France 158,540 Equipment, training, MRE
Norway 2,248,979 UXO clearance
Slovenia 88,920 Mine action, coordination
Spain 157,037 UXO clearance
Sweden 3,419,640 UXO clearance
UAE 19,881,982 CM clearance
USA 11,061,000 UXO clearance, MRE, MVA, mapping
Poland 1,270,000 Equipment
Australia 385,800 UXO clearance
Australia 814,400 UXO clearance
Austria 526,920 UXO clearance, MRE, MVA
Canada (CIDA) 1,123,192 Rapid response plan
Canada (DFAIT) 1,377,648 UXO clearance
Chile 50,000 Un-earmarked
Czech Republic 94,616 UXO clearance
Denmark 967,199 UXO clearance
Denmark 996,818 UXO clearance
Estonia 25,042 UXO clearance
Finland 1,323,500 UXO clearance
Germany 1,000,000 UXO clearance
Ireland 250,000 UNMAS mine action
Italy 2,625,600 Rapid Response Plan
Luxemburg 128,140 Rapid Response Plan
Netherlands 5,000,000 UXO clearance, QA coordination
New Zealand 661,863 UXO clearance
Spain 300,000 Un-earmarked
Switzerland 499,975 UXO clearance
UAE 1,500,000 QA, coordination
UK 468,075 Rapid response plan
UK 200,000 Rapid response plan
UK 1,910,100 Early recovery plan
UK 1,961,500 UXO clearance
USA 2,000,000 Rapid response plan
UNIFIL/DPKO 2,413,205 Coordination, Info management
UNIFIL/DPKO 2,644,575 Coordination, Info management
UNOCHA 100,000 Un-earmarked
HSTF/Japan 998,250 UXO clearance and post clearance development
HSTF/Japan 921,865 UXO clearance and post clearance development
Total 80,591,159
52 counting the cost: the economic impact of cluster munition contamination in lebanon
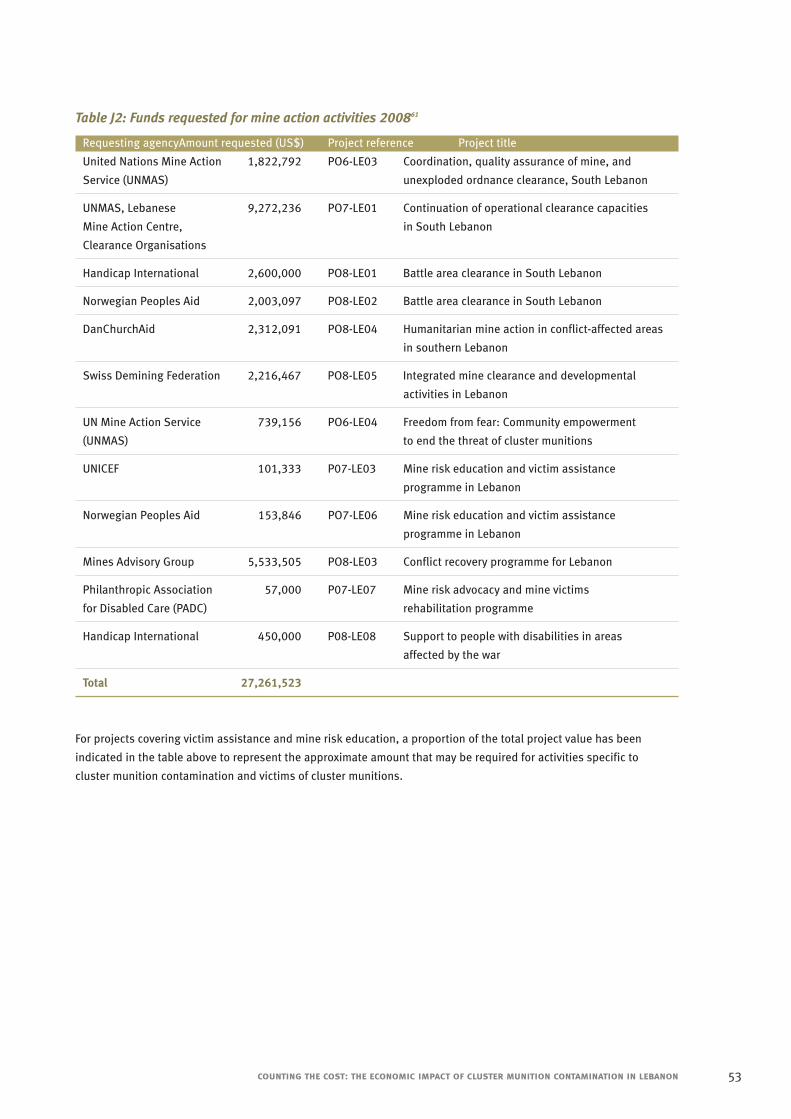
Table J2: Funds requested for mine action activities 200861
Requesting agencyAmount requested (US$) Project reference Project title
United Nations Mine Action 1,822,792 PO6-LE03 Coordination, quality assurance of mine, and
Service (UNMAS) unexploded ordnance clearance, South Lebanon
UNMAS, Lebanese 9,272,236 PO7-LE01 Continuation of operational clearance capacities
Mine Action Centre, in South Lebanon
Clearance Organisations
Handicap International 2,600,000 PO8-LE01 Battle area clearance in South Lebanon
Norwegian Peoples Aid 2,003,097 PO8-LE02 Battle area clearance in South Lebanon
DanChurchAid 2,312,091 PO8-LE04 Humanitarian mine action in conflict-affected areas
in southern Lebanon
Swiss Demining Federation 2,216,467 PO8-LE05 Integrated mine clearance and developmental
activities in Lebanon
UN Mine Action Service 739,156 PO6-LE04 Freedom from fear: Community empowerment
(UNMAS) to end the threat of cluster munitions
UNICEF 101,333 P07-LE03 Mine risk education and victim assistance
programme in Lebanon
Norwegian Peoples Aid 153,846 PO7-LE06 Mine risk education and victim assistance
programme in Lebanon
Mines Advisory Group 5,533,505 PO8-LE03 Conflict recovery programme for Lebanon
Philanthropic Association 57,000 P07-LE07 Mine risk advocacy and mine victims
for Disabled Care (PADC) rehabilitation programme
Handicap International 450,000 P08-LE08 Support to people with disabilities in areas
affected by the war
Total 27,261,523
For projects covering victim assistance and mine risk education, a proportion of the total project value has been
indicated in the table above to represent the approximate amount that may be required for activities specific to
cluster munition contamination and victims of cluster munitions.
counting the cost: the economic impact of cluster munition contamination in lebanon 53
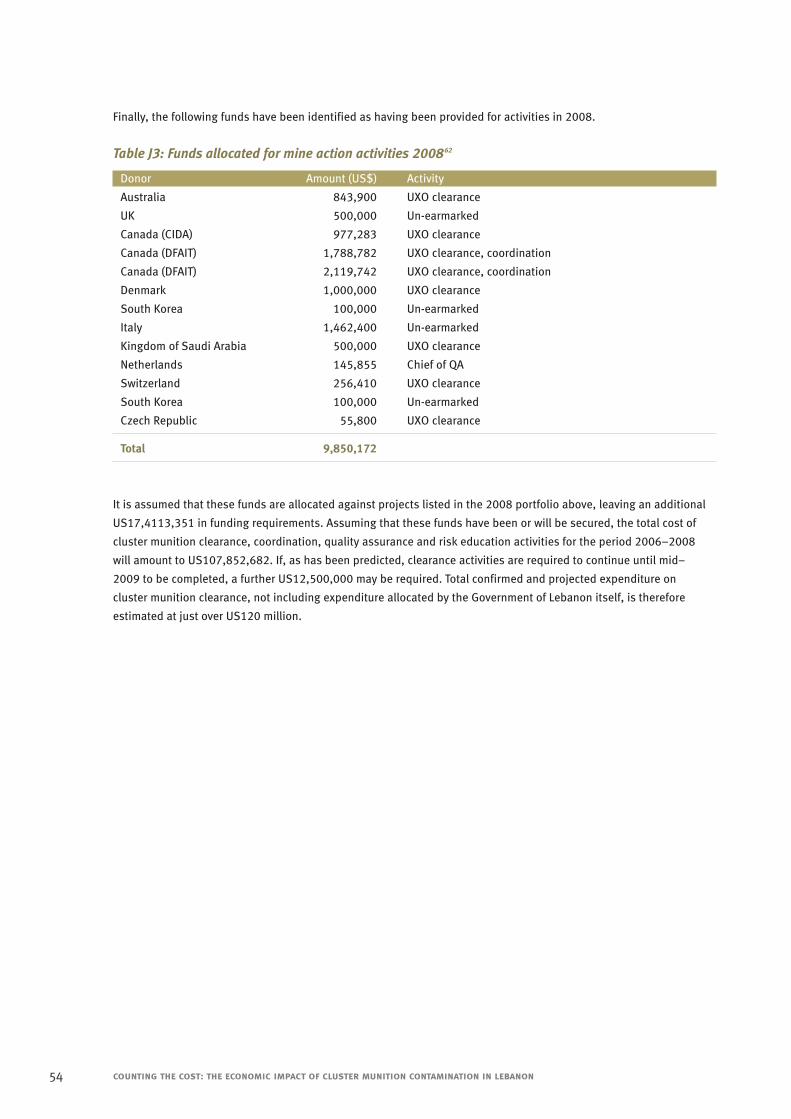
Finally, the following funds have been identified as having been provided for activities in 2008.
Table J3: Funds allocated for mine action activities 200862
Donor Amount (US$) Activity
Australia 843,900 UXO clearance
UK 500,000 Un-earmarked
Canada (CIDA) 977,283 UXO clearance
Canada (DFAIT) 1,788,782 UXO clearance, coordination
Canada (DFAIT) 2,119,742 UXO clearance, coordination
Denmark 1,000,000 UXO clearance
South Korea 100,000 Un-earmarked
Italy 1,462,400 Un-earmarked
Kingdom of Saudi Arabia 500,000 UXO clearance
Netherlands 145,855 Chief of QA
Switzerland 256,410 UXO clearance
South Korea 100,000 Un-earmarked
Czech Republic 55,800 UXO clearance
Total 9,850,172
It is assumed that these funds are allocated against projects listed in the 2008 portfolio above, leaving an additional
US17,4113,351 in funding requirements. Assuming that these funds have been or will be secured, the total cost of
cluster munition clearance, coordination, quality assurance and risk education activities for the period 2006–2008
will amount to US107,852,682. If, as has been predicted, clearance activities are required to continue until mid–
2009 to be completed, a further US12,500,000 may be required. Total confirmed and projected expenditure on
cluster munition clearance, not including expenditure allocated by the Government of Lebanon itself, is therefore
estimated at just over US120 million.
54 counting the cost: the economic impact of cluster munition contamination in lebanon
counting the cost: the economic impact of cluster munition contamination in lebanon 55
Notes1 See Annex A for a complete list of information sources regarding cluster munition use in Lebanon.
2 Rebuilding Lebanon Together... 100 days after. Government of Lebanon (2006) Presented by Prime Minister Siniora on 21 November 2006.
3 “Rebuilding Lebanon Together…100 days after – Damage and Reconstruction Figures”. Government of Lebanon, October 2006. (GoL 2006b).
4 Setting the Stage for long term reconstruction: The national early recovery process. Stockholm Conference for Lebanon’s Early Recovery, August2006. Government of Lebanon (GoL 2006a)
5 EC (European Commission), 2006a. Lebanon 34 Day War: Fact finding mission and preliminary damage assessment. October 2006
6 World Bank, 2006a. Lebanon. Economic and Social Impact Assessment from Recovery to Sustainable Growth. Volume 2. Sectoral Analysis. Socialand Economic Development Group. Middle East and North Africa Region. World Bank.
7 For an more information see Human Rights Watch, Flooding South Lebanon: Israel’s Use of Cluster Munitions in Lebanon in July and August 2006,
Human Rights Watch, New York. (2007)
8 See for general discussion Landmine Action (2006), Failure to protect: A case for the prohibition of cluster munitions.
9 In Lebanon the Lebanese Mine Action Centre estimates that between 2.6 and 4 million submunitions may have been utilised by both aerialbombing and ground-based artillery and rocket fire. In comparison, US and UK forces dropped approximately 234,000 submunitions on Kosovo in 1999. Southern Lebanon covers an area of approximately 2,020 km², equivalent to less than a fifth of the size of Kosovo.
10 pp.39-42, Flooding South Lebanon: Israel’s use of cluster munitions in Lebanon in July and August 2006, Human Rights Watch (2007). It is noted in this report that olive groves and citrus orchards were deliberately targeted as they were frequently used as launch sites by Hezbollah.
11 155 out of the 197, or 79%, of confirmed victims of cluster munitions occurred in the initial five months following the end of hostilities according to information held on the UNMACC Mine Victim Database.
12 UNMACC Quarterly Report (January – March 2008). The UNMACC assumes an average area of approximately 40,000m² per confirmed strike locationwhen estimating Total contaminated land.
13 Figures provided by Rana Elias, IMSMA Programme Officer, UNMACC South Lebanon, 1 May 2008
14 “Duplicated” refers to CBU strike sites that have been cleared as part of another clearance site. Some tasks comprised two or more CBU strike sites.
15 Interview with Tekimiti Gilbert, Chief of Operations, UNMACC. 14 April 2008.
16 Lebanon: Post-conflict Environment Assessment, United Nation Environment Programme (January 2007)
17 Damage and Early Recovery Needs Assessment of Agriculture, Fisheries and Forestry, Food and Agriculture Organisation (November 2006)
18 Now the Lebanese Mine Action Centre (LMAC)
19 Post-conflict Social and Livelihoods Assessment in Lebanon, World Bank/ Ministry of Social Affairs (June 2007)
20 The authors of the report, along with many other observers, equate land contamination with land denial. However as identified in Section 2.3 of this report, a significant proportion of agricultural producers choose to enter and utilise suspect contaminated areas.
21 p.52. World Bank (2007)
22 For example, a UNDP report entitled “CBU Contamination by Land Use”, current as of 29 November 2006, indicates that 4,700ha of olive land wereaffected, and more than 20,000ha of agricultural land in Total. The FAO quote LMAC sources in their damage assessment stating that 26% of allagricultural land was contaminated. UNOCHA in their report on the legacy of cluster munitions indicated that 10% of all land for field crops and 6%of all citrus fruit land was contaminated, noting that this was likley an underestimate. Based on the analysis of contaminated land and land useundertaken in the present report, all of these figures are substantially overestimated.
23 Many of the Dangerous Area reports examined contain little more than a coordinate and the name of the village.
24 Sites are classified as “suspended” for a variety of reasons, including the need for additional clearance, areas within the site that cannot be clearedwithout mechanical assistance and so on. It may be many months or years before these areas are cleared, but it has been assumed that for the 66areas classified as “suspended” amongst the 332 areas assessed in Total, all of the usable and priority land has been cleared.
25 There is an option to tick the type of land that was cleared, but this is restricted to four categories – “Housing”, “Agricultural”, “Industrial” and“Other”: Different agencies have interpreted this in different ways: some organisations tick multiple boxes when a clearance site encompassesmore than one type of land use; other organisations will choose “other” when the land cleared is used for a variety of purposes
26 The sketch maps are provided along with the boundaries defined by both GPS readings and distance and bearing measurements. They dodistinguish between areas cleared using different methods (e.g. visually, instrumentally, mechanically, and so on).
27 IMSMA, the Information Management System for Mine Action, is a piece of specialised software developed by the Geneva International Centre forHumanitarian Demining (GICHD) to assist coordination bodies manage information regarding the threat from mines and ordnance, and the mineaction activities undertaken to mitigate and reduce this threat. It is used in conjunction with ArcView 3.2 in Lebanon, which allows the data to berepresented over maps, including digitised satellite imagery.
28 The six land use categories were used at this stage of the analysis were housing, olive groves, fruit trees, field crops, pasture/ non-agricultural land and unidentified.
29 An interactive CD-ROM version of the Atlas Agricole du Liban was provided by Mr Hussein Nasrallah at the Ministry of Agriculture. However it canalso be viewed online at the Ministry of Agriculture website.
30 The Total number of dangerous areas/ tasks in each caza could only be estimated. This is because the UNMACC separates southern Lebanon into 8 Area of Operations, which do not match with administrative boundaries. However the majority could be clearly identified as lying within a specificcaza based on the UTM reading.
56 counting the cost: the economic impact of cluster munition contamination in lebanon
31 For caza that had not yet received any clearance activities (Saida, Hasbaya and Jezzine) it was assumed that clearance tasks would be equivalent to the average size in the neighbouring caza.
32 In Bent Jbeil, however, the proportion of pasture / non-agricultural land was only increased by half for future clearance locations, from 33.8% to 50.7%. This was due to the already high proportion of pasture land cleared.
33 Interview with Rami Samain, Emergency Coordinator, Food and Agriculture Organisation, 13 March 2008
34 Many factors could influence the projected end date of June 2009, including a change in the number of operational BAC teams, identification ofadditional strike sites, cancellation of existing suspect contaminated sites, delays in clearance operations for reasons such as security restrictionsand so on. These changes will affect the calculations with regards to the economic impact of contamination – if clearance takes longer, theeconomic impact increases, and if it is completed more rapidly than projected, the economic impact is lessened.
35 These comprised of one commercial organisation, BACTEC International, and six non-governmental organisations – Handicap International (France),Swedish Rescue Services Association (SRSA), Norwegian Peoples Aid (NPA), DanChurchAid (DCA), Swiss Demining Federation (FSD) and MinesAdvisory Group (MAG). Another commercial clearance agency, ArmorGroup, was operational in the period October 2006 – December 2007. Several of these organisations had existing activities in Lebanon prior to the 2006 conflict.
36 Interview with Andy Gleeson, Technical Operations Manager, MAG Lebanon, 17 March 2006.
37 In fact in the first six weeks after the end of hostilities more submunitions were destroyed than in the entire 12-month period up to March 2008.
38 Although a substantial amount of clearance, this is lower than the amount of land indicated as cleared in the most recent UNMACC QuarterlyReport, which states that 28,857,522m² of land has been cleared up to March 2008. This reflects variances between the amount of clearanceactivity reported each month by operators, and the actual final amount of cleared land handed over.
39 Information is not readily accessible or consistently recorded in terms of the quantities of munitions found on or below the surface during theclearance process. However in a sample of 27 clearance sites examined during the research, 39.1% of the Total munitions found were locatedbelow the surface in the case of M42, M77 and M85 type submunitions. For BLU-63 submunitions this proportion rose to 69.7% of submunitionsfound below the surface.
40 Different organisations choose to adopt different methodologies for levels of surface or sub-surface search. Some have conducted sub-surfacesearch on all areas except artificial ground. Others have conducted only a minimum amount of sub-surface search. Clearly the levels of residual risk will differ between these locations.
41 Figures for confirmed funding are taken from UNMACC Quarterly Report (January – March 2008) and Lebanon Country Report, Landmine Monitor
2007. The outstanding amount for 2008 is based on figures in the UNMAS 2008 Portfolio of Mine Action Projects: Lebanon. The figure for 2009 is estimated on a pro rata basis based on costs for 2008.
42 For more detailed analysis of these issues see R. Moyes (2004), Tampering: the deliberate handling and use of live ordnance in Cambodia,
Handicap International Belgium, Mines Advisory Group, Norwegian People’s Aid.
43 Economic Assessment of Environmental Degradation Due to the July 2006 Hostilities, Report No. 39787-LB, World Bank (October 2007). A similarsystem, Quality Adjusted Life Years (QALY) is used by the U.K government to calculate the economic cost of road accidents
44 Approximately translated to “Analysis of livelihoods and gender following war damage in poor rural areas”
45 Referred to as AAL 2004 from this point onwards.
46 Land in use is referred to as Superficie Agriculture Utile in the Atlas Agricole du Liban 2004 and does not include land that has been out of use for more than five years or to pasture land in common ownership. The amount of land in use is estimated to have increased to approximately270,000ha since the 1998 survey.
47 Carte S.2.2, AAL 2004
48 Tableau 3: Superficie Agricole Utile et mode de faire valoir de l’exploitation, AAL 2004
49 Carte S.2.4, AAL 2004.
50 Tableau 1 : Répartition des exploitants par classe d’âge et par activité économique. AAL 2004.
51 Tableau 1 : Répartition des exploitants par classe d’âge et par activité économique. AAL 2004.
52 Tableau 2 : Le niveau d’instruction de l’exploitant et la destination principale de la production. AAL 2004
53 Tableau 3 : Superficie Agricole Utile et mode de faire valoir de l’exploitation. AAL 2004
54 p.33. IFAD 2007
55 Tableau 4: La main d’oeuvre salarieé permanente et la main d’œuvre occasionnelle. AAL 2004
56 Based on data contained in the AAL 2004.
57 UNMACC Monthly Report, October 2006.
58 For caza that have not yet received clearance, the proportion of land in each land use category is based on the statistics from neighbouring caza –Saida is based on Sour, Hasbaya on Marjeyoun and Jezzine on Nabatieh.
59 p.44, War Impact on Forest resources and olive groves in southern Lebanon. Association for Forests, Development and Conservation / UNDP (2007)
60 Based on figures from UNMACC Quarterly Report (January–March 2008) and Lebanon Country Report, Landmine Monitor 2007.
61 Taken from the 2008 Portfolio of Mine Action Projects: Lebanon, available at www.mineaction.org/projects.asp?c=16&pg=1
62 Based on figures from UNMACC Quarterly Report (January–March 2008) and specific donor websites.

counting the cost: the economic impact of cluster munition contamination in lebanon 57

58 counting the cost: the economic impact of cluster munition contamination in lebanon

counting the cost: the economic impact of cluster munition contamination in lebanon 59

2nd floor 89 Albert Embankment London SE1 7TP Tel +44 (0)20 7820 0222 Fax +44 (0)20 7820 0057 Email [email protected]
www.landmineaction.org
Related Documents