Counter-propagating wave interaction for contrast-enhanced ultrasound imaging This article has been downloaded from IOPscience. Please scroll down to see the full text article. 2012 Phys. Med. Biol. 57 L9 (http://iopscience.iop.org/0031-9155/57/21/L9) Download details: IP Address: 156.83.1.251 The article was downloaded on 15/10/2012 at 08:08 Please note that terms and conditions apply. View the table of contents for this issue, or go to the journal homepage for more Home Search Collections Journals About Contact us My IOPscience

Welcome message from author
This document is posted to help you gain knowledge. Please leave a comment to let me know what you think about it! Share it to your friends and learn new things together.
Transcript
Counter-propagating wave interaction for contrast-enhanced ultrasound imaging
This article has been downloaded from IOPscience. Please scroll down to see the full text article.
2012 Phys. Med. Biol. 57 L9
(http://iopscience.iop.org/0031-9155/57/21/L9)
Download details:
IP Address: 156.83.1.251
The article was downloaded on 15/10/2012 at 08:08
Please note that terms and conditions apply.
View the table of contents for this issue, or go to the journal homepage for more
Home Search Collections Journals About Contact us My IOPscience
IOP PUBLISHING PHYSICS IN MEDICINE AND BIOLOGY
Phys. Med. Biol. 57 (2012) L9–L18 doi:10.1088/0031-9155/57/21/L9
FAST TRACK COMMUNICATION
Counter-propagating wave interaction forcontrast-enhanced ultrasound imaging
G Renaud1, J G Bosch1, G L ten Kate1,2, V Shamdasani3, R Entrekin3,N de Jong1,4 and A F W van der Steen1,4
1 Biomedical Engineering, Thoraxcenter, Erasmus Medical Center, Rotterdam, The Netherlands2 Department of Cardiology, Thoraxcenter, Erasmus Medical Center, Rotterdam, The Netherlands3 Philips Healthcare, Bothell, WA, USA4 Interuniversity Cardiology Institute of the Netherlands, Utrecht, The Netherlands
E-mail: [email protected] and [email protected]
Received 24 May 2012, in final form 24 August 2012Published 9 October 2012Online at stacks.iop.org/PMB/57/L9
AbstractMost techniques for contrast-enhanced ultrasound imaging require linearpropagation to detect nonlinear scattering of contrast agent microbubbles.Waveform distortion due to nonlinear propagation impairs their ability todistinguish microbubbles from tissue. As a result, tissue can be misclassified asmicrobubbles, and contrast agent concentration can be overestimated; therefore,these artifacts can significantly impair the quality of medical diagnoses.Contrary to biological tissue, lipid-coated gas microbubbles used as a contrastagent allow the interaction of two acoustic waves propagating in oppositedirections (counter-propagation). Based on that principle, we describe a strategyto detect microbubbles that is free from nonlinear propagation artifacts. In vitroimages were acquired with an ultrasound scanner in a phantom of tissue-mimicking material with a cavity containing a contrast agent. Unlike thedefault mode of the scanner using amplitude modulation to detect microbubbles,the pulse sequence exploiting counter-propagating wave interaction creates nopseudoenhancement behind the cavity in the contrast image.
(Some figures may appear in colour only in the online journal)
1. Introduction
Injection of lipid-coated gas microbubbles in the blood flow as an ultrasound contrastagent (UCA) is well established for the diagnosis of cancers or cardiovascular diseases likeatherosclerosis (Liu et al 2005). Aiming at detecting contrast agent microbubbles, the contrastmode of an ultrasound scanner consists in transmitting usually a sequence of one to threeultrasound signals with a time interval of roughly 0.1 ms. The backscattered echoes in responseto the transmitted ultrasound waves are processed to retrieve a specific acoustic signature ofcontrast microbubbles. An image displaying the location of the contrast agent can then be
0031-9155/12/210009+09$33.00 © 2012 Institute of Physics and Engineering in Medicine Printed in the UK & the USA L9
L10 Fast Track Communication
Contrast image obtained by amplitude modulation
[mm]
[mm
]
0 5 10 15 20 25 30 35
0
5
10
15
20
−35
−30
−25
−20
−15
−10
−5
0
0 5 10 15 20 25−1
−0.5
0
0.5
1
Distance (mm)
RF
line
s (c
ontr
ast m
ode)
0 5 10 15 20 25−0.1
−0.05
0
0.05
0.1
Distance (mm)
Con
tras
t sig
nal
A2A1
A2 − 2 x A1
(a)
nonlinear propagation artifact
dB
artifact
(b)
(c)
tissue tissuecarotid lumen
carotid artery
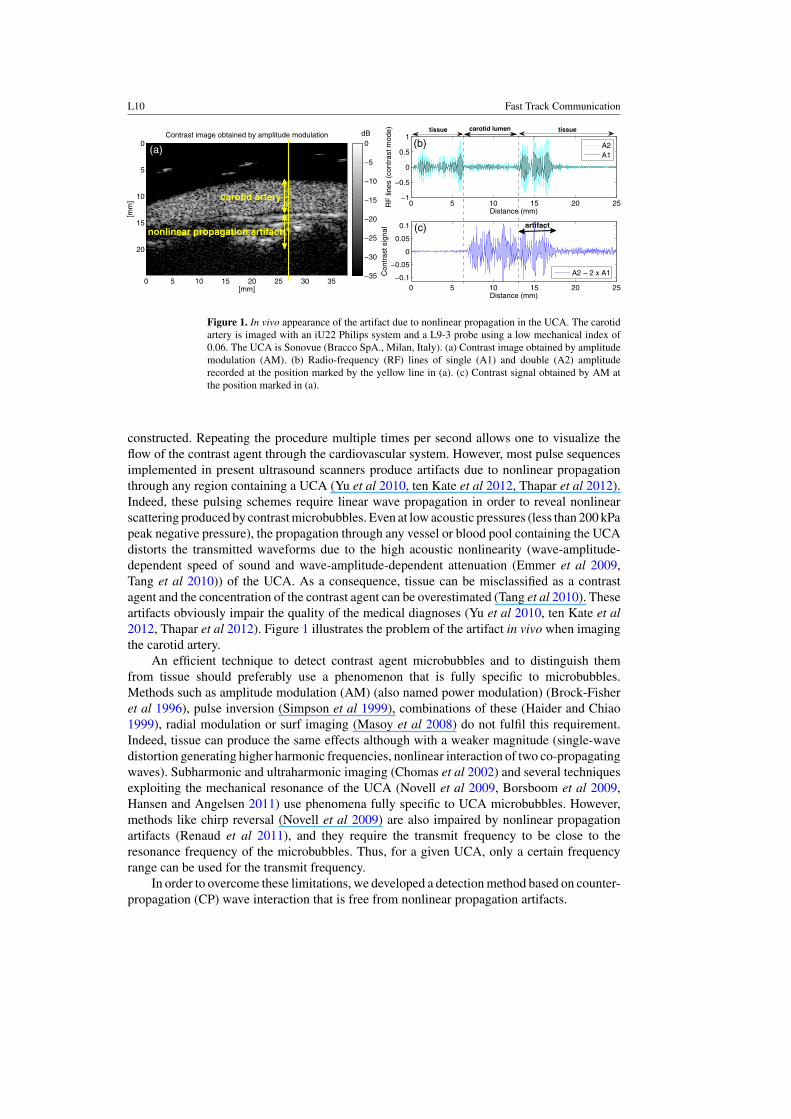
Figure 1. In vivo appearance of the artifact due to nonlinear propagation in the UCA. The carotidartery is imaged with an iU22 Philips system and a L9-3 probe using a low mechanical index of0.06. The UCA is Sonovue (Bracco SpA., Milan, Italy). (a) Contrast image obtained by amplitudemodulation (AM). (b) Radio-frequency (RF) lines of single (A1) and double (A2) amplituderecorded at the position marked by the yellow line in (a). (c) Contrast signal obtained by AM atthe position marked in (a).
constructed. Repeating the procedure multiple times per second allows one to visualize theflow of the contrast agent through the cardiovascular system. However, most pulse sequencesimplemented in present ultrasound scanners produce artifacts due to nonlinear propagationthrough any region containing a UCA (Yu et al 2010, ten Kate et al 2012, Thapar et al 2012).Indeed, these pulsing schemes require linear wave propagation in order to reveal nonlinearscattering produced by contrast microbubbles. Even at low acoustic pressures (less than 200 kPapeak negative pressure), the propagation through any vessel or blood pool containing the UCAdistorts the transmitted waveforms due to the high acoustic nonlinearity (wave-amplitude-dependent speed of sound and wave-amplitude-dependent attenuation (Emmer et al 2009,Tang et al 2010)) of the UCA. As a consequence, tissue can be misclassified as a contrastagent and the concentration of the contrast agent can be overestimated (Tang et al 2010). Theseartifacts obviously impair the quality of the medical diagnoses (Yu et al 2010, ten Kate et al2012, Thapar et al 2012). Figure 1 illustrates the problem of the artifact in vivo when imagingthe carotid artery.
An efficient technique to detect contrast agent microbubbles and to distinguish themfrom tissue should preferably use a phenomenon that is fully specific to microbubbles.Methods such as amplitude modulation (AM) (also named power modulation) (Brock-Fisheret al 1996), pulse inversion (Simpson et al 1999), combinations of these (Haider and Chiao1999), radial modulation or surf imaging (Masoy et al 2008) do not fulfil this requirement.Indeed, tissue can produce the same effects although with a weaker magnitude (single-wavedistortion generating higher harmonic frequencies, nonlinear interaction of two co-propagatingwaves). Subharmonic and ultraharmonic imaging (Chomas et al 2002) and several techniquesexploiting the mechanical resonance of the UCA (Novell et al 2009, Borsboom et al 2009,Hansen and Angelsen 2011) use phenomena fully specific to UCA microbubbles. However,methods like chirp reversal (Novell et al 2009) are also impaired by nonlinear propagationartifacts (Renaud et al 2011), and they require the transmit frequency to be close to theresonance frequency of the microbubbles. Thus, for a given UCA, only a certain frequencyrange can be used for the transmit frequency.
In order to overcome these limitations, we developed a detection method based on counter-propagation (CP) wave interaction that is free from nonlinear propagation artifacts.
Fast Track Communication L11
0 1 2 3
−100
0
100
Counter−propagation 1
Time (µs)
Tra
nsm
it ac
oust
icpr
essu
re (
kPa)
0 1 2 3−400
−200
0
200
400Counter−propagation 2
Time (µs)
Tra
nsm
it ac
oust
icpr
essu
re (
kPa)
0 0.5 1 1.5 2
−100
−50
0
50
100
Time (µs)
Tra
nsm
it ac
oust
icpr
essu
re (
kPa)
Amplitude modulation
2 4 6 8 10−50
−40
−30
−20
−10
0
Frequency (MHz)
Aco
ustic
spe
ctru
m (
dB)
2 4 6 8 10−50
−40
−30
−20
−10
0
Frequency (MHz)A
cous
tic s
pect
rum
(dB
)
2 4 6 8 10−50
−40
−30
−20
−10
0
Frequency (MHz)
Aco
ustic
spe
ctru
m (
dB)
(a)
(d) (e) (f)
(b) (c)
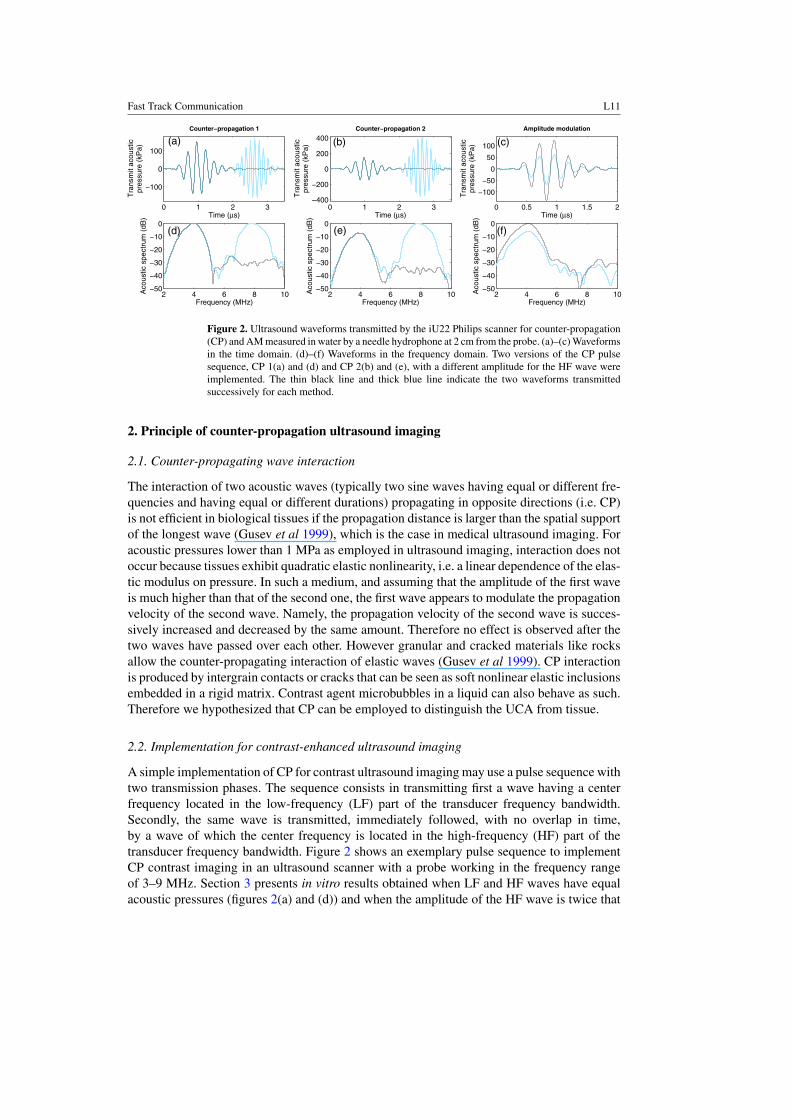
Figure 2. Ultrasound waveforms transmitted by the iU22 Philips scanner for counter-propagation(CP) and AM measured in water by a needle hydrophone at 2 cm from the probe. (a)–(c) Waveformsin the time domain. (d)–(f) Waveforms in the frequency domain. Two versions of the CP pulsesequence, CP 1(a) and (d) and CP 2(b) and (e), with a different amplitude for the HF wave wereimplemented. The thin black line and thick blue line indicate the two waveforms transmittedsuccessively for each method.
2. Principle of counter-propagation ultrasound imaging
2.1. Counter-propagating wave interaction
The interaction of two acoustic waves (typically two sine waves having equal or different fre-quencies and having equal or different durations) propagating in opposite directions (i.e. CP)is not efficient in biological tissues if the propagation distance is larger than the spatial supportof the longest wave (Gusev et al 1999), which is the case in medical ultrasound imaging. Foracoustic pressures lower than 1 MPa as employed in ultrasound imaging, interaction does notoccur because tissues exhibit quadratic elastic nonlinearity, i.e. a linear dependence of the elas-tic modulus on pressure. In such a medium, and assuming that the amplitude of the first waveis much higher than that of the second one, the first wave appears to modulate the propagationvelocity of the second wave. Namely, the propagation velocity of the second wave is succes-sively increased and decreased by the same amount. Therefore no effect is observed after thetwo waves have passed over each other. However granular and cracked materials like rocksallow the counter-propagating interaction of elastic waves (Gusev et al 1999). CP interactionis produced by intergrain contacts or cracks that can be seen as soft nonlinear elastic inclusionsembedded in a rigid matrix. Contrast agent microbubbles in a liquid can also behave as such.Therefore we hypothesized that CP can be employed to distinguish the UCA from tissue.
2.2. Implementation for contrast-enhanced ultrasound imaging
A simple implementation of CP for contrast ultrasound imaging may use a pulse sequence withtwo transmission phases. The sequence consists in transmitting first a wave having a centerfrequency located in the low-frequency (LF) part of the transducer frequency bandwidth.Secondly, the same wave is transmitted, immediately followed, with no overlap in time,by a wave of which the center frequency is located in the high-frequency (HF) part of thetransducer frequency bandwidth. Figure 2 shows an exemplary pulse sequence to implementCP contrast imaging in an ultrasound scanner with a probe working in the frequency rangeof 3–9 MHz. Section 3 presents in vitro results obtained when LF and HF waves have equalacoustic pressures (figures 2(a) and (d)) and when the amplitude of the HF wave is twice that
L12 Fast Track Communication
of the LF wave (figures 2(b) and (e)). These two versions of the CP pulse sequence will becompared to AM (figures 2(c) and (f)). After scattering or reflection of the LF wave in themedium, the resulting back-propagating wave crosses the HF wave, since they propagate inopposite directions. The presence of contrast agent microbubbles at the location where the twowaves cross each other allows the HF wave to interact during its forward propagation withwaves backscattered or reflected in response to the LF wave. Emitting the LF wave withouttransmitting the HF wave provides a reference. Thus comparison of the echoes received in thetwo situations (with and without transmission of the HF wave) allows us to retrieve the effectof CP and therefore to localize the UCA.
In practice, the frequency contents of the LF wave and the HF wave must not overlapsignificantly (figures 2(d) and (e)) so that the signals received in response to the LF wave canbe isolated by means of frequency filtering to suppress echoes at the frequency of the HF wave.Note that the wave transmitted twice is preferably the LF wave. In such a case, the secondharmonic component of the HF wave generated by nonlinear propagation does not appear inthe frequency bandwidth of the probe. The contrary (transmitting first the HF wave, and thentransmitting the HF wave followed by the LF wave) may degrade the efficiency of the methodsince the second harmonic component of the LF wave would appear at a frequency close tothat of the HF wave. The second harmonic component is also produced by tissue, so a residualsignal would be obtained even in the absence of the UCA.
2.3. Physical mechanisms producing counter-propagating wave interaction in an ultrasoundcontrast agent
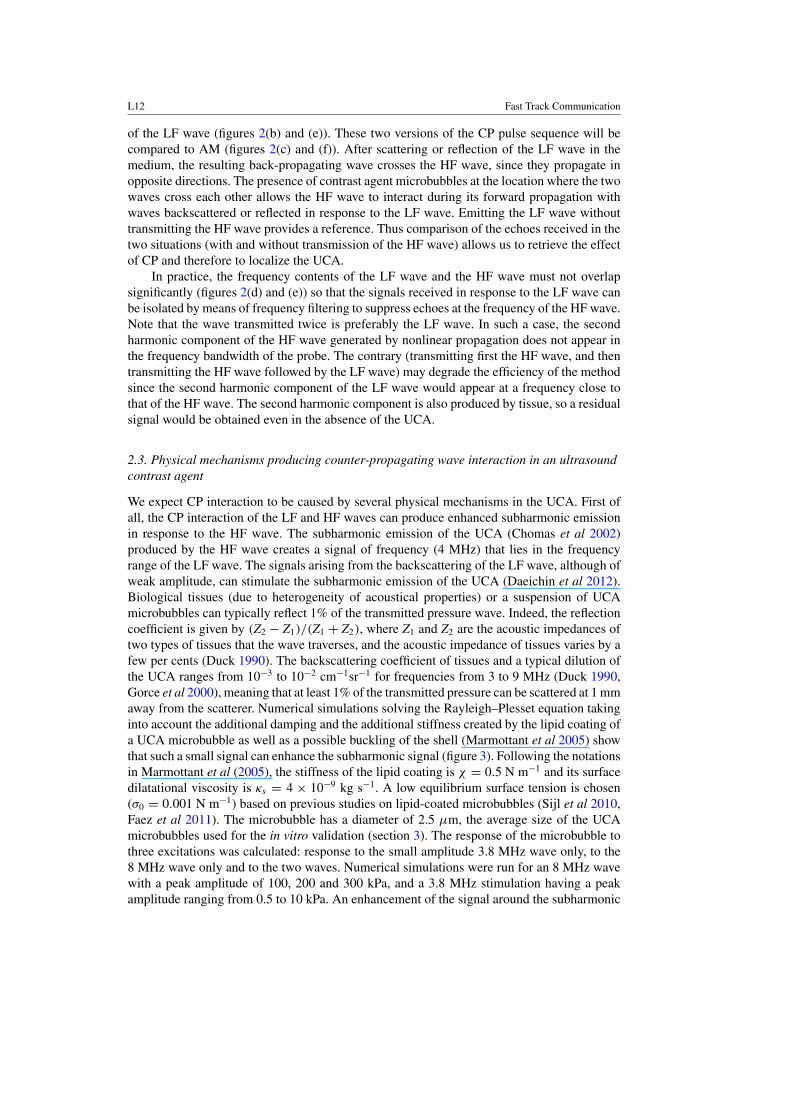
We expect CP interaction to be caused by several physical mechanisms in the UCA. First ofall, the CP interaction of the LF and HF waves can produce enhanced subharmonic emissionin response to the HF wave. The subharmonic emission of the UCA (Chomas et al 2002)produced by the HF wave creates a signal of frequency (4 MHz) that lies in the frequencyrange of the LF wave. The signals arising from the backscattering of the LF wave, although ofweak amplitude, can stimulate the subharmonic emission of the UCA (Daeichin et al 2012).Biological tissues (due to heterogeneity of acoustical properties) or a suspension of UCAmicrobubbles can typically reflect 1% of the transmitted pressure wave. Indeed, the reflectioncoefficient is given by (Z2 − Z1)/(Z1 + Z2), where Z1 and Z2 are the acoustic impedances oftwo types of tissues that the wave traverses, and the acoustic impedance of tissues varies by afew per cents (Duck 1990). The backscattering coefficient of tissues and a typical dilution ofthe UCA ranges from 10−3 to 10−2 cm−1sr−1 for frequencies from 3 to 9 MHz (Duck 1990,Gorce et al 2000), meaning that at least 1% of the transmitted pressure can be scattered at 1 mmaway from the scatterer. Numerical simulations solving the Rayleigh–Plesset equation takinginto account the additional damping and the additional stiffness created by the lipid coating ofa UCA microbubble as well as a possible buckling of the shell (Marmottant et al 2005) showthat such a small signal can enhance the subharmonic signal (figure 3). Following the notationsin Marmottant et al (2005), the stiffness of the lipid coating is χ = 0.5 N m−1 and its surfacedilatational viscosity is κs = 4 × 10⁻⁹ kg s−1. A low equilibrium surface tension is chosen(σ0 = 0.001 N m−1) based on previous studies on lipid-coated microbubbles (Sijl et al 2010,Faez et al 2011). The microbubble has a diameter of 2.5 μm, the average size of the UCAmicrobubbles used for the in vitro validation (section 3). The response of the microbubble tothree excitations was calculated: response to the small amplitude 3.8 MHz wave only, to the8 MHz wave only and to the two waves. Numerical simulations were run for an 8 MHz wavewith a peak amplitude of 100, 200 and 300 kPa, and a 3.8 MHz stimulation having a peakamplitude ranging from 0.5 to 10 kPa. An enhancement of the signal around the subharmonic
Fast Track Communication L13
0 0.5 1 1.5 2
1.2
1.22
1.24
1.26
1.28
Time (µs)
Bub
ble
radi
us (µ
m)
2 4 6 8 10−210
−200
−190
−180
−170
−160
Frequency (MHz)
Bub
ble
radi
us s
pect
rum
(dB
)
100 kPa 8 MHz wave only effect of 1 kPa 3.8 MHz stimulation
(b)(a)
Figure 3. Simulated response of a 2.5 μm diameter lipid-coated microbubble to a 1.5 μs 8 MHzsine burst tapered with a Hann function of peak acoustic amplitude 100 kPa, with and without theaction of a weak 1.5 μs 3.8 MHz sine burst of peak acoustic amplitude 1 kPa. (a) Radial responseas a function of time. (b) Radial response as a function of frequency. The arrow shows the effect ofthe 3.8 MHz stimulation on the subharmonic response around 4 MHz. The subharmonic responseenhanced by the 3.8 MHz signal is shown after the subtraction of the response of the bubble tothe 3.8 MHz signal only. The resonance frequency of a 2.5 μm diameter microbubble is close to4 MHz.
frequency (4 MHz) of 6–16 dB is observed, the enhancement increasing monotonously as theamplitude of the 3.8 MHz stimulation increases. Figure 3 depicts the result obtained for a100 kPa 8 MHz excitation and a 1 kPa 3.8 MHz stimulation. It is seen that without thestimulation created by the 3.8 MHz wave, no clear peak appears at the subharmonic frequency(4 MHz); the signal is −20 dB below the response at the fundamental frequency (8 MHz).When the microbubble is simultaneously excited by the two waves, and after subtraction ofthe response to the 3.8 MHz wave only from the response to the two waves, a subharmonicsignal is clearly visible with an amplitude −10 dB below the response at 8 MHz. This10 dB enhancement of the subharmonic signal is produced by the low amplitude 3.8 MHzstimulation. The stimulated subharmonic signal around 4 MHz is extracted by the signalprocessing employed for CP imaging and therefore it contributes to the detection of the UCA.
An additional contribution can arise from the perturbed back-propagation of the LF waveinduced by the HF wave. Theoretical work showed that amplitude-dependent dissipationand hysteretic nonlinear elasticity can produce significant interaction between two counter-propagating elastic waves (Gusev et al 1999, Gusev 2005). Interestingly, amplitude-dependentattenuation (Chen et al 2002, Tang and Eckersley 2007, Emmer et al 2009) and hystereticnonlinear elasticity (Moreschi et al 2009) were measured in a suspension of UCA microbubblesat low acoustic pressures. Experiments by Moreschi et al (2009) also showed that the pressuredependence of the speed of sound (i.e. nonlinear elasticity) in a suspension of the UCA canbe higher during compression than during expansion, because of buckling of the lipid shell ofmicrobubbles during compression. Such a compression–expansion asymmetry in the nonlinearelastic behavior of the UCA can also produce CP interaction. Therefore, we hypothesize thatthese effects are additional mechanisms contributing to the efficiency of UCA detection.
3. In vitro demonstration: implementation in an ultrasound scanner and comparisonwith a standard method of contrast agent detection
CP imaging was implemented in an iU22 Philips scanner (Philips Healthcare, Bothell, WA,USA) and compared to AM that is the default method for UCA detection in this system. The
L14 Fast Track Communication
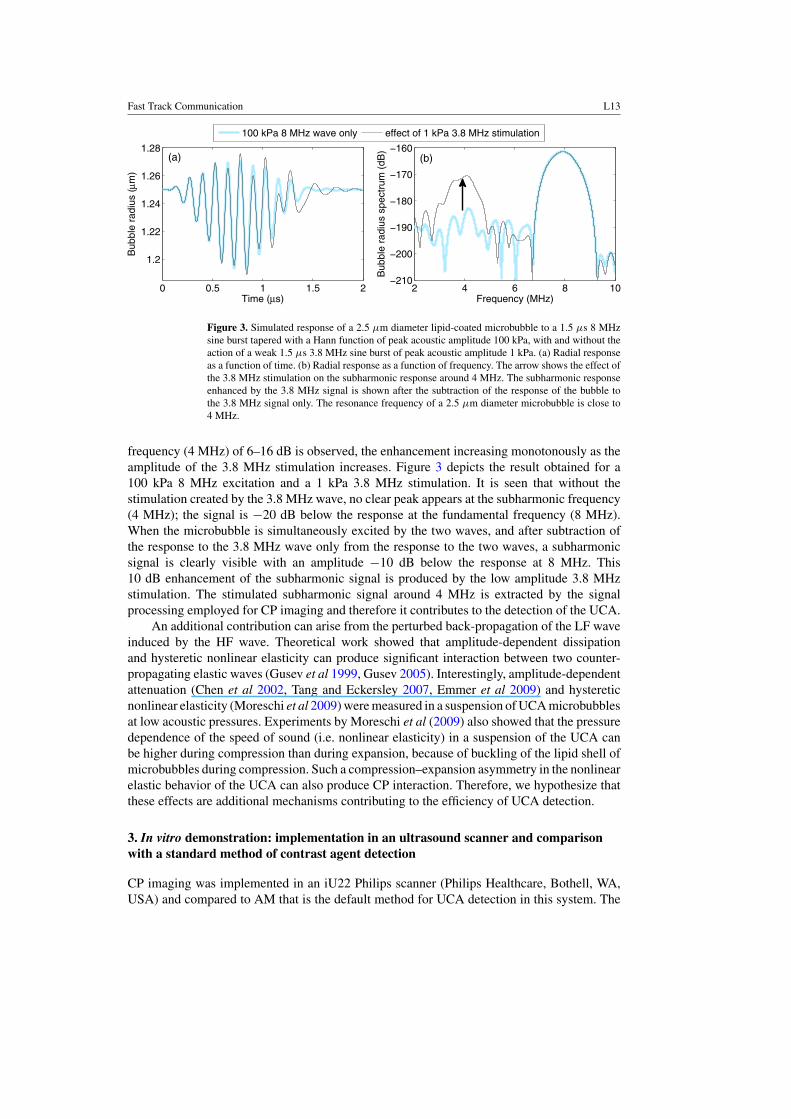
Table 1. Contrast-to-tissue ratio (CTR) and artifact-to-contrast ratio (ACR) measured for theB-mode, counter-propagation (CP) and amplitude modulation (AM).
CTR (dB) ACR (dB)
B-mode 5 −5AM 21 −11CP1 13.5 −13CP2 17.5 −17
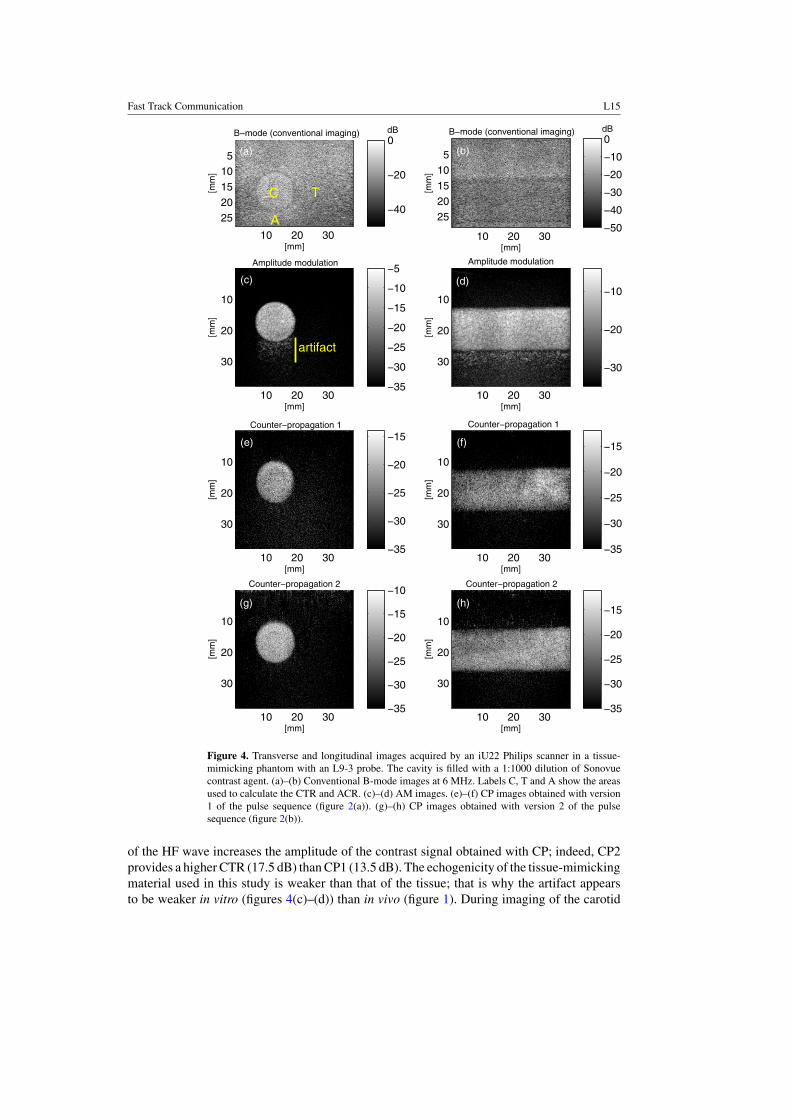
ultrasound system and a L9-3 linear probe (6 MHz center frequency) were employed to acquireimages in a phantom made up of a tissue-mimicking material (Teirlinck et al 1998) containinga 11 mm diameter cylindrical cavity filled with a 1:1000 dilution of Sonovue contrast agent(Bracco SpA., Milan, Italy). CP was performed with a 1.5 μs 3.8 MHz wave and a 1.5 μs8 MHz wave (figure 2). AM was performed by transmitting a 1.3 μs 3.8 MHz wave at fulland half-amplitude in order to retrieve the nonlinear scattering from UCA microbubbles fromthe fundamental frequency (3.8 MHz) to the second harmonic frequency (7.6 MHz). ForCP and AM, the 3.8 MHz wave transmitted by the probe has a peak negative pressure of140 kPa, corresponding to a mechanical index of 0.07 (figures 2(a)–(c)). Such a low peaknegative pressure is commonly used for carotid imaging in order to minimize the destructionof the UCA (ten Kate et al 2012, Thapar et al 2012). CP was tested with two versions, CP1and CP2, of the pulse sequence having an 8 MHz wave with different amplitudes, namelytransmit peak negative pressures of 160 and 360 kPa, corresponding to mechanical indexes of0.06 and 0.12 (figures 2(a)–(b)). The AM image is obtained by the summation of the single-amplitude backscattered signals and subtraction from the double-amplitude backscatteredsignals. The CP image is obtained by the subtraction of reference backscattered signals (noHF wave transmitted) from backscattered signals when the HF wave is transmitted. Then alow-pass frequency filter (cutoff frequency is 6.2 MHz) is applied to suppress the echoesarising from the linear backscattering of the HF wave. For AM and CP, a 160 μs timeinterval is chosen between the transmission of each signal of the pulse sequence. The B-mode image (conventional ultrasound imaging) is performed by transmitting a 0.4 μs pulseat 6 MHz. Figure 4 shows B-mode, AM and CP images obtained in the tissue-mimickingphantom. The pseudo-enhancement due to nonlinear propagation in the UCA is clearly visiblebehind the vessel in the transverse and longitudinal images obtained with AM (figures 4(c)–(d)). With the two versions of CP, no significant enhancement is observed behind the vessel(figures 4(e)–(h)).
In order to compare the performances of AM and the two versions of CP, the maximumamplitude of the signal was calculated in three regions labeled ‘C’ for contrast, ‘T’ fortissue and ‘A’ for tissue located where the artifact appears (figure 4(a)). Then the contrast-to-tissue ratio (CTR, ratio between maximum signal amplitudes in regions C and T) and theartifact-to-contrast ratio (ACR, ratio between maximum signal amplitudes in regions A andC) were computed (table 1). The ACR quantifies the importance of the nonlinear propagationartifact. Although AM provides a better CTR (21 dB) than CP (13.5 dB and 17.5 dB forCP1 and CP2, respectively), AM is dramatically affected by the nonlinear propagation artifact(ACR = −11 dB). An important pseudo-enhancement appears behind the cavity where nocontrast agent is present (figures 4(c)–(d)). As expected, CP is free from artifacts due tononlinear propagation (figures 4(e)–(h)), and the ACR is improved by 6 dB with CP2 comparedto AM. Note that the amplitude of the signals retrieved by CP is smaller than that with AM,but CP images are free from artifacts due to nonlinear propagation. Increasing the amplitude
Fast Track Communication L15
10 20 30
510
15
2025
B−mode (conventional imaging)
[mm]
[mm
]
10 20 30
510
15
2025
B−mode (conventional imaging)
[mm]
[mm
]
10 20 30
10
20
30
Amplitude modulation
[mm]
[mm
]
10 20 30
10
20
30
Amplitude modulation
[mm]
[mm
]
10 20 30
10
20
30
Counter−propagation 1
[mm]
[mm
]
10 20 30
10
20
30
Counter−propagation 1
[mm]
[mm
]
10 20 30
10
20
30
Counter−propagation 2
[mm]
[mm
]
10 20 30
10
20
30
Counter−propagation 2
[mm]
[mm
]
−40
−20
0
−50
−40
−30
−20
−10
0
−35
−30
−25
−20
−15
−10
−5
−30
−20
−10
−35
−30
−25
−20
−15
−35
−30
−25
−20
−15
−35
−30
−25
−20
−15
−10
−35
−30
−25
−20
−15
(b)
(c) (d)
(f)(e)
(h)(g)
(a)
TC
A
artifact
dB dB
Figure 4. Transverse and longitudinal images acquired by an iU22 Philips scanner in a tissue-mimicking phantom with an L9-3 probe. The cavity is filled with a 1:1000 dilution of Sonovuecontrast agent. (a)–(b) Conventional B-mode images at 6 MHz. Labels C, T and A show the areasused to calculate the CTR and ACR. (c)–(d) AM images. (e)–(f) CP images obtained with version1 of the pulse sequence (figure 2(a)). (g)–(h) CP images obtained with version 2 of the pulsesequence (figure 2(b)).
of the HF wave increases the amplitude of the contrast signal obtained with CP; indeed, CP2provides a higher CTR (17.5 dB) than CP1 (13.5 dB). The echogenicity of the tissue-mimickingmaterial used in this study is weaker than that of the tissue; that is why the artifact appearsto be weaker in vitro (figures 4(c)–(d)) than in vivo (figure 1). During imaging of the carotid
L16 Fast Track Communication
2 3 4 5 6 7 8 9 10−35
−30
−25
−20
−15
−10
−5
0
Frequency (MHz)
Ave
rage
d sp
ectr
um in
con
tras
t age
nt (
dB)
(1) 3.8 MHz wave only (2) 3.8 MHz and 8 MHz waves subtraction (1)−(2)
2 3 4 5 6 7 8 9 10−35
−30
−25
−20
−15
−10
−5
0
Frequency (MHz)
Ave
rage
d sp
ectr
um in
tiss
ue (
dB) (b)(a)
cutoff frequencycutoff frequency
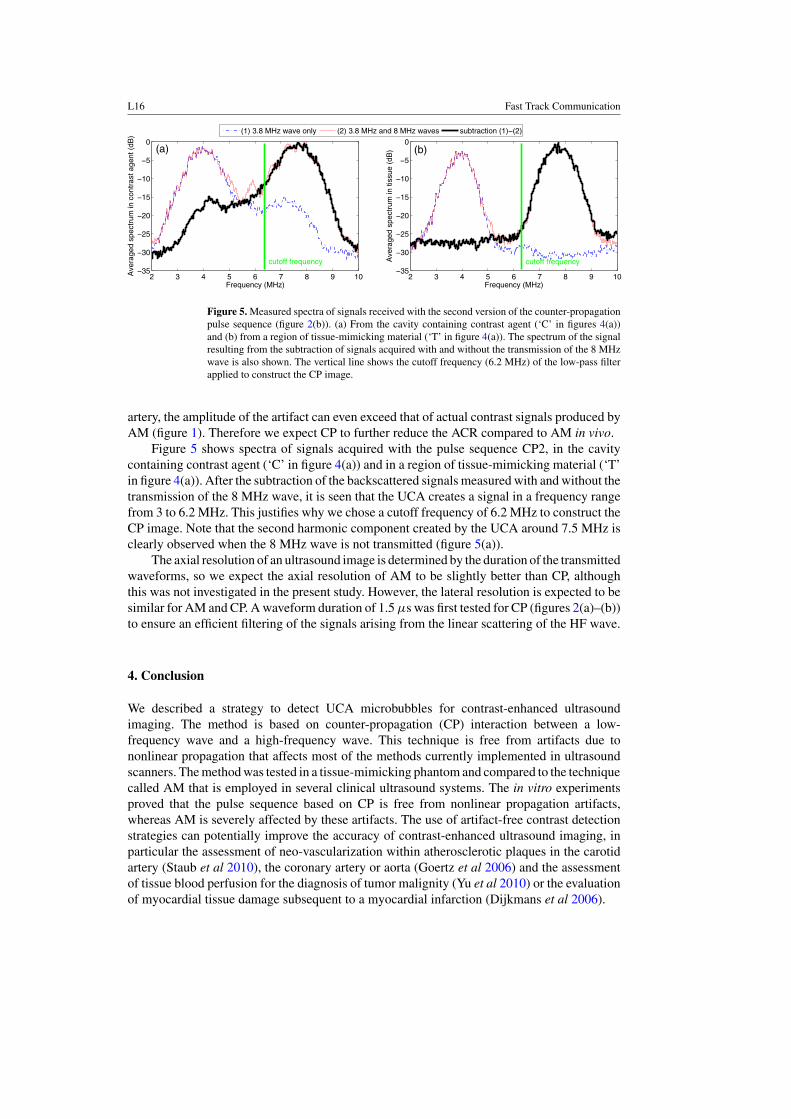
Figure 5. Measured spectra of signals received with the second version of the counter-propagationpulse sequence (figure 2(b)). (a) From the cavity containing contrast agent (‘C’ in figures 4(a))and (b) from a region of tissue-mimicking material (‘T’ in figure 4(a)). The spectrum of the signalresulting from the subtraction of signals acquired with and without the transmission of the 8 MHzwave is also shown. The vertical line shows the cutoff frequency (6.2 MHz) of the low-pass filterapplied to construct the CP image.
artery, the amplitude of the artifact can even exceed that of actual contrast signals produced byAM (figure 1). Therefore we expect CP to further reduce the ACR compared to AM in vivo.
Figure 5 shows spectra of signals acquired with the pulse sequence CP2, in the cavitycontaining contrast agent (‘C’ in figure 4(a)) and in a region of tissue-mimicking material (‘T’in figure 4(a)). After the subtraction of the backscattered signals measured with and without thetransmission of the 8 MHz wave, it is seen that the UCA creates a signal in a frequency rangefrom 3 to 6.2 MHz. This justifies why we chose a cutoff frequency of 6.2 MHz to construct theCP image. Note that the second harmonic component created by the UCA around 7.5 MHz isclearly observed when the 8 MHz wave is not transmitted (figure 5(a)).
The axial resolution of an ultrasound image is determined by the duration of the transmittedwaveforms, so we expect the axial resolution of AM to be slightly better than CP, althoughthis was not investigated in the present study. However, the lateral resolution is expected to besimilar for AM and CP. A waveform duration of 1.5 μs was first tested for CP (figures 2(a)–(b))to ensure an efficient filtering of the signals arising from the linear scattering of the HF wave.
4. Conclusion
We described a strategy to detect UCA microbubbles for contrast-enhanced ultrasoundimaging. The method is based on counter-propagation (CP) interaction between a low-frequency wave and a high-frequency wave. This technique is free from artifacts due tononlinear propagation that affects most of the methods currently implemented in ultrasoundscanners. The method was tested in a tissue-mimicking phantom and compared to the techniquecalled AM that is employed in several clinical ultrasound systems. The in vitro experimentsproved that the pulse sequence based on CP is free from nonlinear propagation artifacts,whereas AM is severely affected by these artifacts. The use of artifact-free contrast detectionstrategies can potentially improve the accuracy of contrast-enhanced ultrasound imaging, inparticular the assessment of neo-vascularization within atherosclerotic plaques in the carotidartery (Staub et al 2010), the coronary artery or aorta (Goertz et al 2006) and the assessmentof tissue blood perfusion for the diagnosis of tumor malignity (Yu et al 2010) or the evaluationof myocardial tissue damage subsequent to a myocardial infarction (Dijkmans et al 2006).
Fast Track Communication L17
Acknowledgments
This research was performed within the framework of CTMM, the Center for TranslationalMolecular Medicine (www.ctmm.nl), project PARISk (grant 01C-202), and supported by theDutch Heart Foundation.
References
Borsboom J, Bouakaz A and de Jong N 2009 Pulse subtraction time delay imaging method for ultrasound contrastagent detection IEEE Trans. Ultrason. Ferroelectr. Freq. Control 56 1151–8
Brock-Fisher G, Poland M and Rafter P 1996 Means for increasing sensitivity in non-linear ultrasound imagingsystems US Patent Specification 5577505
Chen Q, Zagzebski J, Wilson T and Stiles T 2002 Pressure-dependent attenuation in ultrasound contrast agentsUltrasound Med. Biol. 28 1041–51
Chomas J, Dayton P, May D and Ferrara K 2002 Nondestructive subharmonic imaging IEEE Trans. Ultrason.Ferroelectr. Freq. Control 49 883–92
Daeichin V, Faez T, Renaud G, Bosch J, van der Steen A and de Jong N 2012 Effect of self-demodulation on thesubharmonic response of contrast agent microbubbles Phys. Med. Biol. 57 3675
Dijkmans P, Senior R, Becher H, Porter T, Wei K, Visser C and Kamp O 2006 Myocardial contrast echocardiographyevolving as a clinically feasible technique for accurate, rapid, and safe assessment of myocardial perfusion: theevidence so far J. Am. Coll. Cardiol. 48 2168–77
Duck F 1990 Physical Properties of Tissue—A Comprehensive Reference Book (London: Academic)Emmer M, Vos H, Goertz D, van Wamel A, Versluis M and de Jong N 2009 Pressure-dependent attenuation and
scattering of phospholipid-coated microbubbles at low acoustic pressures Ultrasound Med. Biol. 35 102–11Faez T, Emmer M, Docter M, Sijl J, Versluis M and de Jong N 2011 Characterizing the subharmonic response of
phospholipid-coated microbubbles for carotid imaging Ultrasound Med. Biol. 37 958–70Goertz D, Frijlink M, Tempel D, van Damme L A, Krams R, Schaar J, ten Cate F, Serruys P, de Jong N and van
der Steen A W 2006 Contrast harmonic intravascular ultrasound: a feasibility study for vasa vasorum imagingInvest. Radiol. 41 631–8
Gorce J M, Arditi M and Schneider M 2000 Influence of bubble size distribution on the echogenicity of ultrasoundcontrast agents: a study of sonoVue(TM) Invest. Radiol. 35 661–71
Gusev V 2005 Revised theory for the interaction of the counter-propagating acoustic waves in materials with hysteresisof nonlinearity Wave Motion 42 97–108
Gusev V, Bailliet H, Lotton P and Bruneau M 1999 Interaction of counterpropagating acoustic waves in media withnonlinear dissipation and in hysteretic media Wave Motion 29 211–21
Haider B and Chiao R 1999 Micro-ultrasound for preclinical imaging Proc. IEEE Int. Ultrason. Symp. vol 2pp 1527–31
Hansen R and Angelsen B 2011 Contrast imaging by non-overlapping dual frequency band transmit pulse complexesIEEE Trans. Ultrason. Ferroelectr. Freq. Control 58 290–7
Liu J, Wansaicheong G, Merton D, Forsberg F and Goldberg B 2005 Contrast-enhanced ultrasound imaging: state ofthe Art J. Med. Ultrasound 13 109–26
Marmottant P, van der Meer S, Emmer M, Versluis M, de Jong N, Hilgenfeldt S and Lohse D 2005 A model for largeamplitude oscillations of coated bubbles accounting for buckling and rupture J. Acoust. Soc. Am. 118 3499–505
Masoy S E, Standal O, Nasholm P, Johansen T, Angelsen B and Hansen R 2008 SURF imaging: in vivo demonstrationof an ultrasound contrast agent detection technique IEEE Trans. Ultrason. Ferroelectr. Freq. Control 55 1112–21
Moreschi H, Novell A, Calle S, Defontaine M and Bouakaz A 2009 Characterization of nonlinear viscoelasticproperties of ultrasound contrast agents Proc. IEEE Int. Ultrason. Symp. pp 251–4
Novell A, van der Meer S, Versluis M, de Jong N and Bouakaz A 2009 Contrast agent response to chirpreversal: simulations, optical observations, and acoustical verification IEEE Trans. Ultrason. Ferroelectr. Freq.Control 56 1199–206
Renaud G, Bosch J, de Jong N and van der Steen A 2011 In vitro comparative study of the performance of pulsesequences for ultrasound contrast imaging of the carotid artery Proc. IEEE Int. Ultrason. Symp. pp 628–31
Sijl J, Dollet B, Overvelde M, Garbin V, Rozendal T, de Jong N, Lohse D and Versluis M 2010 Subharmonic behaviorof phospholipid-coated ultrasound contrast agent microbubbles J. Acoust. Soc. Am. 128 3239–52
Simpson D, Chin C and Burns P 1999 Pulse inversion Doppler: a new method for detecting nonlinear echoes frommicrobubble contrast agents IEEE Trans. Ultrason. Ferroelectr. Freq. Control 46 372–82
L18 Fast Track Communication
Staub D et al 2010 Contrast-enhanced ultrasound imaging of the vasa vasorum: from early atherosclerosis to theIdentification of Unstable Plaques J. Am. Coll. Cardiol. 3 761–71
Tang M and Eckersley R 2007 Frequency and pressure dependent attenuation and scattering by microbubblesUltrasound Med. Biol. 33 164–8
Tang M, Kamiyama N and Eckersley R 2010 Effects of nonlinear propagation in ultrasound contrast agent imagingUltrasound Med. Biol. 36 459–66
Teirlinck C, Bezemer R, Kollmann C, Lubbers J, Hoskins P, Ramnarine K, Fish P, Fredeldt K and Schaarschmidt U1998 Development of an example flow test object and comparison of five of these test objects, constructed invarious laboratories Ultrasonics 36 653–60
ten Kate G L et al 2012 Far-wall pseudoenhancement during contrast-enhanced ultrasound of the carotid arteries:clinical description and in vitro reproduction Ultrasound Med. Biol. 38 593–600
Thapar A, Shalhoub J, Averkiou M, Mannaris C, Davies A and Leen E 2012 Dose-dependent artifact in the far wallof the carotid artery at dynamic contrast-enhanced ultrasound Radiology 262 672–9
Yu H, Jang H, Kim T, Khalili K, Williams R, Lueck G, Hudson J and Burns P 2010 Pseudoenhancement withinthe local ablation zone of hepatic tumors due to a nonlinear artifact on contrast-enhanced ultrasound Am. J.Roentgenol. 194 653–9
Related Documents