Econ. Theory 4, 41-65 (1994) Economic Theory Springer-Verlag 1994 Cotenancy and competition in an experimental auction market for natural gas pipeline networks* Stephen J. Rassenti t, Stanley S. Reynolds 2, and Vernon L. Smith t 1 Economic Science Laboratory, University of Arizona, Tucson, AZ 85721, USA 2 Department of Economics,University of Arizona, Tucson, AZ 85721, USA Received:December 17, 199t; revised version March 2, 1992 I Introduction This research investigates the use of a "smart" computer-assisted auction mechanism for the allocation of resources within a network of commodity flows. The type of network that we examine has many of the economic properties of the natural gas pipeline industry. In fact this research was originally motivated by specific concerns about the impact of federal regulation on the economic performance of the natural gas industry. However, we believe that the ideas developed here have potential application in other network environments such as electricity generation and transmission, the provision of various transportation and communication services, and scheduling in multiprocessing computing environments) Here are some prominent features of the gas industry: - Its regulation first by the Federal Power Commission, then by the Federal Energy Regulatory Commission (FERC) since the 1930's 2 has been defended on the grounds of pipeline scale economies, market power, and network coordination economies. -Historically all wholesale gas was purchased from pipelines who owned or contracted for wellhead gas; this rigidity obviated the coordination problem without solving it. * This research was supported under a subcontract grant to the Economic Science Laboratory (University of Arizona) from Oak RidgeNational Laboratory under primary contract with the Energy Information Administration. Daniel Alger, Douglas Hale, John Pratt and V. Kerry Smith provided a number of useful suggestionson earlier drafts of this paper. We are indebted to Praveen Kujal, Prashant Marathay, and Shawn LaMaster for assistance in data analysis and charting. 1 Smith (1988) discusses possibilities for deregulation in electric power generation and transmission networks. a Detailedaccountsofthehistoryofregulationinthenaturalgasindustrymaybe foundin Pierce(1988) and Tussing and Barlow(1984).

Welcome message from author
This document is posted to help you gain knowledge. Please leave a comment to let me know what you think about it! Share it to your friends and learn new things together.
Transcript
Econ. Theory 4, 41-65 (1994) Economic Theory
�9 Springer-Verlag 1994
Cotenancy and competition in an experimental auction market for natural gas pipeline networks*
Stephen J. Rassenti t, Stanley S. Reynolds 2, and Vernon L. Smith t 1 Economic Science Laboratory, University of Arizona, Tucson, AZ 85721, USA 2 Department of Economics, University of Arizona, Tucson, AZ 85721, USA
Received: December 17, 199t; revised version March 2, 1992
I Introduction
This research investigates the use of a "smart" computer-assisted auction mechanism for the allocation of resources within a network of commodity flows. The type of network that we examine has many of the economic properties of the natural gas pipeline industry. In fact this research was originally motivated by specific concerns about the impact of federal regulation on the economic performance of the natural gas industry. However, we believe that the ideas developed here have potential application in other network environments such as electricity generation and transmission, the provision of various transportation and communication services, and scheduling in multiprocessing computing environments)
Here are some prominent features of the gas industry:
- Its regulation first by the Federal Power Commission, then by the Federal Energy Regulatory Commission (FERC) since the 1930's 2 has been defended on the grounds of pipeline scale economies, market power, and network coordination economies.
-Historical ly all wholesale gas was purchased from pipelines who owned or contracted for wellhead gas; this rigidity obviated the coordination problem without solving it.
* This research was supported under a subcontract grant to the Economic Science Laboratory (University of Arizona) from Oak Ridge National Laboratory under primary contract with the Energy Information Administration. Daniel Alger, Douglas Hale, John Pratt and V. Kerry Smith provided a number of useful suggestions on earlier drafts of this paper. We are indebted to Praveen Kujal, Prashant Marathay, and Shawn LaMaster for assistance in data analysis and charting. 1 Smith (1988) discusses possibilities for deregulation in electric power generation and transmission networks. a Detailedaccountsofthehistoryofregulationinthenaturalgasindustrymaybe foundin Pierce(1988) and Tussing and Barlow (1984).
42 S.J. Rassenti et al.
- In response to supply inflexibilities and shortages wellhead gas was deregulated in 1978 under the Natural Gas Policy Act, but the potential benefits were blocked by FERC's regulation of pipelines. 3
- By means of Order 436, FERC sought to promote direct bargaining between gas producers and wholesale buyers, 4 thereby 'unbundling' gas from its transportation and promoting competition in both. 5
The research reported here investigates a market mechanism that links gas producers, transporters, and buyers over a network of pipelines. We propose 'smart' computerized dispatch as a solution to the coordination problem by combining the information advantages of decentralized ownership with the coordination advan- tages of central control. There are four main elements of this research.
I Institutional design
Our objective is to develop an exchange mechanism for natural gas pipeline networks that will correct the three most common criticisms of the industry: gas is inefficiently allocated; gas is unfairly priced (e.g., due to "excessive" price discrimination by pipelines); prices are excessively volatile. 6 The exchange mechanism we report on in this paper is called Gas Auction Net. This mechanism can be thought of as a type of uniform-price double auction applied to a network environment. Gas producers and gas transporters make offers indicating their willingness to supply and move gas, respectively. Buyers make bids it~dicating their willingness to pay for delivered gas. Gas Auction Net sets a uniform price at each node of the network based on reported offers and bids.
2 Laboratory experiments
We test and develop our proposed exchange mechanism by using laboratory experiments with human subjects. Laboratory experiments have several advantages:
3 Williams (1985, Chap. 1) discusses wellhead deregulation and the distortions induced by FERC regulation of pipelines. In particular, the "rolled-in pricing" FERC policy for determining maximum delivered gas prices seems to have induced gas pipeline companies to enter into relatNely generous take-or-pay contracts with producers. Williams argues that rolled-in pricing with take-or-pay contracts at high prices distorted economic signals to both producers and consumers. 4 Order 436 also created an optional, expedited certification procedure for regulatory approval of entry of pipelines into new markets. Order 436 was vacated by the U.S. Court of appeals in 1987. The Court of Appeals approved of most of the content of Order 436 but did not approve of FERC's lack of action on take-or-pay contracts. The FERC responded by issuing Order 500 (effective in 1988) which duplicated most of the provisions of Order 436.
Concurrent with the FERC Order, the Energy Information Administration (EIA) was asked by Congressman Dingell to evaluate whether the FERC Order would promote more direct bargains and whether the resulting new structure of natural gas marketing and transportation would have social benefits. EIA answered Congressman Dingell's inquiry within a traditional economic analysis frame- work. One purpose of the research program reported here is to see what answers experimental economics would provide to the safne questions.
These criticisms were brought to our attention by Douglas Hale of the Energy Information Adminis- tration.
Competition in an experimental auction market 43
the cost is low, mistakes are not costly, and incentives and performance can be evaluated under controlled conditions. In addition, laboratory experiments may provide valuable information and insight about the design of subsequent field experiments.
3 "Smart" computer assisted markets
A computerized dispatch center (or, centers) coordinates the simultaneous pricing of well-head gas, delivered gas, and transportation over the network. The center determines prices and allocations over the network based on reported offers and bids for gas and its transportation. The allocation chosen by the center maximizes reported value added for the industry.
4 Cotenancy and competition
A concern sometimes expressed about a deregulated natural gas network is the presence of,monopoly pipeline links in the network. We report on a series of experiments in which monopoly pipeline links are replaced by cotenancy arrange- ments in which several independent agents share the rights to transport gas over a single pipeline link. Such a cotenancy arrangement is similar to observed contractual arrangements in some parts of the natural gas industry where pipeline rights have been acquired by second parties or where a pipeline is a joint venture. We do not address the problem of incentive compatible cost sharing among the cotenants (see Moulin and Shenker 1991 for a second best solution).
The remainder of the paper is organized as follows. Section II discusses alternative market institutions that might be adopted for a deregulated natural gas pipeline network. In Sect. III we describe the real-time double auction process embodied in Gas Auction Net. The network used in the experiments is characterized in Sect. IV. The experimental design is provided by Sect. V. This section focuses on the role of pipeline cotenancy in a deregulated natural gas network. The subject pool and experimental procedures are described in Sect. VI. The experimental results are explained in Sect. VII. Conclusions and suggestions for future research are reported in Sect. VIII.
II Market institutions for production and exchange over a network
Policy-makers for the natural gas industry have made a number of decisions that have deregulated various parts of the industry. At this time, it seems worthwhile to examine how a more market-oriented resource allocation system would perform for a commodity flow network such as the natural gas industry. A question remains about what form competition will take in this less regulated environment and what rules (in addition to standard antitrust rules) will govern this competition. There are clearly several alternative ways in which production and exchange over a network may be accomplished. We discuss some of these below.
44 s.J. Rassenti et al.
1 Bargaining environment
One way to organize exchange would be to permit producers, pipeline transporters, and buyers to negotiate with one another and strike bilateral or, multilateral bargains. These bargains could take the form of short term or longer term contracts. Historically, pipeline companies have typically contracted with producers for purchase of gas, sometimes via long term contracts (some of these contracts have involved take-or-pay clauses). A number of pipeline companies are owners, or joint- owners, of producing wells, so that vertical integration takes the place of some market contracting. Pipeline companies have also made contracts with buyers for delivered gas (generally at regulated rates). Such a contracting system may afford buyers the opportunity to reduce uncertainty by locking in deliveries at a fixed price with a long-term contract.
FERC policies seem to be aimed at providing a role for bargaining in a deregulated, competitive environment. For example, FERC Order 436 encouraged direct bargaining between producers and buyers (e.g., local distributors). Such bargaining would "unbundle" interstate pipelines' transportation services from their storage and brokerage functions. 7
There are, however, potential problems with a competitive system based on bargaining. 8 First, there may be large informational requirements for participants involved in such a bargaining process. For example, a buyer may potentially be able to arrange purchases from a large number of producers, located in several fields. Such a buyer would then have to investigate transportation rates over many possible pipeline segments in order to compare delivered prices. 9 In the language of cooperative games, the large amount of information and communication required for such bargaining may keep agents from reaching a core (efficient) solution. Second, there may be problems with coordinating purchase of gas at a field with transportation. A buyer that negotiates a bilateral contract with a producer may find that the transportation required to deliver the gas is unavailable (e.g., due to full utilization of pipeline capacity on a segment). Such coordination problems had been resolved in the past by having pipelines purchase gas at the field and then contract for deliveries with buyers. However, this regulated system involved
DeCanio (1988) analyzes the effects of Order 436 and the subsequent FERC Order 500 on the contracting system currently in place in the natural gas industry. 8 Laboratory experimental bargaining markets involving a simple network indicated that FERC's concern with pipelines' reactions to transportation requests was well placed (see McCabe et al. 1987, 1988). In the experiments, favorable bargains between producers and wholesale consumers were con- summated. The difficulty was in obtaining the appropriate transportation. In general, the price of transportation services varied widely and erratically over time. As a result transportation and gas were not unbundled in an efficient manner; these experimental bargaining markets failed to coordinate production and transportation of gas efficiently. When price ceilings were imposed to enforce reasonable transportation rates, pipeline charges usually moved to the ceilings. This suggests that a common carrier role for pipelines might not by itself fundamentally change the nature of either the natural gas market or of natural gas industry regulation. 9 For example the Charles River Associates Review (May, 1989) constructs the hypothetical case of a New England LDC (Local Distribution Company) which, after limiting itself to at most two connecting pipelines, finds itself needing to compare 41 alternative transportation routes.
Competition in an experimental auction market 45
numerous difficulties. Evidence from prior laboratory experiments involving a simple network indicates that these coordination problems may be severe and lead to low efficiency (see McCabe et al. 1988).
2 Posted-offer pricing
Exchange over some transportation networks is organized via posted-offer pricing. For example, passenger airline service is provided by airlines that each post a price for each link in the network that they serve, railroads typically post transportation rates for freight hauling (these rates are regulated in many cases), Buyers make purchases subject to availability of transportation service capacity for each route. In a natural gas network, a posted price system might function by having pipelines post prices for transportation (with sales subject to pipeline capacity limits). Buyers and producers could negotiate contracts directly (as described above). Buyers who have acquired rights to produce natural gas would be queued (e.g., randomly) and then buyers at the head of the queue could purchase transpor- tation service from pipelines at their posted prices.
Sharkey (1987) and Haurie and Breton (1985) have analyzed game theoretic models of seller price-setting in a network environment. The analogue of these models for the natural gas network would be to have posted pricing by both producers and pipelines. While these game theoretic pricing models are descriptive of behavior of sellers in some networks, the predicted equilibria may be very inefficient (due to output restrictions resulting from a vertical chain of monopolies, for example).
There are severe potential problems with posted-offer pricing for an environment like the natural gas pipeline network. Many pipeline segments are monopolies or tight oligopolies that have considerable potential market power. In the airline markets, such market power is limited by potential entry. Entry takes more time and involves a greater proportion of sunk costs for natural gas pipelines than for airlines in city-pair markets. On the other hand, there are small numbers of buyers at most nodes in a natural gas network. These buyers may exercise countervailing power if given the opportunity. Posted-offer pricing takes much of that power away from buyers (in contrast to a bargaining or auction setting).
3 Multiple decentralized markets
Another way to implement a competitive production and exchange process would be to establish a system of interrelated, decentralized markets within the network. For example, a market could be established for each of the following: produced gas at each field; transportation services over each pipeline segment, and delivered gas at each consumption node. Plott (1988) reports on a series of laboratory experiments that examined alternative ways in which such a system of decentralized markets inight be organized. One form of market organization studied was a tatonnement process of price adjustment, based on reported excess demands of participants. Such a price adjustment process might correspond to trial and error adjustment of
46 s.J. Rassenti et al.
administered prices by a regulatory agency. The tatonnement process did not perform well in Plott's network experiments; in many market periods, the process failed to converge to a stable price vector. Plott also examined a system of markets with price determined in each market according to a computerized double auction. This type of market organization performed much better than the tatonnement process. For a nine-node competitive network (with 2 agents competing at each part of the network) with experienced subjects, efficiencies converged to between 80 and 90 percent of maximal total surplus. Experiments involving monopolized pipeline segments yielded much lower efficiency.
4 Computer-assisted auction
In McCabe et al. (1989) a new market mechanism was introduced to coordinate resource allocation in an environment such as a natural gas pipeline network. This mechanism (which is called Gas Auction Net) can be thought of as a modified, uniform-price double auction. Agents report bids and offers to a computer dispatch center. The center uses a computer algorithm to allocate resources in a way that maximizes reported gains from trade. In the process, the algorithm specifies a single price at each node in the network (in some sense, the price at a node represents a crossing of supply and demand curves based on offers and bids).
A decentralized, computer-assisted mechanism is also studied by Banks et al. (1989). They analyze a resource allocation problem involving uncertainties in demand and/or supply, unresponsive supplies, and demand indivisibilities. They design and run laboratory experiments that allow the performance of different types of mechanisms to be compared. Computer assistance permits resource allocation to be coordinated more efficiently than in other mechanisms (including a competitive mechanism with multiple markets) in the Banks, Ledyard and Porter environment.
Gas Auction Net is designed so as to address some of the problems with the market exchange processes that were described above. First, recall that coordina- tion problems may arise in a bargaining process, since contracts to purchase gas in the field may not be linked with the ability to transport gas. Gas Auction Net insures that buyers pay only for gas that can be delivered by allocating production and transportation simultaneously in a way that maximizes reported total surplus. Nondiscriminatory prices are used to allocate available pipeline capacity and gas among users and producers. Second, this computerized auction economizes on information. Agents need not invest time and effort learning about many prices and/or potential trades as would be required in a bargaining environment or a multiple market environment. An agent need only be concerned with local prices at the node(s) where his activity takes place. Third, the computerized auction requires fewer traders to be operational than a multiple market mechanism. Convergence to competitive equilibrium prices in a multiple market environment is likely to require several buyers and sellers operating in each individual market.
The next section of this paper describes a modified version of Gas Auction Net that was used in the experiments we report on.
Competition in an experimental auction market 47
III A real time double auction for natural gas networks
For the present study, we have developed a computer assisted continuous real time version of the uniform-price double auction for application to the complex interdependencies characteristic of natural gas pipeline networks. In the standard multiple unit double auction used on the organized commodity exchanges, buyers announce bids, sellers announce offers and buyers and sellers are sequentially matched in trades whenever a buyer accepts a seller's offer or a seller accepts a buyer's bid. In the natural gas market in addition to wholesale buyers we have two kinds of sellers: well-head gas producers and pipeline transporters. In this framework buyers are only interested in gas that can be delivered to their city gates. Consequently, the market mechanism should have the capability of bundling gas with its transportation by matching buyers and producers of gas with the most economical transportation route that connects them. If the gas is homogeneous, which particular buyers and sellers are matched will be a matter of indifference to the participants, as long as the best price is available to all. Consequently, the computer algorithm matches them to maximize the gains from exchange that are realizable given the bid and offer schedule of all participants. The characteristic features of this multiple arc-node double auction as we have implemented it in the experiments are as follows:
1. Location-specific bid schedules of the form [(Pl,ql), (Pz,qz), Pi-->P2], a two-step nonincreasing price-quantity schedule for each buyer, can be entered any time during the auction period. However, once a bid schedule has been entered it can only be altered by raising the bid price and/or increasing the specified quantity. Any number of such improved bids, may be made during the auction period.
2. Location-specific price offer schedules of the form [(Pi, qi), (P2, q2); Pl ~ P2], a two-step nondecreasing price-quantity schedule for each producer, can be entered any time during the auction period. Once entered the offer can be improved as often as desired during the period by lowering the offer price and/or increasing the quantity offer specified.
3. Pipeline owners also submit arc or leg-specific offer schedules of transporta- tion capacity; a two-step nondecreasing price-quantity schedule for each segment in their transportation system. At any time in the auction period these offers can be improved by lowering an offer price and/or increasing the specified capacity offer. However, pipelines may not withhold any part of the base or normal capacity on any pipeline; only the override or peaking capacity may be withheld. This restriction 'is motivated by the assumption that some such limited regulation would carry over from the current regulatory process. Pipelines were also subject to ceiling prices on each segment of the network, but in the experiments reported below these ceilings were not binding. Pipeline competition tended to keep transportation rates well below those ceiling levels. (Both the price ceilings and the prohibition on with- holding base capacity were suggested by our FERC colleagues at the inception of this study).
4. As bids and offers for gas, and offers of transportation, are entered in real time a linear programming algorithm optimally "matches" the highest value bids for delivered gas with the lowest offers for delivered gas. An offer for a unit of
48 S.J. Rassenti et al.
delivered gas consists of a producer's offer for the unit plus the offer(s) of the pipeline operator(s) for transportation. The resulting nondiscriminatory prices at each node in the network and gas flows on all arcs in the network are updated with each new bid or offer or each new improvement in a standing bid or offer. This real time market mechanism differs from the discrete-time version of Gas Auction Net reported on in McCabe et al. We used a (real time) iterative process within each period because we thought that this process would provide subjects with more information about prices and would yield more rapid convergence in the network compared to a discrete time process. Banks et al. (1989) explain the role of an iterative process in their complex experimental environment:
".. . in an environment in which the bases for common knowledge are little understood or controlled, iterations with commitment allow subjects to 'feel their way' in a manner in which. . , one shot auctions do not. ''1~
The commitment that we require is that a change in a bid or offer must improve upon the subject's last bid or offer.
5. This price-allocation generalization of the double auction is a quasi- tatonnement (tentative contract) process in that the allocations and prices become finally binding only at the end of each auction period. Any bid or offer, once entered, is potentially binding, i.e. the entered bid or offer cannot be withdrawn and can only be improved. Such a bid or offer may, however, be "bested," even after it is accepted, by competing bids or offers during the auction period and thereby be replaced. In such cases the bid or offer must be improved if it is to reacquire accepted standing in the tentative allocation process. Similarly, an entered bid or offer, which is initially not accepted, may later be accepted, if changes elsewhere in the network move the market down or up sufficiently to include the standing bid or offer.
6. At each instant after at least one bid and offer has been entered at various nodes and arcs, a price is determined at each node in the network. A trade can be tentatively consummated by any buyer at a node by entering a price bid that is above the price at this node. A seller at any node can make a trade by entering a price offer that is below the price at this node. Similarly a pipeline can make a trade by entering a price offer that is less than the difference in the prices between any two nodes. These auctions correspond to accepting a standing bid or offer in stock or commodity exchange trading using the oral double auction. (A new version of the program will allow agents to accept standing bids or offers at their nodes making the mechanism truly a uniform price double auction). The difference is that until the current auction period ends the trades are always potentially, but not certain to be, binding.
7. At the end of each auction period, an allocation is made with all accepted bids and offers binding at the final standing prices at each node; gas flows are determined by the corresponding accepted quantities of gas and of pipeline
to Banks et al. (1989, p. 15).
Competition in an experimental auction market 49
transportation capacity rights.11 A new auction period begins immediately and the center awaits the entry of new bids and offers.
IV The network
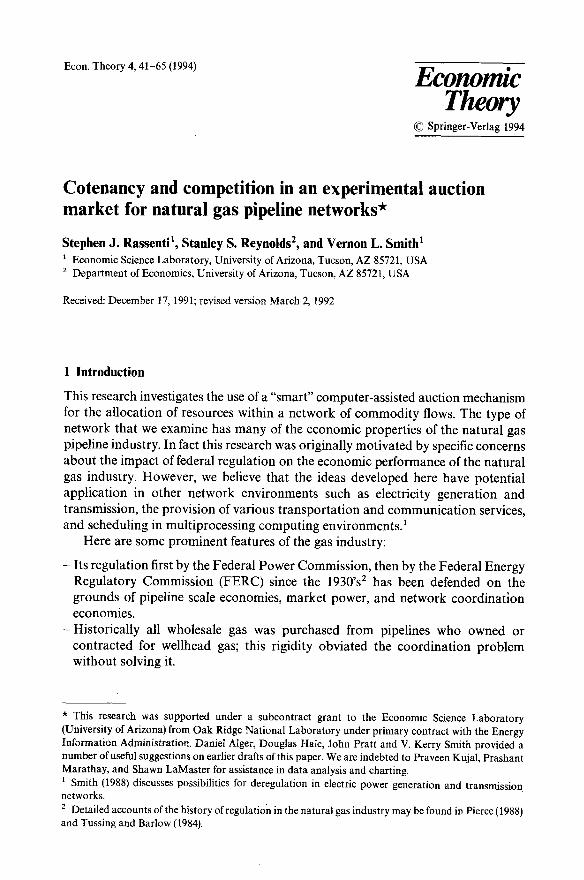
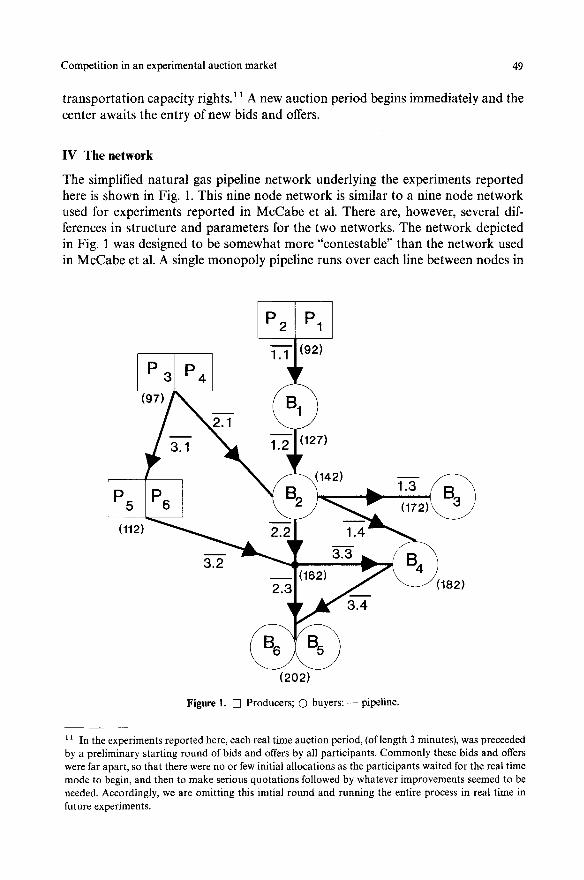
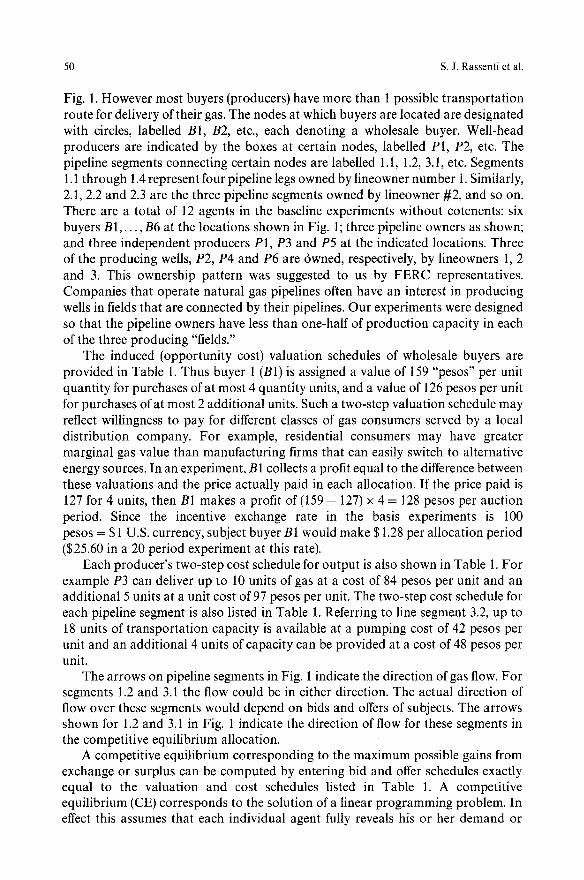
The simplified natural gas pipeline network underlying the experiments reported here is shown in Fig. 1. This nine node network is similar to a nine node network used for experiments reported in McCabe et al. There are, however, several dif- ferences in structure and parameters for the two networks. The network depicted in Fig. 1 was designed to be somewhat more "contestable" than the network used in McCabe et al. A single monopoly pipeline runs over each line between nodes in
P2 I P1 1.1, (92)
(97)
3.1
2.1
\ (112) ~ 2.2
3.2
2.3
127)
\(142)
1.4
r 3.3
(162)
3.4
1.3 m
(172
182)
(202)
Figure 1. [] Producers; 0 b u y e r s ; - pipeline.
11 In the experiments reported here, each real time auction period, (of length 3 minutes), was preceeded by a preliminary starting round of bids and offers by all participants. Commonly these bids and offers were far apart, so that there were no or few initial allocations as the participants waited for the real time mode to begin, and then to make serious quotations followed by whatever improvements seemed to be needed. Accordingly, we are omitting this initial round and running the entire process in real time in future experiments.
50 S.J. Rassenti et al.
Fig. 1. However most buyers (producers) have more than 1 possible transportation route for delivery of their gas. The nodes at which buyers are located are designated with circles, labelled B1, B2, etc., each denoting a wholesale buyer. Well-head producers are indicated by the boxes at certain nodes, labelled P1, P2, etc. The pipeline segments connecting certain nodes are labelled 1.1, 1.2, 3.1, etc. Segments 1.1 through 1.4 represent four pipeline legs owned by lineowner number 1. Similarly, 2.1, 2.2 and 2.3 are the three pipeline segments owned by lineowner #2, and so on. There are a total of 12 agents in the baseline experiments without cotenents: six buyers B1 . . . . , B6 at the locations shown in Fig. 1; three pipeline owners as shown; and three independent producers P1, P3 and P5 at the indicated locations. Three of the producing wells, P2, P4 and P6 are 6wned, respectively, by lineowners 1, 2 and 3. This ownership pattern was suggested to us by FERC representatives. Companies that operate natural gas pipelines often have an interest in producing wells in fields that are connected by their pipelines. Our experiments were designed so that the pipeline owners have less than one-half of production capacity in each of the three producing "fields."
The induced (opportunity cost) valuation schedules of wholesale buyers are provided in Table 1. Thus buyer 1 (B1) is assigned a value of 159 "pesos" per unit quantity for purchases of at most 4 quantity units, and a value of 126 pesos per unit for purchases of at most 2 additional units. Such a two-step valuation schedule may reflect willingness to pay for different classes of gas consumers served by a local distribution company. For example, residential consumers may have greater marginal gas value than manufacturing firms that can easily switch to alternative energy sources. In an experiment, B1 collects a profit equal to the difference between these valuations and the price actually paid in each allocation. If the price paid is 127 for 4 units, then B1 makes a profit of ( 1 5 9 - 127) x 4 = 128 pesos per auction period. Since the incentive exchange rate in the basis experiments is I00 pesos = $1 U.S. currency, subject buyer B1 would make $1.28 per allocation period ($25.60 in a 20 period experiment at this rate).
Each producer's two-step cost schedule for output is also shown in Table 1. For example P3 can deliver up to 10 units of gas at a cost of 84 pesos per unit and an additional 5 units at a unit cost of 97 pesos per unit. The two-step cost schedule for each pipeline segment is also listed in Table 1. Referring to line segment 3.2, up to 18 units of transportation capacity is available at a pumping cost of 42 pesos per unit and an additional 4 units of capacity can be provided at a cost of 48 pesos per unit.
The arrows on pipeline segments in Fig. 1 indicate the direction of gas flow. For segments 1.2 and 3.1 the flow could be in either direction. The actual direction of flow over these segments would depend on bids and offers of subjects. The arrows shown for 1.2 and 3.1 in Fig. 1 indicate the direction of flow for these segments in the competitive equilibrium allocation.
A competitive equilibrium corresponding to the maximum possible gains from exchange or surplus can be computed by entering bid and offer schedules exactly equal to the valuation and cost schedules listed in Table 1. A competitive equilibrium (CE) corresponds to the solution of a linear programming problem. In effect this assumes that each individual agent fully reveals his or her demand or
Competition in an experimental auction market 51
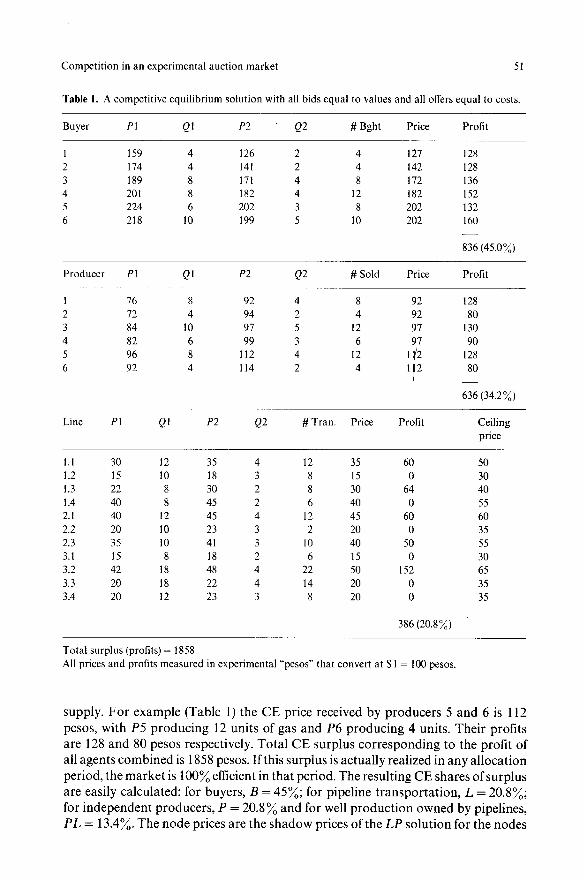
Table 1. A competitive equilibrium solution with all bids equal to values and all offers equal to costs.
Buyer P1 Q1 P2 Q2 # Bght Price Profit
1 159 4 126 2 4 127 128 2 174 4 141 2 4 142 128 3 189 8 171 4 8 172 136 4 201 8 182 4 12 182 152 5 224 6 202 3 8 202 132 6 218 10 199 5 10 202 160
836 (45.0 ~o)
Producer Pl Q1 P2 Q2 # Sold Price Profit
1 76 8 92 4 8 92 128 2 72 4 94 2 4 92 80 3 84 l0 97 5 12 97 130 4 82 6 99 3 6 97 90 5 96 8 112 4 12 1[; 128 6 92 4 114 2 4 112 80
636 (34.2~o)
Line PI Q1 P2 Q2 # Tran. Price Profit Ceiling price
1.1 30 12 35 4 12 35 60 50 1.2 15 10 18 3 8 15 0 30 1.3 22 8 30 2 8 30 64 40 1.4 40 8 45 2 6 40 0 55 2.1 40 12 45 4 12 45 60 60 2.2 20 10 23 3 2 20 0 35 2.3 35 10 41 3 10 40 50 55 3.1 15 8 18 2 6 15 0 30 3.2 42 18 48 4 22 50 152 65 3.3 20 18 22 4 14 20 0 35 3.4 20 12 23 3 8 20 0 35
386 (20.8 ~o)
Total surplus (profits) = 1858 All prices and profits measured in experimental "pesos" that convert at $1 = 100 pesos.
supply . F o r e x a m p l e (Tab le 1) the C E pr ice r ece ived by p r o d u c e r s 5 a n d 6 is 112
pesos , wi th P5 p r o d u c i n g 12 uni ts of gas and P6 p r o d u c i n g 4 units . T h e i r prof i t s
a re 128 and 80 pesos respec t ive ly . T o t a l C E surp lus c o r r e s p o n d i n g to the prof i t of
all agen t s c o m b i n e d is 1858 pesos. If this su rp lus is ac tua l ly rea l i zed in any a l l o c a t i o n
per iod , the m a r k e t is 100~o efficient in t ha t per iod . T h e resu l t ing C E shares o f su rp lus
are easi ly ca lcu la ted : for buyers , B = 45~o; for p ipe l ine t r a n s p o r t a t i o n , L = 20.8~o;
for i n d e p e n d e n t p r o d u c e r s , P = 20.8 ~o a n d for well p r o d u c t i o n o w n e d by pipel ines ,
PL = 13.4~o. T h e n o d e pr ices are the s h a d o w pr ices o f the LP s o l u t i o n for the n o d e s
52 s.J. Rassenti et al.
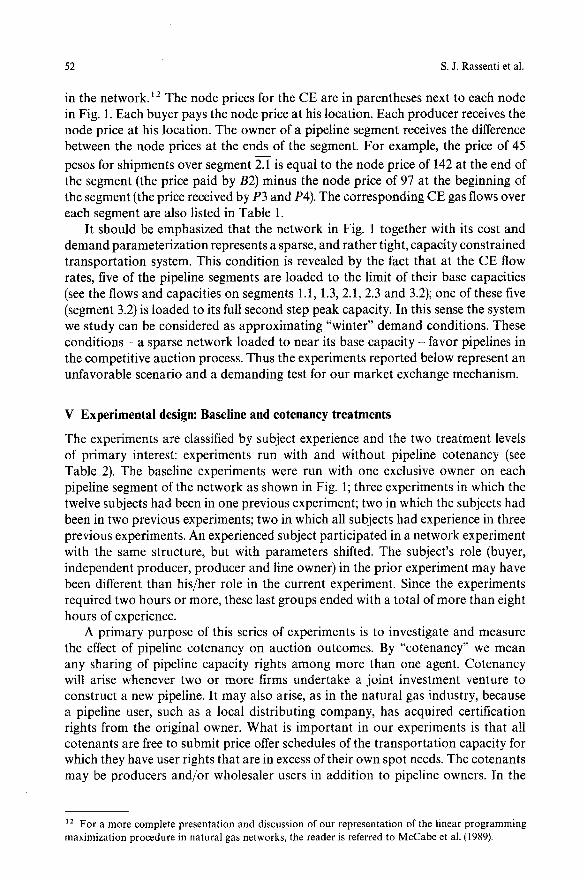
in the network, lz The node prices for the CE are in parentheses next to each node in Fig. 1. Each buyer pays the node price at his location. Each producer receives the node price at his location. The owner of a pipeline segment receives the difference between the node prices at the ends of the segment. For example, the price of 45
pesos for shipments over segment 2.1 is equal to the node price of 142 at the end of the segment (the price paid by B2) minus the node price of 97 at the beginning of the segment (the price received by P3 and P4). The corresponding CE gas flows over each segment are also listed in Table 1.
It should be emphasized that the network in Fig. 1 together with its cost and demand parameterization represents a sparse, and rather tight, capacity constrained transportation system. This condition is revealed by the fact that at the CE flow rates, five of the pipeline segments are loaded to the limit of their base capacities (see the flows and capacities on segments 1.1, 1.3, 2.1, 2.3 and 3.2); one of these five (segment 3.2) is loaded to its full second step peak capacity. In this sense the system we study can be considered as approximating "winter" demand conditions. These conditions - a sparse network loaded to near its base capacity - favor pipelines in the competitive auction process. Thus the experiments reported below represent an unfavorable scenario and a demanding test for our market exchange mechanism.
V Experimental design: Baseline and cotenancy treatments
The experiments are classified by subject experience and the two treatment levels of primary interest: experiments run with and without pipeline cotenancy (see Table 2). The baseline experiments were run with one exclusive owner on each pipeline segment of the network as shown in Fig. 1; three experiments in which the twelve subjects had been in one previous experiment; two in which the subjects had been in two previous experiments; two in which all subjects had experience in three previous experiments. An experienced subject participated in a network experiment with the same structure, but with parameters shifted. The subject's role (buyer, independent producer, producer and line owner) in the prior experiment may have been different than his/her role in the current experiment. Since the experiments required two hours or more, these last groups ended with a total of more than eight hours of experience.
A primary purpose of this series of experiments is to investigate and measure the effect of pipeline cotenancy on auction outcomes. By "cotenancy" we mean any sharing of pipeline capacity rights among more than one agent. Cotenancy will arise whenever two or more firms undertake a joint investment venture to construct a new pipeline. It may also arise, as in the natural gas industry, because a pipeline user, such as a local distributing company, has acquired certification rights from the original owner. What is important in our experiments is that all cotenants are free to submit price offer schedules of the transportation capacity for which they have user rights that are in excess of their own spot needs. The cotenants may be producers and/or wholesaler users in addition to pipeline owners. In the
~2 For a more complete presentation and discussion of our representation 0f the linear programming maximization procedure in natural gas networks, the reader is referred to McCabe et al. (1989).
Competition in an experimental auction market
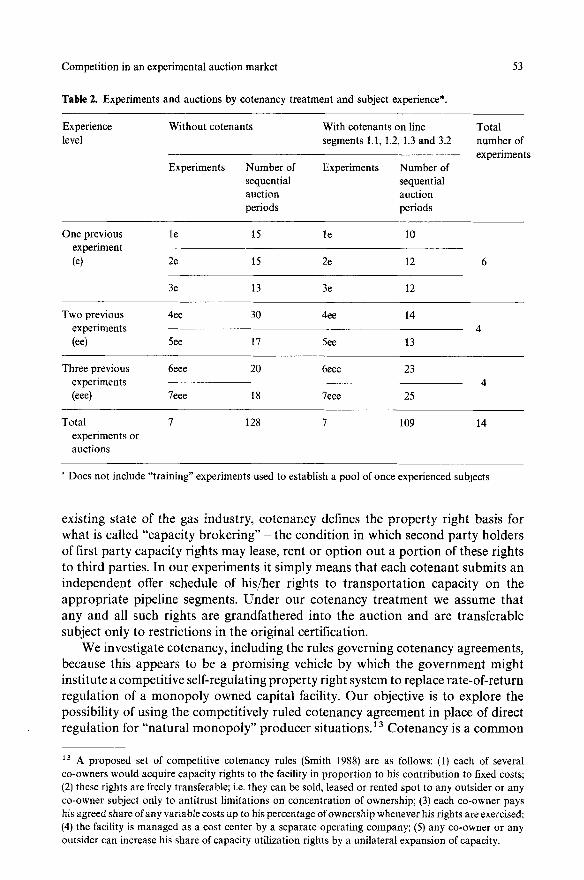
Table 2. Experiments and auctions by cotenancy treatment and subject experience*.
53
Experience Without cotenants level
With cotenants on line segments 1.1, 1.2, 1.3 and 3.2
Experiments Number of Experiments Number of sequential sequential auction auction periods periods
Total number of experiments
One previous le 15 le I0 experiment (e) 2e 15 2e 12
3e 13 3e 12
Two previous 4ee 30 4ee 14 experiments (ee) 5ee 17 5ee 13
Three previous 6eee 20 6eee 23 experiments (eee) 7eee 18 7eee 25
Total experiments or auctions
7 128 7 109 14
Does not include "training" experiments used to establish a pool of once experienced subjects
exist ing s tate of the gas industry , co tenancy defines the p r o p e r t y r ight basis for wha t is called "capac i ty b roker ing" - the cond i t ion in which second pa r ty holders of first pa r ty capac i ty r ights m a y lease, rent or op t ion out a po r t i on of these r ights to th i rd part ies. In our exper iments it s imply means tha t each co tenan t submits an independen t offer schedule of his /her r ights to t r a n s p o r t a t i o n capac i ty on the a p p r o p r i a t e pipel ine segments. U n d e r our co tenancy t r ea tment we assume tha t any and all such rights are g randfa the red into the auc t ion and are t ransferable subject only to res t r ic t ions in the or iginal certif ication.
We invest igate cotenancy, inc luding the rules govern ing co tenancy agreements , because this appea r s to be a p romis ing vehicle by which the gove rnmen t might inst i tute a compet i t ive self-regulat ing p r o p e r t y right system to replace ra te-of - re turn regula t ion of a m o n o p o l y owned capi ta l facility. O u r object ive is to explore the poss ibi l i ty of using the compet i t ive ly ruled co tenancy agreement in place of direct regula t ion for "na tu ra l m o n o p o l y " p r o d u c e r situations.13 Co tenancy is a c o m m o n
13 A proposed set of competitive cotenancy rules (Smith 1988) are as follows: (1) each of several co-owners would acquire capacity rights to the facility in proportion to his contribution to fixed costs; (2) these rights are freely transferable; i.e. they can be sold, leased or rented spot to any outsider or any co-owner subject only to antitrust limitations on concentration of ownership; (3) each co-owner pays his agreed share of any variable costs up to his percentage of ownership whenever his rights are exercised; (4) the facility is managed as a cost center by a separate operating company; (5) any co-owner or any outsider can increase his share of capacity utilization rights by a unilateral expansion of capacity.
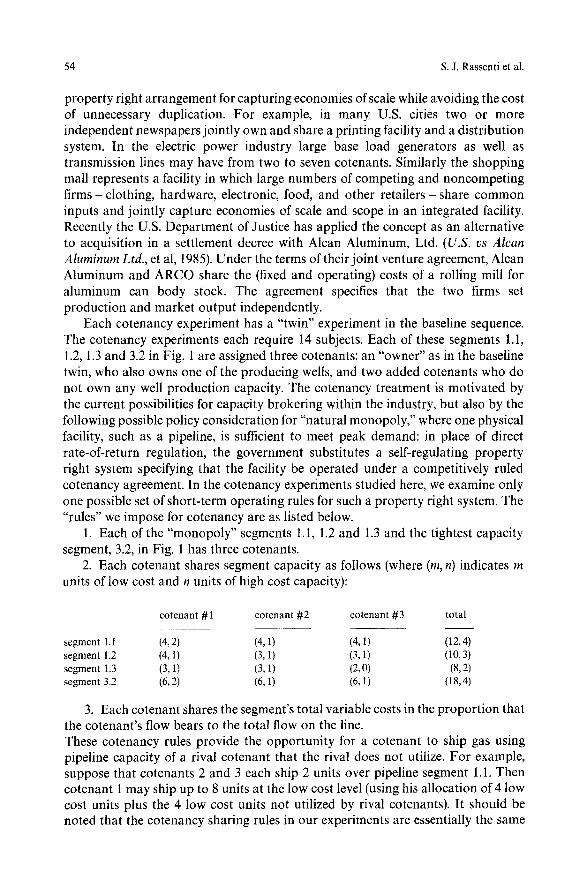
54 s.J. Rassenti et al.
property right arrangement for capturing economies of scale while avoiding the cost of unnecessary duplication. For example, in many U.S. cities two or more independent newspapers jointly own and share a printing facility and a distribution system. In the electric power industry large base load generators as well as transmission lines may have from two to seven cotenants. Similarly the shopping mall represents a facility in which large numbers of competing and noncompeting f i rms- clothing, hardware, electronic, food, and other retai lers- share common inputs and jointly capture economies of scale and scope in an integrated facility. Recently the U.S. Department of Justice has applied the concept as an alternative to acquisition in a settlement decree with Alcan Aluminum, Ltd. (U.S. vs Alcan Aluminum Ltd., et al, 1985). Under the terms of their joint venture agreement, Alcan Aluminum and ARCO share the (fixed and operating) costs of a rolling mill for aluminum can body stock. The agreement specifies that the two firms set production and market output independently.
Each cotenancy experiment has a "twin" experiment in the baseline sequence. The cotenancy experiments each require 14 subjects. Each of these segments 1.1, 1.2, 1.3 and 3.2 in Fig. 1 are assigned three cotenants: an "owner" as in the baseline twin, who also owns one of the producing wells, and two added cotenants who do not own any well production capacity. The cotenancy treatment is motivated by the current possibilities for capacity brokering within the industry, but also by the following possible policy consideration for "natural monopoly," where one physical facility, such as a pipeline, is sufficient to meet peak demand: in place of direct rate-of-return regulation, the government substitutes a self-regulating property right system specifying that the facility be operated under a competitively ruled cotenancy agreement. In the cotenancy experiments studied here, we examine only one possible set of short-term operating rules for such a property right system. The "rules" we impose for cotenancy are as listed below.
1. Each of the "monopoly" segments 1.1, 1.2 and 1.3 and the tightest capacity segment, 3.2, in Fig. 1 has three cotenants.
2. Each cotenant shares segment capacity as follows (where (m, n) indicates m units of low cost and n units of high cost capacity):
cotenant # 1 cotenant #2 cotenant #3 total
segment I.I (4, 2) (4,1) (4, 1) (12, 4) segment 1.2 (4,1) (3,1) (3,1) (10, 3) segment 1.3 (3,1) (3, 1) (2, 0) (8, 2) segment 3.2 (6,2) (6, 1) (6, I) (18,4)
3. Each cotenant shares the segment's total variable costs in the proportion that the cotenant's flow bears to the total flow on the line. These cotenancy rules provide the opportunity for a cotenant to ship gas using pipeline capacity of a rival cotenant that the rival does not utilize. For example, suppose that cotenants 2 and 3 each ship 2 units over pipeline segment 1.1. Then cotenant 1 may ship up to 8 units at the low cost level (using his allocation of 4 low cost units plus the 4 low cost units not utilized by rival cotenants). It should be noted that the eotenancy sharing rules in our experiments are essentially the same
Competition in an experimental auction market 55
as the joint venture rules accepted by Alcan Aluminum and ARCO in the U.S. vs. Alcan (1985) consent decree.
VI Subjects and experimental procedure
All subjects were voluntary recruits from the undergraduate student body at the University of Arizona. Each subject received three dollars "up front" for arriving on time, and was paid his/her profits earned in cash at the end of the experiment. The payouts varied from 5 dollars to 60 dollars per subject. All experimental earnings are denominated in "pesos", which are then converted into U.S. dollars at a fixed rate: $1 U.S. = 100 pesos.
All experiments used the Plato computer system. Subjects were instructed using Plato and the computer enforced the bid-offer rules, e.g. each agent could submit any two price-quantity messages, which could then only be improved during an auction period, and capacity limits could not be violated. Initially, subjects were randomly assigned to an agent type - independent producer, wholesale buyer or pipeline owner. Subjects read through the instructions at their own pace. The complete instructions are available from the authors upon request. The following excerpt from the instructions describes to subjects the pricing and allocation procedures employed in the experiments.
"In most cases, the total quantity of natural gas demanded cannot be delivered at prices which buyers are willing to pay. Therefore, it becomes necessary to allocate the available supply of appropriately priced natural gas to the various buyers. This allocation is done by the Economic Dispatch Center (EDC).
The EDC collects from all agents their willingness to produce, transport and purchase natural gas. Using this information the EDC will attempt to determine the most efficient way to satisfy current demand given the available supply of natural gas in the network. The EDC's goal is to:
1. satisfy the demand for delivered natural gas by ordering buyers according to the willingness to pay which they submitted; and
2. supply that natural gas in the least costly manner by ordering the producers and pipeline owners according to the offers to produce and transport which they submitted.
In this market, the higher the price submitted by a buyer, the more likely it is that this buyer will actually purchase some natural gas. Correspondingly, the lower the producer's or pipeline owner's offer, the more likely it is that they will sell or transport some natural gas.
However, location in the network also plays a role in determining the efficient allocation of delivered gas. For example, two buyers may submit the same bid but only one of them may be accepted because he faces lower production or transpor- tation charges. Producers and pipeline owners face similar location dependent outcomes. Hence, the bids and offers submitted by the agents along with each agent's location in the market will be the two factors considered by the EDC in deter- mining which agents produce, transport and purchase natural gas in the network.
�9 .. After all producers, pipeline owners and buyers have submitted their willing-
56 S.J. Rassenti et al.
ness to produce, transport and purchase units of natural gas the EDC will then have the information it needs to determine the allocation of natural gas and the equilibrium price of delivered natural gas. The price of delivered natural gas paid by the buyers equals the price of production plus the price to transport units of natural gas."
After completing the instructions, and having any questions answered, inex- perienced subjects were put through a one-period trial of the experiment. After this trial, subjects were asked to verify their understanding of their private information and profit reports in view of the network solution and their decisions. Any new questions were answered and the experiment was begun.
Inexperienced subjects could rarely complete more than 6-8 trading periods in the time remaining after the instructions were completed. Experienced subjects were able to complete up to 15 periods in a two hour session, while twice and three times experienced subjects completed as many as 30 periods of trading in two hours.
VII Results from the network experiments
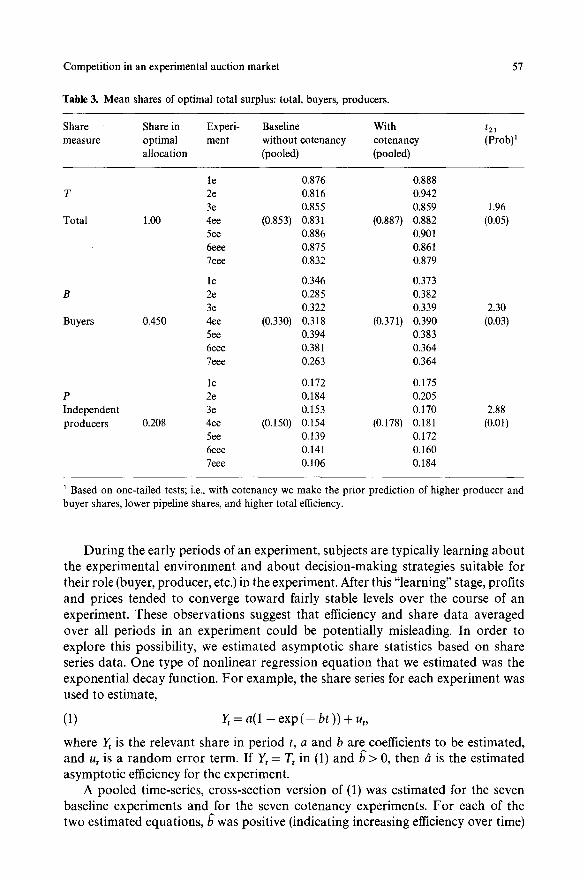
Each experiment yields observations on the share of optimal total surplus earned by all subjects, Tt, the share earned by buyers, Bt, the share earned by independent producers, P, the share earned by line owners as transporters, L~, and the share earned by line owners as producers, PLt, for each auction period ~, t = 1 .... , N (N varies across experiments). In particular, T~ measures actual efficiency in period t of an experiment in terms of the ratio of actual surplus in t to maximum possible surplus (1858 pesos). Each of these dynamic share series for an experiment is reduced to a single observation measured as the mean of the series for the experiment.
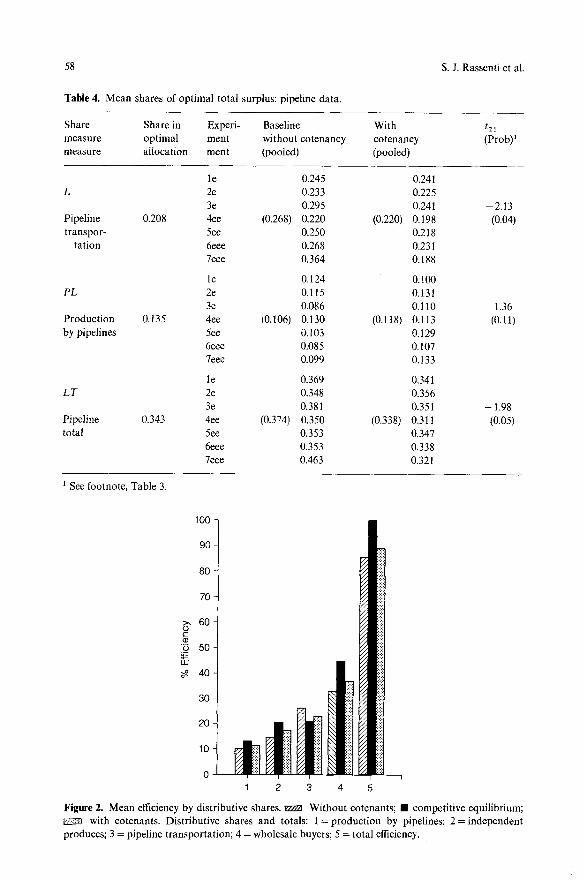
Tables 3 and 4 list the mean shares for each of the fourteen experiments we report: seven experiments without the use of cotenants (column 1), and seven experiments with cotenants (column 2). Comparing columns 1 and 2 the effect of the cotenancy treatment is to increase total market efficiency, increase the buyer's and producer's (both independent and pipeline owned) share of surplus, and lower the share of surplus received by pipelines. In the case of pipeline production, cotenancy enhances their (suboptimal) profits from wells but not enough to compen- sate for the decline in the overall profitability of pipelines.
The last column in Tables 3 and 4 provides a t-test of the hypothesis that the observed differences between the share measures in columns 1 and 2 are statistically different than zero. The probability measures reported are based on one-tailed tests for total efficiency and for the shares of buyers, producers and pipelines because the a priori hypothesis motivating the cotenancy experiments was that the overall gains from exchange would be increased, and its composition shifted away from pipeline transportation toward producers and buyers. Except for production by pipelines, these efficiency and share differences are all significant at a type I error probability of 5~o or less.
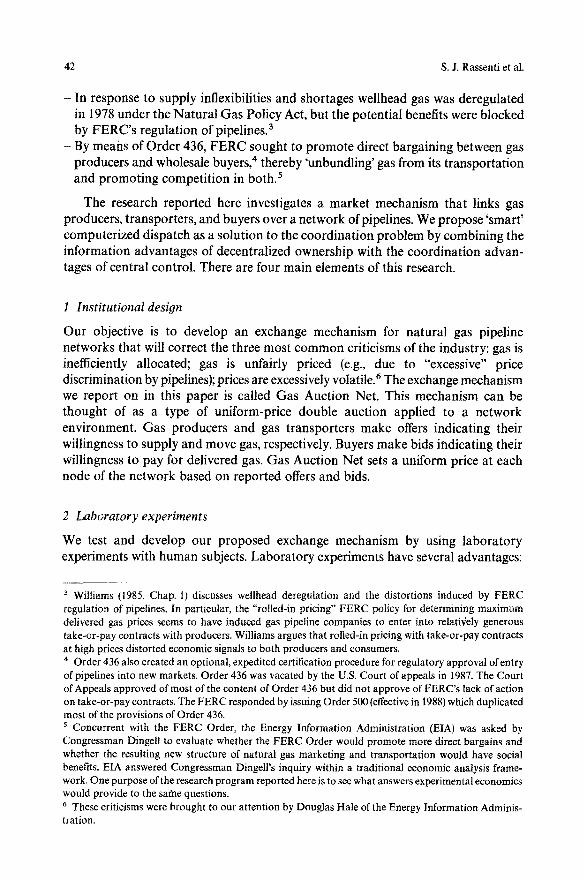
Figure 2 contains a bar chart comparing the component distributive shares and total efficiency for each of the two cotenancy treatment conditions with the ideal competitive equilibrium shares and efficiency.
Competition in an experimental auction market
Table 3. Mean shares of optimal total surplus: total, buyers, producers.
57
Share Share in Expe r i - Baseline With t21 measure optimal ment without cotenancy cotenancy (Prob) 1
allocation (pooled) (pooled)
T
Total
B
Buyers
P Independent producers
le 0.876 0.888 2e 0.816 0.942 3e 0.855 0.859 1.96
1.00 4ee (0.853) 0.831 (0.887) 0.882 (0.05) 5ee 0.886 0.901 6eee 0.875 0.861 7eee 0.832 0.879
le 0.346 0.373 2e 0.285 0.382 3e 0.322 0.339 2.30
0.450 4ee (0.330) 0.318 (0.371) 0.390 (0.03) 5ee 0.394 0.383 6eee 0.381 0.364 7eee 0.263 0.364
le 0.172 0.175 2e 0.184 0.205 3e 0.153 0.170 2.88
0.208 4ee (0.150) 0.154 (0.178) 0.181 (0.01) 5ee 0.139 0.172 6eee 0.141 0.160 7eee 0.106 0.184
1 Based on one-tailed tests; i.e., with cotenancy we make the prior prediction of higher producer and buyer shares, lower pipeline shares, and higher total efficiency.
Dur ing the early periods of an experiment, subjects are typically learning about the experimental environment and about decision-making strategies suitable for their role (buyer, producer, etc.) in the experiment. After this "learning" stage, profits and prices tended to converge toward fairly stable levels over the course of an experiment. These observations suggest that efficiency and share data averaged over all periods in an experiment could be potentially misleading. In order to explore this possibility, we estimated asymptot ic share statistics based on share series data. One type of nonlinear regression equat ion that we estimated was the exponential decay function. For example, the share series for each experiment was used to estimate,
(1) Yt = a(1 - exp ( - b t )) + u t,
where Y~ is the relevant share in period t, a and b are coefficients to be estimated, and u t is a r andom error term. If Yt = Tt in (1) a n d / ~ > 0, then ~ is the estimated asymptot ic efficiency for the experiment.
A pooled time-series, cross-section version of (1) was estimated for the seven baseline experiments and for the seven cotenancy experiments. For each of the two estimated equations,/~ was positive (indicating increasing efficiency over time)
58
Table 4. Mean shares of optimal total surplus: pipeline data.
S. J. Rassenti et al.
Share Share in Experi- Baseline measure optimal merit without cotenancy measure allocation ment (pooled)
With t21 cotenancy (Prob) 1 (pooled)
L
Pipeline transpor-
tation
PL
Production by pipeIines
L T
Pipeline total
le 0.245 0,241 2e 0.233 0.225 3e 0.295 0.241 -2 .13
0.208 4ee (0.268) 0.220 (0.220) 0,198 (0.04) 5ee 0,250 0.218 6eee 0.268 0.231 7eee 0.364 0.188
le 0.124 0.100 2e 0.115 0,131 3e 0.086 0.110 1.36
0.135 4ee (0.106) 0.130 (0.118) 0.113 (0.11) 5ee 0.I 03 0.129 6eee 0,085 0.107 7eee 0.099 0.133
le 0.369 0.341 2e 0.348 0.356 3e 0.381 0.351 -1 .98
0.343 4ee (0.374) 0.350 (0.338) 0.311 (0.05) 5ee 0,353 0,347 6eee 0.353 0.338 7eee 0.463 0.321
1 See footnote, Table 3.
100 -
90
8O
70
o~ 60 ~5 ~ 50
40
3O
0 I 1 1 2 3 4 5
]Figure :2. Mean efficiency by distr ibutive shares. I ~ Without cotenants; �9 competit ive equil ibrium; with cotenants. Distr ibut ive shares and totals: 1 = product ion by pipelines; 2 = independent
produces; 3 = pipeJine transportation; 4 = wholesale buyers; 5 = total efficiency.
Competition in an experimental auction market 59
and ~i was slightly greater than mean efficiency (0.888 and 0.857 respectively)) 4 Exponential decay function estimates were also used to evaluate the impact of
the cotenancy treatment. The estimation procedure and the results are described in detail in the appendix. The dummy variable used to measure the impact of cotenancy is significant for each share series and the signs match the signs reported in Tables 3 and 4 for t-statistics based on mean shares. Thus, our measurement of the impact of cotenancy on efficiency and distributive shares is robust with respect to the use of different statistical methods.
After subjects have participated in one gas auction experiment, the subjects' level of experience does not seem to affect the results. Tables 3 and 4 report on experiments in which all subjects in an experiment had participated in either one, two, or three prior gas auction experiments. There is no predictable difference in total efficiency or in distribution shares reported in Tables 3 and 4 that depends on subjects' experience level. We do not report results of experiments with inexperienced subjects in Tables 3 and 4. Experiments with inexperienced subjects typically ran for only 6 to 8 trading periods after the instructions were completed. Average efficiency in experiments with inexperienced subjects was 10 to 15 percent less than average efficiency in experiments with experienced subjects.
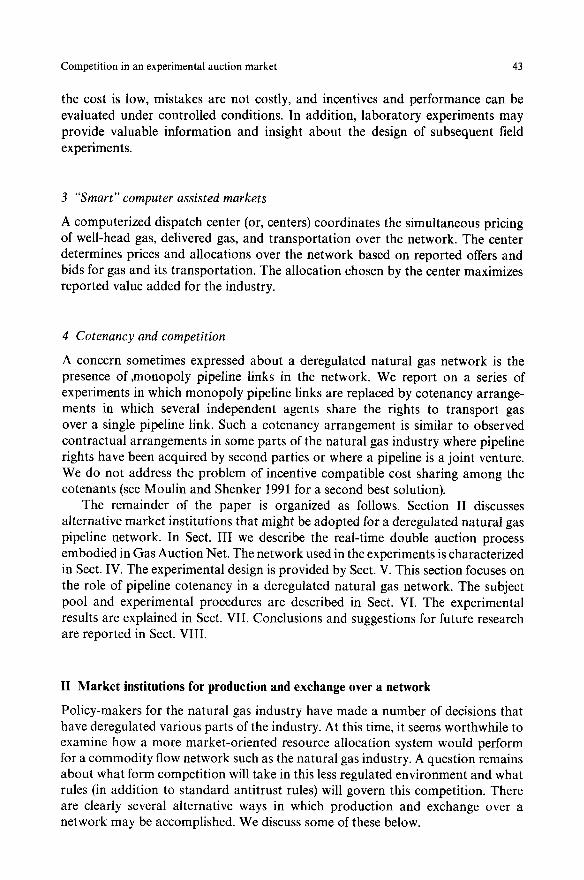
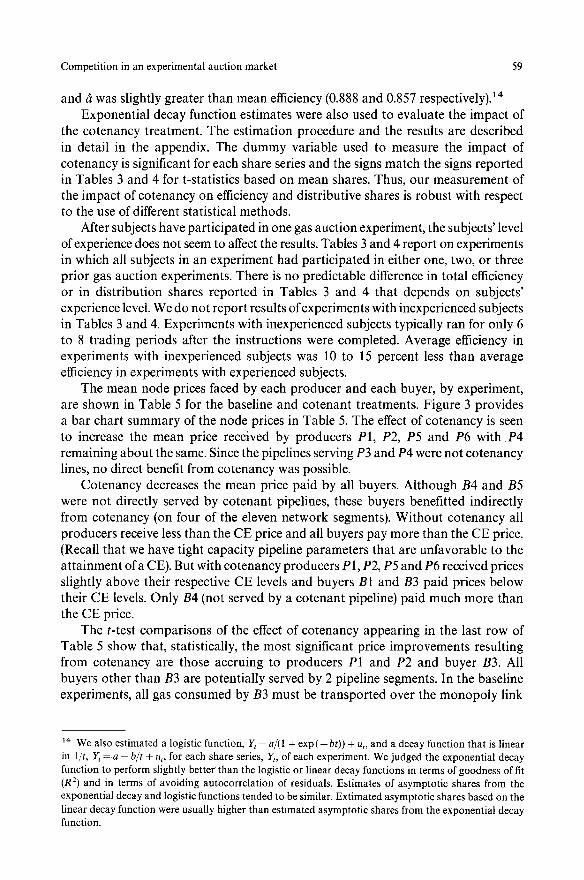
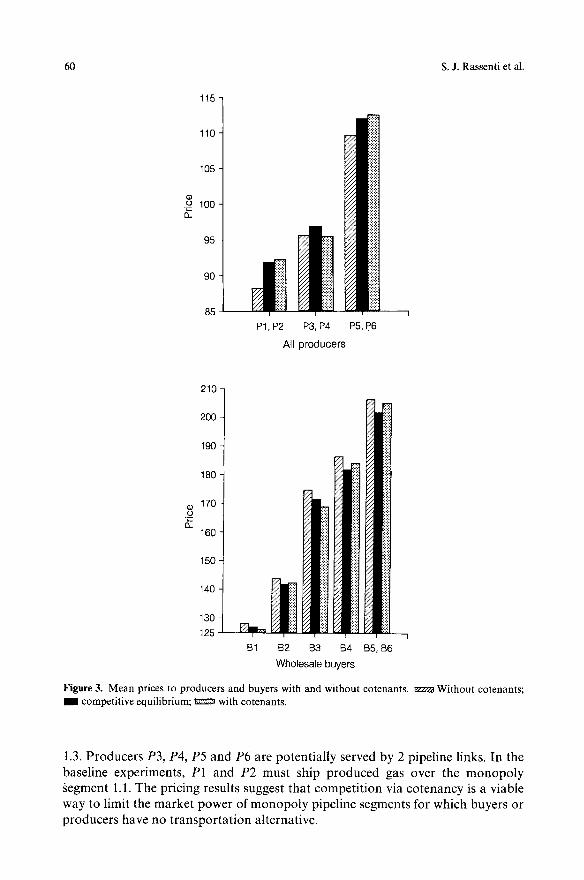
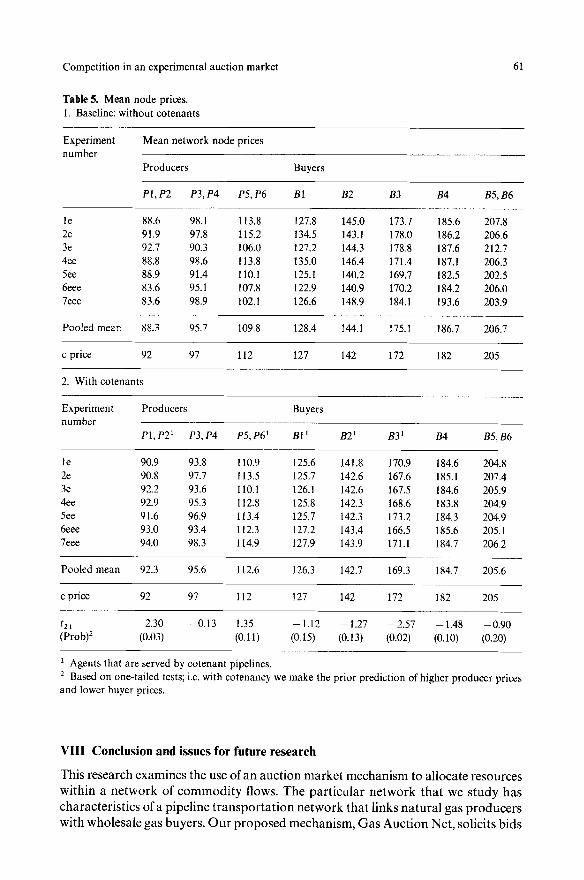
The mean node prices faced by each producer and each buyer, by experiment, are shown in Table 5 for the baseline and cotenant treatments. Figure 3 provides a bar chart summary of the node prices in Table 5. The effect of cotenancy is seen to increase the mean price received by producers P1, P2, P5 and P6 with P4 remaining about the same. Since the pipelines serving P3 and P4 were not cotenancy lines, no direct benefit from cotenancy was possible.
Cotenancy decreases the mean price paid by all buyers. Although B4 and B5 were not directly served by cotenant pipelines, these buyers benefitted indirectly from cotenancy (on four of the eleven network segments). Without cotenancy all producers receive less than the CE price and all buyers pay more than the CE price. (Recall that we have tight capacity pipeline parameters that are unfavorable to the attainment of a CE). But with cotenancy producers P 1, P2, P5 and P6 received prices slightly above their respective CE levels and buyers B1 and B3 paid prices below their CE levels. Only B4 (not served by a cotenant pipeline) paid much more than the CE price.
The t-test comparisons of the effect of cotenancy appearing in the last row of Table 5 show that, statistically, the most significant price improvements resulting from cotenancy are those accruing to producers P1 and P2 and buyer B3. All buyers other than B3 are potentially served by 2 pipeline segments. In the baseline experiments, all gas consumed by B3 must be transported over the monopoly link
14 We also estimated a logistic function, Y, = a/(1 + e x p ( - b t ) ) + u,, and a decay function that is linear in 1/ t , Y~ = a - b / t + ut, for each share series, Yt, of each experiment. We judged the exponential decay function to perform slightly better ' than the logistic or linear decay functions in terms of goodness of fit (R 2) and in terms of avoiding autocorrelation of residuals. Estimates of asymptotic shares from the exponential decay and logistic functions tended to be similar. Extimated asymptotic shares based on the linear decay function were usually higher than estimated asymptotic shares from the exponential decay function.
110 -
105 -
o 100 - n
90
95
85 I
P5, P6
210
I
P1, P2
I
P3, P4
115 -
All producers
I
BI
200
190
180
170
n 160
150
140
130
125 l [ l I I
B2 B3 B4 B5, B6
Wholesale buyers
60 S.J. Rassenti et al.
Figure 3. Mean prices to producers and buyers with and without cotenants..v.r_ze~ Without cotenants; I n competitive equilibrium; ~ with cotenants.
1.3. Producers P3, P4, P5 and P6 are potentially served by 2 pipeline links. In the baseline experiments, P1 and P2 must ship produced gas over the monopoly ~egment 1.1. The pricing results suggest that competition via cotenancy is a viable way to limit the market power of monopoly pipeline segments for which buyers or producers have no transportation alternative.
Competition in an experimental auction market
Table 5. Mean node prices. I. Baseline: without cotenants
61
Experiment Mean network node prices number
Producers Buyers
P1, P2 P3, P4 P5, P6 B1 B2 B3 B4 B5, B6
le 88.6 98.1 113.8 127.8 145.0 173.7 185.6 207.8 2e 91.9 97.8 115.2 134.5 143.1 178.0 186.2 206.6 3e 92.7 90.3 106.0 127.2 144.3 178.8 187.6 212.7 4ee 88.8 98.6 113.8 135.0 146.4 171.4 187.1 206.3 5ee 88.9 91.4 110.1 125.1 140.2 169.7 182.5 202.5 6eee 83.6 95.1 107.8 122.9 140.9 170.2 184.2 206.0 7eee 83.6 98.9 102.1 126.6 148.9 184.1 193.6 203.9
Pooled mean 88.3 95.7 109.8 128.4 144.I t75.1 186.7 206,7
c price 92 97 112 127 142 172 182 205
2. With cotenants
Experiment Producers Buyers number
P1,P21 P3,P4 P5,P61 B11 B21 B31 B4 B5,B6
le 90.9 93.8 110.9 125.6 141.8 170.9 184.6 204.8 2e 90.8 97.7 113.5 125.7 142.6 167.6 185.1 207.4 3e 92.2 93.6 110.1 126.1 142.6 167.5 184.6 205.9 4ee 92.9 95.3 112.8 125.8 142.3 168.6 183.8 204.9 5ee 91.6 96.9 113.4 125.7 142.3 173.2 184.3 204.9 6eee 93.0 93.4 112.3 127.2 143.4 166.5 185.6 205.1 7eee 94.0 98.3 114.9 127.9 143.9 171.1 184.7 206.2
Pooled mean 92.3 95.6 112.6 126.3 142.7 169.3 184.7 205.6
c price 92 97 112 127 142 172 182 205
t21 2.30 --0.13 1.35 --1.12 --1.27 -2.57 --1.48 -0.90 (Prob) 2 (0.03) (0.11) (0.15) (0.13) (0.02) (0.1 O) (0.20)
1 Agents that are served by cotenant pipelines. 2 Based on one-tailed tests; i.e. with cotenancy we and lower buyer prices.
make the prior prediction of higher producer prices
VIII Conclusion and issues for future research
T h i s r e s e a r c h e x a m i n e s t he use of a n a u c t i o n m a r k e t m e c h a n i s m to a l l oca t e r e sou rce s
w i t h i n a n e t w o r k o f c o m m o d i t y f lows. T h e p a r t i c u l a r n e t w o r k t h a t we s t u d y h a s
c h a r a c t e r i s t i c s of a p i p e l i n e t r a n s p o r t a t i o n n e t w o r k t h a t l i nks n a t u r a l gas p r o d u c e r s
w i t h w h o l e s a l e ga s buye r s . O u r p r o p o s e d m e c h a n i s m , G a s A u c t i o n N e t , so l ic i t s b i d s
62 S.J. Rassenti et al.
and offers from the three major types of "players" in this network; producers, pipeline transporters, and wholesale buyers. A computer-assisted dispatch center then determines an allocation that maximizes reported gains from trade. If parti- cipants reveal their actual willingness to provide service and willingness to pay for service then the auction will yield an efficient outcome.
We report on a series of 14 laboratory experiments that were designed to test a real-time version of Gas Auction Net. The experiments utilize a 9-node network that provides for competition among a relatively small number of market participants. In the experiments, participants typically did not reveal their induced willingness to provide service or pay for service. Nevertheless, average realized performance was good in these experiments, with actual total surplus ranging from 80 to 95 percent of optimal total surplus across experiments.
A key feature of these experiments was consideration ofcotenancy as a potential means of stimulating competition and promoting efficiency. In 7 experiments monopoly pipeline links were replaced by cotenancy arrangements in which several independent agents shared the rights to transport gas over a single pipeline link. Such a cotenancy arrangement is similar to observed contractual arrangements in some parts of the natural gas industry. The impact of pipeline cotenancy in the experiments is to raise efficiency, increase the shares of surplus for buyers and producers and reduce the share of surplus for pipeline transporters.
Our experimental results indicate that a computer coordinated auction market mechanism can work to allocate resources with high efficiency in a network of commodity flows.15 Even in our baseline experiments in which each pipeline link connecting distinct nodes was monopolized, experienced subjects attained 85 percent of maximal total surplus on average. We believe that these results are significant in light of the skepticism with which market mechanisms are often viewed as a way of dealing with coordination problems in a network. For example, Carlton and Kiamer (1983, pp. 452-453) provide an example of how short run inefficient allo- cations within a network could arise based on independent decisions by firms. Clearly not all types of market mechanisms would work equally well to solve co- ordination problems within a network (recall our discussion in Sect. II, above). However, a computer-assisted auction market of the type that we examined does help agents coordinate decisions by providing appropriate price signals at the various nodes of the network.
Additional coordination issues arise in regard to new investment and expansion of a network. A market mechanism may not provide appropriate incentives for firms to undertake socially beneficial expansion of a network (see Carlton and Klamer 1983 and additional references cited there). The experiments that we reported on do not directly address issues of expansion and investment. However, observe that the prices established by Gas Auction Net at nodes of the network provide signals that indicate the profitability of expansion of existing facilities or of construction of a new transportation link. Whether these signals for private decisions provide the
5 Its workability has been demonstrated in a limited form adapted for application to the network of the Pacific Gas and Electric Company (Hogan 1989).
Competition in an experimental auction market 63
appropriate social incentives is an open question. Investment and network expansion issues are an important topic for future research.
The network that we examined has elements of bilateral monopoly that are typical of parts of the U.S. natural gas pipeline network. In addition, producers, pipeline transporters, wholesale buyers in the natural gas industry all make invest- ments in specialized assets involving sunk costs. Klein et al. (1978) argue that vertical integration is more likely than market contracting where bilateral monopoly situations involve specific investments. They argue that market contracts may be incomplete and/or costly to enforce and hence expose agents to risks of oppor- tunistic behavior. A combination of vertical and horizontal integration has also been suggested as a way to handle coordination problems over a network (see Klein et al. 1978, pp. 310-311 and Carlton and Klamer 1983).
Our experiments involved vertical integration of pipeline operators and pro- ducers. Each of the three subjects that operated pipelines (in the baseline experiments) also controlled production facilities. There is the potential for further vertical integration to improve performance in our experimental network. For example, buyer B3 is served by a single pipeline link, no. i-7.3. In the baseline experiments this bilateral monopoly situation resulted in inefficiency in some periods as potential gains from trade were not realized. Vertical integration by pipeline operator number 1 and buyer B3 has the potential to yield coordinated bids and offers and to eliminate this inefficiency. However, continued vertical integration to eliminate monopolies and monopsonies may reduce competition within the network. In the extreme, if integration continues until all monopolies and monopsonies are eliminated then the entire network would be owned by a single firm. The impact of vertical integration policies remains as a topic on our future research agenda.
Appendix Estimation of asymptotic shares of optimal surplus
Tables 3 and 4 report on mean efficiency and mean distributive shares for the 14 experiments. The impact of cotenancy on efficiency (share of optimal surplus) and distributive shares is evaluated by using t-tests based on the mean share statistics. In this appendix we describe a second set of tests of the impact of cotenancy that is based on an exponential decay model of share evolution over time (auction periods). These tests utilize pooled data from all 14 experiments for each type of share observation: total (T), buyer (B), independent producer (P), pipeline transportation (L), and production by pipeline (PL).
Consider the following nonlinear statistical model;
(A1) Yi = (a + cDi)(1 - e x p ( - b t l ) ) + ui
where Yi is the share for observation i, Di is zero if i is not a cotenancy observation and one if i is a cotenancy observation, and ti is the time period for observation i. This model allows the asymptotic share to vary depending on the cotenancy treatment but restricts the rate of convergence to be invariant across this treatment (relaxing this restriction is discussed below). The estimated coefficient ~ measures
64 s.J. Rassenti et al.
the impact of cotenancy in the pooled data. The following estimated equation was obtained for the pooled total efficiency data:
(A2) Yi = 1-85.58 + 3.20Di] [1 - exp ( - 1.03ti)] (0.84) (1.21) (0.06)
/~2 = 0.42, D W = 1.85, N = 238 observations.
The cotenancy treatment is estimated to raise asymptotic efficiency by 3.2 percent of maximal surplus. This positive impact of cotenancy is statistically significant at the one percent level. The cotenancy treatment is also estimated to have a positive and statistically significant effect on asymptotic buyer share and asymptotic producer share (both independent and pipeline owned.) Cotenancy is estimated to reduce the share of maximal surplus going to pipelines by 4.99 percent (this is significant at the one percent level). These results are consistent with our a priori hypothesis that the effect of pipeline cotenancy would be to increase overall gains from exchange and to shift its composition away from pipeline transportation and toward buyers and producers.
We also considered a more complex statistical model than (A1) which allowed the rate of convergence coefficient as well as the asymptotic share to vary with the cotenancy treatment. The model is specified as,
(A3) Yi = aoD/(l - exp ( - boDiti) ) + al(1 - Oi)(1 - e x p ( - bl (1 - Di)ti) ) + u i.
This unrestricted model was compared to the following restricted model,
(A4) Yi = a(1 - exp ( -b t l ) ) + ui.
Estimation of (A3) and (A4) for the pooled data permits us to evaluate the null hypothesis that ,~o = ~1 and bo = bl (i.e., both estimated asymptotic share and estimated rate of convergence are the same regardless of the cotenancy treatment), against the alternative. We use a likelihood ratio test based on estimation of the unrestricted and restricted models. We reject this null hypothesis at the five percent confidence level for each of the five sets of share data. However, we cannot reject the hypothesis that b0 = bl for any of the five sets of share data. This indicates that the statistical model (A1) and the estimates reported in (A2) provide a reasonable way to identify the impact of cotenancy on asymptotic shares.
References
Alger, D.: A policy context for FERC-sponsored laboratory experiments concerning market-based regulation of natural gas transportation. Technical report 88-1, FERC Office of Economic Policy, July 1988
Banks, J., Ledyard, J. O., Porter, D.: Allocating uncertain and unresponsive resources: an experimental approach. Rand J. Econ. 20, 1-25 (1989)
Carlton, D., Klamer, J,: The need for coordination among firms, with special reference to network industries. Univ. Chicago Law Rev. 50, 446-465 (1983)
Charles River Associates: Transportation choice: key to profits in natural gas. CRA Rev. May 4, 1989
DeCanio, S.: Cross contract crediting under FERC Order 500: an economic analysis. Working paper, University of California at Santa Barbara, July 1988
Competition in an experimental auction market 65
Haurie, A., Breton, M.: Market equilibrium in a multistage commodity network. Automatica 21,585-597 (1985)
Hogan, W. W.: Firm natural gas transportation: A priority capacity allocation model. A report prepared by Putnam, Hayes and Bartlett, Inc. for Pacific Gas and Electric Co., February 1989
Klein, B., Crawford, R., Alchian, A.: Vertical integration, appropriable rents, and the competitive contracting process. J. Law Econ. 21,297-326 (1988)
McCabe, K. A., Rassenti, S. J., Smith, V. L.: An experimental mechanism for the simultaneous auction of gas and pipeline rights in a transmission network. Preliminary draft, report prepared for the Federal Energy Regulatory Commission, Economic Science Laboratory, University of Arizona, November 12, 1987
McCabe, K. A., Rassenti, S. J., Smith, V. L.: A new market institution for the exchange of composite goods. Department of Economics, Discussion Paper 88-13, University of Arizona, April 1988
McCabe, K. A., Rassenti, S. J., Smith, V. L.: Designing 'smart' computer assisted markets: an experimental auction for gas networks. Eur. J. Polit. Econ. 5, 259-283 (1989)
Moulin, H., Shenker, S.: Serial cost sharing. Duke University, Mimeo, March 1991 Pierce, R.: Reconstituting the natural gas industry from wellhead to burnertip. Energy Law J. 9, 1-57
(1988) Plott, C.: Research on pricing in a gas transportation network. Technical report 88-2, FERC Office of
Economic Policy, July 1988 Sharkey, W.: Models of competitive telecommunications markets. Bell Communications research,
Economics Discussion Paper No. 29, July 1987 Smith, V. L.: Electric power deregulation: background and prospects. Contemp. Pol. Iss. 6, 14-24 (1988) Tussing, A., Barlow, C.: The Natural Gas Industry. Ballinger 1984 U.S.v. Alcan Aluminum Ltd., et al.: Final judgement entered, January 1985, U.S. District Court Western
District of Kentucky Williams, S.: The natural gas revolution of 1985. Washington, D.C.: American Enterprise Institute for
Public Policy Research
Related Documents