Costs, Fees and Trustee Decision-Making Research partnership between Aon Hewitt and Leeds University Business School Aon Hewitt Retirement and Investment Risk. Reinsurance. Human Resources.

Welcome message from author
This document is posted to help you gain knowledge. Please leave a comment to let me know what you think about it! Share it to your friends and learn new things together.
Transcript
Costs, Fees and Trustee Decision-Making
Research partnership between Aon Hewitt and Leeds University Business School
Aon HewittRetirement and Investment
Risk. Reinsurance. Human Resources.

Aon is committed to supporting trustees to achieve the right outcomes for their pension schemes.
With this in mind, one of the areas we are currently focussing on is the highly topical and
interesting subject of behavioural finance. Specifically, we are looking at how behavioural biases
can affect the way in which defined benefit (DB) pension scheme trustees make decisions
about their scheme investments.
As a first step, we partnered with Behave London to develop The Aon Trustee Checklist,
a practical tool designed to reduce decision-making bias in trustee meetings.
Later, we partnered with Leeds University Business School (LUBS) to undertake the first major
piece of academic research exploring trustee investment decision-making, including perceptions
and understanding of costs and value, investment risk and return, manager selection and the
role of bias in all of these areas.
Dr Iain Clacher led the research, working with Dr Richard Edgar Hodgett, a lecturer in Business
Analytics and Decision Science at LUBS, and Dr Simon McNair, Leverhulme Early Career Research
Fellow based at the LUBS Centre for Decision Research. Dr Clacher is currently Associate Professor
in Accounting and Finance at Leeds University Business School and is the co-director of the Centre
for Advance Studies in Finance. More information about our research partner, including team
biographies, can be found on page 15.
In the second half of 2016, we conducted several email and social media campaigns, inviting
trustees to participate in the research. 197 responded and completed an online survey, designed
by the research team. Additionally, Dr Clacher conducted 10 semi-structured interviews
with representatives of a range of pension schemes.
This is the second in a series of reports analysing the research findings, which set out to map
the trustee landscape and provide deeper analysis on trustees’ perceptions of costs and value,
investment risk and return as well as manager selection.
If you have any questions about this research, and to pre-register for future reports, please
contact one of the team. Their details can be found at the end of this report.
Background
*All percentage figures stated throughout are presented to the nearest integer.
Aon Hewitt 3
Introduction
This paper is the second in the series analysing trustees of UK defined benefit pension schemes and examines the extent to which trustees understand costs and fees in fund management. The results of the first paper, Mapping the Trustee Landscape1, found that trustees were highly educated, and had a range of professional qualifications. In addition, a majority of trustees exhibited a high degree of financial literacy when faced with questions on core concepts in investment and finance, such as time value of money, compounding, and inflation. However, the results of the first paper also showed that trustee boards lacked both age and gender diversity, which may not be optimal in making decisions. Moreover, homogeneity on trustee boards is an environment where groupthink may be present, and so an awareness of this may help to mitigate the risk of groupthink dominating decision-making.
The second paper looks in more detail at the salience of costs and fees with respect to investment decision making, and considers both the explicit and implicit costs and fees associated with fund management.²
The separation out of costs and fees into these groups is important in light of the interim report of the Financial Conduct Authority’s Asset Management Market Study3, as one of the potential solutions to opacity in the fund management industry is increased disclosure of what many argue are the hidden costs of fund management. If this is to be the solution from the Financial Conduct Authority4, then it is crucial to understand whether trustees are in a position to actually take any enhanced disclosure and use it meaningfully when making investment decisions for the funds that they steward.
It is also worth noting that any solution may have unintended consequences. For example, a full disclosure of implicit costs and fees may result in information overload and prevent effective decision-making. Similarly, there may be a fixation on ‘costs’ over ‘value’ and it is the combination of both that is crucial to effective investment in pension fund management.
Key results show:
• Interviews with trustees highlight that investment strategy is their primary concern with costs and fees being a second order consideration;
• Almost half of trustees choose active over passive management;
• Trustees have a longer-term focus;
• The influence of investment consultant recommendation was not as strong as expected;
• Trustees are generally good at understanding explicit net of fees analyses, although trustees of smaller schemes did not perform as well;
• Trustees in general are less familiar with implicit fees, and this is worse for trustees of small schemes;
• All trustees, and especially the trustees of smaller schemes, will need to be better supported in a world where the implicit costs of fund management are part of the decision-making criteria for trustees.
1 http://www.aon.com/unitedkingdom/retirement-investment/investment/mapping-the-trustee-landscape.jsp 2 When we separate costs and fees into explicit costs this refers to the Total Expense Ratio while implicit costs and fees refers to other costs associated
with fund management such as custodian fees, exchange fees, bid-ask spread etc. 3 https://www.fca.org.uk/publications/market-studies/asset-management-market-study 4 It is worth noting that the FCA has proposed a single “all in” figure, which may only add to opacity of costs and fees so while a ‘larger’ fee is visible,
what drives this fee may not be understood.
Dr Iain Clacher, Leeds University Business School Associate Professor in Accounting and Finance Deputy Director of the Centre for Advanced Studies in Finance (CASIF) +44 (0)113 343 6860 [email protected]
4 Costs, Fees and Trustee Decision-Making
As part of the investigation into trustee decision making, a
number of trustees from a range of different pension schemes
were interviewed to gain perspectives across a range of
issues, including the role of costs and fees in investment
management. Specifically, trustees were asked ‘How important
do you see costs and fees being in your investment decision-
making, and what sort of discussions do you have around this?’
Below is a range of responses that are reflective of the
broader views that emerged through the interview process.
Across the comments, there is a general view that costs
and fees are not the key to pension fund outcomes;
for trustees this is achieved via strategy and asset
allocation, and it is this that is their primary focus.
“Costs and fees aren’t hugely prominent in
governing a decision. As a strategy develops,
we will undertake periodic review from a risk
management perspective to see how much money
is going to one firm. We then ask whether there
is value to be gained from further consolidation
or is there value to be gained in a broader
perspective through smaller mandates?”
Chairman, Trustee Board
“Costs and fees don’t drive what we are doing. If
we look at a new asset class we ask, why are
we considering this, how does it fit with our
strategy, what do our investment consultants
say, what is the performance of the asset
manager net of fees, are we confident about
this performance? Costs and fees are a second
order concern and strategy comes first.”
Chair of Investment Committee,
Large Defined Benefit Scheme
Similarly, there was a view that it was not a trustee’s job
to concern themselves with fees, as this should have been
taken account of in the selection of the fund managers.
“Costs and fees are not high up the list. Our focus
is net of fees not gross of fees. Fees are the remit
of the consultant as part of their due diligence.”
Independent Trustee, Small to Mid-size Schemes
However, there was also a view that it is about knowing
what you are paying for and how any value that additional
fees generates is split between the pension fund and
the fund manager. Such an approach is consistent with
notions of value for money and how any gains are shared.
“Our focus is on asset allocation. Our philosophy
on fees is how much excess return goes to the
asset manager and how much goes to the pension
fund? Costs and fees are clearly important but
they are not the be all and end all of this. When
investments are being made you have to go into
them with open eyes, so if you are paying high fees
you have to know what it is you are paying for.”
CIO, Large Pension Fund
There was also the view that the costs and fees issue has
been overstated, although this was not a common view.
Underpinning this view is the fact that investment
managers often hide behind complexity and the issue is
one of leakage.5 As such, were leakage to be better managed
then the cost and fees issue would be less prominent.
“There is a lot of bluff about this. There are three or
four managers out there who compete to keep their
costs low to maintain their benchmark. Active
managers would do better if they could keep
leakage down. Leakage goes against fiduciary
duty as it’s other people’s money. Investment
managers hide behind the complex bits.”
Director, Firm of Independent Trustees
Costs and fees — the trustee perspective
5 Leakage here refers to a loss of value to the pension fund through higher costs within a fund that are necessary.
Aon Hewitt 5
Choosing investmentsThe second part of our analysis for this paper was conducted via an online survey, which has generated data across a
range of issues based on the responses of 197 trustees, who represent a range of scheme sizes and trustee types.6
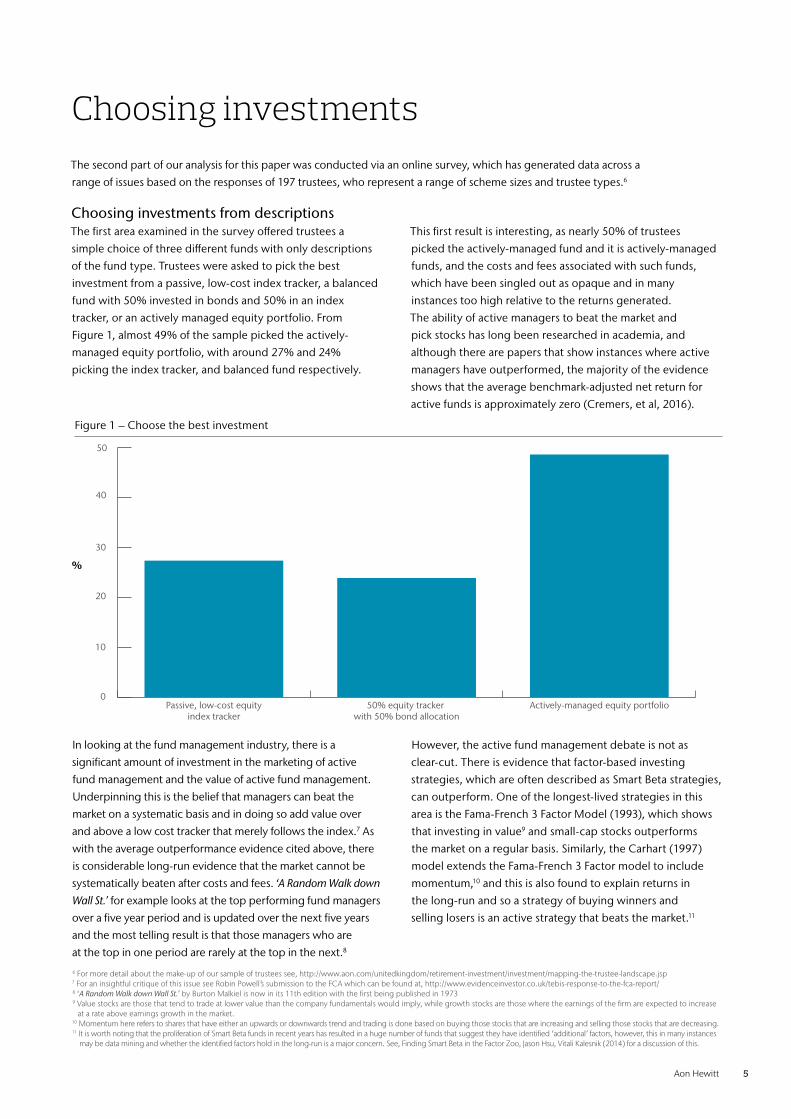
Choosing investments from descriptions The first area examined in the survey offered trustees a
simple choice of three different funds with only descriptions
of the fund type. Trustees were asked to pick the best
investment from a passive, low-cost index tracker, a balanced
fund with 50% invested in bonds and 50% in an index
tracker, or an actively managed equity portfolio. From
Figure 1, almost 49% of the sample picked the actively-
managed equity portfolio, with around 27% and 24%
picking the index tracker, and balanced fund respectively.
This first result is interesting, as nearly 50% of trustees
picked the actively-managed fund and it is actively-managed
funds, and the costs and fees associated with such funds,
which have been singled out as opaque and in many
instances too high relative to the returns generated.
The ability of active managers to beat the market and
pick stocks has long been researched in academia, and
although there are papers that show instances where active
managers have outperformed, the majority of the evidence
shows that the average benchmark-adjusted net return for
active funds is approximately zero (Cremers, et al, 2016).
In looking at the fund management industry, there is a
significant amount of investment in the marketing of active
fund management and the value of active fund management.
Underpinning this is the belief that managers can beat the
market on a systematic basis and in doing so add value over
and above a low cost tracker that merely follows the index.7 As
with the average outperformance evidence cited above, there
is considerable long-run evidence that the market cannot be
systematically beaten after costs and fees. ‘A Random Walk down
Wall St.’ for example looks at the top performing fund managers
over a five year period and is updated over the next five years
and the most telling result is that those managers who are
at the top in one period are rarely at the top in the next.8
However, the active fund management debate is not as
clear-cut. There is evidence that factor-based investing
strategies, which are often described as Smart Beta strategies,
can outperform. One of the longest-lived strategies in this
area is the Fama-French 3 Factor Model (1993), which shows
that investing in value9 and small-cap stocks outperforms
the market on a regular basis. Similarly, the Carhart (1997)
model extends the Fama-French 3 Factor model to include
momentum,10 and this is also found to explain returns in
the long-run and so a strategy of buying winners and
selling losers is an active strategy that beats the market.11
Figure 1 – Choose the best investment
0
10
20
30
40
50
Actively-managed equity portfolio50% equity tracker with 50% bond allocation
Passive, low-cost equityindex tracker
6 For more detail about the make-up of our sample of trustees see, http://www.aon.com/unitedkingdom/retirement-investment/investment/mapping-the-trustee-landscape.jsp7 For an insightful critique of this issue see Robin Powell’s submission to the FCA which can be found at, http://www.evidenceinvestor.co.uk/tebis-response-to-the-fca-report/8 ‘A Random Walk down Wall St.’ by Burton Malkiel is now in its 11th edition with the first being published in 19739 Value stocks are those that tend to trade at lower value than the company fundamentals would imply, while growth stocks are those where the earnings of the firm are expected to increase
at a rate above earnings growth in the market.10 Momentum here refers to shares that have either an upwards or downwards trend and trading is done based on buying those stocks that are increasing and selling those stocks that are decreasing.11 It is worth noting that the proliferation of Smart Beta funds in recent years has resulted in a huge number of funds that suggest they have identified ‘additional’ factors, however, this in many instances
may be data mining and whether the identified factors hold in the long-run is a major concern. See, Finding Smart Beta in the Factor Zoo, Jason Hsu, Vitali Kalesnik (2014) for a discussion of this.
%
6 Costs, Fees and Trustee Decision-Making
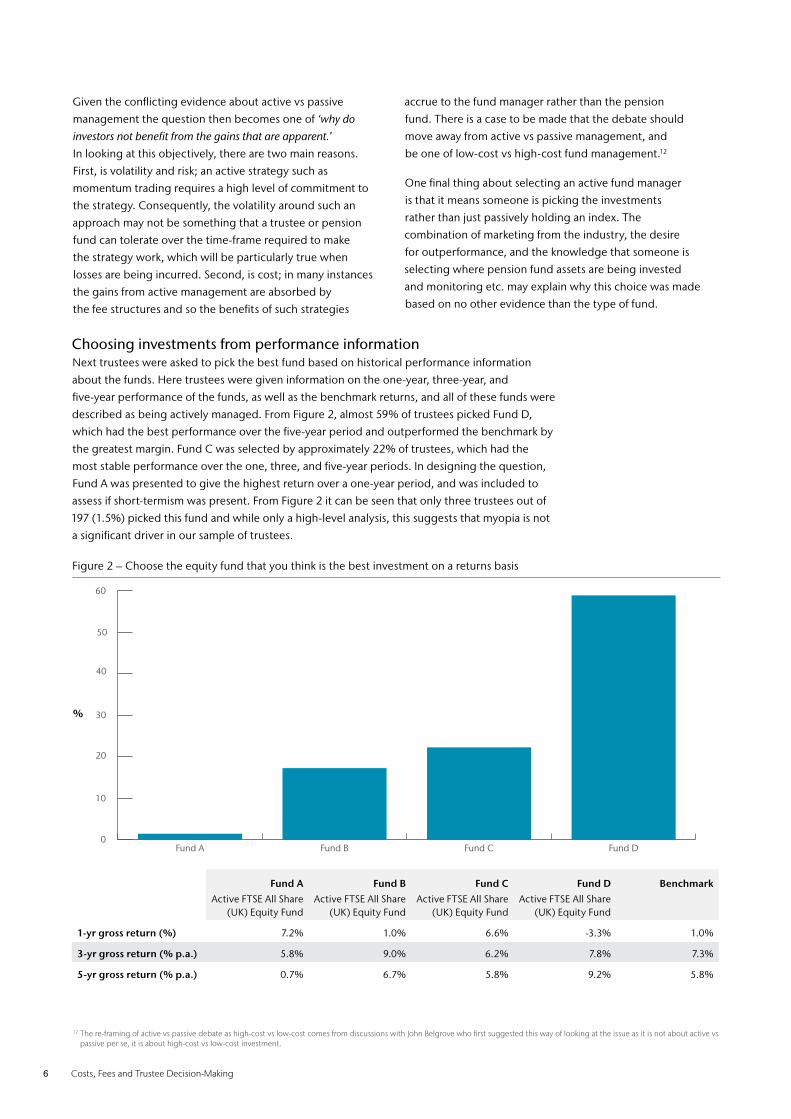
Figure 2 – Choose the equity fund that you think is the best investment on a returns basis
Fund A Fund B Fund C Fund D Benchmark
Active FTSE All Share (UK) Equity Fund
Active FTSE All Share (UK) Equity Fund
Active FTSE All Share (UK) Equity Fund
Active FTSE All Share (UK) Equity Fund
1-yr gross return (%) 7.2% 1.0% 6.6% -3.3% 1.0%
3-yr gross return (% p.a.) 5.8% 9.0% 6.2% 7.8% 7.3%
5-yr gross return (% p.a.) 0.7% 6.7% 5.8% 9.2% 5.8%
0
10
20
30
40
50
60
Fund DFund CFund BFund A
Given the conflicting evidence about active vs passive
management the question then becomes one of ‘why do
investors not benefit from the gains that are apparent.’
In looking at this objectively, there are two main reasons.
First, is volatility and risk; an active strategy such as
momentum trading requires a high level of commitment to
the strategy. Consequently, the volatility around such an
approach may not be something that a trustee or pension
fund can tolerate over the time-frame required to make
the strategy work, which will be particularly true when
losses are being incurred. Second, is cost; in many instances
the gains from active management are absorbed by
the fee structures and so the benefits of such strategies
accrue to the fund manager rather than the pension
fund. There is a case to be made that the debate should
move away from active vs passive management, and
be one of low-cost vs high-cost fund management.12
One final thing about selecting an active fund manager
is that it means someone is picking the investments
rather than just passively holding an index. The
combination of marketing from the industry, the desire
for outperformance, and the knowledge that someone is
selecting where pension fund assets are being invested
and monitoring etc. may explain why this choice was made
based on no other evidence than the type of fund.
Choosing investments from performance informationNext trustees were asked to pick the best fund based on historical performance information
about the funds. Here trustees were given information on the one-year, three-year, and
five-year performance of the funds, as well as the benchmark returns, and all of these funds were
described as being actively managed. From Figure 2, almost 59% of trustees picked Fund D,
which had the best performance over the five-year period and outperformed the benchmark by
the greatest margin. Fund C was selected by approximately 22% of trustees, which had the
most stable performance over the one, three, and five-year periods. In designing the question,
Fund A was presented to give the highest return over a one-year period, and was included to
assess if short-termism was present. From Figure 2 it can be seen that only three trustees out of
197 (1.5%) picked this fund and while only a high-level analysis, this suggests that myopia is not
a significant driver in our sample of trustees.
12 The re-framing of active vs passive debate as high-cost vs low-cost comes from discussions with John Belgrove who first suggested this way of looking at the issue as it is not about active vs passive per se, it is about high-cost vs low-cost investment.
%
Aon Hewitt 7
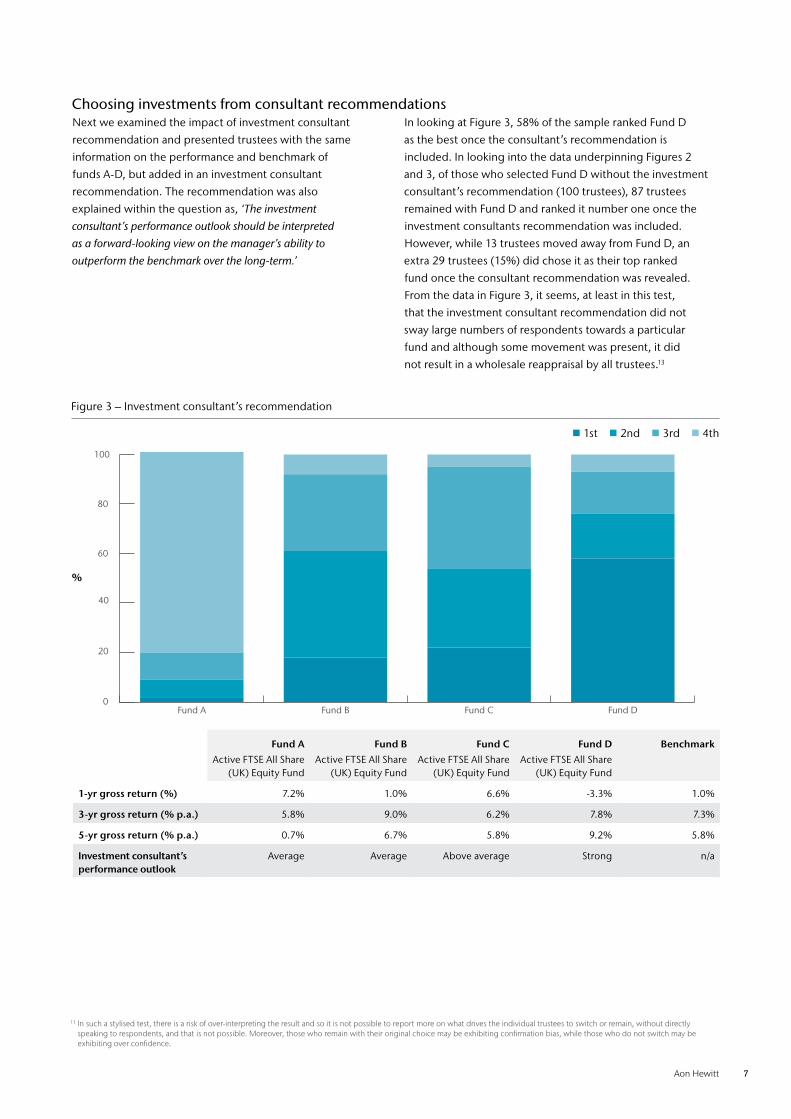
Figure 3 – Investment consultant’s recommendation
1st 2nd 3rd 4th
Fund A Fund B Fund C Fund D Benchmark
Active FTSE All Share (UK) Equity Fund
Active FTSE All Share (UK) Equity Fund
Active FTSE All Share (UK) Equity Fund
Active FTSE All Share (UK) Equity Fund
1-yr gross return (%) 7.2% 1.0% 6.6% -3.3% 1.0%
3-yr gross return (% p.a.) 5.8% 9.0% 6.2% 7.8% 7.3%
5-yr gross return (% p.a.) 0.7% 6.7% 5.8% 9.2% 5.8%
Investment consultant’s performance outlook
Average Average Above average Strong n/a
0
20
40
60
80
100
Fund DFund CFund BFund A
Choosing investments from consultant recommendationsNext we examined the impact of investment consultant
recommendation and presented trustees with the same
information on the performance and benchmark of
funds A-D, but added in an investment consultant
recommendation. The recommendation was also
explained within the question as, ‘The investment
consultant’s performance outlook should be interpreted
as a forward-looking view on the manager’s ability to
outperform the benchmark over the long-term.’
In looking at Figure 3, 58% of the sample ranked Fund D
as the best once the consultant’s recommendation is
included. In looking into the data underpinning Figures 2
and 3, of those who selected Fund D without the investment
consultant’s recommendation (100 trustees), 87 trustees
remained with Fund D and ranked it number one once the
investment consultants recommendation was included.
However, while 13 trustees moved away from Fund D, an
extra 29 trustees (15%) did chose it as their top ranked
fund once the consultant recommendation was revealed.
From the data in Figure 3, it seems, at least in this test,
that the investment consultant recommendation did not
sway large numbers of respondents towards a particular
fund and although some movement was present, it did
not result in a wholesale reappraisal by all trustees.13
13 In such a stylised test, there is a risk of over-interpreting the result and so it is not possible to report more on what drives the individual trustees to switch or remain, without directly speaking to respondents, and that is not possible. Moreover, those who remain with their original choice may be exhibiting confirmation bias, while those who do not switch may be exhibiting over confidence.
%
8 Costs, Fees and Trustee Decision-Making
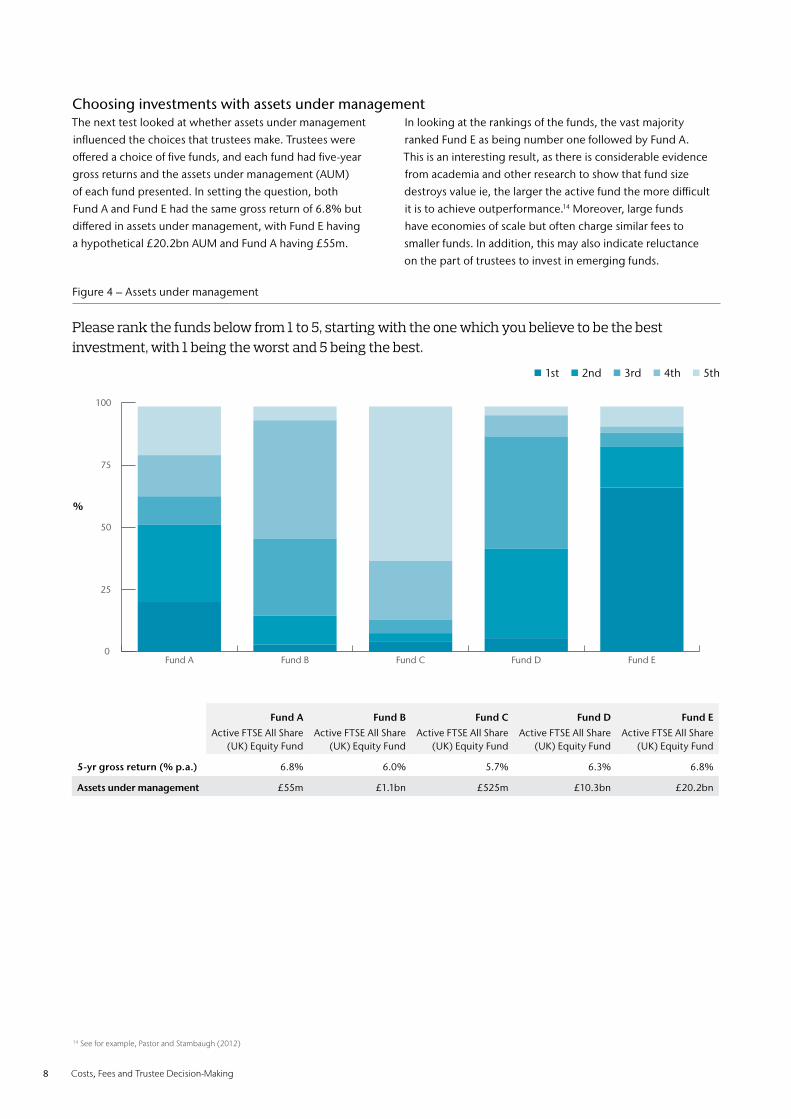
Please rank the funds below from 1 to 5, starting with the one which you believe to be the best investment, with 1 being the worst and 5 being the best.
Figure 4 – Assets under management
Choosing investments with assets under managementThe next test looked at whether assets under management
influenced the choices that trustees make. Trustees were
offered a choice of five funds, and each fund had five-year
gross returns and the assets under management (AUM)
of each fund presented. In setting the question, both
Fund A and Fund E had the same gross return of 6.8% but
differed in assets under management, with Fund E having
a hypothetical £20.2bn AUM and Fund A having £55m.
In looking at the rankings of the funds, the vast majority
ranked Fund E as being number one followed by Fund A.
This is an interesting result, as there is considerable evidence
from academia and other research to show that fund size
destroys value ie, the larger the active fund the more difficult
it is to achieve outperformance.14 Moreover, large funds
have economies of scale but often charge similar fees to
smaller funds. In addition, this may also indicate reluctance
on the part of trustees to invest in emerging funds.
14 See for example, Pastor and Stambaugh (2012)
Fund A Fund B Fund C Fund D Fund E
Active FTSE All Share (UK) Equity Fund
Active FTSE All Share (UK) Equity Fund
Active FTSE All Share (UK) Equity Fund
Active FTSE All Share (UK) Equity Fund
Active FTSE All Share (UK) Equity Fund
5-yr gross return (% p.a.) 6.8% 6.0% 5.7% 6.3% 6.8%
Assets under management £55m £1.1bn £525m £10.3bn £20.2bn
0
25
50
75
100
5th
4th
3rd
2nd
1st
Fund EFund DFund CFund BFund A
1st 2nd 3rd 4th 5th
%
Aon Hewitt 9
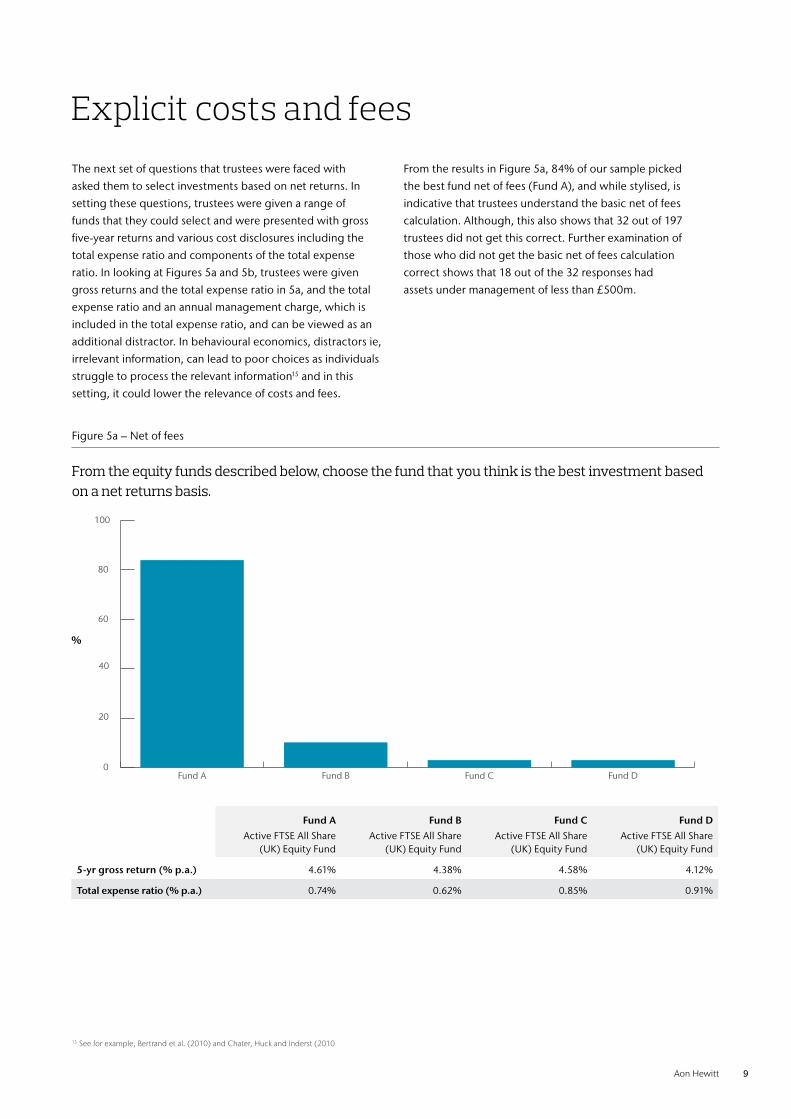
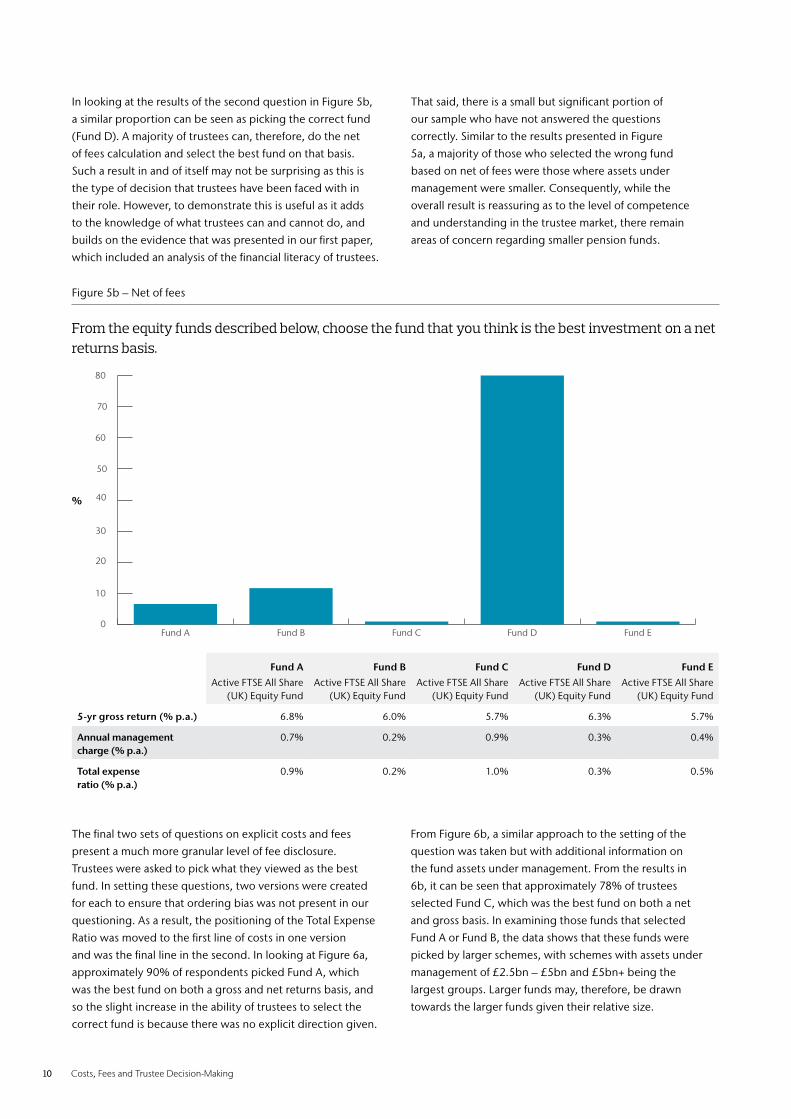
From the equity funds described below, choose the fund that you think is the best investment based on a net returns basis.
Figure 5a – Net of fees
The next set of questions that trustees were faced with
asked them to select investments based on net returns. In
setting these questions, trustees were given a range of
funds that they could select and were presented with gross
five-year returns and various cost disclosures including the
total expense ratio and components of the total expense
ratio. In looking at Figures 5a and 5b, trustees were given
gross returns and the total expense ratio in 5a, and the total
expense ratio and an annual management charge, which is
included in the total expense ratio, and can be viewed as an
additional distractor. In behavioural economics, distractors ie,
irrelevant information, can lead to poor choices as individuals
struggle to process the relevant information15 and in this
setting, it could lower the relevance of costs and fees.
From the results in Figure 5a, 84% of our sample picked
the best fund net of fees (Fund A), and while stylised, is
indicative that trustees understand the basic net of fees
calculation. Although, this also shows that 32 out of 197
trustees did not get this correct. Further examination of
those who did not get the basic net of fees calculation
correct shows that 18 out of the 32 responses had
assets under management of less than £500m.
Explicit costs and fees
15 See for example, Bertrand et al. (2010) and Chater, Huck and Inderst (2010
Fund A Fund B Fund C Fund D
Active FTSE All Share (UK) Equity Fund
Active FTSE All Share (UK) Equity Fund
Active FTSE All Share (UK) Equity Fund
Active FTSE All Share (UK) Equity Fund
5-yr gross return (% p.a.) 4.61% 4.38% 4.58% 4.12%
Total expense ratio (% p.a.) 0.74% 0.62% 0.85% 0.91%
0
20
40
60
80
100
Fund DFund CFund BFund A
%
10 Costs, Fees and Trustee Decision-Making
In looking at the results of the second question in Figure 5b,
a similar proportion can be seen as picking the correct fund
(Fund D). A majority of trustees can, therefore, do the net
of fees calculation and select the best fund on that basis.
Such a result in and of itself may not be surprising as this is
the type of decision that trustees have been faced with in
their role. However, to demonstrate this is useful as it adds
to the knowledge of what trustees can and cannot do, and
builds on the evidence that was presented in our first paper,
which included an analysis of the financial literacy of trustees.
That said, there is a small but significant portion of
our sample who have not answered the questions
correctly. Similar to the results presented in Figure
5a, a majority of those who selected the wrong fund
based on net of fees were those where assets under
management were smaller. Consequently, while the
overall result is reassuring as to the level of competence
and understanding in the trustee market, there remain
areas of concern regarding smaller pension funds.
From the equity funds described below, choose the fund that you think is the best investment on a net returns basis.
Figure 5b – Net of fees
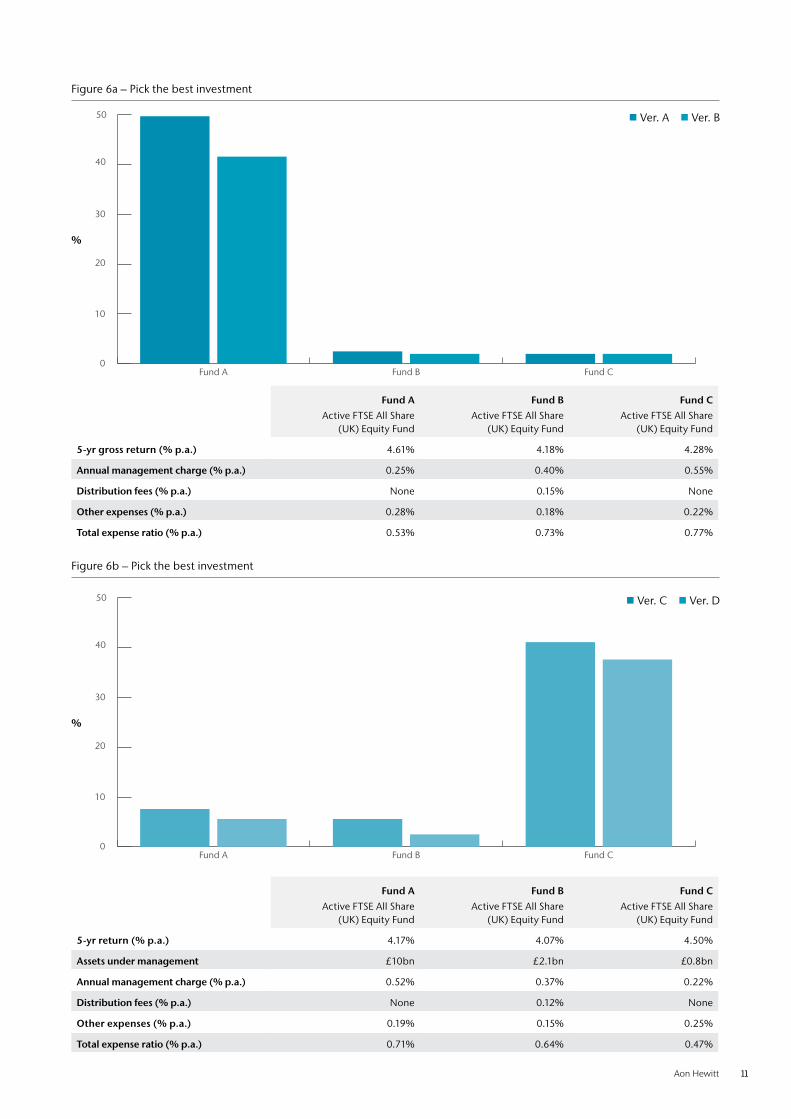
The final two sets of questions on explicit costs and fees
present a much more granular level of fee disclosure.
Trustees were asked to pick what they viewed as the best
fund. In setting these questions, two versions were created
for each to ensure that ordering bias was not present in our
questioning. As a result, the positioning of the Total Expense
Ratio was moved to the first line of costs in one version
and was the final line in the second. In looking at Figure 6a,
approximately 90% of respondents picked Fund A, which
was the best fund on both a gross and net returns basis, and
so the slight increase in the ability of trustees to select the
correct fund is because there was no explicit direction given.
From Figure 6b, a similar approach to the setting of the
question was taken but with additional information on
the fund assets under management. From the results in
6b, it can be seen that approximately 78% of trustees
selected Fund C, which was the best fund on both a net
and gross basis. In examining those funds that selected
Fund A or Fund B, the data shows that these funds were
picked by larger schemes, with schemes with assets under
management of £2.5bn – £5bn and £5bn+ being the
largest groups. Larger funds may, therefore, be drawn
towards the larger funds given their relative size.
0
10
20
30
40
50
60
70
80
Fund EFund DFund CFund BFund A
Fund A Fund B Fund C Fund D Fund E
Active FTSE All Share (UK) Equity Fund
Active FTSE All Share (UK) Equity Fund
Active FTSE All Share (UK) Equity Fund
Active FTSE All Share (UK) Equity Fund
Active FTSE All Share (UK) Equity Fund
5-yr gross return (% p.a.) 6.8% 6.0% 5.7% 6.3% 5.7%
Annual management charge (% p.a.)
0.7% 0.2% 0.9% 0.3% 0.4%
Total expense ratio (% p.a.)
0.9% 0.2% 1.0% 0.3% 0.5%
%
Aon Hewitt 11
Figure 6a – Pick the best investment
Figure 6b – Pick the best investment
0
10
20
30
40
50
Fund CFund BFund A
0
10
20
30
40
50
Fund CFund BFund A
Fund A Fund B Fund C
Active FTSE All Share (UK) Equity Fund
Active FTSE All Share (UK) Equity Fund
Active FTSE All Share (UK) Equity Fund
5-yr gross return (% p.a.) 4.61% 4.18% 4.28%
Annual management charge (% p.a.) 0.25% 0.40% 0.55%
Distribution fees (% p.a.) None 0.15% None
Other expenses (% p.a.) 0.28% 0.18% 0.22%
Total expense ratio (% p.a.) 0.53% 0.73% 0.77%
Fund A Fund B Fund C
Active FTSE All Share (UK) Equity Fund
Active FTSE All Share (UK) Equity Fund
Active FTSE All Share (UK) Equity Fund
5-yr return (% p.a.) 4.17% 4.07% 4.50%
Assets under management £10bn £2.1bn £0.8bn
Annual management charge (% p.a.) 0.52% 0.37% 0.22%
Distribution fees (% p.a.) None 0.12% None
Other expenses (% p.a.) 0.19% 0.15% 0.25%
Total expense ratio (% p.a.) 0.71% 0.64% 0.47%
Ver. A Ver. B
Ver. C Ver. D
%
%
12 Costs, Fees and Trustee Decision-Making
The final part of our analysis into costs and fees looks at
implicit rather than explicit costs and fees. In setting a question
on implicit costs and fees, it is a question of how best to do
this. The approach that has been taken is to select a range of
implicit costs and fees and ask trustees to rank how familiar
they are with each term.16 Some of these costs are the subject
of much debate within the industry, as they arguably cannot
be known with certainty eg, market impact costs. However,
they can still lead to a cost being incurred by a pension fund.
In setting this question the issue is, therefore, not about the
practicalities of whether a cost is sensible or practical etc. but
about understanding whether trustees have any awareness of
implicit costs and fees broadly defined. This is important, as
it is likely that understanding implicit costs and fees is going
to something that is expected of trustees in the future.17
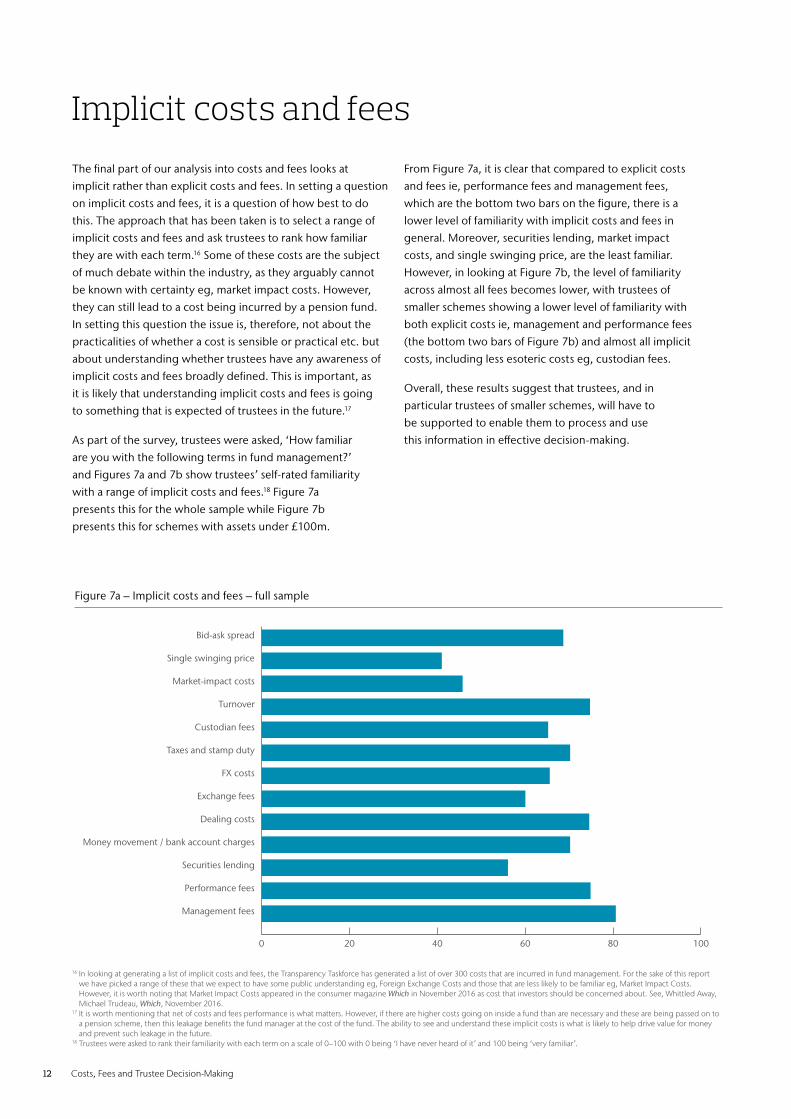
As part of the survey, trustees were asked, ‘How familiar
are you with the following terms in fund management?’
and Figures 7a and 7b show trustees’ self-rated familiarity
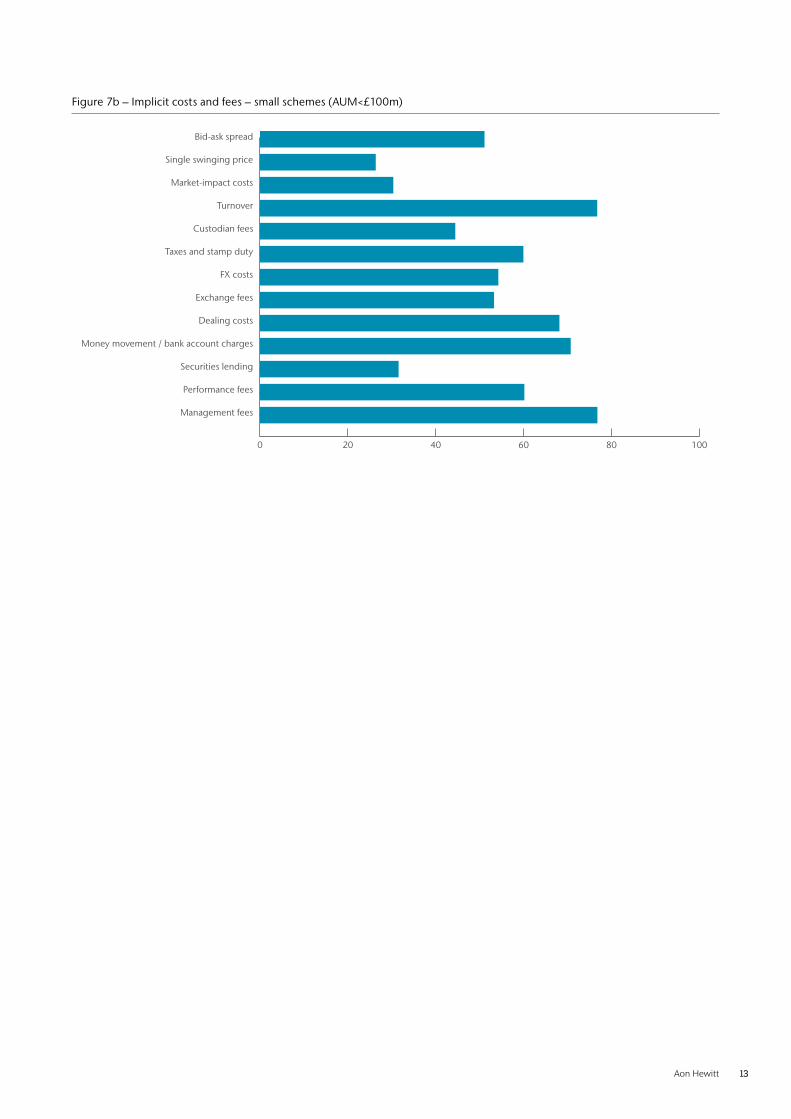
with a range of implicit costs and fees.18 Figure 7a
presents this for the whole sample while Figure 7b
presents this for schemes with assets under £100m.
From Figure 7a, it is clear that compared to explicit costs
and fees ie, performance fees and management fees,
which are the bottom two bars on the figure, there is a
lower level of familiarity with implicit costs and fees in
general. Moreover, securities lending, market impact
costs, and single swinging price, are the least familiar.
However, in looking at Figure 7b, the level of familiarity
across almost all fees becomes lower, with trustees of
smaller schemes showing a lower level of familiarity with
both explicit costs ie, management and performance fees
(the bottom two bars of Figure 7b) and almost all implicit
costs, including less esoteric costs eg, custodian fees.
Overall, these results suggest that trustees, and in
particular trustees of smaller schemes, will have to
be supported to enable them to process and use
this information in effective decision-making.
Implicit costs and fees
Figure 7a – Implicit costs and fees – full sample
0 20 40 60 80 100
Management fees
Performance fees
Securities lending
Money movement / bank account charges
Dealing costs
Exchange fees
FX costs
Taxes and stamp duty
Custodian fees
Turnover
Market-impact costs
Single swinging price
Bid-ask spread
16 In looking at generating a list of implicit costs and fees, the Transparency Taskforce has generated a list of over 300 costs that are incurred in fund management. For the sake of this report we have picked a range of these that we expect to have some public understanding eg, Foreign Exchange Costs and those that are less likely to be familiar eg, Market Impact Costs. However, it is worth noting that Market Impact Costs appeared in the consumer magazine Which in November 2016 as cost that investors should be concerned about. See, Whittled Away, Michael Trudeau, Which, November 2016.
17 It is worth mentioning that net of costs and fees performance is what matters. However, if there are higher costs going on inside a fund than are necessary and these are being passed on to a pension scheme, then this leakage benefits the fund manager at the cost of the fund. The ability to see and understand these implicit costs is what is likely to help drive value for money and prevent such leakage in the future.
18 Trustees were asked to rank their familiarity with each term on a scale of 0–100 with 0 being ‘I have never heard of it’ and 100 being ‘very familiar’.
Aon Hewitt 13
Figure 7b – Implicit costs and fees – small schemes (AUM<£100m)
0 20 40 60 80 100
Management fees
Performance fees
Securities lending
Money movement / bank account charges
Dealing costs
Exchange fees
FX costs
Taxes and stamp duty
Custodian fees
Turnover
Market-impact costs
Single swinging price
Bid-ask spread
14 Costs, Fees and Trustee Decision-Making
Our key results are as follows:
» Interviews with trustees highlight that investment strategy is their primary concern with costs and fees being a second order consideration;
» Almost half of trustees choose active over passive management;
» Trustees have a longer-term focus;
» The influence of investment consultant recommendation was not as strong as many might expected;
» Trustees are generally good at understanding explicit net of fees analyses, although trustees of smaller schemes did not perform as well;
» Trustees in general are less familiar with implicit fees, and this is particularly true for trustees of smaller schemes;
» All trustees, and especially the trustees of smaller schemes, will need to be better supported in a world where the implicit costs of fund management are part of the decision-making criteria for trustees.
This paper is the second in the series analysing trustees
of UK defined benefit pension schemes and examines the
extent to which trustees understand costs and fees in fund
management. From a behavioural standpoint, the issue is
on the relevance of costs and fees in fund management.
Specifically, the paper aims to understand the issues faced
by trustees concerning both the explicit and implicit
costs and fees associated with fund management.
The key results show that trustees are generally
good at understanding explicit net of fees
questions, although trustees of smaller schemes
did not perform as well. Moreover, trustees are in
general less familiar with implicit fees, and this is
particularly true for trustees of smaller schemes.
Although almost half of trustees would choose active
over passive management, trustees do have a longer-term
focus. Moreover, the influence of investment consultant
recommendation was not as strong as many might
have expected.
Interestingly, from a range of interviews with trustees, it
is investment strategy that is their primary concern, with
costs and fees being a second order consideration.
In looking at the direction of travel with respect to the
Financial Conduct Authority’s Asset Management Market
Study, the likely outcome is one with an increased emphasis
on the implicit costs and fees in fund management.
Trustees, and especially the trustees of smaller schemes,
will need to be better supported in a world where
the implicit costs of fund management are part of the
decision-making criteria for trustees in the future.
Summary
References
Bertrand, M., D. Karlan, S. Mullainathan, E. Shafir, and J. Zinman, (2010). What’s Advertising Content Worth? Evidence from a Consumer Credit Marketing Field Experiment, Quarterly Journal of Economics, 125 .
Carhart, M.M., (1997). On Persistence in Mutual Fund Performance, The Journal of Finance, 52, pp. 57-82. v
Chater, N., S. Huck, and R. Inderst, (2010). Consumer Decision-making in Retail Investment Services, Report to the European Commission (SANCO).
Cremers, M., M. A. Ferreira, P. Matos and L. Starks (2016) Indexing and active fund management: International evidence, Journal of Financial Economics, 120, pp. 539-560.
Fama, E.F. and K. R. French, (1993). Common Risk Factors in the Returns on Stocks and Bonds, Journal of Financial Economics, 33, pp. 3-56.
Páástor, L. and R. F. Stambaugh, (2012). On the Size of the Active Management Industry, Journal of Political Economy, 120, pp. 740-781.
Aon Hewitt 15
Leeds University Business School
Leeds University Business School is a leading full-service European business school with more than 3000 students from around 100 countries, and more than 200 academic staff. The Business School is a faculty of the University of Leeds, one of the largest higher education institutions in the UK, positioned in the top 100 best universities in the world (QS rankings 2016/17) and a member of the Russell group research-intensive universities. The University of Leeds has been named University of the Year 2017 by The Times and The Sunday Times’ Good University Guide.
The Business School is a top ten business and management research institution in the UK, according to the 2014 Research Excellence Framework. In recognition of excellence in research and teaching, the School is proud to hold ‘triple accreditation’ from the three leading international bodies, AACSB, AMBA and EQUIS. The School regularly appears in the top rankings including the Financial Times and The Economist.
The School holds the Small Business Charter award for its role in engaging with regional businesses, and the University has won three high profile national awards for enterprise and entrepreneurship.
For more information on Leeds University Business School, please visit: business.leeds.ac.uk
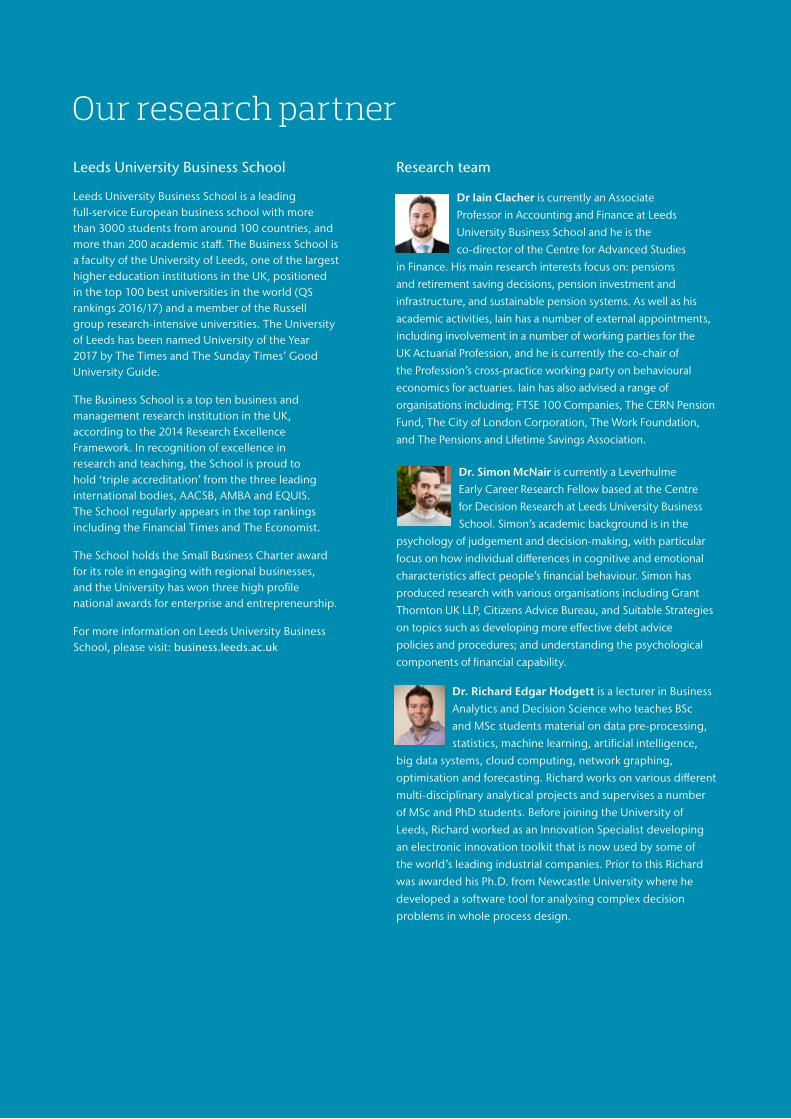
Our research partnerResearch team
Dr Iain Clacher is currently an Associate
Professor in Accounting and Finance at Leeds
University Business School and he is the
co-director of the Centre for Advanced Studies
in Finance. His main research interests focus on: pensions
and retirement saving decisions, pension investment and
infrastructure, and sustainable pension systems. As well as his
academic activities, Iain has a number of external appointments,
including involvement in a number of working parties for the
UK Actuarial Profession, and he is currently the co-chair of
the Profession’s cross-practice working party on behavioural
economics for actuaries. Iain has also advised a range of
organisations including; FTSE 100 Companies, The CERN Pension
Fund, The City of London Corporation, The Work Foundation,
and The Pensions and Lifetime Savings Association.
Dr. Simon McNair is currently a Leverhulme
Early Career Research Fellow based at the Centre
for Decision Research at Leeds University Business
School. Simon’s academic background is in the
psychology of judgement and decision-making, with particular
focus on how individual differences in cognitive and emotional
characteristics affect people’s financial behaviour. Simon has
produced research with various organisations including Grant
Thornton UK LLP, Citizens Advice Bureau, and Suitable Strategies
on topics such as developing more effective debt advice
policies and procedures; and understanding the psychological
components of financial capability.
Dr. Richard Edgar Hodgett is a lecturer in Business
Analytics and Decision Science who teaches BSc
and MSc students material on data pre-processing,
statistics, machine learning, artificial intelligence,
big data systems, cloud computing, network graphing,
optimisation and forecasting. Richard works on various different
multi-disciplinary analytical projects and supervises a number
of MSc and PhD students. Before joining the University of
Leeds, Richard worked as an Innovation Specialist developing
an electronic innovation toolkit that is now used by some of
the world’s leading industrial companies. Prior to this Richard
was awarded his Ph.D. from Newcastle University where he
developed a software tool for analysing complex decision
problems in whole process design.
16 Costs, Fees and Trustee Decision-Making
Contacts
Aon Hewitt empowers organisations and individuals to secure a better future through innovative talent, retirement and health solutions. We advise, design and execute a wide range of solutions that enable clients to cultivate talent to drive organisational and personal performance and growth, navigate risk while providing new levels of financial security, and redefine health solutions for greater choice, affordability and wellness. Aon Hewitt is a global leader in human resource
solutions, with nearly 34,000 professionals in 90 countries serving more than 20,000 clients worldwide. For more information on Aon Hewitt, please visit: aonhewitt.com
Follow Aon on Twitter: twitter.com/Aon_plc
Sign up for News Alerts: http://aon.mediaroom.com/index.php?s=58
About Aon Hewitt
Aon Hewitt
John Belgrove, Senior Partner Consulting | Global Investment Practice +44 (0)20 7086 9021 [email protected]
Tim Giles, Head of UK Investment Consulting Consulting | Global Investment Practice +44 (0)20 7086 [email protected]
Lynda Whitney, FIA, Partner Consulting | Retirement Practice +44 (0)13 7273 3617 [email protected]
Leeds University Business School
Dr Iain Clacher, Associate Professor in Accounting and Finance Deputy Director of the Centre for Advanced Studies in Finance (CASIF) +44 (0)11 3343 6860 [email protected]
Risk. Reinsurance. Human Resources.
About Aon Aon plc (NYSE:AON) is a leading global provider of risk
management, insurance brokerage and reinsurance
brokerage, and human resources solutions and
outsourcing services. Through its more than 72,000
colleagues worldwide, Aon unites to empower results
for clients in over 120 countries via innovative risk
and people solutions. For further information on our
capabilities and to learn how we empower results for
clients, please visit: http://aon.mediaroom.com/
This document and any enclosures or attachments are prepared on the
understanding that it is solely for the benefit of the addressee(s). Unless
we provide express prior written consent, no part of this document
should be reproduced, distributed or communicated to anyone
else and, in providing this document, we do not accept or assume
any responsibility for any other purpose or to anyone other than the
addressee(s) of this document.
Notwithstanding the level of skill and care used in conducting due
diligence into any organisation that is the subject of a rating in this
document, it is not always possible to detect the negligence, fraud, or
other misconduct of the organisation being assessed or any weaknesses
in that organisation’s systems and controls or operations.
This document and any due diligence conducted is based upon
information available to us at the date of this document and takes no
account of subsequent developments. In preparing this document we
may have relied upon data supplied to us by third parties (including
those that are the subject of due diligence) and therefore no warranty
or guarantee of accuracy or completeness is provided. We cannot
be held accountable for any error, omission or misrepresentation of
any data provided to us by third parties (including those that are the
subject of due diligence). This document is not intended by us to form
a basis of any decision by any third party to do or omit to do anything.
Any opinions or assumptions in this document have been derived by
us through a blend of economic theory, historical analysis and/or other
sources. Any opinion or assumption may contain elements of subjective
judgement and are not intended to imply, nor should be interpreted
as conveying, any form of guarantee or assurance by us of any future
performance. Views are derived from our research process and it
should be noted in particular that we can not research legal, regulatory,
administrative or accounting procedures and accordingly make no
warranty and accept no responsibility for consequences arising from
relying on this document in this regard.
Calculations may be derived from our proprietary models in use at
that time. Models may be based on historical analysis of data and
other methodologies and we may have incorporated their subjective
judgement to complement such data as is available. It should be noted
that models may change over time and they should not be relied upon
to capture future uncertainty or events.
Aon Hewitt Limited is authorised and regulated by the
Financial Conduct Authority. Registered in England & Wales.
Registered No: 4396810.
Registered Office:
The Aon Centre
The Leadenhall Building
122 Leadenhall Street
London EC3V 4AN
Copyright © 2017 Aon plc
aon.com
Related Documents