1 Kelley School of Business, Indiana University, Bloomington, IN 47405. Email: [email protected] 2 Kelley School of Business, Indiana University, Bloomington, IN 47405. Email: [email protected] * This paper has benefitted from the response of seminar participants at Alabama, Humboldt, Frankfurt, Illinois, Indiana, INSEAD, Norwegian School of Management, Notre Dame, Penn State and Pittsburgh. Costless Versus Costly Signaling: Theory and Evidence from Share Repurchases * by Utpal Bhattacharya 1 and Amy Dittmar 2 JEL Classification: D80, G14, G30 Key Words: Cheap talk, costly signals, share repurchases First version: January 2001 This version: February 2003

Welcome message from author
This document is posted to help you gain knowledge. Please leave a comment to let me know what you think about it! Share it to your friends and learn new things together.
Transcript

1 Kelley School of Business, Indiana University, Bloomington, IN 47405. Email: [email protected]
2 Kelley School of Business, Indiana University, Bloomington, IN 47405. Email: [email protected]
* This paper has benefitted from the response of seminar participants at Alabama, Humboldt, Frankfurt,Illinois, Indiana, INSEAD, Norwegian School of Management, Notre Dame, Penn State and Pittsburgh.
Costless Versus Costly Signaling:Theory and Evidence
from Share Repurchases*
by
Utpal Bhattacharya1
and
Amy Dittmar2
JEL Classification: D80, G14, G30Key Words: Cheap talk, costly signals, share repurchases
First version: January 2001This version: February 2003

COSTLESS VERSUS COSTLY SIGNALING:
THEORY AND EVIDENCE FROM SHARE REPURCHASES
Abstract
When does a good firm separate itself from a bad firm by “putting its money where its mouth is” and
when does it engage in cheap talk? We develop a simple model in this paper to find out which signaling
mechanism will be used under what circumstances in a capital market. We find, as one would expect, that
the good firm prefers cheap talk over costly signaling, because in the latter method, all of the cost of
separation is being borne by the firm. However, costless signaling can only be used by good firms who are
more undervalued and are more ignored. These restrictions exist because cheap talk will only attract attention
from speculators when scrutiny is likely to uncover more opportunities for trading profits that will cover the
costs of scrutiny. We then test the predictions of the model using a data set of open market share repurchases
that contains firms that employ costless signals (announce share repurchases, but do not repurchase) as well
as firms that employ costly signals (announce share repurchases, and repurchase). The evidence in favor of
the predictions of the model is surprisingly robust.

1
COSTLESS VERSUS COSTLY SIGNALING:
THEORY AND EVIDENCE FROM SHARE REPURCHASES
When does a good firm separate itself from a bad firm by “putting its money where its mouth is” and
when does it engage in cheap talk? Signaling theory predicts that a good firm can separate itself from a bad
firm by giving a costly signal to capital markets; the bad firm will not mimic because the signal is costlier for
the bad firm. A good firm can also separate itself by engaging in cheap talk to attract scrutiny; the bad firm
will not mimic because the bad firm does not gain from being discovered. This paper explores, both
theoretically and empirically, when do good firms use costly signals to separate and when they use costless
signals to separate.
The first contribution of this paper is to develop a simple theoretical model that gives a good firm the
choice between costless and costly signaling in a capital market. This allows us to make precise the
circumstances under which each signaling mechanism will be used. We obtain the following insights from
our theoretical model. The good firm always prefers costless signaling over costly signaling because, in the
latter method, all of the cost of separation is being borne by the firm; whereas, in the former method, all of
the cost of separation is being borne by a speculator who, after his attention has been attracted, finds it
optimal to expend search costs to find out more about the firm. The good firm is, thus, discovered. The bad
firm does not gain from being discovered, and so it does not attract attention. Separation by costless signals,
however, is effective only under very special circumstances in a stock market. This is because the speculator
will only undertake search if he hopes to discover substantial material non-public information about a firm
and then make substantial trading profits to cover the cost of scrutiny. As only good firms, i.e. only
undervalued firms, signal in equilibrium, substantial material non-public information can only be obtained
if the firm is deeply undervalued. Second, the discovery of substantial material non-public information about
a firm is useless if many other speculators discover the same information and compete away all trading
profits. In other words, if the size of informed trading increases, stock prices become more informative, and
so the value of the additional information that can be obtained from costly search diminishes. To summarize,

2
our theoretical model predicts costless signals are effective for more undervalued firms and for more ignored
firms. For other firms, this signaling mechanism will not work, and they have to put their money where their
mouths are – employ costly signals.
The second contribution of our paper is to take the above two testable implications of our theoretical
model to the data. To test our model, we need a signaling mechanism that allows a firm a choice between
a costly and a costless signal. Our data set consists of a sample of firms that have announced open market
share repurchases. This data set offers a unique opportunity to test the predictions of our theoretical model,
because we find that 46% of all firms that announce share repurchase programs do not purchase a single
share within the quarter of or the quarter following the announcement. As a matter of fact, 27% of firms that
announce, do not repurchase within four fiscal years of the announcement or prior to dropping out of
Compustat. Thus, if a repurchase announcement signals value, then these firms simply use the
announcement, which is virtually costless, to attract scrutiny from speculators and have their true value
discovered, whereas the rest of the firms repurchase their shares, which is costly, to signal their true value.
The differences between these two sets of firms should shed some light as to which type of firms use costless
signaling and which type of firms use costly signaling, enabling us to test the predictions of our model.
We test the predictions of our theoretical model using proxies for measuring the two variables of
interest. Our proxy for measuring our first variable of interest, undervaluation, is the amount of positive
information that comes out at the announcement or between the announcement date and the time the firm
reveals if it has used a costly or a costless signal. Since firms do not report stock repurchases until they file
their quarterly statements, the market may not know the type of signal until the close of the next fiscal quarter.
Thus, we assume that the signal corrects the undervaluation within t days after the announcement – where
we take t to be one day, one quarter or two quarters. A classical measure of the amount of undervaluation
is the abnormal returns from the announcement till date t, and this is what we use. Our primary proxy for
measuring our second variable of interest, ignorance, is the number of analyst following. We also use firm
size since the market is typically better informed about large versus small firms.

3
The following are our results from our empirical tests. We find that firms that announce share
repurchases and do not carry them out, have higher cumulative abnormal returns over the announcement
period, have fewer analysts following them, and are smaller than firms which announce share repurchases
and carry them out. These results indicate that firms that are more undervalued and are more ignored are
more likely to use a costless signal. These two pieces of evidence provide strong support for our model.
Our theoretical model liberally borrows insights from two strands of a vast signaling literature. The
first strand, the costly signaling literature, began with Spence (1973). He showed that if the cost of the signal
is higher for the bad type than it is for the good type, the bad type may not find it worthwhile to mimic, and
so the signal could be credible. Riley (1979) formalized the conditions under which such costly signaling
equilibria exist. Numerous papers giving examples of such costly signaling in capital markets followed. An
early paper was by Ross (1977), who showed how debt could be used as a costly signal to separate the good
from the bad. The second strand, the “cheap talk literature” which we call costless signaling in this paper,
began with Crawford and Sobel (1982). They showed that “cheap talk,” defined as a costless, non-binding,
and unverifiable message, could also be a credible signal. They modeled a two-player non-cooperative
information transmission game between a Sender and a Receiver. They demonstrated that the optimal
response of the Receiver after a signal is received may affect the utility of the Sender in a way that it may be
optimal for the Sender to tell the truth. In capital markets, an early paper was by Brennan and Hughes (1991),
who modeled how good firms doing costless stock splits could motivate brokers to provide favorable reports
about them.
In a recent paper, Austen-Smith and Banks (2000) have also allowed both costless and costly
signaling. The main difference between their model and ours is that they view the two types of signals as
complements in a general framework, whereas we model them as substitutes in the specific context of
signaling to capital markets. This means that the focus in Austen-Smith and Banks (2000) is on how costly
signals can improve cheap talk communication, whereas the focus in our model is on when costly signals have
to be used because costless signals will not work.

1 Dittmar (2000) also finds that share repurchases deter takeovers by increasing share prices (see Bagwell (1991)). However, this methodis most commonly linked to self tender offers, not open market repurchases. The latter is the subject of our paper.
4
Our empirical tests also liberally borrow insights from a growing literature. We are not the first to
empirically examine stock repurchases as signals of firm value (see, for example, Asquith and Mullins (1986),
Comment and Jarrell (1991), Dann, Masulis and Mayers (1991), Hertzel and Jain (1991), Lee, Mikkelson and
Partch (1992), and Vermaelen (1981)). However, most of these investigations assume that the repurchase
is a costly signal, which may not be true in an open market stock repurchase program if the firm does not
repurchase stock. Additionally, signaling firm value is not the only reason firms repurchase stock. We use
control variables in our empirical tests to account for the other reasons that firms repurchase stocks, and
which the literature has documented. Dittmar (2000) surveys the hypotheses expounded in the literature to
explain why firms repurchase shares and finds that three other motives are important at different times in the
period 1977 to 1996. The three other motives are: one, share repurchases are an alternative means of
distributing cash to shareholders (see, for example, Brennan and Thakor (1990), and Lucas and McDonald
(1996)); two, share repurchases may be used to tilt leverage ratios towards a target leverage ratio (see, for
example, Bagwell and Shoven (1988), and Havakimian, Opler and Titman (2001)); and three, share
repurchases may be preferred to dividends when a firm has employee stock options outstanding because most
stock options are not dividend-protected and share repurchases allow the firm to distribute cash without
diluting the per-share value of the stock. This third motive is particularly important if managers hold a lot
of stock options (see, for example, Jolls (1996), Kahle (2001), Fenn and Liang (2001), and Weisbenner
(2001)).1
Finally, our theoretical and empirical analyses also address two puzzles in the repurchase literature:
one, why some firms announce open market share repurchases, but never repurchase any stock; and two, why
stock prices increase at the announcement of an open market repurchase program, even though the
announcement does not commit the firm to purchase any stock, and many firms do not. Our hypotheses for
these two puzzles, as formalized in our theoretical model and evidence provided in our empirical investigation

5
are: in some special cases, the mere announcement of an open market share repurchase attracts scrutiny from
speculators, who then discover the true value of the firm; and two, this causes stock prices to increase at the
announcement of an open market repurchase program, even though the announcement does not commit the
firm to purchase any stock.
Oded (2000), like us, also puzzles as to why the announcement of an open-market share repurchase
program, which involves no commitment, is regarded as good news by the market. Ikenberry and Vermaelen
(1996) argue that this may be because announcements are tantamount to creations of valuable options of
buying undervalued shares in the future, but Oded (2000) argues that, if this were the reason, all types of
firms would make such announcements. So, in equilibrium, such “cheap talk” cannot create value. He then
goes on to develop a three-period signaling model that delivers positive announcement returns. In our paper,
we contend that “cheap talk” can create value when it attracts the attention of speculators, who go on to
discover the true value of the firm. We then put our hypothesis to the test.
The plan of the rest of the paper is as follows. We introduce the model in Section I. In Section II
we analyze the choice between costless signaling and costly signaling. The testable implications are
formalized in Section III. The data is discussed in Section IV. Section V is devoted to the empirical tests of
the model. Section VI concludes.
I. Model
There are two types of firms, good firms and bad firms, and each are equally likely. The good firms
as well as the bad firms are equally likely to have good projects or bad projects. The bad projects of both the
good firms as well as the bad firms have a payoff of - :. The good project of the bad firm has a payoff of +:,
whereas the good project of the good firm is equally likely to have a payoff of +: or a payoff of +a:. Here
a > 1. This asymmetry ensures that “good news is uncertain, but bad news is certain” for the market, an

2 The reason we need the “good news is uncertain, but bad news is certain” assumption for a cheap talk equilibrium is that we need thesearch strategy of the trader to be state-contingent: search only the good firm that is attracting attention. The same critical assumption drives the resultsof the Bhattacharya and Krishnan (1999) paper. How valid is this assumption? Bhattacharya and Krishnan (1999) tested this. They obtained a sampleof 1259 firms, each of which had data for fifteen quarters of 5-day returns after an earnings announcement. They then computed, for each firm, themean and the skewness of cumulative abnormal returns (CAR) in this 5-day event window. The cross-sectional statistics of these firm-specific metricwere as follows. The mean of the mean was indistinguishable from zero; the skewness ranged from a high of 0.67 to a low of -0.71, with a mean of0.009. Thus, good news is more uncertain than bad.
6
assumption that is critical for delivering a cheap talk equilibrium.2
Who knows what and when? This is given in Figure 1 below.
______________________
Insert Figure 1 about here
______________________
A. At time t
At time t, the world comes to know that all firms will have access to a positive net present value
project at time t+4. The NPV of this project is ". The investment required to start this project at time t+4
is I, which, with some loss of generality, we normalize to - :. This ensures that, if the firm does not do a
costly signal, the project can be funded from payoffs in all states for all types of firms.
B. At time t+1
At time t+1, a firm is born. As mentioned before, this firm could be good or bad with equal
probability. The manager of the firm knows the type of her firm. She may decide to keep quiet or to signal
its value. Value could be signaled in one of two ways: signal costlessly by attracting scrutiny or do a costly
signal by spending money m. The manager will take the action that maximizes the expected price of her
firm’s share. In other words, there are current shareholders who employ the manager to maximize the
expected share price, with agency problems, if any, resolved by the optimal contract between shareholders
and the manager.
C. At time t+2
At time t+2, it becomes known to all market participants whether a firm has a good project or a bad
project, though it is not publicly known who this project belongs to, a good firm or a bad firm .

3 The Kyle (1985) model gives the same results in our binary framework. Krishnan (1992) uses a binary framework to show the equivalencebetween Glosten-Milgrom (1985) and Kyle (1985), given identical parametric assumptions.
7
D. At time t+3
At time t+3, after receiving the public signal at time t+2, and after observing the action of the firm
at time t+1 – which, recall, could be a costless signal or a costly signal or inaction – a risk-neutral trader can
acquire, at a cost c, additional private information about the firm. This additional private information is a
costly private signal he gets telling him exactly what the project payoff at t+4 will be. This information cost
could be interpreted as the time and money spent doing further investigations by consulting an in-house
expert or an outside expert. The information set of the trader will therefore consist of his observation of the
manager’s actions, a piece of public information, and the outcome of incremental costly information
acquisition if he does any search.
E. At time t+3.5
At time t+3.5, there is a market for shares of these firms. The details of this market are inspired by
the extensive form introduced in Glosten and Milgrom (1985).3 There is a risk-neutral market maker who
commits himself to offer a liquidity supply schedule. To be specific, he commits himself to offer share prices
that are conditioned on the manager’s action, the public information, and his observation of order flows. We
allow only three order flows: +q, +1 and -1. We exogenously restrict the size of the order flows, as did
Glosten-Milgrom (1985), to prevent infinite orders from risk-neutral traders. Share prices are set such that
the market maker’s conditional expected profit in this competitive market is zero. In other words, the share
price equals the conditional expected value of the firm, a conditioning that is done with respect to the market
maker’s information set. The market maker’s information set is his observation of the manager’s actions, the
public information, and his observation of order flow.
Order flows are noisy. They could be information-based or non-information based. The logic for
making this assumption on order flow noise is now standard (see, for example, Grossman and Stiglitz (1980)).
Without it, the informed trader’s order would fully reveal his private information, and thus there would be

4 It is standard in market micro structure models and noisy rational expectations models to introduce noise in the order flow in this way.In some models, the non information-based noise is modeled, whereas in other models, it is assumed to be coming from noise traders. In most models,the non information-based noise is symmetric: there are as many buy non information-based orders as there are sell non information-based orders.There is no conceptual reason for assuming symmetry. Allen and Gorton (1982) derive intriguing results on price manipulation when non information-based orders are asymmetric.
8
no incentive to collect costly information to trade. We will assume that the small orders, +1 and -1, are
information-based, whereas the large order, +q, is information-based with a probability B. This asymmetry
ensures that “good news is uncertain, but bad news is certain” for the market-maker as well, an assumption
that is critical for delivering a cheap talk equilibrium.4
At t+3.5, the risk-neutral trader gives an order flow to maximize his expected profits. This order
could be, as mentioned before, -1, +1, or +q.
F. At time t+4
At t+4, since the -: funding required for the positive net present value project comes from the payoffs
of the projects, and since the manager used up cash m for signaling (m equals zero for costless signaling or
if the manager keeps quiet) at time t+1, the manager may have a shortfall of cash for the funding. This
shortfall is
s = Max [(-:) - (Project payoff at time t+4 – m), 0] (1).
She will have to borrow this shortfall s; otherwise, the positive NPV project will not be financed. External
borrowing, as opposed to internal financing, is costly. Let the cost of borrowing the shortfall s be denoted
by b(s). We shall assume that b(0) =0, and that b is increasing in s.
The payoffs are revealed. Portfolios are consumed.

9
II. Equilibria
From the point of view of the manager of the good firm, it is apparent in our model that if she could,
she would like to separate her firm by attracting scrutiny rather than incurring the deadweight cost of a costly
signal. The reason this is true is because in the former case, the cost of separation is being borne by the
strategic trader, who may find it in his interest to expend search costs and differentiate these firms, whereas
in the latter case, the cost of separation is being borne entirely by the firm. It should be mentioned here that
this unambiguous preference for costless signals over costly signals is an artifact of our model; in more
general models, this result may not hold. The reason this result may not hold in more general models, as in
the model of Austen-Smith and Banks (2000), is because the Receiver of the signal can pass all of the costs
of search to the Sender. As these search costs are passed entirely to the noise traders in our model, this will
not happen here. This allows us to claim that the manager of the good firm will always like to separate by
attracting scrutiny, but if that is not possible, costly signaling is the last resort.
What are the special circumstances under which costless signaling is possible? We now explore this
question.
A. Separating by costless signaling
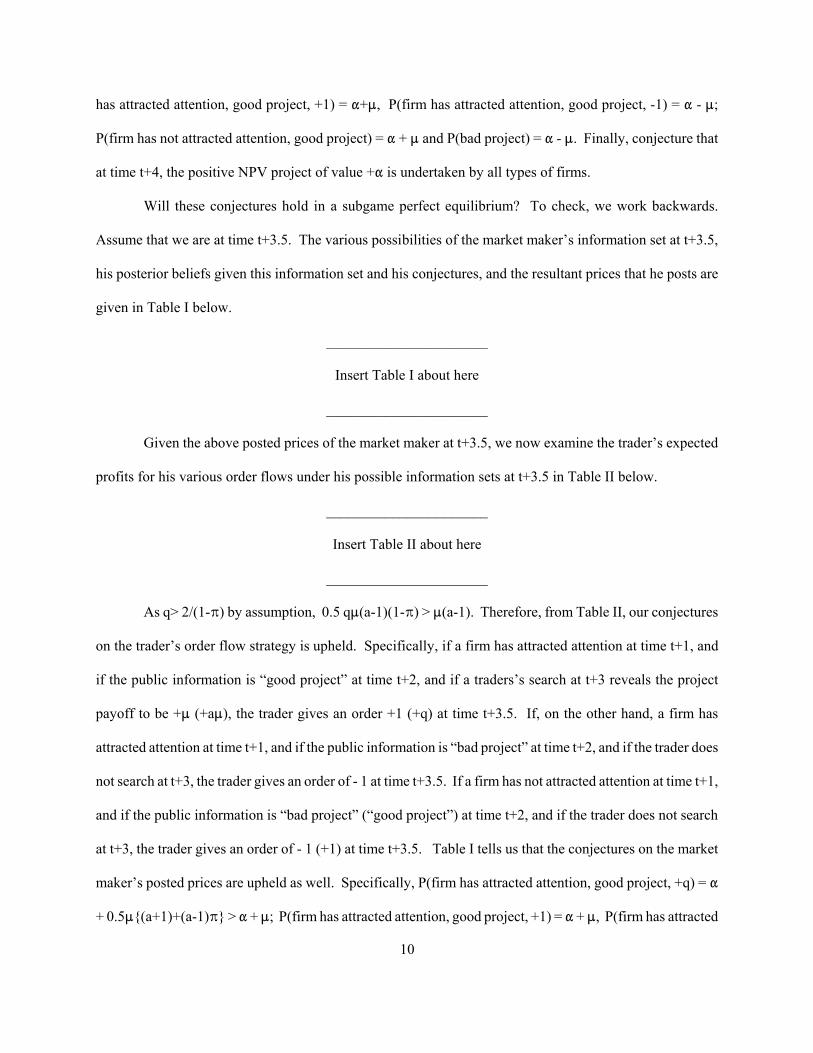
Assume that q> 2/(1-B) and c < 0.25(a-1):[q(1-B) -2]. Conjecture that at time t+1 only good firms
attract attention. If a firm has attracted attention at time t+1, and if the public information is “good project”
at time t+2, conjecture that the trader searches at time t+3. If his search reveals the project payoff to be +:
(+a:), conjecture that the trader gives an order +1 (+q) at time t+3.5. If a firm has attracted attention at time
t+1, and if the public information is “bad project” at time t+2, conjecture that the trader does not search, and
he gives an order of - 1 at time t+3.5. If a firm has not attracted attention at time t+1, and if the public
information is “bad project” (“good project”) at time t+2, conjecture that the trader does not search, and he
gives an order of - 1 (+1) at time t+3.5. Conjecture that the posted prices of the market maker, which are set
at time t+3.5, are P(firm has attracted attention, good project, +q) = " + 0.5:{(a+1)+(a-1)B} > " + :; P(firm
10
has attracted attention, good project, +1) = "+:, P(firm has attracted attention, good project, -1) = " - :;
P(firm has not attracted attention, good project) = " + : and P(bad project) = " - :. Finally, conjecture that
at time t+4, the positive NPV project of value +" is undertaken by all types of firms.
Will these conjectures hold in a subgame perfect equilibrium? To check, we work backwards.
Assume that we are at time t+3.5. The various possibilities of the market maker’s information set at t+3.5,
his posterior beliefs given this information set and his conjectures, and the resultant prices that he posts are
given in Table I below.
______________________
Insert Table I about here
______________________
Given the above posted prices of the market maker at t+3.5, we now examine the trader’s expected
profits for his various order flows under his possible information sets at t+3.5 in Table II below.
______________________
Insert Table II about here
______________________
As q> 2/(1-B) by assumption, 0.5 q:(a-1)(1-B) > :(a-1). Therefore, from Table II, our conjectures
on the trader’s order flow strategy is upheld. Specifically, if a firm has attracted attention at time t+1, and
if the public information is “good project” at time t+2, and if a traders’s search at t+3 reveals the project
payoff to be +: (+a:), the trader gives an order +1 (+q) at time t+3.5. If, on the other hand, a firm has
attracted attention at time t+1, and if the public information is “bad project” at time t+2, and if the trader does
not search at t+3, the trader gives an order of - 1 at time t+3.5. If a firm has not attracted attention at time t+1,
and if the public information is “bad project” (“good project”) at time t+2, and if the trader does not search
at t+3, the trader gives an order of - 1 (+1) at time t+3.5. Table I tells us that the conjectures on the market
maker’s posted prices are upheld as well. Specifically, P(firm has attracted attention, good project, +q) = "
+ 0.5:{(a+1)+(a-1)B} > " + :; P(firm has attracted attention, good project, +1) = " + :, P(firm has attracted

11
attention, good project, -1) = " - :; P(firm has not attracted attention, good project) = " + : and P(bad
project) = " - :.
Let us now go to time t+3, where the trader has to make a decision on whether to incur an additional
cost c to find out more about the firm. We need to show that the trader’s search strategy – to search only
when a firm has attracted attention at t+1 and the public information at t+2 is “good project” – is optimal.
It is clear from the market maker’s posted prices in Table I that share prices are fully-revealing in all
states except the state where a firm has attracted attention at t+1 and the public information at t+2 is “good
project.” We know from Grossman and Stiglitz (1980) that costly search is unprofitable under fully revealing
prices. This implies that the only state where search could be profitable is the state where a firm has attracted
attention at t+1 and the public information at t+2 is “good project.” If the trader searches in this state he is
equally likely to discover a: or :. From Table II, his optimal order flow would be, respectively, +q or +1,
and the consequent gross expected profits would be, respectively, 0.5 q:(a-1)(1-B) and 0. Therefore, the net
expected profits from search is
0.25q:(a-1)(1-B) - c (2).
If he does not search, and gives an order of +1, his net expected profit is going to be
1 [0.5(a:+"-(:+")) + 0.5(:+" -(:+"))] = 0.5:(a-1) (3).
If he does not search, and gives an order of +q, his net expected profit is going to be
q [0.5(a:+" -0.5:{(a+1)+(a-1)B}+" ) + 0.5(:+" -0.5:{(a+1)+(a-1)B} +" )] < 0 (4).
Therefore, search when the firm has attracted attention and the public information is “good project” is optimal
if (2) > (3). This gives us
c < 0.25(a-1):[q(1-B) -2] (5).
This was the assumption on the upper bound of c we had made earlier. As we had also assumed that
q> 2/(1-B) (6),
the right-hand side of inequality (5) is positive. Therefore, if inequalities (5) and (6) hold, the trader will only
search the firm that has separated by attracting scrutiny and the public information is “good news.” He will

12
not search the firm in any other case. His optimal orders will be as given before, and the market maker’s
prices will be posted as shown in Table I.
Let us now go to time t+1. To complete the proof, we have to show that, given these strategies of
the other agents in the future, their conjectures on the signaling behavior of the managers at time t+1 will be
upheld in equilibrium. Specifically, we need to check that the conjectures that only the good manager attracts
attention at t+1, and that both types of firms undertake a project of positive NPV +" at t+4, are upheld.
At time t+1, if the manager of the good firm is expected to separate herself by attracting scrutiny and
she does, the price of her firm at t+3.5 will be (-:+") half the time, (+:+") a quarter of the time, and
0.5:{(a+1)+(a-1)B} +" a quarter of the time. So the expected price of this expected price maximizing good
manager, if she attracts attention, is going to be 0.125:(a+(a-1)B) + " > ". If the manager of the bad firm
is expected to keep quiet and she does, the price of her firm at t+3.5 will be (-:+") half the time and (+:+")
half the time. So the expected price of this expected price maximizing bad manager, if she keeps quiet, is
going to be ". If the manager of the good firm is expected to attract attention, but she decides to keep quiet,
she will not invite search from the trader if she gets a “good project.” The trader will give an order of +1
here, which will beget a price of (+:+"). So the price of her firm at t+3.5 will be (-:+") half the time and
(+:+") half the time, giving her an expected share price of of +". This is less than the expected share price
she would get if she attracted attention. So she would separate herself by attracting attention. However, if
the manager of the bad firm, who is expected to keep quiet but she does not, will invite search from the trader
if she gets a “good project.” The search will reveal a payoff of +: to the trader, who will give an order of
+1, which will beget a price of (+:+"). So the price of her firm at t+3.5 will be (-:+") half the time and
(+:+") half the time. So the expected price of this expected price maximizing bad manager, if she decides
to attract attention, is going to be ". This is the same expected share price she would obtain if she kept quiet.
Assuming an epsilon fixed cost of attracting scrutiny, the bad manager will prefer to keep quiet.
PROPOSITION 1: If the cost of search is below an upper bound, and there is an epsilon fixed cost
of attracting scrutiny, we obtain a costless signaling equilibrium. In this equilibrium, the good type will

13
separate by attracting scrutiny, and will be discovered to be good. The bad type will keep quiet, and no one
will investigate it.
If the cost of search is greater than the upper bound, that is inequality (5) is violated, there will not
be any search. If there is no search, traders will not be able to induce separation. Under this situation, the
good firm will have no recourse other than to resort to costly signaling to separate itself. We now consider
this equilibrium.
B. Separating by costly signaling
Our model on costly signaling follows the classic structure laid out by Spence (1973). The good firm
separates itself by spending money m, whereas the bad firm does not do anything. At time t+4, the positive
NPV project of value +" is undertaken by all types of firms. Suppose these are the conjectures of the market.
We will now show that these conjectures will be upheld in a separating equilibrium.
Assume that financing is not needed only when the project payoff is a:. Later we will give the
condition on exogenous parameter values that will guarantee this assumption. If the bad firm stays true, does
not spend cash m at t+1, and is regarded as a bad firm, its value, is
" + 0.5(:) + 0.5(-:) = " (7).
If the good firm stays true, spends cash m at t+1, and is regarded as a good firm, its value, is
" + 0.5(-:) + 0.5(0.5(:) + 0.5(a:)) - 0.75b(m) = " + 0.25:(a-1) - 0.75b(m) (8).
If the bad firm deviates by spending cash m at t+1, and is perceived as a good firm, its value, is
" + 0.25:(a-1) - b(m) (9).
If the good firm deviates by not spending cash m at t+1, and is perceived as a bad firm, its value, is
" (10).
Solve for m that makes (7) = (9). It will solve
b(m*) = 0.25:(a-1) (11).
It is easy to see that if m* solves (11), (8) > (10). As the good type will not like to spend more money
than is needed to separate, it will spend just m*. The bad type will be indifferent. Finally, to ensure that

5 In this paper, repurchasing stock is costly because this leads to a cash shortfall, which in turn leads to costly external financing. The extantliterature has modeled this cost in different ways. In Brennan and Thakor (1990), for example, share repurchase are costly because they redistributewealth from uninformed shareholders to informed shareholders. Our results depend on share repurchases being costly; they do not depend on whythey are costly.
14
financing is not needed only in the best state, when the payoff is a:, our exogenous parameters have to satisfy
the following condition: : - (-:) = 2: < m*, i.e.,
: < 0.5m* = 0.5 b-1 {0.25:(a-1)} (12)
PROPOSITION 2: If c is above a lower bound, we have a costly signaling equilibrium. In this
equilibrium, the good type will separate by spending money m*. The bad type will not spend any money.
Note that in the above model demonstrating costly signaling, in the interest of consistency, we
retained the critical assumption that drives the costless signaling result: “good news is uncertain, but bad news
is certain.” This asymmetry is not needed for our costly signaling result. The only critical assumption needed
for the costly signaling result is that good firms have a lower probability of a cash shortfall than bad firms
at t+4. This ensures that if bad firms try to mimic the good firm, they will have to undertake costly
refinancing more often.5
III. Testable Implications
Our theoretical model tells us that the good firm prefers costless signaling over costly signaling
because, in the former method, all of the cost of separation is being borne by the speculator who, after his
attention has been attracted, finds it optimal to expend search costs to find out more about the firm. The good
firm is discovered. The bad firm does not gain from being discovered; so it does not attract attention.
Speculators will only undertake search if they hope to discover substantial material non-public
information about a firm and then make substantial trading profits to cover the cost of scrutiny. As only good
firms, i.e. undervalued firms, signal, substantial material non-public information can only be obtained if the
firm is deeply undervalued. The parameter a distinguishes the good firm from the bad firm. If a is 1, both
firms are equivalent. As a increases, their difference increases, and, if the firms are pooled, the higher is the
undervaluation of the good firm. Note that the upper bound of c – given in (5) – for which costless signaling

6 The mass of informed traders, B, is exogenous in our model. It could be argued that the mass of informed traders is endogenous, andit should depend on the cost of search. We claim that this is not going to make any difference to the comparative statics. The reason is the following.If the only barrier to becoming a speculator is the cost of gathering information, the number of speculators in equilibrium will be such that if anadditional speculator entered, he will lose money. Now suppose there is a shock in firm value which leads to a temporary disequilibrium. Theadditional speculator can now, perhaps, make short-term profits. He will make more short-term profits in the firm which had fewer speculators to beginwith because there is less competition. Such firms will, therefore, attract the marginal speculator more.
15
works increases as a increases. This is depicted in Figure 2.
_________________
Insert Figure 2 here
_________________
Figure 2 gives us the first testable implication of our model. Everything else equal, especially
holding the cost of search equal, more is the undervaluation of the good firm, greater is the likelihood of the
good firm separating itself by a costless signal rather than a costly signal.
The discovery of substantial material non-public information about a firm is useless if many other
speculators discover the same information and compete away all trading profits. In other words, if the size
of informed trading increases, stock prices become more informative, and so the value of the additional
information that can be obtained from costly search diminishes. To put it another way, more is the informed
trading, less is the benefit from search. The parameter B is a measure of the magnitude of informed trading.
If B increases, informed trading increases, and if B equals 1, all prices are fully revealing, and there is no
incentive to collect costly information. Note that the upper bound of c – given in (5) – for which costless
signaling works decreases as B increases. This is depicted in Figure 3.
_________________
Insert Figure 3 here
_________________
Figure 3 gives us the second testable implication of our model. Everything else equal, especially
holding the cost of search equal, more is the level of informed trading, less is the likelihood of the good firm
separating itself by a costless signal rather than a costly signal.6

7 Note that we do not claim that announcement of open market share repurchases is the only costless signal available to firms. Our claimis simply that announcement of open market share repurchases is that rare corporate signal that could be either costly or costless, depending onwhether the firm repurchases its own shares or it does not.
16
IV. Sample and Data
It is essential to the tests of the implications of our model that the firm has a choice of using a costless
signal, which means that it has the freedom not to carry through an announced transaction. It is equally
essential that some firms actually make this choice of not carrying through an announced transaction. The
announcement of open market stock repurchases meets both of these requirements. When the board of
directors approves an open market stock repurchase program, the firm typically announces the program to
the public. They do this because, if they do not, the repurchase may be a violation of the safe harbor
provisions under the stock price manipulation provisions of the Securities and Exchange Commission.
According to Stephens, Jagannathan and Weisbach (2000), there is little evidence of firms repurchasing stock
without first announcing the program. However, once the firm announces the repurchase program, it is not
obligated to repurchase stock. Further, as will be shown in Table III, a significant proportion of firms
announcing a stock repurchase never actually repurchase stock. This means that these firms signal with the
announcement, but never incur the cost of the signal. Thus, open market stock repurchase announcements
provide a unique opportunity to test the choice between costless and costly signals, and to investigate why
some firms announce a share repurchase program and never repurchase any stock, whereas other firms
announce and repurchase. 7
The initial sample consists of all firms announcing an open market stock repurchase between 1985
and 1995 as listed on Securities Data Corporation’s Mergers and Acquisitions database. We exclude
announcements in the last quarter of 1987, because the magnitude of the number of announcements suggests
that these announcements may differ from typical repurchase programs. Netter and Mitchell (1989) show
that twice as many repurchases were announced in this quarter than the prior three quarters of 1987. We do
not consider repurchase announcements subsequent to 1995 because we wish to examine if the firm

8This measure is the same as that used in Dittmar (2000) and Grullon and Michaely (2002).
17
repurchases stock for four fiscal years following the announcement. We limit our analysis to the first
repurchase announcement by each firm during the sample period. This is because these subsequent
announcements result in overlapping event windows when we consider the actual repurchases for the years
following the repurchase. Additionally, the information content of subsequent announcements may differ
from that of the initial announcement. We further require that the firms are listed on Compustat in the quarter
of the announcement. This results in a sample of 2297 firm repurchase announcements.
To determine if a firm repurchases stock, we use the Compustat data item Purchase of Stock. As
discussed in Stephens and Weisbach (1998), these data overstate stock repurchases because they include: 1)
conversions of class A, class B, and special stock into common stock; 2) conversions of preferred stock into
common stock; 3) purchases of treasury stock; 4) retirement or redemption of common stock; 5) retirement
of preferred stock; and 6) retirement or redemption of redeemable preferred stock.8. In this paper, we are only
interested in item 3, the purchase of treasury stock. We therefore adjust stock repurchases by reducing
Purchase of Stock by any decrease in preferred stock that occurs. This removes items 2, 5, and 6. The
resulting number may still be overstated by the amount of class A, class B, and special stock converted into
common stock, and the amount of retired common stock. However, most firms have only a single class of
stock and the retirement of stock is much less frequent than stock repurchases. Additionally, we measure if
the firm repurchases stock, not the amount of the repurchase; thus, these errors should have little impact on
our results.
Data on the number of analysts following the stock are from IBES. The market capitalization and
accounting data are from Compustat. The daily and quarterly stock returns are from CRSP. All explanatory
variables, except returns, are measured as of the fiscal year end prior to the year of the repurchase
announcement.
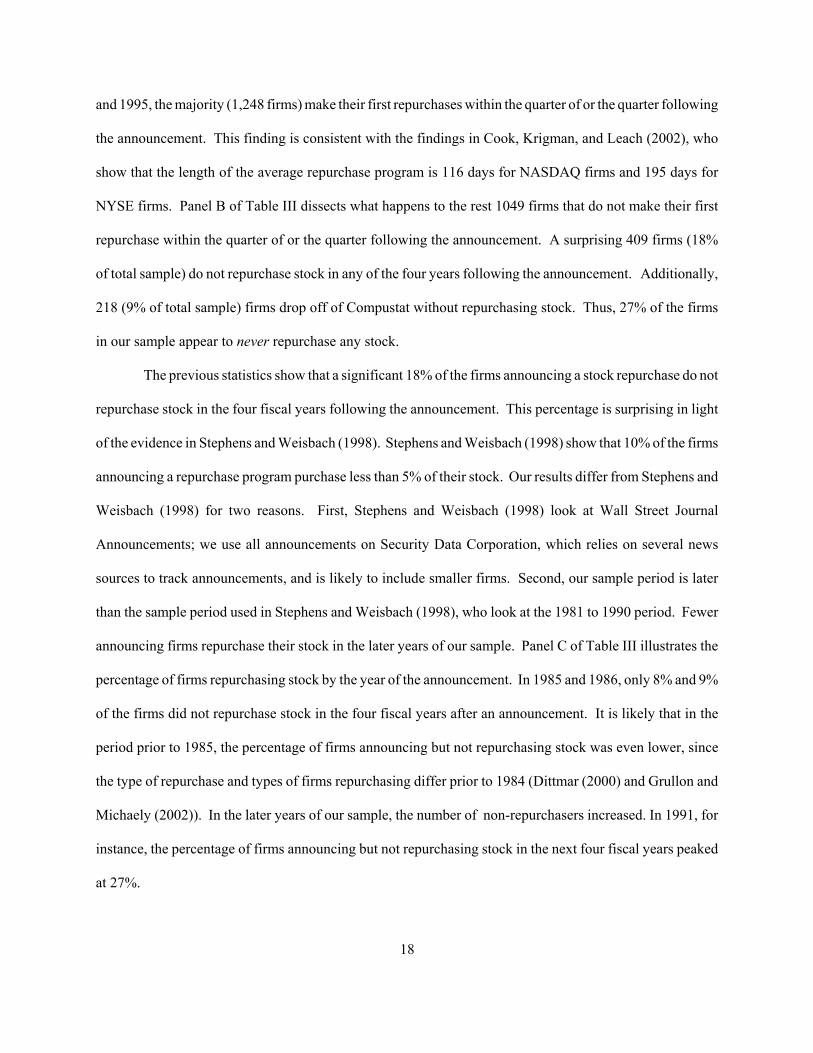
Panel A of Table III shows that of the 2,297 firms that announce repurchase programs between 1985
18
and 1995, the majority (1,248 firms) make their first repurchases within the quarter of or the quarter following
the announcement. This finding is consistent with the findings in Cook, Krigman, and Leach (2002), who
show that the length of the average repurchase program is 116 days for NASDAQ firms and 195 days for
NYSE firms. Panel B of Table III dissects what happens to the rest 1049 firms that do not make their first
repurchase within the quarter of or the quarter following the announcement. A surprising 409 firms (18%
of total sample) do not repurchase stock in any of the four years following the announcement. Additionally,
218 (9% of total sample) firms drop off of Compustat without repurchasing stock. Thus, 27% of the firms
in our sample appear to never repurchase any stock.
The previous statistics show that a significant 18% of the firms announcing a stock repurchase do not
repurchase stock in the four fiscal years following the announcement. This percentage is surprising in light
of the evidence in Stephens and Weisbach (1998). Stephens and Weisbach (1998) show that 10% of the firms
announcing a repurchase program purchase less than 5% of their stock. Our results differ from Stephens and
Weisbach (1998) for two reasons. First, Stephens and Weisbach (1998) look at Wall Street Journal
Announcements; we use all announcements on Security Data Corporation, which relies on several news
sources to track announcements, and is likely to include smaller firms. Second, our sample period is later
than the sample period used in Stephens and Weisbach (1998), who look at the 1981 to 1990 period. Fewer
announcing firms repurchase their stock in the later years of our sample. Panel C of Table III illustrates the
percentage of firms repurchasing stock by the year of the announcement. In 1985 and 1986, only 8% and 9%
of the firms did not repurchase stock in the four fiscal years after an announcement. It is likely that in the
period prior to 1985, the percentage of firms announcing but not repurchasing stock was even lower, since
the type of repurchase and types of firms repurchasing differ prior to 1984 (Dittmar (2000) and Grullon and
Michaely (2002)). In the later years of our sample, the number of non-repurchasers increased. In 1991, for
instance, the percentage of firms announcing but not repurchasing stock in the next four fiscal years peaked
at 27%.

9 If the announcement occurs in the last 2 trading days of the quarter, the quarter of the announcement is defined as the following quarter.
19
V. Empirical Tests
Our theoretical model relies on investors being able to determine if a firm uses a costless or a costly
signal. Thus, in the context of stock repurchases, it is important that investors know if the firm repurchased
stock. Unfortunately, in the U.S., firms do not disclose repurchases until their quarterly statements. We
therefore define a repurchaser (non-repurchaser) as a firm that has announced an open market share
repurchase and has repurchased (has not repurchased) in the quarter of or following the announcement. We
examine two quarters because the announcement may occur late in the first quarter and we need to allow
sufficient time for the firm to repurchase stock.9 Robustness checks with different time windows are
conducted in Table VII. The results do not change.
Our theoretical model predicts that a firm will chose a costless signal if the signal attracts scrutiny;
otherwise, the firm must put its money where its mouth is, and provide a costly signal. The signal will attract
scrutiny if the benefit to search is high. This is true for deeply undervalued firms, because the potential
capital gains to be realized from discovering large undervaluations and trading on that information is high.
Thus, our theoretical model predicts that more undervalued firms use a costless signal (announce share
repurchases without actually repurchasing) for separating, whereas less undervalued firms, where the benefits
to search are low, will use a costly signal (announce share repurchases and actually repurchase) for separating.
Vermaelen (1981), Dann (1981), Comment and Jarell (1991) and Grullon (2000) show that firms
announcing stock repurchases are undervalued, and that the announcement is a signal of their undervaluation.
Obviously, some firms are more undervalued than others. We measure undervaluation as the abnormal return
over the announcement period using three windows. The first window is the three days surrounding the
announcement, t-1 to t+1. We measure the cumulative abnormal return over this window using a market
model, the CRSP value-weighted market return, and a comparison period of –200 to –50 trading days. There
are two problems with a three day window: first, it may take more than three days to resolve the

10 Ikenberry, Lakonishok, and Vermaelen (1995) show that these narrow windows may not be sufficient to measure the full extent ofundervaluation. They provide evidence that repurchasing firms outperform non-repurchasing firms in the three years following the announcement.However, because our theoretical model relies entirely on investors interpreting one particular signal, we find it prudent to curtail the influence ofconfounding events by using a shorter window.
11 Several of the variables investigated are not available for all sample firms.
20
undervaluation and, second, as share repurchases are not disclosed immediately, shareholders will not be able
to distinguish between costly and costless signals. Our second measure of undervaluation is the buy and hold
abnormal return over the quarter of the announcement. We calculate the abnormal returns by subtracting out
the expected return, calculated using the CRSP value-weighted market return over the quarter and the firm
beta calculated over the 1985 to 1995 sample period. Finally, as the primary definition of a repurchaser (non-
repurchaser) in our paper is a firm that has announced an open market share repurchase and has repurchased
(has not repurchased) in the quarter of or following the announcement, our third measure of undervaluation
is the buy and hold abnormal return over these two quarters. The abnormal returns over these two quarters
are computed in the same way we computed abnormal returns over one quarter.10
Our theoretical model also predicts that the benefit to search is high when the ignorance in the market
about the firm is high. Thus, our theoretical model predicts that more ignored firms use a costless signal
(announce share repurchases without actually repurchasing) for separating, whereas less ignored firms, where
the benefits to search are low, will use a costly signal (announce share repurchases and actually repurchase)
for separating. In this paper, we use the number of analysts and two measures of firm size, the natural log
of the market capitalization and the natural log of assets, as measures for the lack of market ignorance about
a firm.
A. Summary Firm Characteristics of the Two Sub-Samples
Table IV presents summary statistics and tests for differences between the repurchasing and non-
repurchasing firms using t-tests for unequal, unpaired samples and Wilcoxon Rank-sum tests.11
Panel A describes our measures of ignorance; it depicts the number of analysts and firm size of the
repurchasing and non-repurchasing firms in the year prior to the repurchase announcement. Unfortunately,

21
IBES only follows 1,405 of the 2,297 sample firms. Thus, we assume that any firm not covered by IBES
has no analyst following. Though this assumption is not perfect, it is likely that firms not on IBES have
significantly less analyst following. To check the impact of this assumption, we repeat all the analysis
presented in this paper using only those firms that IBES covers. The results are unchanged. The mean
(median) repurchasing firm has 5.74 (2) analysts following it in the year before the announcement. The mean
(median) non-repurchasing firm has 3.39 (1) analysts following it in the year before the announcement. The
difference between the repurchasing and non-repurchasing firms’ mean and median number of analysts is
statistically significant. Thus, non-repurchasing firms are more ignored.
It could be argued that any analyst following will improve information and, thus, the proper metric
is a dummy variable if the firm has at least one analyst following it. Based on this dichotomous variable, the
repurchasing firms are more followed: 38% of repurchasing firms have no analyst following, whereas 50%
of the non-repurchasers have no analyst following. We repeat all the analysis presented in this paper using
this alternative measure. The results are unchanged. These statistics support the implications of the
theoretical model: firms that announce but do not repurchase are the ignored firms. Consistent with this
interpretation, repurchasing firms are also significantly larger than non-repurchasing firms, as measured by
the natural log of market capitalization or total assets.
Panel B of Table IV shows our measures of undervaluation. The three-day abnormal returns for
repurchasers and non-repurchasers are not significantly different. However, the one and the two quarter
abnormal mean or median returns for non-repurchasing firms are significantly higher than those for
repurchasing firms. This indicates that firms using stock repurchases as a costless rather than a costly signal
are more undervalued than those using a costly signal. Specifically, the median two quarter abnormal return
is six percent for the non-repurchasing firms and one percent for the repurchasing firms. Both sub-samples’
median abnormal returns are significantly greater than zero.
Our theoretical model focuses only on the signaling motive for repurchasing stock. However, there
are several other reasons why firms may repurchase stock. We control for these motives. Summary statistics

22
of these control variables are presented in Panel C of Table IV. One of the dominant motives firms
repurchase stock is to distribute excess cashflow. We measure the firm’s cashflow as its operating income
before depreciation divided by total assets in the fiscal year prior to the announcement; its cash balances as
the amount of cash and marketable securities divided by assets in the fiscal year prior to the announcement;
one measure of growth opportunity as the market value of equity plus the book value of debt divided by the
book value of assets; and another measure of growth opportunity as the ratio of research and development
expenses to sales in the fiscal year prior to the announcement. Research and development expense is assumed
to be zero for any firm with missing data. Panel C shows that repurchasing firms have significantly higher
cash flow. However, the difference between the sub-samples’ cash balances and growth opportunities is
inconclusive. Table IV also shows that the average repurchasing firm has a higher dividend payout ratio
(common dividends paid divided by operating income before depreciation), but the difference is not
significant. As stock repurchases absorb equity and therefore increase the firm’s leverage ratio, the firm may
use a stock repurchase to achieve its target debt ratio (Bagwell and Shoven (1988) and Havakimian, Opler
and Titman (2001)). We measure the leverage ratio as total debt net of cash balances divided by assets in the
fiscal year prior to the announcement. Table IV shows that the leverage ratios of repurchasing firms are
significantly lower than those of non-repurchasing firms. Also, since employee stock options are typically
not dividend protected, firms with a high level of stock options outstanding may prefer repurchases to
dividends since repurchases do not dilute the per share value of the firm (Jolls (1996), Kahle (2001), Fenn
and Liang (2001), and Weisbenner (2001)). Similar to Dittmar (2000), we measure the number of stock
options outstanding as the percentage of common shares reserved for stock options in the fiscal year prior to
the announcement, as reported in Compustat. Table IV shows that the mean percentage reserved is not
significantly different across the two samples.
We also control for the percentage of shares sought in the repurchase. This item is from the
repurchase announcement, and is reported by Security Data Corporation, but it is not available for all firms.
Not surprisingly, as we observe in Table IV, repurchasing firms announce that they are planning to repurchase

23
a greater percentage of stock than non-repurchasing firms.
B. Logit Analysis
To more formally test the implications of our theoretical model, we estimate a logit model in which
the dependent variable is one if the firm repurchases stock in the quarter of or following the repurchase
announcement, and zero otherwise, conditional upon the firm announcing a stock repurchase. We investigate
the impact that the number of informed traders (proxied by the number of analysts following and firm size)
and undervaluation (proxied by abnormal returns over the announcement period) have on the probability of
repurchasing, given that a firm announces a stock repurchase.
We present the results in Panel A of Table V. Columns one through three of Panel A provide
univariate analysis indicating that the firm is more likely to use a costless signal if the firm is more ignored.
An increase in analyst following or size significantly increases the probability a firm will repurchase stock.
In columns five and six, we provide univariate analysis indicating that the firm is more likely to use a costless
signal if the firm is more undervalued. An increase in undervaluation, as measured by either a one quarter
or a two quarter abnormal return following the announcement of a share repurchase program, significantly
increases the probability a firm will not repurchase stock. The three-day abnormal return shown in column
four, however, does not indicate a difference in the undervaluation of the sub-samples. All results continue
to hold in the bi-variate analysis presented in columns seven through nine. These results indicate that firms
put their money where their mouths are and repurchase, when there are more analysts following them and
when they are less undervalued.
The above analysis indicates that ignorance and undervaluation have a statistically significant impact
on the probability a firm chooses a costly over a costless signal. However, the coefficients of a logit model
are not the partial derivatives of the probabilities with respect to the independent variable, and thus must be
transformed to predict the effect of a change in one of the independent variables on the probability. To
evaluate the economic significance of these variables, we calculate the derivative with respect to each
independent variable, holding all variables constant at their mean. We use the coefficients from column nine

24
in Panel A, Table V, to calculate the impact of each variable. We then multiply the derivatives by the
standard deviation of the independent variable to determine the effect a one standard deviation change in the
independent variable has on the probability. The results show that analyst following and undervaluation have
an economically, as well as a statistically, significant effect on the probability a firm chooses a costly over
a costless signal. Specifically, a one standard deviation decrease in the two quarter abnormal return results
in a 10% increase in the probability a firm repurchases stock, i.e. uses a costly verus a costless signal. A one
standard deviation increase in the number of analysts results in a 7% increase in the probability of a stock
repurchase. These derivatives indicate that a change in the firm’s undervaluation or degree of informed
trading will have a significant impact on the probability of a costly versus a costless signal.
In Panel B of Table V, we further examine the impact of ignorance and undervaluation on the choice
between a costly and a costless signal using a stock repurchase announcement, while controlling for variables
that measure alternative reasons firms may repurchase stock. The results continue to strongly support the
implications of our model. The results presented in Panel B of Table V also show that cashflow, growth
opportunities, and leverage significantly impact the probability of a repurchase given that a firm announces
a repurchase program. Of these effects, cashflow has the greatest economic impact with a one standard
deviation change in cash flow resulting in a 24 percent increase in the probability a firm repurchases stock.
Thus, signaling value is not the only significant influence on a firms decision to repurchase stock. However,
the results supporting our model are robust to including these other control variables.
As explained above, our theoretical model predicts that firms are more likely to announce and not
repurchase – use a costless signal – if they are more undervalued. Further, our model shows that only
undervalued firms will signal value with an announcement; bad firms will not find it advantageous to mimic
good firms. However, since signaling is not the only motive to repurchase. In actuality, a firm may
announce a stock repurchase even if they are not undervalued. Thus, our model applies only to the subset
of undervalued firms announcing a stock repurchase. We focus on this subset in Table VI. We restrict our
sample to only those firms that have an abnormal return greater than zero, because these are the firms that

25
are likely to signal undervaluation. The results are striking. Consistent with the results presented in Panels
A and B of Table V, the coefficients on the one and two quarter returns show that firms are more likely to
not repurchase (use a costless signal) if they are more undervalued. However, unlike the previous results, this
holds true even for the more strict measure of undervaluation – the three-day abnormal returns. The
coefficient on analyst following has the same sign as in Table V, and it remains statistically significant. The
economic significance of the measures in the analysis presented in Table VI is similar to that from using the
full sample that is presented in Table V.
Though the primary definition of a repurchaser (non-repurchaser) in our paper is a firm that has
announced an open market share repurchase and has repurchased (has not repurchased) in the quarter of or
following the announcement, we conduct several robustness checks using different time windows for
repurchasing. In Table VII, we present results for three different time windows: the quarter of the
announcement, the fiscal year of the announcement, and four fiscal years after the announcement. The
advantage of using short windows are two: first, investors need to know soon whether the signal is costly or
costless and, second, not many other changes in firm characteristics nor many other news occur in short time
windows. The advantage of using long windows is that firms typically announce a two to three year
repurchasing program, and we should give firms this time to implement their repurchasing programs.
In column one of Table VII, we examine the quarter of the announcement. In this test, we measure
undervaluation using the one quarter abnormal return so that our horizon for repurchases and the resolution
of undervaluation concur. The results are similar to those using two quarters. The results examining longer
windows are presented in columns two through five of Table VII. In this analysis, we present results using
the one quarter abnormal return variable; however, the results are similar using the two quarter abnormal
return variable. A problem that arises in using these longer windows is that many of the firm characteristics
used to control for alternative reasons a firm may repurchase stock may change in this longer time window.
Thus, in columns three and five, but not in columns two and four, we include all control variables for the
subsequent years. When the repurchase horizon is one year, we include the control variables for the year of

26
the repurchase announcement. When the repurchase horizon also includes the three years following the
repurchase announcement, we include the variables at the end of these years, as well. The results continue
to support the predictions of our theoretical model. The economic significance of undervaluation and analyst
following is slightly less, but this is not surprising given the longer horizon. For instance, using the
coefficients in column five, a one standard deviation increase in abnormal returns (number of analysts)
decreases (increases) the probability a firm repurchases stock by 7% (5%). Thus, the variables of interest
continue to be economically important factors regardless of the repurchase horizon.
In a related paper, Ikenberry, Lakonishok, and Vermaelen (2000)examine the long run stock returns
following open market share repurchase announcements for Canadian firms. An advantage of using Canadian
firms is that, unlike U.S. firms, they have to report their monthly stock repurchases. The authors find similar
long-run returns to those reported in the U.S. Additionally, they show that firms buy more stock when returns
are lower. This evidence is consistent with our findings in that we show that firms are more likely to
repurchase stock when their announcement returns are low. The difference in our paper and their paper is
that one, we focus on the announcement period and use the abnormal return in that period to measure the
degree of undervaluation; two, we do not examine the amount of stock a firm repurchases but rather if they
repurchase any stock or not, because we are interested in determining if the repurchase announcement is a
costly or a costless signal; and three, for most of our analysis, we limit our examination period to only two
quarters because we need the firm to communicate soon to investors the type of signal they use.
Alternatively, Ikenberry, Lakonishok and Vermaelen (2000) examine much longer windows for repurchases
and returns in order to determine if firms repurchase stock after periods of stock price declines. Thus, they
investigate the market timing hypothesis, while we investigate the choice of signals. Though the results in
the two papers are consistent, we explore different issues.
The paper most similar to our empirical analysis is Stephens and Weisbach (1998). In this paper, the
authors document the percentage of stock repurchased and investigate why some firms repurchase more stock
than others. Our analysis differs from theirs in three ways. First, their question of interest differs from ours.

27
Their question of interest is what determines the amount of stock a firm repurchases. We are interested in
testing the dichotomous choice between costly and costless signaling. Second, because our question of
interest differs, so do our testing methods. Stephens and Weisbach (1998) estimate a tobit model to
investigate both the choice to repurchase and the percentage repurchased ,whereas we use a logit model to
focus on the difference in firms that announce and repurchase, and those that announce and never repurchase
any stock. Third, we examine and control for several motives for repurchasing that are not relevant to their
study. Thus, the results presented here cannot be inferred from their work.
VI. Concluding Remarks
This paper focuses on the two signaling mechanisms that can be used by a good type to separate itself
from the bad type: costless signaling and costly signaling. Under costless signaling, a good type can separate
itself from a bad type by attracting scrutiny; the bad type will not mimic because the bad type will not gain
from being discovered. Under costly signaling, a good type can separate itself from a bad type by giving a
costly signal; the bad type will not mimic because the signal is costlier for the bad type.
We develop a simple model that gives the good type the choice of signaling method. We set this
model in the context of an undervalued firm signaling its value to the capital market. Costless signaling
involves attracting scrutiny from speculators. Costly signaling involves spending money. We show that
under this capital market environment, the undervalued firm will always prefer the costless signaling method
to the costly signaling method. The intuition is that under the former method, the cost required for separating
is borne by the speculator, whereas under the latter method, the cost required for separating is borne by the
undervalued firm.
Costless signaling is shown to work only under special circumstances. This is because the ability to
attract scrutiny from speculators depends on whether there are enough incentives for these speculators to
scrutinize the firm. In a capital market, the incentives of speculators to scrutinize a firm is the trading profits
they obtain from discovering material non-public information about the firm. This means, and the model

28
formally shows, that costless signaling will only work if the benefits to search are high. These benefits of
search are high if the firm is deeply undervalued and it is deeply ignored, which increases the potential trading
profit of a speculator.
We then take our testable implications to a sample of firms announcing open market share
repurchases. This is a unique data set to test our theoretical model because a significant proportion of firms
that announce that they will repurchase their shares do not do it. Presuming that this subset is using costless
signaling, we investigate the characteristics of this subset. Compared to the firms who actually repurchase,
we find that this subset is more undervalued (as measured by abnormal returns over the announcement) and
is more ignored (as measured by analyst following and firm size). These two pieces of evidence strongly
support the predictions of our theoretical model.
Our results also address two questions in the repurchase literature: one, why do some firms announce
a stock repurchase but never repurchase any stock; and two, why does the stock price react positively to the
announcement of an open market stock repurchase program when it is not a commitment, and many firms
never repurchase any stock. Our response is that the second question answers the first: firms announce but
do not repurchase because the signal works, i.e,. the stock price increases. The stock price increases because
the announcement attracts scrutiny. This signals undervaluation because only undervalued firms will benefit
from scrutiny, and so will choose to attract scrutiny. More is the undervaluation, or more ignored is the firm,
more will be the scrutiny, because more will be the trading profits to be made from discovering material non-
public information about the firm. So, cheap talk is likely to work when the firm is more ignored and is more
undervalued.

i
REFERENCES
Allen, F. And G. Gorton, 1992, Stock price manipulation, market microstructure and asymmetric information,
European Economic Review 36, 624-630.
Asquith, P. and D. Mullins, 1986, Signaling with dividends, stock repurchases, and equity issues, Financial
Management 15, 27-44.
Austen-Smith, D. and J. Banks, 2000, Cheap talk and burned money, Journal of Economic Theory 91, 1-16.
Bagwell, L., 1991, Share repurchase and takeover deterrence, RAND Journal of Economics 22, 72-88.
Bagwell, L. and J. Shoven, 1989, Cash distribution to shareholders, Journal of Economic Perspectives 3, 129-
140.
Bhattacharya, U. and M. Krishnan, 1999, To believe or not to believe, Journal of Financial Markets 2, 69-98.
Brennan, M. and P. Hughes, 1991, Stock prices and the supply of information, Journal of Finance 46, 1665-
1691.
Brennan, M. and A. Thakor, 1990, Shareholder preferences and dividend policy, Journal of Finance 45, 992-
1017.
Comment, R. and G. Jarrell, 1991, The relative signaling power of dutch-auction and fixed-price self-tender
offers and open-market share repurchases, Journal of Finance 46, 1243-1271.
Cook, D., L. Krigman and C. Leach, 2002, On the timing and execution of open market stock repurchases,
Review of Financial Studies forthcoming.
Crawford, V.P. and J. Sobel, 1982, Strategic information transmission, Econometrica 50, 1431-1451.
Dann, L. 1981, Common stock repurchases: An analysis of returns to bondholders and stockholders, Journal
of Financial Economics 9, 113-138.
Dann, L., R. Masulis and D. Mayers, 1991, Repurchase tender offers and earnings information, Journal of
Accounting and Economics 14, 217-251.
Dittmar, A., 2000, Why do firms repurchase stock, Journal of Business 73, 331-355.
Fenn, G. and N. Liang, 2001 Good news and bad news about share repurchases, Journal of Financial

ii
Economics 60, 45-72
Glosten, L., and P. Milgrom, 1985, Bid, ask and transactions prices in a specialist model with
heterogeneously informed traders, Journal of Financial Economics 14, 71-100.
Grossman, S., and J. Stiglitz,1980, On the impossibility of informationally efficient markets, American
Economic Review, 70, 393-408.
Grullon, G., and R. Michaely, 2002, Dividends, share repurchaes, and the substitution hypothesis, Journal
of Finance 57, 1649-1684.
Grullon, G., 2000, The information content of share repurchase programs, working paper, Rice University.
Havakimian, A., T. Opler, and S. Titman, 2001, The debt-equity choice: An analysis of issuing firms, Journal
of Financial and Quantitative Analysis, forthcoming.
Hertzel, M. and P. Jain, 1991, Earnings and risk changes around stock repurchase tender offers, Journal
of Accounting and Economics 14, 253-274.
Ikenberry, D. and T. Vermaelen, 1996, The option to repurchase stock, Financial Management 25, 9-24.
Ikenberry, D., J. Lakonishok and T. Vermaelen, 1995, Market under-reaction to open market share
repurchases, Journal of Financial Economics 39, 181-208.
Ikenberry, D., J. Lakonishok, and T. Vermaelen, 2000, Stock repurchases in Canada: Performance and
strategic trading, Journal of Finance 55, 2373-2397.
Jolls, C., 1996, The role of compensation in explaining the stock-repurchase puzzle, working paper, Harvard
Law School.
Kahle, K., 2001, When a buyback isn’t a buyback: Open market repurchases and employee options,
Journal of Financial Economics, forthcoming.
Krishnan, M., 1992, On the equivalence between Kyle (1985) and Glosten-Milgrom (1985), Economics
Letters 40, 333-338.
Kyle, A.S., 1985, Continuous auctions and insider trading, Econometrica 53, 1315-1336.
Lee, D., W. Mikkelson and M. Partch, 1992, Managers’ trading around stock repurchases, Journal of Finance

iii
47, 147-1961.
Lucas, D. and R. McDonald, 1996, Shareholder heterogeneity, adverse selection, and payout policy, working
paper, Northwestern University.
Netter, J. and Mitchell, M., 1989, Stock-repurchase announcements and insider transactions after the October
1987 stock market crash, Financial Management 18, 84-96.
Oded, J., 2000, Why do firms announce open market repurchase programs? working paper, Carnegie Mellon
University.
Riley, J., 1979, Informational equilibrium, Econometrica 47, 331-360.
Ross, S., 1977, The determination of financial structure: The incentive signaling approach, Bell Journal of
Economics 8, 23-40.
Spence, M., 1973, Job market signaling, Quarterly Journal of Economics 87, 296-332.
Stephens, C. and Weisbach, M., 1998, Actual share reacquisitions in open-market repurchase programs,
Journal of Finance 53, 313-334.
Stephens, C., M. Jagannathan, and M. Weisbach, 2000, Financial flexibility and the choice between dividends
and stock repurchases, working paper, University of Missouri at Columbia.
Vermaelen, T., 1981, Common stock repurchases and market signaling: an empirical study, Journal of
Financial Economics 9, 139-183.
Weisbenner, Scott J., 2001, Corporate share repurchases in the 1990s: What role do stock options play?,
working paper, Univeristy of Illinois.

iv
Table IPosted Prices of the Market Maker
Market maker’sinformation at time t+3.5
Market maker’s posterior beliefs at timet+3.5
Market maker’s postedprices at t+3.5
Firm has attractedattention at time t+1;
good project at t+2; orderflow is +q at t+3.5
Probability B that the order is from traderwho has observed a:; Prob (1-B) that theorder is non information-based about a
good firm with expected value 0.5(:+a:)Project with NPV equal to + " will be
undertaken at t+4
" + B {a:} + (1-B) {0.5(:+a:)}
= " +0.5:{(a+1)+(a-1)B}
Firm has attractedattention at time t+1;
good project at t+2; orderflow is +1 at t+3.5
The order is from trader who has observed:
Project with NPV equal to + " will beundertaken at t+4
" + :
Firm has attractedattention at time t+1;
good project at t+2; orderflow is -1 at t+3.5
An out-of-equilibrium order flowProject with NPV equal to + " will be
undertaken at t+4
" - :
Firm has attractedattention at time t+1; bad
project at t+2
Bad project of value -:Project with NPV equal to + " will be
undertaken at t+4
" - :
Firm has not attractedattention at time t+1;good project at t+2
Good project of value :Project with NPV equal to + " will be
undertaken at t+4
" + :
Firm has not attractedattention at time t+1; bad
project at t+2
Bad project of value -:Project with NPV equal to + " will be
undertaken at t+4
" - :

v
Table IIExpected Profits of the Trader
Trader’s information at time t+3.5 Trader’s expected profitwhen order is +q at t+3.5
Trader’sprofit when
order is +1 att+3.5
Trader’sprofit whenorder is -1 at
t+3.5
Firm has attracted attention at timet+1; good project at t+2; search reveals
that project payoff is a: at t+3;project with NPV equal to + " will be
undertaken at time t+4
q[a:+"-{0.5:{(a+1)+(a-1)B+"}]
= 0.5 q:(a-1)(1-B) > 0
1[a:+"-(:+")]
= :(a-1)> 0
-1[a:+"-(-:+")]
< 0
Firm has attracted attention at timet+1; good project at t+2; search reveals
that project payoff is : at t+3;project with NPV equal to + " will be
undertaken at time t+4
q[:+"-{0.5:{(a+1)+(a-1)B+"}]
< 0
1[:+"-(:+")]
= 0-1[:+"-(-:+")]
< 0
Firm has attracted attention at timet+1; bad project at t+2; project payoff
is -: by conjecture;project with NPV equal to + " will be
undertaken at time t+4
q[-:+"-(-:+")] = 0
1[-:+"-(-:+")]
= 0
-1[-:+"-(-:+")]
= 0
Firm has not attracted attention at timet+1; good project at t+2; project payoff
is +: by conjecture;project with NPV equal to + " will be
undertaken at time t+4
q[:+"-(:+")] = 0
1[:+"-(:+")]
= 0
-1[:+"-(:+")]
= 0
Firm has not attracted attention at timet+1; bad project at t+2; project payoff
is -: by conjecture;project with NPV equal to + " will be
undertaken at time t+4
q[-:+"-(-:+")] = 0
1[-:+"-(-:+")]
= 0
-1[-:+"-(-:+")]
= 0

vi
Table IIIPercentage of Firms Repurchasing Stock
Panel A: Full Sample
Firms first repurchasing stock in the fiscal quarter of the announcement 983 (43%)Firms first repurchasing stock in the fiscal quarter following the announcement 265 (11%)
Firms first repurchasing stock within the quarter of or the quarter following theannouncement 1248 (54%)
Firms not repurchasing stock within the quarter of or the quarter following theannouncement 1049 (46%)
Firms in the sample 2297 (100%)
Panel B: The Non-Repurchasers
Firms not repurchasing stock within the quarter of or the quarter following theannouncement but repurchasing stock within the fiscal year of the announcement 197 ( 9%)
Firms not repurchasing stock within the fiscal year of the announcement but repurchasing stock within four fiscal year ends following the announcement 225 (10%)
Firms dropping off of Compustat without repurchasing stock 218 ( 9%)
Firms not repurchasing stock within four fiscal year ends following the announcement 409 (18%)
Firms not repurchasing stock within the quarter of or the quarter following theannouncement 1049 (46%)

vii
Panel C; Repurchasers by Year
YearTotalFirms
# firmsrepurchasingin quarter ofor following
announcement
# firmsnot
repurchasingin quarter ofor following
announcement
% of firmsrepurchasingin quarter ofor following
announcement
% of firmsnot
repurchasingin quarter ofor following
announcement
% of firmsnot
repurchasingin four fiscal
year endsfollowing
announcement
1985 160 86 74 54% 46% 8%
1986 171 103 68 60% 60% 9%
1987 155 73 82 47% 47% 16%
1988 164 84 80 51% 51% 22%
1989 247 139 108 56% 56% 23%
1990 289 194 95 67% 67% 14%
1991 94 47 47 50% 50% 27%
1992 159 96 63 60% 60% 14%
1993 157 84 73 53% 53% 20%
1994 349 173 176 50% 50% 21%
1995 352 169 183 48% 52% 20%
Total 2297 1248 1049 54% 46% 18%

viii
Table IVSummary Statistics - Means and Medians
Table IV provides means (medians) for the variables of interest for repurchasers and non-repurchasers.Repurchasers are defined as firms which repurchase stock in the fiscal quarter of or following theannouncement; non-repurchasers are defined as firms which do not repurchase stock in the fiscal quarter ofor following the announcement. Panel A presents variables measuring ignorance about the firm. The numberof analysts is set equal to zero if the firm is not available on IBES. Panel B presents measures of returnswhich are used to measure undervaluation. The abnormal return is measured over three periods: 1) the threeday (t-1 to t+1) abnormal return around the announcement of an open market stock repurchase using theCRSP value-weighted market return and a comparison period of –200 to –50 trading days; 2) the abnormalreturn over the quarter of the announcement; and 3) the cumulative of the abnormal return over the fiscalquarter of the announcement and over the fiscal quarter following the announcement. The abnormal returnfor is the buy and hold return for that period less the risk-free rate less the firm’s beta times the CRSP value-weighted market return over that period. Beta is measured over the sample period using quarterly returns.Panel C presents control variables. The market to book ratio is the market value of equity plus the book valueof debt divided by the book value of the firm. Market capitalization is the market value of equity. Operatingincome is operating income before depreciation. All explanatory variables are measured as of the year priorto the announcement, unless otherwise noted. The means are on top, and the medians are below inparenthesis. The P-values are for t-tests for unequal, unpaired samples and Wilcoxon Rank-Sum tests. ***,**, and * in panel B indicate that the abnormal returns are significantly different from zero at the 1, 5 and 10percent levels, respectively.
Panel A: Ignorance Measures
(1) Non-Repurchasers
(2) Repurchasers P-Value for
(1) = (2)
Number of Analysts
Number of observations
3.39(1.00)1049
5.74(2.00)1248
0.000.00
ln Market Capitalization
Number of observations
4.29(4.19)942
5.05(4.96)1179
0.000.00
ln Total Assets
Number of observations
4.54(4.52)1037
5.16(4.94)1237
0.000.00

ix
Panel B: Undervaluation Measures
(1) Non-Repurchasers
(2) Repurchasers P-Value for
(1) = (2)
Three-Day Abnormal Return Number of observations
0.04 ***
(0.02) ***
951
0.04 ***
(0.03) ***
1197
0.440.14
Announcement Quarter Abnormal Return
Number of observations
0.05 ***
(0.06) ***
910
-0.03 **
(0.01) *1154
0.000.00
Quarter of and following announcement abnormalreturn
Number of observations
0.28 ***
(0.06) ***
907
0.04 **
(0.01) *1154
0.000.00
Panel C: Control Variables
(1) Non-Repurchasers
(2) Repurchasers P-Value for
(1) = (2)
Market to Book
Number of observations
1.52(1.00)937
1.48(1.11)1170
0.520.00
Operating Income / Assets
Number of observations
0.06(0.10)1008
0.15(0.15)1197
0.000.00
Cash / Assets
Number of observations
0.11(0.04)902
0.10(0.05)1048
0.440.08
R&D to Sales
Number of observations
0.24(0.00)1017
0.09(0.00)1230
0.070.86
(Debt - Cash) / Assets
Number of observations
0.18(0.18)898
0.11(0.11)1047
0.000.00
% of Shares Reserved for Stock Options
Number of observations
0.11(0.00)1022
0.06(0.01)1231
0.130.32
Common Dividend / Operating Income
Number of observations
0.05(0.00)1008
0.10(0.00)1194
0.170.00
% of Shares Sought in Repurchase
Number of observations
0.07(0.05)898
0.08(0.06)1046
0.070.00

x
Table VThe Decision to Repurchase
Table V presents the coefficients from a logit model where the independent variable is a dummy variableequal to one if the firm repurchases stock in the fiscal quarter of or following the announcement, and zerootherwise. Panel A examines the variables of interest. The number of analysts is set equal to zero if the firmis not available on IBES. The abnormal return is measured over three periods: 1) the three day (t-1 to t+1)abnormal return around the announcement of an open market stock repurchase using the CRSP value-weighted market return and a comparison period of –200 to –50 trading days; 2) the abnormal return over thequarter of the announcement; and 3) the cumulative of the abnormal return over the fiscal quarter of theannouncement and over the fiscal quarter following the announcement. The abnormal return for a period isthe buy and hold return for that period less the risk-free rate less the firm’s beta times the CRSP value-weighted market return over that period. Beta is measured over the sample period using quarterly returns.Panel B includes several control variables. The market to book ratio is the market value of equity plus thebook value of debt divided by the book value of the firm. Market capitalization is the market value of equity.Operating income is operating income before depreciation. All explanatory variables are measured as of theyear prior to the announcement, unless stated otherwise. The intercept is included, but is not presented. TheWhite corrected p-values are in parentheses.
Panel A: Univariate and Bivariate Tests
(1) (2) (3) (4) (5) (6) (7) (8) (9)
Ignorance Measures:
Number of Analysts 0.0(0.00)
0.04(0.00)
ln Market Capitalization 0.24(0.00)
0.23(0.00)
ln Total Assets 0.17(0.00)
0.17(0.00)
Undervaluation Measures:
Three day abnormal return -0.35(0.44)
Announcement quarterabnormal return
-0.48(0.00)
Quarter of and followingannouncement abnormalreturn
-0.23(0.01)
-0.22(0.01)
-0.29(0.00)
-0.21(0.02)
Pseudo R2 0.02 0.03 0.02 0.00 0.01 0.01 0.03 0.04 0.02
Number of Observations 2297 2121 2274 2148 2064 2061 2061 1960 2051

xi
Panel B: Multivariate Tests
(1) (2) (3) (4)
Ignorance Measure:
Number of Analysts 0.03(0.00)
0.03(0.00)
0.04(0.00)
Undervaluation Measure:
Quarter of and followingannouncement abnormal return
-0.33(0.02)
-0.33(0.02)
-0.31(0.01)
Control Variables:
Market to Book -0.04(0.31)
-0.09(0.01)
-0.09(0.02)
-0.08(0.03)
Operating Income/Assets 3.94(0.00)
4.81(0.00)
4.45(0.00)
4.86(0.00)
Cash /Assets 0.53(0.34)
-0.60(0.32)
-0.37(0.54)
-0.21(0.73)
R&D to Sales 0.02(0.40)
0.02(0.30)
0.02(0.34)
0.02(0.32)
(Debt - Cash)/Assets -1.03(0.00)
-1.11(0.00)
-1.04(0.00)
-0.90(0.01)
% of Shares Reserved for StockOptions
0.58(0.42)
-0.34(0.63)
0.03(0.96)
0.18(0.81)
Common Dividend/ OperatingIncome
0.39(0.10)
0.41(0.13)
0.40(0.12)
0.39(0.12)
% of Shares Sought inRepurchase
1.94(0.09)
Pseudo R2 0.07 0.08 0.10 0.10
Number of Observations 1762 1631 1631 1393

xii
Table VIThe Decision to Repurchase for Undervalued Firms
Table VI presents the coefficients from a logit model where the independent variable is a dummy variableequal to one if the firm repurchases stock in the fiscal quarter of or following the announcement, and zerootherwise. The sample is restricted to only those firms where the analysis indicates that the firm waspotentially undervalued (abnormal return greater than zero). The number of analysts is set equal to zero ifthe firm is not available on IBES. The abnormal return is measured over three periods: 1) the three day (t-1to t+1) abnormal return around the announcement of an open market stock repurchase using the CRSP value-weighted market return and a comparison period of –200 to –50 trading days; 2) the abnormal return over thequarter of the announcement; and 3) the cumulative of the abnormal return over the fiscal quarter of theannouncement and over the fiscal quarter following the announcement. The abnormal return for a period isthe buy and hold return for that period less the risk-free rate less the firm’s beta times the CRSP value-weighted market return over that period. Beta is measured over the sample period using quarterly returns.The intercept is included, but is not presented. In columns three, six and nine, the control variables fromPanel B of Table V are included, but are not presented. P-values are in parentheses.
(1) (2) (3) (4) (5) (6) (7) (8) (9)
Ignorance Measures:
Number of Analysts 0.03(0.00)
0.03(0.00)
0.04(0.00)
0.04(0.00)
0.04(0.00)
0.04(0.00)
Undervaluation Measures:
Three day abnormal return -1.80(0.01)
-1.42(0.00)
-1.65(0.06)
Announcement quarter abnormalreturn
-1.37(0.00)
-1.14(0.00)
-0.94(0.01)
Quarter of and followingannouncement abnormal return
-0.27(0.00)
-0.21(0.01)
-0.24(0.09)
Control variables included No No Yes No No Yes No No Yes
Pseudo R2 0.01 0.01 0.07 0.02 0.04 0.10 0.01 0.03 0.08
Number of Observations 1486 1486 1018 1124 1124 740 1076 1076 716

xiii
Table VIIThe Decision to Repurchase - Various Repurchase Windows
Table VII presents the coefficients from a logit model where the independent variable is a dummy variableequal to one if the firm repurchases stock within the fiscal quarter of (column 1), the fiscal year of (columns2 and 3) or the fiscal year of and the three years following (columns 4 and 5) the announcement, and zerootherwise. The number of analysts is set equal to zero if the firm is not available on IBES. The abnormalreturn is the buy and hold return over the quarter of the announcement less the risk-free rate and the firm’sbeta times the CRSP value-weighted market return. Beta is measured over the sample period using quarterlyreturns. The market to book ratio is the market value of equity plus the book value of debt divided by thebook value of the firm. Market capitalization is the market value of equity. Operating income is operatingincome before depreciation. All explanatory variables are measured as of the year prior to the announcement.In column 3, we also include each control variable for the year of the announcement. In columns 5, weinclude each control variable the year of and the three years following the announcement. These subsequentcontrol variables are not presented in the table. The intercept is also included, but is not presented. TheWhite corrected p-values are in parentheses.
Repurchase Window (1)One Quarter
(2)One Fiscal Year
(3)One Fiscal Year
(4)Four Fiscal Years
(5)Four Fiscal Years
Ignorance Measure:
Number of Analysts 0.03(0.00)
0.04(0.00)
0.04(0.01)
0.03(0.00)
0.03(0.01)
Undervaluation Measure:
Announcement quarterabnormal return
-0.74(0.00)
-0.59(0.00)
-0.70(0.01)
-0.41(0.03)
-0.77(0.01)
Control Variables:
Market to Book -0.10(0.02)
-0.03(0.846)
0.00(0.95)
0.33(0.11)
0.17(0.66)
Operating Income/Assets 3.60(0.00)
7.13(0.00)
3.78(0.00)
7.28(0.00)
3.59(0.00)
Cash /Assets -1.14(0.08)
0.47(0.47)
-0.47(0.74)
0.88(0.33)
0.26(0.84)
R&D to Sales 0.01(0.54)
0.04(0.10)
0.01(0.69)
0.05(0.22)
0.10(0.14)
(Debt - Cash)/Assets -1.19(0.00)
-0.16(0.58)
-1.20(0.22)
0.40(0.25)
-0.03(0.94)
% of Shares Reserved forStock Options
0.06(094)
1.87(0.01)
-0.09(0.95)
4.36(0.00)
3.34(0.01)
Common Dividend/Operating Income
0.52(0.07)
1.32(0.00)
2.20(0.00)
1.41(0.00)
1.64(0.00)
% of Shares Sought inRepurchase
1.31(0.05)
1.26(0.08)
1.12(0.23
6.34(0.01)
8.47(0.00)
Post Variables Included No No Yes No Yes
Pseudo R2 0.08 0.14 0.16 0.19 0.25
Number of Observations 1405 1781 825 1586 1336

Figure 1. Resolution of uncertainty in the economy
GOOD FIRM
GOOD PROJECTS
BAD PROJECTS
BAD FIRM
BAD PROJECTS
GOOD PROJECTS
1/2
1/2
1/2
1/2
1/2
1/2
1
1/2
1/2
1
aµ
µ
µ−
µ
µ−
t t+1 t+2 t+4t+3
1
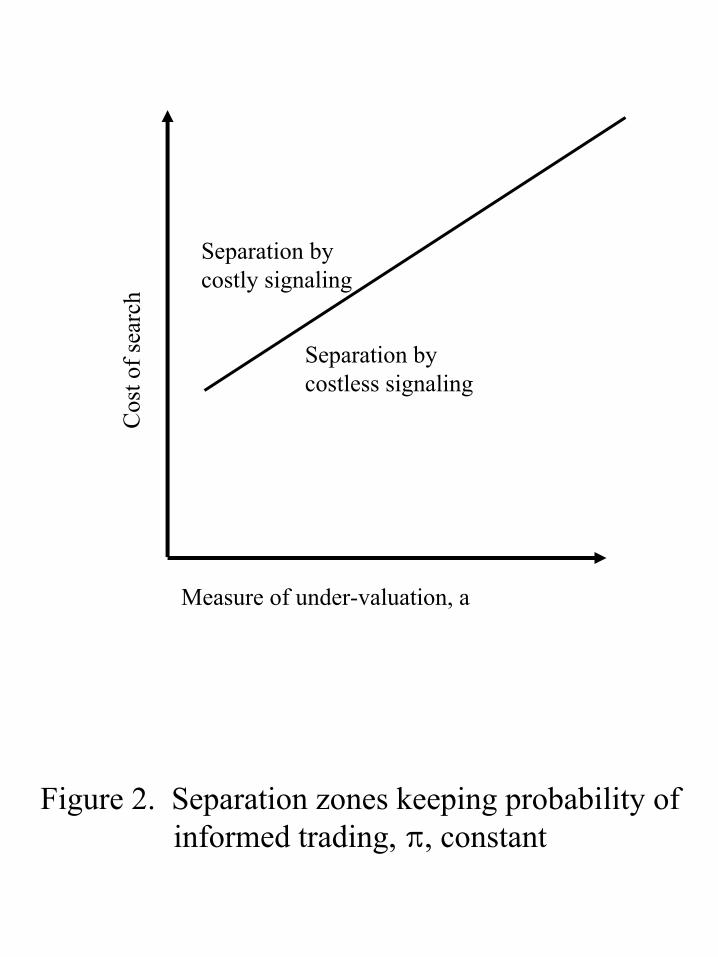
Figure 2. Separation zones keeping probability of informed trading, B, constant
Measure of under-valuation, a
Cos
t of s
earc
h
Separation by costly signaling
Separation by costless signaling

Probability of informed trading,B
Cos
t of s
earc
h
Separation by costly signaling
Figure 3. Separation zones keeping under-valuation, a, constant
Separationby costless
signaling
Related Documents