working today for nature tomorrow Costed plans and options for herpetofauna surveillance and monitoring English Nature Research Reports Report Number 663

Welcome message from author
This document is posted to help you gain knowledge. Please leave a comment to let me know what you think about it! Share it to your friends and learn new things together.
Transcript

working today for nature tomorrow
Costed plans and options for
herpetofauna surveillance and monitoringEnglish Nature Research Reports
Report Number663


English Nature Research Reports
Number 663
Costed plans and options for herpetofauna surveillance and monitoring
Chris Gleed-Owen, John Buckley, Julia Coneybeer, Tony Gent, Morag McCracken, Nick Moulton, & Dorothy Wright
You may reproduce as many additional copies of this report as you like for non-commercial purposes, provided such copies stipulate that copyright remains with English Nature,
Northminster House, Peterborough PE1 1UA. However, if you wish to use all or part of this report for commercial purposes, including publishing, you will need to apply for a licence by contacting the Enquiry Service at the above address. Please note this report may also contain
third party copyright material.
ISSN 0967-876X © Copyright English Nature 2005

Cover note This report is the result of a project designed jointly by The Herpetological Conservation Trust (The HCT), English Nature and the Countryside Council for Wales. The lead researcher was Chris Gleed-Owen at The HCT, and the English Nature project officer was Jim Foster. The views in this report are the authors’ own and do not necessarily represent those of English Nature. For further information on amphibian and reptile conservation please contact: The Herpetological Conservation Trust 655A Christchurch Road Boscombe Bournemouth Dorset BH1 4AP Tel: 01202 391319 Website: www.herpconstrust.org.uk English Nature Northminster House Peterborough PE1 1UA Tel: 01733 455000 Website: www.english-nature.org.uk
This report should be cited as: GLEED-OWEN , C. and others. 2005. Costed plans and options for herpetofauna surveillance and monitoring English Nature Research Reports, No 663.

Acknowledgements The HCT wishes to acknowledge the financial support of English Nature, the Countryside Council for Wales, the Esmée Fairbairn Foundation, and SITA Environmental Trust. The HCT would like to thank Jim Foster and Liz Howe in particular for their involvement in this project. Many other people have helped in some way by providing advice, information or other assistance: Rick Anstis, Neal Armour-Chelu, Henry Arnold, John Baker, Keith Balmer, Trevor Beebee, Jeremy Biggs, David Bird, Lee Brady, Andy Brewer, Lars Briggs, Bill Butcher, Paul Callister, Ruth Carey, Veronica Carnell, Colin Catto, Jan Clemons, Nigel Clemons, Margaret Cole, David Coles, Keith Corbett, Nicky Court, Lynda Darbey, Rod d’Ayala, Paul Edgar, Matthew Ellis, Gemma Fairchild, Helen Fearnley, Helen Forster, Eric Fletcher, Kåre Fog, Jean Glasscock, Oliver Grafton, Tom Gray, Viv Geen, Rachel Green, Richard Griffiths, Tim Halliday, Nigel Hand, Matthew Harris, Martin Harvey, Rebecca Haworth, Andrew Heaton, Jon Houghton, Jules Howard, Liz Howe, Peter Hughes, Howard Inns, Trevor James, Gus Jones, Alistair Kirk, Steve Lane, John Leaver, Paul Lockhart, Pat Lorber, David Lowe, Gareth Matthes, Andi Meyer, Adrian Middleton, Chris Monk, Jean-Claude Monney, James Mortimer, Nick Moyes, Mark Nicholson, Martin Noble, David Orchard, Terry Parr, Angela Peters, Tony Phelps, Delphine Pouget, Mike Preston, Chris Reading, Adam Rowe, Mandy Rudd, Sheila Ryan, Martin Sanford, Benedikt Schmidt, Alan Shepherd, Paul Sison, Craig Slawson, John Smith, Nick Smith, Alison Stewart, Nick Squirrell, David Tamarind, Peter Tipping, Anita Weatherby, Jon Webster, Bill Whitaker, Paul Wisse, Simon Wood, Nick Woods, Helen Wraight, Sheila Wright, Julia Wycherley, Annie Zuiderwijk, Silvia Zumbach. Countless other people have helped indirectly by their involvement in survey, monitoring and conservation.


Summary and conclusions This project was initiated in response to a growing realisation that current knowledge on amphibian and reptile status in Britain does not meet the many demands for such information. Existing knowledge of amphibian and reptile status is largely based upon subjective opinion, albeit the collective opinion of many experts. Survey and monitoring efforts have generally been uncoordinated, short-term, patchily distributed, and with widely differing methods and scope. As a result, they do not lend themselves easily to comparison and extrapolation. This project assesses current needs for information on herpetofauna status, and explores potential options for developing surveillance and monitoring systems to meet these needs. English Nature needs herpetofauna surveillance and monitoring data for various purposes: with regard to interest features on designated sites, status of BAP and other nationally important species, assessment of national trends in widespread species, European legal obligations for Species of Community Interest, information for miscellaneous tasks, and data on non-native species. We examined the types of information needed for each objective, and the reporting timeframes relating to each. Recent work has attempted to develop indicators of ‘conservation status’, and we discuss the philosophy of selecting suitable parameters and models. By assessing the extent to which existing data can satisfy English Nature’s herpetofauna information needs, it is clear that current surveillance and monitoring systems are inadequate, and to meet the required objectives, an effective system would need to be developed. The viability of developing a national recording scheme for herpetofauna is therefore explored in depth. A review is presented of previous herpetofauna surveys, monitoring schemes and pertinent literature from the UK and abroad, and their efficacy at reflecting biological and conservation status. Some key examples of non-herpetofauna monitoring schemes are also presented. Currently-practised data collection methodologies and sampling regimes are discussed, and options for large-scale delivery mechanisms are evaluated, with particular emphasis on the use of volunteers. Opportunities for wider community involvement would be central to the success of a National amphibian and Reptile Recording Scheme (NARRS). The existing community of Amphibian and Reptile Groups (ARGs) would logically form the basis of the recording network, but new groups (or alternatives) would have to fill geographical gaps, and existing groups would need to recruit more people. A consultation of the ARG network by questionnaire showed strong support for NARRS, and a willingness to participate in it. Many volunteers felt that appropriate training would be an important pre-requisite. Systems of data collation, management and dissemination are addressed, and a survey of local record centre data holdings is presented. Various structural and logistical issues are explored, including the feasibility of developing and sustaining a large national volunteer network. Examples of sampling regimes and survey structures are proposed, and the cost implications are examined. Fully costed options are given for delivering each of the four main objectives for which English Nature needs information (widespread species, BAP/nationally important species, very rare species, Common Standards Monitoring of SSSI interest features). The costs of each are interdependent, and it would be most efficient and synergistic to run all four elements concurrently. The total cost may be several hundred thousand pounds per year.

In order to construct an adequate and achievable surveillance system, with broad consensus from stakeholders, a preliminary development stage should be carried out, lasting between six months and a year, culminating in a strategic project design, funding partnership and bid(s). The earliest feasible start date for data collection would be spring 2007. Further research would still be needed to improve methodological approaches iteratively over time.

Contents Acknowledgements Summary and conclusions
1 Introduction..................................................................................................................11
1.1 General.............................................................................................................11 1.2 Species coverage..............................................................................................11 1.3 Discussion of terms and strategies...................................................................16
2 Monitoring objectives ..................................................................................................19
2.1 (A) Condition of interest features on designated sites .....................................19 2.1.1 Herpetofauna on designated sites.........................................................19 2.1.2 Condition assessment process..............................................................23
2.2 (B) Status of BAP and other nationally important species ..............................25 2.3 (C) Assessment of national trends in widespread species ...............................27 2.4 (D) Legal obligations to report on conservation status of Species of Community Interest .....................................................................................................27
2.4.1 Origin of obligations ............................................................................27 2.4.2 Current work in the EC, UK and other Member States .......................32
2.5 (E) Use of species information for miscellaneous English Nature tasks .........35 2.6 (F) Distribution and status of introduced herpetofauna species.......................36
3 General information requirements to meet surveillance and monitoring objectives ...38
3.1 Defining and monitoring species conservation status for UK herpetofauna ...38 3.1.1 Background..........................................................................................38 3.1.2 Parameters............................................................................................39
3.2 Characteristics of data required for each monitoring objective .......................41
4 Review of current and past surveillance and monitoring activities .............................48
4.1 Terms used .......................................................................................................48 4.2 Data sources, scope and coverage....................................................................48
4.2.1 National schemes covering multiple species .......................................48 4.2.2 National schemes covering single species ...........................................53 4.2.3 Regional and local schemes .................................................................64
4.3 Data locations and formats...............................................................................72 4.4 Review of methodologies ................................................................................80 4.5 Learning from foreign herpetofauna surveillance and monitoring projects ....86
4.5.1 Denmark...............................................................................................86 4.5.2 Netherlands ..........................................................................................87 4.5.3 Switzerland ..........................................................................................88 4.5.4 Canada..................................................................................................93 4.5.5 USA......................................................................................................93 4.5.6 Others...................................................................................................95 4.5.7 Summary ..............................................................................................96
4.6 Non-herpetofauna monitoring schemes of relevance ......................................97 4.6.1 Breeding Bird Survey ..........................................................................97 4.6.2 National Bat Monitoring Programme ..................................................98 4.6.3 Tracking Mammals Partnership.........................................................100
5 Proposed mechanisms for delivering surveillance and monitoring objectives..........103
5.1 General approach ...........................................................................................103 5.1.1 Project design and management.........................................................103 5.1.2 Timescales and emphasis...................................................................105 5.1.3 Different work areas in consecutive years .........................................107 5.1.4 All work areas running concurrently .................................................108
5.2 Collection of data...........................................................................................111 5.3 Sampling strategies, sample sizes and power ................................................116
5.3.1 Sample size and power.......................................................................116 5.3.2 Detection probability .........................................................................117
5.4 Transfer to electronic format and geo-referencing ........................................119 5.5 Collation of data from different collection nodes ..........................................120 5.6 Interpretation..................................................................................................120 5.7 Access to data and distribution of data products ...........................................121 5.8 Co-ordination and liaison with English Nature .............................................122 5.9 Proposed roles of key organisations ..............................................................122
5.9.1 Data providers....................................................................................122 5.9.2 Local Records Centres .......................................................................123 5.9.3 English Nature ...................................................................................124 5.9.4 The Herpetological Conservation Trust.............................................124 5.9.5 National Biodiversity Network ..........................................................125 5.9.6 Amphibian and Reptile Groups .........................................................126 5.9.7 Professional herpetologists and other contractors..............................127 5.9.8 National Pond Monitoring Network ..................................................127 5.9.9 Other statutory agencies and partners ................................................127 5.9.10 Additional volunteer sources and synergies ......................................128
6 Indicative costings .....................................................................................................128
6.1 Explanation of costings..................................................................................128 6.2 Costings..........................................................................................................138
7 References..................................................................................................................145
Appendices ........................................................................................................................153
Appendix 1. Indicative costings for broad-scale surveillance projects...................155 Appendix 2. Indicative costings for surveillance of important species using a
site inventory......................................................................................156 Appendix 3. Indicative costings for census work on very rare species ..................157 Appendix 4. Additional costs to deliver Common Standards Monitoring..............158 Appendix 5. European and North American herpetofauna surveillance schemes..160 Appendix 6. A questionnaire survey of the ARGs’ views on NARRS ..................162
Research Information Note

11
1 Introduction 1.1 General
This scoping study arose from the widely-recognised need to develop surveillance and monitoring capacity for the UK herpetofauna. As this contract is largely funded by English Nature, the emphasis of this report will be on issues and elements relevant to England. English Nature also provided the pro-forma structure of this report. The English herpetofauna comprises at least six amphibians and six reptiles accepted as native, and according to recent research, a seventh amphibian should be added to it (Beebee and others 2005). For the purposes of this report, the native non-marine English herpetofauna is considered to contain thirteen species. A similar number of introduced species have been recorded from various locations in England in recent decades, and whilst some are well studied, the status of others is poorly known. In addition, five marine turtle species have been recorded in UK waters, and as one of them appears to use British waters habitually, it is also be considered native. The geographical distribution, ecological preferences, abundance, and therefore conservation needs, of these species vary considerably. The most widely distributed species are also the most abundant, and these are found across the widest range of habitats. Most species can be considered widespread, if somewhat patchy, in their distributions. Several species are rare, and one is currently extinct. The rare species have restricted distributions that are either widely but very thinly scattered, or clustered more densely but only in a few areas. All species have undoubtedly undergone major declines within historic times, and particularly during the last 50 years. As a key deliverer and statutory adviser on nature conservation, English Nature relies upon species status information for guiding many of its activities and for meeting its objectives. The English Nature note entitled Species surveillance strategy: reptiles and amphibians (Foster 2004), describes in broad terms the types of information that English Nature needs for herpetofauna. Using that as a starting point, this report explores information needs, methodologies, sampling strategies, delivery mechanisms, personnel, voluntary involvement, popularity, logistics, coordination, data issues, and resource implications. It then sets out indicative costed options for a national recording scheme. 1.2 Species coverage
The geographical distribution of the non-marine herpetofauna is primarily a function of their climatic tolerances and their habitat preferences. Within Britain, the latitudinal distribution of eight species is not restricted climatically, and all occur from the south of England to the north of Scotland. Four species (sand lizard, smooth snake, grass snake, natterjack toad) have northern limits within Britain. The grass snake has a northern limit approximating with the English-Scottish border, possibly with isolated records further north, but apparently controlled by summer temperature. Whilst certainly controlled by climate, the northern limits of natterjack toad, sand lizard and smooth snake are artefacts of their reliance upon patchily distributed habitats. The natterjack extends to the southwest Scottish coast, the sand lizard reaches Merseyside, and the smooth snake is confined to southern England. All three have clearly disjunct ranges within England. Native populations of the pool frog were, until relatively recently, probably confined to a very small area of eastern England; however as an

12
indigenous species it is currently believed to be extinct. The distribution of all herpetofauna species in Britain is the product of a complex environmental history since the last Ice Age (c.20,000 years ago), including periods when summer climate was much warmer than today. Nine of the English species can be considered as ‘widespread’ (rather than ‘common’ - a term felt by many to give a false impression of abundance). In other words, they are widely distributed across England, although some occur at higher population densities in some areas than others. Invariably they are also patchily distributed in at least some parts of England. The widespread species are the three newts, the common toad, common frog, common lizard, slow-worm, grass snake and adder. The common frog is the most abundant and widely distributed of these. The others are more patchily distributed and may be locally rare. The great crested newt is widespread in central, south and eastern England, but is more thinly distributed in northern and southwest England. The natterjack toad, sand lizard and smooth snake are considered ‘rare’, and are clearly less abundant than the others because of their very limited distribution. Recent population estimates by the HCT suggest that the natterjack toad is the rarest of the three (Gleed-Owen 2004a). The pool frog is currently extinct but would automatically become England’s rarest species if it were reintroduced. Evidence indicates that there is a distinct northern clade, distinguishable from introduced populations of pool frogs originating from other parts of Europe (Beebee and others 2005). Of the five marine turtles known from British waters, the leatherback turtle is recorded often enough to suggest native status, and evidence that they feed in British waters further justifies this (J. Houghton, pers. comm.). The table below lists the non-marine herpetofauna occurring naturally in England, as well as the marine species potentially occurring around the coast of England. Non-marine species Great crested newt Triturus cristatus Smooth newt Triturus vulgaris Palmate newt Triturus helveticus Common toad Bufo bufo Natterjack toad Bufo calamita Pool frog (northern clade) Rana lessonae Common frog Rana temporaria Sand lizard Lacerta agilis Common lizard Lacerta (Zootoca) vivipara Slow-worm Anguis fragilis Grass snake Natrix natrix Smooth snake Coronella austriaca Adder Vipera berus Marine turtles Leatherback turtles Dermochelys coriacea Loggerhead turtle Caretta caretta Kemp's ridley turtle Lepidochelys kempii Green turtle Chelonia mydas Hawksbill turtle Eretmochelys imbricata

13
The English herpetofauna is at its most diverse in lowland areas, although some species extend into the uplands, particularly those species that also extend throughout Scotland and Scandinavia. The common frog, palmate newt, common lizard and adder probably reach the highest altitudes in England. Of the exclusively lowland species, two of the reptiles are not present in parts of the country with upland topography anyway. Population densities and abundance are generally greatest at low altitudes. Most of the British herpetofauna are associated with higher altitudes further south in their European range, and some (eg common lizard) are restricted to montane areas there. This is clearly a postglacial adaptation to climatic warming by shifting altitudinal range. If summer temperatures were warmer in Britain (as anticipated in most global warming predictions), most species would adapt in some or all of the following ways: • extend their range northwards (if possible geographically); • extend into higher altitudes (if possible topographically); • change or extend the suite of habitats that they inhabit; • become less patchy. Conversely, if climate became cooler in Britain, most species would: • contract their range latitudinally; • contract their range altitudinally; • become more patchy; • become restricted to fewer habitats. For example, to illustrate the latter point, British populations of natterjack toad, sand lizard and smooth snake are at the northwest extreme of their range. Here they are compromised by the cooler climate, and can only exploit more favourable habitat types and microclimates, whereas further south in Europe they occupy a wider range of habitats. Breeding populations of at least 11 introduced species of herpetofauna are present in England, but up to 19 or more species may be present (Arnold 1995; Beebee & Griffiths 2000; G. Diechsel, pers. comm.; J. Foster, pers. comm.; Gleed-Owen 2004b; Wycherley 2003). The following table lists the introduced species present or possibly present in England. Present Breeding Alpine newt Triturus alpestris y y Italian crested newt Triturus carnifex y y Midwife toad Alytes obstetricans y y Fire-bellied toad Bombina bombina ? ? African clawed toad Xenopus laevis y y European tree frog Hyla arborea y ? North American bullfrog Rana catesbeiana y y Marsh frog Rana ridibunda y y Iberian water frog Rana perezi y y Edible frog Rana kl. esculenta y y Pool frog (non-northern clade) Rana lessonae y y European pond terrapin Emys orbicularis ? ? Red-eared terrapin Trachemys scripta elegans y ?

14
Present Breeding Green lizard Lacerta viridis ? ? Western green lizard Lacerta bilineata y y Wall lizard Podarcis muralis y y Italian wall lizard Podarcis sicula ? ? Garter snake Thamnophis sp. ? ? Dice snake Natrix tessellata ? ? Owing largely to differences in distribution, abundance and changes in status, the English herpetofauna species have a range of legislative protection. All (extant) native species of herpetofauna receive at least some legislative protection in England, but the levels vary between species and the legislation that protects them varies. The lowest level protects them from trade only. The two key measures are the Wildlife & Countryside Act 1981, as amended (notably via Amendment Acts and the Countryside & Rights of Way Act 2000 (CroW)), and the Conservation (Natural Habitats etc) Regulations 1994 (the ‘Habitats Regulations’). The latter is a legislative provision, brought in though the European Communities Act 1972 to allow the implementation of European Directives and specifically the implementation of the Council Directive 92/43/EEC of 21 May 1992 on the conservation of natural habitats and of wild fauna and flora (the Habitats Directive). All (extant) native species are listed on Schedule 5 of the Wildlife & Countryside Act, although for the more widespread species these are only with respect to some of the provisions of Section 9. The four (extant) native species of ‘terrestrial’ amphibian and reptile, and all marine turtle species listed on Annex IV of the Habitats Directive are also listed on Schedule 2 of the Habitats Regulations; these are termed ‘European Protected Species’. There have been recent consultations regarding changes to both the Wildlife & Countryside Act and the Habitats Regulations in England that would have implications for the protection of England’s herpetofauna and there is a further consultation presently underway regarding Part 1 of the Wildlife & Countryside Act. One suggestion in this latter consultation is the possibility of deleting the ’European Protected Species’ from Sch 5, so that the Wildlife & Countryside Act no longer applies to them, and rely solely on the Habitats Regulations for their protection in England. In effect, three levels of protection exist: 1. Full protection under the Wildlife & Countryside Act 1981 (all parts of Section 9
apply) and the Habitats Regulations (Regulation 39): listed on Annex IV of the Habitats Directive*
• sand lizard; • smooth snake; • great crested newt (also listed on Annex II of the Habitats Directive, requiring
the designation of Special Areas of Conservation); • natterjack toad; • marine turtles (all species): families Dermochelyidae and Cheloniidae (since
1988).

15
2. Protection via Wildlife & Countryside Act 1981 (Section 9, parts 1. but only in respect of killing and injuring; and 5 (sale, etc) only)
• grass snake - plus S 9(1) (part) since 1988; • adder - plus S 9(1) (part) since 1992; • slow-worm - plus S 9(1) (part) since 1988; • common (Viviparous) lizard - plus S 9(1) (part) since 1988.
3. Protection via Wildlife & Countryside Act 1981 (Section 9 part 5 (sale, etc) only)
• smooth (common) newt; • palmate newt; • common frog; • common toad.
* note that the pool frog is listed on Annex IV of the Habitats Directive. However the need to confirm native status and reintroduce this species, native populations of which are now extinct in the UK, has meant that it has yet to be listed on UK domestic legislation. If reintroduced, domestic legislation will be proposed, namely the inclusion on both Wildlife & Countryside Act (Sch 5) and the Habitats Regulations (Sch 2). Conservation action is directed towards all the amphibian and reptile species, but the statutory emphasis is on the rare and/or European-protected species. Most effort and resources are therefore targeted at the great crested newt, natterjack toad, pool frog, sand lizard, smooth snake and marine turtles, which enjoy strategic, centrally-coordinated action. For all except the smooth snake, this is mainly via the UK Biodiversity Action Plan (UK BAP 1995); and for all including the smooth snake, Species Recovery Programmes exist. It is difficult to ascertain how much effort and resources are applied locally to other herpetofauna species, even though collectively they are probably fairly substantial. As there is no national plan or strategy for the widespread species, conservation is through numerous local initiatives that vary geographically, are often voluntary, and which depend upon the existence of local activists and sympathetic funders. There are several broad categories for which English Nature needs information on species status. These can be summarised as follows: • Condition of interest features on designated sites (SSSI, SAC, Ramsar). • Status of BAP and other nationally important species. • Assessment of national trends in widespread species. • Legal obligations to report on status of species. • Use of species information for miscellaneous tasks. The information English Nature requires on each species for each purpose is summarised in the following table (Foster 2004). The relative importance of each category is emphasised by the number of dots.

16
Purpose Species Int. features
on designated
sites
BAP/ nationally important
spp
Widespread spp trends
Legal obligations (Habitats
Dir.)
Other tasks
Common frog Common toad Natterjack toad Pool frog Smooth newt Palmate newt Great crested newt
Common lizard Slow-worm Sand lizard Grass snake Adder Smooth snake Marine turtles There are more rare species than widespread species interest features on SSSIs, hence the emphasis is on those species. As well as the BAP species, the common toad and adder could be viewed as ‘nationally important species’, with significant concerns about their decline. The smooth snake is the only rare non-BAP species, and is being considered for inclusion in the UK BAP. Trends in widespread species can be ranked too, but this is more open to debate. Aside from the intrinsic value of monitoring species status, the rationale for monitoring these is their potential as broad ‘landscape quality’ indicators (J. Foster, pers. comm.). The species with European protection receive equally important regard. Species most commonly requiring information for miscellaneous ad hoc tasks are the BAP/European-protected species; but all species generate some casework or other information needs. One exception is the pool frog, which would probably have insignificant casework etc attached to it if it were reintroduced. 1.3 Discussion of terms and strategies
It is worth dedicating some space to the definition of terms used in this report, and on the concepts involved in herpetofauna recording. A great deal of conservation discussion involves the concept of ‘status’, whether in relation to ‘population status’, ‘biological status’, ‘conservation status’ or trends such as ‘declining status’. Dictionary definitions of ‘status’ tend to refer to a rank or position of an individual in relation to other individuals, but it in ecology and conservation it is used to mean a species’ status in relation to alternative states. It is generally used to mean the combination of distribution and abundance (Cooke & Scorgie 1983; Hilton-Brown & Oldham 1991; Swan and Oldham 1993), but also in the context of native versus introduced status. The EC Habitats Directive defines ‘conservation status’ (for species) as “the sum of the influences acting on the species concerned that may affect the long-term distribution and abundance of its populations…”. In other words, it appears to describe the factors controlling the dynamics of status, rather than the status itself. The emphasis on causality reflects the Directive’s intention to improve the conservation status of species by managing the factors acting upon them. Consequently, simple occurrence measurements would presumably not be sufficient to satisfy the Directive’s requirements to

17
assess conservation status. The assessment of conservation status would need to quantify the impacts of all influences, directly or indirectly, upon the observed abundance and distribution. The unit of measure would need to reflect the interplay between status and influences, and a desired optimum state as well as suboptimal, poor and dire states would need to be defined. The term ‘favourable conservation status’ (FCS) is set out in the Habitats Directive to define the desired state that should be aspired to and achieved for all species and habitats. For species, FCS is attained when “population dynamics data on the species concerned indicate that it is maintaining itself on a long-term basis as a viable component of its natural habitats, and the natural range of the species is neither being reduced nor is likely to be reduced for the foreseeable future, and there is, and will probably continue to be, a sufficiently large habitat to maintain its populations on a long term basis.” (Conservation (Natural Habitats &c.) Directive 1994, Article 1(i), EC Directive 92/43/EEC). The meanings of some other methodological terms are worth discussing here. ‘Monitoring’ tends to be used to describe the repeated collection of information, with reference to a target, benchmark or baseline. It is used in quality control and other connotations, as well as in species status assessment. It implies that the status of the object or the factors influencing it have a dynamic nature, and given that time is required for change to take place, monitoring must involve repeated observation over time. ‘Surveillance’, on the other hand, describes the constant or regular observation of something, but not necessarily against a baseline or target. Therefore, whilst monitoring seems to imply a continuous process, only surveillance is explicitly defined as such. And whilst surveillance would logically be carried out for a reason, only monitoring refers explicitly to a baseline position. Note that surveillance can be carried out for any reason, perhaps without knowing what information will be gathered, whereas monitoring is targeted at collecting specific information. Owing to the subtle differences between ‘surveillance’ and ‘monitoring’, dictionaries tend to use them interchangeably to a certain degree, describing monitoring as ‘regular surveillance’ and ‘systematic collection of information’, whilst describing surveillance as ‘close observation’ and ‘continuous monitoring’. Both surveillance and monitoring collect time-series data, and whilst both arguably need a rationale, only monitoring is dependant upon baseline data and implies reference to a benchmark. The distinction will be made in this report where appropriate. Certainly it seems that surveillance tends to be used as a broad-brush term for systematic ongoing biological recording, perhaps intending a wider definition than monitoring. Statutory agencies refer to ‘monitoring interest features’ on SSSIs, which is correct because interest feature condition is categorised, and any assessment can be readily compared to a preceding assessment. The Habitats Directive refers to ‘long-term monitoring’, which could mean over decades, depending somewhat on the species in question. Statistically, the longer the time-series dataset, the easier it is to identify trends, and the greater the confidence. Furthermore, the greater the number of data points (and the more regularly they are collected), the greater the ability to identify patterns, changes and trends confidently. The terms monitoring and surveillance contrast with ‘survey’, which implies a one-off information-gathering exercise. A survey can last several years and involve multiple events, but its aim is always to increase spatial coverage or volume of datapoints, rather than to generate a time-series. Of course, repeating a survey regularly in a comparable way would result in surveillance or monitoring anyway.

18
‘Census’ means the counting of individuals for estimating absolute population size. Censuses are normally periodic events, often involving the gathering of demographic data (sex ratio, age structure, etc.). As with any species, herpetofauna recording involves the concept of ‘population’, whether the national population or the population at a specific site or even subsite. Traditional definitions of ‘population’ refer to coherent units of a species in time and place, and are much easier to define in theory than to demonstrate in practice. Additional flexibility has been given in recent decades by terms such as ‘metapopulation’, ‘local population’ and ‘subpopulation’, but these are felt by some to confuse the picture. Metapopulations are theoretically networks of distinct local populations (or subpopulations) that are self-sustaining and exist independently, but with significant exchange of individuals, and hence genetic material, between them. Genetic exchange is seen as beneficial for any population, therefore habitat connectivity is important in maintaining genetic diversity. Metapopulations are typically associated with habitat features (such as groups of ponds), which provide focal points for local populations. The term metapopulation is popular in amphibian biology and ecology, particularly with reference to networks of newt ponds. However, it could equally apply to reptiles, the population size, extent and structure of which are altogether much more difficult to ascertain. Various strategies can be employed for herpetofauna surveillance and monitoring, depending on the purpose and the scale of the operation. A census may employ an intensive count of all known individuals within populations, whereas a system of sampling may be used to gain a representative insight with less effort. The condition of designated interest features on SSSIs is monitored on a cyclical basis: every site unit on every site must be assessed; therefore the sample size is 100%. Certain very rare species might be censused with an absolute count, but there are unlikely to be any other circumstances where species surveillance or monitoring operates a 100% sampling regime. Resources and practicalities would demand that a representative sample is sought, as small as possible to minimise effort, but large enough to be extrapolated with confidence. Samples are generally randomly selected in order to be statistically valid, but they may be biased to include certain key sites, and are sometimes ‘stratified’ to reflect categories such as habitat types proportionately. Calculating a sample size often involves analysis of statistical ‘power’ - ie the ability to make the correct conclusion - in this case calculating the size of sample needed for the purpose. For common or widespread species, it is too onerous to record every single population location, but the likelihood of occurrence may be predicted by extrapolating from the known distribution. GIS habitat inventories are likely to play an important part in such exercises. An understanding of information gaps and inconsistencies in any dataset is also crucial. For rare species, a site inventory of all known populations may be necessary for monitoring and surveillance to operate effectively. Although it may not be an obligation to know all the population locations for a species, it would help the construction of representative sampling regimes. As part of this project, ‘baseline datasets’ were created for three rare species in England (natterjack toad, sand lizard, smooth snake) in the form of site inventories with associated population status information (Gleed-Owen 2004a). This exercise demonstrated that not all sites are known for two of these species. For a species with a small number of sites (eg natterjack toad), it may be possible to apply monitoring or surveillance to all of them; for a larger number of sites (eg sand lizard), a sample may need to be selected.

19
2 Monitoring objectives 2.1 (A) Condition of interest features on designated sites
2.1.1 Herpetofauna on designated sites
In the UK, the statutory nature conservation agencies (SNCOs) are responsible for designating a series of protected sites to reflect the UK’s natural heritage. In England, Wales and Scotland these sites are termed Sites of Special Scientific Interest (SSSIs), and in Northern Ireland they are called Areas of Special Scientific Interest (ASSIs). They were designated under Section 28 of the Wildlife and Countryside Act 1981. The selection process for herpetofauna focused on the rare species and on important assemblages of widespread species. These ‘interest features’ for which each SSSI is designated, are defined in a document known as the ‘citation’; this guides the legal protection and management prescription for a site. In England, SSSIs are protected under the Wildlife and Countryside Act 1981 (as amended). In addition to the SSSI series, the Habitats Directives required the designation of Special Areas of Conservation (SACs) for the great crested newt, owing to its Annex II status. An international convention on wetland sites also resulted in designation of some ‘Ramsar’ sites, potentially including herpetofauna interests. Virtually all sites of international importance are first designated SSSIs (or ASSIs); in the case of SACs, this is facilitated by the Habitats Regulations 1994. The SSSI selection criteria for herpetofauna (NCC 1989) are based upon population counts for amphibians, but are less specific for reptiles. For the amphibians: all important established natterjack sites are eligible; great crested newt sites with counts of over 100 individuals are eligible; and for the others, good counts of several species (‘assemblages’) are required. For the sand lizard and/or smooth snake, all important established populations in Dorset, and all established populations elsewhere are eligible. For the widespread reptiles, important assemblages of three species are needed, but the guidance is not clear on how this judgement should be achieved. It is a brief summary only, and the selection process requires additional judgements such as ‘representation in the Area of Search’. Of the more than 4,100 SSSIs in England, it is difficult to assess how many have designated herpetofauna interest features. English Nature has recently carried out a useful survey of herpetofauna interest features, and an initial list of c.150 SSSIs was drawn up using the citations on the ENSIS database (J. Foster, pers. comm.). However, as older citations are often vague and ambiguous, many containing ineligible widespread species, this was not considered to be an accurate reflection of the intended interest features. Area Team staff were therefore asked to critically evaluate the citations alongside various supporting documents, and to give their interpretation of what were the eligible and intended interest features. A new list was created that is considered to be largely accurate, but the complexities of interpreting and recording notification documents may mean that small amendments are necessary in the future (J. Foster, pers. comm.).
20
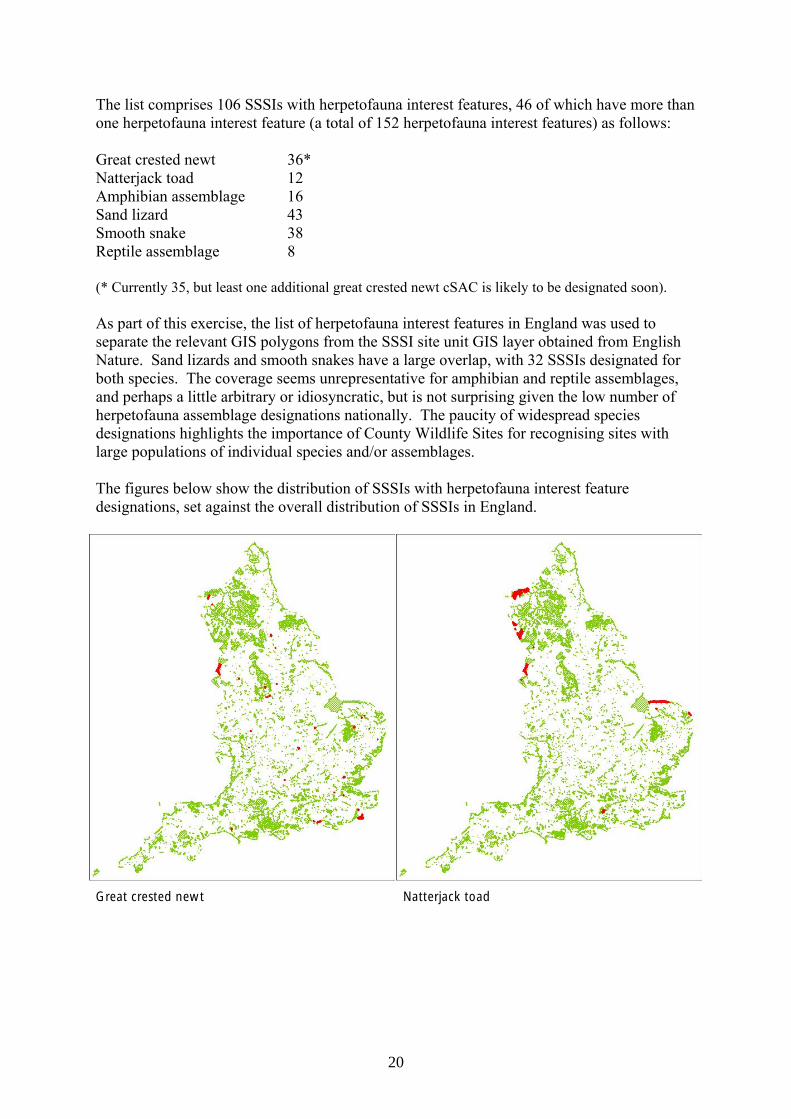
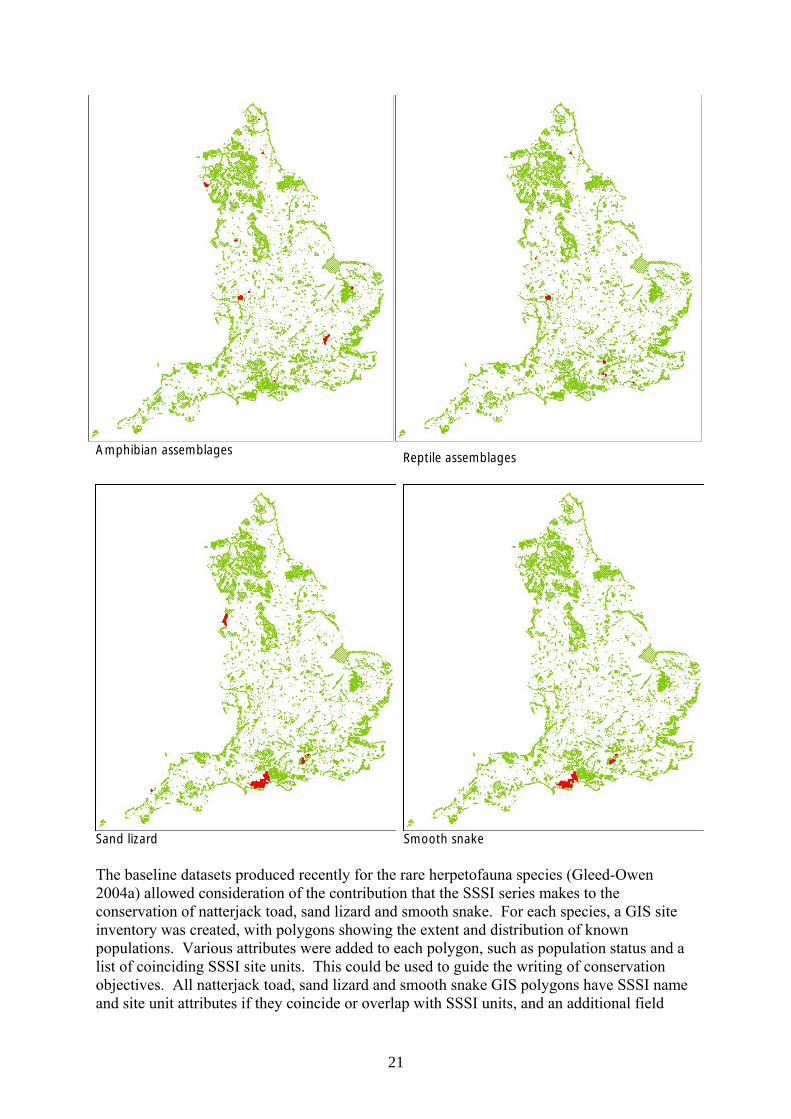
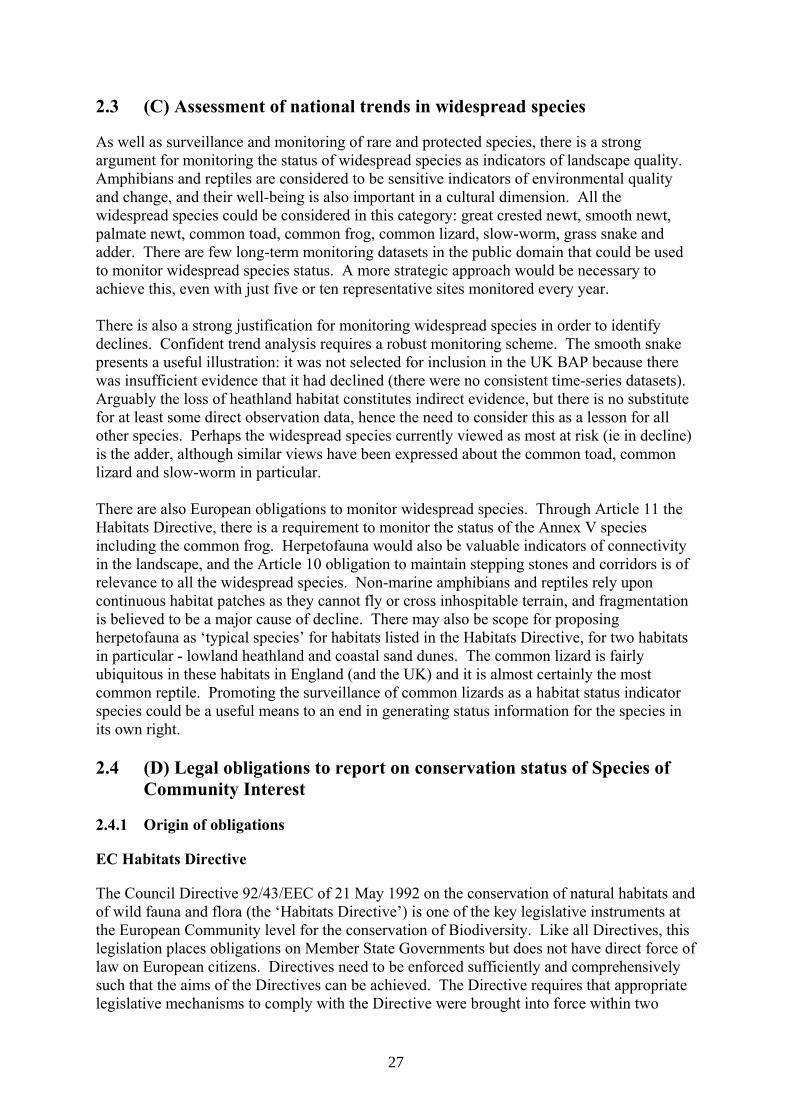
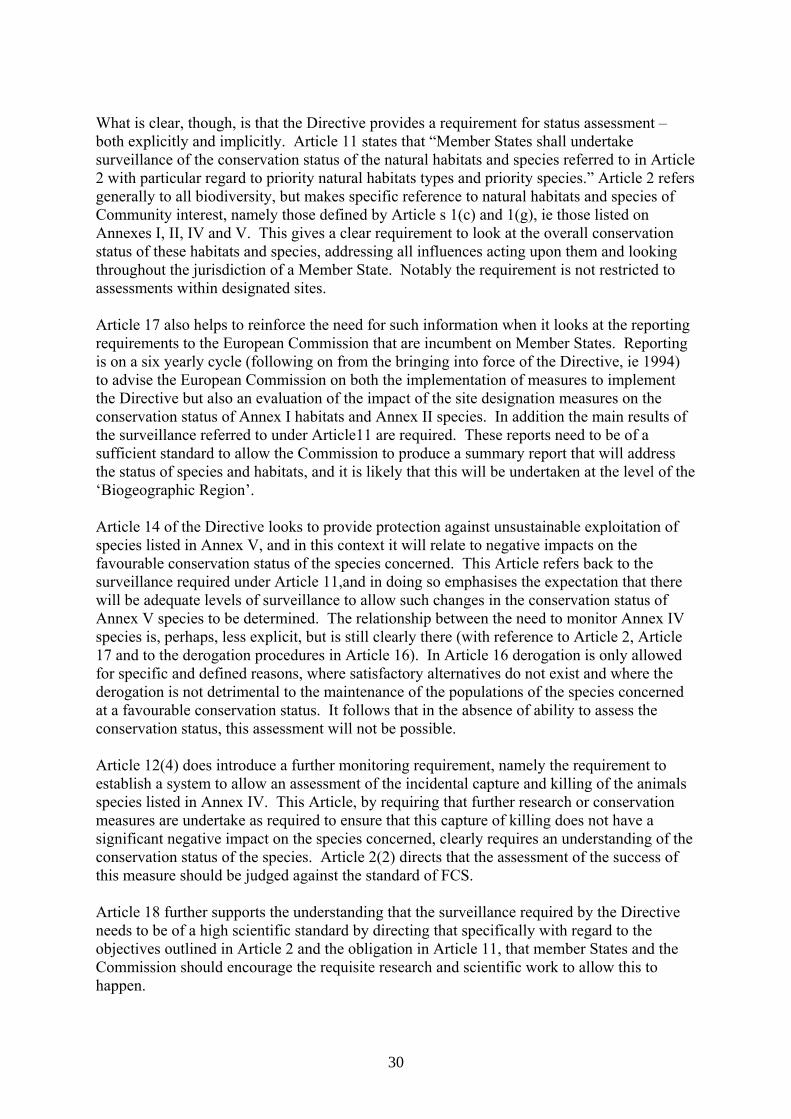
The list comprises 106 SSSIs with herpetofauna interest features, 46 of which have more than one herpetofauna interest feature (a total of 152 herpetofauna interest features) as follows: Great crested newt 36* Natterjack toad 12 Amphibian assemblage 16 Sand lizard 43 Smooth snake 38 Reptile assemblage 8 (* Currently 35, but least one additional great crested newt cSAC is likely to be designated soon). As part of this exercise, the list of herpetofauna interest features in England was used to separate the relevant GIS polygons from the SSSI site unit GIS layer obtained from English Nature. Sand lizards and smooth snakes have a large overlap, with 32 SSSIs designated for both species. The coverage seems unrepresentative for amphibian and reptile assemblages, and perhaps a little arbitrary or idiosyncratic, but is not surprising given the low number of herpetofauna assemblage designations nationally. The paucity of widespread species designations highlights the importance of County Wildlife Sites for recognising sites with large populations of individual species and/or assemblages. The figures below show the distribution of SSSIs with herpetofauna interest feature designations, set against the overall distribution of SSSIs in England.
Great crested newt Natterjack toad
21
Amphibian assemblages Reptile assemblages
Sand lizard Smooth snake The baseline datasets produced recently for the rare herpetofauna species (Gleed-Owen 2004a) allowed consideration of the contribution that the SSSI series makes to the conservation of natterjack toad, sand lizard and smooth snake. For each species, a GIS site inventory was created, with polygons showing the extent and distribution of known populations. Various attributes were added to each polygon, such as population status and a list of coinciding SSSI site units. This could be used to guide the writing of conservation objectives. All natterjack toad, sand lizard and smooth snake GIS polygons have SSSI name and site unit attributes if they coincide or overlap with SSSI units, and an additional field

22
titled Interest was used to identify those notified as interest features. Using GIS to compare the overlap of the species’ distributions with the SSSI series, it was possible to calculate the numbers of populations within and outside SSSIs, and the numbers of populations notified as interest features. A summary of the results is given in the table below.
Species Number of known extant populations
Number notified as SSSI interest
features
Number within SSSIs
Natterjack toad 49 35 (71%) 44 (90%) Sand lizard * 521 404 (78%) 448 (86%) Smooth snake * 163 59 (36%) 145 (89%) * Note that the sand lizard and smooth snake distribution data are incomplete, and further survey work will almost certainly discover new populations. The smooth snake site inventory also needs further attention as some sites need to be amalgamated and others need to be split. As GIS site inventories are not feasible for widespread species, an examination of SSSI coverage against population distribution was not possible for great crested newts or species assemblages. However, SSSI designations for widespread species clearly make up a miniscule proportion of all populations.
Sand lizard population foci (yellow) and potential foci (purple) mapped against SSSI coverage (dark green) in the Frome Valley, southeast Dorset. This exercise demonstrated that whilst the vast majority of rare species populations fall within SSSIs, a considerable proportion of them are not notified interest features. Almost a quarter of sand lizard populations, almost a third of natterjack populations, and two-thirds of smooth snake populations are not designated interest features. For sand lizards, this constitutes 117 populations, 63 of which are outside Dorset and therefore should be notified

23
(NCC 1989), and 29 of those outside Dorset originated from reintroductions. For the smooth snake, 104 extant populations (ie sites with post-1994 records) are not notified interest features. Ninety-eight of these are outside Dorset (the four reintroductions are among them), and 13 populations in Ringwood Forest (Hants.) essentially form a single metapopulation. Note also that the New Forest populations need further examination in terms of amalgamation and/or splitting. There are also likely to be other extant populations not included in the inventory, for which post-1994 data are not available. Targeted smooth snake survey is likely to identify more populations in the future, and this would alter the picture somewhat. Arguably, if it is worthwhile to designate herpetofauna as interest features, perhaps even necessary for their protection and conservation, then it might be argued that the SSSI series is insufficient, ie it does not include all populations that meet the criteria recommended by the guidance (particularly for smooth snakes). However, if the series is meant to be a representative selection of the best populations, then the current series is perhaps sufficient. The poor rate of smooth snake interest designation is presumably attributable to insufficient data being available on population sizes. There are a few anomalies where a rare species is designated a SSSI interest feature but there is no corresponding record in the site inventories, ie the HCT database contains no records for the species at that location. One sand lizard site (Slop Bog & Uddens Heath) and three smooth snake sites (Brenscombe Heath, Horton Common, Slop Bog & Uddens Heath) fit this category. The HCT database currently only holds the last 10 years of data for Dorset, so there may be undigitised data older than 10 years for these sites, but the gaps may also represent a total lack of survey. If so, they should be priorities for survey and/or data searches. Presumably English Nature would be able to execute searches to identify any relevant reports in its local or national team archives. It was made clear in the baseline dataset report (Gleed-Owen 2004a) that the sand lizard and smooth snake site inventories probably have significant gaps due to incomplete data collection. There are undoubtedly further sand lizard populations to discover, particularly on inaccessible MoD ranges and enclosed within forestry. Nevertheless, this is probably equivalent to no more than 5-10% of the national population. Distribution data on the smooth snake is much less complete. There are many locations where smooth snakes could occur, for which there are no data, and there are various areas that may support smooth snakes but where they have never been surveyed. Until these inventories are more complete, a realistic assessment of the relationship between these species and the SSSI series cannot be made. According to the latest list received from English Nature (January 2005), the great crested newt is a notified interest feature on 35 SSSIs. This includes over 20 SACs notified for great crested newt interests in England, but the SAC list has yet to be finalised (eg Holnest cSAC in Dorset). It is worth pointing out that there are important populations of great crested newts on other SACs where they are not notified interest features. The Ribble & Alt Estuaries is the only Ramsar site with a notified herpetofauna interest (ie the Sefton Coast SSSI population of natterjack toads). 2.1.2 Condition assessment process
After introduction of the Environmental Protection Act 1990, the SNCOs adopted a standardised system called ‘Common Standards Monitoring’ (CSM), to monitor the condition of SSSIs and the effectiveness of conservation measures, relevant legislation and policies.

24
CSM is carried out on all SSSIs over a six-year cycle, and sites can be assessed individually or the results can be aggregated. According to the JNCC website (www.jncc.gov.uk/default.aspx?page=2217), CSM is intended to cover the following: • features to be monitored; • conservation objectives; • judging the condition of site features; • recording threats and management measures; • monitoring cycle; • reporting arrangements. The Herpetofauna Inter-Agency Working Group have produced advice on CSM of herpetofauna interest features, published on the JNCC website (www.jncc.gov.uk/default.aspx?page=2223) in February 2004 as Common Standards Monitoring Guidance for Reptiles and Amphibians. It sets out the requirements for monitoring herpetofauna on SSSIs, and its proposed assessment methods. The document suggests that CSM of herpetofauna interest features should take place at least once every three years, and in the case of amphibians, more often. The assessment methods involve a mixture of direct assessment (species observation) and indirect assessment (habitat quality). The document emphasises the need to understand the variation of habitat across a site, and to maximise the validity of the assessment by fully understanding the species' ecologies. It also makes clear that the baseline values, against which CSM will monitor, are to be those recorded at the time of designation. Presumably this is not actually possible in many cases if count data were never collected, and/or if data were not collected from all relevant site units. According to the guidance, data from the three years preceding designation are most relevant. The conservation objectives for each SSSI need to be based on the CSM guidance, and there is likely to be a lag time before these are completed for all of England’s SSSI series. The methods of assessment are tabulated for standard application to reptiles, natterjack toad, and other amphibians respectively. The habitat quality assessment looks at various attributes such as vegetation structure and breeding sites. The direct species observation part involves simple detection of presence/absence and evidence of breeding for all species, with the addition of counts for widespread amphibians. The simplicity of the direct observation attributes is justified by the difficulty in standardising criteria between species and sites. Herpetofauna CSM should give results in one of the standard categories: favourable maintained, favourable recovered, unfavourable recovering, unfavourable no change, unfavourable declining, partially destroyed, destroyed. All attribute targets have to be met for site condition to be classed as favourable; if one or more targets are not met, the condition is classed as unfavourable. The subclasses of recovering, no change and declining are at the assessor’s discretion, but should not be based on species counts unless showing marked trends for at least three years. It is recognised that opportunities for utilising data from other sources such as HCT monitoring programmes, amphibian and reptile groups (ARGs) should

25
be embraced where possible, although such sources may not include sufficient habitat assessment elements. Note that development of habitat quality assessment techniques is currently being attempted by the HCT, as an indirect means of assessing species status. The current driving force behind CSM and the management of the SSSI series is the SNCOs’ commitment to meeting Government targets on site condition. In recognition that many SSSIs were in poor condition, English Nature committed to a Public Service Agreement (PSA) with Defra in 2000, to return 95% of SSSIs to favourable or favourable recovering condition by 2010. In 2003, c. 57% were in favourable or recovering condition. This PSA target has applied acute pressure on English Nature’s resources, and highlights the need for effective and efficient CSM. 2.2 (B) Status of BAP and other nationally important species
Originating from the Rio ‘Earth Summit’ Convention on Biological Diversity (CBD) in 1992, the UK Biodiversity Action Plan (BAP) was published in 1995 to identify species and habitats in serious decline. It included three non-marine herpetofauna species (great crested newt, natterjack toad, sand lizard) and the five marine turtle species known from British waters. A fourth non-marine species was added later (pool frog). There was insufficient monitoring data to include the smooth snake, despite its key habitats being in decline. For each species, a Species Action Plan (SAP) was published, defining goals for recovery such as habitat management, reintroduction to former sites, and better data collection. One or more Lead Partner organisations were chosen to lead the implementation of each SAP, and partnerships were developed nationally, regionally and locally. The sand lizard and natterjack toad SAPs are delivered almost exclusively via nationally-coordinated initiatives, but the great crested newt SAP is geared more towards local action. To aid progress towards BAP targets, Species Recovery Programmes (SRPs) were initiated for herpetofaunal BAP species, but also for the smooth snake. There is a three-year reporting cycle for BAP, with data collected centrally by the UK Biodiversity Partnership via the UK BAP website (www.ukbap.org.uk). The reporting collects textual rather than numeric information, in broad categories only, and doesn’t require breakdown of activities in detail. The reporting process should be improved by the newly-developed Biodiversity Action Reporting System (BARS) (www.ukbap-reporting.org.uk/) which will be used during the next BAP reporting round in 2005. Data-deficiency has previously been a recurring problem for herpetofauna (as for many other species), therefore data collection and establishment of databases is a key action in all the herpetofauna SAPs. The HCT has established a database for non-marine species records, and the ‘TURTLE’ database has been set up by Rod Penrose (Marine Environmental Monitoring Ltd.) on behalf of the Turtle Implementation Group (TIG) for the marine turtles. The Biodiversity Reporting and Information Group (BRIG) reviews BAP targets every six years, and the next review is due to take place in 2005. New targets can be expected for all the herpetofauna SAPs, and this is likely to affect any monitoring plans.

26
The following table summarises the targets and actions for each of the UK BAP species. BAP species Targets Actions Great crested newt
• 100 new viable populations per year
• Maintain its geographical range
• Maintain viability of populations
• Better consideration in local planning, financial incentives, legislation
• Safeguard existing sites, improved management, habitat restoration, creation of new sites
• Encourage dispersal, translocate if necessary • Publish mitigation guidelines, promote training • Improve recording & surveillance methods, encourage
survey & research • Develop national database, improve dissemination • Greater communication, publicity & advocacy
Natterjack toad
• Maintain size of all populations
• Restore populations to 1970s levels
• 5 new viable populations
• Review SSSI policy & wildlife legislation • Consideration in local planning, incentives for
sympathetic management, produce regional strategies • Identify priority sites, seek opportunities for tenure • Produce plans for sustainable site management • Review efficacy of SSSI & other designated sites • Produce translocation strategy • Greater dissemination & public awareness • Coordinate national monitoring programme • Research into extinctions & translocation failures • Establish FCS definitions & SSSI monitoring methods
Pool frog • Recover the last population if not extinct
• 3 new viable populations
• Review legislation & formulate reintroduction plans • Manage remaining site & assess potential of others • Maintain captive breeding & reintroduce to 3 sites • Guidance on habitat management & non-native frogs • Continue research into native status • Monitor last site, assess reasons for decline • Develop European links, prepare for publicity
Marine turtles
• Avoid harm & by-catch
• International conservation
• Influence fisheries policy & coastal water quality • Review legislation & ensure enforcement • Publicise impact of nesting beach developments etc. • Codes of practice, disseminate information • Set up database & develop surveillance systems • Promote research into minimising by-catch • Encourage awareness & ethical considerations • Promote international conservation measures
Sand lizard • 10 new populations by 2000
• Maintain all populations at 1995 level
• Enhance where possible
• Reverse habitat fragmentation
• Encourage habitat creation & appropriate management • Review legislation & SSSI coverage • Standard guidance & proper consideration in planning • Landowner awareness & sympathetic management • Maintain all populations, enhance if possible • Reintroduction strategy, captive breeding, translocation • Develop standardised monitoring methodology • Create database & protocols for data use • Promote research into genetics & potential threats • Publicity & raised awareness
27
2.3 (C) Assessment of national trends in widespread species
As well as surveillance and monitoring of rare and protected species, there is a strong argument for monitoring the status of widespread species as indicators of landscape quality. Amphibians and reptiles are considered to be sensitive indicators of environmental quality and change, and their well-being is also important in a cultural dimension. All the widespread species could be considered in this category: great crested newt, smooth newt, palmate newt, common toad, common frog, common lizard, slow-worm, grass snake and adder. There are few long-term monitoring datasets in the public domain that could be used to monitor widespread species status. A more strategic approach would be necessary to achieve this, even with just five or ten representative sites monitored every year. There is also a strong justification for monitoring widespread species in order to identify declines. Confident trend analysis requires a robust monitoring scheme. The smooth snake presents a useful illustration: it was not selected for inclusion in the UK BAP because there was insufficient evidence that it had declined (there were no consistent time-series datasets). Arguably the loss of heathland habitat constitutes indirect evidence, but there is no substitute for at least some direct observation data, hence the need to consider this as a lesson for all other species. Perhaps the widespread species currently viewed as most at risk (ie in decline) is the adder, although similar views have been expressed about the common toad, common lizard and slow-worm in particular. There are also European obligations to monitor widespread species. Through Article 11 the Habitats Directive, there is a requirement to monitor the status of the Annex V species including the common frog. Herpetofauna would also be valuable indicators of connectivity in the landscape, and the Article 10 obligation to maintain stepping stones and corridors is of relevance to all the widespread species. Non-marine amphibians and reptiles rely upon continuous habitat patches as they cannot fly or cross inhospitable terrain, and fragmentation is believed to be a major cause of decline. There may also be scope for proposing herpetofauna as ‘typical species’ for habitats listed in the Habitats Directive, for two habitats in particular - lowland heathland and coastal sand dunes. The common lizard is fairly ubiquitous in these habitats in England (and the UK) and it is almost certainly the most common reptile. Promoting the surveillance of common lizards as a habitat status indicator species could be a useful means to an end in generating status information for the species in its own right. 2.4 (D) Legal obligations to report on conservation status of Species of
Community Interest
2.4.1 Origin of obligations
EC Habitats Directive
The Council Directive 92/43/EEC of 21 May 1992 on the conservation of natural habitats and of wild fauna and flora (the ‘Habitats Directive’) is one of the key legislative instruments at the European Community level for the conservation of Biodiversity. Like all Directives, this legislation places obligations on Member State Governments but does not have direct force of law on European citizens. Directives need to be enforced sufficiently and comprehensively such that the aims of the Directives can be achieved. The Directive requires that appropriate legislative mechanisms to comply with the Directive were brought into force within two

28
years of the notification of the Directive. The legislative measure in the Great Britain to do this was the Conservation (Natural Habitats etc.) Regulations 1994. The aim of the Habitats Directive is to contribute towards ensuring biodiversity through the conservation of natural habitats and of wild fauna and flora (Article 2(1)), recognising the losses and overall reduction in quality of biodiversity and habitats in Europe. It qualifies this aim by determining that the measures taken to implement the Directive “shall be designed to maintain or restore, at favourable conservation status, natural habitats and species of wild fauna and flora of Community interest” (Article 2(2)). ‘Species of Community interest’ are defined (in Article 1(g)) as those that within the territory of the European Community are: (i) endangered, except for those species whose natural range is marginal in that territory
and which are not endangered or vulnerable in the western Palaearctic region; or
(ii) vulnerable, ie believed likely to move into the endangered category in the near future if the causal factors continue operating; or
(iii) rare, ie small populations that are not at present endangered or vulnerable, but are at risk. These species are located within restricted geographical areas or are thinly scattered over a more extensive range; or
(iv) endemic and requiring particular attention by reason of the specific nature of their habitat and/or the potential impact of their exploitation on their habitat and/or the potential impact of their exploitation on their conservation status.
Such species are listed or may be listed in Annex II and/or Annex IV or V. The Directive therefore provides an overall aim, and within subsequent Articles a series of specific obligations to further this aim. Through Article 2(2) it sets a standard to which the provisions are expected to be applied, namely that of achieving favourable conservation status. Not only should the measures in the Directive be interpreted in the light of this purpose, the measure also need to have this effect in practice. The importance of this concept is that there is an expectation that a standard should be achieved, and in this requirement an overall expectation that it should be measured and progress towards the goal reported. The Directive provides guidance as to what is meant by conservation status. Article 1(i) states that the conservation status of a species ‘means the sum of all influences acting on the species concerned that may affect the long-term distribution and abundance of its populations’ within the territory of the European Union. The ideas set out here look beyond simple instantaneous measures of population size or abundance, but bring in the concept of a whole range of biological and anthropogenic factors that may influence the well-being and viability of the species as a whole, including legislative measures, perception, likelihood for exploitation and conservation management systems and funding. Importantly this also requires an assessment of status not only now, but also in the foreseeable future. Article 1(i) goes on to define when this conservation status would be considered favourable. The conservation status for a species will taken as favourable when: • population dynamics data on the species concerned indicate that it is maintaining
itself on a long-term basis as a viable component of its natural habitats, and

29
• the natural range of the species is neither being reduced nor is likely to be reduced for the foreseeable future, and
• there is, and will probably continue to be, a sufficiently large habitat to maintain its populations on a long-term basis.
As well as for species, the Habitats Directive provides a definition for natural habitats and criteria for assessing if these are in a favourable conservation status. Article 1(e) of the Directive states: “the conservation status of a natural habitat means the sum of the influences acting on a natural habitat and its typical species that may affect its long-term natural distribution, structure and function as well as the long-term survival of its typical species within the territory [of the European Union]”. The Directive defines a natural habitat as terrestrial or aquatic areas distinguished by geographic, abiotic or biotic features whether entirely natural or semi-natural. Note that this is different to the ‘habitat of a species’ which for the purpose of the definition in Article 1(i) simply describes the biotic and abiotic factors in which a species lives at any stage of its biological cycle. While the focus of the Directive looks at conserving natural habitats of Community interest which are identified in Annex I (and with an emphasis on the more threatened priority natural habitat types denoted within Annex I by an asterisk (*)), it offers a more general definition for assessing the conservation status of any natural habitat and determining whether it is in a favourable conservation status. These are considered favourable when: • its natural range and areas it covers within that range are stable or increasing, and • the specific structure and functions which are necessary for its long-term maintenance
exist and are likely to continue to exist for the foreseeable future, and • the conservation status of its typical species is favourable as defined in [Article I (i)]. The definitions for favourable conservation status for both species and habitats are valuable. However in both cases they include terms that are not defined, and yet are critical to the interpretation. Equally the phraseology implies ‘maintenance’, stability or absence of reduction (though in the case of habitats, also an indication of the need for expansion of range). These point towards comparison to a baseline date, perhaps that when the Directive was written or when it came into force. However there should be no implication that this baseline date indicates a point in time when the conservation status was favourable, and indeed the assumption (and definition of both habitats and species of Community interest) is that listing of these species is because, at that time, they were not. Exploration of the meaning and possible interpretation of these terms has exercised the minds of the Scientific Working Group of the ‘Habitats Committee’, a committee established through the Habitats Directive to oversee the implementation of the Directive. Other working groups, such as that established through the European Commission to look at the implementation of Article 12 are looking at specific applications and interpretations. In particular the issue of base line dates and the definition of ‘natural range’ (which is seen as a dynamic concept) are being discussed. These papers are, at the time of writing, still being developed and any interpretation could ultimately be subject to legal challenge through the European Court of Justice.
30
What is clear, though, is that the Directive provides a requirement for status assessment – both explicitly and implicitly. Article 11 states that “Member States shall undertake surveillance of the conservation status of the natural habitats and species referred to in Article 2 with particular regard to priority natural habitats types and priority species.” Article 2 refers generally to all biodiversity, but makes specific reference to natural habitats and species of Community interest, namely those defined by Article s 1(c) and 1(g), ie those listed on Annexes I, II, IV and V. This gives a clear requirement to look at the overall conservation status of these habitats and species, addressing all influences acting upon them and looking throughout the jurisdiction of a Member State. Notably the requirement is not restricted to assessments within designated sites. Article 17 also helps to reinforce the need for such information when it looks at the reporting requirements to the European Commission that are incumbent on Member States. Reporting is on a six yearly cycle (following on from the bringing into force of the Directive, ie 1994) to advise the European Commission on both the implementation of measures to implement the Directive but also an evaluation of the impact of the site designation measures on the conservation status of Annex I habitats and Annex II species. In addition the main results of the surveillance referred to under Article11 are required. These reports need to be of a sufficient standard to allow the Commission to produce a summary report that will address the status of species and habitats, and it is likely that this will be undertaken at the level of the ‘Biogeographic Region’. Article 14 of the Directive looks to provide protection against unsustainable exploitation of species listed in Annex V, and in this context it will relate to negative impacts on the favourable conservation status of the species concerned. This Article refers back to the surveillance required under Article 11,and in doing so emphasises the expectation that there will be adequate levels of surveillance to allow such changes in the conservation status of Annex V species to be determined. The relationship between the need to monitor Annex IV species is, perhaps, less explicit, but is still clearly there (with reference to Article 2, Article 17 and to the derogation procedures in Article 16). In Article 16 derogation is only allowed for specific and defined reasons, where satisfactory alternatives do not exist and where the derogation is not detrimental to the maintenance of the populations of the species concerned at a favourable conservation status. It follows that in the absence of ability to assess the conservation status, this assessment will not be possible. Article 12(4) does introduce a further monitoring requirement, namely the requirement to establish a system to allow an assessment of the incidental capture and killing of the animals species listed in Annex IV. This Article, by requiring that further research or conservation measures are undertake as required to ensure that this capture of killing does not have a significant negative impact on the species concerned, clearly requires an understanding of the conservation status of the species. Article 2(2) directs that the assessment of the success of this measure should be judged against the standard of FCS. Article 18 further supports the understanding that the surveillance required by the Directive needs to be of a high scientific standard by directing that specifically with regard to the objectives outlined in Article 2 and the obligation in Article 11, that member States and the Commission should encourage the requisite research and scientific work to allow this to happen.

31
All of the above obligations need to be transposed to domestic legislation in the UK. However in the absence of transposition to UK law, the Directive will have the effect of law for Government or other ‘emanation of the state’. There is a six-year reporting cycle and the European Commission has indicated its expectation that by the 2006 reporting round, there will be measures of conservation status for the habitats and species identified through the Directive. Convention on Biological Diversity and national & European Action Plans
The CBD was negotiated under the auspices of the United Nations Environment Programme (UNEP). It was opened for signature at the June 1992 UN Conference on Environment and Development (UNCED) and entered into force on 29 December 1993, ninety days after the 30th ratification. The three goals of the CBD are to promote the conservation of biodiversity, the sustainable use of its components, and the fair and equitable sharing of benefits arising out of the utilization of genetic resources. Article 7 of the Convention requires of contracting parties, for the purposes of in-situ and ex-situ conservation, and the sustainable use of biodiversity, to (amongst other things): • monitor through sampling and other techniques the components of biological diversity
paying particular attention to those requiring urgent conservation measures and those offering the greatest potential for sustainable use;
• identify processes and categories of activities which have, or are likely to have, a significant adverse impact on the conservation and sustainable use of biodiversity and monitor their effects through sampling and other techniques;
• maintain and organise by any mechanism, data derived from identification and monitoring activities relevant to the above.
One action arising from CBD was the production of Biodiversity Action Plans by the parties to the Convention. These have been produced at both the European and the UK levels. The EC Biodiversity Strategy, adopted in 1998, was developed to meet the EC’s obligation as a Party to the Convention on Biological Diversity. Since then significant statements of European Policy have been made to confirm the need for conservation action. These include a commitment by EU Heads of State and Government at the EU’s Spring Summit in Gothenburg in 2001, to ‘halt the decline of Biodiversity by 2010’, which was expanded via the Kyiv Resolution on Biodiversity in 2003 to halt the loss of Biodiversity to the pan-European region. With these ‘2010’ targets has come the need to be able to monitor and report on progress. Much of this is likely to be done via ‘biodiversity indicators’ to allow communication to the general public and to decision-makers. Further consideration of research and monitoring approaches were adopted via the Killarney Declaration and Recommendations on Biodiversity Research of May 2004. These looked at enhancing the value of information, promoting research and public engagement. The EU further confirmed its commitment to the 2010 target at the United Nations’ World Summit on Sustainable Development (WSSD) held in Johannesburg in 2002, and provide a commitment to supporting monitoring of biodiversity beyond the confines of the European Union and the ‘pan-European’ level.

32
In the UK, the UK Biodiversity Action Plan (BAP) was published in 1995. This provides a target driven approach and with it the need to follow and monitor both the progress of targets and the change in status of species and habitats. In the ’59 steps’, which provided a framework for action for monitoring progress of the plan, the need for biodiversity monitoring goals were identified. The BAP programme reports on progress every three years. Biological recording to support the BAP occurs at different levels – nationally this has been led through web-based reporting systems, forming part of the responsibilities of Lead partners and Agencies. Reporting of perceived changes in status formed part of this process. Other legislative and policy issues in the UK drive the need for adequate data. For example the broad requirement in England through Section 74 of the Countryside & Rights of Way Act 2000 for Governmental bodies to have regard to the objectives of the BAP means that adequate information is required to ensure that this happens. The implementation of planning legislation and policy, and in particular the need for information about designated sites and protected species, generates the need for sufficient information for the planning authorities to undertake their roles properly. This helps provide support for local and national recording schemes. The need for reporting on an international, European and national level for CBD and at a European level for both the Habitats Directive and the ‘2010 targets’ has provided a clear legal and political imperative for monitoring, and to encourage a convergence of monitoring to fulfil all of these different aims. The increasing need for biodiversity data to fulfil a range of needs and obligations should identify the very obvious need for systems that allow the provision and interpretation of data to a range of decision-making and enforcement bodies. While high level ‘headline’ indicators are being promoted, the need for monitoring of the status of individual species and habitats remains crucial. 2.4.2 Current work in the EC, UK and other Member States
Habitats Directive monitoring
The EC’s ‘Habitats Committee’, through its Scientific Working Group (SWG) has undertaken considerable work to look at the development of conservation status monitoring and made progress on definitions of ‘favourable conservation status’. This has been of increasing prominence since 2002. The SWG comprises scientific and policy representatives from Member States, the EC and NGO ‘observers’. The Group is still extant at the time of writing. Monitoring, indicators and reporting on state, trends and pressures on the components of biological diversity and related issues are required under EU policy and legislation, pan-European agreements and the UN Convention on biological diversity. The SWG recognises the wide range of initiatives are being undertaken in this context. The Habitats Directive is one of the EU’s most significant contributions to the aim of halting the loss of biodiversity by 2010 and effective monitoring of the outcomes of the Directive is considered a significant aspect of taking forward European policy and European law. Importantly the group has recognised the importance of not being restricted to Natura 2000 sites and the need to collect data both in and outside the Natura 2000 network to achieve a full appreciation of conservation status. Monitoring must therefore lead to a clear picture of the actual conservation status and its trends on various levels and indicate the effectiveness of the directive in terms of approaching and reaching this objective.

33
The SWG has addressed different aspects about the monitoring of the Directive and addressed key definitions and agreed general approaches. It is keen that Members States should develop specific monitoring approaches, but that these should fit together within a Europe-wide framework. The Group produced a paper for the Habitats Committee in November 2004, entitled “Assessment, monitoring and reporting of conservation status – Preparing the 2007 report under Article 17 of the Habitats Directive (DocHab-04-03/03 rev.2)” (EC SWG 2004). The document has a series of annexes that look at approaches and definitions and should be referred to in developing schemes for monitoring European Protected Species. Annexes are as follows: Annex A: General reporting format for the 2001-2006 report Annex B: Reporting format for the conservation status of a species Annex C: Evaluation matrix for the conservation status of a species Annex D: Reporting format for the conservation status of a habitat type Annex E: Evaluation matrix for the conservation status of a habitat type Annex F: Definition of key terms: “Natural range” Annex G: Definition of key terms: “Typical species” The focus of the group is the monitoring requirements and the reporting timetable. There is a clear expectation that the focus of the 2007 report (covering the period 2001-2006) will make a first assessment of conservation status, as shown in the table below. Reporting
period National report
(EU synthesis report) Main focus
1. 1994 – 2000 2001 (2003/4)
Progress in legal transposition and implementation of the directive; progress in establishing the Natura 2000 network, administrative aspects.
2. 2001 – 2006 2007 (2008/9)
First assessment of conservation status based on best available data (in comparison with favourable reference values)
3. 2007 – 2012 2013 (2014/15)
Renewed assessment of conservation status in comparison to reference values, based on established monitoring system. Assessment of effectiveness of measures taken under the directive.
It is proposed that the SWG should play the role of a support mechanism in relation to all questions regarding conservation status assessment, monitoring and reporting as monitoring schemes approach the 2007 reporting round. Once Member States have reported in 2007 to the Commission, the Commission will compile the information and assess the situation from an EU perspective, which will include assessments at a biogeographical level. In order to provide a synthesis report, which will be as informative, scientifically sound and as clear as possible, consideration has been given to consulting in the form of a new “biogeographic process”, ie a round of seminars which would bring Member State experts, independent experts, the European Topic Centre and EC together to debate the draft conclusions of the EU-analysis, to correct/fine-tune results where necessary and discuss priorities for future actions. Such a process would also help to re-check quality of data, discuss trans-border issues where monitoring results from neighbouring regions seem not to match, reference values, etc. The final Commission synthesis report would be issued only after such a process and would contain not only an analysis but also agreed proposals for joint conservation action.

34
To support work on monitoring, assessment and reporting of conservation status of species and habitat types under the Habitats (92/43/EEC) and Birds (79/409/EEC) Directive, the European Commission established a publicly-accessible web-based interest group called ‘CIRCA’ (http://forum.europa.eu.int/Public/irc/env/Home/main). This makes relevant documents, internet-links, papers, etc available to whoever is interested and especially to those actively involved in the process. Convention on Biological Diversity and pan-European ‘indicators’
At the 7th Conference of the Parties of the CBD, a framework of indicators (Decision VII.30) was adopted to measure the achievement of the target to achieve by 2010 a significant reduction of the current rate of biodiversity loss. Through the European Commission Biodiversity Expert Group and other meetings work has been undertaken to see how these indicators might be implemented at European and Pan-European scales. This work was further taken forward through the discussions and conclusion developed at the Malahide Biodiversity meeting and the EU - Sustaining Life, Sustaining Livelihoods Conference, which have been welcomed by the Environment Council (in June 2004). While initially separate tracks were being developed for work on the CBD and within the EC, the processes for development of indicators at global, EU and Pan-European levels have converged. There is now momentum for rapid progress to production of global and European indicators with a view to publication of a first assessment in 2006. Work is underway to determine how the EU indicators will be developed (co-ordinated by the European Environment Agency and EC Biodiversity Expert Group), and how these developments should fit with global assessments under CBD undertaken by the CBD Secretariat and UNEP-World Conservation Monitoring Centre. There is still debate to be had within Europe about a top-level biodiversity indicator that would hopefully form part of the set of ‘structural indicators’ reviewed by Heads of State in the spring Council meeting each year. In terms of development of the individual indicators, it is expected that a number of expert groups will be convened. The UK (through Defra and JNCC) has expressed willingness to be involved in this work. The increased burden of biodiversity reporting is causing concern and the current emphasis on process/ activity summaries rather than biological outcomes is seen as problematic. However a gradual change in approach is being advocated to ensure widespread support. Within England, indicators chosen for the England Biodiversity Strategy are considered to be useful for supporting the CBD and EU processes. Though some obvious gaps, such as genetic biodiversity and invasive non-natives, are noted. This process is set to continue working towards reporting in 2006. Important data sources for that work will be gathered under the reporting requirements of the Habitats and Birds Directives. Favourable Conservation Status
The term FCS is increasingly being recognised as a clear and defined goal of the Habitats Directive. It is also referred to in a number of different contexts, for example Status
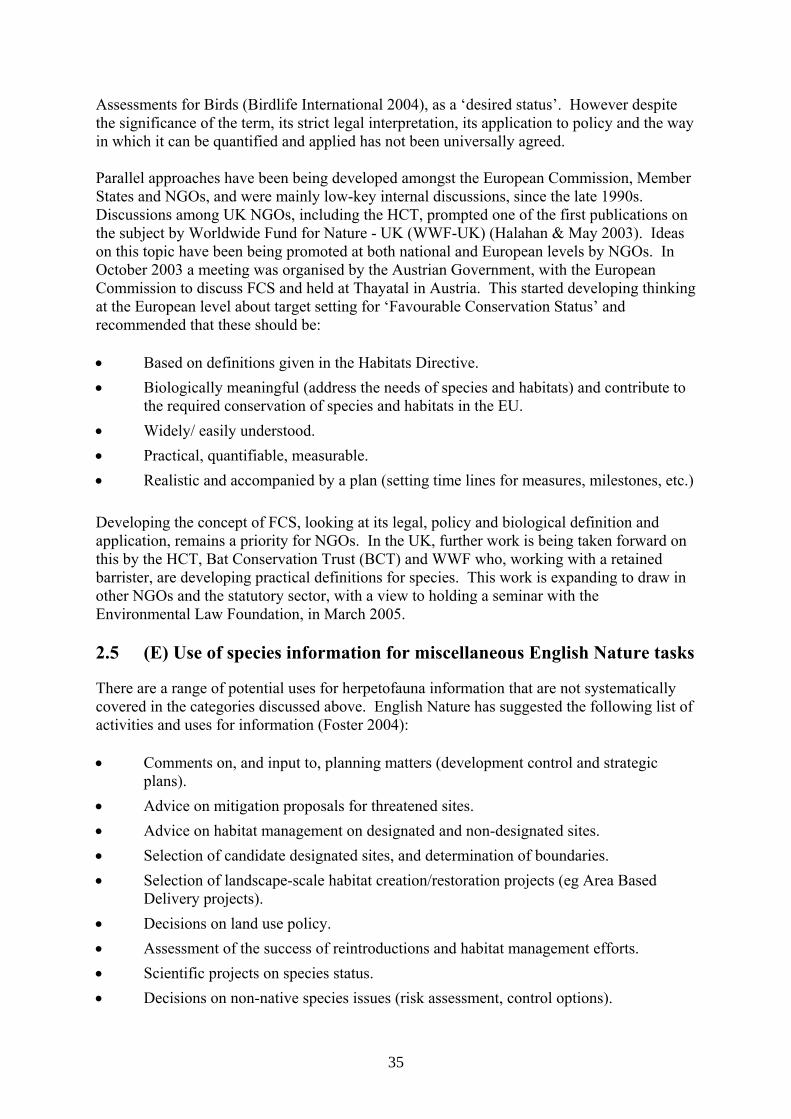
35
Assessments for Birds (Birdlife International 2004), as a ‘desired status’. However despite the significance of the term, its strict legal interpretation, its application to policy and the way in which it can be quantified and applied has not been universally agreed. Parallel approaches have been being developed amongst the European Commission, Member States and NGOs, and were mainly low-key internal discussions, since the late 1990s. Discussions among UK NGOs, including the HCT, prompted one of the first publications on the subject by Worldwide Fund for Nature - UK (WWF-UK) (Halahan & May 2003). Ideas on this topic have been being promoted at both national and European levels by NGOs. In October 2003 a meeting was organised by the Austrian Government, with the European Commission to discuss FCS and held at Thayatal in Austria. This started developing thinking at the European level about target setting for ‘Favourable Conservation Status’ and recommended that these should be: • Based on definitions given in the Habitats Directive. • Biologically meaningful (address the needs of species and habitats) and contribute to
the required conservation of species and habitats in the EU. • Widely/ easily understood. • Practical, quantifiable, measurable. • Realistic and accompanied by a plan (setting time lines for measures, milestones, etc.) Developing the concept of FCS, looking at its legal, policy and biological definition and application, remains a priority for NGOs. In the UK, further work is being taken forward on this by the HCT, Bat Conservation Trust (BCT) and WWF who, working with a retained barrister, are developing practical definitions for species. This work is expanding to draw in other NGOs and the statutory sector, with a view to holding a seminar with the Environmental Law Foundation, in March 2005. 2.5 (E) Use of species information for miscellaneous English Nature tasks
There are a range of potential uses for herpetofauna information that are not systematically covered in the categories discussed above. English Nature has suggested the following list of activities and uses for information (Foster 2004): • Comments on, and input to, planning matters (development control and strategic
plans). • Advice on mitigation proposals for threatened sites. • Advice on habitat management on designated and non-designated sites. • Selection of candidate designated sites, and determination of boundaries. • Selection of landscape-scale habitat creation/restoration projects (eg Area Based
Delivery projects). • Decisions on land use policy. • Assessment of the success of reintroductions and habitat management efforts. • Scientific projects on species status. • Decisions on non-native species issues (risk assessment, control options).

36
• Assessment of optimal survey techniques and survey effort. • Educational projects. Normally these needs for information are likely to arise on an ad hoc basis, depending on the needs of Conservation Officers (COs) and Area Teams. For example, the London Team recently commissioned an adder survey. There may also be national projects or targeted research for example. Their ad hoc nature places them in this miscellaneous category, but in fact these items may be of critical conservation value. 2.6 (F) Distribution and status of introduced herpetofauna species
As stated at the outset, there are potentially as many introduced amphibian and reptile species in England as there are native species. At least 11 are currently present and breeding, and up to 17 species may be present. The highly aquatic water frogs (marsh frog, edible frog, pool frog) are collectively the most widely-occurring and numerous introduced species in England (Wycherley 2003). There have been many introductions from Europe since Victorian times, and whilst some populations don’t survive long-term, all three species can breed successfully and at some sites can apparently persist indefinitely. They have spread in some areas, eg marsh frogs becoming widespread on Romney Marsh since their introduction in 1935 (Beebee & Griffiths 2000; Smith 1951), and they appear to be spreading rapidly in the River Hull valley in Humberside (Wycherley 2003). Nevertheless, there seem to be few concerns about them being invasive in the true sense. Their habitat requirements are probably a restricting factor, but as stated by Beebee and Griffiths (2000), we have little idea what effects they are having on native wildlife. Possibly the biggest concern at present is the risk of admixture of alien pool frogs with the native northern clade pool frogs currently subject to a reintroduction proposal (Beebee and others 2005). There are vastly more marsh frog populations in England than edible and pool frog populations, which tend to be mixed (J. Wycherley, pers. comm.). Most of the populations are in the southeast and north of England. In total, there are at least 288 water frog sites in Kent alone, and over 50 populations elsewhere (Wycherley 2003). It would be wise to maintain a watching brief on water frogs in England, particularly with the advent of a warmer climate. However, as they are so numerous, focus could be placed on a sample (including the fastest-spreading populations). Individual red-eared terrapins, originating as pets from North America, are often reported from locations across England, particularly in the south. No systematic attempt at mapping them has been made, but the locations may number in hundreds. They tend to be individual animals, restricted by their aquatic nature to the ponds and lakes where they were released. They are thought to be incapable of breeding in the (current) British climate, and although there are reports of females laying eggs, these are not thought to be viable (J. Foster, pers. comm.). However, it is not inconceivable that a particularly warm summer may allow breeding if there are individuals of both sexes present at any site. As they are voracious predators, this would be a major concern. There are various terrapin rescue operations in England (working for animal welfare rather than impact reduction reasons), and terrapins are often re-housed if caught. There is no central information resource on red-eared terrapin distribution, and a coordinated effort to gather all known sightings data would be advisable, perhaps starting with a survey of Local Record Centres (LRCs). Red-eared terrapins are

37
relatively visible and recogniseable, and are often reported by the public; any survey or monitoring programme could easily involve the public with little training. The wall lizard is also fairly widely scattered in southern England where it has persisted long-term in several locations along the south coast of Dorset, the Isle of Wight, and West Sussex (Quayle & Noble 2000). Fairly detailed recent data from Dorset (Gleed-Owen 2004b and the HCT Rare Species Database) show that wall lizards breed easily, have more than one clutch per year, are active virtually all year round, and are capable of spreading without necessarily requiring rocks, walls or similar habitats. Other past records from Surrey, London, Shropshire, Devon, Somerset and Hampshire may well persist (Beebee & Griffiths 2000; D. Bird, pers. comm.; Noble, pers. comm.; Quayle & Noble 2000). There has been some discussion about the possible native status of this species, but given how well it fares when released, it is difficult to imagine why it is not more widespread if it were native. There are also reliable records of introductions for most known populations. A green lizard population in Dorset is also thriving and has apparently spread along several kilometres of cliffs and clifftops (Gleed-Owen 2004b). Populations have been reported in recent decades on a railway embankment at Torquay and on the Lady’s Mile cliffs near Dawlish in Devon (K. Corbett, pers. comm.), but neither has been confirmed. The veracity and status of recently reported populations in Essex (J. Cranfield, pers. comm.) are also unknown. The Isle of Wight population reportedly released in 1899 is presumed extinct (Fitter 1959), but it is unlikely that sufficient survey has taken place to be certain. The taxonomy of green lizards in England is uncertain, as central and west European green lizards have now been split into two species (L. viridis and L. bilineata respectively). The Bournemouth lizards appear to be L. bilineata (as in Jersey and the adjacent French coast) because the juveniles have green rather than yellow throats (G. Diechsel, pers. comm.). The name bilineata is misleading because adults of both species have two dorsolateral stripes. The midwife toad is known from several parts of England (Arnold 1995; Beebee & Griffiths 2000), and may be spreading more widely across Bedfordshire and Northamptonshire. Alpine newts have been reported as breeding long-term in several locations across England, but there appears to be little risk of them spreading (Beebee & Griffiths 2000). Bullfrogs have posed serious problems locally in southern England in recent years, but their spread appears to be under control currently. African clawed toads appear to be spreading in a series of fishing lakes in Humberside (J. Foster, pers. comm.), and a watching brief would be wise on them. Italian crested newts, fire-bellied toads, European tree frogs, Iberian water frogs, European pond terrapins, Italian wall lizards, garter snakes, dice snakes, and other species have been reported in the past and may still occur locally (Arnold 1995; Beebee & Griffiths 2000; D. Coles, pers. comm.; M. Noble, pers. comm.; C. Snell, pers. comm.). The status of most alien species is difficult to ascertain, as there is currently no central data gathering system. Herpetofauna survey and monitoring efforts supported by the SNCOs are generally for the native species, and alien species arguably fall within the remit of another agency. The HCT Rare Species Database accepts alien species records, but the HCT does not currently pro-actively seek them. Many LRCs probably have alien species records too. It would be useful to centralise non-native species recording on the HCT database. As a source of regular anecdotes on introduced species, the ‘Reptiles and Amphibians of the UK’ website (www.herpetofauna.co.uk), or ‘RAUK’, is a useful resource.

38
3 General information requirements to meet surveillance and monitoring objectives
3.1 Defining and monitoring species conservation status for UK herpetofauna
3.1.1 Background
The overall aim of the monitoring and surveillance exercise is to understand the conservation status of the species at any point in time and to monitor changes in status over time. Conservation status is the combination of biological status and the net influence of external factors. Reporting requirements defined in Article 17 of the Habitats Directive point to the need to draw conclusions from the (obligatory) monitoring of conservation status for all Annex II, IV and V species (see Article 11). In doing so, consideration needs to be given to changes relative to a reference status, which should ideally be a reflection of when this conservation status is considered ‘favourable’. This objective is reinforced by the purpose behind the monitoring, namely to assess whether the goals of the Directive are being met. The overall goal of the Directive is the achievement of ‘favourable conservation status’. Therefore the objectives for monitoring and surveillance for the UK herpetofauna listed on the Habitats Directive (namely great crested newt, natterjack toad, sand lizard, smooth snake, pool frog [if re-established], marine turtles and common frog) are three fold: • Measure conservation status; ie an assessment of ‘the sum of all influences acting on
that species that may affect the long-term distribution and abundance of its population’ within Europe.
• Assess changes in conservation status over time. • Evaluate the conservation status of the species relative to a level that is considered
favourable based on the definitions within the Directive. These objectives implicitly also need to look at causal mechanisms to allow appropriate actions or activities to ensure the conservation of the species. For the other species of herpetofauna there is no such explicit requirement for such monitoring (although their inclusion on Appendix III of the Bern Convention requires an understanding of the impacts of any exploitation and the application of appropriate means of conservation to ensure that they are ‘regulated to keep populations out of danger’, taking account of the requirement ‘to maintain the population at, or adapt it to, a level which corresponds in particular to ecological, scientific, and cultural requirements whole taking account of economic and recreational requirements and the needs of sub-species, varieties or forms at risk locally’ ). However the framework identified for the species listed on the Habitats Directive will form a useful basis for developing monitoring and surveillance methods and protocols for all species of herpetofauna.

39
3.1.2 Parameters
The parameters to consider when defining and measuring conservation status are developed through an evaluation of the requirements of the Habitats Directive, namely those features that are described within the definitions section in Article 1(i) of the Directive. Evaluation of conservation status needs to make an assessment of ‘the sum of all influences’ that may affect ‘long-term distribution and abundance’. These factors therefore relate to both current situation, and also to long-term factors into the foreseeable future. Consideration of these influences therefore needs to be set in the context of distribution and an understanding of ecology, eg aspects of species’ habitats and all factors important in effecting these. Distribution: • Current, at appropriate scales • Historic • Potential Population viability: • Long-term data • Abundance/density • Trends Habitat availability: • Extent, connectivity • Breeding site • Resting place Sum of Influences: • Threats • Positive benefits • State of current/ historic research data The assessment of when these are favourable requires a more restricted analysis of three components, namely population dynamics data indicating ‘viability’, the natural range of the species and the extent of habitat. Developing these definitions the following assessments can be made (different measures may be appropriate for different species depending on their ecology and the ease of detection, etc.): 1. “population dynamics data on the species concerned indicate that it is maintaining
itself on a long-term basis as a viable component of its natural habitats” Population dynamics:

40
i. General background on research and monitoring: what is the state of the currently available population dynamics data, both current and historic (likely projections)?
ii. What data are available for the current (ie most up to date) population
dynamics on the species concerned?
Measures:
Numbers of populations: a) current, b) historic (date), c) potential Population estimates: a) current, b) historic (date), c) potential Density measures: a) current, b) historic (date), c) potential
iii. Are the available data sufficient; in particular does the current data provide
population dynamics for the species concerned across the natural range of the Member State?
What is the natural habitat? iv. What component (descriptive) part does the species play within its natural
habitat. v. Is the species concerned a viable component (evaluative) part of its natural
habitat.
(Determining whether a species is ‘viable’ can involve consideration of either a) closely linked to ‘itself’, ie direct non-natural intervention by man is not essential, or b) circumstance where there is a dependence on man’s influence to sustain that population.)
Maintaining itself on a long-term basis as a viable component of its natural habitat? vi. Do the data – in the light of the sum of all influences – indicate that the
species concerned will maintain itself (without too much human intervention) and its population dynamics on a long term?
vii. If the population is maintaining itself is it so doing – in the light of the sum of
all influences – as a viable component of its natural habitat?
If the answer to vi. & vii. is ‘no’ then population dynamic data cannot be said to indicate that the conservation status is favourable.
2. “the natural range of the species is neither being reduced nor is likely to be reduced
for the foreseeable future” i. What is the natural range?
• Current (baseline 1994/ current 2004) • Historic (<50 years before present) • Bioclimatic range (Potential) • Future (<50 years from now)

41
Measures:
Known sites: a) current, b) historic (date), c) potential 1 km/ 10km square distribution: a) current, b) historic (date), c) potential Vice county coverage: a) current, b) historic (date), c) potential Area of occupancy: a) current, b) historic (date), c) potential
ii. Is the natural range being reduced or likely to be reduced for the foreseeable
future? - What are the threats - What are the benefits
In the light of the sum of all influences affecting the natural range of the species concerned, is the natural range being reduced or likely to be reduced in the foreseeable future?
If yes: then conservation status is not favourable.
3. There is, and will probably continue to be, a sufficiently large habitat to maintain its
populations on a long-term basis When assessing the likelihood of “Continuing to be sufficiently large habitats”, consider vulnerable aspects of species – are their specific habitat requirements safe? Designation/ protection of important features/ areas. i. Is there sufficiently large habitat of the species concerned. ii. Is the current habitat sufficiently large to maintain the current populations of
the species concerned.
iii. In the light of the sum of influences will there continue to be a sufficiently large habitat for the species concerned?
iv. In the light of the sum of influences will there continue to be a sufficiently
large habitat, of the species concerned, to maintain its populations on a long-term basis?
If the answer to this is ‘no’ then the conservation status cannot be said to be
favourable. 3.2 Characteristics of data required for each monitoring objective
To recap, there are four main objectives for which information needs have been identified: • A: Interest features on designated sites. • B: BAP and other nationally important species. • C: National trends in widespread species. • D: Conservation status of Species of Community Interest.

42
Two additional categories require information, on a more ad hoc basis: • E: Miscellaneous English Nature tasks • F: Status of introduced species Objectives A to D each require information for several species. Some species (eg great crested newt) fall into more than one category, therefore information on their status is required for more than one purpose. Due to the way it is specified in the Habitats Directive, the most demanding of the objectives is D - the prescribed need to report on conservation status to the European Commission - although the way this is arrived at is still open to debate. Any solution will have to involve a degree of pragmatism in order to be achievable financially and logistically. There are many other taxa requiring the same treatment through the Habitats Directive, and conservation funding is finite. Also, it is not clear whether all Species of Community Interest (SOCI) will require the same level of effort (ie common frog vs. Annex II/IV species). The common theme running through all status measures ought to be a combination of: • Distribution – range, spread, occupancy, site density, etc. • Population measures – presence/absence, abundance, density, breeding/recruitment,
demography, etc. • Habitat - quality, extent, connectivity, etc. The most important role of a population viability measure is to identify a population’s decline (with enough warning to do something about it), or to monitor progress towards and above a viable level. The measurable units are therefore generally linked to the abundance of individuals within a population, although other factors may be incorporated. Measuring distribution is the same concept but on a larger scale – the units measured are numbers and distributions of populations – but note that any observed changes in distribution mean that actual extinctions of local populations have taken place, and/or new populations have been established or the spatial extent of populations has increased. The extent, condition and connectivity of suitable habitat is a secondary indicator of both distribution and population viability. It could be classed as an indirect, ‘surrogate’ or ‘proxy’ measure – as opposed to direct empirical observation of the species itself. Habitat is necessary for the survival of the species, whatever the scale of measurement. For the rare species in particular (eg sand lizard and smooth snake restricted to lowland heathland), it is a strong determinant of distribution. Furthermore, the fragmentation of habitat and the isolation of populations have a clear detrimental effect on the viability of populations, both in terms of susceptibility to stochastic events and potential genetic effects. The Habitats Directive makes a clear distinction between habitat measures and the other two species status measures, but habitat is intrinsically linked to both and makes a logical addition to any set of status measures. Therefore, for all four objectives, distribution, population viability and habitat availability are the basic measures that ought to be used to reflect species status, albeit in different combinations and levels of complexity.
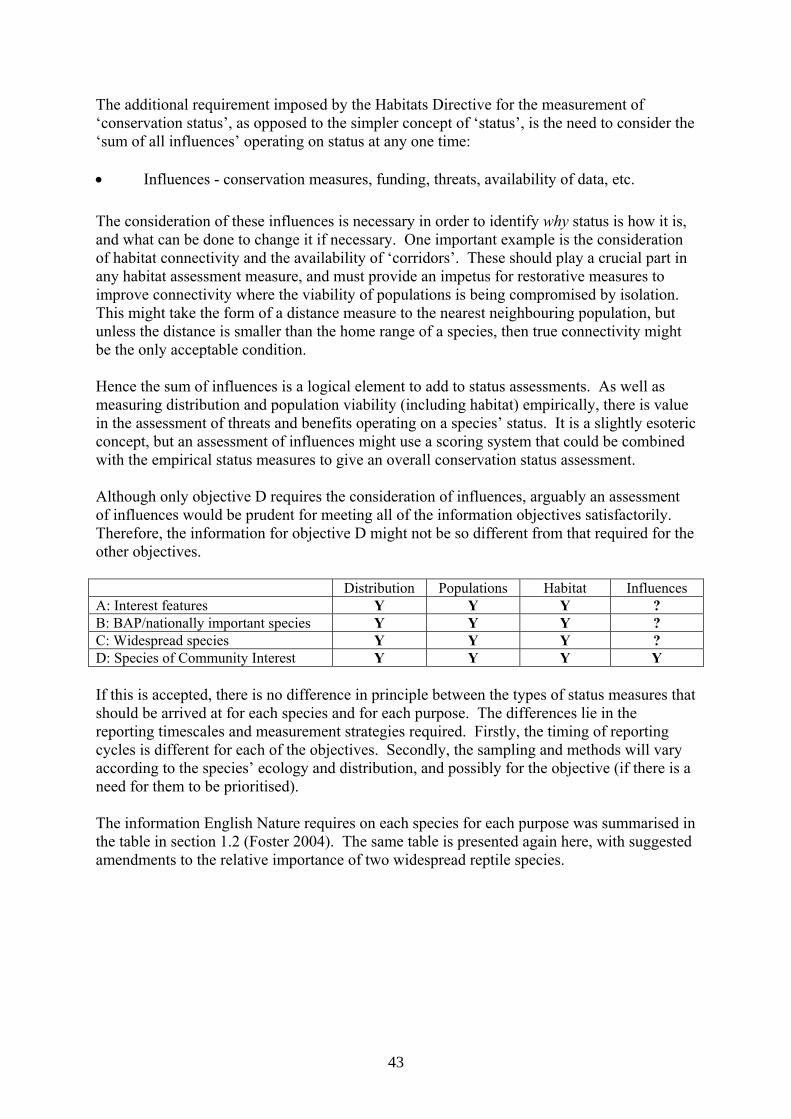
43
The additional requirement imposed by the Habitats Directive for the measurement of ‘conservation status’, as opposed to the simpler concept of ‘status’, is the need to consider the ‘sum of all influences’ operating on status at any one time: • Influences - conservation measures, funding, threats, availability of data, etc. The consideration of these influences is necessary in order to identify why status is how it is, and what can be done to change it if necessary. One important example is the consideration of habitat connectivity and the availability of ‘corridors’. These should play a crucial part in any habitat assessment measure, and must provide an impetus for restorative measures to improve connectivity where the viability of populations is being compromised by isolation. This might take the form of a distance measure to the nearest neighbouring population, but unless the distance is smaller than the home range of a species, then true connectivity might be the only acceptable condition. Hence the sum of influences is a logical element to add to status assessments. As well as measuring distribution and population viability (including habitat) empirically, there is value in the assessment of threats and benefits operating on a species’ status. It is a slightly esoteric concept, but an assessment of influences might use a scoring system that could be combined with the empirical status measures to give an overall conservation status assessment. Although only objective D requires the consideration of influences, arguably an assessment of influences would be prudent for meeting all of the information objectives satisfactorily. Therefore, the information for objective D might not be so different from that required for the other objectives. Distribution Populations Habitat Influences A: Interest features Y Y Y ? B: BAP/nationally important species Y Y Y ? C: Widespread species Y Y Y ? D: Species of Community Interest Y Y Y Y If this is accepted, there is no difference in principle between the types of status measures that should be arrived at for each species and for each purpose. The differences lie in the reporting timescales and measurement strategies required. Firstly, the timing of reporting cycles is different for each of the objectives. Secondly, the sampling and methods will vary according to the species’ ecology and distribution, and possibly for the objective (if there is a need for them to be prioritised). The information English Nature requires on each species for each purpose was summarised in the table in section 1.2 (Foster 2004). The same table is presented again here, with suggested amendments to the relative importance of two widespread reptile species.

44
Purpose Species Int. features
on designated sites
BAP/ nationally
important spp
Widespread spp trends
Legal obligations
(Habitats Dir.)
Other tasks
Common frog Common toad Natterjack toad Pool frog Smooth newt Palmate newt Great crested newt Common lizard ← Slow-worm Sand lizard Grass snake Adder ← Smooth snake Marine turtles Emphasis for the common lizard ought to be increased to the same level as the small newts and slow-worm, and a greater emphasis should be placed on the adder to bring it in line with the common anurans, great crested newt and grass snake. This gives parity to reptiles and amphibians as indicators of wider landscape quality. Amphibians may be more sensitive to some environmental factors such as pollution, but reptiles are arguably more gravely impacted by terrestrial habitat degradation and loss. Certainly, if the widespread anurans and great crested newt are given greater standing as landscape quality indicators, then more than one reptile should be too. For objectives A, B and D that have reporting cycles, it will be desirable to have up-to-date information in order to accurately report observed species status at each reporting stage. Owing to the time needed for data collection and analysis for each species, it is possible that reporting (for any objective) will not be possible until the year after data were collected. This depends on the exact timing of the reporting round however, and for species for which data are collected wholly in the spring there might be a chance of analysing and reporting in the same year. Information objective Relevant species Reporting cycle
A: Interest features Great crested newt (35), natterjack toad (12), sand lizard (43), smooth snake (37), widespread amphibian assemblage, widespread reptile assemblage (8). (Some additions expected, eg pool frog).
6 yrs (continuous) but CSM requires monitoring every 1-3 years
B: BAP/nationally important species
Great crested newt, natterjack toad, pool frog, marine turtles, sand lizard, smooth snake.
3 years : 2005, 2008, 2011, 2014, 2017 …
C: Widespread species Great crested newt, smooth newt, palmate newt, common toad, common frog, common lizard, slow-worm, grass snake, adder
n/a (fit in with A,B,D)
D: Species of Community Interest
Great crested newt, natterjack toad, common frog, sand lizard, smooth snake. (+ common lizard as ‘typical species’?).
6 years: 2006, 2012, 2018 …
E: Miscellaneous English Nature tasks
All 13 non-marine species, possibly also marine turtles.
n/a (ad hoc depending on task)
F: Status of introduced species
Bullfrog, water frogs, African clawed toad, red-eared terrapin, green lizard, wall lizard.
n/a (‘watching briefs’)

45
BAP reporting takes place twice as often as EC reporting, but they do not coincide. The availability of current, reliable data is obviously important, but it would not be possible to provide current data for both reporting objectives, and data that are one or two years old may have to suffice. Objective A (CSM of SSSI interests features) is on a rolling six-year cycle, but current guidance (JNCC 2004) recommends the monitoring herpetofauna sites every three years for reptiles and more often for amphibians. The timing of CSM data collection is not tied to any point within this cycle, and its compatibility with the BAP reporting cycle is immediately obvious. There are relatively few SSSIs with herpetofauna interests (c.104 in total), with no more than 43 for any one species (sand lizard), and much fewer for widespread species assemblages. The number of sites with an interest-monitoring obligation will therefore almost certainly be smaller than the number of sites to be monitored for the respective species for other objectives. For the rare species, all sites ought to receive some monitoring (at least presence/absence), and for the widespread species, a much larger sample will be needed to achieve power. As CSM involves a relatively small sample size, it might be considered possible to run it as a parallel exercise to the monitoring for other objectives. However, in the interests of efficiency and synergy, it will be desirable to keep CSM within the overall monitoring framework for each species. This principle should be maintained for all species and objectives. Four of the SSSI interest features (great crested newt, natterjack toad, sand lizard, smooth snake) are BAP species and SOCI; therefore they must be monitored for the three-year BAP reporting cycle, and for the six-year EC reporting cycle. The CSM cycle for these species should therefore be harmonised with either the BAP reporting cycle or the European reporting cycle. The conservation status of the common frog must also be assessed for the EC, therefore raising the question of trying to fit widespread species monitoring in with BAP and EC cycles. A national monitoring scheme would be more achievable if the workload could be spread across years; for example, rare (BAP/SOCI) species and widespread species in different years. All of the widespread species are involved in the CSM of reptile and amphibian assemblage SSSI interest features. The CSM of these assemblages will need to be every three years (possibly more often), but it does not need to fit in with BAP or EC reporting cycles. Neither does the national surveillance and monitoring of the widespread species for objective C. Hence, widespread species monitoring and CSM of species assemblages could be synchronised on the same three-year cycles. To spread the workload, the widespread reptiles and the widespread amphibians could be monitored in separate years. Alternatively, a six-year cycle might be sufficient for monitoring some of the widespread species nationally, with only the relatively few (23) assemblage SSSIs being monitored more often. Within the CSM, EC, BAP and widespread species categories, there are likely to be differences in emphasis between species. As the SSSI interest feature species coincide with at least one of the other categories, they will be ‘mopped up’ by the other purposes. All BAP and EC species have equal footing; therefore it is the widespread species that may be prioritised according to their perceived importance to English Nature.

46
The rationale for monitoring widespread species status is their value as ‘landscape indicators’ (J. Foster, pers. comm.), ie all types of landscapes, lowland and upland, whether more associated with amphibians or with reptiles. To achieve this wide remit, there is a good argument for giving some widespread reptiles the same emphasis as the widespread anurans (and great crested newt, which is in other categories anyway). The grass snake was suggested by English Nature (Foster 2004), and here the adder is proposed as an equally important indicator of wider landscape quality. This leaves the small newts, the common lizard and the slow-worm with less emphasis than the other widespread species. Looking at the five information objectives, the small newts and widespread lizards are only covered by three objectives; but so is the grass snake. All the others have requirements under four categories; the only species with relevance to all five is the great crested newt. It is difficult at this stage to identify what differences in emphasis might look like. If a species is to be monitored adequately and with sufficient statistical power, then sample size is non-negotiable, and only the periodicity of monitoring can differ between species. To reflect the differences in emphasis and importance suggested by the English Nature note (Foster 2004), periodicities of three and six years would be one option. Three years would fit well logistically with the BAP reporting cycle, and six years would not clash either. The subject of timetabling (for reporting and logistic ease) is discussed in more detail later. With greater relevance to English Nature’s information needs, the common toad, common frog, great crested newt, grass snake and adder might arguably deserve a three-year cycle; whereas the lower-ranking smooth newt, palmate newt, common lizard and slow-worm could be monitored on a six-year cycle. Nevertheless, the small newts would be encountered on the great crested newt’s three-yearly cycle anyway (although a great crested newt sampling strategy would not cover the entire range of the other two species). Likewise, the common lizard and slow-worm would be encountered during grass snake and adder monitoring. These data might constitute most of the sample needed for the former species, and it would be unfortunate if an almost-sufficient dataset were gathered when a complete dataset could have been achieved for relatively little extra effort. It is therefore advisable that all widespread species receive an equal emphasis in terms of sampling periodicity. As there are resource and cost-benefit issues to consider, further discussion with English Nature and others may be needed before a decision is made. Annual recording would undoubtedly be needed for the pool frog, but owing to the sensitive nature and small scale of this requirement, a stand-alone professional contract would be most appropriate. Annual monitoring is achievable for the natterjack toad, and as more than thirty years of data have already been collected, this ought to be continued. Moreover, the natterjack is the rarest of the currently extant species, and serious concerns about its viability at some sites mean that annual monitoring is advisable. For the other rare species and the widespread species, a three-year cycle seems to be emerging as the best candidate for structuring a monitoring around. The miscellaneous information needs of objective E are difficult to predict as they will arise ad hoc, but many of English Nature’s requests for information would be simple occurrence records related to planning and management (J. Foster, pers. comm.). Surveillance and monitoring regimes alone would be less able to meet these needs than if casual records (eg from the public) could be accommodated in the recording system, in the same way that LRCs do. Accepting all casual sightings could also enlighten sampling strategies and contribute to

47
occupancy assessments. Perhaps records could be automatically disseminated to relevant LRCs as a matter of course, rather than housing and analysing them within a centralised formal monitoring programme. For objective F (non-native) species, the monitoring cycle will depend on the species in question. Some potentially invasive species at only a few sites (eg bullfrog) might be monitored intensively anyway, but other species (eg water frogs) may require a more general ‘watching brief’, in which case a three-year cycle might be suggested. The main candidates for non-native species surveillance at a larger scale (numerous sites) are likely to be the European water frogs and red-eared terrapin. The North American bullfrog, the African clawed toad, the wall lizard and green lizard are at fewer sites, and would warrant a more locally focused approach. For other scarcer and/or potentially less invasive non-native species (eg midwife toad) would probably not need more than a six-yearly surveillance regime or watching brief. As the non-native species monitoring does not need to be tied to a particular timescale, it ought to be timetabled when it is most achievable logistically, ie when it would not clash with data collection for the other objectives. It is difficult to say when this might be without knowing sample sizes needed for all the rare and widespread species (and having confirmation of any prioritisation of widespread species), but timetabling non-native species monitoring in the same year as the rare species would probably be the most manageable. Depending on the monitoring regime chosen, the demand on recording capacity might be too high in some years, with spare capacity in other years. It would be difficult to coordinate the project consistently if the workload changed radically from year to year – not least in terms of budgetary flow - and attempts should be made to spread the workload as evenly as possible between years. The possibility that reporting cycles might change in the future should also be considered. For example, organisations, legislation and structures could potentially be re-organised. Surveillance and monitoring programmes would therefore have to adjust to a new cyclicity, potentially causing problems with time-series analysis. It is also worth considering whether reporting must be based on current or recently-collected field data, or whether trends can be confidently extrapolated from the time-series. Statistical measures could theoretically be used to estimate trend positions at any given point, and data need not all be collected in the same year. Whether desirable or not, this might have to be a pragmatic decision. Practicality might dictate that sample coverage had to be spread over three years for a species or species group – for example if there were only enough volunteers to monitor a third of sites in any one year. It would mean that only some data would ever be current, but a means would have to be found of extrapolating current status, so that the whole sample could be analysed and reported on. Ultimately the decision will lie with the end users of the data (largely English Nature and other likely funding partners), after a full assessment of what the scheme will need to achieve, compared to what resources are actually available. The different delivery options will be discussed later, but it clear from the conflicting reporting cycles that no scheme can satisfy all reporting objectives with completely current data. There would have to be some use of one- or two-year-old data for at least one reporting
48
purpose. Given that statistical methods can extrapolate trends, it ought to be possible to identify current status from data collected over several years and presented together. 4 Review of current and past surveillance and
monitoring activities 4.1 Terms used
Herpetofauna recording activities can be divided into systematic and casual schemes, depending on rationale and methodologies. For consistency, the word ‘scheme’ will be used to mean any recording initiative, whether survey, surveillance or monitoring, whether ongoing or not. Systematic schemes can also be split according to their timeframe. Surveillance and monitoring are used here to refer to time-series data, ie involving repetition, whereas survey is used to refer to one-off exercises (although strictly speaking they may have a time-series element to them, eg repeat visits over the course of one year). Repeat surveys and schemes lasting a few years could be classed as short-term, and those running between 5 and 10 years could be classed as medium-term. Any scheme running for 10 years or more could be classed as long-term. Any scheme can become long-term if it runs long enough, and it is worth making the distinction between schemes that have ceased or are intermittent, and those that are ongoing (therefore having the potential to continue collecting time-series data into the long-term). 4.2 Data sources, scope and coverage
4.2.1 National schemes covering multiple species
A long-term herpetofauna surveillance or monitoring scheme has never been set up at a national level in England or the UK, although Swan & Oldham (1989) made it a key recommendation. Very few truly national surveys of all species have been carried out in Britain, and only one involved systematic field survey. Even at a local level, there have been no long-term schemes covering all species, and relatively few covering even single species. The general shortage of time-series data for herpetofauna therefore remains the single biggest obstacle to the study of trends in herpetofauna status. The general distribution and abundance of British herpetofaunal species was described in early accounts such as Leighton (1903), but these consisted of anecdotal accounts rather than systematic surveys. Taylor’s 1948 and 1963 atlas publications were the first attempts to map distribution; largely the result of literature research and personal communications. Taylor addressed all British amphibian and reptile species, mapping them initially at vice county level (Taylor 1948; see also Smith 1951) and later in a revised survey as individual records (Taylor 1963). The Biological Records Centre (BRC) at Monks Wood published a preliminary herpetofauna atlas in 1973 (Arnold 1973), with species distributions in 10km squares, and records split into pre- and post-1960 categories. A revised atlas was published in 1995 (Arnold 1995), with pre-1900, pre- and post-1970 record categories, and phenological histograms. Prestt and others (1974) gave a useful review of the status of British amphibians and reptiles, and made reference to the marine turtles. The emphasis was on changes in status in the 1950s and 60s, with the loss of habitat addressed as a particular overall problem. They described

49
the drastic declines in the distribution of the natterjack, the major recent losses being in the London Basin and Wealden heaths. For the sand lizard, they introduced the zonal classification system for regional sand lizard populations. They estimated that the Merseyside population had reduced from 8-10,000 to c.100 since the 1930s, mostly due to golf courses, and that the Studland (Dorset) population had undergone about an 80% decline in recent decades. In part of Surrey, there had been 54 sand lizard colonies in the mid-1950s; by 1971 only two remained, and by 1974 these had disappeared. They also estimated the national population of smooth snakes to be between 1-3,000 adults, although the distributional knowledge at that time was even less complete than it is now. Spellerberg (1975) briefly reviewed the national status of the reptiles and their habitat associations, with respect to conservation management. Cooke and Arnold (1982) addressed the status of the widespread species, with respect to change, mainly due to loss of habitat, since the 1930s. Cooke and Scorgie (1983) carried out a questionnaire-based survey of perceived status (abundance and distribution) of the nine widespread amphibian and reptile species in 1982. Respondents were divided into NCC regions, with some adjustments aimed at equalising coverage. An almost identical exercise was carried out in 1990 by Hilton-Brown & Oldham (1991); this allowed discussion of apparent changes in status during the 1980s. Both presented thematic maps of perceived status, and Hilton-Brown and Oldham (1991) showed maps of changes in perceived status over the preceding ten years. The latter study appeared to show some increases in common frog status, apparently due to increased garden pond use. All the other species seemed to show some decline, mostly attributed to habitat loss, particularly the great crested newt. However, these exercises were to simplistic to draw too many inferences, and probably hid differences in survey, extent of knowledge and perceptions. The first field-based surveys were carried out by Leicester Polytechnic, under contract to the Nature Conservancy Council (NCC) between 1983 and 1993. Initially this was aimed at assessing the national status of the great crested newt, after its inclusion in the Berne Convention and WCA 1981 (Oldham & Nicholson 1986). A second contract from 1986-89 – ‘Amphibian Communities’ – surveyed the distribution and status of the widespread amphibian species (Swan & Oldham 1989). A third contract from 1989-92 – ‘Herptiles Sites’ – continued surveying amphibians but expanded the remit to cover the widespread reptiles too (Swan and Oldham 1993a,b). Many of the issues and problems associated with a national herpetofauna recording scheme were explored for the first time. All three contracts can be dealt with together as they collectively formed one exercise, synthesised ultimately by Swan and Oldham (1993a,b). The ‘Status and ecology of the warty newt (Triturus cristatus)’ project operated from 1983-86 and established a national network of 450 volunteers. They surveyed distribution, population size and habitat characteristics of great crested newt sites, to identify the most important habitat associations (Oldham & Nicholson 1986). The Amphibian Communities project (Swan & Oldham 1989) incorporated the preceding project’s data, extended the remit to all five widespread amphibians, and substantially extended the recording network through a publicity drive. The project also aimed to identify the best amphibian sites for SSSI designation. Its rationale for using volunteers was to extend the coverage as wide as possible. Methodologies and recording forms were standardised and the National Amphibian Survey ran from 1986-89. Each year involved survey of amphibian ponds during the breeding season, with different secondary aims each year. The first year recorded simple site lists, with only basic site details and species counts. The second year involved pond questionnaires and blanket surveys of ponds,

50
to gather pond density data; some work was paid for in under-surveyed areas. In the third year, additional survey of pond status and terrestrial habitats took place; the survey was also expanded to include garden ponds. Attempts were made to improve access to agricultural land through liaison with the Farming and Wildlife Advisory Group (FWAG). It is interesting to note how the survey was publicised. Publicity in the first year was restricted to previously-productive recorders; 418 site records were received, some of which appeared to be late returns from the great crested newt survey. Year 2 generated 2,399 amphibian records covering 26 of the 58 counties, and site information from 37 counties (ie including negative results). Year 3 sought to increase volunteer capacity through a much larger publicity campaign, and a press release was sent to 750 media and educational contacts, as well as many libraries. Articles appeared in BBC Wildlife and other magazines, and an encouraging number of national and local newspapers publicised the campaign. The appeal drew 1,615 respondents who were then sent survey packs, but only 7% actually returned completed survey forms. Wildlife magazine appeals proved most productive: 13% of respondents to them returned completed forms, compared to only 1% of responders to television and radio appeals. In total, 3,236 site records were received from 473 recorders, and 372 pond questionnaires were returned. The average number of records returned was 7, and the greatest number of 10 per person came from the magazine readers, suggesting that this is the most fruitful media angle to take in a national survey (Swan & Oldham 1989). The survey produced 3,171 simple site lists, 1,272 casual water-body surveys, and 89 blanket surveys were carried out spanning 2,031 sites in 50 counties. Important data on pond encroachment and loss were also generated. Species distributions were mapped as 10km dots, showing open circles where a site was recorded but the species not found. More ‘casual’ sites contained amphibians than ‘blanket’ sites, as may be expected, as recorders tend to go to favoured ponds (Swan & Oldham 1989). At 10km level, the common frog occupied 70% of surveyed squares; common toad 54%; great crested newt 51%; smooth newt 47%; palmate newt 30% of surveyed squares. In relation to surveyed sites, the common frog was the most widespread amphibian (41%), followed by the common toad (22%) and palmate newt (21%). Notably, the palmate newt was present at 9% of sites, and the great crested newt at only 11% of sites; hence these species had roughly equal levels of occurrence. Although the great crested newt was uncommonly encountered, it was much more widespread in lowland Britain, whereas the palmate newt was rare in lowland areas but common elsewhere. Presumably this reflects the great crested newt’s selectiveness locally, in terms of ponds, and the palmate newt’s correspondence to broader geographical and climatic influences. Despite the similar occurrence rates overall, these different distributions meant that the 10km distribution maps skewed the picture and made the great crested newt look more common (51% of squares) than the palmate newt (30% of squares). This is simply because 10km squares cannot reflect the proportion of occupied sites within them – an important point to consider when designing sampling regimes and interpreting data. Pond densities and species breeding site densities were calculated and extrapolated for Britain, and potential sites for SSSI designation were proposed. Using the NCC scoring system, 13 eligible assemblage sites were proposed, and of the best great crested newt sites presented, 28 had counts of over 100. The report (Swan & Oldham 1989) analysed various pond and terrestrial habitat parameters in relation to species occurrence, and made management prescriptions. Finally, it addressed long-term monitoring requirements and made recommendations for a national scheme to be set up.

51
The National Amphibian Survey continued from 1989-1992 as part of the subsequent Herptile Sites contract for the NCC (Swan and Oldham 1993a). It incorporated the data from preceding projects and expanded the volunteer network by a further 20% to 874. Again, data were recorded as either simple site-and-species forms, or as descriptive questionnaires. Herpetofauna Recorders’ Meetings were organised annually from 1987, and served as opportunities to maintain enthusiasm, as well as general get-togethers. By 1992, the total number of amphibian records gathered since 1983 had risen to 11,059, of which 5,369 were pond questionnaires; an increase of 35% since 1989. The total of blanket surveys was 99. Correspondingly, the distribution maps were more comprehensive than the 1989 report (although the authors emphasised that the data still represented very incomplete coverage). Almost all 10km squares surveyed (98%) contained amphibians. Common frogs were again the most prevalent (71%), followed by common toad (57%), great crested newt (53%), smooth newt (51%), and palmate newt (33%). All of these represent a modest increase in 10km coverage from the 1989 report, except the palmate newt coverage, which increased by a half. The possibility of misidentification of palmate and smooth newts was discussed. Comparisons were also made between species ubiquity, without the 1983-86 great crested newt data. Subjects addressed in the previous report, such as habitat characteristics and SSSI selection, were addressed more thoroughly. The likelihood of survey bias was also discussed, as surveyors chose ponds themselves rather than a random and/or stratified sample. This was most evident in blanket surveys; wherein the locations tended to be mixed agricultural land, and the rarer newts were sometimes not encountered although they were present in other parts of the same county. The data was also clearly biased towards human population centres, especially since the inclusion of garden pond data (Swan & Oldham 1993a). The ‘status’ of each species was addressed by calculating breeding site densities from the blanket surveys. Importantly, the authors (Swan and Oldham 1993a) treated the occupied pond density figure as a measure of population density, ie considering each pond occupation to represent a population. This approach could perhaps be improved by combination with an index of terrestrial habitat connectivity. The authors also noted that in some cases the breeding site density did not reflect the overall occupation rate from individual pond survey data. This suggests that a larger sample of blanket surveys would be needed to increase statistical power to an acceptable level. The final sections of Swan and Oldham’s (1993a) report explored the requirements and operation of a national long-term amphibian-monitoring scheme. They recognised that the dynamics of species’ statuses could only be measured by long-term surveillance and monitoring. They proposed a sampling regime using ‘amphibian land classification zones’. It was based upon key amphibian sites identified in the survey, with replicates and representatives of pond successional stages, and expanded to reflect the proportional extents of land-use types in the then Ministry of Agriculture, Food and Fisheries’ and Institute of Terrestrial Ecology’s (ITE) land classification schemes. The sample amounted to 465 sites in Britain, but this was adjusted up to 779 to counteract expected gaps in volunteer take-up of the proposed scheme. They anticipated needing 233 volunteers to monitor these sites: 85% of them agreed to participate (but apparently now only representing 252 sites). Pond monitoring began, but the scheme never properly commenced. Swan and Oldham’s (1993a) monitoring approach could be criticised for its core focus on the 100 best amphibian sites, rather than employing random or random stratified sampling. Also,

52
the land classification they used looks rather crude today, and other classification schemes would now be used to design the sampling distribution. Nevertheless, they made some pertinent observations in their assessment of how a long-term monitoring programme might work. Volunteers would need to be more consistent in their form filling, and instructions would need to be carefully written to avoid ambiguity. It was also clear from their previous experience that most volunteers would not be prepared to survey ponds that were not likely to contain amphibians – clearly a problem for maintaining a representative sampling regime. The variability they identified between years in the preceding survey was difficult to pin down to specific factors, but it evidently involved inconsistency in pond recording, and variation in counts attributable to differences in survey timing. Furthermore, it was obvious that ponds varied significantly between years, and their status would need to be recorded each year. A ‘survey pack’ was sent to the proposed monitors, with instructions on methodology. It proposed a minimum of three counts per year, but permitted up to five. Methods included: torch counts for newts, frog and toad spawn area estimation, newt egg searches, sweep-netting and bottle-trapping for newts, and terrestrial searches for adults, efts and metamorphs. Caveats and limitations were given; for example, spawn counts were to be treated with caution, particularly for common toads. Newt egg counts were to be estimated on a log-scale, although this would mask potentially useful information, and attempted counts of egg numbers could be converted to a log-scale anyway. Furthermore, egg counts are arguably of little value, except for detecting presence/absence, and the unrolling of too many leaves might be damaging to the eggs. The reptile survey utilised the existing amphibian recorder network as well as new recorders identified through publicity (Swan and Oldham 1993b). The survey was launched at the Herpetofauna Recorders’ Meeting in 1990, and continued over three years until 1992. Existing BRC records (post-1970) were included in the survey, increasing the total number of observations from about 4,000 to 5,000, representing almost 400 recorders. Geographical coverage was variable; the highest number of recorders per county was 38, many English counties had less than 10 each, and Greater Manchester had no recorders. The inter-county variation in recorder densities was reflected in the numbers of records received, but apparently less so than for the amphibian survey (Swan and Oldham 1993a,b). Records per county varied from 0 to 430, with several over 200 and many over 100. Most recorders sent less than 15 records each. The recording itself used standardised recording forms and parameters, with simple lifestage categories, no attempt at sexing, and some habitat and site attributes. Not counting the BRC records, the total number of records per species was: 1,083 common lizard, 742 slow-worm, 823 grass snake, and 817 adder. Two-thirds of records included counts as opposed to single sightings. The common lizard records came from 65% of 10km squares in Britain, whereas the other three species had only 44-46% coverage. The data showed that the common lizard was more widespread than the other species, but it was difficult to demonstrate abundance except for the adder, which was clearly less common in the Midlands. The authors were careful to point out that until a more detailed survey was carried out, the status of the widespread reptiles would remain essentially unknown. Encouragingly, 82% of survey records contained habitat information, thus allowing some analysis of habitat associations. No proposals were given for future surveillance and monitoring. The national surveys carried out by Oldham and Nicholson (1986) Swan and Oldham (1989, 1993a,b) served as valuable learning exercises in many ways. The lessons learned about publicity and delivery via a volunteer network offer strong messages about how a scheme should be operated today. The methodological and sampling considerations are also

53
applicable today, and some of the failings of the previous schemes need to be considered objectively. For example, the Leicester Polytechnic surveys were based in many ways around pragmatism and achievability, choosing a realistic sampling regime rather than calculating the statistical validity of the sample size. They also had to accept whatever data they could get, and the inevitable biases brought about by human distribution patterns. Traditionally, statistical emphasis has been on obtaining post-hoc confidence in results, whereas today there is a growing appreciation that power analysis should be performed, and sampling designed a-priori, to ensure that sufficient data are available to make the confident conclusions needed. Today, a scheme would not be worth pursuing if it were not able to offer a sufficient degree of statistical power (normally 80%). Even the accepted norm of 80% power (not to be confused with confidence intervals) is well short of absolute certainty, but it provides a benchmark to attain. Thus, perhaps the single biggest difference between previous schemes and a scheme today would be in designing the sampling regime. The field methodologies themselves have evolved somewhat since the 1980s and early 1990s, and useful reviews such as Griffiths and Raper (1984) enable greater objectivity in amphibian survey methods, but overall changes in amphibian detectability are relatively minor. For reptile field methods, the same problems persist today as they did previously – namely poor detectability and the absence of useful abundance proxies and predictors. The same problem exists to a large extent for the amphibians (do a few head counts at breeding sites reflect population size usefully?); therefore research is needed in these areas for amphibians and reptiles. 4.2.2 National schemes covering single species
Rare species surveillance and monitoring
Aside from the BRC’s collection of casual records, the most geographically comprehensive herpetofauna monitoring and surveillance in the UK currently is carried out by the HCT. Approximately 30 years of paper records are held by the HCT, and digitisation of these is under way. The surveillance and monitoring programme focuses on the three rare herpetofauna species (natterjack toad, sand lizard, smooth snake), but also gathers incidental records of widespread species, mainly from rare species sites. The natterjack toad recording takes the form of monitoring, whereas the sand lizard and smooth snake recording could be described as surveillance as it is difficult to quantify and compare data. The HCT also actively collates rare species data from third party sources wherever possible, and is nurturing a growing network of volunteers (currently about 140). Widespread reptile data (common lizard, slow-worm, grass snake, adder) are collected as part of the HCT’s rare reptile surveillance and monitoring efforts. The sample coverage is therefore biased towards the dry heathlands in southern England, but common lizard data are also collected during sand lizard monitoring on coastal sand dunes sites elsewhere. As part of the current contract, ‘initial surveillance baseline datasets’ were created for the three rare species, using MapInfo GIS to map the extent of all known sites (natterjack toad, smooth snake) and population foci (sand lizard). Population status was assessed for each. The datasets were presented as a report (Gleed-Owen 2004a) and as GIS (MapInfo) site inventories. All three datasets are liable to change, particularly the sand lizard and smooth snake as their distribution is not fully known and their status is difficult to determine under the current surveillance regime. The following fields were used in the datasets: SiteKey, Site,

54
Focus_type (sand lizards only), Area_ha, Xcoord, Ycoord, SSSI, SiteUnit, Popn_status, Last_seen (not sand lizards), Popn_class (natterjack toad only), Popn_size (natterjack toad only), Reintroduction, Boundary_digitisation, Captured_using, Boundary_source, Comments. The site key is a unique identifier. Foci types are only relevant to sand lizards: type 1 are actual (extant) foci, type 2 are potential foci (good habitat, no sand lizards), and 3 are of unknown status (apparently good but unsurveyed). The SSSI site names and site unit numbers were inserted by overlaying the natterjack sites onto a MapInfo file obtained from English Nature. Reintroductions are flagged for all three species. ‘Data capture’ refers to the OS basemap or aerial photography used. ‘Source data’ is the rationale for deciding boundary locations, population size and status. A field has since been added to each dataset, to record coincidence with a SSSI where the species is an interest feature. Natterjack toad
The natterjack toad monitoring scheme has operated since 1970, coordinated now by the HCT and the University of Sussex. Site coverage has become more complete over time as the volunteer network has increased, and it now covers all 49 extant sites in England. Various natterjack toad extinctions and reintroductions have taken place since 1970, and there is currently one site of unknown status in England. Throughout the breeding season, visits are made to all known breeding ponds – ideally weekly so that spawn strings can be counted before hatching. The data are used to calculate annual spawn counts for each site, and therefore to estimate adult population size. However, an indicator of recruitment is also needed, as spawn can be lost, tadpoles are often predated, and ponds sometimes dry up before toadlets metamorphose. Numbers of tadpoles and toadlets are therefore estimated, and annual toadlet production is used as a key index of breeding success. In practice, the regularity of monitoring visits varies between sites, and inevitably there are gaps in the data. Some of the Cumbrian sites in particular, have numerous ponds spread over a wide area, therefore requiring a lot of effort. The annual summary data are presented in the Natterjack Site Register (Beebee & Buckley 2001) and its annual updates (as yet unpublished). At some sites, more detailed studies are carried out, such as daily visits and calling male counts; these data are collated by the HCT, but are not currently digitised. Some data on widespread amphibians are collected from natterjack sites, particularly common toad. Buckley and Beebee (2004) analysed the data as a 30-year time-series, searched for trends and evaluated the effectiveness of conservation activities. Between 1970 and 1999 natterjack populations increased from 43 to 48 because successful translocations (11) outnumbered extinctions (6). Between 1990 and 1999 there were no detectable trends in natterjack toad population size or breeding success in Britain, although the power to detect any trends over 10 years was low. Calling activity and short-term trends in spawn counts were found to be unreliable predictors of long-term population viability, in the absence of extra information such as toadlet production. Not all females breed every year and the percentage which do breed varies, so long periods (>10 years) of spawn counts are needed to demonstrate trends that are reflective of real population changes at a national level. The main problem with maintaining comprehensive natterjack toad monitoring is logistical, as most natterjack sites are in relatively remote and unpopulated areas of England. The breeding pond-based methodologies are well-established and accurate indicators of population status, but less is known about terrestrial habitat use. All natterjack toad populations in England were mapped and assessed to create the baseline dataset (Gleed-Owen 2004a). The population status categories were as follows: increasing,

55
stable, decreasing, extinct, new introduction, never established (failed reintroduction), potential. Only a few potential sites have been mapped, usually adjoining recent introductions. Population status assessment was based upon trends visible from time-series data (as discussed by Buckley & Beebee 2004). The ‘Last seen’ field is the year in which animals and/or spawn were last seen (generally 2004 for extant populations). Population size refers to the number of adult animals. These were calculated by doubling the highest available spawn count (assuming each spawn string represents two adult animals) during the last 6 years, 1999-2004, or in a few cases by animals counted. Population sizes were classified as follows: 1 = <20, 2 = 20-49, 3 = 50-99, 4 = 100-499, 5 = 500+ (and 0 = extinct). Forty-nine extant populations were mapped, as well as extinct populations. A planned reintroduction in 2005 will add a fiftieth English natterjack toad site. Sand lizard
Sand lizard recording involves an order of magnitude greater number of sites, and great variation in volume, consistency, and spatial coverage over time. Most of the HCT dataset was collected by a few individuals, originally by the British Herpetological Society Conservation Committee (BHSCC) from the 1960s onwards, and then by the HCT after it was formed in 1989. Corbett (1988a,b, 1994) described the national status of the sand lizard, and prescribed strategic conservation measures. Truly quantitative and comparable data are elusive though. The HCT’s programme of sand lizard surveillance is mostly carried out by staff and trustees, but data also come from volunteers and third parties. Much of the effort is focused on the HCT’s reserves (c.50 in Dorset, c.30 in the Surrey/Hampshire Weald), but a large proportion of sand lizard populations are on third party sites. Between 2002 and 2004, a sand lizard site inventory was created, based upon the mapping of population ‘foci’, ie areas of high population density related to prime habitat (Gleed-Owen 2004a). It is difficult to say what proportion of sand lizards live within these foci, as the quality of sites vary greatly, but it is probably about 75% overall. There has been a notional five-year cycle to foci monitoring, but many sand lizard sites have been visited more regularly, and others not at all. Together with the difficulties of detecting sand lizards and interpreting sightings consistently, this means that count data are generally not comparable between sites and year on year. Although this is far from ideal, it is understandable given the minimal manpower and resources that the surveillance operation has relied upon for so many years. Until the database was set up, there had previously been no way to collate and analyse results. Efforts are now concentrating on developing more effective and transferable assessment methods. Sand lizard records are mostly gathered as spring and autumn surveys to individual sites, most lasting between an hour and a day. The sightings were traditionally recorded on annotated maps, but recording increasingly involves hand-held GPS coordinates alongside written notes. The volume of records decreases further back in time, and most sand lizard records older than about 15 years are still in notebooks (K. Corbett, pers. comm.), which makes digitisation difficult. Some sand lizard data come from third party sources and commissioned surveys, and there may be some sources of data still to be explored, for example English Nature surveys and planning-related surveys. The translocation history of sand lizards has also been documented by the HCT and included in the HCT database, in compliance with IUCN guidelines. Greater monitoring effort is theoretically given to reintroduced/translocated populations. As well as

56
identifying persistence and breeding success, the colonisation of new habitat areas by a translocated population is monitored. For the baseline dataset (Gleed-Owen 2004a), all sand lizard foci were assessed. Population status was rated at each, based upon data collected and management regime in place (Nick Moulton, pers. comm.). Populations were categorised as: increasing, stable, decreasing, potential, or unknown. There is insufficient data to estimate the size of populations, and this underlines the need for a more scientific way of measuring population size and density. Foci area might provide a way of estimating population sizes, using modest density estimates from the range indicated by the literature, but this would probably be too simplistic. The ‘Last seen’ field was left empty initially, but has now been filled since the development in spring 2005 of a GIS tool to identify the coincidence of foci with database records. The dataset currently contains 521 extant foci, 39 of unknown status, and 330 potential foci. There are almost certainly some undiscovered English sand lizard populations, and not all potential habitat has been mapped. Sand lizard surveillance and monitoring has been hampered by resource limitations and the lack of an effective and efficient methodology. Until a standardised sand lizard surveillance and monitoring methodology is developed, it is difficult to interpret sightings counts, or to compare results between sites and years, except at the simplest level (eg presence/absence, evidence of breeding). Current recording tends to take the form of counts, maximised by intensive walkovers in favourable weather conditions and at appropriate times. Measures of effort (time spent, area covered) and other extraneous variables (weather, time of day, season) are often but not always recorded. The greatest value of the data on the HCT Rare Species Database at present is in depicting distributions on GIS, and identifying concentrations of sightings and recording gaps. This does not account for spatial biases in survey effort. The HCT is carrying out further work at present to evaluate the consistency and comprehensiveness of sand lizard surveillance and monitoring in Britain. The correctness of foci boundaries will also need to be checked and further rationalised, especially as some have no recent sightings data related to them.
Sand lizard sightings (orange dots) in relation to areas interpreted as foci (yellow) and potential foci (purple). Aerial photography © UK Perspectives. Licence number UKP/121/02/EN/63.

57
To enable trends in status to be measured, a reliable methodology needs to be developed that can predict status on all sand lizard sites, but which ideally only involves direct counting on a sample of sites. A PhD project coordinated by the HCT and funded by landfill tax from SITA Environmental Trust has recently begun with this intention. It aims to use photographic recognition, radiotelemetry and other research to identify relationships between: • population densities and habitat variations; • sand lizard activity and environmental, seasonal and time variables. The former may permit the development of a habitat-based predictor of population status that would only require minimal effort to back it up by demonstrating presence and breeding. The latter is based on a captive population of known size, and aims to find ways of calibrating field data. It involves intensive study via repeated counts at three temporal periodicities: • once daily throughout the season • hourly for one day a week • hourly, five days a week for one month By comparison of environmental data, seasonal position and time of day, relationships between sand lizard activity levels and controlling factors will be modelled in order to calibrate field data. The research will also measure the effectiveness of conservation management techniques. Smooth snake
The smooth snake has an altogether more patchy surveillance history than either of the other rare species. The British Herpetological Society (BHS) carried out the most comprehensive smooth snake survey to-date between 1984-1987, but the HCT and its predecessor the BHSCC have collected smooth snake data more or less continuously since the 1960s. Geographical coverage has never been complete, and there are still large gaps in distributional knowledge. Smooth snakes are highly cryptic, and artificial refugia - normally corrugated metal (‘tins’) - have to be laid to improve the chances of detection to a worthwhile level. The BHS survey was carried out under contract from the NCC, and was known as the ‘CAT’ (Coronella austriaca team) survey. It surveyed 196 sites in Dorset, Hampshire, Surrey and some peripheral areas. Coverage was not as complete as the team would have liked because of resource and landowner restrictions, but contemporaneous research by Gent (1988) filled in some of the New Forest gaps. The final report (Braithwaite and others 1989) summarised data from at least 261 individual snakes on 86 sites. The records were presented as a 10km-square distribution map, as in Arnold’s (1995) atlas, and nothing more detailed has been produced since. The HCT collects and encourages others to collect smooth snake records, but also holds paper records dating from the inception of the BHSCC to the present, albeit rather fewer in number in earlier years. The HCT has tins on most of its heathland reserves currently; generally 10 to 50 per site, but calculations show that nearly always at densities of less than

58
one tin per hectare (ha). Most, but not all, of these are checked at least annually, and sometimes many times a year. The primary impetus for laying tins on heathland reserves is the smooth snake interest (although they generate widespread reptile data too), and whilst the HCT is embarking on further tin laying across the smooth snake’s range in 2005, it will be impossible to tin all smooth snake sites without further resources. The density of tins in most areas is low, and large areas of heathland within the smooth snake’s range are unsurveyed. This includes inaccessible Ministry of Defence (MOD) land, unsurveyed habitat types that may harbour smooth snakes (eg Purbeck chalk grass/scrub), outlying heaths where smooth snakes may have gone unnoticed, but also large areas of accessible heathland within the known range, particularly in the Weald. Arguably, the presumed absence of smooth snakes from Devon, Wiltshire, Berkshire, West Sussex, East Sussex, and Kent where there used to be historical accounts, has yet to be proved either. The HCT has fairly regular tin checking on most of its Dorset reserves and in the New Forest, but less so in the Weald. Individual area-based projects are discussed in section 6.2.3. Some of the smooth snake recording areas, such as the New Forest and regularly monitored HCT reserves, could form time-series if continued. For the baseline dataset exercise, smooth snake sites were mapped in two ways: known sites (past and present) where suitable habitat still exists; and suitable habitat within its range, but where smooth snake has never been recorded. Wherever a database record coincided with an area of suitable habitat (using UKPerspective.com aerial photography), a site was mapped. Then, using English Nature’s Lowland Heathland GIS Inventory v.1.2, all other areas of lowland heathland greater than five hectares in area, within the smooth snake’s range, were selected. The population status at these sites was classed as ‘potential’, and for the sites with smooth snake records, it was categorised as either ‘extant’ (recorded since 1994) or ‘unknown’ (pre-1994 records). The 1994 cut-off point is somewhat arbitrary, although it reflects the date of the Habitats Directive’s implementation. However, it does lump all pre-1994 sites together, including some early 20th century records, which may not be appropriate as sites with more recent pre-1994 records are more likely to hold smooth snakes still. Some of the sites with older records are almost certainly extinct; nevertheless, as sites were only mapped in this exercise if suitable habitat still existed at (or very close to) the record location, presence/absence arguably remains unproven at all of the old sites. No attempt was made to estimate population sizes or categorise population size classes for smooth snakes in the baseline datasets; there is insufficient information to do this. Clearly the continued presence of smooth snakes at any site needs to be established more often than every 10 years in order to keep an up-to-date distribution map, let alone to monitor population status. The HCT Rare Species Database currently holds 2,561 smooth snake records (June 2005). The graphs below show numbers of smooth snakes recorded against time of day, air temperature, humidity, and cloud cover. Weather parameters and time of day are not available for all records on the database, therefore the graphs are based only on the records with time and/or weather parameters recorded. Note that these graphs may hide biases in the timing of field visits, for example towards perceived ideal weather or times of day. Most of them are encounters under refugia.

59
412
54
102 104
8495
106 107 104
3126
4 10
20
40
60
80
100
120
7 8 9 10 11 12 13 14 15 16 17 18 19 20
Time of day (h)
Num
ber o
f sm
ooth
sna
kes
enco
unte
red
53
17
58
45
63
4954
6962
0
10
20
30
40
50
60
70
80
0 1 2 3 4 5 6 7 8
Cloud cover in oktars (0/8-8/8)
Num
ber o
f sm
ooth
sna
kes
enco
unte
red
1 0 0
9
4
20
26
13
0 00
5
10
15
20
25
30
0-9 10-19 20-29 30-39 40-49 50-59 60-69 70-79 80-89 90-99
Relative humidity (%)
Num
ber o
f sm
ooth
sna
kes
enco
unte
red
1 27 6
12
32
39 40
50
35
58
2924
4 48
10
10
20
30
40
50
60
70
10 11 12 13 14 15 16 17 18 19 20 21 22 23 24 25 26
Air temperature
Num
ber o
f sm
ooth
sna
kes
enco
unte
red
Encounters of smooth snakes according to time of day
Encounters of smooth snakes according to cloud cover
Encounters of smooth snakes according to relative humidity

60
Encounters of smooth snakes according to shade air temperature Great crested newt
In 2002, Froglife carried out the Great Crested Newt Pilot Monitoring Project (PMP) with support from the Environment Agency, the Countryside Council for Wales (CCW) and others. Its aim was to pilot the methodologies and delivery mechanisms for a national great crested newt monitoring scheme (Baker 2003). It covered several counties in the south of England and south Wales; volunteers were attracted by advertising widely in the preceding year. Several training events were run, and 150 volunteers were trained and licensed (few with significant previous experience), of which 87 (58%) actually carried out the surveys. The sampling was designed around standardised blanket pond surveys of 1km squares, selected via a random stratified approach. The sample size was dependent on the number of volunteers; most surveyed one square but a few did two. The sampling strata were: known species range, land cover, landscape type (Glamorgan, Hampshire and Kent) or pond density (Sussex), and existing records. Biases were applied within the stratification: for landscape-based counties, squares were judged likely or unlikely to contain great crested newt habitat, and only likely squares were chosen; for Sussex, squares with low pond densities were omitted. Half of the squares were selected from 1km squares with previously-known great crested newt sites from the Countryside Information System (CIS) and Froglife’s ‘Great Crested Newt Breeding Site Register’. Each pond was visited in April, initially in the daytime for assessment, egg and net searches; then as a night-time torch count. This was repeated in May, giving a total of four visits; and surveyors could make an optional third torching visit. Data were returned for 92 squares, but a few had been refused permission or contained no ponds, and only 85 could be included in the analysis. Great crested newts were detected in 9% of ponds surveyed, but in fewer ponds in Glamorgan than in England. Of the squares with no previous records, 14% turned up great crested newts; of those with previous records, 32% had positive results. It was suspected that low detection rates in squares with previous records might mean they had been overlooked in the pilot survey. There were higher occurrences where pond densities were highest (45% occupancy compared to 16% for medium pond density); chi square test = 7.93, 2 d.f., p < 0.005. Land cover associations were identified and, total numbers of great crested newt ponds were predicted for the Environment Agency (EA) Southern Region. Using an occurrence rate of 10% of pond (CIS data), the predicted total was 1,257 occupied ponds, or 817-1,697 at two standard deviations. The Froglife pilot survey recorded 17% occupancy rate on squares with no previous records, suggesting a Southern Region total of 1,212 (295-2,129) occupied ponds (Baker 2003). The PMP identified 29 great crested newt ponds. The most successful survey methodology was torching, which got results at 70% of great crested newt ponds, followed by egg searching (55%), then by netting (32%). The second round of visits has fewer positive results, and discovered only one additional site, which was interpreted as meaning that one visit was sufficient (Baker 2003). As over 300 ponds were surveyed, some analysis of quality and threats was possible. He discussed the validity of Froglife’s Great Crested Newt Breeding Site Register, and recommended that care be taken in future to associate great crested newt records with mapped ponds, rather than accept them as evidence of a pond site. Useful feedback was received from the PMP volunteers. Most complained of the inordinate amount of time to identify and deal with landowners. Over half of the surveyors were already ARG members or pond wardens (many heard of it through the BTCV). Baker (2003)
61
suggested that sites should be within 30km of a surveyor’s home. Strict protocols and a verification system are also necessary to maximise the quality of the results. Baker (2003) suggested that a national monitoring scheme ought to involve annual counts at a sample of known ponds, and a pond occupancy survey at lesser intervals. A power analysis was carried out to indicate the sample size needed for identifying population changes, using a small postulated turnover rate. It suggested that to detect a 10% decline over 25 years, at least 1000 1km squares would be needed to give 80% power. A 25% decline over the same period would require nearly 400 squares. With a higher population turnover rate of 5%, the number of squares needed was considerably increased. Adder and slow--worm
English Nature commissioned a questionnaire survey in 2003 to identify long-term surveillance data for the adder and slow-worm, and assess their status (Baker and others 2004). This provided a timely update since national status of these species had not been examined since Hilton-Brown and Oldham (1991). Information was collected on 249 sites (roughly equal numbers for adder and slow-worm), of which about half were known to the recorder for over 15 years, and about a third constituted systematic surveillance. The respondents were unable to estimate population size for 40% of the adder populations and 57% of the slow-worm populations. Nevertheless, there were sufficient data to suggest a decline in adder populations nationally, but not in slow-worm populations. Interestingly, the results from non-systematic surveillance supported the conclusions drawn from systematically-collected data. A worrying factor was the small size of many of the populations - a third of adder populations were less than 10 adults - especially as the smallest populations included those most in decline. Factors such as public pressure and persecution were reported as having negative impacts on adder status, whilst the slow-worm was perceived as suffering most from development. No generalisations were possible for the impact of habitat management as there were contrasting stories from both sides. The report was limited by a disparity between types of data and collection methodologies, and by the unrepresentative site sample, but it does raise valid concerns, particularly for the adder. A more systematic approach would be beneficial for assessing adder status nationally, and perhaps other species such as the slow-worm and common toad, whether thought to be in decline or not. During spring 2005, The HCT also initiated a national adder survey, coordinated by John Baker (HerpConsult Ltd). It is aimed at recorders who are familiar with adder populations, and is essentially a pilot to trial the use of an index based on head counts. It involves three visits to count the number of adults in aggregations of adders near known hibernacula in the spring before they disperse. The intention is to monitor head counts at known aggregations, and to use this as a relative rather than an absolute population measure. In addition to this, the HCT is launching a web-based “Adders Then and Now” survey (www.adder.org.uk) to collate anecdotal accounts of adders, past and present, to draw together an inventory of adder sites, both historical and extant. The emphasis is on collating memories and experiences of adders, both first-hand and second-hand, from the general public. It may produce some previously-unrecorded adder locations (all records will be forwarded to the relevant LRCs and ARGs), and it may fill some gaps in the occupancy history of known adder sites. If sufficient data are generated, it is also hoped that responses to the question of whether adders are still present at the site in question will permit useful
62
analysis of changes in status. The initiative will accept second-hand anecdotal reports as well as first-hand sightings, and the remit is being kept as wide as possible to maximise public interest, and to generate awareness and appreciation. It will inevitably generate some information of questionable quality, and the data will be treated accordingly. As it is also aimed as a publicity exercise, to widen awareness of the adder and focus attention on its apparently declining status, but it will also feed into the scientific and logistic development of NARRS. Common toad
A nationwide survey by questionnaire was prompted by the decline in numbers of a large common toad population in southeast England during the 1990s, and anecdotal reports of similar trends in other toad populations (Carrier & Beebee 2003). The survey included the common frog, as a control for which there was no comparable evidence of recent decline. Ninety-five respondents provided data on a total of 277 sites, of which more than 80% were rural sites for both species. Regional analysis indicated that although toads were faring as well as frogs in north and west Britain, they were declining seriously in central, eastern and southeastern areas. In these regions, 50% or more of toad populations had experienced recent declines, whereas frogs had fared as well as elsewhere. Toads breeding alone had fared significantly worse than toads breeding at sites where frogs were also present. The reasons for these apparently toad-specific declines in lowland England remain unknown. A follow-up study was carried out by Young and Beebee (2004), in which further analysis was carried out. Sites in the main areas of decline seemed similar overall to sites in other areas, but tended to be sited in more complex landscapes with greater road traffic. Most of the declines were attributed to habitat changes, but respondents in all areas could not attribute about 23% of declines to a specific cause. Increased road traffic was felt by many to be a growing problem during toad migrations. Statistical analysis of habitat features was inconclusive but logistic regression showed a weak link between excessive aquatic vegetation and some other factors and toad declines. Common frog
There are few other pertinent accounts of national anuran species status. Cooke (1972) carried out a national assessment of the status of the common frog and the common toad, describing indications of decline in the 1960s. This was superceded in due course by the Leicester Polytechnic surveys, but it highlighted the need for studies into species decline. The questionnaire study by Carrier and Beebee (2003), which examined common frogs as well as common toads, was the most comprehensive assessment of common frog status in the last two decades. The Environmental Change Network (ECN) carries out systematic research into the phenology of frog populations across the UK, and makes assessments of spawn mass size as an indicator of population ‘health’. The Network is a consortium of 14 UK Government departments and agencies (http://www.ecn.ac.uk/aboutecn.htm) that has been monitoring 12 terrestrial and 43 freshwater sites across the UK since 1993 and 1994 respectively (http://www.ecn.ac.uk/sites.htm). The common frog is included among its suite of physical, chemical and biological environmental change indicators at the 12 terrestrial sites. Although this is not a large sample, it is probably the most comprehensive systematic field-based study of common frog populations in the UK. The ECN survey protocols are available online (http://www.ecn.ac.uk/protocols/Terrestrial/BF.doc).

63
First spawning dates of common frog at 12 UK sites monitored by the Environmental Change Network (http://www.ecn.ac.uk/Database/index.html). The CEH and Woodland Trust’s UK Phenology Network (http://www.phenology.org.uk/) also records frog spawning dates nationally, based upon casual records from people who register with the website. The website has an excellent interactive mapping facility, which tracks the progress of frogspawn appearance across the UK, and television coverage in spring 2005 has shown this to be a popular mechanism for engaging the public. Each year thousands of records are submitted, showing the pattern of spawning spreading progressively from the southwest of England to the rest of Britain. The HCT has corresponded with the Network over the potential for including reptile phenology subjects. Other recent PhD research has examined phenology variations across Britain, and Pithart and others (2003) examined the relationship between spawning and environmental factors. Marine turtles
The marine turtles have received much less study in British waters than the terrestrial species, and it has only been recently that research has addressed the ecology and status of individual species. There is a long history of strandings, entanglements and sightings in British waters, but the tendency has been to assume that these were anomalous, due to turtles ‘straying’ from their intended path. Recent research, however, has shown that leatherback turtles deliberately visit British waters in the summer, to feed on jellyfish blooms (Houghton, pers. comm.). Through the SAP steering group – the ‘Turtle Implementation Group’ (TIG) – a national database of UK (and Irish) strandings and sightings has been set up. The ‘TURTLE’ database is operated by Marine Environmental Monitoring Ltd (http://www.strandings.com/Turtlepage.html) on behalf of TIG, and records are actively collated from many sources including a scheme to encourage reports from fishermen. The annual reports for 2003 and 2004 data (Penrose 2004, 2005) set out the recording rationale and methodology. They show that 39 marine turtles (over 70% were alive) were
64
reported around the British Isles in 2003; 31 (80%) of these were leatherbacks. Annual sightings data were also presented for individual species, from 1993-2003; and the database held a total of 978 records. In 2004, 59 turtles (over 80% alive) were reported; 47 (80%) were leatherbacks. The annual reports are available as pdfs at: http://www.strandings.com/Graphics%20active/2003.PDF http://www.strandings.com/Graphics%20active/2004%20Turtle%20Stranding.pdf The INTERREG IIIA Irish Sea Leatherback Turtle Project (http://www.turtle.ie/story.htm) is also coordinating data collection on a national/international scale. 4.2.3 Regional and local schemes
Regional and local studies, by virtue of their limited scope, are eminently achievable by individuals or groups. Amphibians are undoubtedly easier to survey than reptiles, and enjoy a greater public interest; therefore the level of study is greater for this group. The volume of literature on reptile population dynamics and general research into status is relatively small, as indicated by the reviews provided by Beebee and Griffiths (2000). General herpetofauna
There are some reviews on the local and regional status of herpetofauna. Yalden (1965) addressed the distribution of herpetofauna in the London area, later updated by Langton (1991) with 1km dot maps for all species in the London area and descriptions on status. Howes (1973) discussed distributions in southeast Yorkshire. Wycherley and Anstis (2001) gave a remarkably thorough account of the Surrey herpetofauna (ie the UK herpetofauna), including tetrad (2km square) distribution maps. The recent Nottinghamshire atlas (Wright and others 2004) gave a useful historical account of each species, and tetrad (2km square) distribution maps. There are various other county atlas publications showing 1km distributions. They include Kent (Philp 1998), Sussex (Barker & Elliott, undated) and Warwickshire (Clemons 1996). County atlases provide an important perspective on species distribution at a finer scale, as 10km dot maps can hide local patchiness, differences in population densities, and scarcity of records. They also allow identification of recording gaps, to which surveys can be targeted. Many organisations, groups, and individuals carry out herpetofauna recording at a local level, both systematically and casually, whether it is for all species, groups of species or individual species. Much of it is unpublished. Local schemes include surveillance on nature reserves and other land holdings by NGOs, local authorities, government agency staff and volunteer networks, as well as surveillance of ‘neighbourhood’ sites such as garden ponds by residents. This section deals only with schemes with at least some systematic elements to their approach. The common frog and common toad might be expected to be two of the best recorded of the widespread species. However, recent and ongoing studies with time-series data are still very thin on the ground, and there is very little of note published on common frog population dynamics.

65
Common toad
Perhaps the longest study of a common toad population is that of Chris Reading, monitoring some aspects of a population in Dorset since 1980 (Reading 2003). Count data have been collected but not yet been published (C. Reading, pers. comm.). ARG volunteers monitored migrating toads at a site in Warwickshire from 1990-1999, registering a decline in later years, possibly due to local pollution (Clemons 1999). Unfortunately even this study ceased because permission from a new landowner was not forthcoming. Two well-known studies in Wales (summarised in Beebee & Griffiths 2000, p.100-102) were carried out in the 1980s, but they do not continue on a long-term basis. In many parts of the country, ‘Toads on Roads’ (TOR) schemes operate to rescue common toads during their spring migration to breeding ponds. Less than half the 52 counties with registered toad sites have a county organiser, the others are run by keen individuals. The organisers are often based at the ARG or Wildlife Trust (WT). Each patrol generally has a coordinator who recruits and trains volunteers, and liaises with the relevant highway authority to set up toad crossing road signs. Froglife held a register of TOR patrols, but it is not current. According to the Herpetofauna Workers Guide (Gibb & Foster 2000), there were 590 toad crossing sites registered in Britain in 2000. This figure is now thought to be closer to 610 sites (J. Howard, pers. comm.), although Froglife do not know how many of the patrols remain active. Some of the patrols are likely to have ceased due to low counts, lack of volunteers, or loss of the site to development. The methods used by TOR patrols include roadside collection using buckets and torches, to installing drift fencing and pitfall traps. The latter seems to intercept more toads, but a systematic comparison of the methods doesn’t seem to be available. Some local coordinators evidently pass their records on to the respective LRC, but this is rare. With hundreds of local schemes in operation and a large pool of volunteers, TOR could potentially provide an important source of long-term toad population data. There is some debate over how much of a population can be encountered crossing a road, and therefore whether they are a useful measure of population size. Arguably, high road casualty numbers are more indicative of a large and successful population than of one in serious decline. Nevertheless, generalisations are difficult; at a site in Surrey, counting toad numbers at and around the ponds does not reflect the population size as faithfully as drift fencing (G. Matthes, pers. comm.). There is currently no central collation system for toad count data. Froglife collates data from some patrols, but does not pro-actively gather records (R. Carey, pers. comm.), and the data it holds are probably a small proportion of the overall data collected by TOR schemes. Some TOR patrols keep comprehensive daily and annual records, but there are undoubtedly many patrols that do not keep records, and their primary concern is in rescuing the animals. In Avon, there are 20 registered sites, but only about ten sites still active, as many have been lost to development (Wood 2002). For one site, formal recording began in 1985, but the majority of the sites have only been recorded since 1990 or 1991. In Somerset, ten TOR patrol sites were originally registered; only one is currently being patrolled; another will be re-assessed this year; and a new crossing came to the attention of Somerset Environmental Records Centre in 2003 (SERC, pers. comm.). Data for the active site go back to 1997; there a few records for another site, but it is uncertain whether these follow a standard format. Sites in the Surrey TOR scheme are monitored by Surrey Amphibian and Reptile Group. At one site, time-series data have been collected since 1991 (along with great crested newt data), with daily counts available since 1997 (G. Matthes, pers. comm.). Another of the most active

66
ARGs - Derbyshire Amphibian and Reptile Group - also collect annual toad count data from their TOR sites (C. Monk, pers. comm.). Presumably other TOR patrols record their activities and data too, but as the records are unpublished and not collated centrally, this remains an untapped but potentially important data resource. Adder
Phelps (1974, 2004) described his long-term studies of adder populations in Dorset. These provide the longest-running population dynamics data for these species in the UK; with individuals being known to the author for up to 30 years. Sheldon has also studied a population of adders in Worcestershire for 20 years, monitoring population size and individuals for most of that time, and demonstrating an alarming decline (eg Sheldon & Bradley 1989). Nothing more recent is published in print, but her annual reports are summarised on the internet by the Worcestershire ARG: http://www.wbrc.org.uk/WorcRecd/Issue13/adders2001.htm). Benson (1999) reported a similarly intensive population study in Yorkshire, which had been running only three years; it is not known whether this study is still running. Individual recognition techniques are an important aspect of population status research, and the successful use of visual pattern recognition by these and other reptile workers (Fearnley 2002; Riddell 1997), without recourse to intrusive and surgical techniques, should be emphasised. Smooth snake
One of the most enlightening studies of the smooth snake was that of Breeds (1973). He studied four populations in the Purbeck area of Dorset, and marked 142 snakes by scale-clipping; 61.5% were males, 38.5% were females. The longest period over which a known snake was recorded was 10 years. A total of 412 captures were made, of which 299 were found under tins on Calluna/Ulex heathland. Some were not observed for years at a time: one clipped in 1965 was not seen again until 1971 (by which time the scales had regrown), and another clipped in 1966 was only refound in 1973. This raises the possibility that many smooth snakes within a population may go unnoticed for long periods, emphasising both the need for long-term studies, and the difficulty in measuring population size and dynamics. Breeds found that some locations were more favoured than others, and constituted smooth snake hotspots. The greatest recorded movement between capture sites was 400m, but again this must represent a minimum potential distance for smooth snake travel. Phenologically, the smooth snake season stretches from April to September, but Breeds’ earliest record was 18 March, and the latest was 21 October. He used the Lincoln Index to estimate population sizes (50 adults for Studland NNR), but did not discuss densities. He stressed the lack of knowledge on hibernation sites and the relative times spent in different locations and activities. Agricultural reclamation was raised as a key conservation problem, particularly as it fragmented habitat and therefore isolated populations. Goddard (1984) studied various aspects of smooth snake biology and ecology. Both he and Breeds (1973) noted that nestling shrews and other mammals, hunted underground, were evidently a significant part of the smooth snake’s diet; again this suggests that much of the smooth snake’s time may be spent out of reach of survey techniques that rely on observation at the surface.

67
Of most interest here is Goddard’s discussion on population characteristics. He studied three populations from 1976-78 using individual recognition by mark-recapture of 136 snakes in total. The sites were heathland in the New Forest, with areas of 80, 75 and 30 ha respectively (the latter rapidly becoming plantation). Over three field seasons, 324, 205 and 54 visits were made respectively, and 72, 54 and 10 snakes were marked. The demography (sex, age structure) of the populations was also studied, showing no significant pattern or differences in structure between sites and years. The mark-recapture enabled calculation of population size, spatial movement and densities for each of the populations. The two larger sites showed densities of 0.92-1.99 animals per hectare, but movement was not recorded at the third site and the estimated density of 53.33 per hectare was clearly anomalous. Spellerberg and Phelps (1977) also reported smooth snake density figures, from 11-17 per hectare. However, this too probably reflected densities in particularly favoured areas, and did not take account of snakes that moved extensively. The longest-running smooth snake studies have been those by Phelps (1974, 2004) in Dorset for the last 30 years or so. They elucidate the long-term dynamics of the species, but highlight the continuing need for further ecological knowledge, especially with regard to seasonal habitat use, population densities and applicability to other sites. Various organisations and individuals have undertaken small-scale smooth snake studies, sometimes over a long period of time. Reading (1997) examined the effectiveness of refugia (‘tins’) densities and arrangements for detecting smooth snakes, and Gent used radiotelemetry to examine spatial movement (Gent 1988; Gent & Spellerberg 1993). A large proportion of smooth snake survey and monitoring in Britain is currently coordinated by the HCT under its English Nature survey licence, much of it by volunteers. Other landowners, managers and individuals also carry out surveillance, including the National Trust (NT), local authorities, the Forestry Commission (FC) and the BHSCC. Much of the data reaches the HCT database, but more effort is needed to collate data that doesn’t. In 2002 and 2003, the HCT initiated a smooth snake survey in the New Forest, with about 340 tins, mainly checked by volunteers. The primary aim was to determine distribution and identify the effects of the burning and grazing regimes. Smooth snakes are sexed, measured, photographed or drawn, and other herpetofauna are recorded. The results from 2003 and 2004 are already demonstrating clear hotspots, and smooth snakes have been recorded at about 10% of tins. During 2004, the HCT also carried out a reptile survey of Ringwood survey 2004 for Hampshire County Council, focusing on sand lizard and smooth snake. The FC and David Tamarind (pers. comm.) had been monitoring parts of the Forest already, but the new survey identified various new populations. Extensive tin laying in Wareham Forest recently by FC staff and volunteers is also producing good results (A. Middleton, pers. comm.). Sand lizard
The sand lizard has been subject to various small-scale studies, mostly concerned with habitat use, movement, and other aspects of its autecology, rather than studying and monitoring population size and structure. Absolute population size is impossible to measure without intensive individual recognition studies, but some estimates of sand lizard population densities on different habitats have been published.

68
Corbett (1988a) suggested that up to 300 adults per hectare occupied the best English heathland habitats, and Corbett & Tamarind (1979) talked of 125 adults per hectare on sites which were still good but which had less exposed sand and/or less favourable topography. Corbett (in NCC 1983) also reported densities of 210 per hectare on prime Surrey heathland habitat and 300 per hectare in Dorset. Corbett (1994) defined ‘adult’ as being males over three years old and females over four years old (although Corbett & Tamarind 1979, defined it as animals after their second winter, ie 18 months). Nicholson & Spellerberg (1989) identified densities of 48 and 52 animals per hectare on what might be termed suboptimal habitat. Home range movements detected in these studies varied greatly from about 40 to 1,400m2 (uncorrected), but generally range between 200 and 600m2, and always more for males than for females. According to House & Spellerberg (1983), areas of flat (ie suboptimal) heathland in the UK may support between 0.3 to 19 adult sand lizards per hectare. On a heather dominated sand dune in the Netherlands, Strijbosch (1988) measured densities between 30 and 46 adults (4th year and older) per hectare. Density estimates do not appear to be available for marram-dominated sand dune habitats, but it presumably overlaps the range of densities found on heathland. On forest heathland patches in Sweden, Berglind (2004) found an ‘equilibrium density’ of 120 females per hectare, which would correspond to approximately 240 adults of both sexes. UK heathland habitats ought to be comparable to the Swedish and Dutch heathland habitats of these studies, but clearly there are too few case studies available to allow confident population predictions based upon habitat. Several German studies, some with high densities, are not readily comparable as the populations are on different habitats and/or markedly different climatic regimes. According to views gathered during this project (K. Corbett, H. Inns, N. Moulton, D. Tamarind, J. Webster & B. Whitaker, pers. comms.), depending on the site, between 50-95% of sand lizards live within prime habitat areas, often termed ‘foci’. Some sand lizard sites, particularly smaller ones, are almost completely covered by a single focus; whereas some larger sites have narrowly defined foci surrounded by large areas of sub-optimal habitat that probably support low densities of sand lizards. Local topography is a key factor in determining sand lizard population density. Recording by Local Record Centres
Most counties and some other administrative units have their own LRC. A simple survey of all 47 LRCs in England was carried out as part of this contract in January 2005. All were asked to estimate the volume of herpetofauna data they hold, and the approximate proportion that was systematically collected (eg from surveys) rather than casually collected (eg sightings from the general public). Just over 40% of LRCs replied. The results of most are presented in the table below; one additional LRC had not digitised its herpetofauna records and could not provide a figure.

69
Number of records held Local Record Centre Amphibian Reptile Total
Data sources
Beds and Luton Local Records Centre
c.860 Nearly all casual, a few from survey.
Bolton Biological Records Centre 1,165 c.90% common frog, mostly casual.
Derbyshire Biological Records Centre
1,058 997 2,055 95% of reptile and 80% of amphibian records casual, but included public surveys.
Dorset Environmental Record Centre
c.12,500 Mostly casual, few systematic surveys etc
Greenspace Information for Greater London
c.1,000 Mostly garden data from London WT; currently being validated & verified.
Hampshire Biological Information Centre
>1,739 >409 2,252 Nearly all is copy of local ARG database
Herefordshire Biological Record Centre
712 Mostly from ARG survey projects.
Hertfordshire Biological Records Centre
c.3,324 c.843 c.4,167 Most GCNs and half reptile records from systematic surveys; 40% not digitised.
Leicestershire Environmental Resources Centre*
4,234 Mostly casual, some surveys in recent years.
Lincolnshire Biological Records Centre
325 207 532 Newly set up in 2005. Casual records only, from WT reserves.
Ludlow Museum Resource Centre 380 170 550 Norfolk Biological Record Centre c.3,500 Mostly casual via county recorderNorth & East Yorkshire Ecological Data Centre
c.3,850 80% casual, 20% pond, refugia & other targeted surveys. A third not digitised.
Nottingham Biological and Geological Records Centre
1,867 c.75% casual, most since late 1970s;
rECOrd (Biodiversity Information Centre for Cheshire, Halton, Warrington & Wirral)
2,847 256 3,103 c.95% are casual.
Sheffield City Ecology Unit 609 Mostly casual; many other records not yet digitised.
Somerset Environmental Records Centre
1,562 1,406 2,968 c.95% casual, rest targeted surveys.
Staffordshire Ecological Record 3,117 Most casual, small amount from GCN surveys.
Suffolk Biological Records Centre
5,610 Small number of recorders produce most
Surrey Wildlife Trust Biological Records Centre
c.5000 Mostly casual; further exchange with ARG pending.
Sussex Biodiversity Record Centre
c.5,958 5,237 c.11,195 Includes ARG database. Less than 5% systematic.
The Natural History Society of Northumbria
2,066 279 2,345 Includes some survey data.
Warwickshire Museum 2,592 Same as ARG database. Some systematic surveys.
West Yorkshire Ecology c.2,000 Over 90% from systematic surveys.
Worcestershire Biological Records Centre
c.2,800 Mostly systematic surveys.
Wiltshire and Swindon Biological Records Centre*
4,146 Various source, mostly casual
* Number at last upload to the NBN Gateway.

70
Coverage of Local Records Centres in the UK as of January 2005 The large majority of data collated by LRCs are from casual observations, but most LRC respondents said their databases included some systematic survey data. These were typically from a variety of sources, including LAs, ARGs and public surveys. The value of casual data is largely in mapping species distributions, although human population centres create a strong bias and data collected in this way cannot necessarily be interpreted as a true representation of species coverage. Even so, broad geographical variations in species’ distributions show up in LRC data holdings. For example, in the northeast of England, the LRC holds only six grass snake records but 129 adder records (V. Carnell, pers. comm.); in Lincolnshire, the LRC holdings are 72 grass snakes and 45 adders (M. Cole, pers. comm.); and in Warwickshire it is 337 against 29 respectively (http://www.wartsoc.co.uk/database.html). Most LRC herpetofauna data holdings are biased towards amphibians, but some have almost equal numbers of amphibians and reptiles. As many of the casual records LRCs hold are from untrained recorders, their quality is variable, and verification is normally carried out as a quality control measure (usually by the respective ARG/County Recorder). The quantity and format of records held by LRCs differ greatly too. In North and East Yorkshire, herpetofauna data originated from 14 datasets of which seven were systematic, but these constituted only 20% of the records (J. Mortimer, pers. comm.). In Dorset, most species data received are from casual observations by members of the public, but some are received from systematic surveys and surveillance schemes submitted by individuals and professionals (A. Stewart, pers. comm.). In Hampshire, the LRC holds relatively few herpetofauna records, but for all taxa groups, about

71
a third of the records come from commissioned surveys (N. Court, pers. comm.); the ARG (based at the Wildlife Trust) holds a more comprehensive herpetofauna database (M. Harvey, pers. comm.). In Somerset, the LRC is actively trying to engage recording groups to create a strategic approach to future data collection (B. Butcher, pers. comm.). Worcestershire is one of very few where most records were collected through systematic surveys (S. Wood, pers. comm.). LRCs also vary tremendously in their modes of operation, facilities, software, staffing, funding arrangements, resources, and geographical coverage. Some have only one or two staff and limited capacity; LRCs associated with local authorities tend to have more resources, better IT facilities, and greater scope for operating pro-actively. Those LRCs that have close links to the respective ARGs are most likely to hold data of value to surveillance and monitoring, but it is probably true that few hold long-term data series for the same sites. Recording by Amphibian and Reptile Groups
There are about 42 ARGs in the UK at present, although some are not functioning as such, and one or two have recently folded. Many are reasonably active, and have a moderately good membership, but perhaps fewer than ten are very active and well supported. Herpetofauna recording is one of the chief activities for most ARGs, generally based upon the premise that “if you don’t know it’s there, you can’t protect it”, but also because of an enthusiasm for survey and other field-based activities.
Coverage of Amphibian & Reptile Groups in the UK as of December 2004 As part of this contract, a simple questionnaire was circulated to the 44 ARGs listed on the Froglife website (http://froglife.hostwith.me.uk/HGBI/ARGs.htm), asking them among other things, whether they were engaged in any formal recording activities. There were 22 responses (50% of groups), of which a few groups said they were defunct or too small to
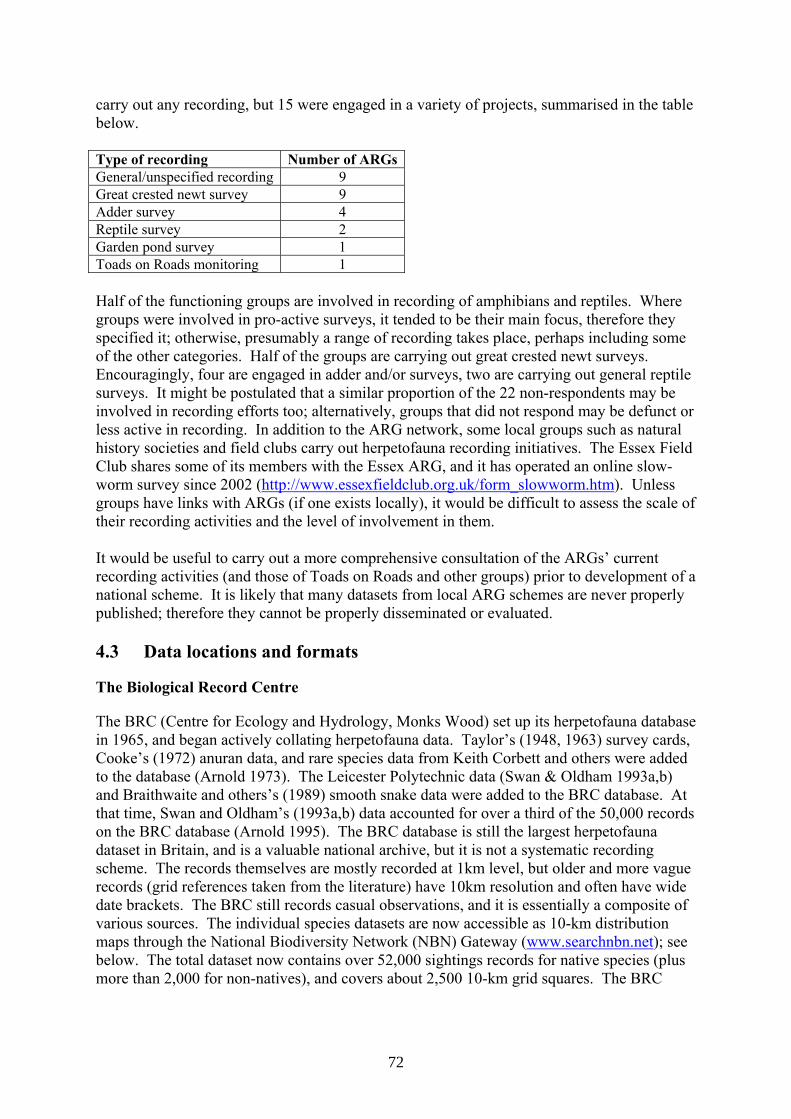
72
carry out any recording, but 15 were engaged in a variety of projects, summarised in the table below. Type of recording Number of ARGsGeneral/unspecified recording 9 Great crested newt survey 9 Adder survey 4 Reptile survey 2 Garden pond survey 1 Toads on Roads monitoring 1 Half of the functioning groups are involved in recording of amphibians and reptiles. Where groups were involved in pro-active surveys, it tended to be their main focus, therefore they specified it; otherwise, presumably a range of recording takes place, perhaps including some of the other categories. Half of the groups are carrying out great crested newt surveys. Encouragingly, four are engaged in adder and/or surveys, two are carrying out general reptile surveys. It might be postulated that a similar proportion of the 22 non-respondents may be involved in recording efforts too; alternatively, groups that did not respond may be defunct or less active in recording. In addition to the ARG network, some local groups such as natural history societies and field clubs carry out herpetofauna recording initiatives. The Essex Field Club shares some of its members with the Essex ARG, and it has operated an online slow-worm survey since 2002 (http://www.essexfieldclub.org.uk/form_slowworm.htm). Unless groups have links with ARGs (if one exists locally), it would be difficult to assess the scale of their recording activities and the level of involvement in them. It would be useful to carry out a more comprehensive consultation of the ARGs’ current recording activities (and those of Toads on Roads and other groups) prior to development of a national scheme. It is likely that many datasets from local ARG schemes are never properly published; therefore they cannot be properly disseminated or evaluated. 4.3 Data locations and formats
The Biological Record Centre
The BRC (Centre for Ecology and Hydrology, Monks Wood) set up its herpetofauna database in 1965, and began actively collating herpetofauna data. Taylor’s (1948, 1963) survey cards, Cooke’s (1972) anuran data, and rare species data from Keith Corbett and others were added to the database (Arnold 1973). The Leicester Polytechnic data (Swan & Oldham 1993a,b) and Braithwaite and others’s (1989) smooth snake data were added to the BRC database. At that time, Swan and Oldham’s (1993a,b) data accounted for over a third of the 50,000 records on the BRC database (Arnold 1995). The BRC database is still the largest herpetofauna dataset in Britain, and is a valuable national archive, but it is not a systematic recording scheme. The records themselves are mostly recorded at 1km level, but older and more vague records (grid references taken from the literature) have 10km resolution and often have wide date brackets. The BRC still records casual observations, and it is essentially a composite of various sources. The individual species datasets are now accessible as 10-km distribution maps through the National Biodiversity Network (NBN) Gateway (www.searchnbn.net); see below. The total dataset now contains over 52,000 sightings records for native species (plus more than 2,000 for non-natives), and covers about 2,500 10-km grid squares. The BRC

73
would still like to receive data from other databases such as the HCT’s (H. Arnold, pers. comm.), but no mechanism is currently in place for doing this. The British Herpetological Society
The BHS operated a database for some time in the 1990s, mostly receiving casual sightings from members, but it has effectively been defunct since c.1998. It contains some coordinate errors, possibly generated during digitisation. The CAT survey data were entered onto the BHS database, and most other records were from BHS members. The total number of records in it is 27,663, comprising 24,735 widespread species, and 2,928 rare and exotic species. Individual members of the BHS Conservation Committee are still collecting data, but the BHS is not pro-actively collating records from members at present. The Herpetological Conservation Trust Rare Species Database
The HCT set up a Rare Species Database in 2002, in order to digitise the paper records it holds, and to provide the basis for future rare species monitoring. It is estimated that the paper format data held may be 100,000 records or more. The database can record detailed species and environmental attributes, and accommodates grid references to 1m resolution in keeping with the coordinate system used by GIS. It also records some habitat information, and is linked to the HCT’s site management database. The Rare Species Database is linked to a GIS system, to allow data entry and viewing via both MS Access and MapInfo. Individual sightings records are grouped into visits where relevant, and GIS polygons are attached to help quantify fieldwork effort. Negative records are collected from tin checking, and occasionally for visits not involving tins. The database contains over 40,000 sightings records, representing over 8,000 visits, but the number is constantly increasing as new data are entered. The following table shows total sightings for each species as of January 2005. As data entry is progressing rapidly at present, the overall total has increased significantly since then. Species RecordsGreat crested newt 584 Smooth newt 159 Palmate newt 119 Common toad 135 Natterjack toad 1,871 Bullfrog (introduced) 1 Marsh frog (introduced) 151 Edible frog (introduced) 172 Pool frog (introduced) 2 Common frog 129 Red-eared terrapin (introduced) 22 Green lizard (introduced) 188 Sand lizard 15,367 Common lizard 2,916 Wall lizard (introduced) 714 Slow-worm 2,351 Grass snake 444 Smooth snake 2,229 Adder 1,683 Negative records 7,526

74
Aggregated annual spawn string counts, toadlet production and some other attributes, from 1970 to the present, have been entered for the natterjack toad. There are no plans for digitisation of the source data, unless it becomes necessary as part of baseline data gathering. Digitisation of sand lizard and smooth snake records is progressing in reverse chronological order, with the last 10 years digitised so far for Dorset, and the last 12 years for the Weald. Rare reptile data collected by the National Trust Purbeck Estates has been entered for 2002-2004. Several English Nature contracted reptile surveys of Dorset sites have been digitised. Reptile data from the HCT’s New Forest survey (2003, 2004) and Ringwood Forest survey (2004) are entered, plus miscellaneous other rare reptile datasets collected by professionals and volunteers. The rare and exotic species data from the BRC database (595 records) have been incorporated into the HCT database, but not the widespread species data. The HCT also holds a copy of the BHS database, but only the rare and exotic species (2,928 records) have been entered on the HCT database. No verification or validation has been carried out on them. There are some great crested newt data from the HCT’s Dorset SAC survey of 2003 and from CCW surveys in northeast Wales, but most widespread species records in the HCT database are incidental by-products of rare species survey and monitoring. As part of the current contract, the HCT created ‘baseline datasets’ for the three rare species, by mapping the extent of all known sites (natterjack toad, smooth snake) and population foci (sand lizard), and giving them population status attributes. The datasets were presented as a report (Gleed-Owen 2004a) and GIS (MapInfo) polygon layers. The HCT also holds a GIS layer of over 2,100 reptile refugia coordinates, including many on third party sites. Species records from the Rare Species Database are held as GIS layers too. Local Record Centres
Most UK counties, and various smaller administrative areas, have LRCs. They hold significant volumes of herpetofauna data, varying from hundreds to thousands of records, and spanning a few years to a few decades. Whilst the format of records may not be ideal (eg counts and lifestages may not be recorded adequately), LRCs often hold records that are not held digitally anywhere else. The main value of LRC databases is in providing an overview of distribution patterns, identifying data gaps for targeting surveys, and providing ‘alert mapping’ for development planning. The complex issues surrounding data exchange are significant obstacles to data collation for LRCs, and many would wish to receive more data from other local organisations than they do at present. Database and record formats differ considerably, and if LRC data were to be collated in a national scheme, editing the data into a single format would be time-consuming. The National Federation for Biological Recording (NFBR) recently surveyed LRCs, mainly to assess funding, staffing and enquiry services (NFBR 2002). The findings are published online (www.nfbr.org.uk/html/survey.html). The majority of LRCs use Recorder (various versions) as their database; and most use either MapInfo or ArcView GIS systems (NFBR 2002). Alternative software likely to be used by the others include MapMate, BioBase, DMap, and AditSite/AditMap. Suffolk Biological Records Centre hold a fairly large volume of herpetofauna data, but the database format does not allow the recording of count and lifestage information (M. Sanford, pers. comm.). Hampshire Biological Information Centre uses ArcView, and GIS features heavily in their activities (N. Court, pers. comm.).

75
A small survey of LRC amphibian holdings was also carried out in 2000, which reflects the typical preponderance of records for widespread amphibian species over those for reptiles and rarer species (www.nfbr.org.uk/html/newsletter_29.html#Amphibians). All 47 English LRCs were contacted in the current exercise, and the findings were given earlier. The majority of data are amphibians as would be expected. One LRC could not give a figure, as it had not digitised its herpetofauna records. From the 27 responses received from LRCs with herpetofauna holdings, the ‘average’ herpetofauna data holding seems to be in the region of 4,000 records. Some LRCs such as Dorset and Sussex have many more records than this. The Sussex LRC contains the ARG database and, with much pro-active recording, this formed the basis for a herpetofauna atlas (Barker & Elliot 2001). In the final report of the NBN Southwest Pilot (English Nature and others 2004), it was recommended that areas of overlap between LRCs should be addressed and funding strategies should be more coordinated, building upon the support already in place from LAs and other partners. LRCs and voluntary recording schemes should also evaluate existing capacity, develop partnerships where possible, and seek cost-effective solutions to their recording and data management needs. The NFBR would be interested the findings of any assessment into herpetofauna holdings of LRCs (N. Moyes, pers. comm.). County recorders
Most counties have voluntary ‘county recorders’ for collating and verifying herpetofaunal records, and passing them on to the respective LRC. As an example, the herpetofauna county recorder for Norfolk collates and forwards all records to the LRC, and these constitute the large majority of herpetofauna records held by the LRC (J. Buckley, pers. comm.; P. Lorber, pers. comm.). The data management systems and modes of operation vary from county to county. The current county recorders for herpetofauna are listed at: http://www.froglife.org/recorders.htm. Some counties do not have a specified individual recorder, and the LRC may be listed as the recorder. Note that county recorders are often also ARG members. Amphibian and Reptile Groups
Most of the UK counties have their own ARG (currently about 35 are in operation in England), but the size and activities vary substantially from county to county. Some ARGs compile their own herpetofauna databases (eg Hampshire, Kent, Warwickshire), and have close relationships with their respective LRC. For example, the Hampshire Amphibian and Reptile Group (HARG) database contains 2,149 records, which are also held by the LRC (N. Court, pers. comm.). The same relationship exists in Warwickshire, where Warwickshire Amphibian and Reptile team (WART) provides online data entry (http://www.wartsoc.co.uk/database.html), but has discontinued its data search facilities, for which it now redirects enquirers to the LRC. A review of the existence and scope of ARG databases in relation to their LRC counterparts would be worthwhile; particularly to identify whether ARG databases are more suitably designed for herpetofauna recording than those held by the respective LRCs, or whether any information is lost during transfer to LRCs.
76
The National Biodiversity Network Gateway
The NBN has a growing presence in recording today, and is likely to develop its web interface capabilities further. The NBN Gateway is a portal to third parties’ datasets, rather than a data custodian (O. Grafton, pers. comm.). It has a database because there is no current mechanism to enable third parties to hold their data remotely whilst being accessed via the Gateway. Data held on the Gateway can be viewed as lists and interactive maps (and downloaded if access permission has been given by the respective custodian). There is a feedback tool for validating records if a custodian wishes to receive feedback, but facilities for data entry per se are not available. It is likely that the Gateway’s role will eventually move towards redirection to third party websites. Consequently, any online data viewing and data entry facilities would need to be bespoke systems developed by the respective organisations (T. James, pers. comm.). The Gateway now displays the herpetofauna holdings of the BRC, the HCT, Leicestershire’s LRC and Wiltshire’s LRC; and great crested newt data from Somerset’s LRC. These are probably in excess of 75,000 records in total. Note that the HCT last uploaded its dataset to the Gateway in May 2004, and the online dataset is therefore not up-to-date. This is probably true for most other data custodians with data on the Gateway. English Nature and Statutory Agencies
English Nature Area Teams sometimes commission herpetofauna surveys, particularly in rare herpetofauna areas, but also for great crested newts, widespread species, and recently for the adder in London. The data are held by the Area Teams, but there is no central database, standardised format, or register of datasets held. The HCT has received data from a few reptile surveys in Dorset, but there are likely to be more that have not yet been received. English Nature local teams also hold libraries of reports and other archives that may be of value (eg Dorset, N. Squirrell, pers. comm.). It would be useful if English Nature held a register of herpetofauna datasets held by its Area Teams, but perhaps more realistic would be to ensure that relevant data custodians, eg LRCs, ARGs and The HCT, receive copies of respective datasets. A Memorandum of Understanding was signed between English Nature and The HCT in 2004 to set the scene for such exchange; various Area teams have since requested and been provided with data, but no reciprocal requests have been made to English Nature Area Teams. Also of relevance are the GIS habitat inventories for BAP priority habitats, created by the NBN Southwest Pilot partners, and in-house by English Nature for other regions. The GIS inventories are downloadable from the English Nature website (http://www.english-nature.org.uk/pubs/gis/GIS_register.asp). All parcels of land over 0.25 ha in area were digitised using vegetation surveys, aerial photography and other source data, but the inventories are not finalised, and require improvement to their accuracy and coverage. The HCT examined the Lowland Heathland GIS Inventory, and used it for part of the rare herpetofauna baseline dataset exercise (Gleed-Owen 2004). There are many areas requiring attention, such as heathland areas that have been omitted and forestry blocks mapped as heathland, but the inventory is a welcome step towards creating a valuable resource. The Scottish Environmental Protection Agency holds what is essentially a national pond inventory, created by capturing all ponds shown on OS maps (I. Fozzard, pers. comm.). This may be useful for planning amphibian surveys, but it is likely that some ponds are not
77
included. Other initiatives such as Defra’s Countryside Survey are based on GIS land classification schemes, and this is clearly becoming integral part of survey planning., didn’t exist when Swan and Oldham (1993) made their proposals for future monitoring; however, they are likely to be very useful in the future for guiding sample selection and construction of a national surveillance and monitoring scheme. The Forestry Commission (FC) is currently reviewing its data holdings and does not currently have a central wildlife database (R. Haworth, pers. comm.). Some individual staff collect data though, and in the case of Dorset and New Forest areas, the HCT receives a copy of the rare reptile data collected. It is likely that throughout Britain some foresters collect reptile data, and this could form an important resource if collated. Furthermore, they may be amenable to becoming involved in recording. Local Authorities
Some local authorities (LAs) keep their own biological recording databases, and these are likely to include some herpetofauna records. As with most casual recording databases, they tend to cater for a wide range of taxonomic groups, hence their technical specification tends to be restricted by the lowest common denominator and there is little scope for recording detailed attributes such as taxon-specific lifestages. The volume and quality of herpetofauna data held by LAs is bound to vary greatly. Poole Borough Council records about 200 herpetofauna records per year (N. Woods, pers. comm.), and in this case they are passed on to the HCT. Sefton Metropolitan Borough Council (SMBC) keeps MapInfo layers of all herpetofauna sightings on the Sefton coast, comprising up to 500 records per year (P. Wisse, pers. comm.). Much of these are sand lizard and natterjack toad data, including adult natterjack counts, and valuable for mapping species distributions. The HCT has received all SMBC herpetofauna records up to 2002, but has not asked for updates since then. The most effective way of accessing data held by LAs ought to be via LRCs (who would also be able to verify and validate records). However, in the case of an LA like SMBC that records parameters an LRC database could not be able to accommodate, it might be better to obtain data direct from the LA. Non-Governmental Organisations
Some NGOs collect and/or hold significant volumes of herpetofauna data. Staff of the National Trust (NT) collect a large amount of rare reptile data in Dorset, on weekly tin-checking visits to their Purbeck Estates heathland reserves. The staff are licensed under the HCT’s organisational licence, and the records are passed on to the HCT. It is likely that other estates nationwide collect herpetofauna data, but the NT does not have a central database to collate wildlife records. The NT could potentially be a valuable aid to recording nationally, particularly as some staff are based in remote areas that would otherwise be difficult to recruit volunteers for. The Mammal Society’s Garden Mammal Survey and the British Trust for Ornithology’s (BTO) Garden Bird Survey generate significant volumes of herpetofauna data, albeit mostly garden pond amphibians (of unchecked validity); probably in the region of a few thousand records per year. The Royal Society for the Protection of Birds (RSPB) carried out an internal audit of herpetofauna present on their reserves in 2002, which created over 200 site-based species records (P. Hughes, pers. comm.). This was just a straw-poll, though, and it does not imply that reserves staff formally collect herpetofauna records. Most Wildlife Trusts (WTs) probably hold some herpetofauna data, even if just presence-absence of species on their reserves. Some WTs also house the LRC for their respective county. It is

78
difficult to assess the volume of herpetofauna data collected by WTs from their own reserves, as it is likely to depend chiefly on the interests and diligence of individual staff. Local memberships organisations such as Natural History Societies and Field Clubs are potentially important sources of herpetofauna data, particularly where there is no local ARG. Some carry out recording initiatives, such as the Essex Field Club’s slow-worm recording scheme. In this case, and perhaps others, there is likely to be a membership overlap with the county’s ARG (where one exists). The Ecological Consultancy Industry
Another potentially important source of herpetofauna data is from development planning. Environmental Impact Assessments (EIAs) often include a herpetofaunal survey wherever there is a likelihood of encountering protected amphibians and reptiles; and mitigation measures should be in place for any derogated responsibilities. In practice, the ecological and planning staff at local authorities vary widely, and implementation depends on the diligence of individuals. However, development planning generates numerous herpetofaunal surveys each year in England, and the ecological consultancy industry is potentially the single biggest source of amphibian and reptile data. The four European-protected species (EPS) receive the greatest attention, but all the reptiles are protected from intentional killing and should generate an EIA survey and mitigation if present. Follow-up monitoring is obligatory for translocations of EPS, but it seems that this is rarely carried out (Edgar & Griffiths 2003; Edgar and others 2005). Currently there is no system for making use of survey and/or monitoring data collected by the numerous ecological consultancies in England. Whilst EIAs/environmental statements are available for public viewing at the LA, they do not typically present raw survey results, which would be of most use. Surveys involving EPS are carried out under English Nature licence, and English Nature should receive licence returns that ought to include the survey data. For mitigation exercises involving rescues and translocations of EPS, a Defra licence is needed, and licence returns to Defra ought to include data on the EPS involved. This system is under review at present. The problems here are twofold: 1) Licensees do not always meet their legal obligations to submit licence returns, and the
licensing process could be modified to improve the quality and rates of return of data. 2) It would be logistically impossible to access all publicly-available data by contacting
LAs individually. The HCT has discussed ways of accessing EPS survey and mitigation data with English Nature, through the licensing system. Under the current licensing regime, returns submissions are too vague in most cases (if received at all) to be of much value. If raw survey data were available, however, this could be a very important resource of systematically-collected data, paid for by the industry. The access problem is partly logistic; it would be impossibly time-consuming to search out new data by contacting every LA in the country, rather than consultants being compelled to submit data to a central place. Some improvements could therefore be made to the licensing system to improve to data, eg making it a licence condition to copy relevant data to a designated data custodian, eg the HCT, and withdrawing or refusing to extend licences for non-compliance.
79
Some consultants forward data on to LRCs voluntarily, out of personal sympathy for wildlife conservation, but there is no motivation for the industry to cooperate in this way. Most data do not make their way to conservation circles because consultants don’t find the time to do it voluntarily, or the data are guarded with commercial secrecy. Given the relative scarcity of well-monitored sites in the voluntary and professional conservation spheres, even for the most widespread species, it would be logical to push for progress in this area. The Institute of Ecology and Environmental Management (IEEM) were unable to estimate how many ecological consultancies and/or consultants there are in England, but we would guess that it is likely to be in excess of 100 registered companies. If each carried out only five herpetofauna surveys per year, this would be in excess of 500 datasets. And as EIA surveys are often carried out over many weeks, particularly those involving great crested newt and reptile rescues, the potential data volume is enormous. The value for ecological studies, development of population assessment methods, and monitoring systems is incalculable. It is certain that professional survey and mitigation for development planning is the single biggest herpetofauna data collection mechanism in the UK. Miscellaneous
There may be other organisations and individuals with herpetofauna data throughout England and Wales, in digital and other formats. For example, several individual herpetologists in Dorset (some of whom also operate as consultants) keep records collected over many years. This is likely to be true of many parts of the country, although it would be difficult to estimate what proportion of their combined data holdings is also held elsewhere, eg in LRCs or the BRC etc. Some universities and university staff also hold data related to herpetofaunal research projects. Most of these would be easy to identify, and the respective projects are well-known, but there are undoubtedly various less well-known research projects, eg undergraduate dissertations, that could hold useful data. Among others, the universities of Bangor, Bournemouth, Cardiff, Kent, Southampton, Stirling and Sussex are currently undertaking herpetofaunal research projects. Collective total
Out of interest, it is worth estimating the total volume of herpetofauna data holdings in the UK, although many of the local custodians will hold duplicate datasets. The table below gives an idea of the total estimated holdings for each of the organisations and categories described above.
Data holders/custodians in the UK Number of herpetofauna
records
Comments
The Biological Records Centre 52,000 Number of records when uploaded in 2004 to NBN Gateway.
The British Herpetological Society 27,663 Copy held by the HCT. The Herpetological Conservation Trust c.100,000 c.100,000 (c.40% digitised so far). Local Record Centres c.288,000 Average c.4,000 records each(?): 72 in
UK (47 in England) County Recorders n/a Records usually forwarded to LRCs. Amphibian and Reptile Groups c.100,000? Between none - 10,000 each? 44 in UK
(35 in England); records often forwarded to or held by LRC.
80
Data holders/custodians in the UK Number of herpetofauna
records
Comments
National Biodiversity Network Gateway c.75,000 Currently holds a copy of data from BRC, HCT, and 3 LRCs.
English Nature and other Statutory Agencies
c.10-50,000? Unknown volume nationally; some passed on to the HCT already.
Local Authorities 50-100,000? Probably from up to several thousand records each.
Non-Governmental Organisations 20-50,000? WT’s, BTO and NT likely to hold most; NT already passes some to the HCT.
Ecological consultancy industry 100-500,000 per year
Estimate 100 consultancies in UK; average 10 surveys a year each; 100-500 data points per survey (visits x locations), and possibly a lot more.
Miscellaneous 10,000? ie data not held anywhere else.
Note: there is significant overlap between some of these databases, ie the same data are held in several places. These are totals for the whole of the UK. There is a significant volume of overlap between these data custodians: some ARGs and LRCs hold the same data; the HCT holds some BRC, BHS and other data; the BRC holds some data from LRCs, ARGs etc; the NBN Gateway is purely a portal to other datasets. The largest unknown is the volume of data collected by the ecological consultancy industry. Even with fairly modest estimates, it is likely to constitute collectively the biggest herpetofauna dataset in the country. It is also the least accessible, and by its association on the whole with development, it must intrinsically be an important indicator of rates of herpetofauna loss. Serious attempts should be made to find ways of tapping into this valuable resource. English Nature is keen to assist with this endeavour. 4.4 Review of methodologies
Amphibian survey methods
Griffiths and Raper (1994) and Griffiths, Raper and Brady (1996) critically examined amphibian survey techniques by researching workers’ preferences nationally. Their initial questionnaire survey (Griffiths & Raper 1994) asked which of six methods people used and believed most efficacious for detecting and counting widespread amphibian species. Unsurprisingly, the methods used were different for each species. Egg searching (spawn) was most popular for the common anurans, followed by head counts. Netting and head counts were almost equally popular for the three newts. Netting was the most popular method for larvae of all five species. Aquatic trapping was the least popular for the anurans, but popular for the newts. Refugia searches were moderately popular for all species; drift fences and pitfalls were less well used for all species. The survey demonstrated a diversity of opinions on the efficacy of the various methods, and the authors concluded that a standardised approach was needed that would be both effective and acceptable to volunteers, who would after all be expected to deliver any national monitoring scheme. Following on from the previous study, Griffiths, Raper and Brady (1996) tested five preferred methods experimentally in the field: spawn counts for common frog; torchlight head counts, bottle-trapping, netting, and egg counts for newts. They used volunteers to estimate common

81
frog spawn clump numbers at 18 ponds, using a simple estimation of the area covered, and found that the seven trained volunteers accurately estimated clump numbers, but the nine untrained volunteers did not. Common toads survey techniques were not explored. For newts, the authors surveyed a diverse sample of 74 ponds, some with all three species present, using three survey techniques. Torch counts were carried out 30-90 minutes after dusk, using head torches, at 2m intervals around pond edges. After each head count circuit, bottle-traps were laid at the same 2m sampling points, and checked 8-10 hours later. Netting was performed, generally on the subsequent afternoon, using nets with an aperture of 700cm2. A single sweep was used at each of the same sampling points, and an unsystematic egg search was carried out. Various pond and environmental variables were measured. Analysis of variance (ANOVA) was used to compare the three methods, the times and dates of survey (Griffiths, Raper & Brady 1996). Female smooth and palmate newts were pooled in the analysis. For counting newts, all three methods were effective for the smaller newt species, possibly with some seasonal variation. For great crested newts, trapping was clearly the most effective; netting only detected about 2% of animals. Netting seems to be the most effective at detecting smooth and palmate newts in April. Torching was markedly better at detecting male great crested newts than females. In smooth and palmate newts, trapping captured more males than females. There was considerable variability in the effectiveness of methods between sites. Torching was not effective in turbid water, whereas trapping was equally effective in both conditions. The relationship between detection success and pond characteristics was explored using stepwise discriminant function analysis, with the methods divided according to whether they detected the majority of newts or not. The only clear relationships were turbidity, length of shoreline and shoreline vegetation. Survey over consecutive days showed that data could vary considerably within two or three days. For great crested newts, similar numbers were detected in March and April, with far fewer detected in May. Smooth newts showed a roughly normal distribution peaking in April; palmate newts showed a less marked monthly difference. For all three species, trapping was always the most effective at detecting presence. Using all the methods together gave a 98% chance of detecting all three species. They recommended trapping as the best method, to be substituted with torching if necessary (and possible). Egg searches were useful at supplementing great crested newt data. At least two visits should be carried out during peak season; they suggested using average densities as a measure to rank sites. Further research would be needed into stochastic environmental effects on population dynamics data, and into the relationship between density estimates and absolute population size.

82
Statistical methods
The need to achieve statistical confidence with the minimum effort is the subject of a study by Pellet and Schmidt (2005). They addressed the problem of detection being imperfect, and attempted to calculate detection probabilities that would help interpret the effects of environmental factors, and allow calculation of the minimum number of visits needed to detect presence/absence. An experimental survey was carried out of amphibian ponds, using four calling species (fire-bellied toad Bombina variegata, midwife toad, natterjack toad, tree frog) of differing phenology, occurrence and detectability. An average of 3.7 visits each was made to 27 ponds, wherein shores were walked systematically to record presence/absence of calls for each species. Temperature and rain were measured and averaged for each day. True occurrence was determined by a mark-recapture-type approach. The problem of imperfect detection was stated as E(C) – Np Where E(C) was the expected value of a recording parameter (eg number of sites identified for a species using amphibian calling), N was the true number of sites, and p was the detection probability. They aimed to improve the reliability of negative data in detecting absence (ie no more presence can be detected). Three detection probability models were developed that assumed constant, rain-dependent and temperature-dependent detectability respectively. In addition, they modelled several site-related occurrence factors, and combined them with the detection models to produce nine candidate models. The models were then ranked using Akaike’s Information Criterion (AIC), and Akaike weights were calculated – a Bayesian approach to indicate the relative support offered by each model. Akaike weights were then used to estimate occurrence, detection probabilities and confidence intervals. Using the detection probabilities, they then estimated the number of visits needed to be confident of absence. If visits are comparable and independent, F = (1 – p)N where the probability of not seeing a species is F, when the detection probability is p and the number of visits is N. To achieve 95% confidence, F = 0.05, and solving the above equation, the minimum number of visits required to be 95% confident of absence can be calculated. Nmin = log(0.05)/log(1-p) The proportion of ponds where a species was detected versus the expected occurrence, varied considerably between species. The best model for explaining occurrence varied between species, but the predicted proportions of pond occurrences were consistent between models. For the tree frog (present at 18/27 sites), temperature strongly controlled detection probability; one model had an Akaike weight of 0.645, and the sum of Akaike weights for the three models containing temperature was 0.961. Three visits at 13 C enabled the detection of absence at 95% confidence, although the number of visits declined with increased temperature. For the natterjack (10/27 sites), occurrence was positively linked to the distance from the nearest road (sum of Akaike weights 0.628), and the predicted occurrence was greater than the observed, suggesting that some populations were missed. Therefore, with the estimated mean detection probability of 0.442, a minimum of six visits was required to achieve 95% confidence. None of the modelled parameters were reliable predictors of detection probability.
83
The other two species were only heard at 3/27 sites, and the models proved less effective. For fire-bellied toad, it did not appear to work, thus suggesting that rare species may needed species-specific surveys to increase detection rates. However, for midwife toad, the estimated mean detection probability was 0.570, suggesting a minimum of four visits to detect absence with 95% confidence. An important benefit identified by Pellet and Schmidt (2005) is that, with this approach, different methods can be used each year. The important factor is the calculation of detection probability. Confidence intervals are dependent on the method used, and differences in methodologies can be incorporated as covariates in the Bayesian-type models used to estimate detection probabilities. They noted the prohibitive costs of intensive population studies, and that long-term monitoring often has to make do with presence/absence data. If the cost of multiple visits is too high, then detection probabilities may only be estimated at a subset of sites. Reptile survey methods
The need for effective and workable reptile survey methodologies is a crucial pre-requisite to measuring reptile population status, and has been the subject of discussions for a long time. The single most pertinent contribution to the issue was the proceedings volume for a seminar held in 1995, edited by Foster and Gent (1996). Their own introductory account in this volume gave a useful overview of the problems and the potential solutions. Whilst a great deal of reptile recording goes on in the UK, little of it employs methodologies that can be compared meaningfully between sites and over time in terms of population status. The main problem is the poorer detectability of reptiles compared to amphibians, but arguably insufficient effort has been directed at developing standardised techniques or ‘calibration’ methods. Simple reptile counts cannot be interpreted confidently as reflections of population size, and the intensity of effort needed to produce sufficiently large datasets to be comparable, is preclusive to such methods being used widely at many sites. Some useful papers were presented at this symposium, but the general conclusion is that reptile survey and monitoring data are difficult to quantify meaningfully and confidently. Gaywood and Spellerberg (1996) discussed body temperature and thermoregulatory requirements of the three British snakes and concluded that survey and monitoring should take place between 1045 and 1545, in shade air temperatures of at least 13°C. They suggested that up to 40% cloud was tolerable between 13-17°C, and full cloud cover over 17°C. Whilst this might serve as a guideline, it is perhaps too much of a generalisation. Gent and Spellerberg (1996) examined optimum body temperatures for the smooth snake. They concluded that basking places rarely exceed 30°C but are normally 18-28°C; the best survey conditions would be shade air temperatures of between 15-22°C. The effects of cloud on delaying emergence and reducing body temperature were also highlighted. For Riddell (1996), slow-worms were active between 8-22°C, but the preferred shade air temperature seemed to be 11-17°C. Common lizards were generally active between 11-24°C, in the morning and again in the afternoon, with few sightings below 10°C. Cheung and Gent (1996) found that optimum temperatures for detecting reptiles using refugia was 15-18°C at one site and 23°C at another. Whitaker (1996) identified the day after poor weather as an ideal time to search for reptiles, with temperature between 11-12°C clearly productive for

84
sand lizards during the spring. Inns (1996) suggested an ideal reptile ‘survey window’ of 11-19°C, with sun or hazy sunshine and little or no wind, as being for reptiles. Gent and others (1996) found smooth snakes basking in the open in a range of 9.6-26.3°C shade air temperature (typical ‘mid-range’ of 16.9-20.4°C). For smooth snakes under refugia, shade air temperature 11.1-26.7°C (mid-range of 16.3-21.9°C), with most snakes found with temperature under refugia of 18-24°C. The highest frequencies of smooth snake sightings were between 16-22°C shade air temperature, with no clear difference between refugia and basking in the open. They made a striking correlation between cloud cover and sightings frequency though. Cloud cover was not significant for smooth snakes under refugia, but for open-basking animals there was a clear positive (almost exponential) relationship between sightings frequency and increased cloud cover, ie most sightings of basking smooth snakes were with high or complete cloud cover (Gent and others 1996). This supports the belief of many that bright overcast or hazy cloud cover can be very productive for reptiles. The authors also found that the highest numbers of radio-tracked animals that couldn’t otherwise be seen were during periods of no cloud or complete cloud cover (presumably meaning they were warmed up and under cover, or the weather was too poor to emerge). Few snakes were visible below 15 or above 28°C. None of these studies measured relative humidity, although this is likely to have a significant (positive) effect on reptile activity. The ‘inexplicably poor’ results of some apparently-suitable survey days, and the surprisingly-high results of other days, may be due to this unmeasured factor. The relative effectiveness of refugia materials has been the subject of various research. Riddell (1996) used a variety of refugia materials, and found that metal was effective during the spring but often exceeded 50°C in the summer. Roofing felt was most productive during hotter periods, with corrugated asbestos and carpet being reasonably good also. For a more systematic study by Cheung and Gent (1996), the most effective refugia material was metal. Another recent systematic study (N. Smith, pers. comm.) has shown that metal tins are more effective than several non-metal alternatives, but that there may be sexual and ontogenetic differences in material choice, at least for slow-worms. There is also some evidence to suggest that non-metal materials (eg onduline) may be more effective in some conditions (D. Tamarind, pers. comm.). All studies tend to agree that the different thermal properties of non-metal and metal refugia are an important influence of their utility. Inns (1996) emphasised the importance of visual searching for basking animals, alongside refugia as a detection method. Reading (1996a,b, 1997) discussed in detail the use of ‘arrays’ of metal refugia, and the effectiveness of different approaches to reptile survey and monitoring. In determining presence/absence, the layout of ‘tin arrays’ was not so important as the time of checking; tins performed best in May, June and September. Unsurprisingly, denser arrays were more effective at detecting animals and increased the number of captures, but the standardised tin arrays suggested would be too cumbersome and impractical to be used widely. At least two current studies are experimenting with refugia densities and their effects on capture rates (D. Pritchett, pers. comm.; G. Reynolds, pers. comm.).

85
A current BSc dissertation (P. Lockhart, pers. comm.) is examining whether the use of specific tins by smooth snakes is due to chance findings or preference. Small arrays of six tins have been placed around tins known to be productive for smooth snakes. Some records were collected in 2004, and data will be gathered during the 2005 season. If the existing tins are preferred even when new tins are placed around them, then it would suggest special qualities (under-tin environment). If new tins are equally or more favoured, then it would seem that chance encounter is the chief determiner of tin choice. This research should give a clearer idea of why some tins never produce results, even though they are ostensibly placed in good habitat. Corbett and Moulton (1996) attempted a comparison between random transects and pre-determined ‘Pollard walks’ for detecting counting lizards. For detecting sand lizards, the biased walks were clearly more productive; especially as random transects dictated walking through obviously inappropriate habitat. For the other reptiles, the benefit of Pollard walks over random transects was less clear. The data are not sufficient to make fully objective conclusions, but intuitively there is value in maximising numbers of sightings through ‘calculated bias’. Moreover, a calculated bias would theoretically be consistently applied on every occasion a Pollard walk was used. Whitaker (1996) also examined transect methodology by using 29 visits to the same route, with binoculars for sighting animals. Interestingly, his unit of measure was animals per hour; unsurprisingly this showed clear shifts as the day progressed. Reptile survey by visual search remains a difficult method to standardise, not just because season, time, weather and observer bias can have strong effects, but also because visibility of reptiles is strongly linked to the quality of the habitat. A current BSc study is examining the effects of vegetation edge features caused by fires on reptile encounter rates (L. Darbey, pers. comm.). Riddell (1996) demonstrated that slow-worm and common lizard individuals could be identified by their dorsal head and cloacal scale patterns respectively. Sheldon and Bradley (1989) and Benson (1999) have shown that it is possible with adder dorsal head markings too. Fearnley (2002) carried out an intensive photographic study of a sand lizard population, and is now able to identify about 140 individuals in one population (H. Fearnley, pers. comm.). Following on from Fearnley’s research, the HCT is leading a PhD-based research project with the University of Southampton, to develop sand lizard monitoring methodologies. It will attempt to model sand lizard detectability in relation to external factors (time, season, weather) by intensively studying a captive population of known size, with the collaboration of Marwell Preservation Trust. Lizard counts are performed at different periodicities (once a day, hourly for one day a week, and hourly for a one-month block), and environmental variables are logged on a weather station. It is also calculating population densities by individual photographic recognition studies of a range of sites, and attempting to characterise habitat quality so that it can be used as a population predictor. The measurement of sand lizard activity against environmental and temporal variables should allow the modelling of explanatory variables in order to predict the proportion of animals that should be active and visible, and therefore allow the calibration of field data. If successful, the habitat quality system would allow indirect assessment of sand lizard densities, using habitat as a proxy (to be combined with monitoring of presence-absence and breeding success). An a priori ‘habitat index’ will need to be constructed initially, spanning a range of

86
habitat qualities and perceived sand lizard densities. Development of an index will require population density estimates for a range of habitat plots, hence the photographic recognition study is being used as a mark-recapture-type technique to estimate densities. Most sites will be on dry heathland, some on regenerating heathland, and one or two on sand dunes. If successful, the proxy habitat measure would be used to predict and monitor the status of all sand lizard populations without needing intensive direct observation at all sites. 4.5 Learning from foreign herpetofauna surveillance and monitoring
projects
4.5.1 Denmark
There is no national surveillance scheme in Denmark, but various short-term and longer-term initiatives operate for different species. The following is based upon a summary provided by Kåre Fog and Lars Briggs (pers. comms.) of survey and monitoring activity carried out in Denmark, both by professionals and volunteers. The great crested newt was surveyed in 2001, using netting of larvae. The size of dipnet and length of strokes were standardised, and the number of strokes per pond until the first larva catch was recorded. In each study area, survey started in a central pond and then extended concentrically until 100 ponds were visited. The alpine newt, a rare species in Denmark, is monitored systematically by volunteers by dipnetting in August. Fire-bellied toad Bombina bombina are very rare and all remaining populations are well-known. They are usually monitored using photographic recognition of the belly pattern during three separate catching exercises. The photographs studied after the field season, and population size is calculated using the Lincoln Index. This procedure has also been used for the green toad Bufo viridis, by photographing the back, and for tree frogs by photographing the sideline. It gives an accurate measure of population size, migration patterns and yearly mortality. For the spadefoot toad Pelobates fuscus, maps and aerial photos are used to locate likely sites; permission is then sought and the ponds are visited at night. The observer wades into shallow parts of pond and listens for calling males by ear, and if possible with an underwater microphone. Rare anurans, such as the tree frog and green frog are monitored mainly by identifying their calls. Every evening in spring, the recorder drives along a road through an previously uninvestigated area, stops the car and listens for one minute and records the presence of any species heard. If a chorus is heard, the observer walks towards the pond and once there counts the number of calling males. They then drive 700-1000m further and repeat the procedure. This is repeated for 2-4 hours until frog calling ceases. The species investigated can be heard from up to 1km away, therefore roads should not be more than 2 km apart. In this way, 25-50 km2 can usually be covered per night. Where a rare species is discovered, the site will be managed if necessary (eg pond dredging, cutting trees, removing fish), through liaison with the landowner. Ponds are then typically monitored every 1-3 years, under suitable weather conditions, and the number of calling males is counted. To improve the accuracy of values for total number of males, recording is extended by a number of ways: for natterjack toad and green toad, banks are searched by

87
torchlight. For tree frogs, the chorus is counted twice. For fire-bellied toads, a calibration curve gives the most likely total number of males for each number of males heard. There is currently little reptile survey, surveillance or monitoring in Denmark. There are five widespread species (sand lizard, common lizard, slow-worm, grass snake, adder) and three very rare species (European pond terrapin, smooth snake and Aesculapian snake Zamenis longissimus). The sand lizard was surveyed in 2004 by dividing the landscape into 10 km squares, and choosing three sites within each that was likely to be occupied. Each site was visited to record presence/absence, and once recorded in a 10km square, the observer moved on to the next square. If the species was not found under optimal weather conditions during the first visit to a suitable site, it was not searched again. This was admittedly a crude procedure. Although it gives useful information on distribution, it is not sensitive enough to provide an early warning of decline. The pond terrapin, smooth snake and Aesculapian snake are virtually or actually extinct and there is no current monitoring. However, one Aesculapian snake was seen in 2004 at one of the old known localities, close to a good hibernation place, and there is likely to be an observer there every day during spring 2005. Records of pond terrapins have mainly been collected by contact with local people and articles in newspapers. An EU-funded project based in Denmark is currently under way to develop monitoring methods for great crested newts across the Baltic region (L. Briggs, pers. comm.). 4.5.2 Netherlands
The Netherlands has national herpetofauna monitoring system carried out by RAVON. The following information was obtained from the RAVON website (http://www.ravonwm.org/). ’RAVON Working Group Monitoring’ is part of the RAVON Foundation, a volunteering organisation for reptile, amphibian and fish research in the Netherlands. Working Group Monitoring is responsible for the Reptile Network and Amphibian Network. Both work nationally and take part in the Ecological Monitoring Network (NEM), which includes other national flora and fauna networks. The networks are funded by the Ministry of Agriculture, Nature Management and Fisheries, and Statistics Netherlands. RAVON Working Group Monitoring uses facilities at the Institute of Systematics and Population Biology at the University of Amsterdam. The reptile and amphibian networks collect information annually on the herpetofauna of the Netherlands, to investigate changes in populations and identify the causes. Particular attention is paid to areas where one or more Red List species occur. The Dutch Red List reptiles are: slow worm, sand lizard, wall lizard, grass snake, smooth snake and adder. The nine amphibian species on the Red List are: fire salamander, great crested newt, palmate newt, yellow-bellied toad, spadefoot toad, midwife toad, tree frog, pool frog and moor frog. Most are considered vulnerable, but two are threatened and one (yellow-bellied toad) is seriously threatened. For the Reptile Network, over 300 plots are surveyed by volunteers using transect surveys. Plots are selected in all major reptile areas and are visited under favourable weather conditions, seven times a year as follows:
88
• Four times between end of March – end of July. • Three times between August – September. • Between two successive visits there should be a delay of at least 5 days. • A route is executed under favourable weather conditions. Plot size is 2-2.5 ha or 1,500-2,000 m in length. A visit generally lasts two hours. Plots are located in one type of landscape, and a route should be homogeneous with respect to landscape and management, and no hard barriers should occur along it. Approximately 5m either side of the route is widely examined. Once chosen, the route should not be deviated from, although adaptations are permitted if large changes have taken place within it. All observed reptiles are recorded (species, numbers of individuals, locations). After seven years of monitoring, reliable trends have been detected for all seven species. For the Amphibian Network, over 150 volunteers and land managers are currently involved in surveying amphibians on plots across the country. Plots are approximately 100 ha, and contain at least three water sites in one landscape type. The same sites are surveyed every year using the same methodologies. Sites are individually numbered and observations recorded on a standard recording form. They are visited four times a year – two during the day and two in the evening – as follow: • Once in March. • Once in April - beginning May. • Once between end of May - early June. • Once in July – August. The second and third visits should preferably be in the evening. The visit dates depend on the period in which the known species are most active. Day visits should aim to find eggs, particularly in early spring. Later in the summer, tadpole and juvenile searches are made. Species are recorded as absent (0), rare (1), average (2) or very common (3). After the last field visit, the observer determines the maximum number present for each species over the season at their site. 4.5.3 Switzerland
KARCH
Switzerland began national amphibian and reptile survey exercises in the 1990, carried out by a government-funded unit called KARCH. Following on from these, a national monitoring system is now more-or-less in place, but the implementation has yet to be finalised. The KARCH unit consists of five half-time posts (two amphibian and two reptile specialists, one IT/database specialist), and one 0.2-time post for data entry. It covers all native reptile and amphibian species, using consistent methodologies over time. Population size, distribution and long-term trends are monitored. Sampling strategies are fairly robust, but there is a bias towards key amphibian sites, and to rare reptile sites. The number of visits is based primarily on achievability and cost. As part of the current contract, a visit was made to the KARCH team in Bern.

89
The current amphibian-recording regime arose from a national survey to identify the country’s most important amphibian populations (S. Zumbach, pers. comm.). Most of lowland Switzerland is fairy intensively farmed or urbanised, with only relatively small areas protected as nature reserves, therefore amphibian populations are normally isolated and restricted in size. Over a period of 10 years, KARCH surveyed and estimated the size of amphibian populations all over Switzerland, and published an inventory of the best 10% of sites. They demonstrated the largest species assemblages and the largest populations. Borgula and others (1994) submitted their final report describing the project to the Swiss Government’s environmental agency, and the Swiss Government gave the sites legal protection (Schweizerischer Bundesrat 2001). The inventory register comprises five volumes covering 884 sites, with two pages summarising each site. Each site account has: • GIS-derived raster and contour map, marked with the boundaries of primary terrestrial
habitat, wet areas and ponds, labelled with scale (according to size of site), site name and code
• Geographic information, altitude, areas of wet and terrestrial habitats • Species present and population size classes (1 small to 4 very large) • Notes on the specific importance of the site Of the 884 sites, c.120 were part of the Swiss Red List assessment. The inventory resulted in a national law to protect amphibian sites in 2001 (law 451.34) – similar to SSSI protection in the UK. Under this legislation, landowners must protect both the habitat and the amphibian population. Ryser (2002) described how breeding sites should be protected (available online http://www.umwelt-schweiz.ch/buwal/shop/files/pdf/phpjNEUEt.pdf), and a book was published to explain the significance and implementation of the law to planners. KARCH hold the inventory on ArcView, with separate layers for each species. KARCH hold a pond database of 12-14,000 ponds. Nearly all amphibian ponds are isolated, with little opportunity for exchange. Lowland environments in Switzerland are more homogenous than in the UK, and there are no large areas of wetland. Amphibian population size is estimated by simple counts of adults, juveniles, larvae, spawn for anurans, and egg searches for newts. Sites are visited three times per year. Newts are trapped, but using ‘minnow traps’ at the surface, rather than the familiar bottle-traps used in the UK. All reliable distribution data are transferred into a database and distribution maps and ecological analyses are produced. Negative records are also kept. Current hopes are for monitoring visits to be made every five years, but some sites could be visited every year (B. Schmidt & S. Zumbach, pers. comm.). However, volunteer networks are not in place, and it is not certain that monitoring will take place. Reptiles have not received the same protective framework as the amphibians - possibly because most reptile populations are concentrated in the mountains - and a site inventory has not been created. The site protection law received by the amphibians would not be possible now for the reptiles, although there may still be local scope for protection at the Canton level (S. Zumbach, pers. comm.). However, a five-year pilot project has just finished to decide the methodologies for a national reptile-monitoring programme (A. Meyer, pers. comm.). The monitoring has focused on the rare reptiles, ie those with only a few populations left and those that are rapidly declining. The site selection could have been randomised, but this

90
would involve many more sites and would prove too expensive. The rare species include single populations of sand lizard and grass snake in the Alps, three populations of viperine snake Natrix maura, three populations of asp viper Vipera aspis, smooth snake and green lizard in urban areas, and six populations of adder in the west of the country (A. Meyer, pers. comm.). All recording is currently performed by professionals as follows: • A total of 13 or 14 sites are monitored. • Four visits per year, preferably in appropriate weather conditions, half a day each. • Time of year is selected to maximise sightings: May-September at high altitudes,
March-April at lower altitudes. • Comparability is important year on year. Ideally 10-15 visits would be made to each site, but resources are limited. This is problematic if visits fail due to poor weather, and if weather is poor on both days selected for a visit, the monitoring results still have to be accepted (A. Meyer & J.-C. Monney, pers. comm.). Two visits per year may be sufficient for some sites, and after five years of adder monitoring it appears that four visits per year are enough for this species (A. Meyer, pers. comm.). In the Jura Mountains, monitoring focuses on hibernacula when found. Gravid females are also counted, and anticipated neonate production is used in population estimates. For the viperine and tessellated snake Natrix tessellata, only adult females are monitored as they are easier to find, and can be extrapolated to estimate the overall population size. For tessellate snake sites, four visits are sufficient, but for viperine snake sites, four is not sufficient and eight visits are needed. Mark-recapture is used to calculate population size, and refugia (metal sheets or roofing felt) are used for detection in relevant species. At one site with three species, 70 animals have been PIT tagged. There were no recaptures in 2004, but 14 new individuals were tagged (A. Meyer, pers. comm.). Telemetry is used on viperine snakes and other species. The Swiss amphibian and reptile Red Listing process has not yet finished its analysis, but will publish in 2005 (B. Schmidt, pers. comm.). For reptiles it was based upon presence/absence only, based upon a sample of 306 random but regionalised (therefore not strictly stratified) 306 1km squares. Some sampling was deliberately directed towards known rarities in some areas. All were chosen from squares with greater than 15 years of data. Three visits were made to each, which was sufficient for some species; for arguably for smooth snake sites, 35 visits would have been required (A. Meyer, pers. comm.). The amphibian Red List species occupy about 300 sites in total, and these were visited four times during the Red Listing exercise in 2003 and 2005. The Red Listing exercise is to be repeated every ten years, or perhaps more often. Amphibian and reptile atlases are published for Switzerland, showing 5km dot maps of pre-1980 and 1980-1999 records, introduced populations, and ‘potential distributions’ for all species predicted from known ecological preferences (Hofer and others 2001). A national GIS resource, with all of Switzerland divide into 100m x 100m height-controlled squares, was used alongside features such as soil, geology and aspect, to predict the potential ranges. There are various other publications on the herpetofauna of individual Cantons. The KARCH team do not currently engage volunteers, but are considering using them in future, and are keen to know more about the HCT’s experience of using volunteers in the UK.

91
Their primary concern is that small amphibian populations may be missed (B. Schmidt, pers. comm.). They support the concept of using habitat as a proxy measure for population status in principle, but with several caveats. There are some locations with good amphibian habitat but not the expected amphibians. Isolation means that recovery from stochastic events such as pollution is impossible. Likewise, reptiles are absent from some locations where good habitat exists. Farmers may have killed snakes previously, food may not have been available, microhabitats may have been absent, species may simply never have reached a particular location, or isolation and stochastic events may have been responsible. Interestingly, there are sometimes local legends as to why there are no snakes in some valleys. Also, some reptile populations seems to be in decline although the habitat still exists, including good primary habitats such as talus, rocks and cliffs (A. Meyer & J.-C. Monney, pers. comm.). The KARCH database holds about 50,000 amphibian records (c.8,000 since 1999), and 50,000 reptile records (c.3,000 since 1999), with the oldest records from around the year 1900 (A. Meyer, pers. comm.). It is not a relational database as such, and consists of a flat table of observations with lookups attached, and data entry forms. Age (adult or juvenile) and sex are recorded in a single field, and there are few other parameters. Time of day and many visit information parameters are not recorded, and they are primarily interested in presence, national and local distribution, and counts. The data source field is categorical (eg published, anecdotal etc), to facilitate analysis rather than to track the origins of records. Simple counts are used as evidence (within confidence limits) of population size; then population size is classed and compared to site size. KARCH do no monitor site threats and habitat quality, although some Cantons do so for protected amphibian sites. KARCH currently operates mainly as an information and advice service, facilitating and motivating conservation action, offering project support, and acting as the national expert centre to the railways, government and the general public. . Canton Argau
Several counties in Switzerland (“Cantons”) have herpetofaunal recording schemes funded by local government; the best example is Canton Argau. As part of this contract, a visit was made to the coordinator of amphibian monitoring in Canton Argau, Christoph Bühler, who provided the information described here. He works for an ecological consultancy in Reinach near Basel, that is paid by the Canton government to manage the amphibian-monitoring scheme. Volunteers created an inventory of c.2,500 amphibian breeding locations in Canton Argau in 1991, and a monitoring scheme has been running on them since 1999. This targets the rarer species (great crested newt, smooth newt, yellow-bellied toad, midwife toad, natterjack toad, tree frog, and the three water frogs). The fire salamander, common toad and common frog are considered common and are not monitored. A sample of c.550 sites covering at least one target species was chosen in 1999, but with sites discovered since then, the sample now stands at 601 sites. The emphasis is on 10 areas with rare species concentrations; 2-4 of these zones are visited per year, covering all sites within them (including negative sites). There are also 120 federally-protected amphibian sites in Canton Argau, some of which are outside the 10 priority areas; these are monitored every two
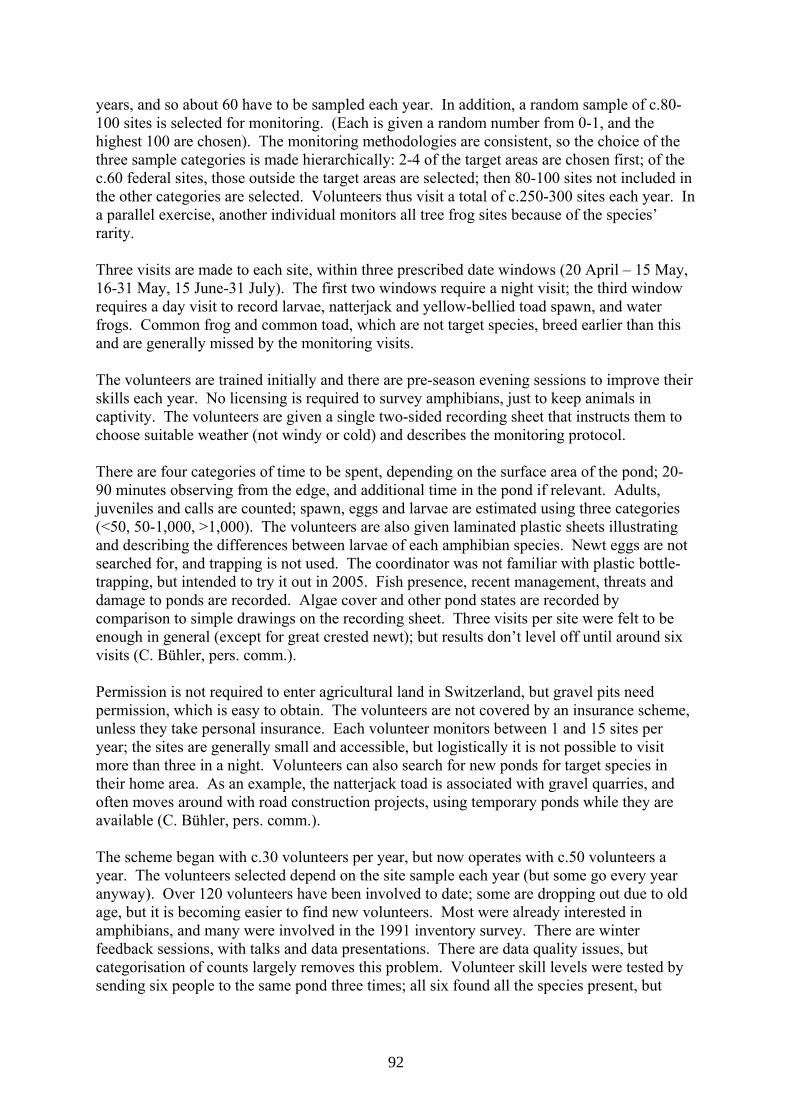
92
years, and so about 60 have to be sampled each year. In addition, a random sample of c.80-100 sites is selected for monitoring. (Each is given a random number from 0-1, and the highest 100 are chosen). The monitoring methodologies are consistent, so the choice of the three sample categories is made hierarchically: 2-4 of the target areas are chosen first; of the c.60 federal sites, those outside the target areas are selected; then 80-100 sites not included in the other categories are selected. Volunteers thus visit a total of c.250-300 sites each year. In a parallel exercise, another individual monitors all tree frog sites because of the species’ rarity. Three visits are made to each site, within three prescribed date windows (20 April – 15 May, 16-31 May, 15 June-31 July). The first two windows require a night visit; the third window requires a day visit to record larvae, natterjack and yellow-bellied toad spawn, and water frogs. Common frog and common toad, which are not target species, breed earlier than this and are generally missed by the monitoring visits. The volunteers are trained initially and there are pre-season evening sessions to improve their skills each year. No licensing is required to survey amphibians, just to keep animals in captivity. The volunteers are given a single two-sided recording sheet that instructs them to choose suitable weather (not windy or cold) and describes the monitoring protocol. There are four categories of time to be spent, depending on the surface area of the pond; 20-90 minutes observing from the edge, and additional time in the pond if relevant. Adults, juveniles and calls are counted; spawn, eggs and larvae are estimated using three categories (<50, 50-1,000, >1,000). The volunteers are also given laminated plastic sheets illustrating and describing the differences between larvae of each amphibian species. Newt eggs are not searched for, and trapping is not used. The coordinator was not familiar with plastic bottle-trapping, but intended to try it out in 2005. Fish presence, recent management, threats and damage to ponds are recorded. Algae cover and other pond states are recorded by comparison to simple drawings on the recording sheet. Three visits per site were felt to be enough in general (except for great crested newt); but results don’t level off until around six visits (C. Bühler, pers. comm.). Permission is not required to enter agricultural land in Switzerland, but gravel pits need permission, which is easy to obtain. The volunteers are not covered by an insurance scheme, unless they take personal insurance. Each volunteer monitors between 1 and 15 sites per year; the sites are generally small and accessible, but logistically it is not possible to visit more than three in a night. Volunteers can also search for new ponds for target species in their home area. As an example, the natterjack toad is associated with gravel quarries, and often moves around with road construction projects, using temporary ponds while they are available (C. Bühler, pers. comm.). The scheme began with c.30 volunteers per year, but now operates with c.50 volunteers a year. The volunteers selected depend on the site sample each year (but some go every year anyway). Over 120 volunteers have been involved to date; some are dropping out due to old age, but it is becoming easier to find new volunteers. Most were already interested in amphibians, and many were involved in the 1991 inventory survey. There are winter feedback sessions, with talks and data presentations. There are data quality issues, but categorisation of counts largely removes this problem. Volunteer skill levels were tested by sending six people to the same pond three times; all six found all the species present, but

93
abundance varied by c.50%. The identification of the three water frog species is a problem though. Recording is done on a simple relational database created by an external developer, which is being improved each year. Data entry is done by a skilled secretary, who enters data for 250 sites in three days. Sites (‘objekts’) and their details, subsite details, and species records are held in separate tables. Abundance is recorded in four categories, and negative records are included. Standard queries are set up, eg to report the species list for an area. The scheme costs about £22,500 per year: £13,500 for coordination, £9,000 for volunteer expenses (ie about £180 for each volunteer per year). Both the Canton Argau and KARCH initiatives are funded by government, arising from a federal obligation to monitor species status. The main protective legislation was passed in 1967. The national suite of amphibian sites was designated by KARCH, without the need to go through parliament. 4.5.4 Canada
FrogWatch Canada
FrogWatch Canada is a volunteer-based programme that monitors vocal amphibians. It is part of NatureWatch, a range of community based monitoring programs administered by the Ecological Monitoring and Assessment Network of Canada, the Canadian Nature Federation and the University of Guelph. Volunteers survey amphibians using the FrogWatch Observation Form, which records: • Longitude and latitude at 4-5 decimal places • Amphibian species recorded (common and Latin names) • Number of individuals and level of activity using ‘abundance codes’:
1. No frogs or toads seen or heard 2. Frog(s) or toad(s) seen but not heard 3. Individuals can be counted, calls not overlapping 4. Some individuals can be counted, other calls overlapping 5. Full chorus, calls continuous and overlapping, and individuals not distinguishable.
This information was obtained from the NatureWatch Canada website (http://www.naturewatch.ca/english/select_province.html). 4.5.5 USA
Frogwatch
Frogwatch in the USA is a long-term frog and toad monitoring program managed by the National Wildlife Federation in partnership with the United States Geological Survey, the capacity of which depends very much on volunteer availability. It collects information on frog and toad populations in the U.S.A. It monitors all anuran species, including vocal identification, but the website (URL: http://www.nwf.org/frogwatchusa/) gives little information on methodologies.

94
NAAMP
The North American Amphibian Monitoring Program (NAAMP) is a collaborative effort that operates nationally in the USA, covering 17 species of vocal anuran. Information was obtained on the Indiana branch of NAAMP, operating under the title of Indiana Amphibian Monitoring Program (INAMP) (http://www.in.gov/dnr/fishwild/endangered/naamp/nindex.htm). NAAMP is funded by regional partners including state natural resource agencies, NGOs and the U.S. Geological Survey (USGS). Volunteers are trained in the identification of anuran species from their vocalisations, and the programme is often referred to as an ‘amphibian calling survey’. They follow NAAMP data collection protocols, to monitor populations of vocal frogs and toads. Surveys are carried out by volunteers along roadside routes where calling species are identified and recorded as follows: • Each survey route has 10 listening stations. • At each listening station, observers listen for five minutes. • Surveys are conducted in the evening in favourable weather conditions. • Routes take at least one hour and no more than three hours to complete. • Routes are conducted three times per year, because different species breed at different
times. • Some individual sites require less time. At each listening station, weather conditions are recorded and the “species calling index” is estimated using the following codes: 0 = No calls heard. 1 = Individuals can be counted, there is space between the calls. 2 = Calls of individuals can be distinguished, but there is some overlapping of calls. 3 = Full chorus, calls are constant, continuous and overlapping. ARMI
The Amphibian Research Monitoring Initiative (ARMI) is a national programme of amphibian monitoring, research, and conservation, coordinated and led by the US Geological Survey (http://edc2.usgs.gov/armi/monitoring.asp%23Sample). Information on the scheme was obtained from the website. The sampling design addresses spatial variation and detectability, and tests different approaches tailored to the types of species and environments that occur in different areas of the USA. Geospatial stratification is used to determine the sampling regime, and a metapopulation framework makes fieldwork more efficient, and allows examination of the effects of isolation in local population dynamics. The programme estimates what percentage of a population has been detected. Species present are noted, as well as those not detected but expected. Multiple sampling techniques are used to maximise species detection: visual survey, calling surveys, PVC pipes, and refugia boards. Visual Encounter Surveys (VES) are effective in most habitats and for most species that breed in lentic (non-flowing) waterbodies. Two workers walk slowly around the perimeter and shallows of a water body searching for amphibians. Multiple transects are used for large

95
shallow wetland habitats such as marshes that cannot be completely surveyed. Most amphibians are identified by sight. All life history stages (eggs, larvae, juvenile, adult) are recorded for each species, with emphasis on evidence of breeding activity. Time-series data are used to monitor changes in number and distribution of breeding sites for each species. ARMI aims to survey a sub-sample of sites more than two times within a short time period (eg 2 weeks), so that species-specific detection probabilities can be estimated. In this way, the proportion of the sampling area occupied (PAO) by breeding populations can be estimated for each species. Detailed information about amphibian habitat is also collected at every site to study associations between species and vegetation cover. A variety of analyses are conducted to assess amphibian population status and trends, and to determine biotic and abiotic stressors in order to improve ecological understanding. Regional and national syntheses are produced, as well as feedback for determining adaptations in protocols, monitoring strategies and/or research activities, and decision-support tools for land managers and policy-makers. 4.5.6 Others
Hungary
There is no national scheme in Hungary, but a Breeding Pond Survey was carried out by the Amphibian-Reptile Conservation Group of Birdlife Hungary, on the forest ponds of the Pilis-Visegrád Hills (Pilis) (Puky and others 2001). The survey was carried out as part of a countrywide census to which a Declining Amphibian Population Task Force (DAPTF) Seed Grant contributed significantly (http://www.open.ac.uk/daptf/froglog/FROGLOG-50-3.html). During 2001, 105 forest ponds were recorded, ranging from 25 m2 up to 0.75 ha. The following parameters were recorded: size, depth, vegetation cover, transparency, disturbance by game, species and numbers of breeding amphibians. The most common species observed were smooth newt, common toad, agile frog and common frog, whilst fire-bellied toad, tree frog and spadefoot toad were less common. Romania
The Romanian Society of Herpetology, founded in 2002, aims to study and protect amphibians and reptiles. There is no national scheme, but local monitoring schemes include: • Mapping the Transylvanian herpetofauna. • Study of a slow-worm population near Rupea, Brasov County. • Monitoring amphibians in the Retezat National Park (in collaboration with Retezat
N.P. Administration). • Ecological and faunal study of the Tirnave Vallies herpetofauna. These projects are in addition to several other scientific studies on herpetofauna. This information was obtained from http://bioge.ubbcluj.ro/vivariu/srh/eindex.htm.

96
4.5.7 Summary
This is not a complete survey of surveillance and monitoring schemes, but it shows the variety of approaches that are used across Europe and North America. See Appendix 5 for a summary. There are few national surveillance and monitoring schemes in Europe today, perhaps only Netherlands and Switzerland have such programmes, and neither of these is entirely satisfactory. Both are restricted in scope by pragmatic considerations such as cost and achievability. Arguably none of the schemes examined assess ‘conservation status’, and at best they only deal with biological status and/or distribution of populations. The most common parameters recorded are species presence/absence and head counts. Widely used field techniques include torching and dip netting, with trapping used less than it is in the UK. For vocal species, frog and toad populations are often monitored by estimating total numbers of breeding males (Frogwatch USA, NAAMP, Denmark). For the native British species this is only relevant to the natterjack, but of the exotic species it applies well to the water frogs. Some projects use their own standardised codes, eg “species calling index” (NAAMP, USA), “abundance codes” (FrogWatch Canada), and statistical values such as “proportion of area occupied” (ARMI, USA). The calculation of neonate production using gravid female counts, by KARCH is Switzerland, is interesting. Devices such as these should be evaluated more fully when constructing methodological protocols for a national amphibian and reptile recording scheme (NARRS) in the UK. It appears that few if any of the schemes are based upon rigorous statistical forethought such as power analysis, and multivariate analysis of variations in biological parameters and their causes. Monitoring in other countries relies heavily on volunteers, as would be expected in the UK, and it is generally dependent on statutory funding. The experiences of using volunteers in Canton Aargau are useful, as they show that volunteers can be trained and expected to carry out visits according to strict protocols year upon year. They were paid travel expenses, but otherwise the scheme relies upon the enthusiasm and dedication of individuals. The rates of volunteer turnover experienced, and the differences between workloads that volunteers will accept, would provide useful reference points when designing NARRS, as there is no similar herpetofauna-based example on this scale to compare with in the UK. The sophistication and intensity of monitoring regimes and surveys differs widely between countries, yet there appears to be no pattern or reasoning behind this. In this review, the number of schemes in a country ranges from one-off projects on single/few species (eg Denmark) to several independent national long-term projects (eg USA). Sampling regimes may be designed by choosing sites based on previous knowledge (eg Denmark) or using geospatial stratification, as in to give a fair representation of spatial variation in species over a large area (eg ARMI, USA). The focus of schemes tends to be guided by urgency, ie species listed under the Habitats Directive in Europe, or on the Red List of the respective country. However, given the need for all European Member States to monitor ‘conservation status’ of EPS, as defined by the Habitats Directive, there appears to be no EU country that has yet defined how to meet its monitoring obligations in this respect. The North American schemes appear to survey all anuran species without bias, but the superior emphasis placed on the monitoring of amphibians rather than reptiles seems to be a

97
common thread in all countries examined. Even in countries with relatively well-structured monitoring on national and regional scales, such as Switzerland, commit less effort overall to reptile recording. As observed earlier, this no doubt reflects a generally greater interest, of both professionals and volunteers, in amphibians rather than reptiles. It does not mean that more people will not become interested and involved in reptile survey; the HCT has many experiences of recruiting new volunteers who had not previously recorded reptiles because they lacked basic reptile detection skills. Volunteers play a major role in collecting data for nearly all the schemes examined, and in some cases (eg fire-bellied toad monitoring in Denmark), their local knowledge is important. A possible downfall of using volunteers is their potential reluctance to visit sites where they are unlikely to get good results. The use of randomly-selected sites will undoubtedly include some sites of poor habitat (eg urban or intensively agricultural areas), which can result in reticence among some volunteers (J. Baker, pers. comm.). Some volunteers will always carry a higher workload than others, but to maintain enthusiasm, it is crucial to spread the sample so that all surveyors have a fair chance of finding the species they are surveying for (C. Buehler, pers. comm.). The most pertinent findings from examination of herpetofauna surveillances schemes abroad are that there is not any one scheme that could be used as ‘role model’ for NARRS, nor is there one which has the scale and scope that NARRS hopes to achieve. Therefore, it is appears that NARRS would be the state-of-the-art if it were to be achieved. The lessons that can be learnt from schemes abroad are in the survey and analytical methods used, and to a lesser extent the delivery mechanisms, eg using volunteers. A close watch on the literature would be advisable, such as papers by B. Schmidt on detection probability and other statistical approaches. With respect to volunteers, engagement with the UK ARGs and examination of other (non-herpetofauna) volunteer-based wildlife monitoring schemes in the UK would be most beneficial and relevant. 4.6 Non-herpetofauna monitoring schemes of relevance
4.6.1 Breeding Bird Survey
The Breeding Bird Survey (BBS) is an annual monitoring scheme organised by the British Trust for Ornithology (BTO) and jointly funded by the BTO, RSPB and JNCC. It records the presence and abundance estimates of species, and produces population trends of all breeding birds in Britain (Raven and others 2002 and BBS instruction leaflets). BBS sample locations are 1km squares randomly selected across Britain, stratified to take account of differences in the availability of observers. Two parallel 1km transects are used, 500m apart and 250m in from the edge of the square. The same route must be followed as in previous years. Observers make three visits to selected squares: the first to record habitat types and set up a suitable survey route; the second and third to record birds seen or heard whilst walking along the route. The latter visits should be at least four weeks apart: 1. March – April Reconnaissance visit to set up route/ check census route 2. Early April – mid-May Complete ‘early’ transect count 3. Mid-May – late June Complete ‘late’ transect count 4. July – August Return data to BTO Census Unit

98
Counts should be made between 6-7am, no later than 9am. An average visit should last an hour and a half. Recording should take place under favourable weather conditions. All birds seen or heard along each transect are recorded when first noted, using standard BTO species codes and one of the following four categories: 1. Within 25m either side of the line 2. Between 25 and 100m either side of the line 3. >100m either side including birds outside the 1km square boundary 4. Birds in flight only (at any distance) Birds behind the observer, or too far from the transect, are not recorded once the census has begun. Juveniles are excluded from summary sheets. Habitat type is also recorded for each transect section, using the coding scheme common to a range of BTO projects. 4.6.2 National Bat Monitoring Programme
The BCT coordinates the National Bat Monitoring Programme (NBMP) as an annual national survey of British bats. Many of the sites are different each year, so it is not a series of sites that are being monitored, but species as a whole, nationally. The scheme covers 17 species, with sufficient data for robust statistical analyses on 10 of these; fewer than 40 sites is considered insufficient for precise trend analysis (Bat Conservation Trust 2004). The scheme originated as a five-year project launched in 1996 under contract to the then DETR, but it has continued as a national monitoring programme. Data are collected by volunteers, and more than 2,000 volunteers surveyed over 3,000 roost and field sites during the project. The final report of the DETR contract (BCT 2001) describes the methodologies, sampling and delivery, and presents an atlas of 10km distribution maps. The 1996-2001 survey used three main methods, including counts of bats at maternity and hibernating colony roost sites, and field survey sites using bat detectors. For roost sites, the sampling strategy was non-random; known sites were selected by volunteers. For field surveys, a random stratified sample was used. Sites were selected proportionately using CEH National Land Classes. For the Daubenton’s bat, field survey sample units are stretches of waterway of 1km length, with ten ‘spot counts’ spaced systematically along the transect lines, each for a set time period. The noctule, serotine and pipistrelle (‘NSP’) survey transects were 3km in length, each within 1km squares. The methodologies of the three approaches are described below. Maternity colony counts (summer) - Emergence counts of adult bats pre-birth are made at dusk. Both the mean of several counts and peak count are used as sample statistics. Two counts are made May-June; counts made minimum four days apart. Observers should be in place 15 minutes before sunset or the known emergence time. A single species is monitored at each roost site. Observers record total bat count, weather conditions, the reason for stopping the count, and whether they used a bat detector. Counts should occur under favourable weather conditions. For late emerging species a torch with red filter can be used to illuminate exit points. If no bats are present during the survey dates, but they had been at other times, observers should make a single count on any night when bats are present and indicate dates when bats were present at roost. Hibernation site counts (January – February) - Visual counts of inactive bats are made at hibernation sites. One surveyor leading search must have a hibernation site visitor’s licence.

99
The search should cover the whole accessible area of site or use standard search patterns eg transects in larger sites. If more than one chamber is surveyed within a single location, counts made on same day and submitted for individual chambers are treated as one site for database input. All species are recorded, and two counts are made of each species present (one in January, one in February). Counts are made during daytime at least one week apart. For each survey, total bat count for each species is recorded, temperatures outside and inside, numbers of surveyors, number of those holding a licence and time taken to complete the survey. Habitat types that fall within a visual radius c.500m around site are recorded. Bat detector field surveys (summer) - Continuous counts of bats are made at spot count sites along transects within 1km squares. For Daubenton’s waterway surveys, counts are made of bats heard over a heterodyne bat detector tuned to 35kHz or broadband detectors; a torch can be used to scan the water surface. Daubenton bat passes are recorded for four minutes at each of the ten stopping points or ‘spots’, thus the number of bat passes per half-hour are recorded. Surveyor records the total bat count and weather conditions; counts should be conducted under favourable weather conditions. Two survey counts made during August. The NSP field survey (noctule, serotine, common pipistrelle and soprano pipistrelle) makes counts of bat passes heard over a heterodyne bat detector and broadband detector. These are made at 12 spots and 12 walking sections, spaced equally along the 3km transect. Two survey counts made c.20 minutes after sunset. Surveyor records total bat count and weather conditions. The idealised route within a sampled square selected so that the observer finishes at the starting point. The NBMP Annual Report 2003 (Bat Conservation Trust 2004) presents some useful data on volunteer involvement. The scheme is dependent upon volunteers, and many of the volunteers are householders who have bat colonies in their properties. Little previous experience is needed, and the protocol issued with recording pack is sufficient to meet minimum standards for most species. More ‘difficult’ species tend to be counted by local Bat Group members. Training is available to those who want to become involved in field surveys. The sex ratio (male:female) of household participants is about 30:70, whereas the ratio for field surveyors is 70:30. Hibernation site surveys require licensing from the relevant SNCO, or accompaniment by a licensed bat worker. End-of-season contact is made with all volunteers, to encourage subsequent involvement. They are asked if they wish to survey again in the following year, and sites are then assigned to those who wish to participate. Local Bat Groups are the focus for recruiting new volunteers in poorly-covered areas, and there is a general need for recruitment drives in Scotland, Wales and Northern Ireland. General feedback to volunteers is maintained by newsletter and website. Each year a series of workshop is held to train volunteers in the use of hearing and bat detectors to identify species. Survey protocols are also taught, and a field session can be attended. In 2003, over 400 people were trained in 27 workshops. A new development is the training of experienced bat workers to deliver training courses themselves; there are now 10 Volunteer Regional Bat Detector Workshop Leaders (Bat Conservation Trust 2004). A total of 1,900 volunteers have participated in the NBMP since 1997, with mean annual participation varying between elements of the scheme, from 40 (hibernation counts) to 415 (colony counts). Mean annual turnover of volunteers varies from 16 to 42%, again depending on the element of the scheme; field surveys had the highest turnover, hibernation counts the lowest. This appears to suggest that people are more willing to be involved from the comfort

100
of their own homes, than to commit to field surveys. An average of 750 people take part each year, but this rose to 850 in 2003. The Annual report 2003 also made some interesting calculations regarding the economics of using volunteers (Bat Conservation Trust 2004). Each survey amounts to an annual total of 6 hours for hibernation surveys, 11 hours for waterway surveys, 12 hours for field surveys, and 30 hours for colony counts. All survey times were totalled and doubled (in accordance with health and safety guidelines on lone working at night), and costed at BCT’s professional rate of £35 per hour. This produced a total mean annual input of 14,148 volunteer hours, at a notional cost of £495,190. Since the scheme began, this amounts to a total of 94,592 hours, equivalent to £3,310,825. Even with a very modest rate of £10 per hour, the annual volunteer input is worth £141,483. The annual input of volunteer hours is equivalent to one person working continuously, day and night, for 589.5 days; or at office hours with holiday entitlement, for 8.13 years. 4.6.3 Tracking Mammals Partnership
The Tracking Mammals Partnership (http://www.trackingmammals.org/) is a collaborative initiative begun by 24 organisations in 2003. It aims to “improve the quality, quantity and dissemination of information on the status of mammal species in the UK”. It followed two scoping studies commissioned to “investigate the feasibility and costs of setting up a mammal surveillance and monitoring network across the UK, and the survey methods that could be used for different species”. The first was made by Macdonald and others (1998) for DETR and JNCC, and the second was published by the BTO (British Trust for Ornithology 1999). All 24 organisations signed a declaration of intent, thereby committing them to: • Setting up co-ordinated, nationwide networks of volunteers to carry out surveillance
and monitoring, enabling us to deliver distribution and population trend information on all UK mammals.
• Developing, where possible, standardised survey designs and methods to facilitate information exchange.
• Working towards improving data availability, at agreed levels, through the National Biodiversity Network.
• Disseminating information on the status of UK mammals individually and collectively through the Tracking Mammals Partnership website and through periodic reports.
The website presents ‘Terms of reference’ for the partnership, stating the UK Government’s obligation under the Habitats Directive and the UK BAP to monitor mammal status. The Terms include a note that JNCC have distinguished between ‘surveillance’ (repeated counts to detect changes in abundance) and ‘monitoring’ (repeated counts, plus other data to identify causes of change). Interestingly, this definition of monitoring comes close to describing ‘conservation status’ as discussed earlier in this report. All in all, the Terms of Reference provide a more explicit rationale than any other wildlife-monitoring scheme in the UK or abroad. As well as monitoring distribution, abundance and population trends, the partnership aims to link these to potential causal factors such as habitat, climate and pollution. It is this marriage of biological parameters with external (potentially influential) factors that constitute conservation status as defined in the Habitats Directive.

101
Although the Tracking Mammals Partnership is the result of a thorough exploration of needs, intentions and aspirations, it is still in its early stages, and much remains to be done before the recording networks it aims to achieve are fully implemented. It currently includes the following species-group-based long-term monitoring schemes, periodic surveys and pilot schemes: • The National Dormouse Monitoring Programme (NDMP) (http://www.mtuk.org/).
This scheme is run by Royal Holloway, University of London, and the Peoples' Trust for Endangered Species (PTES). It collects annual data on occupancy, breeding success and population density from at least 30 nest boxes at 180 woodland sites (10% of known sites). Data have been collected nationally since 1991, and regionally since 1993; during which period parts of Britain have shown a 40% decline.
• The NBMP (see above). • Mammal Monitoring through the Breeding Bird Survey (BBS) coordinated and
funded by the BTO (http://www.bto.org/bbs/index.htm) and partners including JNCC. The inclusion of mammals in the BBS was a deliberate attempt to extend the scope of the scheme synergistically. BBS volunteers record any mammals that they see while surveying for birds, particularly medium to large mammals, although they can record any that they see. Preliminary analysis of the first six years’ data shows that they are sufficient to identify population trends for at least nine species of mammal, and they provide presence/absence data for various additional species.
• The National Game Bag Census (NGC) is operated and funded by the Game Conservancy Trust (http://www.gct.org.uk/text01.asp?PageId=163). It has collected its own data since 1961, but has collated data from historical sources extending back to the 19th century. As well as data on numbers of game species released and shot each year, it also keeps data on predatory species controlled to protect game interests.
• The English House Condition Survey (EHCS) run by the Department of Transport, Local Government and the Regions (DTLR) includes a Defra-funded survey of house mouse and brown rat in domestic dwellings. In 1996, about 12,000 properties were successfully surveyed out of 17,100 attempted; 0.23% had brown rats inside, 1.6% had them outside; and 1.83% had house mice. The survey is continuing annually from 2003, to monitor the occurrence of these species in English houses.
• National Otter Surveys. A series of otter surveys has taken place since the 1970s, approximately every seven years, at country level. Funded and operated by various organisations (largely the Environment Agency, the WTs and the SNCOs), they survey the same sites each time and use essentially the same methods to detect presence/absence. The data collected using current methods cannot be used to measure changes in abundance, but as they show changes in distribution, these have been interpreted as an indirect indication of population changes. The Fourth Otter Survey of England 2000-2002 recorded evidence of otter presence at 34% of 3,327 sites visited; or 35 of 28 50-km squares or partial squares surveyed. A summary is given at the website http://www.jncc.gov.uk/page-2784 which also recaps results of previous surveys.
• Mammals on Roads. This is a four-year pilot, run by the Mammals Trust UK (MTUK) (http://www.mtuk.org/) and PTES, to collect national roadkill data for selected species. It aims to calibrate roadkill numbers according to species abundance in various adjacent habitats, and to assess the power to detect population changes from these data. The survey takes place between July and September, and

102
participants (volunteers) drive a stretch of road (at least 20 miles) and record the count of mammal casualties they see.
• The Winter Mammal Monitoring Project is a three-year pilot run by the BTO and The Mammal Society (http://www.bto.org/survey/special/mammal_home.htm), and funded by Defra. Carried out by volunteers, it records winter sightings and field signs for various mammals, and aims to assess the feasibility of the surveys, sample sizes and species coverage. Participants are randomly allocated a 1km square within 10km of their home, in which they should decide a transect route that crosses the square twice and is therefore approximately 2km long. It should follow linear features such as hedgerows and footpaths where possible. The survey involves three transect walks between October to March, carrying out a habitat survey, sightings transect, and field signs transect respectively. Results so far suggest that it could provide reliable data on distribution and population trends for at least 11 species. A summary of the results from the 2001-2002 season, in which over 800 sites were surveyed, are shown at http://www.bto.org/survey/special/mammal_results.htm.
• A DNA library of cytochrome b sequences is being collected by the Forensic Science Service and various other partners. To date, it has sequenced 28 mammal species, and analysis of 16 bat species is under way (http://www.jncc.gov.uk/page-2807).
• Living with Mammals. This is a survey of mammals in the built environment, funded by PTES and run jointly with RHUL since 2003 (http://www.ptes.org/action/surveys.html). It runs from April to June each year, using volunteers supplied with a starter pack. It aims to assess numbers of mammals from sightings and signs, and records broad habitat types. 790 surveys were carried out in 2004.
• The BTO operates a Garden Mammal initiative as part of its Garden BirdWatch scheme (http://www.bto.org/gbw/mammals/index.htm). Funded jointly by subscriptions from participant householders and commercial sponsorship (CJ WildBird Foods Ltd), Garden BirdWatch records common garden birds but also produces a significant volume of mammal data, including species such as pine martens that are limited to certain parts of the country. It aims to assess the use of gardens over time, and according to garden type and geographical region.
• Mammals in your garden? This surveys is run by The Mammal Society, with media support from BBC Wildlife magazine and BBC Gardener's World magazine. It collects information on mammals and how they use gardens, with particular reference to the planning process. A water shrew survey: http://www.abdn.ac.uk/mammal/water_shrew_survey.shtml is also being carried out by The Mammal Society.
• The Great British Deer Survey is an initiative at the planning stages, which would be coordinated by the British Deer Society. It will comprise a distribution survey running on a five-year cycle, an annual density survey, and annual collation of third party data. http://www.deerstalker.com/british_deer_society.htm It aims to determine presence/absence of wild deer at the 10km square level, to ‘qualify status’, quantify demography of observations, and estimate deer density, abundance and changes in these over time. Interestingly, it also aims to identify links between presence and density, and environmental and management parameters.
Whilst not strictly part of the Tracking Mammals Partnership, the Vincent Wildlife Trust coordinates the current 2004-2006 Polecat Distribution Survey jointly with The Mammal

103
Society (http://www.abdn.ac.uk/mammal/polecat_survey.shtml). Based upon roadkill casualties, it uses records sent by volunteers to identify distribution. It is a follow-up to the 1993-1997 survey. 5 Proposed mechanisms for delivering surveillance and
monitoring objectives 5.1 General approach
5.1.1 Project design and management
The purpose of this report is to review the evidence based needed to inform knowledge on herpetofauna status, and to formulate proposals for a national surveillance and monitoring scheme. The term ‘NARRS’ has been used in a generic sense, during recent discussions and exploratory activities, to encapsulate the concept a national scheme, and it will be used here when referring to proposals for a national scheme, whether it is becomes a unified project or a banner under which multiple schemes could operate. English Nature’s note on herpetofauna surveillance data needs (Foster 2004) identified the data gaps in relation to the requirements according to each objective (see below). Adder was not identified as a priority by English Nature, but it is suggested here that it ought to be highlighted.
Purpose Species Int. features
on designated sites
BAP/ nationally
important spp
Widespread spp trends
Legal obligations
(Habitats Dir.)
Other tasks
Now Need Now Need Now Need Now Need Now Need Common frog Common toad Natterjack toad Pool frog n/a ? n/a n/a n/a Smooth newt Palmate newt Great crested newt
Common lizard Slow-worm Sand lizard Grass snake Adder ??? ??? Smooth snake Marine turtles The emphasis is equal on all widespread species in this table, but as discussed earlier, there may be variation in the level of effort required for some widespread species. Apart from the BAP and CSM reporting cycles, there is no need for any widespread species to be monitored more often than every six years, thus three-year or six-year cycles are possible.

104
The differing purposes for which information is needed mean that the type of information needed will vary from species to species, and the timescales dictated by the respective information needs complicate matters somewhat. These are essential considerations in designing NARRS, and cannot be tackled satisfactorily by the current contract. A preliminary development stage should be carried out, lasting between six months and a year, to construct an adequate and achievable design for NARRS. This would enable a more complete evaluation of the respective information needs, the most appropriate methods and approaches, the most efficient sampling strategies, and the most effective delivery mechanisms. Opportunities for public involvement and wider community benefits should be fully explored and built into any proposals. The scope for including education and learning, raising awareness and promoting greater appreciation and enjoyment of herpetofauna should be explored. The design phase would also enable the development of partnerships and a funding consortium in parallel to the design of the scheme. The relative merits of general casual recording versus formal conservation status monitoring would benefit from clarification before the design phase. Formal recording is the way in which most of the information needs discussed in previous sections would be met. Survey methods and protocols would be designed to answer questions that need to be answered, and to be delivered in the most cost-effective way. Formal monitoring under NARRS would probably involve a few thousand people, probably trained in survey protocols, operating as part of a sampling regime, carrying out several planned site visits during the right weather, times and season, recording parameters dictated on survey sheets, and submitting their records as required. The completeness, accuracy and overall quality of data would be crucial in order to maintain statistical power in the analysis stages. Informal or casual recording, conversely, may just involve the bare minimum of attributes that the NBN consider constitute a record: what, where, when, who (recorder). Such records have an intrinsic value for mapping presence/absence, and they can be useful to a certain extent in other ways for measuring density, occupancy and abundance patterns; but overall they are of less value than formally-structured monitoring. This low level of involvement is simple to achieve, and can be done with minimal understanding and knowledge (albeit with some limitations and doubts over reliability). It is also the type of involvement that is most accessible to the greatest number of people. It is quite feasible that tens of thousands of people, if not hundreds of thousands, could send in herpetofauna records if NARRS were: a) well enough packaged and publicised to generate household familiarity, and b) straightforward enough to submit records, eg via the internet. It may be assumed that a programme of formal monitoring will form the basis for NARRS, but that recording on a less formal level should be welcomed. It would be the greatest opportunity for public involvement, as well as generating large volumes of presence/absence data. Reptiles and amphibians are among the least familiar animals to most people in Britain. As well as suffering from a poor public image, most people do not encounter them frequently, and they are not as ‘popular’ as other animals such as birds and mammals. However, the HCT’s experiences with recruiting new volunteers as surveyors (via open days, presentations, student placements etc) show that given the opportunity, many people find great pleasure in seeing, learning about and becoming involved in herpetofauna survey and conservation. Many people already willingly offer their time to help with amphibian and reptile recording and conservation throughout the UK, not just in the ARGs dedicated to the conservation of these animals. NARRS could capitalise on this latent enthusiasm, with great conservation benefits, and with some clever planning, it could fulfil some social and political

105
goals too. It is no coincidence that likely major funding sources such as the Heritage Lottery Fund (HLF) are heavily focused on projects that fulfil the social inclusion remit. It is clear that the collection of data on a national scale could not be funded, coordinated and delivered by any one organisation. At least three dedicated full-time staff would be needed to run it, and probably more. NARRS would require the employment of at least one dedicated national coordinator, one or more facilitator(s) to support the recording network, perhaps contractors to train the volunteer workforce, and a data manager/analyst to process the data. Realistically, this would be expecting rather too much of too few people; pragmatically, it may have to be sufficient though. The overall coordinator would be responsible for, among other things, reporting to the respective partner organisations. The likely size of the recording workforce, and the extent of the geographical areas to be covered, suggest that delivery might also need to involve some local coordination. The experience of national schemes and local groups such as ARGs and toad patrols shows that even small-scale activities work best with a local coordinator or representative of some sort. Recent consultation at a workshop at the amphibian and Reptile Workers’ Meeting at Keele University (February 2005) suggested that volunteers appreciated having a local ‘face’ to deal with. Devolving responsibilities (and powers) does come with intrinsic problems though. First, it is reliant on finding suitably-dedicated people in all geographical areas, and with an extra link in the ‘chain of command’ it runs the risk of complicating coordination mechanisms rather than simplifying them. It would be most logical for marine turtle data collection to stay with MEM, and overseen by TIG. The reporting networks being developed by TIG produce data continuously, mostly on a casual basis but with some survey trips (Penrose 2004). Collecting data more systematically than this would involve major funding and organisation that is both beyond the scope of this project, and already being tackled by TIG and the INTERREG project. Therefore, marine turtle surveillance and monitoring may not feature in plans for NARRS, although there may be opportunities for synergy in promoting data gathering from the general public, boat users, fishermen etc. 5.1.2 Timescales and emphasis
Following on from the discussion in section 5.2, a three-year monitoring cycle seems the most sensible proposal for all except the rarest species, which should be monitored annually, although a six-year monitoring cycle is also an option for any lower priority species. Some species can be surveyed at the same time using the same methods, for example the newts and the widespread reptiles. This is an eminently sensible approach, but it would mean selecting a sufficiently large sample to cover all species in the group. The geographic range of all species in the group would have to be covered, although this that some part of the country would definitely not have all the target species. Careful consideration is needed into how best to spread the monitoring workload over time and across the voluntary workforce. Given that reptiles and amphibians will be monitored as separate exercises, and some further sub-division is likely (eg newts, anurans, rare vs widespread species), the monitoring workload already falls into several separate ‘work areas’. There is likely to be some overlap between the volunteers working on different work areas (eg amphibians vs reptiles), but perhaps not great. The geographic coverage of work areas also varies (eg rare species have only restricted distributions). There are two main options for delivering different work areas, hinging on whether they run consecutively and concurrently.
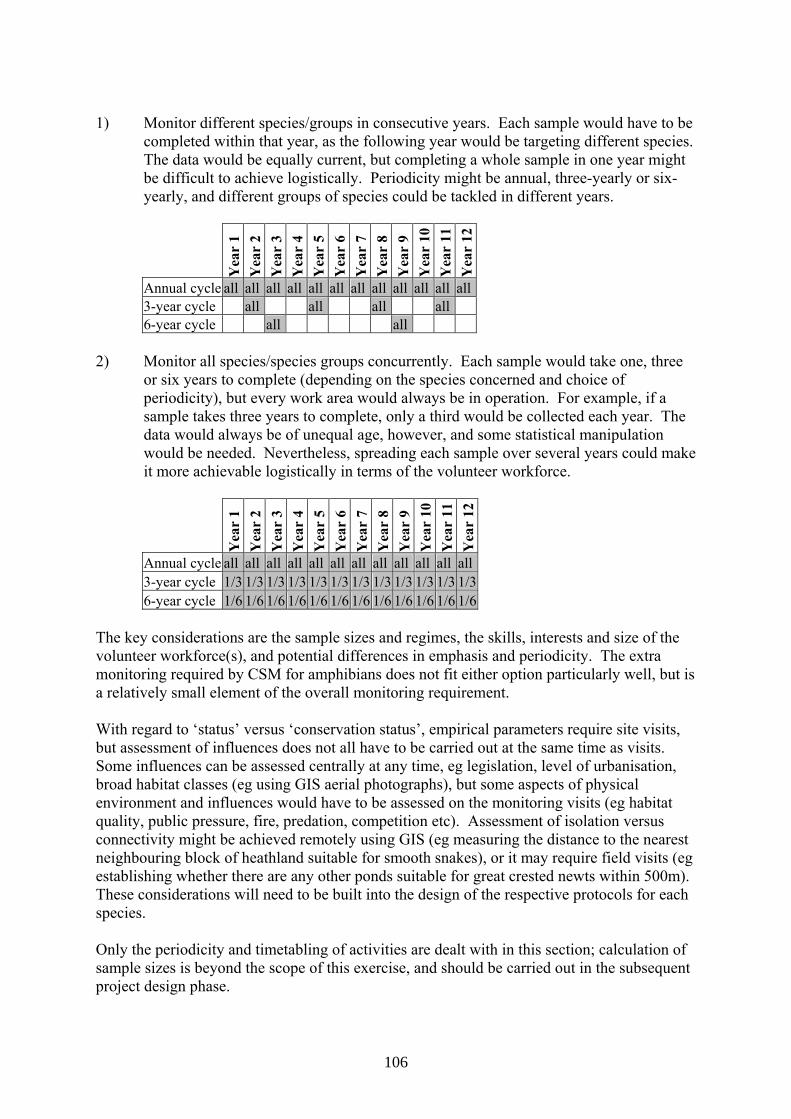
106
1) Monitor different species/groups in consecutive years. Each sample would have to be
completed within that year, as the following year would be targeting different species. The data would be equally current, but completing a whole sample in one year might be difficult to achieve logistically. Periodicity might be annual, three-yearly or six-yearly, and different groups of species could be tackled in different years.
Yea
r 1
Yea
r 2
Yea
r 3
Yea
r 4
Yea
r 5
Yea
r 6
Yea
r 7
Yea
r 8
Yea
r 9
Yea
r 10
Y
ear
11
Yea
r 12
Annual cycle all all all all all all all all all all all all3-year cycle all all all all 6-year cycle all all
2) Monitor all species/species groups concurrently. Each sample would take one, three
or six years to complete (depending on the species concerned and choice of periodicity), but every work area would always be in operation. For example, if a sample takes three years to complete, only a third would be collected each year. The data would always be of unequal age, however, and some statistical manipulation would be needed. Nevertheless, spreading each sample over several years could make it more achievable logistically in terms of the volunteer workforce.
Yea
r 1
Yea
r 2
Yea
r 3
Yea
r 4
Yea
r 5
Yea
r 6
Yea
r 7
Yea
r 8
Yea
r 9
Yea
r 10
Y
ear
11
Yea
r 12
Annual cycle all all all all all all all all all all all all3-year cycle 1/3 1/3 1/3 1/3 1/3 1/3 1/3 1/3 1/3 1/3 1/3 1/36-year cycle 1/6 1/6 1/6 1/6 1/6 1/6 1/6 1/6 1/6 1/6 1/6 1/6
The key considerations are the sample sizes and regimes, the skills, interests and size of the volunteer workforce(s), and potential differences in emphasis and periodicity. The extra monitoring required by CSM for amphibians does not fit either option particularly well, but is a relatively small element of the overall monitoring requirement. With regard to ‘status’ versus ‘conservation status’, empirical parameters require site visits, but assessment of influences does not all have to be carried out at the same time as visits. Some influences can be assessed centrally at any time, eg legislation, level of urbanisation, broad habitat classes (eg using GIS aerial photographs), but some aspects of physical environment and influences would have to be assessed on the monitoring visits (eg habitat quality, public pressure, fire, predation, competition etc). Assessment of isolation versus connectivity might be achieved remotely using GIS (eg measuring the distance to the nearest neighbouring block of heathland suitable for smooth snakes), or it may require field visits (eg establishing whether there are any other ponds suitable for great crested newts within 500m). These considerations will need to be built into the design of the respective protocols for each species. Only the periodicity and timetabling of activities are dealt with in this section; calculation of sample sizes is beyond the scope of this exercise, and should be carried out in the subsequent project design phase.

107
5.1.3 Different work areas in consecutive years
Monitoring of species groups could be divided such that each year has a different focus within a three-year cycle. A possible division of labour would be to monitor rare species in one year, widespread amphibians the next, and widespread reptiles in every third year. It would mean that the whole dataset for each species or group of species was collected in the same year, thus giving data the advantage of comparability and independence from any inter-year differences. The workload would depend ultimately on the sampling strategy adopted for each species, but it might prove unworkable if the sample sizes were too large for the available workforce to achieve. Also, whilst there would be some overlap between the widespread amphibian, widespread reptile and rare species workforces, there would be a major change of personnel every year. Hence, even if there were three separate workforces, they might be unable to achieve the sample sizes demanded of them in their respective years of operation. If there were no differences in emphasis between widespread species, variations in periodicity would not be an issue, and the same workload would be repeated every three years. If there were different emphases as discussed earlier, some species would only feature in alternate three-year cycles. The tables below demonstrate the two approaches. The first is based upon annual monitoring for all rare species and an equal emphasis for all widespread specie; the second shows less rare species monitoring, a differential emphasis within the widespread species, and a lesser emphasis on non-native species.
Cycle 1 Cycle 2 Cycle 3 Cycle 4 Consecutive, option 1 2006 2007 2008 2009 2010 2011 2012 2013 2014 2015 2016 2017 Reporting EC BAP BAP EC BAP BAP
Natterjack toad ● ● ● ● ● ● ● ● ● ● ● ● Pool frog ● ● ● ● ● ● ● ● ● ● ● ● Sand lizard ● ● ● ● ● ● ● ● ● ● ● ● Rare species
Smooth snake ● ● ● ● ● ● ● ● ● ● ● ● Great crested newt * ● ● ● ● Smooth newt * ● ● ● ● Palmate newt * ● ● ● ● Common toad * ● ● ● ●
Widespread amphibians
Common frog * ● ● ● ● Common lizard ● ● ● ● Slow-worm ● ● ● ● Grass snake ● ● ● ●
Widespread reptiles
Adder ● ● ● ● Water frogs ● ● ● ● Bullfrog ● ● ● ● ● ● ● ● ● ● ● ● African clawed toad ● ? ? ● ? ? ● ? ? ● ? ? Red-eared terrapin ● ● ● ● Wall/green lizard ● ? ? ● ? ? ● ? ? ● ? ?
Non-native Species
Other species ● ? ? ? ? ? ● ? ? ? ? ? Marine turtles All five species ● ● ● ● ● ● ● ● ● ● ● ●
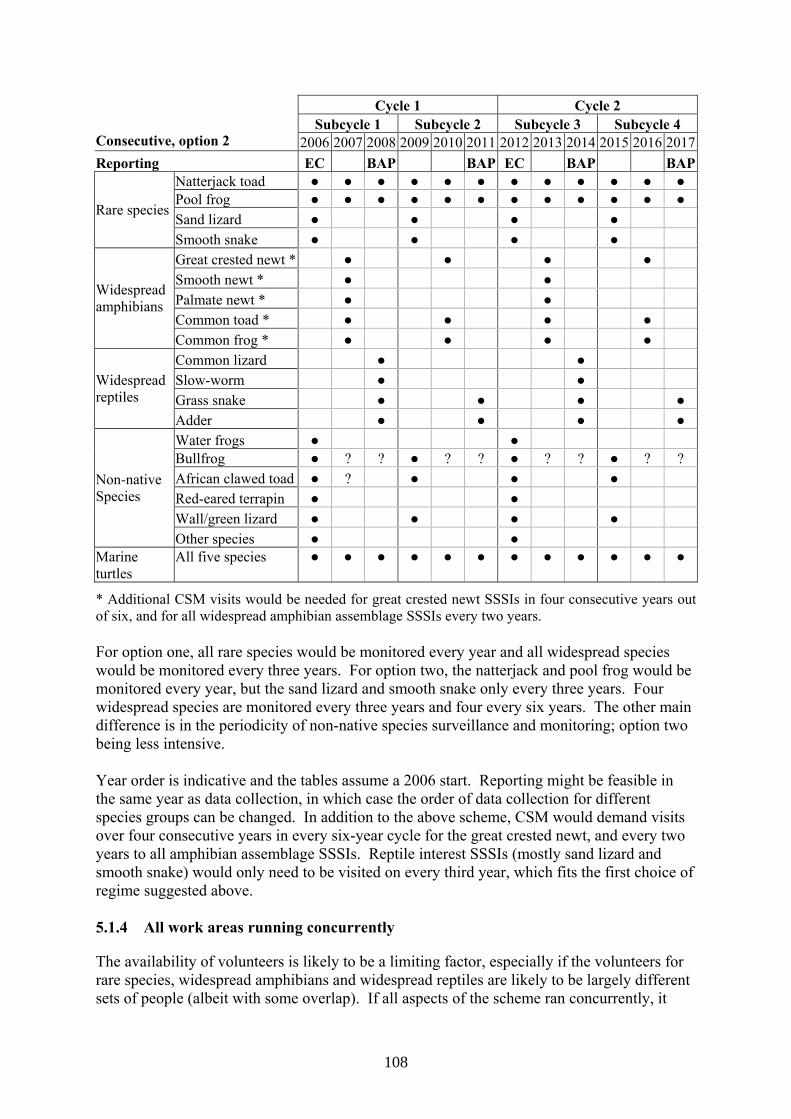
108
Cycle 1 Cycle 2 Subcycle 1 Subcycle 2 Subcycle 3 Subcycle 4
Consecutive, option 2 2006 2007 2008 2009 2010 2011 2012 2013 2014 2015 2016 2017Reporting EC BAP BAP EC BAP BAP
Natterjack toad ● ● ● ● ● ● ● ● ● ● ● ● Pool frog ● ● ● ● ● ● ● ● ● ● ● ● Sand lizard ● ● ● ●
Rare species
Smooth snake ● ● ● ● Great crested newt * ● ● ● ● Smooth newt * ● ● Palmate newt * ● ● Common toad * ● ● ● ●
Widespread amphibians
Common frog * ● ● ● ● Common lizard ● ● Slow-worm ● ● Grass snake ● ● ● ●
Widespread reptiles
Adder ● ● ● ● Water frogs ● ● Bullfrog ● ? ? ● ? ? ● ? ? ● ? ? African clawed toad ● ? ● ● ● Red-eared terrapin ● ● Wall/green lizard ● ● ● ●
Non-native Species
Other species ● ● Marine turtles
All five species ● ● ● ● ● ● ● ● ● ● ● ●
* Additional CSM visits would be needed for great crested newt SSSIs in four consecutive years out of six, and for all widespread amphibian assemblage SSSIs every two years. For option one, all rare species would be monitored every year and all widespread species would be monitored every three years. For option two, the natterjack and pool frog would be monitored every year, but the sand lizard and smooth snake only every three years. Four widespread species are monitored every three years and four every six years. The other main difference is in the periodicity of non-native species surveillance and monitoring; option two being less intensive. Year order is indicative and the tables assume a 2006 start. Reporting might be feasible in the same year as data collection, in which case the order of data collection for different species groups can be changed. In addition to the above scheme, CSM would demand visits over four consecutive years in every six-year cycle for the great crested newt, and every two years to all amphibian assemblage SSSIs. Reptile interest SSSIs (mostly sand lizard and smooth snake) would only need to be visited on every third year, which fits the first choice of regime suggested above. 5.1.4 All work areas running concurrently
The availability of volunteers is likely to be a limiting factor, especially if the volunteers for rare species, widespread amphibians and widespread reptiles are likely to be largely different sets of people (albeit with some overlap). If all aspects of the scheme ran concurrently, it

109
could be a more efficient use of the volunteers, perhaps needing fewer of them overall, by using all of them every year. The downside is that data would always be of composite ages, and therefore not independent of time. At any one point, a third of data would be three years old, a third would be two years old, and a third would be one year old. Statistical methods could be employed to extrapolate the non-current data, however, to bring them all into line for analysis and reporting. The following tables show this concurrent approach, with species grouped (vertically) if they are to be monitored together, and spread over one or three years (horizontally) to show the length of their monitoring cycle. For example, for a group such as the newts, data collection would be spread over three years, and a third of sites would be monitored each year. Reporting years are marked ‘R’.
The marine turtles are essentially on a different monitoring platform as most turtle records are gathered casually and continuously.

110
As well as natterjack toad and pool frog being monitored every year, reintroductions of sand lizard and smooth snake might need to be monitored every year, at least in the first few years. However, visits every three years would probably gain the same insights. CSM will require visits in four out of every six years for great crested newt SSSIs, and every two years for amphibian assemblage SSSIs. Reptile interests are only to be monitored every three years, hence CSM does not affect the proposed regime. The following table shows the extra CSM sampling requirement in pink.
CSM therefore complicates the amphibian-monitoring regime with visits needed in additional years. With careful scheduling, no extra reptile visits are necessary. The relatively small number of great crested newt SSSIs means that only about 35 out of a sample size of perhaps 350 for England (based on an estimate of 400 sites for Britain) would need to be monitored more often than every three years. The 15 amphibian assemblage SSSIs would need visits

111
every two years, but out of an overall sample size possibly numbering in thousands, this is a small amount of extra effort. A differential emphasis on some widespread species (eg six-year regime) would have the effect of splitting newt survey and widespread reptile survey. The stratified sample for great crested newt would be different from that chosen to cover all three species of newt; the same goes for separating the grass snake and adder from the other widespread reptiles. Essentially, recorders would be expected to record only the target species although they may see others. Differential emphasis therefore adds an extra layer of complication when it might not cost too much extra to place all (except the rarest) species on the same three-year sampling cycle. Non-native species surveillance and monitoring could be operated differently, but costings have not been requested for them in this exercise. After considering the ‘consecutive’ and ‘concurrent’ options, the most efficacious proposal seems to be to run all monitoring concurrently on a one- or three-year cycle. CSM for the widespread amphibians (including great crested newt) will require visits on additional years to a subset of sites. 5.2 Collection of data
Virtually all previous studies of the status of UK herpetofauna have relied almost entirely on the use of volunteers, and any future scheme will need to rely on volunteers too. The reason this works is that volunteers positively enjoy being involved in survey work, and they want to give their time freely within reason. No scheme would work if it asked so much of the participants, or dictated such strict protocols that the ‘fun’ element was taken out of it. Certain aspects of NARRS might require the use of professional herpetologists, but the financial implications of all data collection being carried out in this way would be prohibitive. There are several circumstances where the use of professional herpetologists might be necessary: • If volunteers cannot offer sufficient time commitment • If volunteers cannot offer sufficient skills • If there are insufficient volunteers in certain geographical areas • If sensitivities demand professional involvement The first two depend to a large extent on the choice of methodologies and sampling regimes, but the third might be unavoidable to achieve a complete geographic coverage. The fourth may apply in an example such as the pool frog where confidentiality exists over the location of the proposed reintroduction site, and certain contractual obligations might need to be in place. NARRS would have to be coordinated centrally (nationally) overall, but it is worth considering whether it would benefit from a network of local ‘nodes’, facilitating data collection and managing the logistics of delivery at a local level. If a formal network of local nodes were used, and each had its own coordinator, these individuals would need the time, ability and inclination to carry the responsibility without being paid (although facilities and support could be provided, and payment of expenses might be an option). With 48 pre-unitary county areas in England (pre-unitary counties being the typical geographical units

112
covered by ARGs), it would be difficult to find keen and capable local coordinators for all of them – especially given that if these people existed they would probably already have formed ARGs in their respective counties. There would also be inherent risks with this approach, particularly the delegation of too many responsibilities to too many parties. The alternative would be a much more intensive central coordination operation, dealing directly with recorders. Using the internet for data collation would be the most obvious way of collating data centrally without using local nodes. Distribution of workload from only one central point might be difficult, however, especially if ad hoc decisions were required locally on the ground, for example to re-assign work if people dropped out unexpectedly. If all recorder management had to be coordinated centrally, the workload of one or several national facilitators might be unmanageable. Perhaps it might be more realistic to have a network of reliable local representatives to act as local ‘eyes and ears’ and to trouble-shoot problems. Depending on the number of recorders that each had to deal with, and the level of input required, this approach might not be too onerous for them. The ARGs could provide the focal point for this. The training of recorders (and coordinators or representatives) is a potentially complex issue. In order to minimise recorder bias, and maximise data quality, all recorders would need the same level of training. If first-hand experience of the species and habitats in question were necessary, training events would be necessary. If training could be provided via printed instructions, in much the same way as most mammal and bird schemes operate, then attendance on training events could be avoided, and a significant saving on cost would be achieved. It is difficult to see how attendance at events could be avoided though. Licensing for great crested newt and other protected species survey would normally require direct experience of the animals and the techniques. As well as being a pre-requisite for the issue of licences, having adequate previous experience is promoted as best practice by NGOs, SNCOs and other statutory agencies. Signing up untrained licensees could therefore set a bad precedent. Nevertheless, it is possible that a blanket licence could be issued for all participants in NARRS (J. Foster, pers. comm.). Furthermore, it is difficult to see how participants in reptile surveys could be taught fieldcraft without an interactive taught event and a field visit. Hence, although the cost of training on a national scale would be quite significant, this element needs to be anticipated. It is also clear from the recent ARG questionnaire survey and workshop that one of the key benefits they would anticipate from NARRS is the provision of training. As will be seen later, the logistics of organising sufficient training events could be complex, but the cost is not unduly large. It is also possible that the cost could be largely avoided if voluntary trainers could be found. Any training provision would need to be managed centrally, but some aspects of delivery could be devolved and this needs further consideration. The size of classes on training courses would have to be limited to a manageable size, which will influence the number of courses needed. It is difficult to predict the number of recorders needed nationally, but it is likely to be several thousand. The number of people trained would have to be greater than the number needed, simply because some would drop out after training. The geographical spread and density of recorders in each area cannot be calculated until sample sizes are calculated, but it is likely that at least one one-day training event would be needed for each (pre-unitary) county. This is assuming that a single training event could cater for all the potential recorders in any one county (very unlikely in some areas). This would amount to 48 days of training for England alone, not including the trainer(s)’ travel time. Several additional events would be needed for Wales, and several more for lowland Scotland.

113
Highland Scotland would probably need an entirely different approach, due to the sparseness of the human population there, the geographic isolation of some areas that would inevitably need to be surveyed, and the greater travel times. The training schedule would probably have to be repeated each year, as inevitably there would be a significant turnover of volunteers. Reptile and amphibian training would probably have to involve separate events on different days and in different locations. Even if they were held on the same day, covering the whole of Britain would require at least 60 training events, and perhaps up to 200. Looking from a different perspective: if up to 3,000 volunteers were needed, and course sizes were limited to 30 participants (15 would be better), at least 100 events would be needed. Given that separate events would be needed for amphibian and reptile survey, and each may involve largely different volunteer bases, an estimate of 200 courses seems entirely plausible. If training had to involve direct field experience of the animals to be surveyed, it would be impossible for one person to fit all the events into one spring season. Factoring in the unreliability of the weather, travel times to and from events, and the need to schedule courses on specific days (ie days that suit the participants and the venues – probably weekends), then the logistics become impossible even for several trainers. Therefore, with such timetable and practical constraints, there is a good case for using contractors – perhaps 20 is a reasonable estimate - to deliver the training events. The events could still be organised centrally by the volunteer facilitator post(s), but this would be logistically demanding, and perhaps an element of the organisation could be devolved to the trainers – either arranging the venue and dates, or registering the participants. Using fixed-term appointments to employ a team of trainers would be unworkable for such a short period. Contractors, on the other hand, could be hired for a fixed number of days (perhaps 10 days each), during which they would be expected to deliver a series of training courses within seasonal and other constraints. This would allow flexibility over timetabling the courses, and would be a more efficient use of time and money than fixed-term appointments, as the trainers would only be paid for the days on which they prepared and delivered events. It might be argued that training would be more consistent if given by the same person everywhere, but there would be evolution in the quality of training given by any one person after delivering dozens of courses anyway. One or two training events would be needed to ‘train the trainers’ in order to establish a consistent approach. At least one full-time national volunteer-support post would be essential, with the role of managing and liaising with the recorders or their local representatives, distributing work, ensuring it is carried out, overseeing data collation, quality control, and being available for other purposes as required. The post would be demanding, and the possibility of having more than one volunteer-support post needs to be considered, either covering different geographical areas, or dividing their roles. Siting two equivalent posts in different parts of Britain would potentially cut travel costs. As discussed above, survey instructions and workload could be distributed either centrally or by local representatives; there are merits in both methods. If it were managed locally, the local representatives might be better placed to re-distribute workload if recorders dropped out, or deal with other contingencies that might arise. Even if local representatives were not used, local verification might be useful to ensure that sampling is carried out satisfactorily, identifications are correct, and that data are submitted in a standardised way. Either way, it is
114
clear that the need for contact with the central coordination team ought to be kept to a minimum; otherwise it might not be able to cope with potentially thousands of enquiries. Unless a volunteer network was developed from scratch, the only realistic basis for a volunteer workforce is the ARG network. However, the great crested newt PMP (Baker 2003) found that relatively few of its participants were already ARG members. This is encouraging as it shows that new volunteers can be recruited through promotion, even where there are pre-existing ARGs. Whilst the ARGs are effective focal points for people already interested in herpetofauna conservation, they are not on the whole able to effectively publicise their activities county-wide. This is probably just a resource issue, as few ARGs have the capacity to dedicate time to recruitment and publicity. Even in Kent, where one of the most active ARGs - Kent Reptile and Amphibian Group (KRAG) - operates, the PMP found that most volunteers were not previously KRAG members. In Glamorgan, there was no ARG when the PMP operated there, although the beginnings of a group are now forming. The ARGs are self-governing, and most are formally constituted and membership-based. Froglife act as their secretariat, and a committee known as the HGBI (Herpetofauna Groups of Britain and Ireland), made up of regional representatives and other advisers, meet once a year (although this arrangement is under review). The ARG network is not centrally funded, although Froglife provide support in kind. The network currently has incomplete geographical coverage and great variation in membership between groups. There are 44 ARGs listed on the Froglife website (http://www.froglife.org/ARGs/ARGs.htm). A questionnaire survey sent to representatives of all of them (as part of this contract) generated 22 replies, 20 of which were still active groups and two of which were defunct. The responses indicated overwhelming support for NARRS, and a general willingness to engage with the design and development process. Most of the ARGs expressed reservations about their capacity for involvement, but generally felt that this issue could be overcome given sufficient financial and logistical support. Very few, if any, ARGs could deliver NARRS with their current membership, and a targeted recruitment drive would be needed before there were sufficient recording members. This would obviously need to operate in close cooperation and consultation with the ARGs. On a national scale, at its current capacity, the ARG network could supply a significant proportion of the recording workforce. In the questionnaire consultation, each ARG was asked the size of its membership, how many of those are active recorders, and the potential for recruitment of new members. Membership size varies widely, from less than five in Fife, to 280 in Hampshire where membership is free via a large contact list maintained by the Wildlife Trust (although this does not reflect activity). Most groups have 20-50 members, but differences in the structure of groups means that the concept of membership is not applicable in the same way to all. According to the questionnaire results, the total ARG membership is about 800, with approximately 200 active recorders. Nearly all groups were positive about the potential to attract new members and increase recording activity, although this would generally require external support. Invariably, the ARGs would welcome support and funding from NARRS anyway. Suffolk ARG felt that it might be easier to find new recorders by strengthening links with other wildlife recording groups, especially as many people are already heavily committed to other groups and projects (J. Baker, pers. comm.). In Kent, there are active recorders outside the ARG; the county recorder collates records from around 30 people who record herpetofauna but are not KRAG members (G. Fairchild, pers. comm.). Some groups noted that encouraging more activity

115
among the existing membership would increase recording output. Naturally, a national scheme such as NARRS would provide a focal point for generating renewed interest and activity. The ARGs were also asked what the most important considerations were if they were to be involved in NARRS. In addition, the workshop at the Amphibian and Reptile Workers’ Meeting in February 2005 generated important points. The key issues are summarised as follows: • Keep recording forms simple, use effective and consistent methods, and streamline
record collation. • Liaise with other recording schemes, coordinate data exchange with LRCs and others,
communicate with BAPs and other initiatives. • Clear data ownership and access mechanisms, data access for all participants. • Good feedback to ARGs, regular updates on progress at local and national scales. • Sufficient financial support, support in kind, and training, to enable recruitment of
active recorders. • Realistic and achievable targets relative to ARG capacities. • Recording sites should not be too far away. • Travel expenses may be necessary. • Provide forum for discussion between ARGs, although travel distance a likely issue. The need for feedback mechanisms is important. This could be via publication of newsletters, email updates, reports, website and other media, but equally or more importantly by the organisation of local, regional and national meetings. The meetings would essentially be like those that the ARG network holds today (albeit with more consistency and complete coverage). The annual Herpetofauna Workers’ Meetings (originating from the Herpetofauna Recorders’ Meetings of the 1980s) are well-attended, and provide a valuable means for recorders to get together, listen to presentations, share experiences and socialise. Regional HGBI meetings are less consistent in their occurrence, and local ARG meetings are highly variable from county to county. Events such as these should be financially supported by NARRS. Given that there is clearly overwhelming support for NARRS among the ARGs, the only real issues are the feasibility of increasing the size of the network and providing the steer and support that they require. If 3,000 volunteers were needed for NARRS, this would require almost a four-fold increase in membership nationally, and a fifteen-fold increase in active recorders. Most ARGs were interested in being consulted further on the design of NARRS, time and resources permitting. A few groups were keen to participate as much as possible, for example to be involved in any pilot studies that might take place. In case sufficient recorders cannot be found in all areas of the country, it would be wise to consider alternative sources of volunteer capacity in some areas, to bolster the ARG network and to fill geographical gaps. As suggested by some of the ARGs, this would be a wise move anyway. In some geographical areas with low human population densities, such as northwest

116
Scotland, ARGs would be difficult to initiate and capacity would be difficult to sustain. In these areas, NARRS might need to utilise existing wildlife recorder networks, or target holidaymakers through special interest publications and societies. The British Trust for Conservation Volunteers (BTCV) is one option for additional volunteer capacity. There are also opportunities for partnerships with other wildlife NGOs and their volunteer networks in the delivery of herpetofauna recording. The BCT has a volunteer recorder network that could potentially get involved with evening amphibian surveys whilst carrying out bat surveys (C. Catto, pers. comm.); the HCT is discussing the potential for partnership. The WTs, RSPB, BTO, Butterfly Conservation (BC), Botanical Society of the British Isles (BSBI), the Tracking Mammals Partnership and others have volunteers operating all over the UK; and possible volunteer sharing should be investigated where necessary. Pond Conservation (PC)’s National Pond Monitoring Network (NPMN) will involve national stratified samples of ponds to monitor aquatic vegetation and invertebrate indices known as the ‘Predictive System for Multimetrics’ (PSYM) method (Pond Action 2000; Williams and others 1998). The HCT is represented on the ‘Ponds in Partnership’ (PiP) project board, and is discussing potential areas of overlap and partnership opportunities with PC. Skilled PSYM users could be recruited to record amphibians, but for amphibian recorders to reciprocate would require significant plant identification skills (J. Biggs, pers. comm.). As well as a formal recording network and sampling regime, it might be considered worthwhile to operate campaigns aimed at the general public, and or specific interest groups of people such as the Ramblers’ Association or wildlife and outdoor magazine readers. The purpose might be to cast a wide net to gather as much distributional data as possible, whether according to strict survey protocols or not, or to increase awareness and publicity for herpetofauna and the NARRS scheme overall. Such initiatives might be delivered by a different mechanism than the stricter monitoring elements of NARRS, perhaps as a web-, media- or leaflet-based survey, as and when appropriate. A mechanism for gathering casual records continuously would be advantageous in any case, to increase coverage of simple presence/absence records, to promote interest in herpetofauna recording, and to increase general awareness/appreciation of herpetofauna. 5.3 Sampling strategies, sample sizes and power
The involvement of a professional statistician has been identified as a necessary element to the designing of sampling regimes, as part of the design phase of NARRS. It is difficult to predict how much professional involvement would be needed from a non-herpetologist (some herpetologists have a good statistical understanding already), but it would probably take the form of a contract to provide a fixed number of days’ work. 5.3.1 Sample size and power
Further work is needed on estimating the total numbers of populations for each species first, to feed into statistical power analyses. Power is the ability to make confident conclusions from the information available. To achieve power, the sample size must be big enough allow confident extrapolation of status measurements to the whole population. The most powerful approach would be to sample all sites, but this would not be achievable for all but the rarest species. Achieving an 80% power level (probability) is generally used as an acceptable level. Note that this is a different concept to that of statistical confidence.
117
A reasonable idea of sample size requirements to achieve sufficient power for some species could be gained from previous work. Baker and others (2004) employed a statistician to calculate sample size for a national monitoring programme. This presumably used pre-existing estimations of the overall number of great crested newt breeding sites, an estimation of average population turnover, proposed methodologies, and experience of a previous survey. Based upon an estimate of the total number of populations in Britain, they calculated that to achieve 80% power with a 5% annual population turnover, a sample size of 400 was required. In order to perform power analysis on every species, it would be necessary to estimate the total number of populations for each nationally. This has recently been attempted for the three rare species (Gleed-Owen 2004a), but the literature is not as helpful in estimating the current number of populations for most of the other species. The population density estimates of Swan and Oldham (1993a,b) are the last available information on a national scale. The comparative densities for each species could be used to estimate overall numbers of populations, but it would involve an assumption that the same relative numbers exist today. If some species have declined faster than others (ie a greater proportion of populations have been lost), this assumption would be invalid. The palmate newt may have a similar number of populations to the great crested newt (as found by Swan & Oldham 1993a). Populations of the smooth newt and the common anurans are likely to be more numerous, possibly several-fold for the common toad and smooth newt, and perhaps ten-fold for the common frog. Again, this is largely guesswork and would need further research and survey to calculate sample sizes properly. The number of widespread reptile populations is even more difficult to assess. The total number of grass snake populations might be similar to that of the great crested newt, especially as its absence from Scotland mirrors the general absence of great crested newts from northern and western Britain. Populations of the common lizard are probably more numerous though. Slow-worms may also be more numerous in population numbers, but they are more widespread, albeit patchy, and could conceivably have a similar number of populations as the great crested newt. Adder populations may be less numerous, and are certainly sparse in much of lowland England, but the wider distribution overall might make up for this. For the purposes of this exercise, rough estimates of sample size are proposed, and used in the costings exercises. In the absence of better information, a similar national number of populations as the great crested newt will be assumed for the palmate newt; a larger number for the common lizard, slow-worm, grass snake and adder; and a larger number still for the smooth newt and widespread anurans. 5.3.2 Detection probability
A key factor in analysing the reliability of distribution and abundance data is the analysis of detection probabilities (Schmidt 2004; B. Schmidt, pers. comm.). Detection probability for counts (of sites or individuals) is between 0-1, and it can be presented as p in relation to observed count C and true number N: C = Np or C = N/p
For example, the probability of missing a species is 1 – p, and the probability of missing it after multiple visits is (1 – p)(1 – p) or (1 – p)n.

118
Detection probability p can be approximated through various ‘known’ factors, using AIC (Akaike’s Information Criteria) to model the importance of each in explaining probability. As discussed earlier (Pellet & Schmidt 2005), this can be used to calculate the minimum number of visits required to achieve 95% confidence in detection levels – provided that the chief environmental and phenological determinants can be isolated. This is perhaps easier to define for the amphibians than for the reptiles, in terms of climatic variations. However, there is a potential application for reptiles, where occurrence should be more strongly related to habitat variables, and to a lesser degree to season and time of day. Modelling detection probabilities for reptiles should help separate the influences of habitat, seasonal, circadian and climatic variables. The relative influences of climatic variables on reptile detectability have not been sufficiently examined to discount their utility in predicting reptile detection. It certainly has not been tackled using Bayesian-style multiple models such as those used by (Pellet & Schmidt 2005). By taking a consensus on the most important influences on the detectability of reptile species, and ranking and weighting them using AIC (or ANOVA for individual factors), the potential for isolating various factors could be identified (B. Schmidt, pers. comm.). Candidate factors would include: air temperature, relative humidity, cloud cover, brightness, atmospheric pressure, recent rain, hours of sunshine so far, wind speed, wind direction, and weather over recent days - the latter is potentially complex and would need to account for a combination of several days’ weather. Seasonal position (day in season) and circadian rhythms (time of day) should be modelled too. Given that ground temperature is known to be highly variable over very short distances, it is essentially a stochastic influence over reptile activity. It would be impossible to generalise ground temperature for a site visit, and therefore it would be a worthless element in any model. If the combined multivariate models concluded that they could not satisfactorily explain reptile detectability and that soil temperature is too important to discount, then it would have to be reluctantly accepted that reptile detectability involves too much stochasticity and the environmental influences cannot be modelled. The importance of seasonality in detecting reptiles is well known, and ways of accounting for it statistically should be explored. ‘Day in season’ could be used as a measure of distance (in time) from the average emergence date, or distance to or from the average date of peak sightings. If the detectability of a species is known to peak around a certain point in the spring, perhaps declining with a normal distribution around this date, then a quadratic equation could be used to model it (B. Schmidt, pers. comm.). The slope could be calculated by running a regression on previously collected data. If the number of animals seen is a function of the day in the season, ‘days squared’ would be used to find the function and identify the peak (N = ∫(D2). For a species such as the sand lizard that shows a distinct spring detection peak, low summer visibility, and a lesser autumn peak, an ANOVA could be performed for each season. In any case, it is likely that monitoring would focus on the spring peak for sand lizards and adders (and possibly slow-worm and common lizard); and as the survey season would probably be spread over three months (March-May) to be achievable, ‘distance from peak’ should be employed to help calibrate sightings data. For the other reptiles, the summer appears equally good for detection and, providing the environmental conditions are properly accounted for, monitoring could be spread over the whole spring and summer.

119
5.4 Transfer to electronic format and geo-referencing
There are at least three options for how the data might be digitised and forwarded to the national data manager: • Records digitised locally and forwarded electronically to national data manager • Records forwarded as hard copy to national data manager for digitisation • Records digitised locally via web interface to national database For the first option, the local coordinators would have to manage data collation and quality control, and either do all the digitisation themselves or find voluntary help (possibly including the recorders themselves). The key considerations would be to ensure that all data are collated, properly digitised, validated and quality controlled. This would be a large workload for any person, and there are clearly significant risks. For example, coordinators might not have enough time, other unforeseen circumstances might arise, and previous experiences of the HGBI and TOR scheme show that significant local resource commitments are necessary to hold together a functioning network. The second solution would require an unmanageably large volume of digitisation at a central location unless the data could be read automatically by machine. The BTO uses this method and has a machine that reads recording sheets in this way. It has also been used for the NBMP and National Brown Hare Survey (J. Foster, pers. comm.). This method still relies upon collation and posting of large volumes of recording forms, either by the recorders sending them, or via local coordinators collating and sending them in batches. Validation would still be a problem though (if it were deemed worthwhile and necessary), both logistically and because a central team would lack local knowledge. The simplest mechanism, logistically, would be web-based data entry. Developing an appropriate web interface and hardware capacity would involve significant costs, but it would remove the need for collation and forwarding of records in paper and other formats, posting them, emailing them, managing them etc. The main downfall with relying solely on the internet is that not everyone has access to it and the ability to use it. However, with free internet access at most public libraries today, access should not be a problem in all but the remotest areas; and for those without computer skills, they could find an acquaintance that does have computer skills. Although a web interface would allow recorders to enter their own data on their own computers, a network of local coordinators or representatives might still have a useful role in overseeing the process, particularly in validating records. Validation is typically performed by the relevant country recorder, using their local knowledge to remove obviously spurious records. However, this approach is arguably far too subjective. As validation is also logistically difficult, many national non-herpetofauna schemes simply accept unvalidated data and deal with the issue statistically. With all three options there are significant IT costs, and potential implications for GIS basemap licensing if free usage could not be provided by SNCOs or other agencies. A sufficiently powerful central computer would be necessary to hold the database, and if GIS were to play an important part (eg mapping of habitat and distribution of sightings), to accommodate national coverage of GIS basemaps and aerial photography. In addition, if

120
local nodes were to be involved, they would need computer facilities, although LRCs or other existing facilities could perhaps be used. 5.5 Collation of data from different collection nodes
As discussed above, there are several technical solutions for gathering data from recorders to a central point. Depending on whether the recorders pass their data directly to the national coordination unit (directly or via a web interface), or via local coordinators, the collation of data (and distribution of workload in the first instance) could be carried out in two main ways: 1) From a central national point 2) From local or regional points The latter would be logistically very difficult, but during the consultation workshop, many volunteers expressed a preference for having at least a local representative of some sort, to communicate with. If this latter system is used, each local representative would coordinate all recording activities in their area, and all volunteers would take their instructions from them. They would be responsible for liaising with the national coordinator, distributing workload among their local volunteer force, managing logistics, timescales and expenditure, collating and quality controlling records, and forwarding them in the agreed fashion to the national coordination centre. The local coordinator would also serve as the point of contact for any problems and advice. It would be essential, therefore, for each local coordinator to be a highly motivated individual, and as discussed already, this is perhaps unrealistic to expect. They would need to be experienced herpetologists, although their organisational and people skills would be equally important factors. It might help if there were also ‘deputy coordinators’ to operate as back-ups, share workload, and to answer questions beyond the ability of the primary coordinator. Clearly it would be difficult or impossible to find a sufficiently reliable and comprehensive network of local coordinators. In reality, most of the work distribution and data collation duties would probably have to be managed nationally, and individual recorders would have to be relied upon to submit their own results, either by post, email or internet. Local representatives could still play a role as facilitators, answering queries, helping with arrangements and generally keeping an eye on recording in their area; but the responsibility of data collation would be best placed with the participants. 5.6 Interpretation
As well as coordinating NARRS, the HCT sees its main role as carrying out the scientific analysis, interpretation and dissemination of data. The HCT already houses the national Rare Species Database for herpetofauna, and has access arrangements for GIS basemaps and aerial photography via English Nature and CCW licences. NARRS would generate large volumes of data in potentially complex formats. To handle many thousands of data points, sufficient hardware and software capability will need to be in place, and the HCT has already made significant steps towards this in developing its Rare Species Database and GIS. The HCT’s involvement with various national and European fora, formal relationships with statutory agencies, and position as lead partner for BAP

121
species, also place it in a useful position for understanding the emphasis needed for surveillance and monitoring objectives. Strategies for data collection would need to be explored in further detail before NARRS begins. A comprehensive project design will be necessary to ensure that information needs are met coherently and efficiently. Data may need to be collected differently for different purposes, and analysis and interpretation will be dependent on the objectives for which it is collected. For example, a measure of conservation status would require assessment of biological status and external influences, involving the combination of various parameter measurements, perhaps weighted and/or calibrated, in order to produce a standard measure that is repeatable from site to site and year to year. Measures will also need to be scalable in order to report on status at different spatial scales. Statistical methods will be indispensable in analysis and interpretation of results. Recent advances in the use of Bayesian statistical models (eg Pellet & Schmidt 2004; Schmidt 2004), and thinking on the respective importance of power and confidence (Nakagawa 2004; Pollock and others 2002) should be fed into the design of analytical processes. The services of a skilled statistician will be needed during the design stages of NARRS, but perhaps also annually to aid analysis and interpretation. A ‘call-out’ contract or service level agreement approach would probably the best way of meeting this need. To maximise the efficient usage of project staff time, the timing of respective reporting rounds and other dissemination obligations will be of paramount importance in scheduling analytical activity. Further input from SNCOs, Defra and other statutory agencies will be needed during the design stage of NARRS, to confirm reporting timetables. 5.7 Access to data and distribution of data products
In order to build the partnership that would be needed to fund and run NARRS, a presumption of openness and data sharing would need to be adopted, except where there are specific causes for a different approach. The Data Protection Act (DPA), intellectual property law, the Environmental Information Regulations (EIR), and the Freedom of Information Act (FIA) also have to be addressed. Under the Environmental Information Regulations and the Freedom of Information Act, NARRS partners such as the HCT that receive public funding, will probably have the same status as a Public Body sensu stricto, and will therefore have to provide information freely. There is some current discussion over how this will affect existing and future data-sharing relationships. Some local recorders and national schemes are concerned that it will discourage recorders from submitting records, particularly for threatened species. The NBN Trust, the HCT and others have provided submissions to Defra on the potential pitfalls of unlimited public access (not least in the potential administrative burden). The FIA and EIR do not appear to apply to private companies and professionals, and it is a frustration that the new and revised laws could adversely affect biological recording by charitable and public bodies, whilst benefiting profit-making companies. The DPA is fairly easy to comply with by registering with the Data Protection Commissioner, publicising a Privacy Policy, obtaining permission to store and share Personal Data, and allowing data suppliers to opt out of any sharing arrangements. As long as reasonable effort

122
and due diligence are shown in handling data protection issues, they are relatively unproblematic. A potentially more contentious issue surrounding data sharing is the attribution of intellectual property to biological records. There have been no test case precedents, but it is possible that a law court might view records as copyrightable; therefore the possibility should be catered for. The moral rights of any recorder should also be respected, ie they should be identified as the author of the records they submit, but it should be acceptable to derogate from this duty in some circumstances. The HCT operates a sign-up system for recorders, under its organisational licence, which makes it clear that recorders’ names might not be mentioned if it is impractical to do so, eg the publication of aggregated data. By submitting records, recorders also agree to share copyright on their data, and permit the HCT to pass data on to third parties. The HCT currently states that data will only be shared for science, conservation and education purposes; but this might need to be revised if the EIR and FIA impose full public access. Specific means of accessing and disseminating data include the internet (eg a NARRS website or the NBN Gateway), newsletters, reports and other feedback. Some of these are discussed in section 5.9.5. 5.8 Co-ordination and liaison with English Nature
The HCT would need to maintain a close liaison with English Nature, probably through a steering group and with contact with a specified project officer. However, NARRS would probably involve a large funding partnership and a potentially large steering group. The partnership, management hierarchy, volunteer networks, logistics, quality control, analytical procedures and other aspects of the project will depend upon proper coordination. For reporting purposes and other communications, the level of liaison with English Nature will probably be dictated by English Nature. All funding partners will have to be aware, though, that each of them may have different priorities. Ideally, the data needs of SNCOs, other statutory agencies and the NGOs will be in tune with each other, and a synergistic relationship will be possible. 5.9 Proposed roles of key organisations
5.9.1 Data providers
Data providers would mostly be voluntary recorders, but may include professional contractors. A significant proportion of volunteers are likely to be existing herpetofauna enthusiasts (eg ARG members), many of whom who do not work professionally in the nature conservation sector, and would be participating in their spare time. There are also likely to be some professionals working for NGOs and government agencies who would be involved as a voluntary sideline that could be carried out as part of their existing job. The majority of volunteers would probably have to be recruited from scratch, however, and although many might already be involved with other conservation initiatives (eg WT members), some might have little or no previous experience of conservation. All volunteers, regardless of experience, would have to be trained to the same level, endorsed by the scheme, and if necessary licensed. Training would need to include health and safety, risk assessment and lone working. Provision of insurance could be an issue to consider, but

123
most other schemes do not provide insurance. ‘Best practice’ in the use of volunteers should be pursued. The HCT currently operates a successful system whereby 160 agents are accredited to its licence, and each signs an agreement regarding licence adherence and data protection. All recorders participating in NARRS, whether volunteers or professionals, should sign agreements sharing the copyright on all records, permitting the storage of their personal details, and informing them of the anticipated subsequent use of data. Current thinking on the rights of volunteers and employment law should be watched closely, but signing a ‘Volunteer Working Agreement’ as the HCT operates for its volunteers should be sufficient to provide mutual protection of rights. It includes requirements that volunteers obtain landowner permissions, act responsibly and safely, and follow lone working and risk assessment guidance. It should be possible to draw all the necessary information together in a volunteer pack, and combine the agreements on one sheet of A4 paper. The issue of whether to pay volunteers travel expenses for agreed activities is a difficult one. Most UK wildlife monitoring schemes do not pay expenses to their volunteers, and in fact the BTO’s Garden BirdWatch requires participants to pay an annual £12 subscription to the scheme. The workshop held in February 2005 produced strong support for expense payment from many but not all participants. It is difficult to say whether the views put forward in the workshop were representative of all ARG members. The participants included a significant proportion of professional consultants. Depending on the chosen route and methodologies for delivering a national herpetofauna recording scheme, there may be call for involving the general public in a much looser fashion, perhaps via media broadcasts. Increased awareness and public sympathy might be the best reasons for doing this, but increased distribution knowledge might also be achieved for some species. The primary concerns here are the reliability of the data, and publicity would have to be clear on data protection and copyright implications. Publicity drives involving organisations such as the Ramblers’ Association might also be beneficial, perhaps as part of targeted surveys for widespread reptiles. 5.9.2 Local Records Centres
There are several ways in which LRCs could help, or benefit from, NARRS. They could take part in the data collation and digitisation process, or they could help support the voluntary network, eg by providing computer facilities. Conversely, NARRS would produce large volumes of herpetofauna records that ought to be forwarded to LRCs as policy. In this way, data collected for NARRS would be given added value due to its utility for development planning and other local uses. LRCs normally collate, verify, validate, manage and disseminate herpetological records as part of their business, although usually with the help of county recorders and other herpetologists. LRCs could therefore potentially act as local nodes in the data collation process for NARRS, if such a structure were chosen. If web-based data entry were chosen, or records were to be forwarded from recorders to a national central collection point, then LRCs would not be needed for collation purposes. Reliance on LRCs is problematic in any case, as their geographical coverage is far from complete, and they differ widely in size, structure, resources and capacity.
124
The NFBR survey of LRC status (NFBR 2002) serves as the best assessment of LRC capacity currently available. At the time of the survey, there were 29 active LRCs in England, and 39 in the UK. The NFBR contacted all known LRCs by questionnaire and asked about their status, data holdings, IT systems, staffing and funding. They also investigated the current situation where there were no LRCs. Out of the 24 LRCs that responded, 12 operate under LAs, 6 under WTs, and the others are charitable trusts or companies. Their computer systems vary, and whilst most use Recorder as their database, some do not, and 20% of them do not use GIS. LRCs employ a mean of 3.3 staff and use the services of a mean of 1.7 volunteers. However, eight LRCs were operating on fewer than two professional staff, which is considered by the NFBR to be the minimum viable level. Arguably the disparity between LRC coverage and abilities is too great at present to use them as data collation nodes. The Recorder software used by most is able to record species counts and to group records into visits, and therefore may be sufficient for many of the simpler aspects of herpetofauna recording. However, a bespoke database system, such as the HCT Rare Species Database (or a derivative) would be more versatile. This is particularly true if anything more complex than basic environmental, habitat, methodological and animal observation parameters are to be recorded. As it is likely that at least some elements of a recording scheme might involve more detailed study of a sample of sites, it would be wise to use a database that could cater for all aspects of the datasets collected. Hence, it is likely that all LRCs would have to be supplied with specific software for NARRS. LRCs would be welcome partners in data sharing arrangements, although the logistics of agreeing multiple data exchange agreements could be a major source of inertia, and arrangements would have to be addressed generically. The role of LRCs in local development planning is understated at present, and one of the chief spin-offs of NARRS could be the dissemination of data via LRCs, to aid the conservation of herpetofauna through the planning process. It should be NARRS policy that all LRCs receive all the data generated for their geographical remit. Data would have to be in a suitable format for LRCs to be able to use it. Mechanisms could be developed for converting NARRS data into the most popular formats (eg Recorder, MapMate, BioBase), but it could not be the responsibility of NARRS to meet the requirements and idiosyncrasies of other bespoke systems. 5.9.3 English Nature
Guidance and financial support would be anticipated from English Nature, as well as instructions on meeting information needs. The level of input will largely depend on the support that English Nature is prepared to give to NARRS, and the level to which it can meet English Nature’s information needs. English Nature’s involvement would presumably be motivated by aspirational goals as well as legal obligations, and full support for NARRS would be expected, along with a commensurate level of funding. In return, English Nature would expect NARRS to meet its herpetofauna information needs. English Nature would also be able to help publicise the scheme. 5.9.4 The Herpetological Conservation Trust
The HCT sees itself as taking a primary role in the design and coordination of NARRS. As well as developing much of the thinking behind such a scheme, it has done a lot of the groundwork necessary to set it up. As well as this scoping exercise, including the ARG consultation and workshop, the HCT has held meetings with Froglife, HGBI, the SNCOs and
125
NGOs over several years. The HCT is also the lead or joint lead partner for all the UK herpetofauna SAPs, and has been central to several years of policy development on FCS monitoring in relation to the EC Habitats Directive. The HCT proposes to coordinate the delivery at a higher level of the national scheme. It would be responsible for analysis and intellectual interpretation of the data, and disseminating the deliverables required for nature conservation. Therefore, both the national coordinator and the data manager posts would be based at the HCT. The facilitator post(s) could be based elsewhere. (Froglife have expressed an interest). The HCT, as lead partner, would chair the NARRS steering group and lead on project development, partnership- and consensus-building, external relations and media initiatives. 5.9.5 National Biodiversity Network
The NBN is a partnership that has been developed over the last few years (and continues to develop), centred around the NBN Trust (http://www.nbn.org.uk/). Its aim is to build a ‘network of biodiversity information’ by bringing together data custodians to share data. The focus of its activities is a web portal known as the NBN Gateway (http://www.searchnbn.net/) that allows users to access species records held by data custodian partners throughout the British Isles. The NBN Gateway should not be confused with the NBN Trust or with the NBN sensu stricto, which is technically the sum of its parts, and therefore includes the HCT (and will include NARRS). The Gateway enables users to display records for individual species, mapped against OS basemaps. They can choose the spatial scale and decide which component datasets to display. For example, users can display herpetofauna records from the BRC, HCT and several LRCs either collectively or individually. The partnership of data custodians taking part in the NBN project is growing, and the project has benefited particularly from the ‘Southwest Pilot’ scheme supported by English Nature, which encouraged partners to supply their datasets for this region of England. Species and Habitat Dictionaries have also been developed in partnership with the Natural History Museum. The NBN Gateway is a possible option for participants in NARRS to access their data (another would be via a dedicated NARRS website). If NARRS data were uploaded to the Gateway’s server, users could plot records on 10km, 1km or full resolution (depending on any access constraints dictated by NARRS). The Gateway is improving its facilities iteratively, but it is still not as intuitive as it might be. With nearly 19 million species records from 145 datasets, it is already a very complex portal involving numerous organisations, covering many geographical areas and taxonomic groups. Furthermore, future policy may shift towards redirecting Gateway users to third part websites anyway (A. Brewer, pers. comm.). Data entry is not currently possible via the NBN Gateway, and even if this were to become a facility it offered in the future, it is unlikely that this mechanism would be the best for NARRS. A dedicated web interface would be most appropriate, especially as NARRS would require a whole package of web pages covering how to get involved, identifying amphibians and reptiles, their ecology, how to enter records, accessing records etc. A link from the NBN Gateway to the NARRS website would be well advised however. Similarly, a link from the NARRS website to the Gateway would be worthwhile, to provide general guidance on

126
wildlife recording, to promote standards in recording, and to inform participants of other schemes they may be interested in. The NBN Development Officer for National Societies and Recording Schemes has been helpful in offering support and advice towards development of NARRS, and is available for advice and help with seeking funding (T. James, pers. comm.). The NBN Gateway could also presumably help with publicity by linking to the NARRS website. 5.9.6 Amphibian and Reptile Groups
The ARG network, probably with assistance from other volunteer networks, would be the chief source of volunteers to carry out the recording. The questionnaire survey carried out under this contract showed that the ARGs are enthusiastic about being involved in NARRS, provided that appropriate funding and support was provided, and that many would appreciate involvement in the project design stages. Ideally, all ARGs would be formally constituted and well-organised if they are to be involved in NARRS. They would probably serve as a local focus for volunteers, rather than necessarily the coordination mechanism, hence the distribution of survey work and the collation of records could be independent of the ARG if necessary. As part of the NARRS design phase, geographical gaps and capacity deficits should be identified, and a strategy should be drawn up to boost their membership and recording capacity. As discussed earlier, the issue of reimbursing volunteer expenses may be contentious. A great deal of current voluntary recording does not involve payment of expenses, and if some volunteers were paid expenses, all would have to be offered the opportunity to claim. The Mammal Society is currently lobbying Government on the need for greater financial support for volunteers involved in delivering information that is crucial to Government needs (M. Woods, pers. comm.), but overall there appears to be no trend towards paying volunteer expenses. Arguably there is a difference between recorders voluntarily submitting their records to a scheme ad hoc, and a scheme dictating to them when and where they ought to do their recording as part of a formal sampling regime. Baker (2003) noted that it was necessary for volunteer morale, to ensure that every recorder had at least one ‘good site’. In Canton Aargau (Switzerland), where the volunteer network provides a useful model for NARRS, travel expenses are paid to volunteers (C. Bühler, pers. comm.). Many UK schemes do not pay volunteer expenses, and the BTO’s Garden BirdWatch (which does not involve travel) requires payment of subscriptions. The subsequent sections of this report assume that it may be necessary to pay expenses to volunteers. Whether this becomes the case is a matter for the design phase, but as a contingency plan to aid consideration of fundraising issues, it is included here. As the costings tables show, volunteer expenses are not necessarily anticipated to form a major part of NARRS expenditure. The most influential factors financially are sample size and intensity of visits. In fact, arguably the biggest problem with paying volunteer expenses would not be the cost of the expenses but the administrative burden of managing and distributing them. Whether or not individual recorders actually claim their expense entitlement, the administrative capacity would have to be in place to deal with perhaps several thousand claims and payments per year.

127
5.9.7 Professional herpetologists and other contractors
Some independent professional herpetologists may be required as recorders, particularly to achieve desired sample coverage in all parts of the country. It may be parsimonious to hold a ‘call-out contract’ with one or two contractors who could fill in gaps as necessary. The cost implications could be prohibitive though, and gaps in data might be more acceptable than filling them expensively. As discussed earlier, there is a good case for contracting recorder training out to contractors. It would be simpler logistically, enabling several parallel events programmes in different parts of the country, and there might be insufficient year-round justification for these posts. Other professionals, such as statisticians, may be required periodically and would probably be hired by the HCT. 5.9.8 National Pond Monitoring Network
As mentioned earlier, the NPMN is an initiative set up in 2002 by PC (full title is ‘Pond Conservation: The Water Habitats Trust’, formerly known as the Ponds Conservation Trust) in collaboration with the EA and others, under the PiP banner. It maintains a pond inventory with a web interface for data collection, and plans to carry out a programme of pond monitoring and targeted surveys. The NPMN will involve a random stratified sample of ponds monitored by trained volunteers and professionals, using the PSYM method, which is based upon botanical and invertebrate matrices (Pond Action 2000; Williams and others 1998). The scheme aims to link its pond sample to pre-existing initiatives such as Defra’s (DETR’s) Countryside Survey. Other systematic pond survey schemes of note are the Lowland Pond Survey 1996 (Williams and others 1998) which covered 377 ponds in 150 1km squares, and the Countryside Survey 2000 (Haines-Young and others 2000) which examined pond status in 569 1km squares across Britain. Owing to the dependence of amphibians (and to a lesser extent grass snakes) on ponds, there is a clear connection between the remits of PC and NARRS, and it could provide opportunities for partnership and synergy. It has previously been suggested that the scope for sampling NPNM ponds, as part of NARRS, should be examined (Baker 2003), and English Nature, the HCT and PCT have discussed collaborative avenues already. Involvement in PSYM recording for the NPMN would require significant botanical and invertebrate training, perhaps more so than the level required for NARRS, hence it would be more difficult for NARRS volunteers to contribute to NPMN surveys than vice versa. However, any opportunities for coordinating sample sites should be explored. This would undoubtedly add value to data collected by both schemes, providing opportunities for exploring relationships between herpetofauna status and other biological parameters. 5.9.9 Other statutory agencies and partners
CCW and Scottish Natural Heritage (SNH) might be expected to contribute financially to NARRS as they share broadly similar information needs and obligations as English Nature. CCW has already indicated its support for NARRS by jointly funding this scoping exercise. Funding could also be sought from other sources such as the European Commission, the Heritage Lottery Fund (HLF), Defra, JNCC, and the Esmée Fairbairn Foundation. As another NGO involved with herpetofauna conservation, Froglife is likely to be involved as a partner in the NARRS project. They are now based in Peterborough and have recently

128
recruited new staff. Their secretarial responsibilities and supporting role for the ARGs mean that they have both experience and a specific interest in volunteer development issues. There may also be ways in which the other national herpetofauna NGO, the BHS, could become involved. The Deeside Urban Wildlife Group is another NGO that could perform a role in NARRS; it has an office in northwest England, it manages reserves with an emphasis on herpetofauna, and it employs staff with good experience of education and community involvement. 5.9.10 Additional volunteer sources and synergies
Potential sources of volunteer recorders outside the ARG network that are worth exploring include the BTCV, the Ramblers’ Association, and readers of specialist wildlife and countryside magazines. There are also opportunities for sharing the volunteer networks of other NGOs, such as The BCT, the WTs, RSPB, BTO and BC. PC’s NPMN is also an area where synergies should be pursued if possible. During the design phase of NARRS, all of these potential volunteer sources should be scoped and evaluated, and all opportunities for maximising community involvement should be explored. Realistically, NARRS would be most successful if it cast its net wide enough to involve the general public, whether or not they are already involved in other volunteering or special interest activities. A prominent media presence would be necessary to generate wide interest, and the support of the BBC and others (via television programmes such as SpringWatch, Countryfile and magazines such as BBC Wildlife) should be sought wherever possible. It follows, therefore, that the ‘NARRS experience’ would have to be accessible in terms of ability, and interesting and enjoyable for volunteers to participate in. 6 Indicative costings 6.1 Explanation of costings
English Nature requested three alternative costings for each aspect of NARRS, mainly to show upper and lower cost extremes with an example in between, rather than a multitude of possible sampling and delivery regimes. The true cost would logically lie somewhere between the two extremes. It is likely that the most effective and efficient way of running NARRS would be with all aspects of data collection running concurrently rather than consecutively; therefore this is the approach adopted here. The factors that impact most on the cost of NARRS (ie with the greatest variability in cost) are: • Volunteers vs professionals • Sample sizes • Methodologies/number of visits • Periodicity of monitoring cycle • Project management structure

129
Each of these factors involves a range of options, and all of them combined would produce numerous potential combinations, but a few obvious choices and assumptions can be made at this stage. Volunteers vs professionals
It is unrealistic to consider professionally employed herpetologists to deliver NARRS rather than volunteers: the cost is an order of magnitude greater. Hence, the costings given here will work on the assumption that volunteers rather than professionals will carry out most of the data collection. Some aspects may need professional involvement, specifically pool frog monitoring and geographical areas where volunteers cannot be found. A strategic decision will need to be taken in the event of failing to attain full sample coverage. If volunteers could not cover some areas, then statistical power would be compromised for the whole dataset, and it may be wise to invest in professional help to fill in the gaps. This could potentially be sensitive if all other work were carried out by volunteers. The costings assume that: • All pool frog monitoring will be by professional contract. • Rare species work will be a 50-50 split between volunteers and HCT staff. • Widespread species monitoring might have a 5% professional involvement (95%
volunteers). The way CSM is delivered will depend on whether the other aspects of NARRS take place, eg it could be integrated into the widespread and rare species monitoring programmes carried out by volunteers, or it might be carried out solely by HCT staff or other professionals. The recent workshop (Amphibian and Reptile Workers’ Meeting, Keele University, February 2005) suggested that payment of expenses to volunteers would have to be considered; hence it would be unwise to proceed with funding calculations without considering this as a possibility. The proposals given here therefore include payment of mileage expenses to all volunteers at a rate of £10 per visit. This is calculated at 25p/km for an average 40 km roundtrip (but clearly isn’t predictable with accuracy). It should be noted, however, that volunteers are not paid currently for their involvement in the HCT’s rare species monitoring programmes, despite some of them incurring fuel costs. Under NARRS, it would be untenable to pay some volunteers and not others; therefore paying expenses under NARRS would result in a cost that is currently borne by the goodwill of volunteers. Furthermore, as discussed earlier, there would be a heavy administrative burden with payment of volunteer expenses, and this might make it unworkable. Sample sizes
For the rarest species (natterjack toad and pool frog), monitoring should be carried out on all sites. The other rare species (sand lizard and smooth snake) are present at an order of magnitude more sites; the possibility of monitoring only a sample of them could be considered, but should be seen as a less desirable option. Sand lizard and smooth snake monitoring methodologies are currently being developed by the HCT, and a preferred option is that a few visits will be made to all sites, but more detailed study will take place at a sample of sites. Therefore, for the purposes of the current exercise, it is assumed that sand

130
lizard and smooth snake monitoring occurs at all sites. For the widespread species, only monitoring a sample is possible. The figures used in this costing exercise are estimates based on presumed relative numbers of populations nationally. Power analysis for each species will dictate how many sites must be visited to confidently extrapolate results. Basically, the more sites there are for a species, the bigger the sample needs to be. Other key factors are the rate of natural turnover in a population, the degree of change that needs to be detected, and the degree of surety (power) needed. This is beyond the scope of the current project, but it is an essential next step in constructing NARRS and in calculating the likely costs. Sample sizes have been estimated here for all species except the natterjack and pool frog (where all sites will be monitored), based upon the sample size of 400 suggested by Baker (2003) for great crested newts. Some species ought to be grouped for field data collection (the newts and the widespread reptiles), to make efficient use of survey effort; therefore the sample has been estimated to cover the combined geographical range of each group.
Estimated UK total (all
sites or sample) Likely range (50% and 200% of total)
Likely range with species groupings
Natterjack toad 55 (all) 55 55 Pool frog 1 (all) 1 1 Sand lizard 530 (all) 530 530 Smooth snake 200 (all) 200 200 Great crested newt 400 (s) 200-800 Smooth newt 1000 (s) 500-2000 Palmate newt 500 (s) 250-1000
750-3000
Common toad 2000 (s) 1000-4000 1000-4000 Common frog 5000 (s) 2500-10000 2500-10000 Common lizard 2000 (s) 1000-4000 Slow-worm 2000 (s) 1000-4000 Grass snake 1000 (s) 500-2000 Adder 1000 (s) 500-2000
1500-6000
It is assumed that all sand lizard and smooth snake sites will be monitored. Sample sizes were estimated, and likely ranges were calculated based on 50% and 200% of these estimates. The above sample estimates are based upon the whole of Britain, but these need to be split according to the individual countries within Britain. Northern Ireland is not included in these calculations, but assuming that NARRS covers the whole UK, a relatively small extra cost would need to be factored in to cover the small extra geographical area and the survey of only a few species. It is assumed that the proportions of the samples can be split into English, Welsh and Scottish components according to geographic area of each country. (Sampling may be stratified according to habitat, and therefore biased geographically, but this is beyond the scope of the current exercise). England occupies about 60% of Britain, Wales about 10% and Scotland about 30%, hence for a species that is distributed throughout Britain, the proposed sample size would be split as follows: 60% in England, 10% in Wales, 30% in Scotland. Given that a sample should be spread equally throughout a species’ range, whether or not the distribution is patchy, it is assumed here that sampling should be evenly spread. For example, even though the adder is thinly distributed throughout much of lowland England, all parts of Britain must be given equal treatment. Conversely, only two small parts of Scotland have grass snake records, so the sample need not extend to the north of Scotland, although

131
monitoring should take place throughout the known areas in order to pick up any currently unknown occurrences. Likewise, great crested newt is not present throughout all parts of Scotland and Wales, and the sample proportions for each country have been altered accordingly. If sand lizard and smooth snake are sampled, the sample size for countries will be absolute rather than an estimate. All other species are essentially distributed throughout Britain, and the 60%, 10% and 30% split is suitable. The table below shows estimated sample sizes for each country, for individual species and for the likely species groupings.
Estimated sample size for each country (and 50-200% range), with likely species
groupings England Wales Scotland Natterjack toad 50 50 2 2 3 3
Pool frog 1 1 0 0 0 0 Sand lizard 526 526 3 3 1 1 Smooth snake 200 200 0 0 0 0
Great crested newt 340 (170-680) 20 (10-40) 40 (20-80)
Smooth newt 600 (300-1200) 100 (50-200) 300 (150-600)
Palmate newt 300 (150-600)
900 (450-1800)
50 (25-100)
150 (75-300)
150 (75-300)
450 (225-900)
Common toad
1200 (600-3200)
1200 (600-3200) 200 (100-400) 200 (100-400) 600
(300-1200) 600
(300-1200) Common frog
3000 (1500-6000)
3000 (1500-6000)
500 (250-1000)
500 (250-1000)
1500 (750-3000)
1500 (750-3000)
Common lizard
1200 (600-3200) 200 (100-400) 600
(300-1200)
Slow-worm 1200 (600-3200) 200 (100-400) 600
(300-1200)
Grass snake 820 (410-1640) 140 (70-280) 40 (20-80)
Adder 600 (300-1200)
1800 (900-3600)
100 (50-200)
300 (150-600)
300 (150-600)
900 (450-1800)
To reiterate, these figures are just estimates, and provide a guide rather than a true reflection of the fieldwork costs. The main financial implication is the effect on volunteer costs. Note that once calculated, minimum sample sizes will be non-negotiable if statistical power is to be maintained. Methodologies/number of visits
The choices of methodologies could impact directly or indirectly on the cost of NARRS. The main expenditure is likely to be reimbursing volunteer travel costs, and this would increase significantly if blanket surveys were to be employed for amphibians. The survey unit for blanket surveys would probably be a 1km square rather than individual ponds, thus increasing the number of visits several-fold.

132
The number of visits required to collect data in each monitoring round will obviously influence the cost of volunteer expenses. Detectability should be calculated (Pellet & Schmidt 2004) and the effectiveness of methodologies evaluated. Once a minimum number of visits has been arrived at statistically for each monitoring methodology and species/group, this will essentially be non-negotiable as a minimum. Such analysis needs to be carried out in the project-building stage of NARRS, but a reasonable idea of acceptable visit levels has been gained from existing literature and schemes abroad (eg Fog, pers. comm.; Griffiths and others 1996; Monney, pers. comm.; Pellet & Schmidt 2004; Schmidt 2004). The costings options considered are therefore based on the likely range in the number of visits for each species/species group, varying from two to 22. Sand lizard and smooth snake monitoring may involve differential numbers of visits to sites, ie a sample receiving more visits than the others. For the simplest level of monitoring (eg along the lines of the CSM guidance, JNCC 2004), one visit could potentially be enough, but it will inevitably involve an element of luck and may require several visits; for the sample of sites that would be monitored more intensively, perhaps 10 visits would be in order. Therefore, an average of 3-5 visits is assumed for all sand lizard and smooth snake sites.
Likely number of visits per monitoring
exercise
Periodicity of monitoring cycle
(years)
Main restricting factor on
periodicity Natterjack toad 3-22 1 Rarity Pool frog 12-20 1 Rarity Sand lizard * 3-5 3 BAP Smooth snake * 3-5 3-6 EC Great crested newt * 3-4 3 BAP Smooth newt * 3 3-6 None Palmate newt * 3 3-6 None Common toad * 2 3-6 None Common frog * 2 3-6 EC Common lizard 3-5 3-6 None Slow-worm 3-5 3-6 None Grass snake 3-5 3-6 None Adder 3-5 3-6 None * = additional visits required to a subsample for CSM The pool frog monitoring will involve at least 12 and possibly up to 20 days of a professional herpetologist’s time, depending on how the day and night visits are arranged. Most sand lizard and smooth snake sites are monitored professionally by the HCT at present, with some use of volunteers, and an incomplete coverage due to resource limitations. It is unlikely that volunteers could ever replace professional staff for all rare reptile monitoring as the sites are too densely clustered in places, particularly in Dorset. The necessary skills for detecting sand lizards also require experience rather than just training. A large enough skilled volunteer force to cover all sites would therefore be difficult to recruit. Realistically, professional HCT staff would need to carry a significant portion of the rare reptile monitoring responsibility, perhaps 50% of it. With dedicated HCT staff time, several sites and/or foci could be visited in a day, perhaps four on average. Mileage efficiencies ought to be possible, and an indicative cost would be £90 per day for staff time plus £20 mileage per day. Additional visits will be needed for CSM purposes in some years, to a relatively small subset of amphibian sites.

133
Periodicity
Following from discussion in earlier sections, the two rarest species (natterjack toad and pool frog) ought to be monitored annually. All the other species could be monitored on a three- or six-year cycle (although there is a strong case for placing all on a three-year cycle). With a six-year cycle, the annual fieldwork costs are half that of a three-year cycle as there are half as many visits in a year. Annual total fieldwork (sample sizes, number of visits and periodicity combined)
The total number of field visits made in any one year would control the cost of volunteer expenses. This can be calculated by multiplying the minimum and maximum options for sample size, number of visits and periodicity for each monitoring element. The minimum annual cost is given by smallest sample, lowest number of visits and longest periodicity; the maximum annual cost is given by the largest sample, the highest number of visits, and the shortest periodicity. A median figure might be a sensible figure to work with until the field elements have been better examined in the anticipated project development stage. Pool frog monitoring costs are calculated using a consultancy rate of £150 per day; rare species work is calculated at 50% volunteers (£10 per visit) and 50% HCT staff (£110 per day). Note that this is not proposed as a suitable rate for paying professional consultants. Many charge a lot more than this, and £200-250 per day is probably a more realistic rate (J. Foster & L. Howe, pers. comms.). For the widespread species, 100% delivery by volunteers is expected, but the calculations consider the possibility that volunteers would not be able to meet all of the monitoring required, and that 5% of the site visits might have to be carried out by professionals at £150 per day. Depending on the location of sites, it might be possible for consultants to visit more than one site per day; but with travel time being potentially large, it would be unwise to expect more than two visits in a day. At two visits per day, using consultants to carry out 5% of the work adds 32.5% to the monitoring costs for the widespread species. At the lower end of the fieldwork estimates, this additional cost is relatively small in comparison to the management costs, but at the higher end of the fieldwork estimates it is a considerable element of the costings.

134
Monitoring regimes
Likely range of sample size for
England
Likely number of visits per
monitoring exercise
Periodicity of
monitoring cycle (years)
Total number of monitoring visits per year in
England
Cost (100% volunteers for natterjack and
widespread species)
Cost (95% volunteers, 5% consultants for
widespread species)
Natterjack toad 50 3-22 1 150-1100 1,500-11,000 1,500-11,000 Pool frog 1 12-20 1 12-20 1,800-3,000 1,800-3,000 Sand lizard 526 3-5 3 526-877 9,890-16,490 9,890-16,490 Smooth snake 200 3-5 3-6 100-333 1,930-6,290 1,930-6,290 Great crested newt *
3-4 3 (takes precedence)
Smooth newt * 3 (3-6) Palmate newt *
450-1800
3 (3-6)
450-2400 4,500-24,000 5,110-31,800
Common toad * 600-3200 2 3-6 200-3200 2,000-32,000 2,650-42,400 Common frog * 1500-6000 2 3-6 500-4000 5,000-40,000 6,625-53,000 Common lizard 3-5 3-6 Slow-worm 3-5 3-6 Grass snake 3-5 3-6 Adder
900-3600
3-5 3-6
450-6000 4,500-60,000 5,963-79,500
Visits Cost Cost Annual total 2163-17930 £28,870-
192,780 £35,468-243,480
* = does not include additional visits required for CSM. The rare reptile elements are calculated as follows: Rare reptile monitoring
regimes
Total number of visits per
year
50% of visits by volunteers
Volunteer cost (£10
mileage per visit)
50% of visits by HCT (4
visits per day)
HCT cost (£90 plus £20 mileage per
day)
Total cost
Sand lizard 526-877 263-439 visits £2,630-4,390 66-110 days £7,260-12,100 £9,890-16,490Smooth snake 100-333 50-167 visits £500-1,670 13-42 days £1,430-4,620 £1,930-6,290 Project management structure (widespread and rare species)
The overall management of NARRS – if it were to include widespread species - would require a minimum of three posts for coordination, volunteer support, and data management. This may well be an unrealistic underestimate (even with training being provided by contractors), and if more than one volunteer support post were possible, it would undoubtedly ease pressure. Various capital costs and overheads would be incurred. In addition, the hierarchy at the delivery end of the project requires further consideration, in particular the roles of any local representatives. With between 2,000 and 18,000 monitoring visits per year (and relatively few of these being on a professional basis), a likely volunteer force of over a thousand and perhaps several thousand will be needed. For the purposes of this exercise, we will assume 3,000. Direct communication between all of the volunteers and the national coordination and support mechanisms would potentially be difficult to manage, and it would be wise to have a network of local or regional representative with carefully defined responsibilities, just to take some of the pressure of the national coordination staff. As discussed earlier, duties might include answering simple questions, and helping with work allocation.

135
At the recent workshop, potential volunteers also felt strongly that local and/or regional representatives would be essential, not just to ensure the scheme’s proper functioning, but to provide a ‘friendly local face’. If duties were onerous and had clear responsibilities, some said that regional coordinators ought to be paid commensurate salaries, although this was more contentious among other workshop participants. In reality, NARRS would probably be unable to fund county-based coordinators, even part-time, although several regional volunteer facilitators might be viable. Alternatively, with clear and efficient central management of volunteers and workload, unpaid representatives with much more informal duties would be the cheapest and easiest option. This is an approach taken by various non-herpetofauna schemes run by the BTO, the BSBI and others. With any local coordination or representation, the focus would largely be on the field season, although data collation, meetings, feedback etc could take place post-season. A local ‘management structure’ might involve some capital expenditure and overheads, such as computer hardware, consumables or overheads. Contribution towards office costs (eg computer facilities) of third parties such as WTs or LRCs could be investigated, but again this would be logistically difficult to arrange centrally. Arguably the pre-requisites for becoming local NARRS representatives ought to include having adequate IT access and skills. On balance, it is likely that training courses in reptile and amphibian survey techniques would need to be provided; and this would incur costs. All training would have to follow a standard protocol. The organisation of training events would have to be well organised, probably by the national volunteer facilitator(s) but perhaps also by contracted trainers. It would be wise to have captive specimens of all the species covered by each course, order to mitigate poor weather. Training would arguably not be effective if it didn’t provide practical experience of the animals, and protected species licensing might well require direct experience of the animals (unless a special blanket licence was provided). The amphibian survey season (and to a large extent the peak reptile season) would limit the training season to a maximum of three months. At least two types of training course would be needed (amphibian and reptile), and these would probably involve different dates, times of day and sites, and would generally be provided by different trainers. Once a sufficient body of recorders is trained in the first year, the volunteer facilitator(s) or local representatives could recruit and train additional recorders to maintain numbers in subsequent years. Training courses could not realistically have a geographic remit larger than the county level as it would be unfair to expect people to travel too far, and the capacity of each course would have to be limited to 30 persons (although many people would consider this too many). To fulfil sampling needs, the volunteer needs for some counties would be greater than 30 people, necessitating more than one course. With an anticipated 3,000 volunteers needed nationally, and separate amphibian and reptile training courses, a total of 200 training events might be needed across Britain; hence this is the figure is assumed in the costings. The events could be carried out by contracted professionals, or by employing individuals on short-term contracts. For professionals, a rate of £150 a day is assumed here, and travel expenses would not be paid. For fixed-term contracts, an equivalent salary/overhead to the volunteer facilitator post is assumed, but with greater travel costs, a three-month contract is likely to cost c.£9,000 per person. During three months, each trainer could probably give no more than about 50 training days; therefore at least 4 trainers would be needed on fixed-term contract. As discussed earlier, this is not a favourable option, and contractors paid on a day rate would be much more flexible.

136
It is possible that local voluntary trainers could be trained to train others, in which case perhaps the only cost would be travel expenses incurred by the trainers-to-be, in bringing them to regional or national training events. The volunteer facilitator(s) could provide the training, but would probably need support from several other individuals. It is difficult to estimate how many voluntary trainers would be needed, as they could not be expected to commit as much time as professional trainers, but it would probably be in the region of 100. The most expensive costings are to employ 10 people on short-term contracts; the intermediate option is to pay professionals (based upon a rate of £150 a day). Using voluntary trainers (assuming an average travel cost of £50) offers the lowest costings. However, bringing together 100 voluntary trainers is likely to be more difficult than finding 20 contractors. Also, if standardised equipment (eg torches and nets) were to be provided for amphibian survey, this would involve a large capital outlay. According to the recent workshop, provision of equipment seems to be an important issue to many volunteers. Thus the possibility of a large equipment outlay (though probably still not realistic) is included in the survey costings. Reptile survey may involve artificial refugia (where permitted and appropriate), but with an appropriate campaign, these could perhaps be sourced for free to save a large capital cost. The predicted costings are given for widespread species monitoring only, but are effectively the same as the whole of NARRS. Rare species, census and CSM monitoring are relatively small elements, accounting for about 15% of NARRS overheads, and the proposed staffing levels are modest estimates in any case. The costings are given for Britain as a whole and for England only; and all components are split into low, medium and high cost for each element. Depending on choices for delivery mechanisms, the total costs should be somewhere in between the three bottom-line figures.
Project management costs (Britain) Min cost Med cost Max cost
Running costs Project coordinator 33,000 35,000 38,000Data analyst/manager 26,000 28,000 30,000Volunteer officers (1,2 or 3 posts) 34,000 68,000 102,000Annual meeting and feedback literature 0 5,000 10,000
Subtotal (£) 93,000 136,000 180,000England @ 60% of subtotal (£) 55,800 81,600 108,000
Capital costs 200 training events (100 x volunteer travel, 200 x £150/day, or 10 x fixed-term)
10,000 30,000 36,000
Local IT and other support etc 0 25,000 50,000Web interface 0 5,000 20,000Publicity 0 10,000 20,000Field equipment (1000 nets & torches, high or low quality if provided at all)
0 10,000 50,000
Central computer hardware & software 6000 13,000 20,000Total (£) 109,000 229,000 376,000
England @ 60% of total (£) 65,400 137,400 225,600

137
The proportion of project management costs accountable to England would correspond to approximately 60% of the British cost. Capital costs would be required in year one only, but running costs would be incurred in each subsequent year. It would be wise to anticipate an annual inflationary increase in most or all costs, but this has not been factored into the costings at this stage. Project management structure (rare species only)
It is difficult to isolate management costs for the rare species elements of NARRS, as they would depend on a good volunteer coordination structure. With a support structure in place for a national volunteer network, a large proportion of rare reptile monitoring could be carried out by volunteers. However, under the current situation (ie no volunteer support structure), most rare species monitoring would continue to be borne by HCT staff and existing volunteers (and coverage would remain inconsistent). Therefore, to achieve the monitoring capacity needed for the rare species, at least three part/half-time posts would be needed. One post would be needed, perhaps at 25% pro rata, to include overall coordination, analysis, reporting, and licensing. In addition, to service a geographically diverse volunteer network, two posts would be most effective. Another post would be necessary at 50% pro rata to support/train the southern volunteer network, and 25% pro rata for data management. A half-time post would be necessary to train/maintain the volunteer networks in northwest England (and north Wales and southwest Scotland). (Ideally, beyond the scope of NARRS, this post would be combined with other habitat management, advice and advocacy roles to form a full-time post). The number of volunteers needed in the northwest might be fewer than in the southern counties, but the logistics of developing and managing them would be more costly, particularly in Cumbria. Fewer training courses would be needed in theory, but it is possible that some extra training capacity might be needed. This could be delivered by contractors or trained volunteers. The table below shows likely management costs for rare species monitoring across Britain. Very little of the rare species monitoring falls outside of England, therefore approximately 95% of the management costs are attributable to England. Project management costs (Britain) Min cost Med cost Max cost
Running costs Project coordinator (25% pro rata) 8,250 8,750 9,500Southern volunteer & database officer (75% pro rata) 22,500 24,000 25,500Northwest volunteer officer (50% pro rata) 15,000 16,000 17,000Annual meeting and feedback literature 0 500 1,000
Subtotal (£) 45,750 49,250 53,000England @ 95% of subtotal (£) 43,463 46,788 50,350
Capital costs Additional training capacity 0 3,000 6,000Central computer hardware & software 3,000 4,500 6,000
Total (£) 48,750 56,750 65,000England @ 95% of total (£) 46,313 53,913 61,750

138
As before, year 1 would incur capital and running costs, year 2 and subsequent years would only incur running costs. 6.2 Costings
The subsequent sections deal with each surveillance and monitoring objective individually, and the cost implications for each. English Nature provided pro-forma tables to accommodate three different costings options for data collection and project management components. These are presented in the appendices. The tables cover 2005/6 to 2014/15, but the costings have not been inserted until 2006/7 onwards as it is unrealistic to expect implementation of recording systems until then. The costings tables corresponding to each of the subsequent sections show the upper and lower extremes, and a middle range cost for each objective. It is notable that project management makes up the bulk of the project costs for all objectives. Volunteer expenses (if paid) would be a relatively small proportion of costs, but – as discussed earlier – a potentially greater concern would be the logistics of distributing expenses. Broad-scale surveillance projects (widespread species)
The costings given here are for surveillance/monitoring of all widespread species. Fieldwork would be grouped for the three newts and for the four widespread reptiles, but separate for common toad and common frog (at least temporally). As discussed earlier, if volunteers cannot be found to cover all sample sites, the possibility of using professional herpetologists to fill the gaps must be considered. With just 5% of fieldwork carried out by contractors making two visits per day, the cost of fieldwork increases by 32.5% (not including any capital costs for equipment). Obviously the significance of the additional cost is closely linked to the workload (sample size, periodicity, methods/visits). At the lower workload estimates, a 5% use of consultants is still far cheaper than the higher end cost of using 100% volunteers. At the higher end, it is 32.5% more expensive than using only volunteers. Hence, the feasibility of using consultants to fill any gaps in coverage depends heavily on the final calculations of sample size, choice of methodologies and timescales. It is also worth bearing in mind the level of these costs level relative to the management costs (which are considerable), and that incomplete data collection would have important consequences for statistical power. For the purposes of this exercise, three costed options were requested. The most extreme figures (highest and lowest) and the most desirable middle figure were selected as follows: 1) Low fieldwork estimate delivered by 100% volunteers, plus low management
estimate. 2) Low fieldwork estimate delivered by 95% volunteers and 5% contractors, plus
medium management estimate. 3) High fieldwork estimate delivered by 95% volunteers and 5% contractors, plus high
management estimate. Broad-scale monitoring could not begin until spring 2007 at the earliest. The design stage of NARRS (‘Phase 1’) could begin in 2005, as soon as funding is available, but it would need to
139
last 6-12 months. It would need to build consensus, establish methods and strategies, determine delivery mechanisms, and gather a funding consortium. Non-statutory funding would almost certainly be needed for the full roll-out of the programme (‘Phase 2’), and Phase 1 ought to culminate with the submission of appropriate funding bids (eg HLF). There would then be an inevitable delay in securing a funding package before the project could be set up, but if project management structures could be in place by the end of 2006, widespread species surveillance and monitoring could begin in spring 2007. One of the chief problems would be building the volunteer network in time. A clever recruitment strategy would need to be implemented quickly to ensure that volunteers were available for training and fieldwork in spring 2007. The costings in Appendix 1 are for England only. Note that the costings do not include an annual inflationary increase. In summary, the projected annual cost is likely to be between £81,400-432,300 in the first year, and then £71,800-314,700 per year thereafter. Surveillance of important species using a site inventory (rare species monitoring)
Monitoring of the three rare species involves visits to every site in each monitoring cycle, but methodological and timescale options require further attention. The costings demonstrate high, medium and low estimates for fieldwork and for management, under the assumption that a dedicated coordination structure may be needed if other elements of NARRS do not proceed. If broad-scale monitoring of widespread species does occur, then probably around 10-20% of the management costs could be attributed to the rare species, but not all components of the overall NARRS management costings would be applicable. Coordinating rare species monitoring as part of a bigger project would be much less costly than stand-alone rare species monitoring. Three proposed options are: 1) Low fieldwork estimate delivered by 50% HCT staff and 50% volunteers, plus low
management estimate. 2) Medium fieldwork estimate delivered by 50% HCT staff and 50% volunteers, plus
medium management estimate. 3) High fieldwork estimate delivered by 50% HCT staff and 50% volunteers, plus high
management estimate. The costings in Appendix 2 are for England only and do not include an annual inflationary increase. In summary, the projected annual cost is likely to be between £59,633-95,530 in the first year, and then £56,783-84,130 per year thereafter. Census work on very rare species
The only species falling into this category currently is the pool frog. It is extinct at present, but its reintroduction to one site in East Anglia is anticipated in 2005, after which it will be subjected to a programme of intensive monitoring beginning in 2006 (financial year 2006/7).

140
The reintroduction strategy is due to be published shortly, and recommends 12-20 monitoring visits per year, in suitable conditions between April to September, with the majority of effort in May and June (Buckley & Foster 2005). All visits will need to be carried out by professional herpetologist(s), and typically last half a day each. These will comprise 12 day visits and eight night visits (preceding day visits), with two people needed on eight of the day visits; this amounts to the equivalent to a total of 14 full days. The monitoring will continue in this format for at least ten years, after which the monitoring intensity may be reduced. The number of reintroduction sites is expected to increase to several, and each will require at least ten years of intensive monitoring. Assessment and reporting will take place every year, with more detailed summary after five years and ten years (Buckley & Foster 2005). The annual costings given in the previous tables are based upon the proposed monitoring regime beginning in 2006 at a single site, ie the only one firmly planned for 2005 at present. The costings in Appendix 3, however, are based on the proposed phasing of additional reintroductions: two in 2007, two in 2009, and two in 2011. (These are ambitious targets and serve as a maximum). As the costings are only for 2006/7 to 2014/15, any reductions in monitoring intensity after 10 years were not included. The management elements are costed at five days of HCT staff time per year initially (at £130 per day), increasing according to the projected reintroductions. The monitoring costs are indicative, and the three options are based upon paying a consultant at a rate of £150 per day, for 12, 16 or 20 visits to each site. In reality, costs are difficult to predict at this stage: some visits might be combined or visits may be paid as half-days, and sites might be close enough to visit more than one on the same day. As the pool frog would only be reintroduced to England, the costings in Appendix 3 are for England only. Note that the costings do not include an annual inflationary increase. In summary, the projected cost is likely to be between £2,450-3,650 for the first year, rising with anticipated reintroductions to £14,810-23,210 by year seven. Note that this is based on a contractor rate of £150 per day, which is a modest estimate and not necessarily a market rate. Additional costs to deliver Common Standards Monitoring
English Nature provided a list of SSSIs in England with herpetofauna as designated interest features, based on the best information available in January 2005 (J. Foster, pers. comm.). These comprise the following species and species assemblages: Species/assemblage Number of SSSIsGreat crested newt 36* Natterjack toad 12 Amphibian assemblage 16 Sand lizard 43 Smooth snake 38 Reptile assemblage 8 (* Currently 35, but least one additional great crested newt cSAC is likely to be designated soon).

141
The list comprises a total of 152 herpetofauna interest features, on a total of 106 SSSIs in England. Sand lizards and smooth snakes have the most overlap, with 32 SSSIs designated for both species. For this exercise, only additional costings over and above the proposed widespread and rare species monitoring schemes were requested. If widespread and rare species monitoring were to take place under NARRS, CSM would not necessarily require additional staff or management resources over and above those proposed for widespread species, but the coordination structures might be stretched. Depending on whether sampling regimes for the other objectives can include all CSM sites, additional fieldwork would still be needed for amphibian interest features (because of the higher regularity of assessments required) and possibly for reptiles. Great crested newt CSM needs two more visits in every six years than the triennial national system suggested above (ie 50% extra visits), and the widespread amphibian assemblages need one or two more visits respectively than the three- or six-year national cycles suggested (ie 50% extra visits). The CSM requirements for widespread reptile assemblages and the three rare species fit the regimes proposed above. The final costings attempt to isolate the costs incurred only by CSM, but it is also worthwhile considering the stand-alone costs of CSM as a whole. Calculating the additional costs of CSM is not straightforward, and in any case, if neither widespread nor rare species monitoring were to take place, it would be essential to know the stand-alone costs of a delivery mechanism for CSM only. The CSM guidance for Herpetofauna (JNCC 2004) was used to formulate the suggested monitoring regime and calculate the costings. For great crested newts, assessment is required in four consecutive years out of every six. It is assumed here that the assessment workload can be spread evenly between years, ie with 36 great crested newt SSSIs, two-thirds (24) could be assessed per year on a rolling cycle. For great crested newt SSSIs, three visits per assessment year are necessary to measure some variables, but the other less frequent measurements could be carried out during some of these visits. For natterjack toad, all 12 SSSIs must be assessed every year. At least three visits are required to monitor the animals, but up to six visits may be necessary depending on the toadlet production results obtained. The costings assume an average of five visits, which can double up as habitat-assessment visits. For amphibian assemblage SSSIs, monitoring must take place in three out of every six years, with 3-5 visits in each assessment year (depending on the species). The costings therefore assume an average of four visits per assessment, with biennial monitoring split evenly between years (8 SSSIs per year). Sand lizard, smooth snake and reptile assemblage SSSIs require assessment every three years, with 4-8 visits per assessment year. The number of visits would depend to a certain extent on their timing and success, therefore an average of six visits is assumed, with the assessments spread evenly across three years (15 sand lizard SSSIs, 13 smooth snake SSSIs, and 3 reptile assemblage SSSIs per year). For CSM, SSSIs are theoretically assessed according to the monitoring objectives set for each SSSI, and these are typically based around site units. However, as the CSM herpetofauna guidance was only introduced recently (JNCC 2004), it is unlikely that monitoring objectives for many SSSIs will have been set yet. For the purposes of this exercise, it is assumed that every population of a notified interest feature on each SSSI will have to be assessed. This might not necessarily be so if multiple populations exist within a site unit, but should represent the average scenario as sand lizard foci are typically smaller than site units, but

142
natterjack toad and smooth snake populations typically cross several site units. (See GIS baseline datasets; Gleed-Owen 2004a). Given the range of CSM assessment methods (JNCC 2004) and site sizes, it is difficult to estimate how long a visit would take. Most of the SSSIs with rare herpetofauna interest cover large areas with multiple populations. It is assumed here that four sand lizard foci or smooth snake populations can be assessed in a day, or one natterjack toad population. This suggests an average of about two days would be needed to assess a rare reptile population, or about five days for a sand lizard population. Without knowing the extent of the interest on the great crested newt and species assemblage SSSIs, it is difficult to calculate the time necessary to assess them. Some assessments might take several days to complete, whilst for others a day might be sufficient. Amphibian assessments would be more clearly focused around breeding ponds that could be visited in one or two evenings (amounting to two visits, but one day’s pay if delivered by professionals).
Reptile assemblage sites are likely to be fairly large and it could be assumed that the average assessment would take two days to complete. Widely differing travel times mean that time budgets and any costs associated with travel are surprisingly difficult to predict. Monitoring
regime SSSIs with
notified interest
Total no. of sampling
sites/ populations
Regularity of
monitoring
Suggested timetabling
Number of SSSIs visited
per year
Number of visits
per assessm't
year (average)
Average time to assess
each SSSI (per visit)
Total days per year
Great crested newt
36 at least 36 4 out of 6 years
(consec.)
Two-thirds of 36 SSSIs every year
24 (67%) 3 (3) 1 day? 72
Natterjack toad
12 (71% of all)
36 (71% of 50)
Every year All 12 SSSIs every year
12 (100%)
3-6 (5) 5 days 180
Amphibian assemblage
16 at least 16 Every 2 years
Half of 16 SSSIs per
year
8 (50%) 3-5 (4) 1 day? 32
Sand lizard 43 (78% of all)
410 (78% of 526)
Every 3 years
One third of 43 SSSIs per
year
c.15 (33%)
4-8 (6) 2.3 days 205
Smooth snake
38 (36% of all)
72 (36% of c.200)
Every 3 years
One third of 38 SSSIs per
year
c.13 (33%)
4-8 (6) 1.9 days 144
Reptile assemblage
8 at least 8 Every 3 years
One third of 8 SSSIs per
year
c.3 (33%) 4-8 (6) 2 days? 36
Most of England’s rare species populations are designated interest features (78% of sand lizard foci, 71% of natterjack toad populations, and 36% of smooth snake populations), therefore CSM could be achieved by a rare species monitoring scheme if it covered all rare species sites. However, the options proposed earlier included sampling rare species sites, rather than visiting all sites, and it is useful to at least consider the cost of CSM if delivered independently (although to reiterate, the costings in the final table are only those costs over and above the other aspects of NARRS).
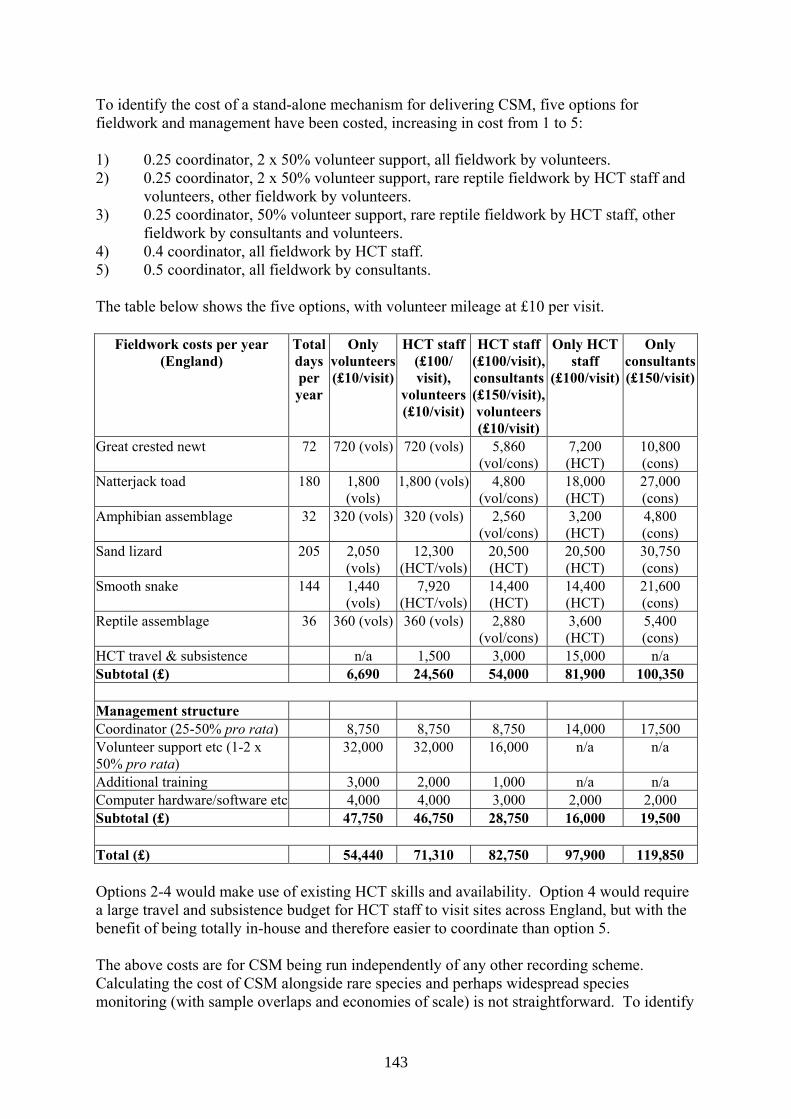
143
To identify the cost of a stand-alone mechanism for delivering CSM, five options for fieldwork and management have been costed, increasing in cost from 1 to 5: 1) 0.25 coordinator, 2 x 50% volunteer support, all fieldwork by volunteers. 2) 0.25 coordinator, 2 x 50% volunteer support, rare reptile fieldwork by HCT staff and
volunteers, other fieldwork by volunteers. 3) 0.25 coordinator, 50% volunteer support, rare reptile fieldwork by HCT staff, other
fieldwork by consultants and volunteers. 4) 0.4 coordinator, all fieldwork by HCT staff. 5) 0.5 coordinator, all fieldwork by consultants. The table below shows the five options, with volunteer mileage at £10 per visit.
Fieldwork costs per year (England)
Total days per year
Only volunteers (£10/visit)
HCT staff (£100/ visit),
volunteers (£10/visit)
HCT staff (£100/visit), consultants (£150/visit), volunteers (£10/visit)
Only HCT staff
(£100/visit)
Only consultants (£150/visit)
Great crested newt 72 720 (vols) 720 (vols) 5,860 (vol/cons)
7,200 (HCT)
10,800 (cons)
Natterjack toad 180 1,800 (vols)
1,800 (vols) 4,800 (vol/cons)
18,000 (HCT)
27,000 (cons)
Amphibian assemblage 32 320 (vols) 320 (vols) 2,560 (vol/cons)
3,200 (HCT)
4,800 (cons)
Sand lizard 205 2,050 (vols)
12,300 (HCT/vols)
20,500 (HCT)
20,500 (HCT)
30,750 (cons)
Smooth snake 144 1,440 (vols)
7,920 (HCT/vols)
14,400 (HCT)
14,400 (HCT)
21,600 (cons)
Reptile assemblage 36 360 (vols) 360 (vols) 2,880 (vol/cons)
3,600 (HCT)
5,400 (cons)
HCT travel & subsistence n/a 1,500 3,000 15,000 n/a Subtotal (£) 6,690 24,560 54,000 81,900 100,350
Management structure Coordinator (25-50% pro rata) 8,750 8,750 8,750 14,000 17,500 Volunteer support etc (1-2 x 50% pro rata)
32,000 32,000 16,000 n/a n/a
Additional training 3,000 2,000 1,000 n/a n/a Computer hardware/software etc 4,000 4,000 3,000 2,000 2,000 Subtotal (£) 47,750 46,750 28,750 16,000 19,500
Total (£) 54,440 71,310 82,750 97,900 119,850 Options 2-4 would make use of existing HCT skills and availability. Option 4 would require a large travel and subsistence budget for HCT staff to visit sites across England, but with the benefit of being totally in-house and therefore easier to coordinate than option 5. The above costs are for CSM being run independently of any other recording scheme. Calculating the cost of CSM alongside rare species and perhaps widespread species monitoring (with sample overlaps and economies of scale) is not straightforward. To identify

144
the additional costs over and above the proposed widespread and rare species monitoring, a whole raft of issues need to be considered and factored in to the calculations: • CSM requires 50% more great crested newt visits than proposed for broad-scale
surveillance of widespread species (ie 50% of the fieldwork costs above). • CSM requires 50% more amphibian assemblage visits than proposed for broad-scale
surveillance of widespread species (ie 50% of the fieldwork costs above). • If CSM sites could not be accommodated in the sampling for widespread amphibians,
no additional sites would have to be visited. • If CSM sites could not be accommodated in the sampling for widespread amphibians,
then all CSM sites could potentially be additional to the broadscale regimes, and any overlaps would be coincidental (ie up to 100% of fieldwork costs above for great crested newt and amphibian assemblages).
• If sand lizard and smooth snake monitoring involved all sites equally, then CSM would incur no extra fieldwork costs.
• If sand lizard and smooth snake monitoring involved all sites but with differential effort, CSM would incur extra costs (difficult to predict).
• If sand lizard monitoring involved a sample of (for example) 50 sites, then CSM would account for 88% of fieldwork costs above.
• If smooth snake monitoring involved a sample of (for example) 20 sites, then CSM would account for 28% of fieldwork costs above.
• If CSM sites could not be accommodated in the sampling for widespread reptiles, no additional sites would have to be visited.
• If CSM sites could not be accommodated in the sampling for widespread reptiles, then all CSM sites could potentially be additional to the broadscale regimes, and any overlaps would be coincidental (ie up to 100% of fieldwork costs above for reptile assemblages).
• The equivalent of at least half a coordination/support post would be attributable to CSM, and a commensurate proportion of other costs.
• The calculation of costs for CSM depend very much on the choices of regime made for the other surveillance and monitoring objectives.
Hence provide a simple costing for ‘Additional costs to deliver Common Standards Monitoring’ is a tall order. The costs are difficult to predict, particularly without knowing the likelihood of funding for other monitoring activities, but an attempt has been made at three costed options for CSM. With the above points in mind, the costings were calculated using different proportions of the middle option of the relevant element of the fieldwork costs (pro rata) from the respective rare and widespread species costings, as follows: • Great crested newt : 50, 75 and 100% of widespread species surveillance/monitoring
costs. • Amphibian assemblages: 50, 75 and 100% of widespread species
surveillance/monitoring costs. • Reptile assemblages: 0, 50 and 100% of widespread surveillance/monitoring costs. • Sand lizard: 0, 44 and 88% of rare species surveillance/monitoring costs.

145
• Smooth snake: 0, 14 and 28% of rare species surveillance/monitoring of costs • Natterjack toad: no extra cost. Management costs have been set at three different levels, from half a post to two half-posts (or equivalent) attributable to CSM, plus £5-15,000 capital costs. The costings in Appendix 4 are for England only and do not include an annual inflationary increase. In summary, the projected annual cost of CSM is likely to be between £23,384-65,422 in the first year, and then £18,384-50,422 per year thereafter. 7 References ARNOLD, H.R. 1973. Provisional atlas of the amphibians and reptiles of the British Isles. Huntingdon: Biological Records Centre. ARNOLD, H.R. 1995. Atlas of amphibians and reptiles in Britain. ITE research publication no.10. London: HMSO. BAKER, J. 2003. Great Crested Newt Pilot Monitoring Project (Glamorgan, Hampshire, Kent and Sussex). English Nature Research Reports, No. XXX. BAKER, J., SUCKLING, J., & CAREY, R. 2004. Status of the adder Vipera berus and slow-worm Anguis fragilis in England. English Nature Research Reports, No. 546. BARKER, M., & ELLIOTT, M. Undated (2001). Sussex Amphibian & Reptile Group Millennium Report. A Great Leap Forward. Sussex Amphibian & Reptile Group. BAT CONSERVATION TRUST. 2004. The National Bat Monitoring Programme Annual Report 2003. London: The Bat Conservation trust. BEEBEE, T.J.C., & BUCKLEY, J. 2001. Natterjack toad (Bufo calamita) site register for the UK 1970-1999 inclusive. Unpublished report by the University of Sussex and The Herpetological Conservation Trust. BEEBEE, T.J.C., & GRIFFITHS, R.A. 2000. Amphibians and reptiles. A natural history of the British herpetofauna. London: HarperCollins. BEEBEE, T.J.C., and others. 2005. Neglected native or undesirable alien? Resolution of an unusual conservation dilemma concerning the pool frog Rana lessonae. Biodiversity and Conservation, 14, 1607-1626. BENSON, P.A. 1999. Identifying individual adders Vipera berus, within an isolated colony in East Yorkshire. Herpetological Society Bulletin, 67, 21-27.

146
BERGLIND, S.-A. 2004. Sand lizard Lacerta agilis in Central Sweden. Modelling juvenile reintroduction and spatial management strategies for metapopulation establishment. In: H.R. AKÇAKAYA and others (ed.). Species Conservation and Management: Case Studies. Oxford: Oxford University Press. BIRDLIFE INTERNATIONAL. 2004. Birds in the European Union: a status assessment. Wageningen: Birdlife International. BORGULA, A., FALLOT, P., & RYSER, J. 1994. Inventar der Amphibienlaichgebiete von nationaler Bedeutung: Schlussbericht. Schriftenreihe Umwelt 233 (Bundesamt für Umwelt, Wald und Landschaft), Bern, Switzerland. BRAITHWAITE, A.C., and others. 1989. The distribution of the smooth snake Coronella austriaca Laurenti. Herpetological Journal, 1, 370-376. BREEDS, J.M. 1973 . A study of the smooth snake (Coronella austriaca) in the Purbeck area. Nature Conservancy Council. BRITISH TRUST FOR ORNITHOLOGY. 1999. Developing a mammal monitoring programme for the UK. BTO Research Report No. 223. BUCKLEY, J., & BEEBEE, T.J.C. 2004. Monitoring the conservation status of an endangered amphibian: the natterjack toad Bufo calamita in Britain. Animal Conservation, 7: 221 – 228. BUCKLEY, J., & FOSTER, J. 2005. Reintroduction strategy for the pool frog (Rana lessonae) in England. English Nature Research Reports, in preparation. CARRIER, J-A., & BEEBEE, T.J.C. 2003. Recent, substantial, and unexplained declines of the common toad Bufo bufo in lowland England. Biological Conservation, 111: 395 – 399. CHEUNG, M., & GENT, T. 1996. Evaluation of refuges for surveying common reptile species at two sites in Northamptonshire and Hampshire. In: J. FOSTER & T. GENT (eds.) Reptile survey methods. English Nature Science Series, 27, 71-99. CLEMONS, J. 1996. A Provisional Atlas of the Amphibians and Reptiles of Warwickshire. Warwickshire Museum Service, Warwick. CLEMONS, J. 1999. Changes in a common toad population over 10 years. 1999. Froglog, Newsletter of the Declining Amphibian Population Taskforce, 35, 1-2. COOKE, A.S. 1972. Indications of recent changes in status of the British Isles of the frog Rana temporaria and the toad Bufo bufo. Journal of Zoology, 167, 161-178. COOKE, A.S., & ARNOLD, H.R. 1982. National changes in status of the commoner British amphibians and reptiles before 1974. British Journal of Herpetology, 6, 206-207. COOKE, A.S., & SCORGIE, H.R.A. 1983. The status of the commoner amphibians and reptiles in Britain. Focus on nature conservation, 3. Huntingdon: Nature Conservancy Council.

147
CORBETT, K.F. 1988a. Distribution and status of the sand lizard Lacerta agilis agilis in Britain. Mertensiella, 1, 92-99. CORBETT, K.F. 1988b. Conservation strategy for the sand lizard Lacerta agilis agilis in Britain. Mertensiella, 1, 101-109. CORBETT, K.F. 1994. Pilot study for Sand Lizard UK Recovery Programme. English Nature Research Reports, No.102. CORBETT, K., & MOULTON, N. 1996. Monitoring sand lizards in Dorset under the Species Recovery Programme. In: J. FOSTER & T. GENT (eds.). Reptile survey methods. English Nature Science Series, 27, 105-107. CORBETT, K.F., & TAMARIND, D.L. 1979. Conserrvation of the sand lizard Lacerta agilis, by habitat management. British Journal of Herpetology, 5, 799-823. EDGAR, P., & GRIFFITHS, R.A. 2004. An evaluation of the effectiveness of great crested newt Triturus cristatus mitigation projects in England, 1990-1991. English Nature research reports, No. 575. EDGAR, P.W., GRIFFITHS, R.A., & FOSTER, J.P. 2005. Evaluation of translocation as a tool for mitigating development threats to great crested newts Triturus cristatus in England, 1990-2001. Biological Conservation, 122, 45-52. ENGLISH NATURE AND PROJECT PARTNERS. 2004. The National Biodiversity Network Southwest Pilot Project. Final Project Report. Peterborough: English Nature. EUROPEAN COMMISSION SCIENTIFIC WORKING GROUP. 2004. Assessment, monitoring and reporting of conservation status – Preparing the 2007 report under Article 17 of the Habitats Directive (DocHab-04-03/03 rev.2). Unpublished paper. FEARNLEY, H. 2002. A photographic study of reproductive behaviour in the sand lizard Lacerta agilis on a Dorset nature reserve. Herpetological Bulletin, 82, 10-19. FITTER, R.S.R. 1959. The Ark in Our Midst. London: Collins. FOSTER, J.P. 2004. Species surveillance strategy: reptiles and amphibians. Unpublished note. Peterborough: English Nature. FOSTER, J., & GENT, T. (eds.) 1996. Reptile survey methods: proceedings of a seminar held on 7 November 1995 at the Zoological Society of London’s meeting rooms, Regent’s Park, London. English Nature Science Series, 27. GAYWOOD, M.J., & SPELLERBERG, I.F. 1996. Thermal ecology 1: Thermal ecology of reptiles and implication for survey and monitoring. In: J. Foster & T. Gent (eds.) Reptile survey methods. English Nature Science Series, 27, 9-22. GENT, A.H. 1988. Movement and dispersion of the smooth snake Coronella austriaca Laurenti in relation to habitat. Unpublished PhD thesis, Southampton University.
148
GENT, T., SHEWRY, M. & SPELLERBERG, I. 1996. Activity of the smooth snake: observations of animals in the field and their relevance to developing a survey technique for the species. In: J. FOSTER & T. GENT (eds.) Reptile survey methods. English Nature Science Series, 27, 162-173. GENT, AH., & SPELLERBERG, I.F. 1993. Movement rates of the smooth snake Coronella austriaca (Colubridae): a radio-telemetric study. Herpetological Journal, 3, 140-146. GENT, A.H. & SPELLERBERG, I.F. 1996. Thermal ecology 2: The thermal ecology of the smooth snake Coronella austriaca and its application to conservation and survey. In: J. FOSTER & T. GENT (eds.) Reptile survey methods. English Nature Science Series, 27, 9-23-42. GIBB, R., & FOSTER, J. 2000. The Herpetofauna Workers Guide 2000. Halesworth: Froglife. GLEED-OWEN, C.P. 2004a. Initial surveillance baseline datasets for the sand lizard Lacerta agilis, natterjack toad Bufo calamita and smooth snake Coronella austriaca in England. Unpublished report for English Nature, Peterborough. GLEED-OWEN, C.P. 2004b. Green lizards and wall lizards on Bournemouth cliffs. Herpetological Bulletin, 88, 3-7. GODDARD, P. 1984. Morphology, growth, food habits and population characteristics of the Smooth snake Coronella austriaca in Southern Britain. Journal of the Zoological Society of London, 204, 241-257. GRIFFITHS, R.A., & RAPER, S.J. 1994. A review of current techniques for sampling amphibian communities. JNCC Report No. 210. Peterborough: Joint Nature Conservation Committee. GRIFFITHS, R.A., RAPER, S.J., & BRADY, L.D. 1996. Evaluation of a standard method for surveying common frogs (Rana temporaria) and newts (Triturus cristatus, T. helveticus and T. vulgaris). JNCC Report No. 259. Peterborough: Joint Nature Conservation Committee. HALAHAN, R., & MAY, R. 2003. Favourable Conservation Status – to the heart of EU wildlife legislation. Godalming: WWF- UK. HAINES-YOUNG, R.H., and others. 2000. Accounting for nature: assessing habitats in the UK countryside (2000). London: DETR. HILTON-BROWN, D., & OLDHAM, R.S. 1991. The status of the widespread amphibians and reptiles in Britain, 1990, and changes during the 1980's. Nature Conservancy Council Contract surveys, 131. HOUSE, S.M., & SPELLERBERG, I.F. 1983. Ecology and conservation of the sand lizard Lacerta agilis L. habitat in southern England. Journal of Applied Ecology, 20, 417-437.
149
HOWES, C.A. 1973. The history and distribution of reptiles and amphibians in southeast Yorkshire and the Doncaster district. Naturalist, Hull, 1973, 121-132. INNS, H. 1996. Survey methodology for British reptiles: a practical proposition? and Appendix: Survey Guidelines for the Widespread British Reptiles. In: J. FOSTER & T. GENT (eds.) Reptile survey methods. English Nature Science Series, 27, 131-137. JNCC. 2004. Common Standards Monitoring Guidance for Reptiles and Amphibians, Version February 2004. ISSN 1743-8160. Peterborough: JNCC. LANGTON, T. 1991. Distribution and status of reptiles and amphibians in the London area. The London Naturalist, 70, 97-124. LEIGHTON, G. 1903. The life history of the British lizards and their local distribution in the British Isles. London: Blackwood. MACDONALD, D.W., MACE, G., & RUSHTON, S. 1998. Proposals for monitoring British mammals. Report for DETR & JNCC by the Wildlife Conservation Research Unit, University of Oxford. NAKAGAWA, S. 2004. A farewell to Bonferroni: the problems of low statistical power and publication bias. Behavioural Ecology, 15(6), 1044-1045. NATIONAL FEDERATION FOR BIOLOGICAL RECORDING. 2002. The Status of Local Record Centres in the UK, 2002. NFBR. NATURE CONSERVANCY COUNCIL . 1983. The ecology and conservation of amphibian and reptile species in Britain. London: Nature Conservancy Council NATURE CONSERVANCY COUNCIL. 1989. Guidelines for selection of biological SSSI. Peterborough: Nature Conservancy Council. NICHOLSON, A.M., & SPELLERBERG, I.F. 1989. Activity and home range of the lizard Lacerta agilis L. Herpetological Journal, 1, 362-365. OLDHAM, R.S., & NICHOLSON, M. 1986. Status and ecology of the warty newt (Triturus cristatus). Peterborough: Nature Conservancy Council. PELLET, J., & SCHMIDT, B.R . 2005. Monitoring distributions using call surveys: estimating site occupancy, detection probabilities and inferring absence. Biological Conservation, in press. PENROSE, R.S. 2004 . UK & Eire marine turtle strandings & sightings. Annual Report 2004. Cardigan: Marine Environmental Monitoring. PENROSE, R.S. 2005. UK & Eire marine turtle strandings & sightings. Annual Report 2003. Cardigan: Marine Environmental Monitoring. PHELPS, T.E. 1978. Seasonal movement of the snakes Coronella austriaca, Vipera berus and Natrix natrix in southern England. British Journal of Herpetology, 5, 755-761.

150
PHELPS, T.E. 2004. Beyond hypothesis – a long-term study of British snakes. British Wildlife, 15 (5), 319- 327. PHILP, E.G. 1998. Provisional atlas of the amphibians and reptiles of Kent. Transactions of the Kent Field Club, 15(2): 61-81. PITHART, D., SCOTT, W.A., & ADAMSON, J.K. 2003. Variation in spawning and migration of the common frog (Rana temporaria) in response to weather and climate. BES Annual Meeting 2003, Manchester 9-11 September, Abstracts, 3. POLLOCK, K.H., and others. 2002. Large scale wildlife monitoring studies: statistical methods for design and analysis. Environmetrics, 13, 105-119. POND ACTION. 2000. A guide to monitoring the ecological quality of ponds and canals using PSYM. Oxford: Pond Action (now Pond Conservation). PRESTT, I., COOKE, A.S., & CORBETT, K.F. 1974. British Amphibians and Reptiles. In: D.L. HAWKESWORTH (ed.) The Changing Flora and Fauna of Britain, 229-254. London: Academic Press, London. PUKY, M., and others. 2001. Intensive herpetofauna mapping in Hungary. Biota, 2, Supplement: 103-104. QUAYLE, A., & NOBLE, M. 2000. The wall lizard in England. British Wildlife, 12(2), 99-106. RAVEN, M.J., NOBLE, D.G., & BAILLIE, S.R. 2002. The Breeding Bird Survey 2001. Report Number 7. BTO, JNCC & RSPB. READING, C.J. 1996a. Evaluation of reptile survey methodologies. Final report. English Nature Research Reports, No. 200. READING, C.J. 1996b. Validation of reptile survey methodologies. In: J. FOSTER, & T. GENT (eds.) Reptile survey methods. English Nature Science Series, 27, 138-146. READING, C.J. 1997. A proposed standard method for surveying reptiles on dry lowland heath. Journal of Applied Ecology, 34, 1057-1069. READING, C.J. 2003. The effects of variation in climatic temperature (1980-2001) on breeding activity and tadpole stage duration in the common toad Bufo bufo. Science of the Total Environment, 310, 231-236. RIDDELL, A. 1996. Monitoring slow—worms and common lizards, with special reference to refugia materials, refugia occupancy and individual recognition. In: J. FOSTER & T. GENT (eds.) Reptile survey methods. English Nature Science Series, 27, 46-60. RIDDELL, A. (ed.) 1997. The slow-worm. Kent Reptile and Amphibian Group.

151
RYSER, J. 2002. Bundesinventar der Amphibienlaichgebiete von nationaler Bedeutung: Vollzugshilfe. Available from: http://www.umwelt-schweiz.ch/buwal/shop/files/pdf/phpjNEUEt.pdf. SCHMIDT, B.R. 2004. Declining amphibian populations: the pitfalls of count data in the study of diversity, distributions, dynamics, and demography. Herpetologicl Journal, 14, 167-174. SCHWEIZERISCHER BUNDESRAT (Swiss Government). 2001. Verordnung vom 15. Juni 2001 über den Schutz der Amphibienlaichgebiete von nationaler Bedeutung (Amphibienlaichgebiete-Verordnung; AlgV). Bern, Switzerland. SHELDON, S., & BRADLEY, C. 1989. Identification of individual adders (Vipera berus) by their head markings. Herpetological Journal, 1, 392-396. SMITH, M.A. 1951. The British Amphibians and Reptiles. London: Collins. SPELLERBERG, I.F. 1975. Conservation and management of Britain’s reptiles based on their ecological and behavioural requirements: a progress report. Biological Conservation, 7, 289-300. SPELLERBERG, I.F., & PHELPS, T.E. 1977. Biology, general ecology and behaviour of the snake Coronella austriaca. Biological Journal of the Linnean Society, 9, 133-164. STRIJBOSCH, H. 1988. Reproductive biology and conservation of the sand lizard. Mertensiella, 132-145. SWAN, M.J.S., & OLDHAM, R.S. 1989. Amphibian communities. Final report. Peterborough: Nature Conservancy Council. SWAN, M.J.S., & OLDHAM, R.S. 1993a. Herptile sites volume 1: national amphibian survey final report. English Nature Research reports, No. 38, SWAN, M.J.S. & OLDHAM, R.S. 1993b. Herptile sites volume 2: national common reptile survey final report. English Nature Research reports, No. 38. TAYLOR, R.H.R. 1948. The Distribution of Reptiles and Amphibia in the British Isles, with notes on Species recently introduced. British Journal of Herpetology, 1, 1-38. TAYLOR, R.H.R. 1963. The distribution of amphibians and reptiles in England, Wales, Scotland and Ireland and the Channel Islands: a revised survey. British Journal of Herpetology, 3 (5), 95-115. THE BAT CONSERVATION TRUST. 2001. The UK’s National Bat Monitoring Programme. Final Report 2001. The Bat Conservation Trust (London) & Defra. UK BIODIVERSITY ACTION PARTNERSHIP. 1995. UK Biodiversity Action Plan. Peterborough: Joint Nature Conservation Committee.

152
WHITAKER, W. 1996. What can be learned from a month’s intensive transect study? In: J. FOSTER. & T. GENT (eds.) Reptile survey methods. English Nature Science Series, 27, 113-130. WILLIAMS, P., and others. 1998. Biological techniques of still water quality assessment. Phase 2. Method development. Environment Agency R&D Technical Report E56. Bristol: Environment Agency. WOOD, M. 2002. Toad Crossing Report 2002. Unpublished report. Bristol: Bristol: Avon Wildlife Trust. WRIGHT, S., OSBORNE, J., & PURSGLOVE, C. 2004. Frogs and Friends. The Distribution and Conservation of Amphibians and Reptiles in Nottinghamshire. Nottingham: Nottingham Natural History Museum. WYCHERLEY, J. 2003. Water frogs in Britain. British Wildlife, 14, 260-269. WYCHERLEY, J., & ANSTIS. 2001. Amphibians and Reptiles of Surrey. Woking: Surrey Wildlife trust. YALDEN, D.W. 1965. Distribution of reptiles and amphibians in the London Area. London Naturalist, 44, 57-69. YOUNG, S., & BEEBEE, T.J.C. 2004. An investigation into recent declines in the common toad Bufo bufo. English Nature Research Reports, No. 584.

153
Appendices 1. Indicative costings for broad-scale surveillance projects 2. Indicative costings for surveillance of important species using a site inventory 3. Indicative costings for census work on very rare species 4. Additional costs to deliver Common Standards Monitoring 5. European and North American herpetofauna surveillance schemes 6. A questionnaire survey of the ARGs’ views on NARRS


155
Appendix 1. Indicative costings for broad-scale surveillance projects Option 1 FY & Year in monitoring cycle
1 2 3 4 5 6 7 8 9 10 Costs No. sites 2005/6 2006/7 2007/8 2008/9 2009/10 2010/11 2011/12 2012/13 2013/14 2014/15
Newts 450 4,500 4,500 4,500 4,500 4,500 4,500 4,500 4,500 4,500 Common toad 600 2,000 2,000 2,000 2,000 2,000 2,000 2,000 2,000 2,000 Common frog 1,500 5,000 5,000 5,000 5,000 5,000 5,000 5,000 5,000 5,000 Widespread reptiles 900 4,500 4,500 4,500 4,500 4,500 4,500 4,500 4,500 4,500 Survey co-ordination, data management, reporting and interpretation
65,400 55,800 55,800 55,800 55,800 55,800 55,800 55,800 55,800
Total (£) 81,400 71,800 71,800 71,800 71,800 71,800 71,800 71,800 71,800
Option 2 FY & Year in monitoring cycle 1 2 3 4 5 6 7 8 9 10
Costs No. sites 2005/6 2006/7 2007/8 2008/9 2009/10 2010/11 2011/12 2012/13 2013/14 2014/15 Newts 450 5,110 5,110 5,110 5,110 5,110 5,110 5,110 5,110 5,110 Common toad 600 2,650 2,650 2,650 2,650 2,650 2,650 2,650 2,650 2,650 Common frog 1,500 6,625 6,625 6,625 6,625 6,625 6,625 6,625 6,625 6,625 Widespread reptiles 900 5,963 5,963 5,963 5,963 5,963 5,963 5,963 5,963 5,963 Survey co-ordination, data management, reporting and interpretation
137,400 81,600 81,600 81,600 81,600 81,600 81,600 81,600 81,600
Total (£) 157,748 101,948 101,948 101,948 101,948 101,948 101,948 101,948 101,948
Option 3 FY & Year in monitoring cycle 1 2 3 4 5 6 7 8 9 10
Costs No. sites 2005/6 2006/7 2007/8 2008/9 2009/10 2010/11 2011/12 2012/13 2013/14 2014/15 Newts 1,800 31,800 31,800 31,800 31,800 31,800 31,800 31,800 31,800 31,800 Common toad 3,200 42,400 42,400 42,400 42,400 42,400 42,400 42,400 42,400 42,400 Common frog 6,000 53,000 53,000 53,000 53,000 53,000 53,000 53,000 53,000 53,000 Widespread reptiles 3,600 79,500 79,500 79,500 79,500 79,500 79,500 79,500 79,500 79,500 Survey co-ordination, data management, reporting and interpretation
225,600 108,000 108,000 108,000 108,000 108,000 108,000 108,000 108,000
Total (£) 432,300 314,700 314,700 314,700 314,700 314,700 314,700 314,700 314,700
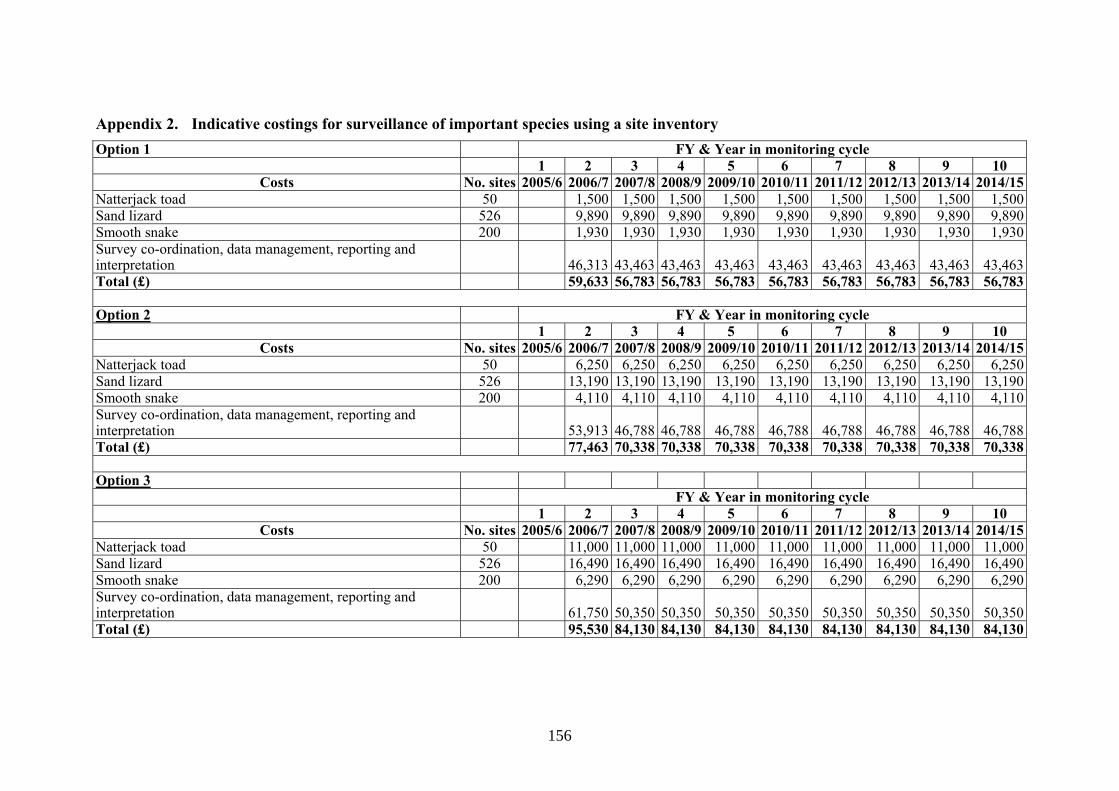
156
Appendix 2. Indicative costings for surveillance of important species using a site inventory Option 1 FY & Year in monitoring cycle
1 2 3 4 5 6 7 8 9 10 Costs No. sites 2005/6 2006/7 2007/8 2008/9 2009/10 2010/11 2011/12 2012/13 2013/14 2014/15
Natterjack toad 50 1,500 1,500 1,500 1,500 1,500 1,500 1,500 1,500 1,500 Sand lizard 526 9,890 9,890 9,890 9,890 9,890 9,890 9,890 9,890 9,890 Smooth snake 200 1,930 1,930 1,930 1,930 1,930 1,930 1,930 1,930 1,930 Survey co-ordination, data management, reporting and interpretation
46,313 43,463 43,463 43,463 43,463 43,463 43,463 43,463 43,463
Total (£) 59,633 56,783 56,783 56,783 56,783 56,783 56,783 56,783 56,783
Option 2 FY & Year in monitoring cycle 1 2 3 4 5 6 7 8 9 10
Costs No. sites 2005/6 2006/7 2007/8 2008/9 2009/10 2010/11 2011/12 2012/13 2013/14 2014/15 Natterjack toad 50 6,250 6,250 6,250 6,250 6,250 6,250 6,250 6,250 6,250 Sand lizard 526 13,190 13,190 13,190 13,190 13,190 13,190 13,190 13,190 13,190 Smooth snake 200 4,110 4,110 4,110 4,110 4,110 4,110 4,110 4,110 4,110 Survey co-ordination, data management, reporting and interpretation
53,913 46,788 46,788 46,788 46,788 46,788 46,788 46,788 46,788
Total (£) 77,463 70,338 70,338 70,338 70,338 70,338 70,338 70,338 70,338 Option 3 FY & Year in monitoring cycle
1 2 3 4 5 6 7 8 9 10 Costs No. sites 2005/6 2006/7 2007/8 2008/9 2009/10 2010/11 2011/12 2012/13 2013/14 2014/15
Natterjack toad 50 11,000 11,000 11,000 11,000 11,000 11,000 11,000 11,000 11,000 Sand lizard 526 16,490 16,490 16,490 16,490 16,490 16,490 16,490 16,490 16,490 Smooth snake 200 6,290 6,290 6,290 6,290 6,290 6,290 6,290 6,290 6,290 Survey co-ordination, data management, reporting and interpretation
61,750 50,350 50,350 50,350 50,350 50,350 50,350 50,350 50,350
Total (£) 95,530 84,130 84,130 84,130 84,130 84,130 84,130 84,130 84,130
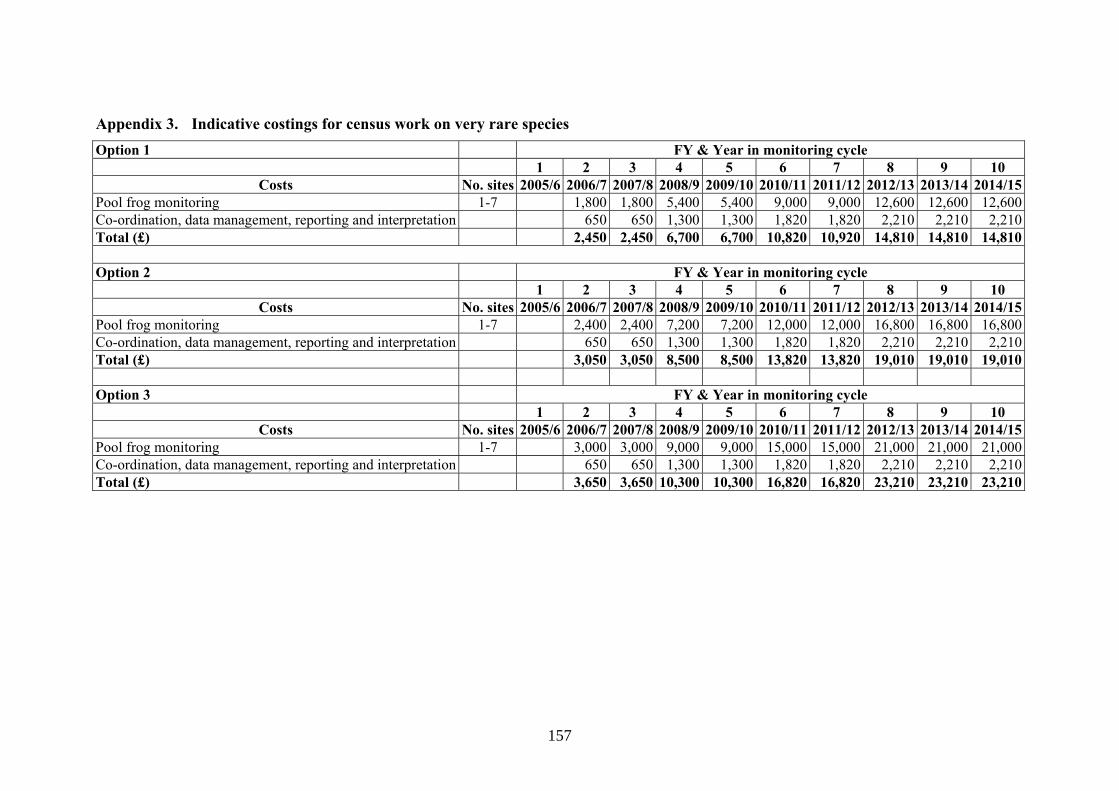
157
Appendix 3. Indicative costings for census work on very rare species Option 1 FY & Year in monitoring cycle
1 2 3 4 5 6 7 8 9 10 Costs No. sites 2005/6 2006/7 2007/8 2008/9 2009/10 2010/11 2011/12 2012/13 2013/14 2014/15
Pool frog monitoring 1-7 1,800 1,800 5,400 5,400 9,000 9,000 12,600 12,600 12,600 Co-ordination, data management, reporting and interpretation 650 650 1,300 1,300 1,820 1,820 2,210 2,210 2,210 Total (£) 2,450 2,450 6,700 6,700 10,820 10,920 14,810 14,810 14,810
Option 2 FY & Year in monitoring cycle
1 2 3 4 5 6 7 8 9 10 Costs No. sites 2005/6 2006/7 2007/8 2008/9 2009/10 2010/11 2011/12 2012/13 2013/14 2014/15
Pool frog monitoring 1-7 2,400 2,400 7,200 7,200 12,000 12,000 16,800 16,800 16,800 Co-ordination, data management, reporting and interpretation 650 650 1,300 1,300 1,820 1,820 2,210 2,210 2,210 Total (£) 3,050 3,050 8,500 8,500 13,820 13,820 19,010 19,010 19,010 Option 3 FY & Year in monitoring cycle
1 2 3 4 5 6 7 8 9 10 Costs No. sites 2005/6 2006/7 2007/8 2008/9 2009/10 2010/11 2011/12 2012/13 2013/14 2014/15
Pool frog monitoring 1-7 3,000 3,000 9,000 9,000 15,000 15,000 21,000 21,000 21,000 Co-ordination, data management, reporting and interpretation 650 650 1,300 1,300 1,820 1,820 2,210 2,210 2,210 Total (£) 3,650 3,650 10,300 10,300 16,820 16,820 23,210 23,210 23,210

158
Appendix 4. Additional costs to deliver Common Standards Monitoring Option 1 FY & Year in monitoring cycle
1 2 3 4 5 6 7 8 9 10 11 12 Costs No. sites 2005/6 2006/7 2007/8 2008/9 2009/10 2010/11 2011/12 2012/13 2013/14 2014/15 2015/16 2016/17
Great crested newt 36 612 612 612 612 612 612 612 612 612 612 612 Natterjack toad 12 0 0 0 0 0 0 0 0 0 0 0 Amphibian assemblage 16 272 272 272 272 272 272 272 272 272 272 272 Sand lizard 43 0 0 0 0 0 0 0 0 0 0 0 Smooth snake 38 0 0 0 0 0 0 0 0 0 0 0 Reptile assemblage 8 0 0 0 0 0 0 0 0 0 0 0 Survey co-ordination, data management, reporting and interpretation
22,500 17,500 17,500 17,500 17,500 17,500 17,500 17,500 17,500 17,500 17,500
Total (£) 23,384 18,384 18,384 18,384 18,384 18,384 18,384 18,384 18,384 18,384 18,384
Option 2 FY & Year in monitoring cycle 1 2 3 4 5 6 7 8 9 10 11 12
Costs No. sites 2005/6 2006/7 2007/8 2008/9 2009/10 2010/11 2011/12 2012/13 2013/14 2014/15 2015/16 2016/17 Great crested newt 36 918 918 918 918 918 918 918 918 918 918 918 Natterjack toad 12 0 0 0 0 0 0 0 0 0 0 0 Amphibian assemblage 16 408 408 408 408 408 408 408 408 408 408 408 Sand lizard 43 5,412 5,412 5,412 5,412 5,412 5,412 5,412 5,412 5,412 5,412 5,412 Smooth snake 38 1,109 1,109 1,109 1,109 1,109 1,109 1,109 1,109 1,109 1,109 1,109 Reptile assemblage 8 306 306 306 306 306 306 306 306 306 306 306 Survey co-ordination, data management, reporting and interpretation
36,250 26,250 26,250 26,250 26,250 26,250 26,250 26,250 26,250 26,250 26,250
Total (£) 44,403 34,403 34,403 34,403 34,403 34,403 34,403 34,403 34,403 34,403 34,403

159
Option 3 FY & Year in monitoring cycle 1 2 3 4 5 6 7 8 9 10 11 12
Costs No. sites 2005/6 2006/7 2007/8 2008/9 2009/10 2010/11 2011/12 2012/13 2013/14 2014/15 2015/16 2016/17 Great crested newt 36 1,224 1,224 1,224 1,224 1,224 1,224 1,224 1,224 1,224 1,224 1,224 Natterjack toad 12 0 0 0 0 0 0 0 0 0 0 0 Amphibian assemblage 16 544 544 544 544 544 544 544 544 544 544 544 Sand lizard 43 10,824 10,824 10,824 10,824 10,824 10,824 10,824 10,824 10,824 10,824 10,824 Smooth snake 38 2,218 2,218 2,218 2,218 2,218 2,218 2,218 2,218 2,218 2,218 2,218 Reptile assemblage 8 612 612 612 612 612 612 612 612 612 612 612 Survey co-ordination, data management, reporting and interpretation
50,000 35,000 35,000 35,000 35,000 35,000 35,000 35,000 35,000 35,000 35,000
Total (£) 65,422 50,422 50,422 50,422 50,422 50,422 50,422 50,422 50,422 50,422 50,422

160
Appendix 5. European and North American herpetofauna surveillance schemes Country Scheme/
programme Scope Regularity Sampling
regime Methods Delivery Funding
Denmark
(various)1 National All species
(various) (various) Presence/absence Counts (torch) Amphibian calls
Volunteers & professionals
Government Various other sources
Netherlands RAVON2 National 14 species (includes all Red List)
Monitoring >300 reptile sites; many amphibian sites
Presence/absence Counts Peak count (amphibians)
Volunteers Ministry of Agriculture, Nature Management, Fisheries & Statistics Netherlands
Hungary Breeding Pond Survey3
Local (Pilis-Visegrád Hills) 7 amphibians
Surveys 105 ponds Presence/absence Counts Pond characteristics
Professionals DAPTF Seed Grant
KARCH4 National Emphasis on rare species
Monitoring Presence/absence Counts
Mostly professionals, hope to expand volunteer base
Government Switzerland
Aargau Amphibian Survey5
Regional (Canton Argau) All amphibians
Monitoring Presence/absence Counts
Volunteers Local government
Canada
FrogWatch Canada6
National 24 species (all anurans)
Monitoring Variable, according to volunteer capacity
Population monitoring Changes in range Phenology of calling season Vocal identification Counts ‘Abundance codes’
Volunteers Partnership: Ecological Monitoring & Assessment Network Canadian Nature Federation University of Guelph
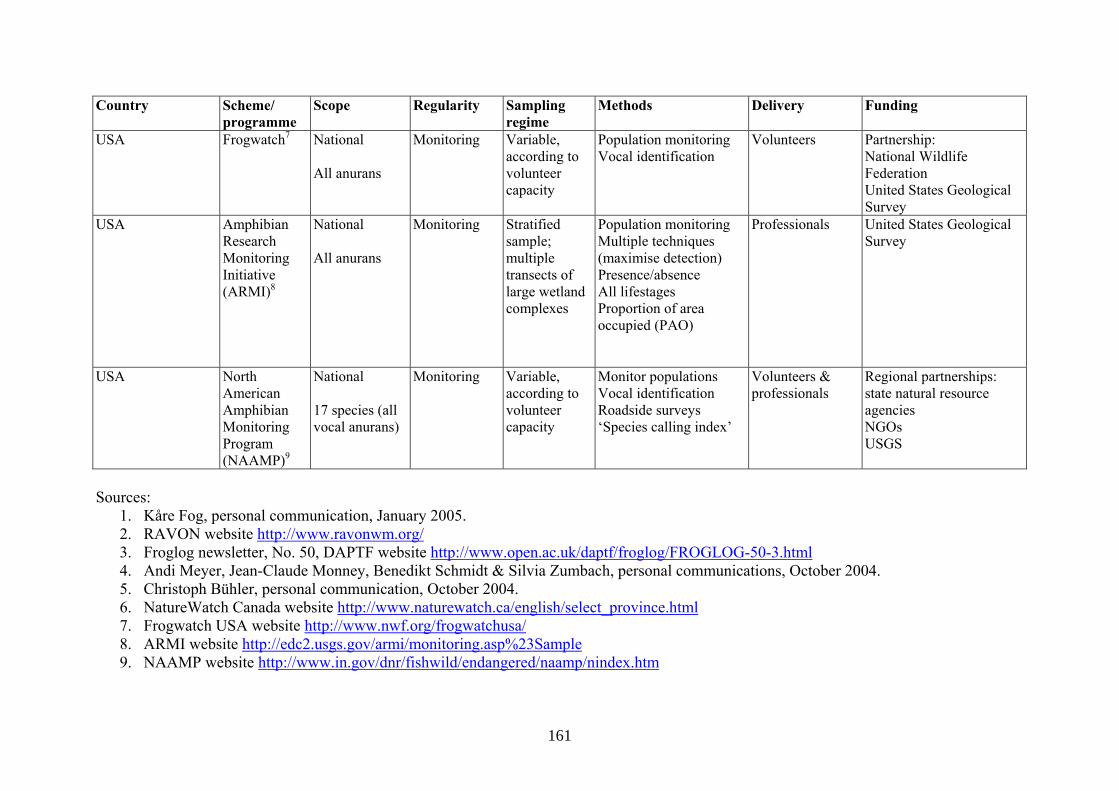
161
Country Scheme/ programme
Scope Regularity Sampling regime
Methods Delivery Funding
USA Frogwatch7 National All anurans
Monitoring Variable, according to volunteer capacity
Population monitoring Vocal identification
Volunteers Partnership: National Wildlife Federation United States Geological Survey
USA Amphibian Research Monitoring Initiative (ARMI)8
National All anurans
Monitoring Stratified sample; multiple transects of large wetland complexes
Population monitoring Multiple techniques (maximise detection) Presence/absence All lifestages Proportion of area occupied (PAO)
Professionals United States Geological Survey
USA North American Amphibian Monitoring Program (NAAMP)9
National 17 species (all vocal anurans)
Monitoring Variable, according to volunteer capacity
Monitor populations Vocal identification Roadside surveys ‘Species calling index’
Volunteers & professionals
Regional partnerships: state natural resource agencies NGOs USGS
Sources:
1. Kåre Fog, personal communication, January 2005. 2. RAVON website http://www.ravonwm.org/ 3. Froglog newsletter, No. 50, DAPTF website http://www.open.ac.uk/daptf/froglog/FROGLOG-50-3.html 4. Andi Meyer, Jean-Claude Monney, Benedikt Schmidt & Silvia Zumbach, personal communications, October 2004. 5. Christoph Bühler, personal communication, October 2004. 6. NatureWatch Canada website http://www.naturewatch.ca/english/select_province.html 7. Frogwatch USA website http://www.nwf.org/frogwatchusa/ 8. ARMI website http://edc2.usgs.gov/armi/monitoring.asp%23Sample 9. NAAMP website http://www.in.gov/dnr/fishwild/endangered/naamp/nindex.htm

162
Appendix 6. A questionnaire survey of the ARGs’ views on NARRS ARG name and representative
Membership (and those that are active recorders)
Important considerations for the ARG if it were to be involved in NARRS?
Potential for recruiting & training new members if funds, training & support were available?
Is your ARG already involved in formal herpetofauna recording? (briefly state which)
How much would your ARG like to be involved in the design stages of NARRS?
Badenoch & Strathspey (B&S Conservation Group) – Gus Jones, Convener
37 (a few) Simple and well supported scheme; integrated with other local recording groups eg Highland Biological Reading Group
Yes No Little interest
Cambridgeshire & Peterborough (CPARG) – Ruth Carey, Secretary
29 (c.16) Training, recruitment, regular feedback, travel expenses
Yes Not yet Limited capacity to do so as yet
Cornwall (CRAG) – Mark Nicholson, Coordinator
50 (2-3) Recording common species (no rarities in Cornwall); simple form – make use of JNCC recording forms; regular feedback
Yes Yes Send on records to BRC
Interested to comment on draft ideas
Dorset (DARN) – Chris Gleed-Owen, Chair
64 (c.30) Well coordinated; robust methods, sampling and design; sustainable funding & statutory support
Yes Yes Mostly rare reptiles in east Dorset heathlands, but launching Dorset-wide recording initiative for all herps.
Very much
Derbyshire (DARG) – Chris Monk, Secretary
30 (7) Detailed information on the workings of the scheme; regular feedback on progress including results (local & national)
Yes Yes Toads on Roads – keep annual counts and forward to LRC; new Reptile survey but no detailed site surveys undertaken yet
Interested to comment on draft ideas

163
ARG name and representative
Membership (and those that are active recorders)
Important considerations for the ARG if it were to be involved in NARRS?
Potential for recruiting & training new members if funds, training & support were available?
Is your ARG already involved in formal herpetofauna recording? (briefly state which)
How much would your ARG like to be involved in the design stages of NARRS?
Fife (FARG) – Tom Gray, Coordinator
<5 Best organised through FERN (Fife Environmental Recorders Network)
Yes Recorder for FERN especially herps c/o Fife Council
Minimal interest
Gwent (GARG) – Matthew Harris, Chair
c.20 (5) Free and open data exchange Yes Yes Great crested newt survey – data held on MapMate
Interested, can supply local data and promote NARRS to other recorders
Hants & Isle of Wight (HARG) – Rachel Green, Coordinator & HWT liaison
280 (20-30) Any records from Hants that didn’t come from HARG should be fed back; kept involved and regularly updated; true methodology & forms are straightforward; provide a forum for discussion between different ARGs
Yes Large capacity to motivate the other members to record and getting other naturalists, consultants etc to record and send in sightings; funding to hold events; material costs is a problem
Yes County recorder for all herp species, use general standard form; great crested newt county survey has been going on for a few years – hold records on MapMate
Interested
Herefordshire (HART) – Nigel Hand, County recorder
<50 (24-5) Need for more people with active roles
Yes Yes great crested newt project; Currently compiling an atlas on herps for Herefordshire
Interested, depends on time & travel

164
ARG name and representative
Membership (and those that are active recorders)
Important considerations for the ARG if it were to be involved in NARRS?
Potential for recruiting & training new members if funds, training & support were available?
Is your ARG already involved in formal herpetofauna recording? (briefly state which)
How much would your ARG like to be involved in the design stages of NARRS?
Kent (KRAG) – Gemma Fairchild, Secretary
25 (a few) Funding and support for training should be offered including equipment, expenses etc
Yes Yes ‘Adders in Decline’ project – long-term monitoring at a number of sampling sites across the county; ‘BCTV Pond Warden GCN Project 2004’ – follow-up of Froglife pilot project, aimed to continue recording for great crested newt in Kent. KRAG provided the training and support in the field – hoped to continue next year.
Interested in the design stage
Leicestershire (LARN) – Andrew Heaton, Coordinator
25 (a few) Achievable targets for recording effort; training towards great crested newt licences
Yes Yes Currently reptile survey in Leics & Rutland - “Snakes Alive” survey form produced
Minimal interest
North-east Wales (NEWARN) – Matthew Ellis, Chair
20 (all active) Funding for equipment, time and other resources as appropriate
Yes Yes Work focuses on SACs, SSSIs and key sites considered to be at risk
Interested in design of survey methodologies

165
ARG name and representative
Membership (and those that are active recorders)
Important considerations for the ARG if it were to be involved in NARRS?
Potential for recruiting & training new members if funds, training & support were available?
Is your ARG already involved in formal herpetofauna recording? (briefly state which)
How much would your ARG like to be involved in the design stages of NARRS?
North Merseyside (NMARG) – Peter Tipping, Chair
6 (3) Great crested newt and sand lizard recording for areas outside NNR
Unsure Yes 2004 garden pond survey gave 290+ records; Next few seasons: great crested newt surveys of non-garden ponds; plans for a sand lizard survey of dune heath area
Interested but group has small capacity
Oxfordshire (OARG) – Rod d’Ayala, Coordinator
Unsure (a few active recorders)
Forms and methods must be straightforward
Yes Need time to organise volunteers/members)
No “Hit & miss” general info gathering
Interested to comment/see how it develops
Shropshire (SAG via SWT) – Viv Geen, Coordinator
Varies depending on surveys
Who will have access to the data? Consultants? Will it be easy for the ARG to access the data?
Yes Training volunteers in survey work already. But further funding would provide further opportunities
Yes Two large great crested newt surveys conducted in the County;Carry out surveys for EA – inform them of best pond sites etc in South Shropshire with Shropshire Hills AONB unit
Interested to be involved in initial stages. Can provide data already stored on GIS (Viv green is Biological Records Officer)

166
ARG name and representative
Membership (and those that are active recorders)
Important considerations for the ARG if it were to be involved in NARRS?
Potential for recruiting & training new members if funds, training & support were available?
Is your ARG already involved in formal herpetofauna recording? (briefly state which)
How much would your ARG like to be involved in the design stages of NARRS?
South Lancashire (ARGSL) – David Orchard, Chair
11 (aim for 10 recorders in spring 2005)
Volunteers probably more keen to record the relatively easily found reptiles – one or two specialists may survey the more elusive reptiles; proximity to known sites a factor – volunteers may not be keen to travel too far
Yes Funding to cover someone (one day/week maybe) would enable issues eg access to ponds to be sorted out efficiently
Yes Plans for great crested newt surveys in county wildlife sites in spring 2005; plans to take part in proposed grass snake reintroduction; the group will run basic ID and survey training days; plans to visit natterjack and sand lizard sites (though distance may discourage involvement in survey work for these species).
Interested - keen to be involved in design and pilot developing ideas
Staffordshire (group being formed) – John Smith, Manager
20+ (3-4) Coordination of data with LRCs, National & Regional Support Delivery & link to BAPs; financial support
Yes No (yes!) Great crested newt recording in a single pond at events.
Interested in principle
Suffolk (SARG) – John Baker, Chair
40 (12) Streamlined record-transfer rather than become another tier in the existing system; feedback; two-way data exchange
Yes Limited – perhaps better to strengthen network with other groups eg Southern Water’s Pond Wardens. Great crested newt PMP showed this.
Yes Primarily great crested newt and adder surveys. Supply data to BRC.
Interested to be involved at a consultation level
Warwickshire (WART) – Jan Clemons, Chair
50 (2) “Ownership” – ARG would like to be informed of any threats to herp populations in the county if a national database was set up
Unsure Need at least a two-man team working full time during survey season to even start covering the county
Yes Warks Adder Survey; estimate amphibian population sizes (re-start toad monitoring at Dunchurch?) , some reptile survey too
Interested only with the guiding principles.
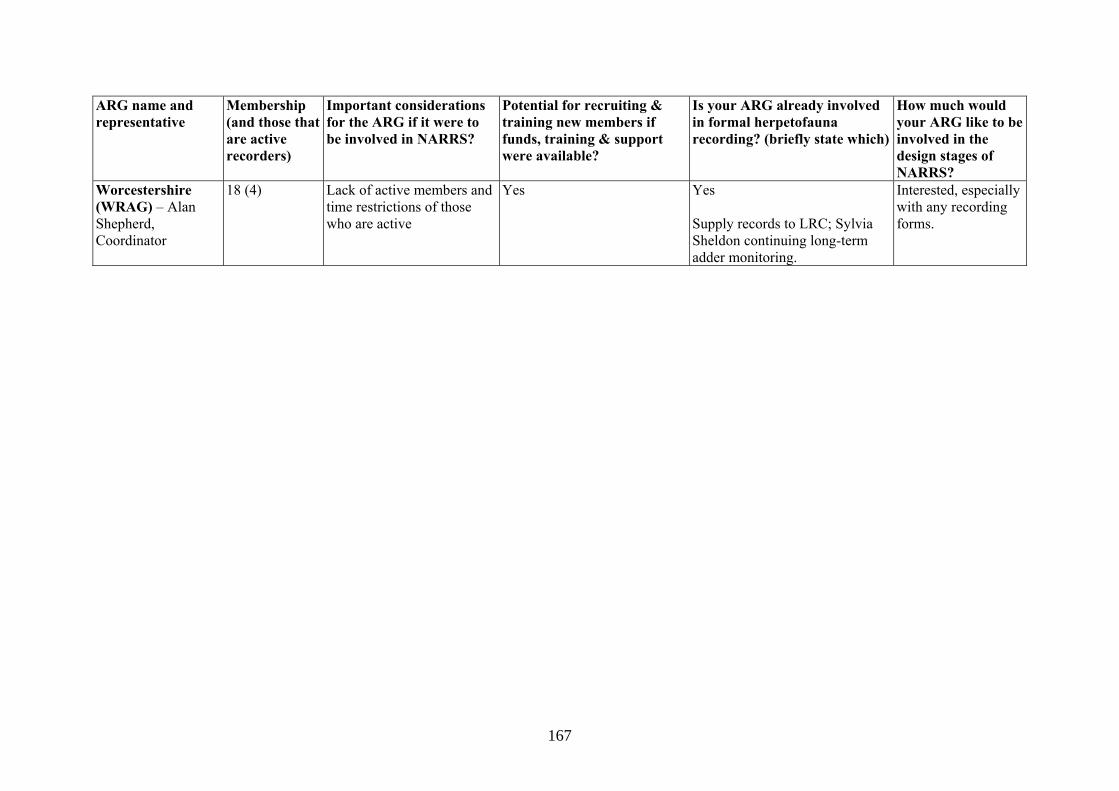
167
ARG name and representative
Membership (and those that are active recorders)
Important considerations for the ARG if it were to be involved in NARRS?
Potential for recruiting & training new members if funds, training & support were available?
Is your ARG already involved in formal herpetofauna recording? (briefly state which)
How much would your ARG like to be involved in the design stages of NARRS?
Worcestershire (WRAG) – Alan Shepherd, Coordinator
18 (4) Lack of active members and time restrictions of those who are active
Yes Yes Supply records to LRC; Sylvia Sheldon continuing long-term adder monitoring.
Interested, especially with any recording forms.


Research information note
English Nature Research Reports, No. 663
Costed plans and options for herpetofauna surveillance and monitoring Report Authors: Chris Gleed-Owen, John Buckley, Julia Coneybeer, Tony Gent, Morag McCracken, Nick Moulton, Dorothy Wright Date: October 2005 Keywords: reptiles, amphibians, monitoring, surveillance Introduction English Nature needs herpetofauna surveillance and monitoring data for various purposes: with regard to interest features on designated sites, status of BAP and other nationally important species, assessment of national trends in widespread species, European legal obligations for Species of Community Interest, information for miscellaneous casework tasks, and data on non-native species. At present much of the data is lacking, patchily distributed across many organisations, and collected to different standards. There is also no assessment of the precise needs of English Nature and how the available data might meet those needs; in addition an assessment of the desired future data collection and management is required. What was done This report explores information needs, methodologies, sampling strategies, delivery mechanisms, personnel, voluntary involvement, popularity, logistics, coordination, data issues, and resource implications. It then sets out indicative costed options for a national recording scheme. Results and conclusions Systems of data collation, management and dissemination are addressed, and a survey of local record centre data holdings is presented. Various structural and logistical issues are explored, including the feasibility of developing and sustaining a large national volunteer network. Examples of sampling regimes and survey structures are proposed, and the cost implications are examined. Fully costed options are given for delivering each of the four main objectives for which English Nature needs information (widespread species, BAP/nationally important species, very rare species, Common Standards Monitoring of SSSI

interest features). The costs of each are interdependent, and it would be most efficient and synergistic to run all four elements concurrently. The total cost may be several hundred thousand pounds per year. English Nature's viewpoint This report provides an extremely useful and detailed assessment of the current state of herpertofauna status data. The proposed options for future data collection, management, interpretation and dissemination will prove very useful in the coming years as English Nature (and its successor organisation, Natural England) work with partners to progress the issue. The suggestions provide a sound platform on which the develop survey projects, and already some examples of single-species projects, such as "Make the Adder Count", are being trialled. Selected references ARNOLD, H.R. 1995. Atlas of amphibians and reptiles in Britain. ITE research publication, No.10. London: HMSO. BAKER, J., SUCKLING, J., & CAREY, R. 2004. Status of the adder Vipera berus and slow-worm Anguis fragilis in England. English Nature Research Reports, No. 546. CARRIER, J-A., & BEEBEE, T.J.C. 2003. Recent, substantial, and unexplained declines of the common toad Bufo bufo in lowland England. Biological Conservation, 111, 395-399. SWAN, M.J.S., & OLDHAM, R.S. 1993a. Herptile sites volume 1: national amphibian survey final report. English Nature Research Reports, No. 38. SWAN, M.J.S., & OLDHAM, R.S. 1993b. Herptile sites volume 2: national common reptile survey final report. English Nature Research Reports, No.38.
Further information For the full report or other publications on this subject, please contact the Enquiry Service on 01733 455100/101/102 or email [email protected] For further information about the work of English Nature, please visit our website at: www.english-nature.org.uk

English Nature is the Governmentagency that champions theconservation of wildlife andgeology throughout England.
This is one of a range ofpublications published by: External Relations Team English NatureNorthminster HousePeterborough PE1 1UA
www.english-nature.org.uk
© English Nature 2002/3
Cover printed on Character Express, post consumer waste paper, ECF.
ISSN 0967-876X
Cover designed and printed by Status Design & Advertising,2M,5M,5M.
You may reproduce as many copiesof this report as you like, providedsuch copies stipulate that copyrightremains with English Nature,Northminster House,Peterborough PE1 1UA
If this report contains any OrdnanceSurvey material, then you areresponsible for ensuring you have alicense from Ordnance Survey tocover such reproduction.
Front cover photographs:Top left: Using a home-made moth trap. Peter Wakely/English Nature 17,396Middle left: Co2 experiment at Roudsea Wood and Mosses NNR, Lancashire. Peter Wakely/English Nature 21,792Bottom left: Radio tracking a hare on Pawlett Hams,Somerset. Paul Glendell/English Nature 23,020Main: Identifying moths caught in a moth trap at Ham Wall NNR, Somerset. Paul Glendell/English Nature 24,888
Related Documents