oup Members: reen Bano ima Fazal ed Yasir Husnain Rizvi

Welcome message from author
This document is posted to help you gain knowledge. Please leave a comment to let me know what you think about it! Share it to your friends and learn new things together.
Transcript
Group Members:Nureen BanoSaima FazalSyed Yasir Husnain Rizvi
2
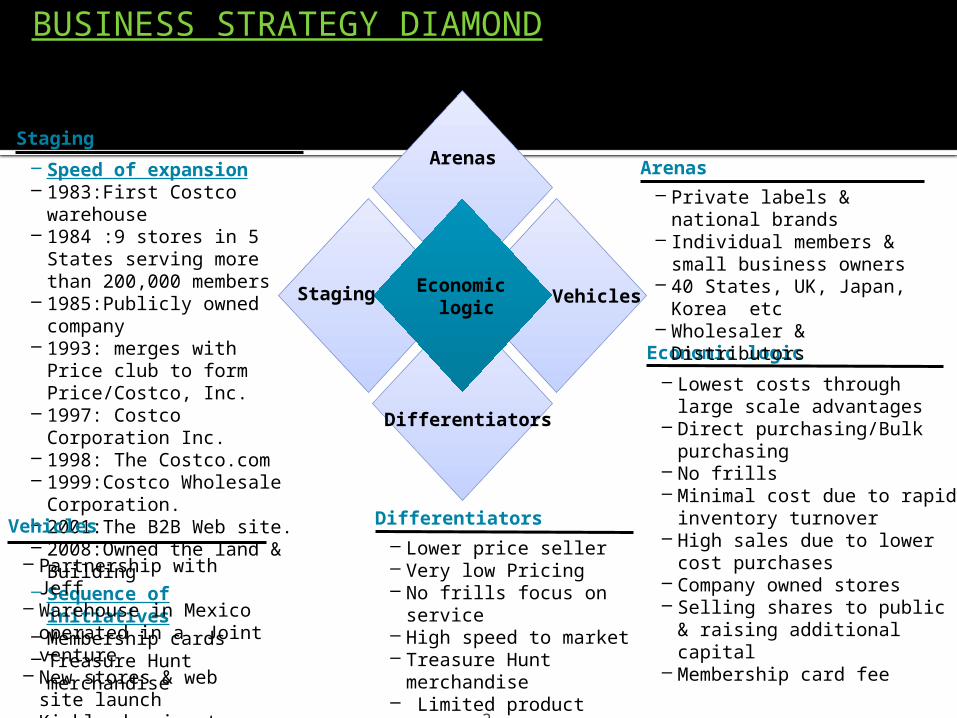
BUSINESS STRATEGY DIAMOND
Staging
Differentiators
Economic logic
Vehicles
Arenas– Speed of expansion– 1983:First Costco
warehouse– 1984 :9 stores in 5 States
serving more than 200,000 members
– 1985:Publicly owned company
– 1993: merges with Price club to form Price/Costco, Inc.
– 1997: Costco Corporation Inc.
– 1998: The Costco.com– 1999:Costco Wholesale
Corporation.– 2001:The B2B Web site.– 2008:Owned the land &
Building– Sequence of initiatives– Membership cards– Treasure Hunt
merchandise
Staging
– Lowest costs through large scale advantages
– Direct purchasing/Bulk purchasing
– No frills– Minimal cost due to rapid
inventory turnover– High sales due to lower cost
purchases– Company owned stores– Selling shares to public &
raising additional capital– Membership card fee
Economic logic
– Partnership with Jeff– Warehouse in Mexico
operated in a Joint venture
– New stores & web site launch
– Kirkland signature– Costco merged with
Price Club
Vehicles– Lower price seller– Very low Pricing– No frills focus on
service– High speed to market– Treasure Hunt
merchandise– Limited product range
that covers broad spectrum
Differentiators
– Private labels & national brands
– Individual members & small business owners
– 40 States, UK, Japan, Korea etc
– Wholesaler & Distributors
Arenas
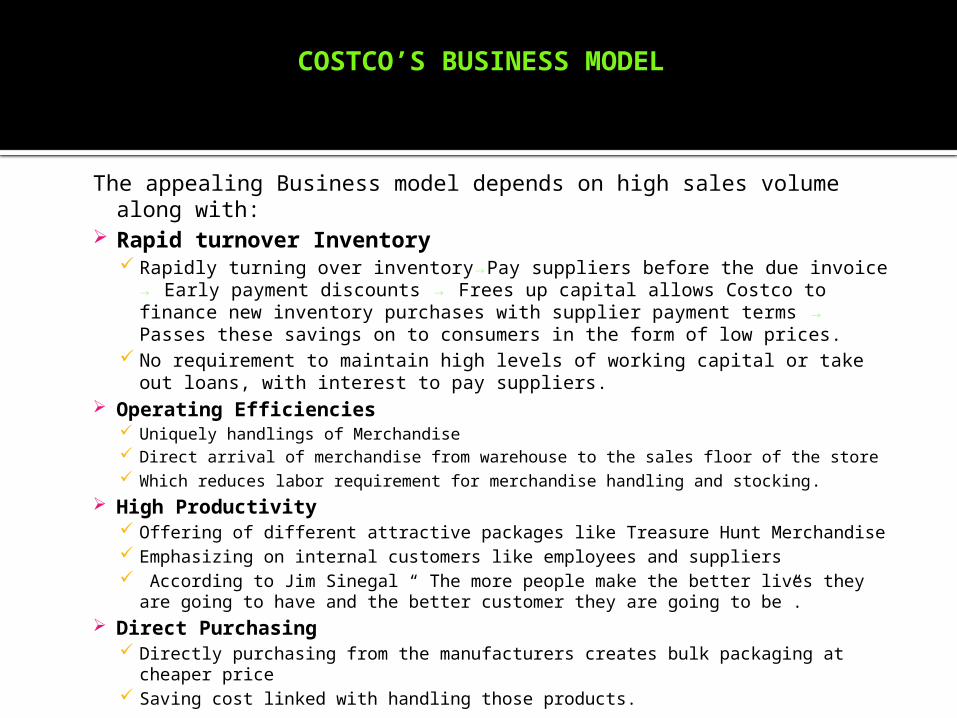
COSTCO’S BUSINESS MODEL
The appealing Business model depends on high sales volume along with:
Rapid turnover Inventory Rapidly turning over inventory→Pay suppliers before the due invoice → Early
payment discounts → Frees up capital allows Costco to finance new inventory purchases with supplier payment terms → Passes these savings on to consumers in the form of low prices.
No requirement to maintain high levels of working capital or take out loans, with interest to pay suppliers.
Operating Efficiencies Uniquely handlings of Merchandise Direct arrival of merchandise from warehouse to the sales floor of the store Which reduces labor requirement for merchandise handling and stocking.
High Productivity Offering of different attractive packages like Treasure Hunt Merchandise Emphasizing on internal customers like employees and suppliers According to Jim Sinegal “ The more people make the better lives they are going
to have and the better customer they are going to be”. Direct Purchasing
Directly purchasing from the manufacturers creates bulk packaging at cheaper price
Saving cost linked with handling those products.
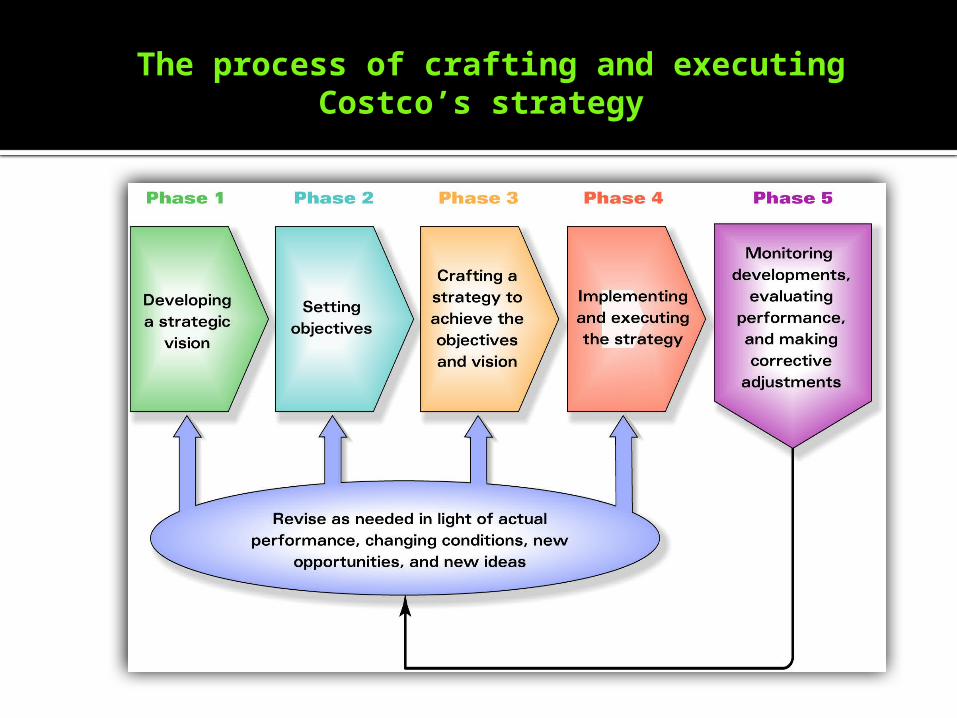
The process of crafting and executing Costco’s strategy
Phase 1 – Developing a strategic vision
The first phase is to develop a strategic vision for the company. Sometimes a company doesn’t state its strategic vision clearly,
like Costco does. But it has company values or philosophy that is implemented on its performance.
Costco’s philosophy was to keep customers coming to shop by wowing them with low prices.
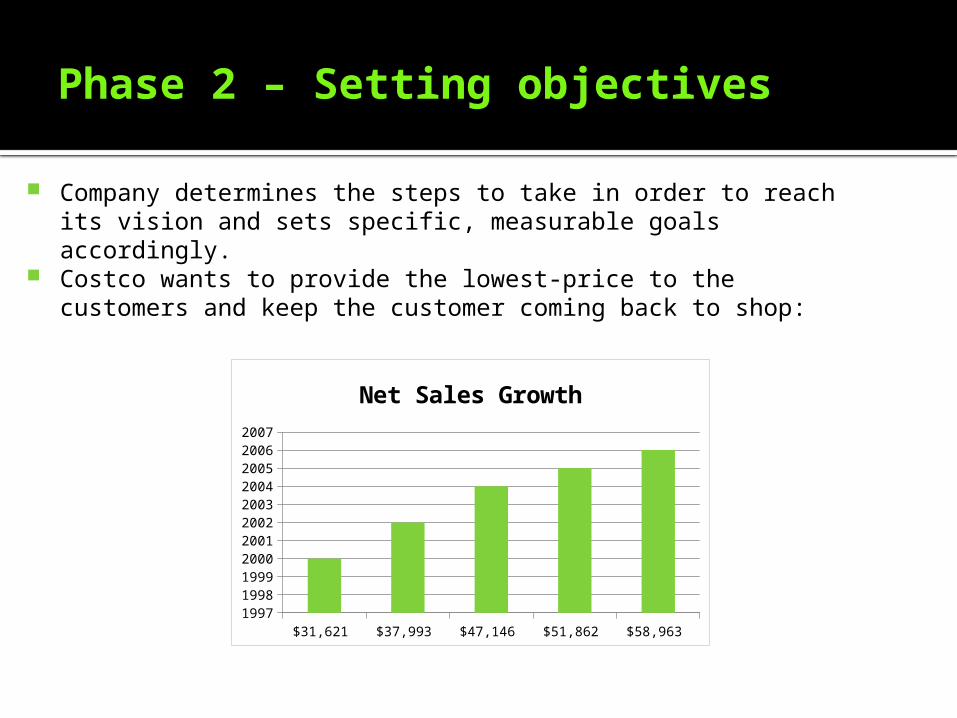
Phase 2 – Setting objectives
Company determines the steps to take in order to reach its vision and sets specific, measurable goals accordingly.
Costco wants to provide the lowest-price to the customers and keep the customer coming back to shop:
$31,621 $37,993 $47,146 $51,862 $58,963 19971998199920002001200220032004200520062007
Net Sales Growth
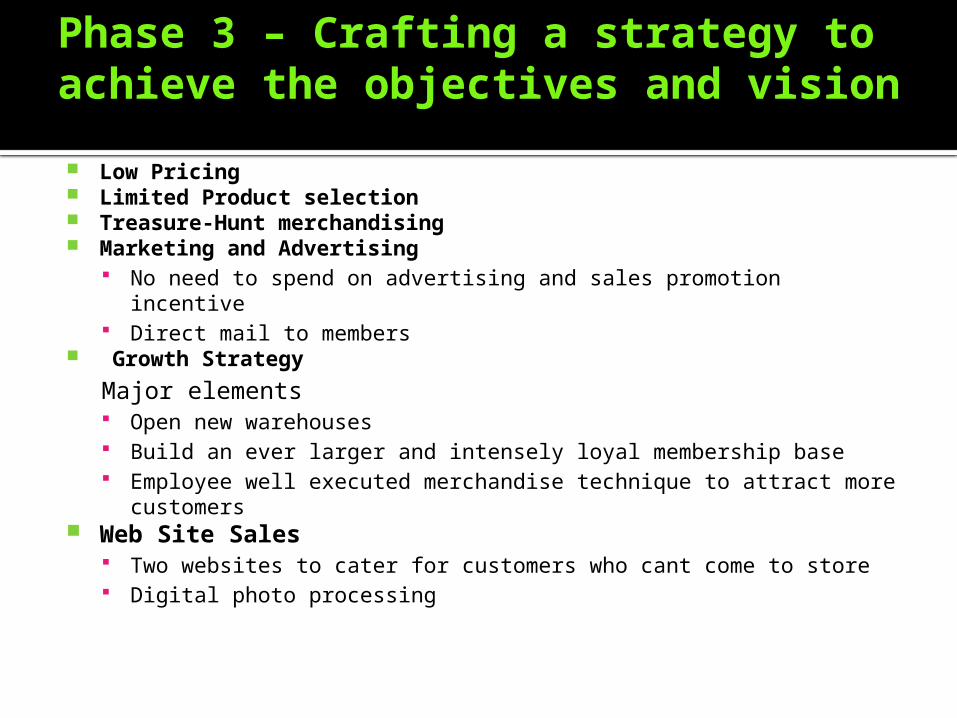
Phase 3 – Crafting a strategy to achieve the objectives and vision
Low Pricing Limited Product selection Treasure-Hunt merchandising Marketing and Advertising
No need to spend on advertising and sales promotion incentive Direct mail to members
Growth Strategy
Major elements Open new warehouses Build an ever larger and intensely loyal membership base Employee well executed merchandise technique to attract more
customers Web Site Sales
Two websites to cater for customers who cant come to store Digital photo processing
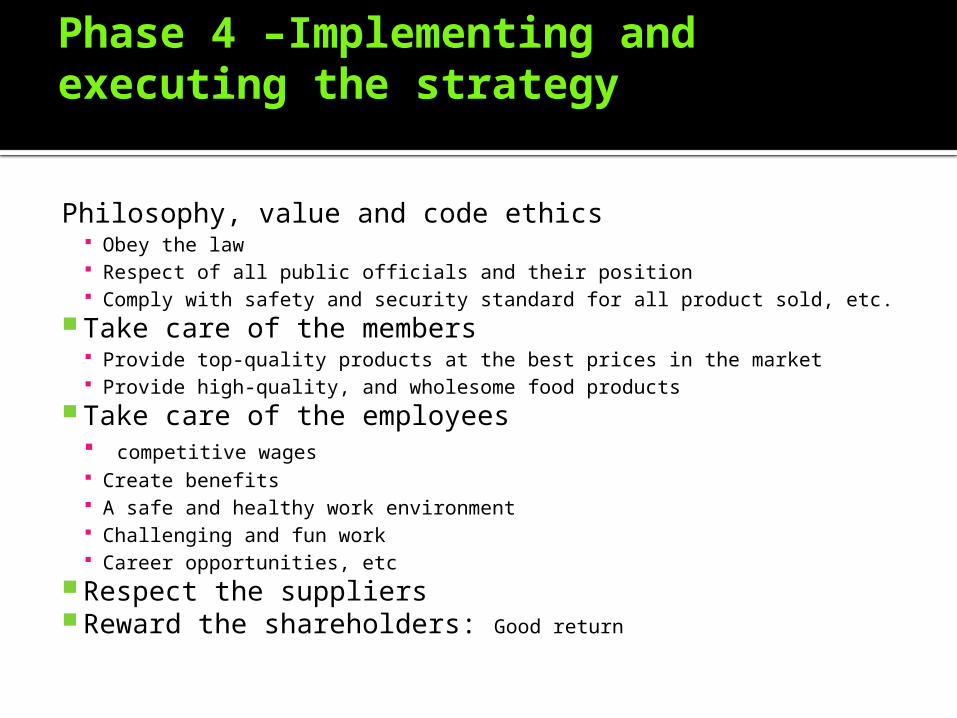
Phase 4 –Implementing and executing the strategy
Philosophy, value and code ethics Obey the law Respect of all public officials and their position Comply with safety and security standard for all product sold, etc.
Take care of the members Provide top-quality products at the best prices in the market Provide high-quality, and wholesome food products
Take care of the employees competitive wages Create benefits A safe and healthy work environment Challenging and fun work Career opportunities, etc
Respect the suppliers Reward the shareholders: Good return
Phase 5 – Monitoring developments, evaluating performance, and making corrective adjustment
Costco proved that the strategies was work, it looks from the loyalty of employees and customers, financial growth, warehouse expansion in other countries.
Jim Sanegal’s personal involvement in operational activities’ monitoring and evaluation.
Costco’s performing from financial prospective
Profitability Ratios Liquidity Ratios Leverage Ratios Activity Ratios Other important financial measures
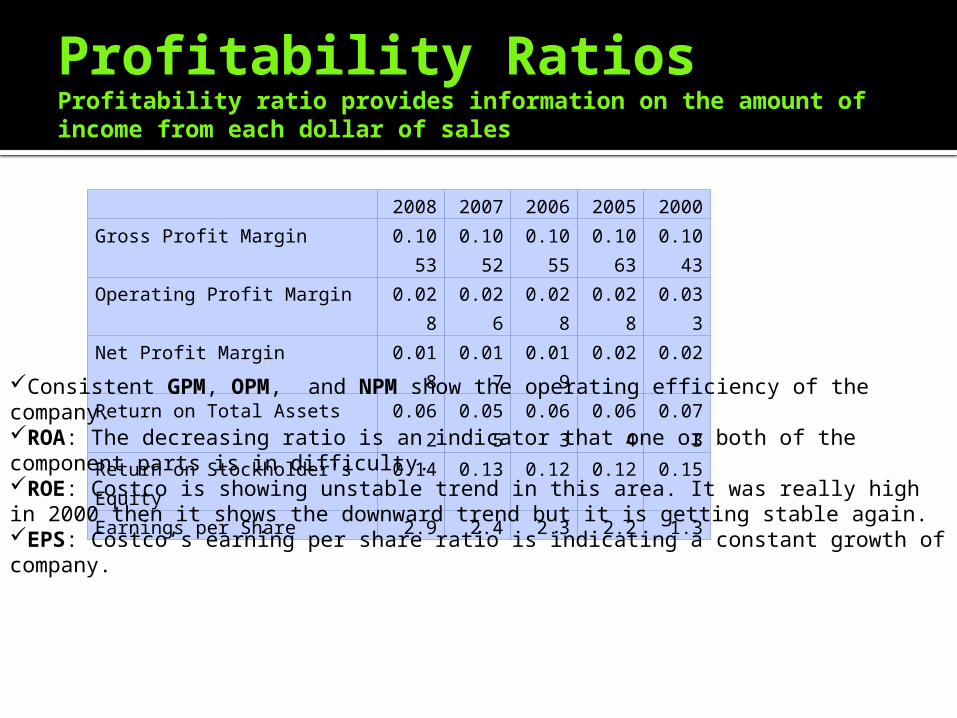
Profitability RatiosProfitability ratio provides information on the amount of income from each dollar of sales
2008 2007 2006 2005 2000Gross Profit Margin 0.10
530.10
520.10
550.10
630.10
43Operating Profit Margin 0.02
80.02
60.02
80.02
80.03
3Net Profit Margin 0.01
80.01
70.01
90.02 0.02
Return on Total Assets 0.062
0.055
0.063
0.064
0.073
Return on Stockholder's Equity
0.14 0.13 0.12 0.12 0.15
Earnings per Share 2.9 2.4 2.3 2.2 1.3
Consistent GPM, OPM, and NPM show the operating efficiency of the company. ROA: The decreasing ratio is an indicator that one or both of the component parts is in difficulty.ROE: Costco is showing unstable trend in this area. It was really high in 2000 then it shows the downward trend but it is getting stable again.EPS: Costco’s earning per share ratio is indicating a constant growth of company.
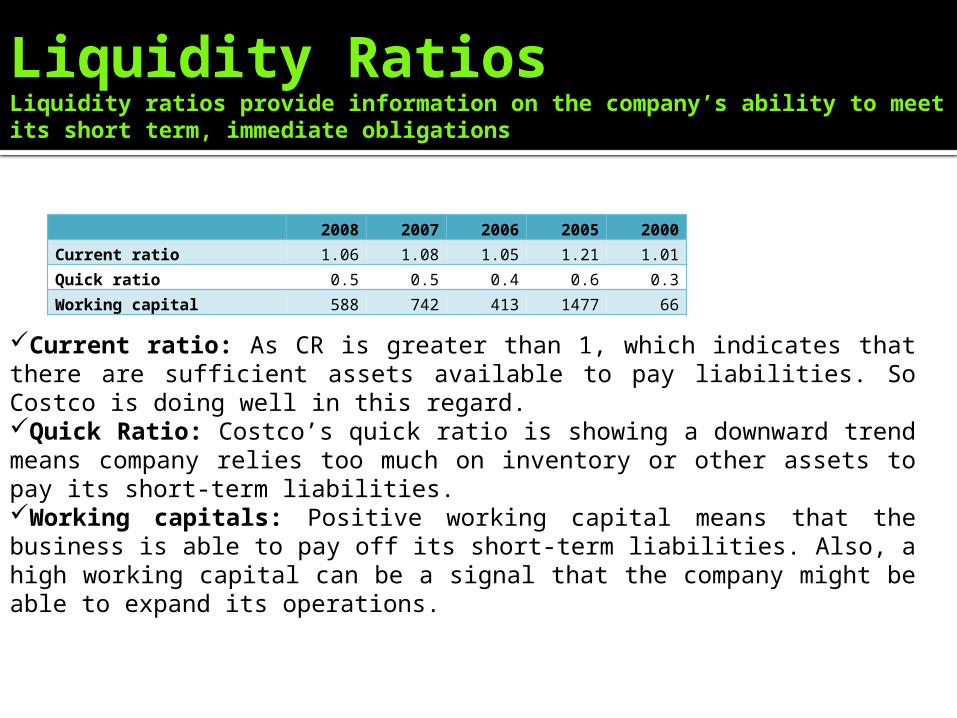
Liquidity RatiosLiquidity ratios provide information on the company’s ability to meet its short term, immediate obligations
2008 2007 2006 2005 2000Current ratio 1.06 1.08 1.05 1.21 1.01Quick ratio 0.5 0.5 0.4 0.6 0.3Working capital 588 742 413 1477 66
Current ratio: As CR is greater than 1, which indicates that there are sufficient assets available to pay liabilities. So Costco is doing well in this regard.Quick Ratio: Costco’s quick ratio is showing a downward trend means company relies too much on inventory or other assets to pay its short-term liabilities.Working capitals: Positive working capital means that the business is able to pay off its short-term liabilities. Also, a high working capital can be a signal that the company might be able to expand its operations.
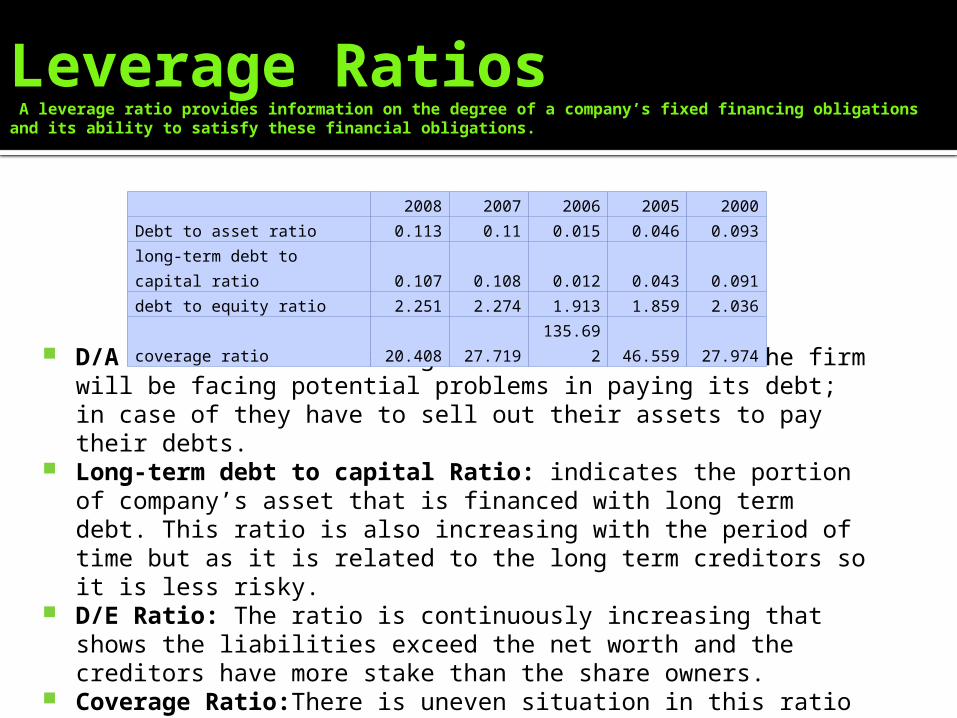
Leverage Ratios A leverage ratio provides information on the degree of a company’s fixed financing obligations and its ability to satisfy these financial obligations.
D/A Ratio: The increasing ratio indicates that the firm will be facing potential problems in paying its debt; in case of they have to sell out their assets to pay their debts.
Long-term debt to capital Ratio: indicates the portion of company’s asset that is financed with long term debt. This ratio is also increasing with the period of time but as it is related to the long term creditors so it is less risky.
D/E Ratio: The ratio is continuously increasing that shows the liabilities exceed the net worth and the creditors have more stake than the share owners.
Coverage Ratio:There is uneven situation in this ratio but if we compare the ratio of 2000 with 2008 we can see that the company is lacking at this point.
2008 2007 2006 2005 2000Debt to asset ratio 0.113 0.11 0.015 0.046 0.093long-term debt to capital ratio 0.107 0.108 0.012 0.043 0.091debt to equity ratio 2.251 2.274 1.913 1.859 2.036
coverage ratio 20.408 27.719135.69
2 46.559 27.974
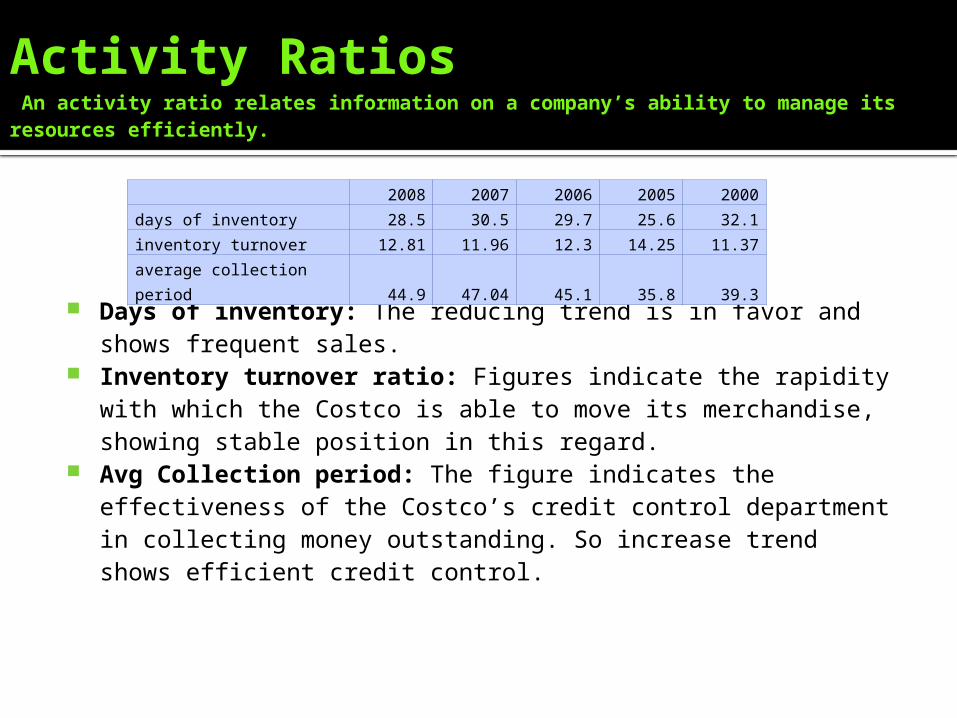
Activity Ratios An activity ratio relates information on a company’s ability to manage its resources efficiently.
Days of inventory: The reducing trend is in favor and shows frequent sales.
Inventory turnover ratio: Figures indicate the rapidity with which the Costco is able to move its merchandise, showing stable position in this regard.
Avg Collection period: The figure indicates the effectiveness of the Costco’s credit control department in collecting money outstanding. So increase trend shows efficient credit control.
2008 2007 2006 2005 2000days of inventory 28.5 30.5 29.7 25.6 32.1inventory turnover 12.81 11.96 12.3 14.25 11.37average collection period 44.9 47.04 45.1 35.8 39.3
Comparative financial performance (Sam’s club and BJ’s wholesale)
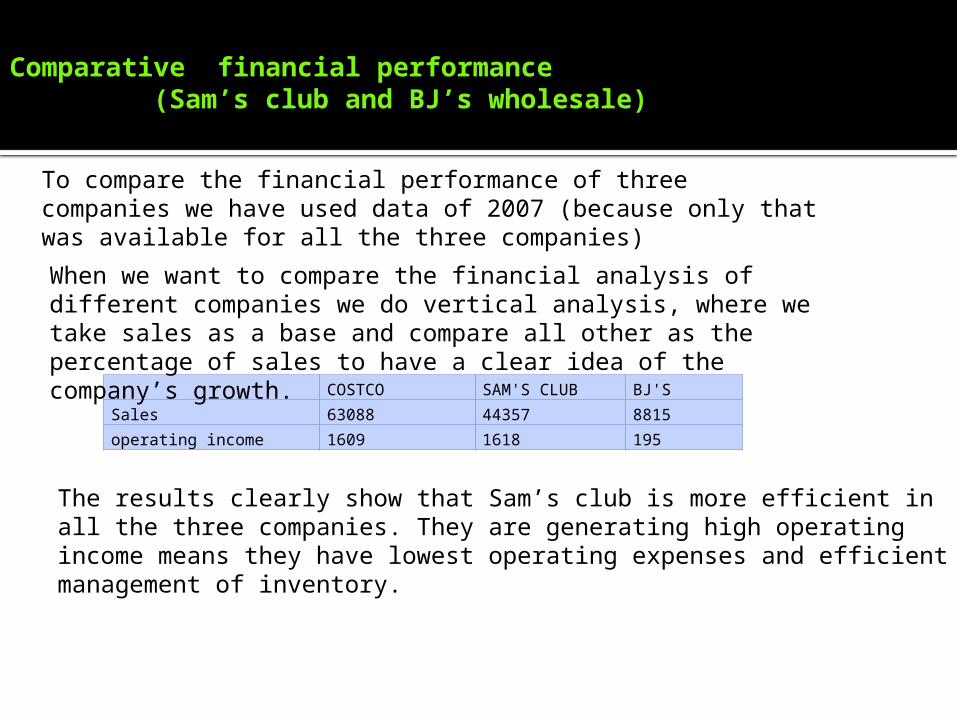
COSTCO SAM'S CLUB BJ'SSales 63088 44357 8815operating income 1609 1618 195
The results clearly show that Sam’s club is more efficient in all the three companies. They are generating high operating income means they have lowest operating expenses and efficient management of inventory.
To compare the financial performance of three companies we have used data of 2007 (because only that was available for all the three companies)
When we want to compare the financial analysis of different companies we do vertical analysis, where we take sales as a base and compare all other as the percentage of sales to have a clear idea of the company’s growth.
Whether Costco’s expansion outside the U.S is financially successful
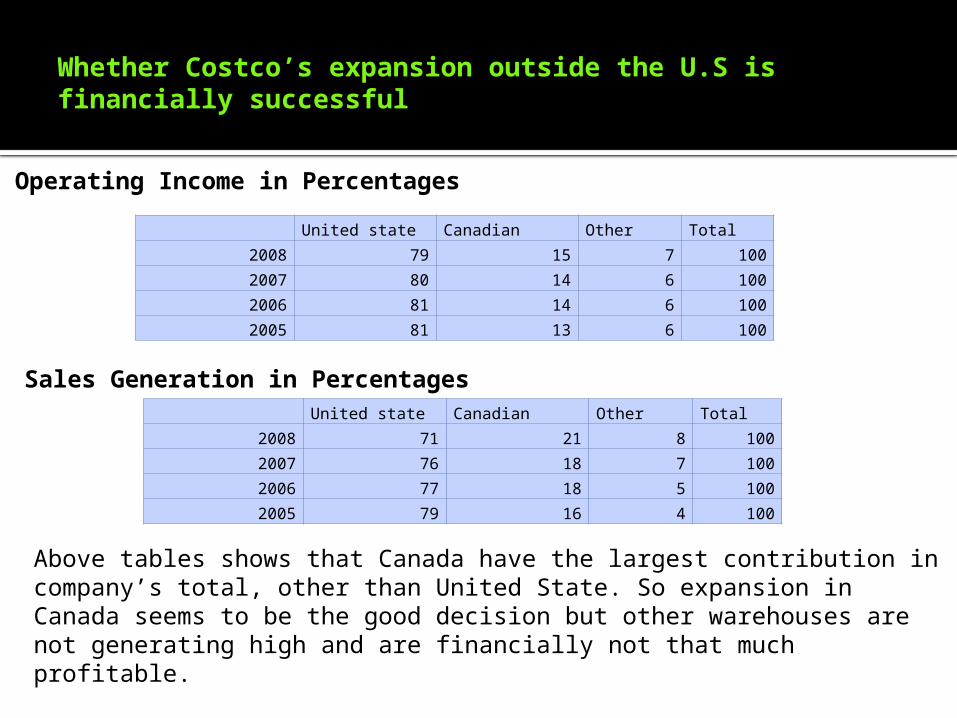
United state Canadian Other Total2008 71 21 8 1002007 76 18 7 1002006 77 18 5 1002005 79 16 4 100
United state Canadian Other Total2008 79 15 7 1002007 80 14 6 1002006 81 14 6 1002005 81 13 6 100
Above tables shows that Canada have the largest contribution in company’s total, other than United State. So expansion in Canada seems to be the good decision but other warehouses are not generating high and are financially not that much profitable.
Operating Income in Percentages
Sales Generation in Percentages
Costco strategic performince over Sam’s club & BJ’s
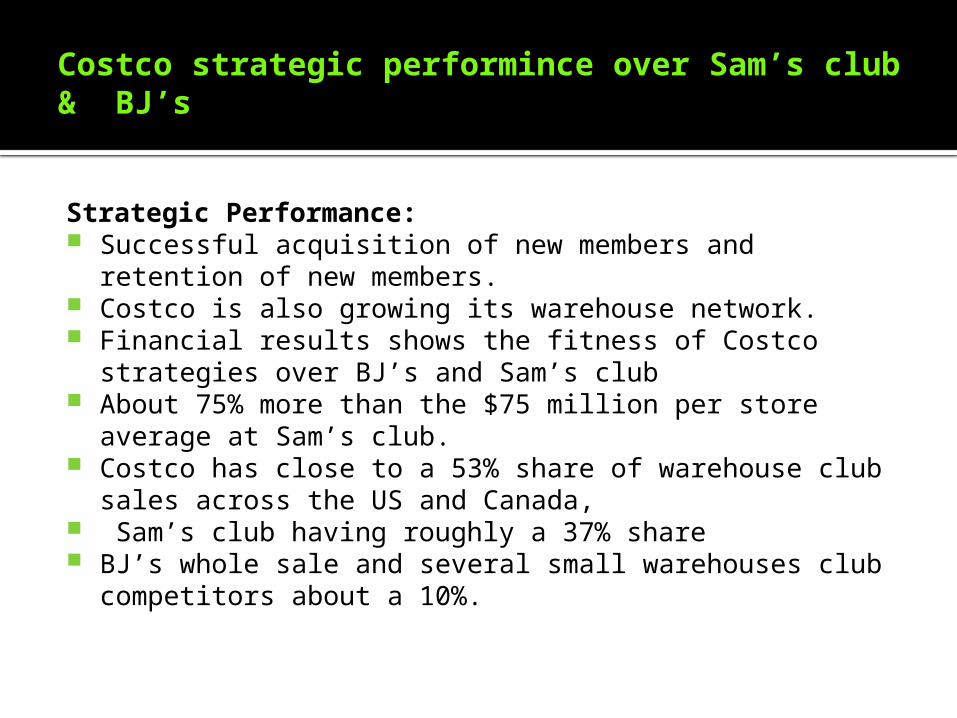
Strategic Performance: Successful acquisition of new members and retention of
new members. Costco is also growing its warehouse network. Financial results shows the fitness of Costco strategies over
BJ’s and Sam’s club About 75% more than the $75 million per store average at
Sam’s club. Costco has close to a 53% share of warehouse club sales
across the US and Canada, Sam’s club having roughly a 37% share BJ’s whole sale and several small warehouses club
competitors about a 10%.
Competitive Advantages
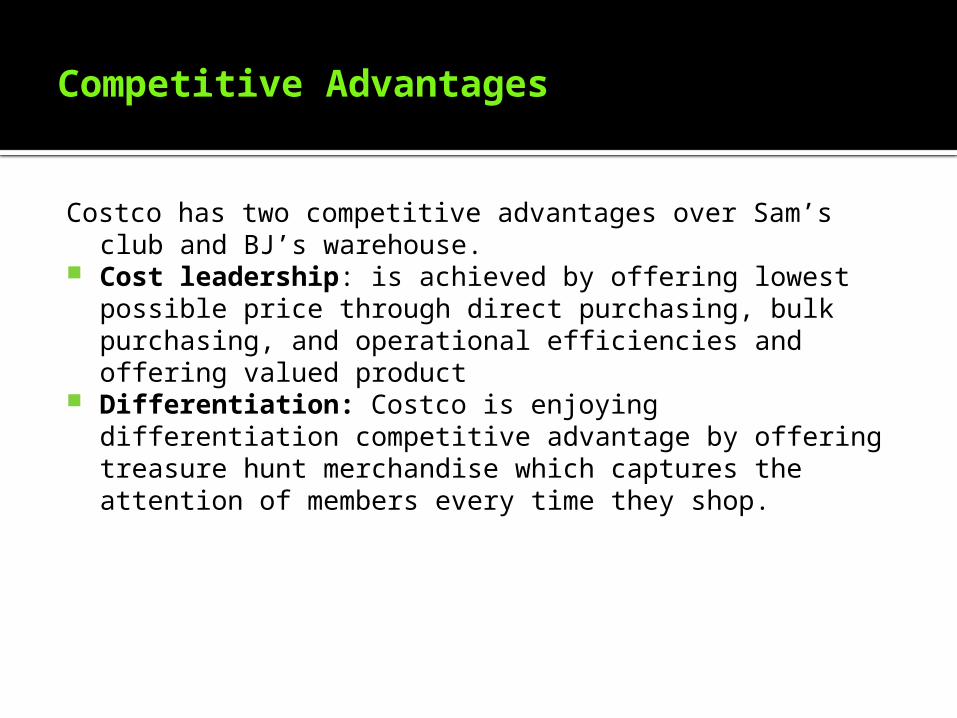
Costco has two competitive advantages over Sam’s club and BJ’s warehouse.
Cost leadership: is achieved by offering lowest possible price through direct purchasing, bulk purchasing, and operational efficiencies and offering valued product
Differentiation: Costco is enjoying differentiation competitive advantage by offering treasure hunt merchandise which captures the attention of members every time they shop.
Winning Strategy
Expansion with its profitability Value to customers and low prices According to Jim Sinegal “ we are very good merchant and
we offer value. The traditional retailer will say I am selling this for $ 10. I wonder whether he can get $10.50 or $ 11.” We say “we are selling this for $9. How do we get it down to $8?”
we understand that our members don’t come and shop with us because of window displays or the Santa Claus.
They come and shop with us because we offer great value.
Costco’s prices are too low
Costco offers lower price as compare to its main competitor Sam’s club and BJ’s.
Lower prices is the resultant of overall cost leadership strategy of Costco.
Attracting its member by keeping prices lower than all the competitors in the market.
Costco has identified that in-spite of selling product at higher to the members, it should sell more products (in bulk) by keeping prices comparatively low in the market.
Low Pricing Philosophy
Costco’s philosophy was to keep members coming in to shop by wowing them with low prices.
Costco’s pay its employee’s better than the employees at Wal-Mart
Costco is paying more to its employees as compare the Wal-Mart/Sams club.
Wal-Mart is offering lower wage and a skimpier benefit package. Jim Sinegal was convinced that having a well compensated work
force is very important to execute Costco strategy successfully. To take care of the employees is one of the principles of Costco’s
business philosophy and values. Paying good wage and keeping your people working with you is
very good business (Jim). Costco offers good wage and good career which resulting in
reducing employees turnover, reduces the cost of advertising, training and hiring.
Thus Costco have satisfied and loyal employees, working with full dedication and enthusiasm as they know that efficiency do not come at the cost of worker’s expense.
Sinegal Business Philosophy
Employees have the right to good wages and good career. We pay high wages, it must mean we get better productivity. The more people make, the better lives they are going to have
and better consumer they are going to be.
Recommendations
Persist to honor their business philosophy value and code of ethics.
Could offer a wider range of merchandising Instituting new payment techniques Accepting manufactures coupon Being open longer hours than competitors. Geographic expansion outside United State and Canada . Need to identify the reasons that why the same strategies are not
doing well in out side the US and Canada and improved strategies should be formulated according to the changed circumstances and requirements.
More online opportunities to members of with in and outside United State and Canada.
This way they can expand their business and will reach maximum number of customers that will ultimately help them to have better financial performance.
Related Documents