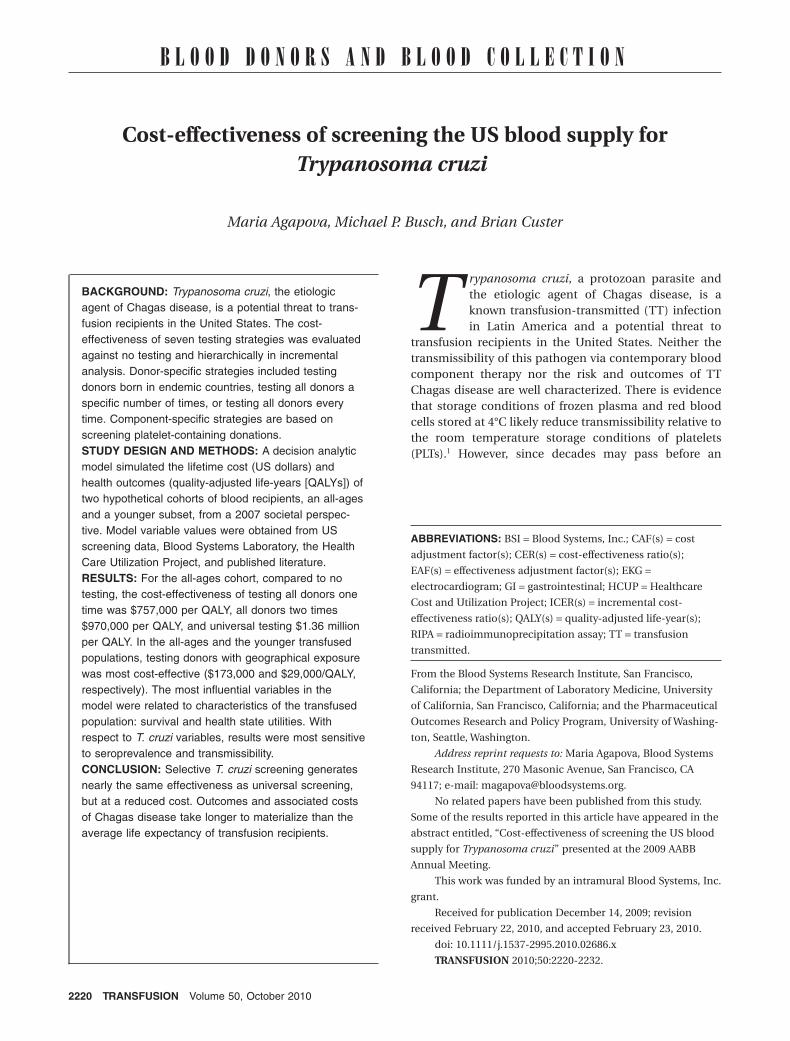
BLOOD DONORS AND BLOOD COLLECTION Cost-effectiveness of screening the US blood supply for Trypanosoma cruziMaria Agapova, Michael P. Busch, and Brian Custer BACKGROUND: Trypanosoma cruzi, the etiologic agent of Chagas disease, is a potential threat to trans- fusion recipients in the United States. The cost- effectiveness of seven testing strategies was evaluated against no testing and hierarchically in incremental analysis. Donor-specific strategies included testing donors born in endemic countries, testing all donors a specific number of times, or testing all donors every time. Component-specific strategies are based on screening platelet-containing donations. STUDY DESIGN AND METHODS: A decision analytic model simulated the lifetime cost (US dollars) and health outcomes (quality-adjusted life-years [QALYs]) of two hypothetical cohorts of blood recipients, an all-ages and a younger subset, from a 2007 societal perspec- tive. Model variable values were obtained from US screening data, Blood Systems Laboratory, the Health Care Utilization Project, and published literature. RESULTS: For the all-ages cohort, compared to no testing, the cost-effectiveness of testing all donors one time was $757,000 per QALY, all donors two times $970,000 per QALY, and universal testing $1.36 million per QALY. In the all-ages and the younger transfused populations, testing donors with geographical exposure was most cost-effective ($173,000 and $29,000/QALY, respectively). The most influential variables in the model were related to characteristics of the transfused population: survival and health state utilities. With respect to T. cruzi variables, results were most sensitive to seroprevalence and transmissibility. CONCLUSION: Selective T. cruzi screening generates nearly the same effectiveness as universal screening, but at a reduced cost. Outcomes and associated costs of Chagas disease take longer to materialize than the average life expectancy of transfusion recipients. T rypanosoma cruzi, a protozoan parasite and the etiologic agent of Chagas disease, is a known transfusion-transmitted (TT) infection in Latin America and a potential threat to transfusion recipients in the United States. Neither the transmissibility of this pathogen via contemporary blood component therapy nor the risk and outcomes of TT Chagas disease are well characterized. There is evidence that storage conditions of frozen plasma and red blood cells stored at 4°C likely reduce transmissibility relative to the room temperature storage conditions of platelets (PLTs). 1 However, since decades may pass before an ABBREVIATIONS: BSI = Blood Systems, Inc.; CAF(s) = cost adjustment factor(s); CER(s) = cost-effectiveness ratio(s); EAF(s) = effectiveness adjustment factor(s); EKG = electrocardiogram; GI = gastrointestinal; HCUP = Healthcare Cost and Utilization Project; ICER(s) = incremental cost- effectiveness ratio(s); QALY(s) = quality-adjusted life-year(s); RIPA = radioimmunoprecipitation assay; TT = transfusion transmitted. From the Blood Systems Research Institute, San Francisco, California; the Department of Laboratory Medicine, University of California, San Francisco, California; and the Pharmaceutical Outcomes Research and Policy Program, University of Washing- ton, Seattle, Washington. Address reprint requests to: Maria Agapova, Blood Systems Research Institute, 270 Masonic Avenue, San Francisco, CA 94117; e-mail: [email protected]. No related papers have been published from this study. Some of the results reported in this article have appeared in the abstract entitled, “Cost-effectiveness of screening the US blood supply for Trypanosoma cruzi” presented at the 2009 AABB Annual Meeting. This work was funded by an intramural Blood Systems, Inc. grant. Received for publication December 14, 2009; revision received February 22, 2010, and accepted February 23, 2010. doi: 10.1111/j.1537-2995.2010.02686.x TRANSFUSION 2010;50:2220-2232. 2220 TRANSFUSION Volume 50, October 2010

Welcome message from author
This document is posted to help you gain knowledge. Please leave a comment to let me know what you think about it! Share it to your friends and learn new things together.
Transcript
B L O O D D O N O R S A N D B L O O D C O L L E C T I O N
Cost-effectiveness of screening the US blood supply forTrypanosoma cruzi_2686 2220..2232
Maria Agapova, Michael P. Busch, and Brian Custer
BACKGROUND: Trypanosoma cruzi, the etiologicagent of Chagas disease, is a potential threat to trans-fusion recipients in the United States. The cost-effectiveness of seven testing strategies was evaluatedagainst no testing and hierarchically in incrementalanalysis. Donor-specific strategies included testingdonors born in endemic countries, testing all donors aspecific number of times, or testing all donors everytime. Component-specific strategies are based onscreening platelet-containing donations.STUDY DESIGN AND METHODS: A decision analyticmodel simulated the lifetime cost (US dollars) andhealth outcomes (quality-adjusted life-years [QALYs]) oftwo hypothetical cohorts of blood recipients, an all-agesand a younger subset, from a 2007 societal perspec-tive. Model variable values were obtained from USscreening data, Blood Systems Laboratory, the HealthCare Utilization Project, and published literature.RESULTS: For the all-ages cohort, compared to notesting, the cost-effectiveness of testing all donors onetime was $757,000 per QALY, all donors two times$970,000 per QALY, and universal testing $1.36 millionper QALY. In the all-ages and the younger transfusedpopulations, testing donors with geographical exposurewas most cost-effective ($173,000 and $29,000/QALY,respectively). The most influential variables in themodel were related to characteristics of the transfusedpopulation: survival and health state utilities. Withrespect to T. cruzi variables, results were most sensitiveto seroprevalence and transmissibility.CONCLUSION: Selective T. cruzi screening generatesnearly the same effectiveness as universal screening,but at a reduced cost. Outcomes and associated costsof Chagas disease take longer to materialize than theaverage life expectancy of transfusion recipients.
Trypanosoma cruzi, a protozoan parasite andthe etiologic agent of Chagas disease, is aknown transfusion-transmitted (TT) infectionin Latin America and a potential threat to
transfusion recipients in the United States. Neither thetransmissibility of this pathogen via contemporary bloodcomponent therapy nor the risk and outcomes of TTChagas disease are well characterized. There is evidencethat storage conditions of frozen plasma and red bloodcells stored at 4°C likely reduce transmissibility relative tothe room temperature storage conditions of platelets(PLTs).1 However, since decades may pass before an
ABBREVIATIONS: BSI = Blood Systems, Inc.; CAF(s) = cost
adjustment factor(s); CER(s) = cost-effectiveness ratio(s);
EAF(s) = effectiveness adjustment factor(s); EKG =electrocardiogram; GI = gastrointestinal; HCUP = Healthcare
Cost and Utilization Project; ICER(s) = incremental cost-
effectiveness ratio(s); QALY(s) = quality-adjusted life-year(s);
RIPA = radioimmunoprecipitation assay; TT = transfusion
transmitted.
From the Blood Systems Research Institute, San Francisco,
California; the Department of Laboratory Medicine, University
of California, San Francisco, California; and the Pharmaceutical
Outcomes Research and Policy Program, University of Washing-
ton, Seattle, Washington.
Address reprint requests to: Maria Agapova, Blood Systems
Research Institute, 270 Masonic Avenue, San Francisco, CA
94117; e-mail: [email protected].
No related papers have been published from this study.
Some of the results reported in this article have appeared in the
abstract entitled, “Cost-effectiveness of screening the US blood
supply for Trypanosoma cruzi” presented at the 2009 AABB
Annual Meeting.
This work was funded by an intramural Blood Systems, Inc.
grant.
Received for publication December 14, 2009; revision
received February 22, 2010, and accepted February 23, 2010.
doi: 10.1111/j.1537-2995.2010.02686.x
TRANSFUSION 2010;50:2220-2232.
2220 TRANSFUSION Volume 50, October 2010
infected individual experiences cardiac and/or gas-trointestinal (GI) symptoms, tracing transmission to spe-cific blood components is difficult. Disease progression ina patient who acquired Chagas through vector transmis-sion, often at a young age, may be different from thatacquired by transfusion. In the former case, a 20- or30-year period beginning in childhood may lead tosequelae such as heart failure in adulthood.2 In the lattercase—particularly in a blood recipient who is likely to bemuch older and suffering from an underlying healthcondition—T. cruzi infection may progress quickly or maynot cause clinically apparent morbidity or mortality.Because T. cruzi is known to have a broad range of clinicalmanifestations,3,4 the overall burden of Chagas disease inUS blood recipients continues to be debated.
In the United States, infectious threats to bloodsafety have to date been interdicted via universal testingof blood donors. In 2006 the FDA licensed an enzyme-linked immunosorbent assay (ELISA) test for antibodiesto T. cruzi. For at least 2 years after licensure, roughly75% of all US blood donations have been screened undera universal screening protocol.5 ELISA repeat-reactivedonations are confirmed using radioimmunoprecipita-tion assay (RIPA). However, employing selective testingstrategies may provide comparable safety at markedlyreduced cost. France and Spain currently select T. cruziat-risk donors with the help of questions about birthand/or time spent in endemic countries.6,7 Our goal wasto assess the efficiency of selective T. cruzi donor screen-ing strategies to reduce the risk of TT infection in USblood recipients. Several potential blood screeningoptions were examined, ranging from universal testing tohighly selective testing of only donors born in Latin orSouth America. Since PLTs have been implicated intransfusion transmission of T. cruzi in North America,8
we included strategies targeting higher-risk components,such as apheresis PLTs collections and whole blooddonations processed into PLTs.
MATERIALS AND METHODS
Overview
We developed a deterministic multicycle, discrete-timeMarkov model with cycle length of 1 year, to simulateT. cruzi identification in donated blood and TT diseaseprogression in blood recipients from a 2007 US societalperspective. While national seroprevalence estimateswere used,5,9,10 effectiveness of each testing strategy andcosts were based on 22 months of universal testing datafrom our organization, Blood Systems, Inc. (BSI), repre-senting an 8% sample of the US blood supply; remainingmodel variables were attained through the HealthcareCost and Utilization Project (HCUP) or PubMed literaturereview. Half-cycle correction was applied to posttransfu-sion costs and effects.
We analyzed cost utility (results estimated as cost perquality-adjusted life-year [QALY]) of seven T. cruzi bloodtesting strategies (Table 1). “No testing” for T. cruzi servedas the baseline in calculations of the cost-effectivenessratio (CER) of each strategy. To calculate incremental cost-effectiveness ratios (ICERs), strategies were compared in asuccessive stepwise manner in terms of the costs incurredand effects achieved. Of the seven strategies compared, weinvestigated universal testing, four donor-specific strate-gies (employing risk questions to trigger testing and/ortesting of donors a specific number of times), and twocomponent-specific approaches. A risk question strategyimplemented as part of donor eligibility assessment onthe donor health questionnaire targets donors born inMexico, Central America, or South America. Selectivetesting strategies: first-time donor, one-time and two-timetesting included additional testing of donors who reportedtravel to endemic areas since their last donation. Refer-ences in this article to endemic areas (Mexico, CentralAmerica, and South America) do not include the Southernparts of the United States, some of which are consideredendemic for T. cruzi; US vector-borne T. cruzi risk, cases,
TABLE 1. Relative costs, effectiveness, and T. cruzi residual risk of screening strategies in order ofincreasing cost
Strategy CAF EAFSeroprevalence adjusted for*
EAF Multiple components/donation Transmissibility
Baseline: no screening or testing 0.00 0.00 1/29,000 1/20,000 1/200,000Risk question 0.08 0.57 1/67,442 1/46,512 1/465,000PLT donations only† 0.13 0.50 1/58,000 1/40,000 1/400,000First timers and repeats at risk 0.21 0.75 1/116,000 1/80,000 1/800,000One time everyone and repeats at risk 0.54 0.95 1/580,000 1/400,000 1/4,000,000Two times everyone and repeats at risk 0.71 0.97 1/966,666 1/666,666 1/6,666,666Whole blood and PLT donations† 0.79 0.975 1/1,160,000 1/800,000 1/8,000,000Universal testing 1.00 0.98 1/1,450,000 1/1,000,000 1/10,000,000
* The effectiveness of each strategy was based on national seroprevalence adjusted for the portion of confirmed cases captured (defined asthe EAF), the number of components prepared from one donation (1.45), and the estimated transmissibility of T. cruzi in blood (10%).CAFs were derived from the respective portion of donors or donations tested from the total and represent the cost of each strategy.
† Component-specific strategies.
COST-EFFECTIVENESS OF T. CRUZI TESTING
Volume 50, October 2010 TRANSFUSION 2221

or transmission are referred to as “autochthonous”infections.
PLTs have been disproportionately implicated intransfusion transmission of Chagas disease, particularly inNorth America.8 Therefore, we included strategies that callfor testing of PLT donations: PLTs only and, in a scenario ofincreased vigilance, any donations that include PLTs pluswhole blood donations that could be processed into PLTs;this strategy is designed to assess the cost-effectiveness ofdonations that would have the highest potential to trans-mit T. cruzi based on storage temperature and donationprocessing procedures.
In Fig. 1, we present the basic structure of Chagasdisease progression inside the decision analytic model interms of the disease/treatment pathways (Fig. 1A) and theMarkov transitions (Fig. 1B). Chagas infection has twomajor phases: acute and chronic. All patients to whomT. cruzi infection is transmitted enter the “acute” state,characterized by flulike symptoms that are often mild andmay go unnoticed. Chronic infection can take many dif-ferent pathogenesis pathways. Usually, 1 to 2 months afterinfection, the disease progresses to the clinically asymp-tomatic (indeterminate) form.5 In the model, after spend-ing one cycle in the acute state, patients transition eitherto “all-cause death” or the “chronic” state. At every pro-ceeding cycle, some of the cohort will progress to a clini-cally apparent form by manifesting cardiac symptoms or
cardiac symptoms mixed with GI symptoms. Patients withcardiac symptoms transition into the “cardiomyopathy”state while those with mixed symptoms transition to the“mixed” state. These two states are similar with the follow-ing exceptions: the latter state is assumed to have slightlylower quality of life and a 5% annual probability for GIsurgical-medical treatment.11 At any transition the cohortmembers may die of Chagas or other causes such as theunderlying condition requiring transfusion and beabsorbed into the all-cause death state.
Transition probabilitiesDisease progression probabilities were estimated fromliterature review of vector-transmitted and TT Chagasdisease (Table 2). In the model, infection acquisitiondepends on four factors (Eq. [1]): T. cruzi seroprevalence,effectiveness of each screening strategy, the number ofblood components produced from each infected dona-tion, and T. cruzi transmissibility.
In the United States, a seroprevalence of 1 in 29,000during the first 2 years of donor testing was observed.12 Toestimate effectiveness for each strategy, we assumed thatuniversal screening would be 98% effective and used 22months of universal testing data from BSI to calculateeffectiveness adjustment factors (EAFs) defined as thepercentage of confirmed cases each strategy would inter-dict out of the total reported. For example, screening first-time donors captured 75% of the confirmed cases ofT. cruzi (EAF, 0.75). While in BSI’s experience, no con-firmed donor infections came from PLT donations, toreflect previous observations that T. cruzi transmissionrisk is greater in PLTs, we used an EAF for PLTs of 0.5 andfor PLTs and whole blood of 0.975. Marginal effectivenessof interdicting new infections in repeat donors with thehelp of questions was not considered because no estimateof incident infection exists. We assumed that 1.45 compo-nents are made from each whole blood donation, thusamplifying the residual risk of a single donation.13 Toreflect literature reports, we used 10% T. cruzi transfusiontransmissibility as the baseline in the model.14 Insummary, for the case of universal testing (EAF, 0.98), theestimated overall probability that T. cruzi is transmitted toa blood recipient is 1 per 10,000,000 transfusions.
Probability of transmission EAF= −( ) × ×1 29 000 1 1 45 10, . %.(1)
Mortality rates were estimated using posttransfusionsurvival data from up to 20 years of follow-up provided byScanDat.15 The model simulated lifetime outcomes andcosts until 99.9% of the cohort had died. Starting at Year 20posttransfusion, the model interpolated annual valuesfrom 10-year increments. To estimate long-term mortality,ScanDat annual mortality was merged with US life tablesat Year 30 after transfusion for a person 20 and 60 years of
A
B
Acute
Chronic
Cardiomyopathy Mixed Cardio/GI
GI Surgery Heart Failure Heart Failure
Fig. 1. (A) Chagas disease progression. Thick lines indicate the
most probable path. (B) Bubbles indicate Markov states and
arrows indicate possible transitions; remaining in one state
for multiple years and/or cycles is possible and transition to
death is possible from any state.
AGAPOVA ET AL.
2222 TRANSFUSION Volume 50, October 2010

age in the younger and all-ages transfusion recipientcohorts, respectively.16 We estimated mortality due toChagas as health state–dependent additional risk(Table 2).
CostsThe cost of screening, on a per-donation basis, composedof reagents, labor, and confirmatory testing, is estimatedfrom data provided by BSI (G. Robertson, Blood SystemsLaboratories, personal communication, 2009; Table 3).Similar to the method used for EAFs, we developed costadjustment factors (CAFs) for each screening strategy.CAFs are based on the number of donations in the22-month period that would have been tested by eachstrategy out of the total donations processed combinedwith an assumed extra cost reflecting loss of economies ofscale. For example, successful first-time donors represent13% of the donor population. A loss of economies of scaleof 5% additional cost was added to any selective strategythat is designed to screen less than half of the donor popu-
lation. The marginal cost of testing donors already testedonce or twice but identified at risk by ongoing risk ques-tioning was assumed to be the same as that of the stand-alone CAF for donation screening based on the riskquestioning strategy (an additional 3%); therefore, aggre-gate first-time donor strategy CAF is 0.21.
All illness-related costs are rounded to the nearest$100 amount and updated to 2007 dollars by using themedical care component of the Consumer Price Index.17
Arkansas 2007 HCUP data were used to determinestandard charges for X-ray, electrocardiogram (EKG),echocardiogram, laboratory workup, and outpatient phy-sician visits including indirect professional fees (Table 3).Charges were converted to costs using an all-payer inpa-tient, hospital-specific, mean cost-to-charge ratio of0.5.18
We used the friction cost method to calculate produc-tivity loss. The cost of lost productivity is expressed as thetime consumed (friction period) to fully replace a workerno longer able to work with another from the pool ofunemployed multiplied by an average wage rate.19 In the
TABLE 2. Chagas disease quality-of-life estimates, disease progression, and mortality probabilitiesVariable Estimate Range Source
Health state utilitiesIndeterminate form 0.9 0.81-0.99 13
Cardiomyopathy 0.80 0.7-0.9 26,27
Mixed clinical form 0.75 0.7-0.84 28,29
Heart failure 0.63 0.47-0.79 30
Transition probabilities (annual)Clinical form* 0.0001 for 10 years with 1.087
annual increase thereafter�25% 22,26,31
Cardiac symptoms 0.95 0.80-0.90 32
Heart failure 0.03 0.0-0.06 33
GI surgery* 0.05 0.01-0.06 11
Mortality probabilities (annual)Posttransfusion old; young See technical appendix �25% 15,16
Acute state; immunocompromised* 0.025;0.34 0-0.01; 0.14-0.54 3
Cardiac sudden death while in indeterminate form* 0.03, Year 1; 0.05, Year 20 �25% 34
Cardiomyopathy state 0.04 0.03-0.05 5
Mixed state 0.038 0.035-0.041 35
Specific to heart failure 0.22 0.15-0.29 36
Specific to GI surgery 0.04 0.0-0.2 11
* Additional methods details are provided in the technical appendix.
TABLE 3. Costs of T. cruzi screening, Chagas diagnosis, treatment, and lost productivityVariable Estimate ($) Range ($) Location in tree Source
Antibody test 5.0 2.0-8.0 All strategy arms except no testing BSIAntibody test labor 1.5 1.0-2.0 All strategy arms except no testing BSIConfirmatory test* 0.10 0.05-0.15 All strategy arms except no testing BSIAnnual clinical workup* (visit, X-ray,
echocardiogram, EKG, and laboratory tests)700 600-1,000 All nondeath states in transmitted arm 37
Drug treatment and follow-up* 1,300 1,000-1,600 Acute and clinical form 37
Final year of cardiomyopathy or mixed 55,600 41,200-70,000 Cardiomyopathy and mixed states 38
Heart failure 36,100 20,600-51,500 Cardiomyopathy and mixed states 38,39
GI surgery 4,000 3,000-5,000 Mixed state 40
Lost productivity* 25,100/6 months 20,000-30,000 Heart failure and all Chagas-related death 20
* Additional methods details are provided in the technical appendix.
COST-EFFECTIVENESS OF T. CRUZI TESTING
Volume 50, October 2010 TRANSFUSION 2223

cases of heart failure or Chagas death, we assumed a6-month replacement period at average US householdincome.20
Sensitivity analysesTo estimate the influence of individual model variablesand overall uncertainty, we used one-way, two-way, andprobabilistic (Monte Carlo simulation of 10,000 runs)sensitivity analyses. We present the one-way sensitivityresults in a single graph, a tornado diagram, in whicheach variable is represented by a horizontal bar. The sizeof the bar indicates how the CER or ICER result changesover the specified range of values for each variable. Theexpected (baseline) CER or ICER value is demarcated bya vertical, dotted line. Holding all other variables con-stant, we varied seroprevalence and transmissibility in atwo-way sensitivity analysis assuming a willingness topay per QALY of $1 million. Highest donor seropreva-lence has been reported in Florida (1:3800)14 and weassumed a low seroprevalence of 1:100,000. Similarly,transmissibility has not been reported higher than 10%and in some cases as low as 4%;9 we therefore selected abroad range of possible values, 1% to 20%. Probabilisticsensitivity analysis is presented as an acceptability curveand is also used to generate the CER and ICER point esti-mate and confidence intervals (CIs) approximations (the2.5 and 97.5 percentile values of the distribution ofresults from the Monte Carlo simulation). As recom-mended by the US Panel on Cost Effectiveness in Healthand Medicine we varied discount rates for future costs
and effects from 3% down to 1% and up to 5%.21 Wemodeled uncertain variables using triangular distribu-tions for all variables with the exception of CAFs, sero-prevalence, and transmissibility, which were modeledusing beta distributions and direct medical care costsfor which we used normal distributions. We constructedand performed all analyses using computer software(TreeAge Pro 2009 Suite, Release 1.0.2, TreeAge, Inc., Wil-liamstown, MA).
RESULTS
In the all-ages cohort baseline analysis, the mean quality-adjusted life expectancy of transfused patients was 8.57years and the mean cost of TT Chagas spread across allrecipients was $0.06; society gains a mean of 2.3 quality-adjusted life-minutes per blood recipient with universalscreening in place. In the cohort consisting of recipientsaged 39 years and younger, estimated quality-adjusted lifeexpectancy was longer, 21.75 QALYs with a cost attribut-able to TT Chagas of $0.25 per patient; a mean of 12.2quality-adjusted life-minutes are gained in this cohortwhen universal screening is implemented. Modeled life-time cost of Chagas disease for an immunocompetentrecipient older than 40 years of age was $11,000, whereaslifetime cost was $53,000 for a recipient 39 years oryounger. In Table 4, incremental cost, effectiveness, andCERs along with CI for each strategy, compared to notesting for Chagas, are provided. Also included are theICERs of each strategy relative to the preceding, less costlystrategy.
TABLE 4. Cost, effectiveness, and cost-effectiveness of testing the blood supply for T. cruzi compared againstno screening and in formal incremental analysis
Strategy Cost ($) QALYs CER ($/QALY) CER CI ($/QALY) ICER ($/QALY)
All Age GroupsNo Screening* 0.06 8.57Question 0.48 0.00000306 173,000 55,000-375,000 173,000Platelets 0.81 0.00000269 332,000 124,000-692,000 (Dominated)1st time 1.36 0.00000403 369,000 161,000-712,000 907,0001 time all 3.54 0.00000510 757,000 348,000-1,411,000 2,026,0002 time all 4.61 0.00000521 967,000 450,000-1,808,000 9,940,000Whole blood/PLTs 5.14 0.00000523 1,072,000 500,000-2,008,000 19,768,000Universal 6.56 0.00000526 1,359,000 637,000-2,527,000 52,569,00039 Years or YoungerNo Screening* 0.25 21.75Question 0.37 0.0000137 29,000 5,000-67,000 29,000Platelets 0.71 0.0000120 63,000 22,000-131,000 (Dominated)1st time 1.21 0.0000181 71,000 32,000-132,000 195,0001 time all 3.34 0.0000229 154,000 77,000-269,000 445,0002 time all 4.40 0.0000234 199,000 101,000-343,000 2,212,000Whole blood/PLTs 4.93 0.0000235 221,000 114,000-383,000 4,407,000Universal 6.34 0.0000236 283,000 146,000-487,000 11,734,000
* Changes in costs and effects of each strategy were compared to baseline costs ($0.06) and estimated posttransfusion survival with noT. cruzi screening in place across the entire cohort (8.57 QALYs). Cost-effectiveness ratio (CER) is reported comparing each strategy to notesting (95% confidence interval [CI] approximation), and as the incremental cost-effectiveness ratio (ICER) of each strategy compared tothe preceding strategy.
AGAPOVA ET AL.
2224 TRANSFUSION Volume 50, October 2010

All-ages cohortWhen compared to no testing, the most cost-effectivetesting strategy is to test only those donors who report riskbased on predonation questioning at $173,000 per QALY(95% CI, $55,000-$375,000/QALY). Results of one-timetesting of all donors, $757,000 per QALY (95% CI, $348,000-$1,411,000), and universal testing, $1,359,000 per QALY(95% CI, $637,000-$2,527,000/QALY), reflect a constantincrease in testing costs and negligible increases in effec-tiveness (reduced transfusion transmission of T. cruzi andsubsequent Chagas disease burden).
Younger cohortTesting only blood donations that would be transfused torecipients 39 years or younger leads to a lower cost perQALY in all strategies. The most cost-effective strategy isagain the risk question strategy at $29,000 per QALY (95%CI, $5000-$67,000/QALY). One-time testing costs $71,000per QALY (95% CI, $32,000-$132,000/QALY) and universaltesting costs $283,000 per QALY (95% CI, $146,000-$487,000/QALY).
Formal incremental cost-effectiveness analysisIn both cohorts, PLT-only screening is dominated by therisk question strategy when cost and effects of the strate-gies are compared in incremental cost-effectivenessanalysis (Table 4). When compared to one-time testing,the incremental cost per QALY gained of testing eachdonor’s next donation (two-time testing strategy) and uni-versal testing are $9,940,000 per QALY and $18,738,000 perQALY, respectively.
Sensitivity analysisIn one-way sensitivity, the model was not sensitive to mostChagas-specific variables such as probabilities of diseaseprogression, costs of treatment, or lost productivity; ratherit was sensitive to variables that affect all blood recipients:the discount rate for effects and posttransfusion mortalityrate and quality of life. At 1% discount for future effects ofT. cruzi infection in the all-ages cohort, the CER of everystrategy improved a mean of 22% and at 5% annual dis-count for future effects all strategies became approxi-mately 14% more expensive. In the younger cohort, a 1%discount rate decreased the CER by 54% and a 5% dis-count rate increased the ratio by 74%.
In addition, with the use of a tornado diagram weexamined the variables which influence the ICER of one-time screening against no testing (Fig. 2). Uncertainty inUS blood donor seroprevalence, transmissibility, cost ofthe antibody test, the proportion of immunocompro-mised recipients, and the probability of acute death of
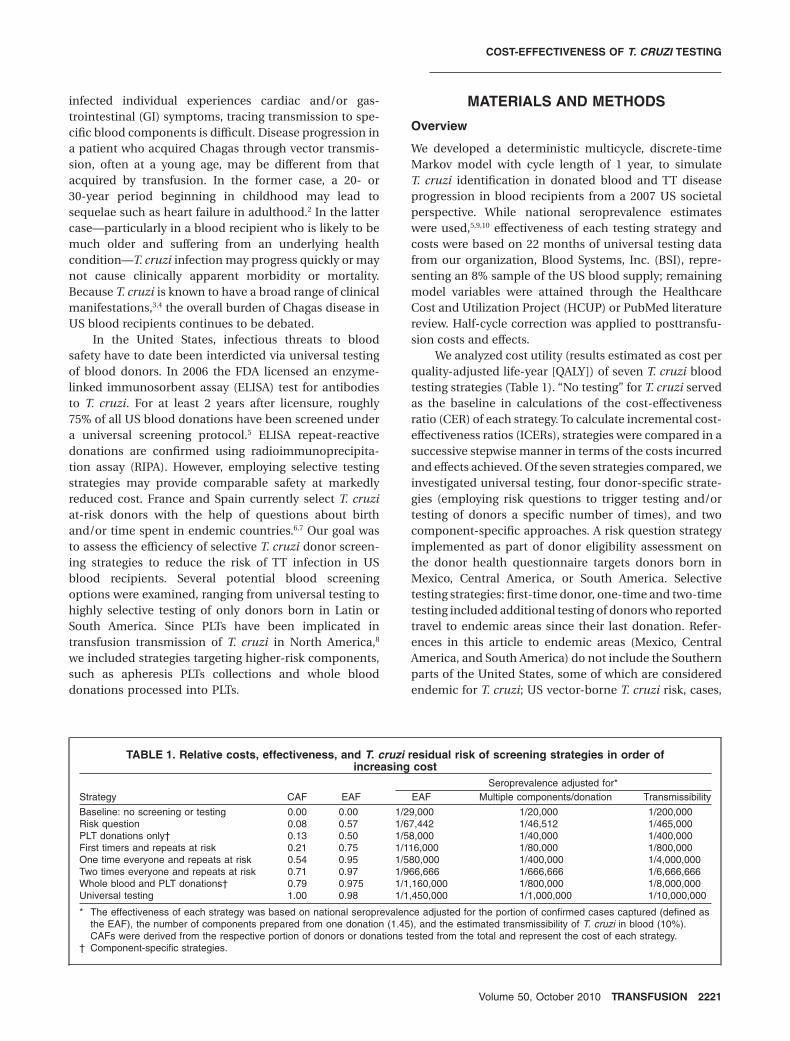
these recipients created the greatest fluctuation in theCER. A seroprevalence of 1:100,000 and a transmissibilityof 1% when examined independently had a similar effectof worsening the CER of this strategy by threefold. Infurther examination of the influence of these two vari-ables on the optimal screening strategy, we performed atwo-way sensitivity analysis (Fig. 3). At low seroprevalenceand transmissibility represented by the lower left area ofthe plot, “no testing” is the optimal strategy. The plotshows that in the low range of possible values for sero-prevalence and transmissibility, only the no testing strat-egy would have a cost per QALY at or below $1,000,000.The strategy that occupies the greatest area of the plot is totest every donor once. However, under higher TT risk con-ditions, such as a seroprevalence at or higher than 1:5000and transmissibility greater than 15%, two-time testingwould be the optimal strategy. Note that assuming the$1,000,000 per QALY willingness-to-pay threshold, univer-sal testing is not an optimal strategy across the range ofplausible values for seroprevalence and transmissibility.
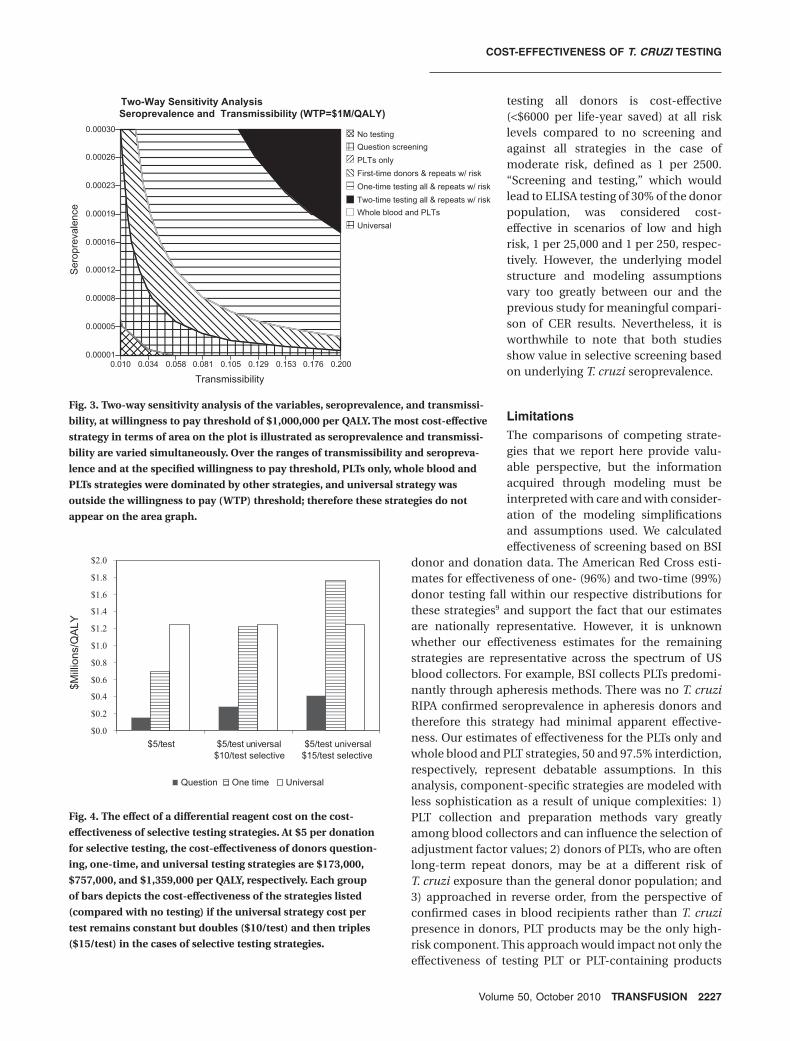
Consideration of the third most influential variabledepicted in the tornado diagram, cost per test, reveals thatthere is a significant impact on cost-effectiveness of one-time testing compared to no screening if the reagent priceper unit varies up or down by $1 or $2. The impact ofdiscriminately applying cost increases to selective strate-gies was similarly significant (Fig. 4). We estimate thatwhen each strategy is compared independently with noscreening, doubling of reagent costs for one-time selectivetesting (from the base estimate of $5 to $10) would lead tothe same CER for this selective testing strategy as univer-sal testing. Further, if the cost per test of one-time or two-time screening is tripled (to $15), selectively screeningdonors becomes more costly than universal screening. Ifone-time and universal screening are compared side byside, in incremental analysis, one-time screening is lesseffective and relatively more costly than universal screen-ing and is, therefore, dominated.
In probabilistic sensitivity analysis, we have por-trayed overall uncertainty as a cost-effectiveness accept-ability curve (Fig. 5). The curve shows what the probabilityis that a given strategy is cost-effective for specificwillingness-to-pay values. For example, there is a 57%chance that the cost-effectiveness of one-time testing ofT. cruzi is equal to or less than $757,000 per QALY, whencompared to no testing for T. cruzi.
DISCUSSION
We developed a decision analytic model for two bloodrecipient cohorts: a cohort of blood recipients of all agesand a cohort of recipients aged 39 years or younger. Theresults for these two cohorts show a large difference in thecost-effectiveness of different strategies for screening USblood donors for T. cruzi to prevent Chagas disease in
COST-EFFECTIVENESS OF T. CRUZI TESTING
Volume 50, October 2010 TRANSFUSION 2225

blood recipients. In sensitivity analysis of the overallmodel, we identified this difference as attributable tothe influence of mortality and health state utilityposttransfusion; the averaged life-expectancy of all agesversus the cohort 39 years or younger was approximately 9and 22 QALYs, respectively. At $1,360,000 per QALY, uni-versal screening is not cost-effective, and nearly all of thebenefits of screening could be achieved by selectivetesting strategies such as one-time testing of all donors($757,000/QALY). When strategies were compared informal incremental analysis, the combined effect of sero-prevalence and transmissibility drove ICER variability.
In this analysis we included two scenarios that strati-fied the recipient population by age. The purpose of thethese scenarios was not intended to imply that testing ofblood should or could be reserved for blood intended togo to young recipients as this implication is laden withethical and logistical concerns. Instead we intended tomake explicit that longer life expectancy posttransfusionwill improve cost-effectiveness of any blood testing inter-vention, especially in cases of lifelong, chronic conditionscharacterized by progressively worse outcomes over time.The greater importance of transfusion survival and quality
of life in the model reflect the reality that general post-transfusion morbidity and mortality outweigh Chagas-specific outcomes.
Through sensitivity analysis we illustrated the highconsequences of overstating T. cruzi seroprevalence andtransmissibility (Fig. 2). Although in some regions of theUS seroprevalence approaches 1 in 3000 there is little evi-dence that recipients have been infected at a proportionanywhere near this value. Even at a donor seroprevalenceof 1 in 29,000, we estimate that 1 recipient in 200,000 isinfected when no intervention is in place. Every year,approximately 5 million patients receive transfusions; thisequates to 25 annual transmissions before testing was ini-tiated. This annual number does not align well with thehistorical sum of seven known TT Chagas cases reportedin an approximately 10-year period before screening wasadopted.8
The influential effect of seroprevalence on the cost-effectiveness of T. cruzi screening strategies was reportedpreviously by Wilson and colleagues,22 who investigatedthe value of a risk questions selective screening strategyreferred to as “screening and testing” against doing noscreening or universal testing and found that ELISA
One-Time Testing versus No TestingNine Most Influential Variables
ICER
$0.0M $0.5M $1.0M $1.5M $2.0M $2.5M
T. cruzi seroprevalence: 1:29,000 (1:3,000-1:100,000)
T. cruzi transmissibility: 10% (20%-1%)
Cost of antibody test: $5.00 ($2-$8)
Proportion of immunocompromised patients: 25% (10%-50%)
Probability of death in acute state if immunocompromised: 34% (14%-54%)
Testing all donors once EAF: 0.95 (1-0.675)
Discount for future effects: 3% (1%-5%)
Annual ScanDat survival : +25% to -25%
Number of components per donation: 1.45 (1-4)
Fig. 2. Tornado diagram of the nine most influential variables. Point estimates of the most influential variables and, in parentheses,
the ranges of possible values corresponding with the left and right values at the end of each horizontal bar are provided in order
from the most to least influence on the incremental cost-effectiveness of one-time testing compared to no testing. The vertical
dotted line indicates the modeled expected incremental cost-effectiveness of one-time testing ($757,000/QALY). Although the mean
number of components processed from one donation is the ninth most influential variable, at the selected x-axis scale, its influ-
ence is too small and no bar appears on the plot.
AGAPOVA ET AL.
2226 TRANSFUSION Volume 50, October 2010
testing all donors is cost-effective(<$6000 per life-year saved) at all risklevels compared to no screening andagainst all strategies in the case ofmoderate risk, defined as 1 per 2500.“Screening and testing,” which wouldlead to ELISA testing of 30% of the donorpopulation, was considered cost-effective in scenarios of low and highrisk, 1 per 25,000 and 1 per 250, respec-tively. However, the underlying modelstructure and modeling assumptionsvary too greatly between our and theprevious study for meaningful compari-son of CER results. Nevertheless, it isworthwhile to note that both studiesshow value in selective screening basedon underlying T. cruzi seroprevalence.
LimitationsThe comparisons of competing strate-gies that we report here provide valu-able perspective, but the informationacquired through modeling must beinterpreted with care and with consider-ation of the modeling simplificationsand assumptions used. We calculatedeffectiveness of screening based on BSI
donor and donation data. The American Red Cross esti-mates for effectiveness of one- (96%) and two-time (99%)donor testing fall within our respective distributions forthese strategies9 and support the fact that our estimatesare nationally representative. However, it is unknownwhether our effectiveness estimates for the remainingstrategies are representative across the spectrum of USblood collectors. For example, BSI collects PLTs predomi-nantly through apheresis methods. There was no T. cruziRIPA confirmed seroprevalence in apheresis donors andtherefore this strategy had minimal apparent effective-ness. Our estimates of effectiveness for the PLTs only andwhole blood and PLT strategies, 50 and 97.5% interdiction,respectively, represent debatable assumptions. In thisanalysis, component-specific strategies are modeled withless sophistication as a result of unique complexities: 1)PLT collection and preparation methods vary greatlyamong blood collectors and can influence the selection ofadjustment factor values; 2) donors of PLTs, who are oftenlong-term repeat donors, may be at a different risk ofT. cruzi exposure than the general donor population; and3) approached in reverse order, from the perspective ofconfirmed cases in blood recipients rather than T. cruzipresence in donors, PLT products may be the only high-risk component. This approach would impact not only theeffectiveness of testing PLT or PLT-containing products
Two-Way Sensitivity Analysis
Seroprevalence and Transmissibility (WTP=$1M/QALY)
Transmissibility
Ser
opre
vale
nce
0.010 0.034 0.058 0.081 0.105 0.129 0.153 0.176 0.200
0.00030
0.00026
0.00023
0.00019
0.00016
0.00012
0.00008
0.00005
0.00001
No testing
Question screening
PLTs only
First-time donors & repeats w/ risk
One-time testing all & repeats w/ risk
Two-time testing all & repeats w/ risk
Whole blood and PLTs
Universal
Fig. 3. Two-way sensitivity analysis of the variables, seroprevalence, and transmissi-
bility, at willingness to pay threshold of $1,000,000 per QALY. The most cost-effective
strategy in terms of area on the plot is illustrated as seroprevalence and transmissi-
bility are varied simultaneously. Over the ranges of transmissibility and seropreva-
lence and at the specified willingness to pay threshold, PLTs only, whole blood and
PLTs strategies were dominated by other strategies, and universal strategy was
outside the willingness to pay (WTP) threshold; therefore these strategies do not
appear on the area graph.
$0.0
$0.2
$0.4
$0.6
$0.8
$1.0
$1.2
$1.4
$1.6
$1.8
$2.0
$5/test $5/test universal$10/test selective
$5/test universal$15/test selective
$Mill
ions
/QA
LY
Question One time Universal
Fig. 4. The effect of a differential reagent cost on the cost-
effectiveness of selective testing strategies. At $5 per donation
for selective testing, the cost-effectiveness of donors question-
ing, one-time, and universal testing strategies are $173,000,
$757,000, and $1,359,000 per QALY, respectively. Each group
of bars depicts the cost-effectiveness of the strategies listed
(compared with no testing) if the universal strategy cost per
test remains constant but doubles ($10/test) and then triples
($15/test) in the cases of selective testing strategies.
COST-EFFECTIVENESS OF T. CRUZI TESTING
Volume 50, October 2010 TRANSFUSION 2227

but also EAFs of other strategies and the overall residualrisk as a function of transmissibility.
Differential transmissibility across components, inpart due to room temperature storage conditions ofPLT products, is a pertinent limitation of modelingcomponent-specific strategies. In a recent 22-month look-back study of 242 recipients who may have receivedT. cruzi-positive blood products, it is likely that two trans-fusion transmissions occurred, and all recognized NorthAmerican transmissions to date have come from PLT-containing products.8,23 Although the strategy to test PLTproducts was dominated by other strategies in incremen-tal analysis, PLT screening can become cost-effective iftransmissibility proves high (�10%) in these products andvery low or nonexistent in non-PLT components (<4%).Until better information is available regarding the exist-ence and extent of differential transmissibility amongblood components, dismissing the utility of component-specific strategies may be premature.
Selective testing requires initial costs such as imple-menting enhanced donor database management toolsand laboratory test triage and routing algorithms. Whilereducing the number of tests using selective strategiesseems feasible to blood centers, manufacturers may reactto selective testing by increasing the per test reagent costs.We attempted to partially account for lost economies ofscale by increasing CAFs by 5% for strategies that test lessthan 50% of the donor population. However, this mayunderestimate up-front, fixed costs of selective testingstrategies and does not account for changes in variablecosts. A threefold increase in antibody reagent costs of allstrategies reduces the cost-effectiveness of T. cruzi testingby 132 and 152% when comparing one-time testing to no
testing and universal testing to one-time testing, respec-tively. Moreover, holding all else constant, large reagentcost increases applied to selective strategies, but not uni-versal testing, can shift CERs of selective strategies to suchan extent that universal testing becomes favorable from acost per QALY perspective.
Resource utilization varies nationwide; our analysismay not have fully captured health care resource utiliza-tion for T. cruzi-infected blood recipients. As there are nodata on lifetime Chagas-specific health services consump-tion of posttransfusion patients, we used non-Chagascardiomyopathy, chronic heart failure, and colectomyinformation. Arkansas charges data and the 2006 cost-to-charge ratio may not represent nationwide resource costs.
We defined immunocompromised patients as thosehaving moderate to severe underlying compromisedimmune systems resulting from conditions such ashuman immunodeficiency virus (HIV) infection, neo-plasms, or organ transplants.23 The estimate of bloodproducts transfused to immunocompromised recipientscould be much higher than 25%. In deterministic sensitiv-ity analysis (results not shown), general population CERsimprove 42% when 50% of blood recipients have animmunocompromised profile. This change affects thecost-effectiveness profile of the younger population farmore dramatically: the CER of one- and two-time testingincreased 580%, with a range of increase from 570% (uni-versal screening) to 720% (risk question approach).
Each one of the strategies we analyzed haslimitations: screening by risk questions is vulnerable tointentional or inadvertent misreporting and, also, alongwith the strategy to test only first-time donors, would notcapture long-standing or new autochthonous cases; one-and two-time testing would not capture all incident cases(seroconversion); component-specific methods may misscomponents with viable T. cruzi, and universal screening,if autochthonous and seroconversion infections are rare,may unnecessarily divert scarce resources from higherpriority interventions. Concern that selective screening,which does not continuously and universally test for thepresence of T. cruzi, leaves open the possibility for repeatdonors to develop incident infections should be inbalance with existing trends: 1) no definitive cases ofT. cruzi seroconversion have been reported and 2) theincidence rate of T. cruzi in endemic continues to decline.
In conclusion, it is unclear how much testing is nec-essary to safeguard the national blood supply from the riskof T. cruzi transmission. If compared to other infectiousdisease screening, T. cruzi screening, even at the cost ofuniversal testing ($1.36 million/QALY) falls within therange of already implemented interventions, such as HIVnucleic acid testing (NAT) and hepatitis C virus NAT andother interventions that have CERs above $1.0 million perQALY.24 However, it is likely only younger and some immu-nocompromised transfusion recipients will realize a
0
0.1
0.2
0.3
0.4
0.5
0.6
0.7
0.8
0.9
1
0 200 400 600 800 1,000
Willingness to Pay ($1,000s)
Pro
ba
bil
ity
Co
st-
Eff
ec
tiv
e
Fig. 5. Cost-effectiveness acceptability curve at a willingness
to pay threshold of $1,000,000 per QALY. (—) Risk question;
( ) PLTs; (�) first-timers plus at risk; (¥) one-time plus at risk;
(*) two-time plus at risk; (�) whole blood and PLTs; ( )
universal.
AGAPOVA ET AL.
2228 TRANSFUSION Volume 50, October 2010
measurable benefit of preventing clinically apparentChagas disease and therefore directly benefit from T. cruziscreening. All the while, in all age groups and patient cat-egories, incorrect blood transfused remains the leadingcause of transfusion-related mortality (69.7%) comparedto mortality related to infections (1.8%), the categoryT. cruzi infection shares with other parasitic, bacterial, andviral blood-borne pathogens.25
T. cruzi transmissibility, in terms of infectious doseand viability in blood products, deserves further investi-gation. The potential availability of pathogen reductionmethods, particularly those developed for PLT productsthat may carry the highest risk of T. cruzi transmission,may also warrant consideration. In the meantime, selec-tive strategies provide a more cost-effective US T. cruziinterdiction solution. A recent recommendation by the USFDA Blood Products Advisory Committee to allow one-time screening is now being used by some of the largestblood collection agencies in the country. A study to assessincidence of T. cruzi infection in previously tested donorsis also now under way. Selective testing for T. cruzi appearsto fit well in a new era of evidence-based decision making,and the health economics of selective testing provideadditional support for this approach.
TECHNICAL APPENDIX
This appendix supplements the methods section of ourarticle. As recommended by The Panel on Cost-Effectiveness in Health and Medicine, we provide detailedexplanations of the variables used in the model for repli-cation and validation purposes.
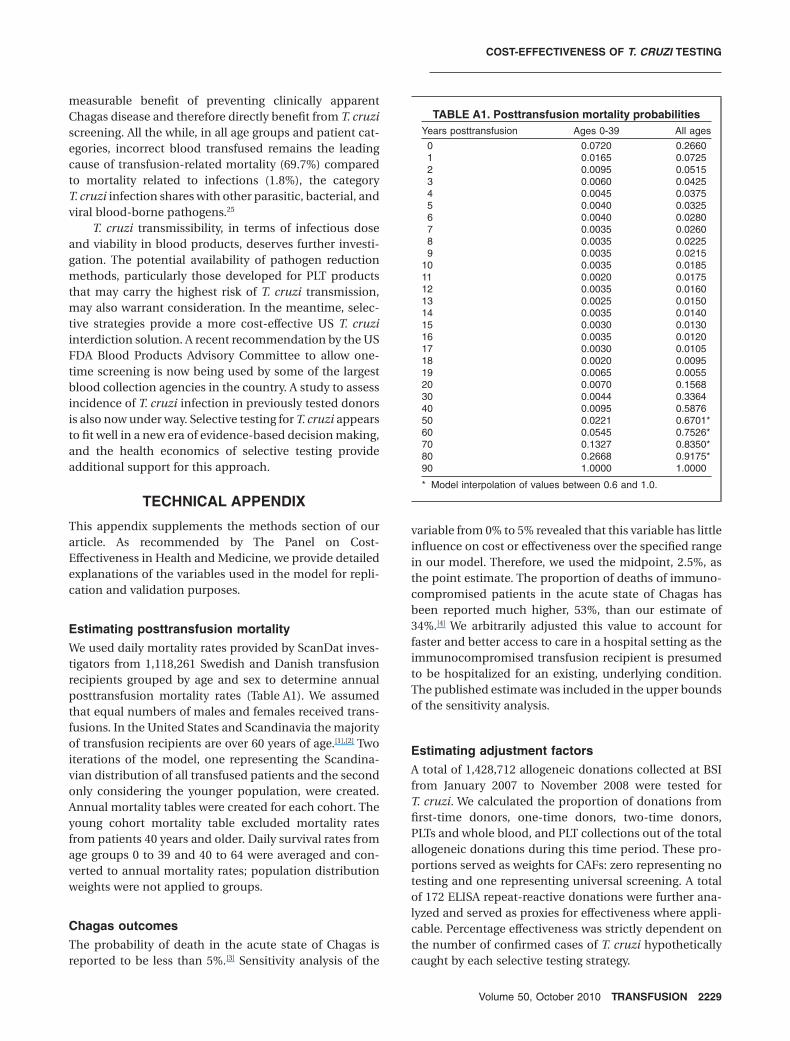
Estimating posttransfusion mortalityWe used daily mortality rates provided by ScanDat inves-tigators from 1,118,261 Swedish and Danish transfusionrecipients grouped by age and sex to determine annualposttransfusion mortality rates (Table A1). We assumedthat equal numbers of males and females received trans-fusions. In the United States and Scandinavia the majorityof transfusion recipients are over 60 years of age.[1],[2] Twoiterations of the model, one representing the Scandina-vian distribution of all transfused patients and the secondonly considering the younger population, were created.Annual mortality tables were created for each cohort. Theyoung cohort mortality table excluded mortality ratesfrom patients 40 years and older. Daily survival rates fromage groups 0 to 39 and 40 to 64 were averaged and con-verted to annual mortality rates; population distributionweights were not applied to groups.
Chagas outcomesThe probability of death in the acute state of Chagas isreported to be less than 5%.[3] Sensitivity analysis of the
variable from 0% to 5% revealed that this variable has littleinfluence on cost or effectiveness over the specified rangein our model. Therefore, we used the midpoint, 2.5%, asthe point estimate. The proportion of deaths of immuno-compromised patients in the acute state of Chagas hasbeen reported much higher, 53%, than our estimate of34%.[4] We arbitrarily adjusted this value to account forfaster and better access to care in a hospital setting as theimmunocompromised transfusion recipient is presumedto be hospitalized for an existing, underlying condition.The published estimate was included in the upper boundsof the sensitivity analysis.
Estimating adjustment factorsA total of 1,428,712 allogeneic donations collected at BSIfrom January 2007 to November 2008 were tested forT. cruzi. We calculated the proportion of donations fromfirst-time donors, one-time donors, two-time donors,PLTs and whole blood, and PLT collections out of the totalallogeneic donations during this time period. These pro-portions served as weights for CAFs: zero representing notesting and one representing universal screening. A totalof 172 ELISA repeat-reactive donations were further ana-lyzed and served as proxies for effectiveness where appli-cable. Percentage effectiveness was strictly dependent onthe number of confirmed cases of T. cruzi hypotheticallycaught by each selective testing strategy.
TABLE A1. Posttransfusion mortality probabilitiesYears posttransfusion Ages 0-39 All ages
0 0.0720 0.26601 0.0165 0.07252 0.0095 0.05153 0.0060 0.04254 0.0045 0.03755 0.0040 0.03256 0.0040 0.02807 0.0035 0.02608 0.0035 0.02259 0.0035 0.0215
10 0.0035 0.018511 0.0020 0.017512 0.0035 0.016013 0.0025 0.015014 0.0035 0.014015 0.0030 0.013016 0.0035 0.012017 0.0030 0.010518 0.0020 0.009519 0.0065 0.005520 0.0070 0.156830 0.0044 0.336440 0.0095 0.587650 0.0221 0.6701*60 0.0545 0.7526*70 0.1327 0.8350*80 0.2668 0.9175*90 1.0000 1.0000
* Model interpolation of values between 0.6 and 1.0.
COST-EFFECTIVENESS OF T. CRUZI TESTING
Volume 50, October 2010 TRANSFUSION 2229
Estimating costs of Chagas diagnosisand treatmentThe cost of RIPA confirmatory testing on an overall per-donation-tested basis was calculated by multiplying theestimated per-donation cost of the test ($450) by the pro-portion of repeat-reactive cases (2775 nationwide) to allblood donations for the 22-month period in 2007 through2008 (19.3 million), rounded to $0.10.[5] This number is notstatic and is affected by the proportion of repeat-reactivedonations. Although ELISA repeat-reactive donors arepermanently deferred and their blood donations are dis-carded, we did not consider these costs in our analysis.
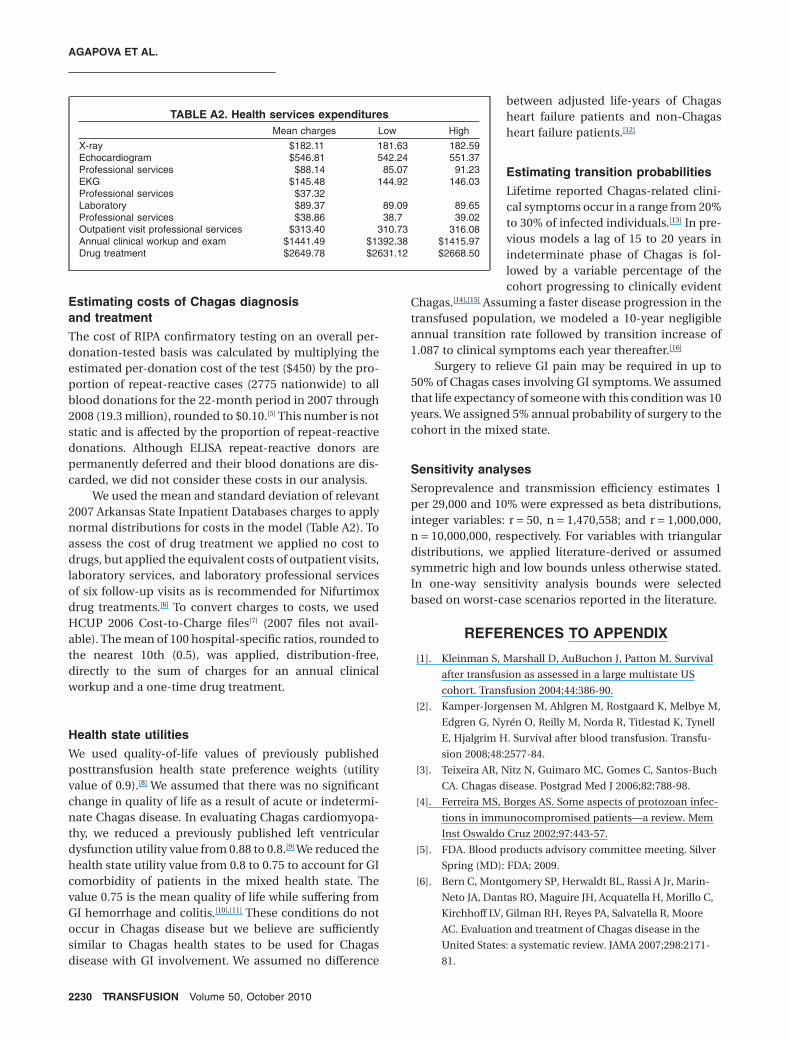
We used the mean and standard deviation of relevant2007 Arkansas State Inpatient Databases charges to applynormal distributions for costs in the model (Table A2). Toassess the cost of drug treatment we applied no cost todrugs, but applied the equivalent costs of outpatient visits,laboratory services, and laboratory professional servicesof six follow-up visits as is recommended for Nifurtimoxdrug treatments.[6] To convert charges to costs, we usedHCUP 2006 Cost-to-Charge files[7] (2007 files not avail-able). The mean of 100 hospital-specific ratios, rounded tothe nearest 10th (0.5), was applied, distribution-free,directly to the sum of charges for an annual clinicalworkup and a one-time drug treatment.
Health state utilitiesWe used quality-of-life values of previously publishedposttransfusion health state preference weights (utilityvalue of 0.9).[8] We assumed that there was no significantchange in quality of life as a result of acute or indetermi-nate Chagas disease. In evaluating Chagas cardiomyopa-thy, we reduced a previously published left ventriculardysfunction utility value from 0.88 to 0.8.[9] We reduced thehealth state utility value from 0.8 to 0.75 to account for GIcomorbidity of patients in the mixed health state. Thevalue 0.75 is the mean quality of life while suffering fromGI hemorrhage and colitis.[10],[11] These conditions do notoccur in Chagas disease but we believe are sufficientlysimilar to Chagas health states to be used for Chagasdisease with GI involvement. We assumed no difference
between adjusted life-years of Chagasheart failure patients and non-Chagasheart failure patients.[12]
Estimating transition probabilitiesLifetime reported Chagas-related clini-cal symptoms occur in a range from 20%to 30% of infected individuals.[13] In pre-vious models a lag of 15 to 20 years inindeterminate phase of Chagas is fol-lowed by a variable percentage of thecohort progressing to clinically evident
Chagas.[14],[15] Assuming a faster disease progression in thetransfused population, we modeled a 10-year negligibleannual transition rate followed by transition increase of1.087 to clinical symptoms each year thereafter.[16]
Surgery to relieve GI pain may be required in up to50% of Chagas cases involving GI symptoms. We assumedthat life expectancy of someone with this condition was 10years. We assigned 5% annual probability of surgery to thecohort in the mixed state.
Sensitivity analysesSeroprevalence and transmission efficiency estimates 1per 29,000 and 10% were expressed as beta distributions,integer variables: r = 50, n = 1,470,558; and r = 1,000,000,n = 10,000,000, respectively. For variables with triangulardistributions, we applied literature-derived or assumedsymmetric high and low bounds unless otherwise stated.In one-way sensitivity analysis bounds were selectedbased on worst-case scenarios reported in the literature.
REFERENCES TO APPENDIX
[1]. Kleinman S, Marshall D, AuBuchon J, Patton M. Survival
after transfusion as assessed in a large multistate US
cohort. Transfusion 2004;44:386-90.
[2]. Kamper-Jorgensen M, Ahlgren M, Rostgaard K, Melbye M,
Edgren G, Nyrén O, Reilly M, Norda R, Titlestad K, Tynell
E, Hjalgrim H. Survival after blood transfusion. Transfu-
sion 2008;48:2577-84.
[3]. Teixeira AR, Nitz N, Guimaro MC, Gomes C, Santos-Buch
CA. Chagas disease. Postgrad Med J 2006;82:788-98.
[4]. Ferreira MS, Borges AS. Some aspects of protozoan infec-
tions in immunocompromised patients—a review. Mem
Inst Oswaldo Cruz 2002;97:443-57.
[5]. FDA. Blood products advisory committee meeting. Silver
Spring (MD): FDA; 2009.
[6]. Bern C, Montgomery SP, Herwaldt BL, Rassi A Jr, Marin-
Neto JA, Dantas RO, Maguire JH, Acquatella H, Morillo C,
Kirchhoff LV, Gilman RH, Reyes PA, Salvatella R, Moore
AC. Evaluation and treatment of Chagas disease in the
United States: a systematic review. JAMA 2007;298:2171-
81.
TABLE A2. Health services expendituresMean charges Low High
X-ray $182.11 181.63 182.59Echocardiogram $546.81 542.24 551.37Professional services $88.14 85.07 91.23EKG $145.48 144.92 146.03Professional services $37.32Laboratory $89.37 89.09 89.65Professional services $38.86 38.7 39.02Outpatient visit professional services $313.40 310.73 316.08Annual clinical workup and exam $1441.49 $1392.38 $1415.97Drug treatment $2649.78 $2631.12 $2668.50
AGAPOVA ET AL.
2230 TRANSFUSION Volume 50, October 2010

[7]. HCUP. Cost-to-Charge Ratio Files (CCR): agency for
healthcare research and quality. Rockville (MD): HCUP;
2006.
[8]. Custer B, Busch MP, Marfin AA, Petersen LR. The cost-
effectiveness of screening the U.S. blood supply for West
Nile virus. Ann Intern Med 2005;143:486-92.
[9]. Sanders GD, Hlatky MA, Owens DK. Cost-effectiveness of
implantable cardioverter-defibrillators. N Engl J Med
2005;353:1471-80.
[10]. Fryback DG, Dasbach EJ, Klein R, Klein BE, Dorn N,
Peterson K, Martin PA. The Beaver Dam Health Out-
comes Study: initial catalog of health-state quality
factors. Med Decis Making 1993;13:89-102.
[11]. Gerson LB, Triadafilopoulos G, Gage BF. The manage-
ment of anticoagulants in the periendoscopic period for
patients with atrial fibrillation: a decision analysis. Am J
Med 2004;116:451-9.
[12]. Agha Z, Lofgren RP, VanRuiswyk JV. Is antibiotic prophy-
laxis for bacterial endocarditis cost-effective? Med Decis
Making 2005;25:308-20.
[13]. Bern C, Montgomery SP, Katz L, Caglioti S, Stramer SL.
Chagas disease and the US blood supply. Curr Opin
Infect Dis 2008;21:476-82.
[14]. Castillo-Riquelme M, Chalabi Z, Lord J, Guhl F,
Campbell-Lendrum D, Davies C, Fox-Rushby J. Modelling
geographic variation in the cost-effectiveness of control
policies for infectious vector diseases: the example of
Chagas disease. J Health Econ 2008;27:405-26.
[15]. Wilson LS, Ramsey JM, Koplowicz YB, Valiente-Banuet L,
Motter C, Bertozzi SM, Tobler LH. Cost-effectiveness of
implementation methods for ELISA serology testing of
Trypanosoma cruzi in California blood banks. Am J Trop
Med Hyg 2008;79:53-68.
[16]. Silva Sde A, Gontijo ED, Amaral CF. Case-control study of
factors associated with chronic Chagas heart disease in
patients over 50 years of age. Mem Inst Oswaldo Cruz
2007;102:845-51.
ACKNOWLEDGMENTS
We thank Sally Cagliotti and Gene Robertson for providing data
used in this study.
CONFLICT OF INTEREST
The authors report no potential conflicts of interests, financial
interests or relationships.
REFERENCES
1. Raether W, Michel R, Uphoff M. Effects of dimethylsulfox-
ide and the deep-freezing process on the infectivity, motil-
ity, and ultrastructure of Trypanosoma cruzi. Parasitol Res
1988;74:307-13.
2. Kirchhoff LV, Paredes P, Lomeli-Guerrero A, Paredes-
Espinoza M, Ron-Guerrero CS, Delgado-Mejía M, Peña-
Muñoz JG. Transfusion-associated Chagas disease
(American trypanosomiasis) in Mexico: implications for
transfusion medicine in the United States. Transfusion
2006;46:298-304.
3. Ferreira MS, Borges AS. Some aspects of protozoan infec-
tions in immunocompromised patients—a review. Mem
Inst Oswaldo Cruz 2002;97:443-57.
4. Da-Cruz AM, Igreja RP, Dantas W, Junqueira AC, Pacheco
RS, Silva-Gonçalves AJ, Pirmez C. Long-term follow-up of
co-infected HIV and Trypanosoma cruzi Brazilian patients.
Trans R Soc Trop Med Hyg 2004;98:728-33.
5. Bern C, Montgomery SP, Herwaldt BL, Rassi A Jr, Marin-
Neto JA, Dantas RO, Maguire JH, Acquatella H, Morillo C,
Kirchhoff LV, Gilman RH, Reyes PA, Salvatella R, Moore AC.
Evaluation and treatment of Chagas disease in the United
States: a systematic review. JAMA 2007;298:2171-81.
6. Piron M, Verges M, Munoz J, Casamitjana N, Sanz S,
Maymó RM, Hernández JM, Puig L, Portús M, Gascón J,
Sauleda S. Seroprevalence of Trypanosoma cruzi infection
in at-risk blood donors in Catalonia (Spain). Transfusion
2008;48:1862-8.
7. El Ghouzzi MH, Boiret E, Wind F, Brochard C, Fittere S,
Paris L, Mazier D, Sansonetti N, Bierling P. Testing blood
donors for Chagas disease in the Paris area, France: first
results after 18 months of screening. Transfusion 2009;50:
575-83.
8. Tobler LH, Contestable P, Pitina L, Groth H, Shaffer S,
Blackburn GR, Warren H, Lee SR, Busch MP. Evaluation of
a new enzyme-linked immunosorbent assay for detection
of Chagas antibody in US blood donors. Transfusion 2007;
47:90-6.
9. Staropoli A. Future strategies for U.S. Chagas screening:
how new evidence could help shape policy. AABB News
2009; June 13.
10. Stramer L, Townsend L, Foster A, Krysztof E, Noedel P,
Caglioti G, Nguyen L, Proctor C, Leiby A. US blood donor
screening for Trypanosoma cruzi: clinical studies and first
year experience XXX international congress of the ISBT.
Macao, SAR, China. Vox Sang 2008;95:296.
11. Kirchhoff LV. Parasitic diseases of the liver and intestines.
Gastroenterol Clin 1996;25:518-33.
12. FDA. Blood products advisory committee meeting. Silver
Spring (MD): FDA; 2009.
13. Custer B, Busch MP, Marfin AA, Petersen LR. The cost-
effectiveness of screening the U.S. blood supply for West
Nile virus. Ann Intern Med 2005;143:486-92.
14. Bern C, Montgomery SP, Katz L, Caglioti S, Stramer SL.
Chagas disease and the US blood supply. Curr Opin Infect
Dis 2008;21:476-82.
15. Kamper-Jorgensen M, Ahlgren M, Rostgaard K, Melbye M,
Edgren G, Nyrén O, Reilly M, Norda R, Titlestad K, Tynell E,
Hjalgrim H. Survival after blood transfusion. Transfusion
2008;48:2577-84.
COST-EFFECTIVENESS OF T. CRUZI TESTING
Volume 50, October 2010 TRANSFUSION 2231
16. Coura JR. Chagas disease: what is known and what is
needed—a background article. Mem Inst Oswaldo Cruz
2007;102 Suppl 1:113-22.
17. Consumer price index bureau of labor statistics.
Department of Labor; 2007.
18. HCUP. Cost-to-Charge Ratio Files (CCR): agency for
healthcare research and quality. Rockville (MD): HCUP;
2006.
19. Brouwer WB, Koopmanschap MA. The friction-cost
method: replacement for nothing and leisure for free?
Pharmacoeconomics 2005;23:105-11.
20. DeNavas-Walt C, Proctor BD, Smith JC. Income, poverty
and health insurance coverage in the United States: 2007.
Washington, DC: US Census Bureau; 2008.
21. Siegel JE, Torrance GW, Russell LB, Luce BR, Weinstein
MC, Gold MR. Guidelines for pharmacoeconomic studies.
Recommendations from the panel on cost effectiveness
in health and medicine. Panel on Cost Effectiveness
in Health and Medicine. Pharmacoeconomics 1997;
11:159-68.
22. Wilson LS, Ramsey JM, Koplowicz YB, Valiente-Banuet L,
Motter C, Bertozzi SM, Tobler LH. Cost-effectiveness of
implementation methods for ELISA serology testing of Try-
panosoma cruzi in California blood banks. Am J Trop Med
Hyg 2008;79:53-68.
23. Llewelyn C, Amin M, Malfroy M, Williamson L. Distribu-
tion of blood component recipients according to immune
status. Presented at Eurosat on 19 October 2004. Transfu-
sion Clinque et Biologique. Accessed at http://www.ints.fr/
pdf/sat04_09_llewelyn.pdf on 15 March 2005.
24. Custer B, Hoch JS. Cost-effectiveness analysis: what it
really means for transfusion medicine decision making.
Transfus Med Rev 2009;23:1-12.
25. Hillyer CD, Blumberg N, Glynn SA, Ness PM. Transfusion
recipient epidemiology and outcomes research: possibili-
ties for the future. Transfusion 2008;48:1530-7.
26. Castillo-Riquelme M, Chalabi Z, Lord J, Guhl F, Campbell-
Lendrum D, Davies C, Fox-Rushby J. Modelling geographic
variation in the cost-effectiveness of control policies for
infectious vector diseases: the example of Chagas disease.
J Health Econ 2008;27:405-26.
27. Sanders GD, Hlatky MA, Owens DK. Cost-effectiveness of
implantable cardioverter-defibrillators. N Engl J Med 2005;
353:1471-80.
28. Gerson LB, Triadafilopoulos G, Gage BF. The management
of anticoagulants in the periendoscopic period for patients
with atrial fibrillation: a decision analysis. Am J Med 2004;
116:451-9.
29. Fryback DG, Dasbach EJ, Klein R, Klein BE, Dorn N, Peter-
son K, Martin PA. The Beaver Dam Health Outcomes
Study: initial catalog of health-state quality factors. Med
Decis Making 1993;13:89-102.
30. Agha Z, Lofgren RP, VanRuiswyk JV. Is antibiotic prophy-
laxis for bacterial endocarditis cost-effective? Med Decis
Making 2005;25:308-20.
31. Silva Sde A, Gontijo ED, Amaral CF. Case-control study of
factors associated with chronic Chagas heart disease in
patients over 50 years of age. Mem Inst Oswaldo Cruz
2007;102:845-51.
32. Teixeira AR, Nitz N, Guimaro MC, Gomes C, Santos-Buch
CA. Chagas disease. Postgrad Med J 2006;82:788-98.
33. Bestetti RB, Theodoropoulos TA, Cardinalli-Neto A, Cury
PM. Treatment of chronic systolic heart failure secondary
to Chagas heart disease in the current era of heart failure
therapy. Am Heart J 2008;156:422-30.
34. de Menezes M, Rocha A, da Silva AC, da Silva AM. [Basic
causes of death in elderly patients with Chagas’ disease].
Arq Bras Cardiol 1989;52:75-8.
35. Rassi A, Jr, Rassi A, Rassi SG. Predictors of mortality in
chronic Chagas disease: a systematic review of observa-
tional studies. Circulation 2007;115:1101-8.
36. Theodoropoulos TA, Bestetti RB, Otaviano AP, Cordeiro JA,
Rodrigues VC, Silva AC. Predictors of all-cause mortality in
chronic Chagas’ heart disease in the current era of heart
failure therapy. Int J Cardiol 2008;128:22-9.
37. HCUP. Arkansas State Inpatient Database (SID): agency for
healthcare research and quality. Rockville (MD): HCUP;
2007.
38. HCUP. National and regional estimates on hospital use for
all patient from the HCUP nationwide inpatient sample:
principal procedure and principal diagnosis. Rockville
(MD): HCUP; 2006.
39. Gohler A, Conrads-Frank A, Worrell SS, Geisler BP, Halpern
EF, Dietz R, Anker SD, Gazelle GS, Siebert U. Decision-
analytic evaluation of the clinical effectiveness and cost-
effectiveness of management programmes in chronic heart
failure. Eur J Heart Fail 2008;10:1026-32.
40. Surgeons ASoCaR. Laparoscopic colectomy is cost-effective
for managing sigmoid diverticular disease. In: Guide Ds,
editor. DGNews: Peer Review Media. 2002.
AGAPOVA ET AL.
2232 TRANSFUSION Volume 50, October 2010
Related Documents