Karen M. van Leeuwen Judith E. Bosmans Aaltje P.D. Jansen Emiel O. Hoogendijk Maaike E. Munnga Hein P.J. van Hout Giel Nijpels Henriee E. van der Horst Maurits W. van Tulder Submied Cost-effectiveness of a chronic care model for frail older adults in primary care: economic evaluation alongside a stepped wedge cluster randomised trial Chapter 4

Welcome message from author
This document is posted to help you gain knowledge. Please leave a comment to let me know what you think about it! Share it to your friends and learn new things together.
Transcript
Karen M. van Leeuwen
Judith E. Bosmans
Aaltje P.D. Jansen
Emiel O. Hoogendijk
Maaike E. Muntinga
Hein P.J. van Hout
Giel Nijpels
Henriette E. van der Horst
Maurits W. van Tulder
Submitted
Cost-effectiveness of a chronic care model for frail older adults in primary care: economic evaluation alongside a
stepped wedge cluster randomised trial
Chapter 4
72
Chapter 4
Abstract
OBJECTIVES To evaluate the cost-effectiveness of the Geriatric Care Model, an integrated
care model for frail older adults based on the Chronic Care Model, compared to usual care.
DESIGN Economic evaluation alongside a 24-month stepped wedge cluster randomised
controlled trial.
SETTING Primary care (35 practices) in two regions in the Netherlands.
PARTICIPANTS 1147 community-dwelling older adults who were frail according to primary
care physicians and the PRISMA-7 questionnaire.
INTERVENTION The Geriatric Care Model included the following components: a regularly
scheduled in-home comprehensive geriatric assessment by a practice nurse followed by
a tailored care plan, management and training of practice nurses by a geriatric expert
team, and coordination of care through community network meetings and multidiscipli-
nary team consultations of patients with complex care needs.
MEASUREMENTS Outcomes were measured every 6 months and included costs from a
societal perspective, health-related quality of life (SF-12 physical (PCS) and mental com-
ponent (MCS) summary scales), functional limitations (Katz ADL and iADL) and quality ad-
justed life years (QALYs) based on the EQ-5D.
RESULTS Multilevel regression models adjusted for time and baseline confounders showed
no significant differences in costs (€297; 95% CI: -€407 to €945) and outcomes between in-
tervention and usual care phases. Cost-effectiveness acceptability curves showed that for
the SF-12 PCS and MCS, the maximum probability of the intervention being cost-effective
in comparison with usual care was around 0.80 at ceiling ratios of 20,000 €/unit of effect
extra. For all other outcomes (QALY, ADL and iADL) the maximum probability of cost-effec-
tiveness was 0.43.
CONCLUSION As the Geriatric Care Model was not cost-effective compared to usual care
after 24 months of follow-up, widespread implementation in its current form is not recom-
mended.
4
73
Cost-effectiveness of the Geriatric Care Model
Introduction
Frail older adults use a wide range of health and social care services which results in a large eco-
nomic burden on society.1–3 To constrain increases in societal costs associated with care for frail
older adults and to respond to the desire of older adults to ‘age in place’,4 government policies in
many western countries are aimed at supporting older adults to live independently at home as
long as possible.5–7 In addition, to prepare for a further increase in complex and long-term care
needs (and associated costs) of frail older adults, integrated care models have increasingly been
implemented.8–13 These models are developed in response to the reactive and fragmented nature
of care systems and the lack of involvement of older adults in their own care process.5,14,15
Integrated care models are expected to result in better patient outcomes and cost savings for
society by prevention or postponement of acute care use and long-term institutionalization.3,16,17
However, reviews of studies on the costs and effects of integrated care models for older adults
show mixed results.9–13 While it has been hypothesized that targeting integrated care models to
older adults with a high risk of adverse health outcomes (i.e frail older adults18) may be the most
cost-effective strategy,9,19,20 there is a lack of data from cost-effectiveness studies supporting this
hypothesis. Descriptive cost studies suggest that integrated care for this group may result in either
a reduction in costs in comparison with usual care, or in comparable costs.21–25 So far, only three
studies evaluated the short-term cost-effectiveness of integrated care models for community-
dwelling fail older adults, and the results are inconclusive. Makai et al.26 showed that integrated
care was not cost-effective in comparison with usual care after 3 months of follow-up. Two other
studies suggest that integrated care may be cost-effective at high values for willingness to pay after
627 and 12 months28 of follow-up. Long term effects are still unknown.
The aim of this paper was to evaluate the cost-effectiveness of an integrated care model (The
Geriatric Care Model, GCM) based on the Chronic Care Model29,30 for community-dwelling frail
older adults in the Netherlands, in comparison with usual care with a follow up of 24 months.
Methods
The study protocol has been published elsewhere.31 Below a summary is given.
Study design and settingThe economic evaluation was conducted alongside a 24-month stepped wedge cluster rand-
omized controlled trial, the “Frail older Adults: Care in Transition” (ACT) study.31 A stepped wedge
74
Chapter 4
design is a one-way crossover trial involving sequential roll-out of an intervention to allocation
groups over a number of time periods.32,33 Thirty-five primary care practices in two regions in the
Netherlands were randomized into four allocation groups, which designated the starting moment
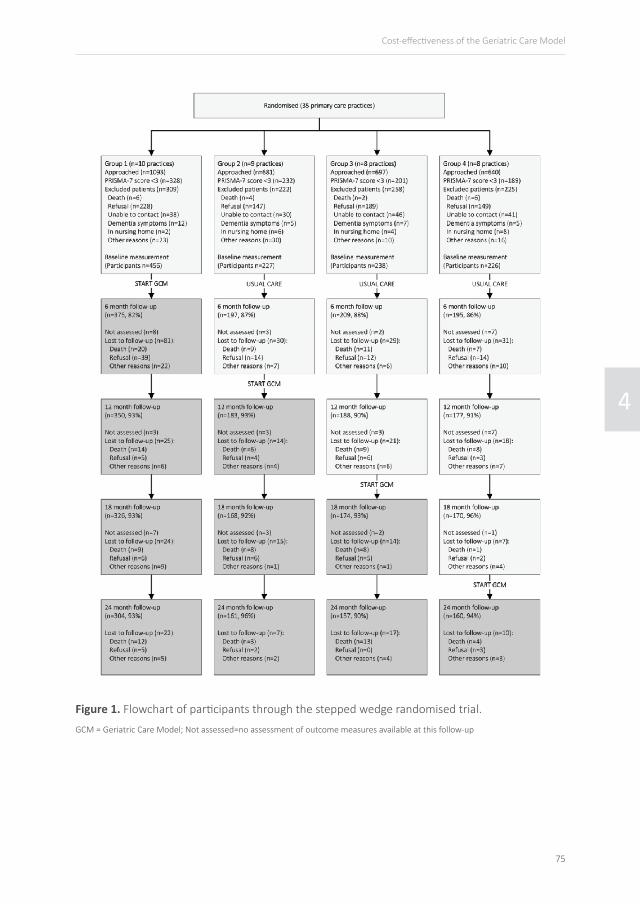
of the intervention phase (see Figure 1).
The ACT study received approval from the medical ethics committee of the VU University
medical centre (ref. no 10/003), and all participants gave written informed consent before inclu-
sion.
Study participantsIn brief, persons of 65 and older who were identified as frail by their primary care physician based
on a multidimensional definition of frailty were tested for further eligibility using the ‘Program on
Research for Integrating Services for the Maintenance of Autonomy case-finding tool’ (PRISMA-
7).34 Older adults with PRISMA-7 scores of 3 or more were considered eligible for study enrol-
ment.34,35 Exclusion criteria were: residence outside area of practice registration; residence in a
nursing home or in a home for the elderly; cognitive impairment or impaired mental status; critical
or terminal illness.
Informal caregivers were asked by telephone to participate if older adults confirmed having an
informal caregiver and did not oppose to their involvement in the study.
Geriatric care model The GCM was designed to target health risks and care needs at a timely stage, to stimulate active
involvement of patients in the care process and to improve the coordination between health care
professionals. The GCM combined the following components: regularly scheduled in-home com-
prehensive geriatric assessments by practice nurses followed by a tailored care plan, management
and training of practice nurses by a regional geriatric expert team consisting of an experienced
geriatric nurse and elderly care physician, and coordination of care during community network
meetings and multidisciplinary team consultations of complex patients. At all times, the older
adult’s own care wishes remained at the centre of the decision making process.
Usual careUntil the start of the intervention, primary care practices provided usual care, which was not
restricted in any way. Since primary care physicians in the Netherlands act as gatekeepers of the
health care system, they play an important role in the organisation of community elderly care.36
Older adults consult the primary care physician on their own initiative.
4
75
Cost-effectiveness of the Geriatric Care Model
Figure 1. Flowchart of participants through the stepped wedge randomised trial.
GCM = Geriatric Care Model; Not assessed=no assessment of outcome measures available at this follow-up
76
Chapter 4
Outcome measuresEffect measurements were administered at baseline, and at 6, 12, 18, and 24 months. Data were
collected at the participant’s own home by means of computer assisted personal interviewing.
The primary outcome was health-related quality of life as measured by the SF-12 Health Survey
physical component summary (PCS) and mental component summary (MCS) scales.37 Secondary
outcomes were functional limitations and Quality Adjusted Life Years (QALYs). Functional limita-
tions were assessed using a 6-item modified Katz basic Activities of Daily Living (ADL) scale and a
7-item Instrumental Activities of Daily Living (iADL) scale.38 QALYs were based on the EQ-5D-3L,39
using the tariff of the Dutch population.40 We calculated QALYs by multiplying the utilities with
amount of time participants spent in a particular health state. Transitions between health states
were linearly interpolated.
Measurement and valuation of resource useCosts were measured from a societal perspective. To measure medical consumption prospectively,
6-montly cost diaries were used. Consultations with primary care physicians and medical special-
ists, as well as home care, meals services, home adaptations and nursing home admissions were
included in the cost diaries. Participants received the diaries through project interviewers who
gave instructions for completion during in-home interviews for the effect measurements. Hospital
admissions were obtained from hospital registries and medication data from pharmacies. Lost
productivity costs were not considered relevant in this population of frail older adults. To collect
data about informal care time, we sent postal questionnaires to participating informal caregivers.
Information about informal care time from caregivers not included in the study was obtained from
the participants during interviews.
Dutch standard costs were used to value resource use.41,42 Medication costs were valued using
prices of the Royal Dutch Society for Pharmacy.43 All costs were indexed to the level of 2011, and
were discounted by 4% in the second year of follow-up.
We calculated a cost price for the care model using a bottom-up approach. Average GCM
costs were calculated to be € 215 (se 1.65) per 6 months per person, including software licenses
and materials (€ 15), training sessions (€ 13), and time investments from practice nurses (€ 96),
the geriatric expert team (€ 89) and other professionals consulted in multidisciplinary team con-
sultations for complex patients (€ 1). Practice nurses used time sheets to record the time invest-
ment per participant. They spent on average a little more than 2.5 hours on each participant per
half year, with a mean caseload of 220 patients/fte practice nurse (none of the practice nurses
worked fulltime).
4
77
Cost-effectiveness of the Geriatric Care Model
Missing dataMissing data on costs and outcomes were imputed using multiple imputation with chained equa-
tions and fully conditional specification in Stata 12.44,45 The percentage missing data varied from
21% for data in cost diaries and 25% for outcome measures (due to loss to follow-up) to 51% for
medication data. An imputation model was created that contained variables related to missing data
or the outcome measure, and variables that differed at baseline between the groups. Predictive
mean matching was used to account for the skewed distribution of costs. Twenty imputed data
sets were created, resulting in a loss of efficiency of less than 3.5% for all outcomes.45 The 20
imputed datasets were analysed separately and the results of the analyses were pooled using
Rubin’s rules.46
Statistical analysesThe main analysis was performed according to the intention-to-treat principle. Each participant
was observed during four phases of 6 months (Figure 1), which were, according to the stepped
wedge design, either intervention or usual care phases. Costs and QALYs were calculated for each
phase of 6 months, and set to 0 for periods after death. For other outcome measures, the meas-
urements at the end of each 6 months were used and observations after death were excluded
from analysis. The cost-effectiveness analysis was performed by relating the difference in total
mean costs per 6 months between all intervention phases and all usual care phases to the dif-
ference in health-related quality of life (SF-12 PCS and MCS), functional limitations (both ADL
and iADL limitations) and QALYs. Multilevel modelling was used to adjust for the dependency of
observations within participants.
Since in stepped wedge designs, the intervention variable is highly time dependent due to
a later onset of intervention phases and variations in intervention duration, the intervention
effect was adjusted using a time variable which indicated the measurement period (1, 2, 3 or
4). Variables that resulted in a change in costs and/or effect difference of more than 10% were
included as confounders, which were partner status, educational level, region, baseline values of
outcome measures and degree of frailty. We constructed a frailty index using 46 deficits in health
at baseline to establish degree of frailty.47,48 Furthermore, as QALY calculations depended on the
number of days in each observed phase, the phase length in days was also included in this analysis.
Uncertainty around the incremental cost-effectiveness ratios (ICERs) was estimated using the
bias-corrected percentile bootstrapping method (5000 replications) and plotted in cost-effective-
ness (CE) planes. In addition, cost-effectiveness acceptability curves (CEACs) were estimated to
show the probability that phases in which care was provided according to the GCM were cost-
effective in comparison with phases in which usual care is provided using different ceiling ratios.
78
Chapter 4
These ceiling ratios represent the maximum amount that society is willing to pay for one point
improvement on the respective outcome scales. The CEAC shows for a range of ceiling ratio’s the
proportion of bootstrapped incremental cost and effect pairs that are cost-effective, i.e the prob-
ability that the GCM is cost-effective compared to usual care given our data and for a particular
ceiling ratio.49
Sensitivity analysesTwo sensitivity analyses were performed. In a per-protocol analysis, all phases after drop-out of
a participant from the study were excluded, and phases in which no first geriatric assessment
had taken place yet were indicated as usual care phases. The second sensitivity analysis was per-
formed using a healthcare system perspective. This analysis only included direct healthcare costs,
thus excluding costs related to informal care time.
Results
ParticipantsFigure 1 provides an overview of the randomisation, recruitment, and follow-up. Of the 3111
potentially frail older adults, 713 (22.9%) refused to participate and 1147 (36.9%) met the eligibil-
ity criteria and gave informed content. Six hundred participants indicated to receive help from
an informal caregiver, of which 118 (19.7%) participated in the study. This percentage differed
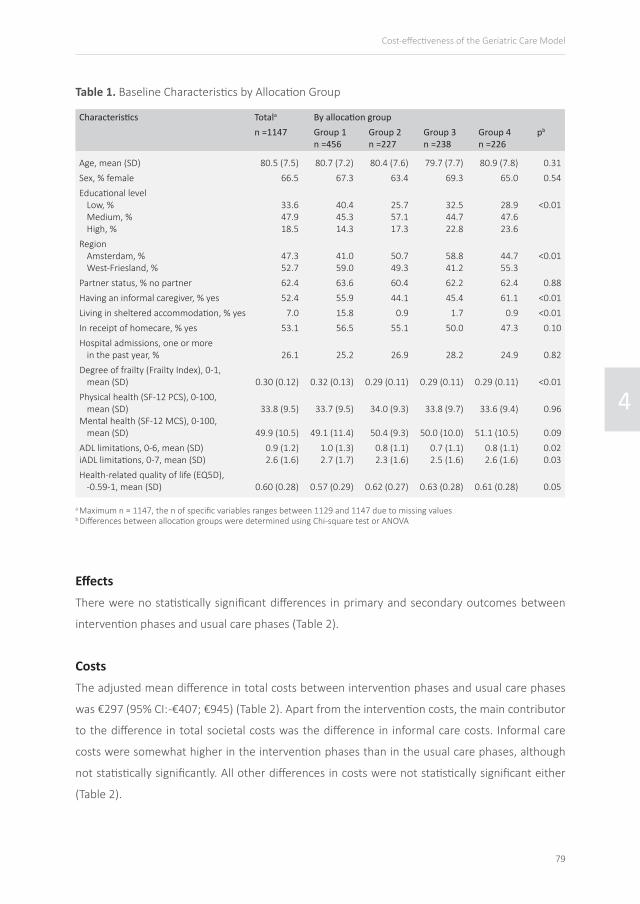
significantly (p=0.02) between allocation groups. Table 1 shows the baseline characteristics of the
participants and differences between allocation groups.
As shown in Figure 1, 782 of the 1147 participants (68.2%) completed the full 24-month study
period. Death was the main cause for drop-out (12.4%). The participants that completed the study
period were statistically significantly younger, less frail according to the frailty index, and had more
beneficial baseline values of ADL and iADL, SF-12 PCS and MCS and EQ-5D compared to those lost
to follow-up. Furthermore, participants from West-Friesland, participants with a high or low edu-
cation level and participants without informal caregiver were more likely to complete the study
period.
Of the 1147 participating older adults, 877 (76.5%) were visited at home at least once by a
practice nurse. The main reason for not ‘having a home visit’ was drop-out from the study (n=119;
44.1%). Also, 31 patients of one primary care practice in allocation group 4 did not receive care
according to the GCM as the primary care physician decided not to start working in accordance
with the GCM.
4
79
Cost-effectiveness of the Geriatric Care Model
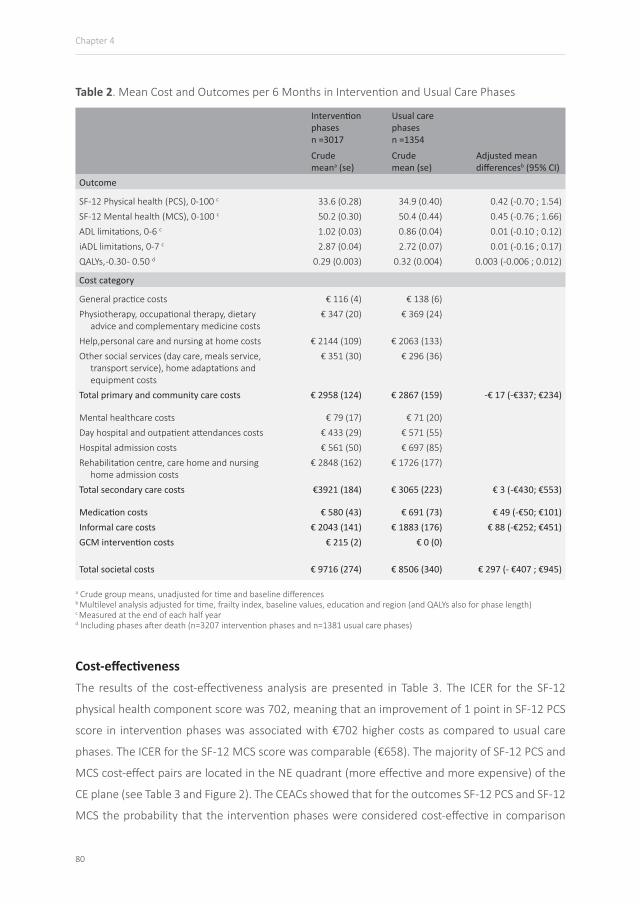
EffectsThere were no statistically significant differences in primary and secondary outcomes between
intervention phases and usual care phases (Table 2).
Characteristics Totala By allocation groupn =1147 Group 1
n =456Group 2n =227
Group 3n =238
Group 4n =226
pb
Age, mean (SD) 80.5 (7.5) 80.7 (7.2) 80.4 (7.6) 79.7 (7.7) 80.9 (7.8) 0.31Sex, % female 66.5 67.3 63.4 69.3 65.0 0.54Educational level
Low, %Medium, %High, %
33.647.918.5
40.445.314.3
25.757.117.3
32.544.722.8
28.947.623.6
<0.01
RegionAmsterdam, %West-Friesland, %
47.352.7
41.059.0
50.749.3
58.841.2
44.755.3
<0.01
Partner status, % no partner 62.4 63.6 60.4 62.2 62.4 0.88Having an informal caregiver, % yes 52.4 55.9 44.1 45.4 61.1 <0.01Living in sheltered accommodation, % yes 7.0 15.8 0.9 1.7 0.9 <0.01In receipt of homecare, % yes 53.1 56.5 55.1 50.0 47.3 0.10Hospital admissions, one or more
in the past year, % 26.1 25.2 26.9 28.2 24.9 0.82Degree of frailty (Frailty Index), 0-1,
mean (SD) 0.30 (0.12) 0.32 (0.13) 0.29 (0.11) 0.29 (0.11) 0.29 (0.11) <0.01Physical health (SF-12 PCS), 0-100,
mean (SD)Mental health (SF-12 MCS), 0-100,
mean (SD)
33.8 (9.5)
49.9 (10.5)
33.7 (9.5)
49.1 (11.4)
34.0 (9.3)
50.4 (9.3)
33.8 (9.7)
50.0 (10.0)
33.6 (9.4)
51.1 (10.5)
0.96
0.09ADL limitations, 0-6, mean (SD)iADL limitations, 0-7, mean (SD)
0.9 (1.2)2.6 (1.6)
1.0 (1.3)2.7 (1.7)
0.8 (1.1)2.3 (1.6)
0.7 (1.1)2.5 (1.6)
0.8 (1.1)2.6 (1.6)
0.020.03
Health-related quality of life (EQ5D), -0.59-1, mean (SD) 0.60 (0.28) 0.57 (0.29) 0.62 (0.27) 0.63 (0.28) 0.61 (0.28) 0.05
Table 1. Baseline Characteristics by Allocation Group
a Maximum n = 1147, the n of specific variables ranges between 1129 and 1147 due to missing valuesb Differences between allocation groups were determined using Chi-square test or ANOVA
CostsThe adjusted mean difference in total costs between intervention phases and usual care phases
was €297 (95% CI: -€407; €945) (Table 2). Apart from the intervention costs, the main contributor
to the difference in total societal costs was the difference in informal care costs. Informal care
costs were somewhat higher in the intervention phases than in the usual care phases, although
not statistically significantly. All other differences in costs were not statistically significant either
(Table 2).
80
Chapter 4
Intervention phasesn =3017
Usual care phasesn =1354
Crudemeana (se)
Crude mean (se)
Adjusted mean differencesb (95% CI)
Outcome
SF-12 Physical health (PCS), 0-100 c 33.6 (0.28) 34.9 (0.40) 0.42 (-0.70 ; 1.54)SF-12 Mental health (MCS), 0-100 c 50.2 (0.30) 50.4 (0.44) 0.45 (-0.76 ; 1.66)ADL limitations, 0-6 c 1.02 (0.03) 0.86 (0.04) 0.01 (-0.10 ; 0.12)iADL limitations, 0-7 c 2.87 (0.04) 2.72 (0.07) 0.01 (-0.16 ; 0.17)QALYs, -0.30 - 0.50 d 0.29 (0.003) 0.32 (0.004) 0.003 (-0.006 ; 0.012)
Cost category
General practice costs € 116 (4) € 138 (6)Physiotherapy, occupational therapy, dietary
advice and complementary medicine costs€ 347 (20) € 369 (24)
Help,personal care and nursing at home costs € 2144 (109) € 2063 (133)Other social services (day care, meals service,
transport service), home adaptations and equipment costs
€ 351 (30) € 296 (36)
Total primary and community care costs € 2958 (124) € 2867 (159) -€ 17 (-€337; €234)
Mental healthcare costs € 79 (17) € 71 (20)Day hospital and outpatient attendances costs € 433 (29) € 571 (55)Hospital admission costs € 561 (50) € 697 (85)Rehabilitation centre, care home and nursing
home admission costs€ 2848 (162) € 1726 (177)
Total secondary care costs €3921 (184) € 3065 (223) € 3 (-€430; €553)
Medication costs € 580 (43) € 691 (73) € 49 (-€50; €101)Informal care costs € 2043 (141) € 1883 (176) € 88 (-€252; €451)GCM intervention costs € 215 (2) € 0 (0)
Total societal costs € 9716 (274) € 8506 (340) € 297 (- €407 ; €945)
Table 2. Mean Cost and Outcomes per 6 Months in Intervention and Usual Care Phases
a Crude group means, unadjusted for time and baseline differencesb Multilevel analysis adjusted for time, frailty index, baseline values, education and region (and QALYs also for phase length)c Measured at the end of each half year d Including phases after death (n=3207 intervention phases and n=1381 usual care phases)
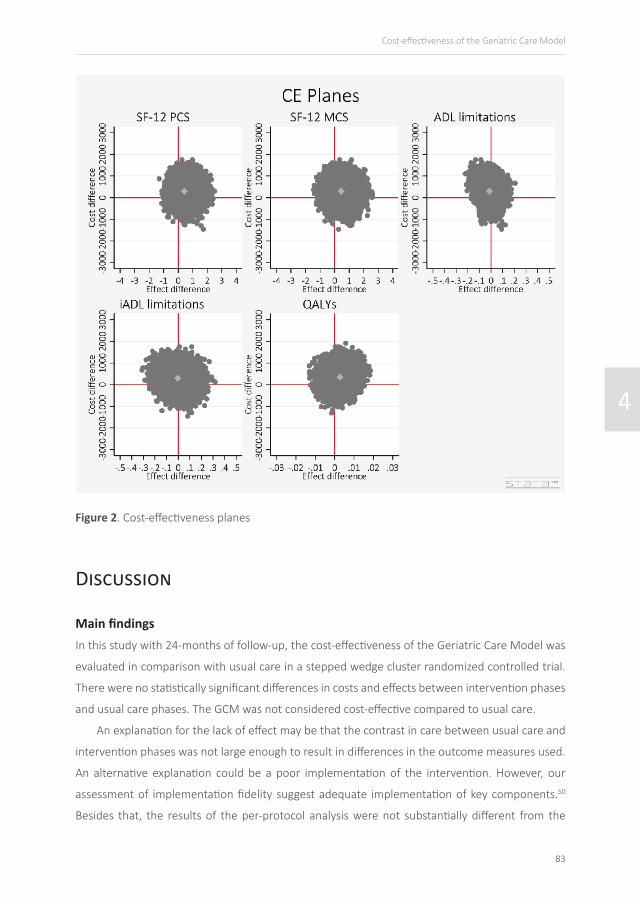
Cost-effectiveness The results of the cost-effectiveness analysis are presented in Table 3. The ICER for the SF-12
physical health component score was 702, meaning that an improvement of 1 point in SF-12 PCS
score in intervention phases was associated with €702 higher costs as compared to usual care
phases. The ICER for the SF-12 MCS score was comparable (€658). The majority of SF-12 PCS and
MCS cost-effect pairs are located in the NE quadrant (more effective and more expensive) of the
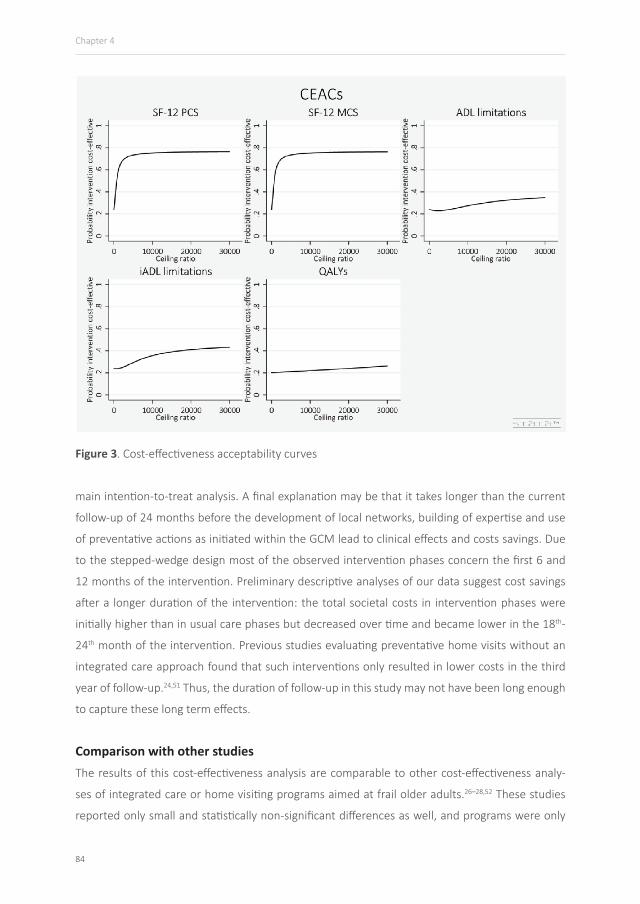
CE plane (see Table 3 and Figure 2). The CEACs showed that for the outcomes SF-12 PCS and SF-12
MCS the probability that the intervention phases were considered cost-effective in comparison
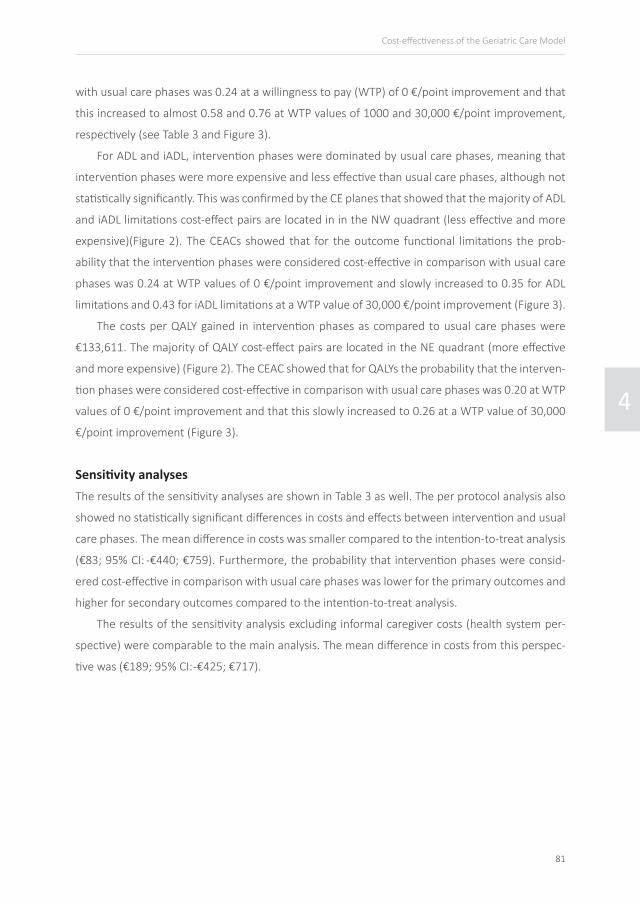
4
81
Cost-effectiveness of the Geriatric Care Model
with usual care phases was 0.24 at a willingness to pay (WTP) of 0 €/point improvement and that
this increased to almost 0.58 and 0.76 at WTP values of 1000 and 30,000 €/point improvement,
respectively (see Table 3 and Figure 3).
For ADL and iADL, intervention phases were dominated by usual care phases, meaning that
intervention phases were more expensive and less effective than usual care phases, although not
statistically significantly. This was confirmed by the CE planes that showed that the majority of ADL
and iADL limitations cost-effect pairs are located in in the NW quadrant (less effective and more
expensive)(Figure 2). The CEACs showed that for the outcome functional limitations the prob-
ability that the intervention phases were considered cost-effective in comparison with usual care
phases was 0.24 at WTP values of 0 €/point improvement and slowly increased to 0.35 for ADL
limitations and 0.43 for iADL limitations at a WTP value of 30,000 €/point improvement (Figure 3).
The costs per QALY gained in intervention phases as compared to usual care phases were
€133,611. The majority of QALY cost-effect pairs are located in the NE quadrant (more effective
and more expensive) (Figure 2). The CEAC showed that for QALYs the probability that the interven-
tion phases were considered cost-effective in comparison with usual care phases was 0.20 at WTP
values of 0 €/point improvement and that this slowly increased to 0.26 at a WTP value of 30,000
€/point improvement (Figure 3).
Sensitivity analyses The results of the sensitivity analyses are shown in Table 3 as well. The per protocol analysis also
showed no statistically significant differences in costs and effects between intervention and usual
care phases. The mean difference in costs was smaller compared to the intention-to-treat analysis
(€83; 95% CI: -€440; €759). Furthermore, the probability that intervention phases were consid-
ered cost-effective in comparison with usual care phases was lower for the primary outcomes and
higher for secondary outcomes compared to the intention-to-treat analysis.
The results of the sensitivity analysis excluding informal caregiver costs (health system per-
spective) were comparable to the main analysis. The mean difference in costs from this perspec-
tive was (€189; 95% CI: -€425; €717).
82
Chapter 4
N o
bser
vatio
ns
Cost
-effe
ctive
ness
pla
nec
Prob
abili
ty th
at G
CM is
co
st-e
ffecti
ve a
t WTP
for
100%
impr
ovem
ent
Anal
ysis
Inte
rven
tion
phas
esU
sual
car
e ph
ases
Cost
saEff
ects
bIC
ERN
ESE
SWN
WW
TP€
0W
TP€
1000
WTP
€ 30
000
Mai
n an
alys
is
SF-1
2 PC
S, 0
-100
3017
1354
€ 29
7 (-
€407
; €9
45)
0.42
(-0.
70 ;
1.54
)70
264
%18
%4%
14%
0.24
0.57
0.76
SF-1
2 M
CS, 0
-100
3017
1354
€ 29
7 (-
€407
; €9
45)
0.45
(-0.
76 ;
1.66
)65
866
%19
%4%
11%
0.24
0.58
0.76
ADL
limita
tions
, 0-6
3017
1354
€ 29
7 (-
€407
; €9
45)
0.01
(-0.
10 ;
0.12
)23
264
27%
10%
12%
51%
0.24
0.23
0.35
iADL
lim
itatio
ns, 0
-730
1713
54€
297
(- €4
07 ;
€945
)0.
01 (-
0.16
; 0.
17)
5857
336
%12
%10
%42
%0.
240.
240.
43
QAL
Ys, -0
.30 -
0.5
032
0713
81€
356
(- €
365;
€10
67)
0.00
3 (-0
.006
; 0.
012)
1336
1158
%12
%7%
23%
0.20
0.20
0.26
Per p
roto
col a
naly
sis
SF-1
2 PC
S, 0
-100
2152
1342
€ 83
(-€
440;
€ 7
59)
-0.2
6 (-0
.92
; 0.3
9)-3
1612
%13
%35
%40
%0.
400.
240.
21SF
-12
MCS
, 0-1
0021
5213
42€
83 (-
€ 44
0; €
759
)-0
.38
(-1.1
1 ; 0
.36)
-74
7%7%
41%
45%
0.40
0.18
0.16
ADL
limita
tions
, 0-6
2152
1342
€ 83
(-€
440;
€ 7
59)
0.00
(-0.
07 ;
0.06
)-3
0439
25%
28%
19%
27%
0.40
0.40
0.50
iADL
lim
itatio
ns, 0
-721
5213
42€
83 (-
€ 44
0; €
759
)-0
.05
(-0.1
6 ; 0
.06)
-154
841
%39
%8%
12%
0.40
0.46
0.81
QAL
Ys, -0
.30 -
0.5
021
5213
42€
83 (-
€ 44
0; €
759
)-0
.003
(-0.
009
; 0.0
04)
-329
0410
%10
%38
%42
%0.
400.
400.
32
Heal
thca
re sy
stem
per
spec
tive
SF-1
2 PC
S, 0
-100
3017
1354
€ 18
9 (-
€425
; €7
17)
0.42
(-0.
70 ;
1.54
)44
762
%20
%4%
14%
0.28
0.63
0.77
SF-1
2 M
CS, 0
-100
3017
1354
€ 18
9 (-
€425
; €7
17)
0.45
(-0.
76 ;
1.66
)41
965
%20
%4%
11%
0.28
0.65
0.77
ADL
limita
tions
, 0-6
3017
1354
€ 18
9 (-
€425
; €7
17)
0.01
(-0.
10 ;
0.12
)14
821
26%
11%
13%
49%
0.28
0.27
0.37
iADL
lim
itatio
ns, 0
-730
1713
54€
189
(- €4
25 ;
€717
)0.
01 (-
0.16
; 0.
17)
3731
636
%12
%12
%40
%0.
280.
280.
45Q
ALYs
, -0.3
0 - 0
.50
3207
1381
€ 22
0 (-
€ -40
5; €
798)
0.00
3 (-0
.006
; 0.
012)
8250
656
%15
%8%
21%
0.26
0.26
0.34
Tabl
e 3.
Diff
eren
ces
in O
utco
mes
and
Cos
ts p
er 6
Mon
ths
betw
een
Inte
rven
tion
and
Usu
al C
are
Phas
es, I
CER,
% C
E Pl
ane
Qua
dran
ts
a Mul
tilev
el a
naly
sis a
djus
ted
for ti
me,
frai
lty in
dex,
edu
catio
n an
d re
gion
b M
ultil
evel
ana
lysis
adj
uste
d fo
r tim
e, fr
ailty
inde
x, b
asel
ine
valu
es, e
duca
tion
and
regi
on (a
nd Q
ALYs
also
for p
hase
leng
th)
c NE:
Mor
e ex
pens
ive,
mor
e eff
ectiv
e; S
E: L
ess
expe
nsiv
e, m
ore
effec
tive;
SW
: Les
s ex
pens
ive,
less
effe
ctive
; NW
: Mor
e ex
pens
ive,
less
effe
ctive
4
83
Cost-effectiveness of the Geriatric Care Model
Figure 2. Cost-effectiveness planes
Discussion
Main findingsIn this study with 24-months of follow-up, the cost-effectiveness of the Geriatric Care Model was
evaluated in comparison with usual care in a stepped wedge cluster randomized controlled trial.
There were no statistically significant differences in costs and effects between intervention phases
and usual care phases. The GCM was not considered cost-effective compared to usual care.
An explanation for the lack of effect may be that the contrast in care between usual care and
intervention phases was not large enough to result in differences in the outcome measures used.
An alternative explanation could be a poor implementation of the intervention. However, our
assessment of implementation fidelity suggest adequate implementation of key components.50
Besides that, the results of the per-protocol analysis were not substantially different from the
84
Chapter 4
Figure 3. Cost-effectiveness acceptability curves
main intention-to-treat analysis. A final explanation may be that it takes longer than the current
follow-up of 24 months before the development of local networks, building of expertise and use
of preventative actions as initiated within the GCM lead to clinical effects and costs savings. Due
to the stepped-wedge design most of the observed intervention phases concern the first 6 and
12 months of the intervention. Preliminary descriptive analyses of our data suggest cost savings
after a longer duration of the intervention: the total societal costs in intervention phases were
initially higher than in usual care phases but decreased over time and became lower in the 18th-
24th month of the intervention. Previous studies evaluating preventative home visits without an
integrated care approach found that such interventions only resulted in lower costs in the third
year of follow-up.24,51 Thus, the duration of follow-up in this study may not have been long enough
to capture these long term effects.
Comparison with other studiesThe results of this cost-effectiveness analysis are comparable to other cost-effectiveness analy-
ses of integrated care or home visiting programs aimed at frail older adults.26–28,52 These studies
reported only small and statistically non-significant differences as well, and programs were only
4
85
Cost-effectiveness of the Geriatric Care Model
considered cost-effective in comparison with control at large WTP values. The difference in QALYs
between intervention phases and usual care phases found in our study was comparable to the
estimates reported by Makai et al.26 and Drubbel et al.28 However, Drubbel et al. reported costs
savings of 815 euros for the intervention in comparison with usual care in 12 months. The differ-
ence between our study and Drubbel et al. may be explained by the fact that Drubbel et al. did
not include medication costs, and that intervention costs were almost 70% lower than in our study
(due to higher time investments from practice nurses in our study and the employment of the
geriatric expert team).
Strengths and limitationsThis study has several strengths. It was one of the first rigorous economic evaluations of an in-
tegrated care program following a Chronic Care Model approach for community-dwelling frail
older adults. Other studies did not include a societal perspective27 and/or had shorter follow-up
periods.26–28 Secondly, the use of a stepped wedge design has practical and ethical advantages, as
it makes a large implementation study better manageable and eventually offers all participants in
the study the intervention program.32,33 By using multilevel techniques with time adjustments to
estimate cost and effect differences between intervention and usual care phases, we accounted
for this design in the analyses. Thirdly, although cost diaries were not always completed prospec-
tively by the participants, the in-home interviews for effect measurements gave us the opportu-
nity to complete these diaries retrospectively with the participants. Finally, we expect that the
results are generalisable to the population of frail older adults in the Netherlands due to the small
number of exclusion criteria, the participation of primary care practices in an urban and urbanized
rural region in the Netherlands, and the relatively small proportion of older adults that refused to
participate.
Some limitations should be considered when interpreting the results. Despite extensive at-
tempts to limit the rate of missing data, loss-to-follow up and limited coverage of pharmacy reg-
istries resulted in missing data for a quarter (cost diaries and outcome data) or half (medication
data) of all phases. To deal with this, we used multiple imputation, which is currently the most
appropriate technique to deal with missing data and allows for accounting for the uncertainty
about the imputed values.44,45 Secondly, willingness to participate among informal caregivers was
low and differed between allocation groups. Therefore, it was not possible to analyse cost and
effects of informal caregivers, as announced in the study protocol.31 Nonetheless, informal care
time administered from informal caregivers was supplemented with information from older adults
about informal care time, and included in the analysis.
86
Chapter 4
Conclusions and implications for further researchBased on our results we consider the GCM not cost-effective as compared with usual care in
community-dwelling frail older adults after 24 months of follow-up. Although the concept of inte-
grated care programs is widely adopted as a cost controlling approach for elderly care and descrip-
tive cost studies suggest cost savings,21–25 evidence from adequately executed economic evalua-
tions remains limited so far. Before more economic evaluations are performed, further research
should identify effective combinations of components of integrated care and the stadium of frailty
in which people benefit most from integrated care. To conclude, at this moment widespread im-
plementation of the GCM in its current form is not recommended.
4
87
Cost-effectiveness of the Geriatric Care Model
References1. Heinrich S, Luppa M, Matschinger H, et al. Service
utilization and health-care costs in the advanced elderly. Value Health 2008; 11: 611–20.
2. Ageing Working Group. The 2012 Ageing Report. Economic and budgetary projections for the 27 EU Member States (2010-2060). Brussels, 2012.
3. Rechel B, Doyle Y. How can health systems respond to population ageing. Copenhagen: World Health Organization 2009 and World Health Organization, on behalf of the European Observatory on Health Systems and Policies, 2009.
4. Wiles JL, Leibing A, Guberman N, Reeve J, Allen RES. The meaning of ‘aging in place’ to older people. Gerontologist 2012; 52: 357–66.
5. Secretary of State for Health. Caring for our future : reforming care and support. 2012. https://www.gov.uk/government/uploads/system/uploads/attachment_data/file/136422/White-Paper-Caring-for-our-future-reforming-care-and-support-PDF-1580K.pdf (accessed Nov 5, 2014).
6. Pavolini E, Ranci C. Restructuring the welfare state: reforms in long-term care in Western European countries. J Eur Soc Policy 2008; 18: 246–59.
7. Rechel B, Grundy E, Robine J-M, et al. Ageing in the European Union. Lancet 2013; 381: 1312–22.
8. De Bruin SR, Versnel N, Lemmens LC, et al. Comprehensive care programs for patients with multiple chronic conditions: a systematic literature review. Health Policy 2012; 107: 108–45.
9. Oeseburg B, Wynia K, Middel B, Reijneveld SA. Effects of case management for frail older people or those with chronic illness: a systematic review. Nurs Res 2009; 58: 201–10.
10. Eklund K, Wilhelmson K. Outcomes of coordinated and integrated interventions targeting frail elderly people: a systematic review of randomised controlled trials. Heal SocCare Community 2009; 17: 447–58.
11. Beswick AD, Rees K, Dieppe P, et al. Complex interventions to improve physical function and maintain independent living in elderly people: a systematic review and meta-analysis. Lancet 2008; 371: 725–35.
12. Low LF, Yap M, Brodaty H. A systematic review of different models of home and community care services for older persons. BMCHealth ServRes 2011; 11: 93.
13. Boult C, Green AF, Boult LB, Pacala JT, Snyder C, Leff B. Successful models of comprehensive care for older adults with chronic conditions: evidence for the Institute of Medicine’s ‘retooling for an aging America’ report. J Am Geriatr Soc 2009; 57: 2328–37.
14. Boeckxstaens P, De Graaf P. Primary care and care for older persons: position paper of the European Forum for Primary Care. Qual Prim Care 2011; 19: 369–89.
15. OECD. Health Reform. Meeting the challenge of ageing and multiple morbidities. OECD Publishing, 2011.
16. Kodner DL. The quest for integrated systems of care for frail older persons. Aging Clin Exp Res 2002; 14: 307–13.
17. Hébert R, Raîche M, Dubois MF, Gueye NR, Dubuc N, Tousignant M. Impact of PRISMA, a coordination-type integrated service delivery system for frail older people in Quebec (Canada): A quasi-experimental study. Journals Gerontol - Ser B Psychol Sci Soc Sci 2010; 65 B: 107–18.
18. Fried LP, Ferrucci L, Darer J, Williamson JD, Anderson G. Untangling the concepts of disability, frailty, and comorbidity: implications for improved targeting and care. J Gerontol A Biol Sci Med Sci 2004; 59: 255–63.
19. Bodenheimer T, Wagner EH, Grumbach K. Improving primary care for patients with chronic illness: the chronic care model, Part 2. JAMA 2002; 288: 1909–14.
20. Bodenheimer T, Fernandez A. High and rising health care costs. Part 4: can costs be controlled while preserving quality? Ann Intern Med 2005; 143: 26–31.
21. Barrett DL, Secic M, Borowske D. The Gatekeeper Program: proactive identification and case management of at-risk older adults prevents nursing home placement, saving healthcare dollars program evaluation. Home Healthc Nurse 2010; 28: 191–7.
22. Beland F, Bergman H, Lebel P, et al. A system of integrated care for older persons with disabilities in Canada: results from a randomized controlled trial. J Gerontol 2006; 61A: 367–73.
23. Bernabei R, Landi F, Gambassi G, et al. Randomised trial of impact of model of integrated care and case management for older people living in the community. BMJ 1998; 316: 1348–51.
24. Counsell SR, Callahan CM, Tu W, Stump TE, Arling GW. Cost analysis of the Geriatric Resources for Assessment and Care of Elders care management intervention. J Am Geriatr Soc 2009; 57: 1420–6.
88
25. Landi F, Onder G, Russo A, et al. A new model of integrated home care for the elderly: impact on hospital use. JClinEpidemiol 2001; 54: 968–70.
26. Makai P, Looman W, Adang E, Melis R, Stolk E, Fabbricotti I. Cost-effectiveness of integrated care in frail elderly using the ICECAP-O and EQ-5D: does choice of instrument matter? Eur J Heal Econ 2014. DOI:10.1007/s10198-014-0583-7.
27. Melis RJF, Adang E, Teerenstra S, et al. Cost-effectiveness of a multidisciplinary intervention model for community-dwelling frail older people. J Gerontol A Biol Sci Med Sci 2008; 63: 275–82.
28. Drubbel I, Neslo REJ, Bleijenberg N, et al. Economic evaluation of a proactive patient-centered primary care program for frail older patients: cost-effectiveness analysis alongside the U-PROFIT randomised controlled trial [Chapter 7, Thesis]. 2013; : 155–80.
29. Bodenheimer T, Wagner EH, Grumbach K. Improving primary care for patients with chronic illness. JAMA 2002; 288: 1775–9.
30. Wagner EH, Austin BT, Davis C, Hindmarsh M, Schaefer J, Bonomi A. Improving chronic illness care: Translating evidence into action. Health Aff 2001; 20: 64–78.
31. Muntinga ME, Hoogendijk EO, van Leeuwen KM, et al. Implementing the chronic care model for frail older adults in the Netherlands: study protocol of ACT (frail older adults: care in transition). BMC Geriatr 2012; 12: 19.
32. Brown CA, Lilford RJ. The stepped wedge trial design: a systematic review. BMC Med Res Methodol 2006; 6: 54.
33. Mdege ND, Man M-S, Taylor Nee Brown CA, Torgerson DJ. Systematic review of stepped wedge cluster randomized trials shows that design is particularly used to evaluate interventions during routine implementation. J Clin Epidemiol 2011; 64: 936–48.
34. Raiche M, Hebert R, Dubois MF. PRISMA-7: a case-finding tool to identify older adults with moderate to severe disabilities. ArchGerontolGeriatr 2008; 47: 9–18.
35. Hoogendijk EO, van der Horst HE, Deeg DJ, et al. The identification of frail older adults in primary care: comparing the accuracy of five simple instruments. Age Ageing 2013; 42: 262–5.
36. Schäfer W, Kroneman M, Boerma W, et al. The Netherlands: health system review. Health Syst Transit 2010; 12: v – xxvii, 1–228.
37. Ware JE, Kosinski M, Keller SD. SF-12: How to score the SF-12 physical and mental health summary scales. Boston, MA: Health Institute, New England Medical Center, 1995.
38. Weinberger M, Samsa GP, Schmader K, Greenberg SM, Carr DB, Wildman DS. Comparing proxy and patients’ perceptions of patients’ functional status: results from an outpatient geriatric clinic. JAmGeriatrSoc 1992; 40: 585–8.
39. The EuroQol Group. EuroQol--a new facility for the measurement of health-related quality of life. Health Policy 1990; 16: 199–208.
40. Lamers LM, Stalmeier PFM, McDonnell J, Krabbe PFM, van Busschbach JJ. [Measuring the quality of life in economic evaluations: the Dutch EQ-5D tariff]. Ned Tijdschr Geneeskd 2005; 149: 1574–8.
41. Hakkaart-van Roijen L, Tan SS, Bouwmans CAM. Handleiding voor kostenonderzoek: Methoden en standaard kostprijzen voor economische evaluaties in de gezondheidszorg. Diemen: College voor Zorgverzekeringen, 2010.
42. Oostenbrink JB, Koopmanschap MA, Rutten FF. Standardisation of costs: the Dutch Manual for Costing in economic evaluations. Pharmacoeconomics 2002; 20: 443–54.
43. Z-index. G-Standaard. 2010. http://www.z-index.nl/zorgverleners (accessed Nov 5, 2014).
44. White IR, Royston P, Wood AM. Multiple imputation using chained equations: Issues and guidance for practice. Stat Med 2011; 30: 377–99.
45. Sterne JAC, White IR, Carlin JB, et al. Multiple imputation for missing data in epidemiological and clinical research: potential and pitfalls. BMJ 2009; 338: b2393.
46. Rubin DB. Multiple Imputation for Nonresponse in Surveys. New York: Wiley, 1987.
47. Lutomski JE, Baars MAE, van Kempen JA, et al. Validation of a frailty index from the older persons and informal caregivers survey minimum data set. J Am Geriatr Soc 2013; 61: 1625–7.
48. Rockwood K, Mitnitski A. Frailty in relation to the accumulation of deficits. J Gerontol A Biol Sci Med Sci 2007; 62: 722–7.
49. Fenwick E, Marshall DA, Levy AR, Nichol G. Using and interpreting cost-effectiveness acceptability curves: an example using data from a trial of management strategies for atrial fibrillation. BMC Health Serv Res 2006; 6: 52.
50. Muntinga ME, Van Leeuwen KM, Schellevis FG, Nijpels G, Jansen A. From concept to content: assessing the implementation fidelity of a chronic care model for frail, older people who live at home. BMC Health Serv Res 2015. DOI:10.1186/s12913-014-0662-6.

4
89
Cost-effectiveness of the Geriatric Care Model
51. Stuck AE, Minder CE, Peter-Wüest I, et al. A randomized trial of in-home visits for disability prevention in community-dwelling older people at low and high risk for nursing home admission. Arch Intern Med 2000; 160: 977–86.
52. Bouman A, van Rossum E, Evers S, Ambergen T, Kempen G, Knipschild P. Effects on health care use and associated cost of a home visiting program for older people with poor health status: a randomized clinical trial in the Netherlands. JGerontolA BiolSciMedSci 2008; 63: 291–7.

Related Documents