COST-EFFECTIVENESS ANALYSIS OF AIR TRAFFIC CONTROL SYSTEM IMPROVEMENTS Jason C. Yu, Transportation Research Center, University of utah; and Ahmet G. Ulusoy, Virginia Polytechnic Institute and state University A cost-effectiveness method that can help make air traffic control (ATC) system improvement decisions has been developed for use in making decisions among alternatives when different groups with conflicting objec- tives are involved. In this study, the choice of the measures of effective- ness and the development of the method make the use of the method possi- ble by every interested group. All the measures of effectiveness are nondimensional so that all factors, tangible or intangible, can be included in the analysis; a weighting scheme is employed to incorporate the relative importance of objectives into the decision-making. After a decision has been reached within each group, the groups, under certain conditions, can arrive at a final decision by using the compromised suboptimization tech- nique developed. Theoretical consideration of the problem resulted in a simple method for practical applications. An example is included to il- lustrate the application to ATC improvement of within-group decision- making. •AIR TRAFFIC congestion in the terminal area along with other problems has ad- versely affected the attractiveness of air transportation. It is estimated that in 1977 there will be about 55 million general aviation operations and about 17 million air carrier OJ?erations (1). World airline traffic has increased tlu·eefold in the years 1960 to 1970 (!). All of these tremendous increases in t]le number of takeoff and landing op- · erations can cause lengthy delays if no immediate actions are taken to improve air traf- fic control (ATC) in the terminal area. Various means have been suggested to overcomE!' this dilemma. The alternatives for ATC improvement should consist of an exhaustive list of possibilities for a given problem airport. Different constraints must be taken into consideration when one plans for each of these alternative means of improvement. The major alternatives that will have the desired effects on the efficiency of the terminal ATC system may be grouped into the following 3 categories: 1. Airport improvements (new runways and runway extensions, fast exit and fast entry runways, additional exit taxiways, and navigational equipment improvement), 2. ATC procedural changes (reducing minimum separation standards, changing se- quence and priority rules, and using dynamic runway assignment system automation), and 3. Regulatory changes (restricting general aviation and limiting number of operations during peak hours). A major problem in selecting the proper ATC improvement alternative is cost- effectiveness. The situation becomes more complicated because more than 1 party is involved, and each usually has conflicting objectives, which is common when invest - ments directly affect the public interest. Publication of this paper sponsored by Special Committee on Air Transport Activities of the Transportation Research Board. 24

Welcome message from author
This document is posted to help you gain knowledge. Please leave a comment to let me know what you think about it! Share it to your friends and learn new things together.
Transcript

COST-EFFECTIVENESS ANALYSIS OF AIR TRAFFIC CONTROL SYSTEM IMPROVEMENTS Jason C. Yu, Transportation Research Center, University of utah; and Ahmet G. Ulusoy, Virginia Polytechnic Institute and state University
A cost-effectiveness method that can help make air traffic control (ATC) system improvement decisions has been developed for use in making decisions among alternatives when different groups with conflicting objectives are involved. In this study, the choice of the measures of effectiveness and the development of the method make the use of the method possible by every interested group. All the measures of effectiveness are nondimensional so that all factors, tangible or intangible, can be included in the analysis; a weighting scheme is employed to incorporate the relative importance of objectives into the decision-making. After a decision has been reached within each group, the groups, under certain conditions, can arrive at a final decision by using the compromised suboptimization technique developed. Theoretical consideration of the problem resulted in a simple method for practical applications. An example is included to illustrate the application to ATC improvement of within-group decisionmaking.
•AIR TRAFFIC congestion in the terminal area along with other problems has adversely affected the attractiveness of air transportation. It is estimated that in 1977 there will be about 55 million general aviation operations and about 17 million air carrier OJ?erations (1). World airline traffic has increased tlu·eefold in the years 1960 to 1970 (!). All of these tremendous increases in t]le number of takeoff and landing op-· erations can cause lengthy delays if no immediate actions are taken to improve air traffic control (ATC) in the terminal area.
Various means have been suggested to overcomE!' this dilemma. The alternatives for ATC improvement should consist of an exhaustive list of possibilities for a given problem airport. Different constraints must be taken into consideration when one plans for each of these alternative means of improvement. The major alternatives that will have the desired effects on the efficiency of the terminal ATC system may be grouped into the following 3 categories:
1. Airport improvements (new runways and runway extensions, fast exit and fast entry runways, additional exit taxiways, and navigational equipment improvement),
2. ATC procedural changes (reducing minimum separation standards, changing sequence and priority rules, and using dynamic runway assignment system automation), and
3. Regulatory changes (restricting general aviation and limiting number of operations during peak hours).
A major problem in selecting the proper ATC improvement alternative is costeffectiveness. The situation becomes more complicated because more than 1 party is involved, and each usually has conflicting objectives, which is common when investments directly affect the public interest.
Publication of this paper sponsored by Special Committee on Air Transport Activities of the Transportation Research Board.
24

25
CONFLICTING INTERESTS
The parties involved in and affected by the decisions regarding airport improvements, particularly ATC improvements, include the local government owning the airport, the Federal Aviation Administration regulating the airport, the airline operators using the airport, and the community surrounding the airport. Each of these groups views the operation of the airport differently, and their evaluations of airport operations are based on different criteria. Usually, these groups will propose widely differing alternatives for ATC improvement. So we have a decision-making situation in which several parties with conflicting objectives regarding the outcomes and nature of ATC improvements are involved. The problem discussed in this paper can be defined as how to choose among different alternatives suggested for improving the ATC system, find the one alternative that would be most satisfactory to the parties involved, and stay within the boundaries of the constraints imposed on the system. These constraints can be considered in 2 different categories: one in which the constraints are binding for all alternatives (a limited budget), and one in which the constraints are binding only for a subset of the alternatives (the limited land available for adrport expansion).
The basic objective of this study is to develop a decision-making scheme that is general enough to be used by every party involved in ATC improvement. In addition to giving the decision-maker an insight into his or her preferences, the scheme to be developed also should provide the decision-maker with a clear understanding of the objectives and point of view of the other parties. Because use of this scheme will result in widely varying decisions because of conflicting objectives, a method will be proposed to lead the groups to a final decision acceptable to all of them.
METHOD OF APPROACH
Cost-effectiveness studies have been used as a standard procedure by federal agencies for evaluating investments and their return. Although cost-effectiveness analysis has been used rather extensively, the analysts have not yet come to an agreement on its scope and methodology. Niskanen(~ has the following to say on cost-effectiveness:
Cost-effectiveness analysis is specifically directed to problems in which the output cannot be evaluated in market prices, but where the inputs can, and where the inputs are substitutable at exchange relationships developed in the market. It addresses the problem of maximizing effectiveness subject to a generalized resource constraint measured in dollars. Cost-effectiveness analysis is appropriate when 1) there is no market evaluation of alternative outputs, as in the defense sector (or when the marginal priorities are determined by some other system, such as our political voting system) and 2) the resource inputs can be appropriately evaluated at market prices.
In some cases attempts have been made to assign monetary values to outputs and constraints that were expressed as incommensurable variables.
There are mainly 2 different criteria being used for rating the cost-effectiveness of a certain alternative and for finding the ma:ximum effectiveness levels of inputs. One is the ratio of marginal effectiveness to marginal cost; the other is the ratio of total costs to total effectiveness.
In this study, cost-effectiveness analysis is treated as a subjective method that takes into account the value judgments of the decision-maker. All measures of effectiveness, except the implementation cost of the alternatives, are nondimensional, and a weighting scheme is employed to differentiate the relative importance of the objectives. The measure of merit employed here will be effectiveness-cost ratio rather than a marginal effectiveness-marginal cost ratio simply because most of the alternatives relevant to ATC improvement cannot be treated continuously and must be either implemented fully or not at all.

26
OBJECTIVES AND MEASURES OF EFFECTIVENESS
The objectives that the decision-maker expects to achieve by implementing a proposed alternative should be clearly defined. Although the associated small weights will handle the relatively unimportant objectives, the weighting procedure gets very complicated and almost impractical as the number of objectives becomes large. The following list covers important objectives relevant to the cost-effectiveness analysis of the ATC system:
1. Minimize cost; 2. Decrease delay; 3. Increase system capacity; 4. Increase margin of safety; 5. Decrease noise pollution; and 6. Minimize social disruption.
Tl1e measures of effectiveness are a set of variables reflecting system characteristics. Each objective is associated with 1 measure of effectiveness. Therefore, it is good practice to keep the list of objectives as small as possible and not let the analysis lose its generality.
The measures of effectiveness associated with the objectives started earlier are as follows:
C1 = cost of implementing ATC improvement alternative i, in dollars; X1 = cost of delay in the terminal area to the airline, in dollars per year; X2 = average delay per operation due to congestion in the terminal area, in minutes; Xa = capacity of the system, in number of aircraft served under continuous satura-
tion conditions per hour; X4 = safety, in number of fatal accidents per 100,000 operations per year; Xs = noise, in number of people exposed to 90 composite noise 1·ating (CNR) per
year; and X6 = social disruption, in number of people displaced by expansion.
Implementation Cost
The cost of implementing an improvement alternative consists of fixed cost and variable cost such as operating and maintenance costs of the facilities added to the system. All of these cost elements may be reduced to present value by means of an appropriate interest rate for comparative analysis. The cost of implementation indicates whether the budget constraint is violated, and it plays an important role in the choice of the alternative to be implemented.
Average Delay per Operation
The average delay per operation can be different from the average delay per person because the latter involves the number of passengers per operation in addition to the delay of that operation. A plane with the same delay but more passengers will contribute more to the average delay per passenger. Landing delay can be obtained by subtracting from the difference of actual and scheduled landing times the difference of actual and scheduled takeoff times at the airport from which the flight originated. Takeoff delays are obtained from the difference of actual and scheduled takeoff times. These are added for each landing and takeoff and divided by the total number of landings and takeoffs to arrive at the average delay per operation for that airport.

27
Airline Delay Cost
Analysis of the average delay per operation is also useful in evaluating the cost of delay to the airline. The more important parts of delay to the airline are delays en route and at landing, which account for considerable fuel cost. If the data on delay are on overall delay, then the cost calculations will be very conservative for 3 reasons. First, this delay does not represent delay due to runway congestion; second, the cost of delay at takeoff is smaller than the cost of delay at landing; and third, any delay en route that is not associated with runway congestion adds to the calculation of the cost of delay. More accurate results can be obtained afterward if the total delay is broken down into takeoff delays, delays en route, and landing delays.
System Capacity
Peak-hour capacity, sustained capacity, and yearly capacity have been used to define airport capacity. We are interested in the interaction between capacity and delay in the terminal area. Axrival and departure flight delays probably account for more than 90 percent of all aircraft delays, which shows the effect of capacity on delay (4). Delay in the terminal area can be reduced by diverting the airplane from its optimal- route to cause delay en route and thereby more evenly distribute peak load. Average delay also depends on the arrival process, which has nothing to do with the runway configuration.
Operational Safety
Because most airplane accidents are crashes that occur during approach to and liftoff from the runway, areas near runways should be kept clear of residences and industries as much as possible. Providing for fire fighting equipment, ambulance service, dependable radar and communication equipment, safe sequencing rules, effective weather data collection, and safe and clear runways for all weather conditions is the prime duty of airport administration. The unit chosen for the measure of safety may be the number of fatal accidents per 100,000 operations per year.
Aviation Noise
Noise has become an important criterion in the design and operation of airports. The number of operations per day affects the amount of noise that is heard. Composite noise rating is a measure of the amount by which the offending noise level exceeds the prevalent ambient noise level; it includes the deviation of offending noise (5). It has been estimated that under certain wind conditions the capacity of Kennedy Airport in New York is reduced by more than 50 percent solely because of noise abatement procedures ( 4). These limitations not only cause more delays but also restrict operations to limited- airspace thereby imposing further limitations on the system. Noise has several effects on the surrounding community including physical and emotional effects. And noise complaints can be used as political pressure to restrict airport operations (_~).
Social Disruption
Social disruption caused by improvements that bring about added air and noise pollution exerts significant bearing on which alternatives to choose. The unit to measure this attribute would be the number of people displaced per alternative. This number should include employees who worked in the displaced industries and businesses and people who had to leave their residences.

28
FUNDAMENTALS OF THE DECISION-MAKING SCHEME
Definition 1
A binary relation R on a set Xis defined to be a set of ordered pairs (x, y) with x, yrX. The following notation will be used to denote a binary relation.
xRy .. (x, y)rR
A negation of the relation will be denoted by
xNRy @> (x, y) (R
Definition 2
Some of the properties that the binary relations can have can be listed. R defined on a set X is called
1. Weak order@> R on Xis asymmetric and negative transitive, 2. Strict order ~ R on X is a weakly connected weak order, and 3. Equivalence@> R on Xis reflexive, symmetric, and transitive.
In addition to these relations, there are also equivalence classes. An equivalence class is a disjointed, nonempty subset containing all of the original set. The set of equivalence classes under a binary relation represents a partition of the original set and will be denoted by S/R where Sand R denote the original set and the binary relation respectively.
Preference Relations
We are interested mainly in preference relations for this study. From now on, unless otherwise stated, the binary relation R will be a preference relation. It will be denoted by>-; fm.0 example, x >- y means x is preferred to y.
Another important relation in context of preference is indifference or lack of strict preference, which will be denoted by - or ID. The following theorem will establish the preference as a weak order and define another binary relation in relation to preference.
Theorem 1
Given that>- on Xis a weak order, the following holds true: (a)>- is transitive and (b) - is an equivalence. The proof ">- is transitive" makes use of the fact that R is negatively transitive if and only if
xRy «> (xRz or zRy)
holds true for all x, y, zrX. Proof that 11- is an equivalence" also uses the same rela
tionship. The next theorem defines strict order in context to preference relations.
Theorem 2
Given that>- on Xis a weak order, 1>- on X/ID is called a strict order and is defined by

a~B=x>-y
for any Xt'A and y,B.
Axiom
29
The equivalence classes under the binary relation of indifference occur only on interval subsets of X, and the preference relation among these intervals is defined by~ on X/ID. This axiom together with theorem 3 is going to establish the monotonicity of the scaling function,
Definition 3
The scaling function, S(x), is a real-valued numerical function that maps the level of the decision-maker's satisfaction by attaining a certain value of the measure of effectiveness being considered and putting it onto the real axis within the finite interval -1, 1. The mapping is unique, that is, each element in the domain is mapped into a unique element in the range.
Order Preference Characteristics
Before stating the definition theorem, let us state the following assumption, which is legitimate when one remembers the axiom and the fact that the domains of each variable considered are finite.
Assumption 1
The number of equivalence classes under the binary relation of ID is finite.
Theorem 3
Given that>- on Xis a weak order and X/ID is finite, one can construct a real-valued function S(x) on X such that
x >-y~ X(x) > S(y)
for every x, y,x.
Corollary
Combining theorem 3 and the axiom, one can state that either
x > y ~ S(x) :.: S(y)
for every x, yt'X, or
x > y @> X(x) ~ S(y)
for every x, y,x. S(x) is either monotone increasing or decreasing.

30
Independence and Additivity
Establishing independence among the measures uf effectiveness to iead to the additive representation of the joint scaling function is the crucial point in the analysis because it results in tremendous simplification of the method. It should be understood that independence as implied here does not mean that the measures of effectiveness do not affect each other but that it is independence in the utility sense. Additivity, on the other hand, implies that the joint scaling function can be represented as the sum of scaling functions when each of them is a function of only 1 measure of effectiveness, and there is 1 scaling function in the sum for each measure of effectiveness. The importance of additivity lies mainly in eliminating the need for establishing the joint scaling function, which is a very complicated task.
The following 2 theorems, which are both by Fishburn (6), define independence and additivity in a clear and minimal way. -
Theorem 4
Given that X = Xi X X2 X Xa . . . X Xn, the n X1 are mutually independent in the utility sense if and only if
whenever x1, x2, x3, x4£X, and any x1 £X1 appear once or twice on the left and right side of the indifference relation, i = 1, 2, ... , n.
Theorem 5
Given that X =Xix X2 .•. x Xn, then X1 are mutually independent in the utility sense if and only if there exist functions F1 on X1, i = 1, 2, ... , n so that
F(xi, X2, .. , , x.,) = F(xi) + F(x) + , . , + F(:x,J
for all x£X with the F1 unique up to the simultaneous transformations f1(x1) = FJK) + c1
for all x1£X1, i = 1, 2, ... , n, I:c1 = O, when f is fixed in origin and scale unit.
Scaling Functions
Because the measures of effectiveness are independent, the scaling function for each measure of effectiveness will be obtained separately. In this connection, 3 new terms will be introduced at this point. 'TI1ey are least tolerable value (LTV), present system value (PSV), and logical upper bound (LUB). Least tolerable value is a value of a particular measure of effectiveness that is impossible or infeasible for the decision-maker to go beyond. Present system value gives the average value of a particular measure of effectiveness as it exists in the present system. Logical upper bound is the highest value of a particular measure of effectiveness that the decision-maker can think of achieving.
For the measures of effectiveness that are allowed to deviate from PSV in both directions, the scaling function range is (-1, 1) for (LTV, LUB). For the measures of effectiveness that are expected to become better than their PSVs, the range is (O, 1) for (PSV, LUB). For those measures of effectiveness that can become only worse than their PSVs, the range is (-1, O) for (LTV, PSV).
The scaling function values for the range above O are obtained by asking the decisionmaker the following question: "What value of this measure of effectiveness do you con-
31
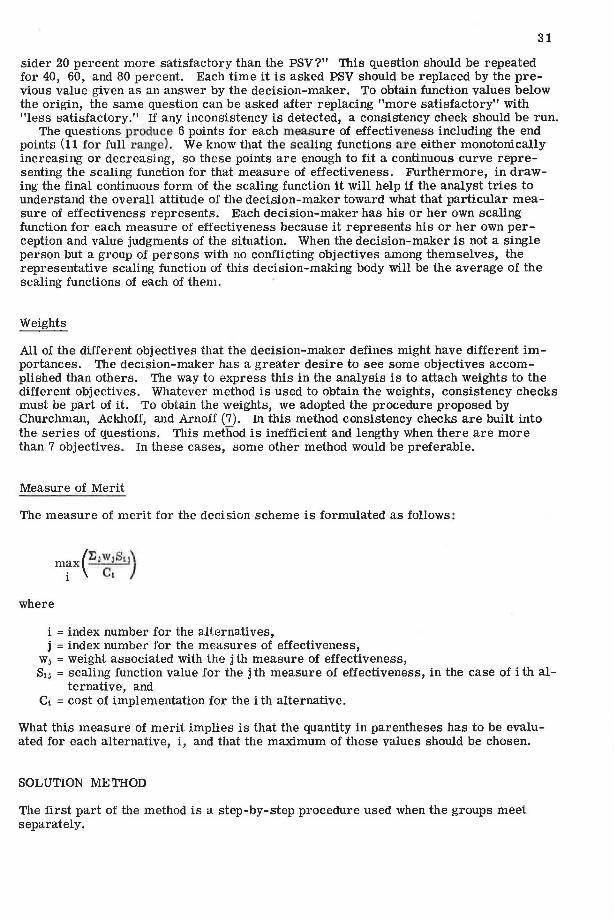
sider 20 percent more satisfactory than the PSV?" This question should be repeated for 40, 60, and 80 percent. Each time it is asked PSV should be replaced by the previous value given as an answer by the decision-maker. To obtain function values below the origin, the same question can be asked after replacing "more satisfactory" with "less satisfactory." If any inconsistency is detected, a consistency check should be run.
The questions produce 6 points for each measure of effectiveness including the end points (11 for full range). We know that the scaling functions are either monotonically increasing or decreasing, so these points are enough to fit a continuous curve representing the scaling function for that measure of effectiveness. Furthermore, in drawing the final continuous form of the scaling function it will help if the analyst tries to understand the overall attitude of the decision-maker toward what that particular measure of effectiveness represents. Each decision-maker has his or her own scaling function for each measure of effectiveness because it represents his or her own perception and value judgments of the situation. When the decision-maker is not a single person but a group of persons with no conflicting objectives among themselves, the representative scaling function of this decision-making body will be the average of the scaling functions of each of them.
Weights
All of the different objectives that the decision-maker defines might have different importances. The decision-maker has a greater desire to see some objectives accomplished than others. The way to express this in the analysis is to attach weights to the different objectives. Whatever method is used to obtain the weights, consistency checks must be part of it. To obtain the weights, we adopted the procedure proposed by Churchman, Ackhoff, and Arnoff (7). In this method consistency checks are built into the series of questions. This method is inefficient and lengthy when there are more than 7 objectives. In these cases, some other method would be preferable.
Measure of Merit
The measure of merit for the decision scheme is formulated as follows:
where
i = index number for the alternatives, j = index number for the measures of effectiveness,
w, = weight associated with the j th measure of effectiveness, S1J = scaling function value for the j th measure of effectiveness, in the case of i th al
ternative, and C1 = cost of implementation for the i th alternative.
What this measure of merit implies is that the quantity in parentheses has to be evaluated for each alternative, i, and that the maximum of these values should be chosen.
SOLUTION METHOD
The first part of the method is a step-by-step procedure used when the groups meet separately.

32
1. List all proposed alternatives. Eliminate alternatives that violate budgetary or legal constraints. Determine implementation cost for each remaining alternative.
2. Determine a set of objectives to be accomplished. This set should include the objectives of all parties;
3. Determine the weights the decision-maker attaches to the objectives. If there are any objectives fo which not only the decision-maker but also other parties attach a relatively small weight, eliminate those objectives from further consideration.
4. Associate a set of measures of effectiveness with the remaining set of objectives. 5. Obtain scaling function values for each measure of effectiveness. 6. Run consistency checks for the scaling function obtained, and remove any incon
sistencies. 7. Take alternative i. Determine scaHng function values for the level of each mea
sure of effectiveness which would be attained if alternative i is implemented. Evaluate measure of merit to get the effectiveness-cost ratio for alternative i. Repeat this for each alternative.
8. Determine the alternative with the maximum effectiveness-cost ratio. This should be the first choice of the decision-maker.
It should be noted that the decision arrived at in the final step is not necessarily final. If the best alternative chosen does not use all of the budget and further improvement in the system is desired, the best combination of alternatives can be selected and budgetary constraints would not be violated. The best combination is that with the largest effectiven~ss-cost ratio. For this procedure to be applicable, the alterna~ives should be independent so that their effects can be added.
The second part of the method starts after all the groups have made their decisions. During this part meetings will be held at which the groups can discuss their decisions. In these meetings, each group should try not only to impose its decision on others but also to make the other groups see the problem from its point of view. The scaling functions of each group also should be discussed to give to each group a better understanding of the other groups' preference structures.
If these efforts do not result in a final decision, then each group should go through the first part of the method. As a result of the discussions, some of the alternatives might be dropped, and the scaling functions and sets of weights probably will change. After each group arrives at a decision individually, discussions should be resumed. This procedure should be repeated until a compromise solution can be agreed on by all parties or a majority of parties. If it becomes clear that no compromise solution can be obtained, then L'le project should either be dropped er decided on by some other method.
The following hypothetical example is included to illustrate use of the first part of the method. Assume that an analyst has been hired by airport management to help them make a decision on ATC improvement. Four alternatives, each of which is financially feasible, are available to the airport management to choose from. After several interviews with the airport managem ent, the analyst det ermines the weights associated with the objectives and the scaling functions representing the preference structure of the airport management. The scaling functions are shown in Figures 1 through 6.
The trends of the decision-maker (airport manager) in evaluating the various levels of the measures of effectiveness are established by investigating the scaling functions obtained and can be summarized as follows:
1. X1 -The decision-maker is satisfied when airline costs are 15 to 75 million dollars; 2. X 2-He or she puts too much weight on decreasing delay, and would like to be in
the 9- to 15-min delay range; 3. X3-He or she seems to be satisfied with a capacity of 75 to 90 operations per hour 4. X4-He or she puts emphasis on no accidents. 5. X5-He or she worries about the number of noise complaints when the number of
people subjected to high noise is between 40 and 50 thousand and would be satisfied if the range were between 10 and 20 thousand; and
6. X6-He or she considers the displacement of more than 10,000 people difficult.

33
Figure 1. Scaling function of airline cost.
l.
o.
Q) o.
..-<
"' u <ll 0 .1
0. 2
o.
6 12 16 20 24 28 32 36 40
Airline Cost due to Delay($ millions)
Figure 2. Scaling function of operation delay.
1. 0
0. 8
0.6 Q)
..-<
"' u 0.4 "'
0.2
o.o x2
3 6 9 12 15 18 21
Delay per Operation (min.)
Figure 3. Scaling function of capacity. 1. 0
0.8
0.6
Q)
..-< .. u 0.4 <ll
0.2
0.0
65 75 85 95 105 115 X3
Capacity (Operations/hr.)

Figure 4. Scaling function of safety .
.. .-< .. " "'
Figure 5. Scaling function of noise.
Figure 6. Scaling function of social disruption.
.. .-< .. " "'
.. .-< .. " "'
o. 0 '-----,---,----.---r---"'i--o. o 0.1 0.2 0.3 0.4 0.5
Fatal Accidents/100 ,000 Operations
o.o
5 10 40 45 50 55
-o. 2
People Subjected to 90 CNR or More in Thousands
- 0. 4
-o.
-o.
-1 .
People Displaceed in Thousands
0 5 10 15 20 25 30 35
- 0. 4
- o. 6
- 0.8
-1.0
35
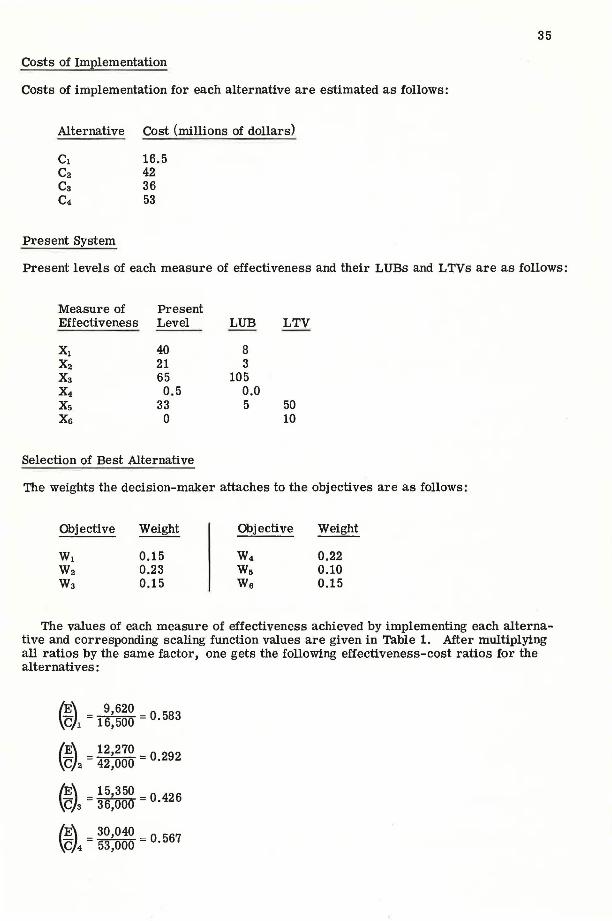
Costs of Implementation
Costs of implementation for each alternative are estimated as follows:
Alternative Cost (millions of dollars)
C1 16.5 C2 42 Cs 36 C4 53
Present System
Present levels of each measure of effectiveness and their LUBs and LTVs are as follows:
Measure of Effectiveness
Present Level
40 21 65 0.5
33 0
Selection of Best Alternative
LUB
8 3
105 0.0 5
LTV
50 10
The weights the decision-maker attaches to the objectives are as follows:
Objective Weight
0.15 0.23 0.15
Objective Weight
0.22 0.10 0.15
The values of each measure of effectiveness achieved by implementing each alternative and corresponding scaling function values are given in Table 1. After multiplying all ratios by the same factor, one gets the following effectiveness-cost ratios for the alternatives:
(E\ 9,620 c/1 = 16,500 =
0 ·583
(E\ 12,270 c)a = 42,000 = 0 ·292
/~\ _ 15,350 _ O 426 \c/s - 36,omf - .
/E\ _ 30,040 _ O 567 ~c/4 - 53,000 - ·

36
Table 1. Scaling function values for measures of effectiveness.
Alternative
2
Measure of Effectiveness Value
x. = 35 X, = 19 X, = 68 x. = 0.30 X, = 35,000 X, = 0
X1 = 30 X, = 16 X, = 90 x. = 0.50 X, ~ 44,000 X, ~ 10,000
Scaling Function Value
Su= 0.15 S12 = 0.09 s., = 0.20 s .. = 0.20 s .. = -0 .20 S1, = 0.0
821 = 0.31 s,, = 0.29 S,, = 0.84 s,. = 0.0 s,. = -0.52 s,, = 0.43
Alternative
3
4
Measure u.i.' Effect! veness Value
x. = 31 X, = 17 X, = 82 x. = 0.5 X, = 38,000 X, = 0
X1 = 22 X, = 12 X, = 104 x. = 0.4 X, = 28,000 X, = 18,000
Sea.Hug Function Value
s,, = 0.28 s,, = 0.20 s,, = 0.65 S,, = 0.0 s,, = -0.32 s,. = 0.0
s .. = 0.56 s,, = 0.60 s., = 0.97 s .. = 0.07 S" = 0.24 s .. = -0. 71
Clearly, alternatives 2 and 3 should be eliminated. Alternatives 1 and 4 are very close. The analyst can help the decision-maker by discussing the advantages and disadvantages of these 2 alternatives. The analyst may recommend an alternative based on grouping the effects on a formal scoring basis. The recommendation should be made as objectively as possible. The analyst must present not only expected outcomes but also supporting explanations of time sequences and spillover effects to give the decision-maker an appreciation for the risks associated with each choice.
CONCLUSIONS
The air terminal system has many components and the ATC operation has many dimensions. In addition to the direct costs and effects involved, there are many indirect variables to be considered in the ATC operation. Thus, the complexity of improving the operation stems not only from its magnitude but also from the diversity of its components. The cost-effectiveness analysis developed in this paper has taken care of the complex nature of the problem by making the variables nondimensional to make it possible to include intangible factors in the analysis. Weights have been introduced to quantify the relative importance attached to each objective by the decision-maker. Theoretical consideration of the problem resulted in a fairly simplified scheme for decision-making within a group, which makes the model practical. For decisionmaking among groups with conflicting objectives, it has been assumed that the groups act as objectively as possible and demonstrate a sincere effort to arrive at a compromise solution and try to understand the viewpoints of other groups. Although the scheme for decision-making within a group can be properly called an optimization technique, we conclude that, in general, no optimum solution can be found for the whole problem. The overall method results in suboptimization for all or most of the groups involved because they must modify their initial decisions.
ACKNOWLEDGMENT
This research was performed as part of a National Science Foundation grant. The opinions expressed in this paper are those of the authors and are not necessarily those of the sponsor.
REFERENCES
1. B. A. Schriever and W. W. Seifert, eds. Air Transportation 1975 and Beyond: A System Approach. M.LT. Press, Cambridge, Mass., 1968.

2. Aviation Week & Space Technology, March 11, 1974, p. 60. 3. W. A. Niskanen. Measures of Effectiveness. In Cost-Effectiveness Analysis
(T. A. Goldman, ed.), Praeger Publishers, New York, 1969. 4. G. Pestalozzi. Delay to Air Traffic in a Terminal Area. Univ. of California,
Berkeley, Rept. N68-860674, June 1968.
37
5. W. Buerck. Some Considerations on the Origin and the Spread of Public Reaction due to Noise. In Transportation Noises: A Symposium on Acceptability Criteria (J. D. Chalupnik, ect.> , Univ. of Washington Press, Seattle, 1970.
6. P. C. Fishburn. Independence in Utility Theory With Whole Product Sets. Operations Research, Vol. 13, 1965, pp. 28-45.
7. C. W. Churchman, R. L. Ackoff, and E. L. Arnoff. Introduction to Operations Research, John Wiley and Sons, Inc., New York, 1957.
Related Documents