University of Wollongong University of Wollongong Research Online Research Online University of Wollongong Thesis Collection 2017+ University of Wollongong Thesis Collections 2017 Cost Competitiveness and Efficiency of the Automobile Industry in China: Cost Competitiveness and Efficiency of the Automobile Industry in China: An Empirical Examination An Empirical Examination Ying Deng University of Wollongong Follow this and additional works at: https://ro.uow.edu.au/theses1 University of Wollongong University of Wollongong Copyright Warning Copyright Warning You may print or download ONE copy of this document for the purpose of your own research or study. The University does not authorise you to copy, communicate or otherwise make available electronically to any other person any copyright material contained on this site. You are reminded of the following: This work is copyright. Apart from any use permitted under the Copyright Act 1968, no part of this work may be reproduced by any process, nor may any other exclusive right be exercised, without the permission of the author. Copyright owners are entitled to take legal action against persons who infringe their copyright. A reproduction of material that is protected by copyright may be a copyright infringement. A court may impose penalties and award damages in relation to offences and infringements relating to copyright material. Higher penalties may apply, and higher damages may be awarded, for offences and infringements involving the conversion of material into digital or electronic form. Unless otherwise indicated, the views expressed in this thesis are those of the author and do not necessarily Unless otherwise indicated, the views expressed in this thesis are those of the author and do not necessarily represent the views of the University of Wollongong. represent the views of the University of Wollongong. Recommended Citation Recommended Citation Deng, Ying, Cost Competitiveness and Efficiency of the Automobile Industry in China: An Empirical Examination, Doctor of Philosophy thesis, School of Accounting, Economics and Finance, University of Wollongong, 2017. https://ro.uow.edu.au/theses1/83 Research Online is the open access institutional repository for the University of Wollongong. For further information contact the UOW Library: [email protected]

Welcome message from author
This document is posted to help you gain knowledge. Please leave a comment to let me know what you think about it! Share it to your friends and learn new things together.
Transcript
University of Wollongong University of Wollongong
Research Online Research Online
University of Wollongong Thesis Collection 2017+ University of Wollongong Thesis Collections
2017
Cost Competitiveness and Efficiency of the Automobile Industry in China: Cost Competitiveness and Efficiency of the Automobile Industry in China:
An Empirical Examination An Empirical Examination
Ying Deng University of Wollongong
Follow this and additional works at: https://ro.uow.edu.au/theses1
University of Wollongong University of Wollongong
Copyright Warning Copyright Warning
You may print or download ONE copy of this document for the purpose of your own research or study. The University
does not authorise you to copy, communicate or otherwise make available electronically to any other person any
copyright material contained on this site.
You are reminded of the following: This work is copyright. Apart from any use permitted under the Copyright Act
1968, no part of this work may be reproduced by any process, nor may any other exclusive right be exercised,
without the permission of the author. Copyright owners are entitled to take legal action against persons who infringe
their copyright. A reproduction of material that is protected by copyright may be a copyright infringement. A court
may impose penalties and award damages in relation to offences and infringements relating to copyright material.
Higher penalties may apply, and higher damages may be awarded, for offences and infringements involving the
conversion of material into digital or electronic form.
Unless otherwise indicated, the views expressed in this thesis are those of the author and do not necessarily Unless otherwise indicated, the views expressed in this thesis are those of the author and do not necessarily
represent the views of the University of Wollongong. represent the views of the University of Wollongong.
Recommended Citation Recommended Citation Deng, Ying, Cost Competitiveness and Efficiency of the Automobile Industry in China: An Empirical Examination, Doctor of Philosophy thesis, School of Accounting, Economics and Finance, University of Wollongong, 2017. https://ro.uow.edu.au/theses1/83
Research Online is the open access institutional repository for the University of Wollongong. For further information contact the UOW Library: [email protected]
Cost Competitiveness and Efficiency of the Automobile Industry in China: An Empirical Examination
A thesis submitted in fulfilment of the requirements for the award of the degree
Doctor of Philosophy
From
University of Wollongong
By
YING DENG
School of Accounting, Economics and Finance
Faculty of Business
March 2017
THESIS CERTIFICATION
I, Ying DENG, declare that this thesis, submitted in fulfilment of the
requirements for the award of Doctor of Philosophy, in the School of Accounting,
Economics and Finance, Faculty of Business, University of Wollongong is wholly my
own work unless otherwise referenced or acknowledged. The document has not
been submitted for qualification at any other academic institution.
Ying DENG
31st March 2017
i
ABSTRACT
China has been the world’s leading manufacturer of automobiles since 2010,
after having to rebuild the industry from scratch in the 1970s with an initial reliance
on technology from Russia and Eastern Europe (McKinsey 2015). China’s success
in this sector has been largely attributed to favourable government policies
promoting the automobile industry, contributions made by foreign joint ventures and
the cost leadership business strategy pursued by automobile and component
manufactures in the country (Hass 1987; Dent 1996; IBISWorld Industry Report
2016). Currently, China’s automobile sector is a pillar industry and it plays a
significant role in the economic development of the country. Therefore, it is critically
important for China’s long-term prosperity and economic growth.
However, despite the impressive development of the industry over the last few
decades, Chinese automobile manufacturers are now faced with great challenges
when it comes to quality, innovation and costs of production. Real wages growth in
recent years is eroding the cost advantage China has enjoyed for so many years. At
the same time, competition, particularly from automobile manufacturers in other
emerging markets, has been increasing and the demand for Chinese automobiles
from other countries is falling. In fact the export of Chinese-made automobiles fell by
20 percent from 2014 to 728,200 units in 2015 (CAAM 2016). This sharp reduction
in demand has raised concerns about the low-cost and low-tech models produced in
China, and the lack of quality of the indigenous brands (Chang 2016). The industry
itself has been confronted with many more challenges. Among them are: the
changing cost structure of automobile firms, the use of large volumes of unskilled
labour further affecting the quality of products (Berkowitz et al. 2015), increasing
labour and materials costs, and the opportunistic behaviours of the managers in
ii
state-owned enterprises, which have become prominent (Chang 2016). The joint
venture collaborations with foreign firms, which previously served Chinese
companies well in the early years of their development, are now severely restricted
by government regulations. This has hindered the transfer of the latest technologies
which the industry desperately requires in order to address some of the major issues
it is facing.
The academic literature that has examined the problems and issues in the
Chinese automobile industry has focused on examining: the political issues in
relation to Chinese government policy measures regarding the automobile industry;
economic issues in relation to both micro and macroeconomic policies, including
demand and supply issues; marketing issues in relation to controversial government
policies on sales to government organisations, and restrictions on the practices of
car dealerships; and production issues in relation to capacity and efficiency issues in
factories. However, despite the declining cost competitiveness of Chinese
automobile and component manufacturers, no prior study has examined the cost
competitiveness of these companies from a managerial accounting point of view.
Given this background, this study aims to contribute to the academic literature by
conducting a longitudinal study to assess how competitive Chinese automobile
companies are in terms of their cost and efficiency management, and to identify the
key factors affecting the competitiveness of the Chinese automobile industry. This is
done by taking a managerial accounting view in examining the underlying issues
facing the industry. The study uses a three-fold analysis to answer the research
questions of the study.
First, the performance and financial status of the Chinese automobile and
component manufacturing companies are assessed using a ratio analysis, combined
iii
with a statistical analysis. Second, a Data Envelopement Analysis (DEA) is
conducted to derive the efficiency parameters to indicate the efficiency performance
of manufacturers in the Chinese automobile industry. Third, the seven factors
identified from the literature as factors affecting the performance of automobile
companies are examined to test their relationship with the performance of
automobile companies using a multiple regression analysis.
The results of the ratio analysis were employed to examine the profitability,
liquidity and leverage of Chinese automobile and component manufacturers for the
period from 2006 to 2014. This analysis revealed that Indian automobile
manufacturing companies have outperformed Chinese automobile and component
manufacturers in many of the profitability measures examined. Such differences
were not observed for the level of liquidity between Chinese and Indian companies in
both automobile and component manufacturing sectors. Although, some liquidity
measures indicated weakening liquidity positions in the Chinese companies relative
to Indian firms. With regards to leverage, the study found significantly lower levels of
debt in Chinese automobile and component manufacturing companies in comparison
to their Indian counterparts, and this was identified as a factor affecting the relatively
lower rate of return on equity in Chinese automobile companies.
The results of the DEA analysis conducted to examine the level of efficiency
of Chinese automobile companies showed that technical efficiency of Chinese
manufacturers has steadily improved since 2008. Comparatively, the technical
efficiency of component manufacturers has plateaued in the last few years after a
significant drop in 2012, indicating technical inefficiencies in that sector. The average
of technical efficiency (Constant Return to Scale Technical Efficiency - CRSTE) and
pure technical efficiency (Variable Return to Scale Technical Efficiency - VRSTE)
iv
indicate that all the observed Decision-making units (DMUs) are not operating at
optimal scale, and scale efficiency results have not been achieved for all the
observed years. Further analysis revealed a deteriorating increasing return to scale
(IRS) of automobile manufacturing over the sample period, while constant return to
scale (CRS) increased over the same period, indicating deteriorating scale efficiency
of automobile manufacturing companies. A similar situation was observed for the
IRS for automobile component manufacturing, but unlike automobile manufacturing,
it is the decreasing return to scale (DRS) which is on the rise. This indicates the
situation is even worse for component manufacturing. Also, the study found that
allocative inefficiencies have dragged down any potential improvements to cost
efficiency which could have been gained from improvements in technical efficiency of
automobile manufacturing. As for component manufacturing, allocative efficiency has
deteriorated at a faster rate than has technical efficiency, and has dropped down to a
level similar to the level that existed in 2006. As a result, cost efficiency has virtually
shown no improvement over the 9 year period in this sector and thus requires
remedial action for improvement.
The multiple regression analysis enabled an examination of the relationship
between the factors affecting firm performance (ownership structure, leverage,
sustainable growth, state control, age, size and industry) and firm performance. The
results showed that government ownership, operating leverage, and state control
have significantly negative relationships with performance as measured by return to
assets (ROA) and return to equity (ROE), while foreign and institutional ownership,
financial leverage, and sustainable growth have significantly positive relationships
with performance. The relationship between firm age and firm performance was
negative, but not significant. As expected, the size of the firm has a positive impact
v
on performance, and the performance of the automobile manufacturing sector is
significantly lower than that of the component manufacturing sector. When the
performance was measured by Tobin’s Q, government and institutional ownership,
financial leverage, and sustainable growth were all found to be major factors in
affecting firm performance. When the performance was measured by cost efficiency,
it was found that leverage (both financial and operating) and age of the firms had
significantly negative relationships with performance. Furthermore, size and state
control were the only two factors that were significantly positively related to firm
performance.
The study, while drawing conclusions on the basis of the findings of the data
analysis, also highlights its limitations, and provides opportunities for future research
in this area. The study also makes a number of recommendations for enhancing the
cost competitiveness of the Chinese automobile industry.
vi
ACKNOWLEDGEMENTS
Completing my PhD has been a long, difficult, yet satisfying adventure. This journey
would have been impossible without the wonderful people in my life. I would like to
take this opportunity to express my sincere thanks to them.
I could not have finished my PhD without the expertise, guidance and endless
support of my supervisors, Dr Anura De Zoysa and Dr Shyam Bhati, from the time of
choosing my research topic to finishing writing up this thesis. Their extraordinary
support, understanding and patience helped me immensely along the way, not only
to complete this research project successfully, but also to learn valuable lessons and
acquire the skills I need to build my future career. My sincere appreciations to Dr
Anura De Zoysa’s family, Ms Menik De Zoysa and Ramali De Zoysa, who supported
me all the way to the end of my Phd.
I also wish to express my sincere thanks to a number of academic and professional
staff remembers at the School of Accounting, Economics and Finance at Wollongong
University and other universities. Particularly I would like to thank Associate
Professor Lee Moerman, Dr Graham Bowrey, Dr George Mickhail, Dr Kathy Rudkin,
Dr Corinne Cortese, Dr Sandra Chapple, Dr Sanja Pupovac, Dr Shirley Xu, Dr
Shiguang Ma, Dr Xiaofei Pan, Dr Dionigi Gerace, Professor Sandy Suardi,
Associate Professor Peter Sminiski and Dr Amir Arjomandi; and Dr Qigui Liu from
Zhejiang University in China, Dr Jinghua (Vincent) Tang from Hunan University in
China, Dr Ku He and Professor Gary Tian from Macquarie University and Giuseppe
Carabetta from University of Sydney, for their advice and support throughout my
journey. I am also thankful to the following faculty and administrative staff for their
support: Ms Helen Harman, Mr Phil Luskan, Ms Maree Horne, Ms Lena Ivancevic,

vii
Ms Lesley Simes, Ms Danielle O’Neill, Ms Samantha Constantinou, Ms Toni Seton
and Ms Margaret Brown, and Mr Louie Athanasiadis.
I would also like to thank my fellow PhD students, Ms Sheetal Deo, Ms Melissa
Ellsmore, Mr Vilimone Mataka Rabuatoka and Mr Brandon Crapp, who were there
for me all the time when I needed help.
I would also like to particularly thank my best friends, Ms Lijuan (Melinda) Ma, Ms
Wenyi (Melody) Huang, Mr Jiaying (Victor) Cai, Ms Sisi (Iris) Ma, Ms Chunzhi Lou,
Ms Xinyue (Nicole) Li, and Ms Nina Ding. They believed in me, trusted me and
supported me when going through the ups and downs of the PhD journal in the last
few years.
Lastly, I would like to express my deepest appreciation to my family: Nanqing Zhou
and Qiong Shao, Chuan Zhou and Junjie Shao, for their continuing encouragement
and support. And I would like to especially thank my father, Mr Yonglin Deng, who
has never judged me or doubted me, has always shown constant belief in me, and
my mother, Ms Yun Zhou, grandmother, Shouyang Liu and my beloved grandfather,
Fengchun Zhou, who have been the rock in my life, always standing beside me to
light my way Thank you for your infinite support and understanding. I am so grateful
for having you around me when times were darkest. I will carry the strength you gave
me to continue this adventure.
viii
TABLE OF CONTENTS
ABSTRACT i
ACKNOWLEDGEMENTS .......................................................................................... vi
TABLE OF CONTENTS ........................................................................................... viii
LIST OF FIGURES ................................................................................................... xiii
LIST OF TABLES ..................................................................................................... xiv
LIST OF ABBREVATIONS ........................................................................................ xv
Chapter One Introduction ........................................................................................... 1
1.1 Background to The Research ............................................................................ 1
1.2 Research Problem ............................................................................................. 3
1.3 Research Questions .......................................................................................... 6
1.4 Research Design, Methodology and Data ......................................................... 7
1.5 Significance and Contribution .......................................................................... 10
1.6 Structure of This Thesis ................................................................................... 11
Chapter Two Overview of the Automobile Industry in China .................................... 13
2.1 Introduction.. .................................................................................................... 13
2.2 Development of Automotive Industry in China ................................................. 14
2.2.1 Early Production and Policies: 1949-1965 ..................................................... 14
2.2.2 The Automobile Industry under Revolutionary Policies 1966-1976................ 16
2.2.3 Post-Mao Era in the Automobile Sector: Late 1970s to 1980s ...................... 20
2.2.4 Early Face of New Production: 1990s ............................................................ 23
2.2.5 Post 2000: the Modernisation of the Chinese Automobile Industry ............... 24
2.3 Market Structure .............................................................................................. 27
2.4 Industry Performance....................................................................................... 28
2.5 Exports and Imports ......................................................................................... 29
2.6 Manufacturing Environment ............................................................................. 30
2.7 Establishments and Wages ............................................................................. 32
2.8 Technology and Economies of Scale ............................................................... 32
2.9 Industry Globalisation and Increasing Competition .......................................... 33
2.10 Social Issues- Sustainability and Corporate Social Responsibilities on
Automobile Industry ......................................................................................... 34
2.11 Issues and Problems for the Automobile Industry in China .............................. 35
ix
2.12 The Evolution of India’s Automobile Industry ................................................... 37
2.12.1 Government Intervention Era: 1947-1965 ...................................................... 37
2.12.2 Segmental Growth: 1966-1979 ...................................................................... 40
2.12.3 Limited Liberalization and Foreign Collaborations: 1980 to 1990 .................. 41
2.12.4 Liberalization and Ensuing Globalization: 1991 onwards ............................... 42
2.13 Importance of Comparison of Automobile Industry in China with India ............ 44
2.14 Summary…. ..................................................................................................... 45
Chapter Three Literature Review ............................................................................. 47
3.1 Introduction ...................................................................................................... 47
3.2 Theory of Competitiveness .............................................................................. 48
3.3 Cost Competitiveness, Cost Ratios and Firm Performance ............................. 53
3.4 Studies on The Performance of the Automobile Industry ................................. 54
3.4.1 Customer Value, Profitability and Firm Performance ..................................... 55
3.4.2 Supply Chain Management and Firm Performance ....................................... 56
3.4.3 Technology and Firm Performance ................................................................ 57
3.4.4 Human Resources and Firm Performance .................................................... 58
3.5 Efficiency Studies in the Automobile Industry .................................................. 59
3.5.1 Review of Efficiency Studies .......................................................................... 60
3.5.2 Overview of the Automobile Industry Efficiency Studies ................................ 71
3.6 Ownership Structure, Capital Structure and Firm Performance ....................... 74
3.6.1 Agency Cost Hypothesis ................................................................................ 74
3.6.2 Agency Cost Theory and Capital Structure .................................................... 75
3.6.3 Sustainable Growth and Firm Performance ................................................... 77
3.6.4 Ownership Structure, Agency Costs and Firm Performance ......................... 77
3.7 Implications of Government Policies on the Automobile Industry in China ...... 86
3.7.1 Environmental Issues with the Chinese Automobile Industry ........................ 86
3.7.2 Environmental Accounting and Corporate Social Reporting (CSR) ............... 87
3.7.3 The Relevance of the Chinese Automobile Industry ...................................... 88
3.8 Summary…. ..................................................................................................... 88
Chapter Four Research Design, Methodology and Data .......................................... 90
4.1 Introduction …………………………………………………………………………..90
4.2 Research Problem ........................................................................................... 91
4.3 Research Questions ........................................................................................ 97
x
4.4 Research Design and Approach ...................................................................... 98
4.4.1 Research Framework .................................................................................... 99
4.4.2 Research Methods ....................................................................................... 101
4.4.3 Selection of Sample and Data Collection ..................................................... 101
4.5 Cost Competitiveness - Ratio Analysis .......................................................... 103
4.5.1 Introduction .................................................................................................. 103
4.5.2 Selection of Samples and Data Collection ................................................... 104
4.5.3 Method-Ratio Analysis ................................................................................. 105
4.5.4 Accounting Ratios and Definitions ............................................................... 106
4.5.5 Limitations of Ratio Analysis ........................................................................ 113
4.6 Efficiency of Chinese Automobile Manufacturers ........................................... 114
4.6.1 Introduction .................................................................................................. 114
4.6.2 Selection of The Sample and Data Collection ............................................. 115
4.6.3 Method – Data Envelopment Analysis ......................................................... 116
4.7 Multivariate Regression Analysis ................................................................... 135
4.7.1 Introduction .................................................................................................. 135
4.7.2 Selection of Sample and Data Collection ..................................................... 135
4.7.3 Multivariate Regression Analysis Model ...................................................... 136
4.7.4 Factors Affecting Firm Performance ............................................................ 137
4.7.5 Measuring Variables-Dependent Variables ................................................. 145
4.7.6 Measuring Variables- Independent Variables .............................................. 147
4.7.7 Limitations of Regression Analysis .............................................................. 149
4.8 Summary…. ................................................................................................... 149
Chapter Five Empirical Analysis and Results ......................................................... 151
5.1 Introduction….. .............................................................................................. 151
5.2 PART A: Results on The Profitability and Financial Status-Analysis and
Discussion ..................................................................................................... 152
5.2.1 Profitability ................................................................................................... 152
5.2.2 Liquidity ....................................................................................................... 172
5.2.3 Leverage ...................................................................................................... 180
5.3 PART B: Results on The Analysis of Efficiency and Discussion ................... 182
5.4.1 Initial Data Assessment ................................................................................. 183
5.4.2 Technical Efficiency Performance of the Automobile industry ....................... 184
xi
5.4.3 Scale Efficiency ............................................................................................. 187
5.4.4 Allocative Efficiency and Cost Efficiency Performance .................................. 192
5.4 PART C : Results on The Analysis of Factors Affecting The Firm Performance
of Manufacturers in The Chinese Automobile Industry and Discussion ......... 195
5.4.1 Introduction ................................................................................................... 195
5.4.2 Multivariate Regression Model ...................................................................... 195
5.4.3 Empirical Results ......................................................................................... 197
5.5 Summary……. ............................................................................................... 212
Chapter Six Summary and Conclusion ................................................................... 215
6.1 Introduction. …………………………………………………………………………215
6.2 Summary of Major Findings ........................................................................... 219
6.2.1 Conclusions and Recommendations ........................................................... 231
6.3 Limitations of This Study and Future Research Areas ................................... 242
6.4 Policy Implications ......................................................................................... 244
BIBLIOGRAPHY .................................................................................................... 249
Appendix A: Financial Ratios of Chinese and Indian Automobile Manufacturers,
2006 -2014 ........................................................................................ 292
Appendix B:Levene’s Test for Equality of Variances ,Automobile Manufacturers,
2006 – 2014 ...................................................................................... 297
Appendix C: Financial Ratios of Chinese and Indian Component Manufacturers,
2006 -2014 ........................................................................................ 315
Appendix D: Levene’s Test for Equality of Variances, Component Manufacturers,
2006 – 2014 ...................................................................................... 320
Appendix E: Descriptive statistics of Output and Inputs, Data Envelopment Analysis
(DEA) ................................................................................................ 338
Appendix F: Descriptive Statistics of Efficiency Scores of Chinese Automobile and
Component Manufacturers, 2006 -2014 ............................................ 339
Appendix G: Results from Estimates of Technical Efficiency Scores of DEA
Approach, 2006 – 2014 ..................................................................... 340
Appendix H: Number of Percentage of Automobile and Component Manufacturers,
Classified by Types of Return to Scale ............................................. 341
Appendix I: Results from Estimates of Allocative and Cost Efficiency Scores of DEA
Approach, 2006 – 2014 ..................................................................... 342
xii
Appendix J: Normality Tests on Dependent Variables, Multivariate Regression
Analysis ............................................................................................. 343
Appendix K:Homoscedasticity of Residuals ........................................................... 347
Appendix L: Heteroscedasticity Tests .................................................................... 349
xiii
LIST OF FIGURES
Figure 1.1: Theoretical Research Framework – Competitiveness .............................. 7
Figure 2.1: Total Annual Vehicle Production, 2006-2015 ......................................... 25
Figure 2.2: Vehicle Exports from China .................................................................... 29
Figure 3.1:Three Dimensions of Competitiveness .................................................... 49
Figure 4.1: Production Frontiers and Technical Efficiency ..................................... 118
Figure 4.2: Productivity, Technical Efficiency and Scale Economies .................... 118
Figure 4.3: Technical and Allocative Efficiency ...................................................... 120
Figure 4.4: Input- and Output-Orientated Technical Efficiency .............................. 122
Figure 4.5: Increasing and Diminishing Returns to Scale ....................................... 127
Figure 4.6: Scale Efficiency in DEA ........................................................................ 128
Figure 5.1: Overall Profitability ............................................................................... 154
Figure 5.2: Company Tax Rates in China and India ............................................... 164
Figure 5.3: Key Differences in Profitability Measures of Automobile Manufacturers…
………………………………………………………….169
Figure 5.4: Key Differences in Profitability Measures of Automobile Component
Manufacturers ................................................................................... 171
Figure 5.5: Constant Return to Scale Technical Efficiency (CRSTE) ..................... 185
Figure 5.6: Variable Return to Scale Technical Efficiency (VRSTE) ...................... 187
Figure 5.7: Scale Efficiency (Scale) ....................................................................... 188
Figure 5.8: Types of Return to Scale –Chinese Automobile Manufacturing ........... 190
Figure 5.9: Types of Return to Scale –Chinese Component Manufacturing ........... 191
Figure 5.10: Technical Efficiency, Allocative Efficiency and Cost Efficiency in
Chinese Automobile Manufacturing ................................................ 193
Figure 5.11: Technical Efficiency, Allocative Efficiency and Cost Efficiency in
Chinese Component Manufacturing ................................................ 194
xiv
LIST OF TABLES
Table 2.1: Market Concentration by Segment .......................................................... 28
Table 2.2: The Automotive Segments in the Chinese Automobile Industry .............. 31
Table 4.1: The Sample Data .................................................................................. 102
Table 5.1: Return on Assets ................................................................................... 153
Table 5.2: Profit Margin Ratio ................................................................................. 155
Table 5.3: Assets Turnover Ratio ........................................................................... 156
Table 5.4: Fixed Assets Turnover Ratio ................................................................. 158
Table 5.5: Gross Profit Margin Ratio ...................................................................... 159
Table 5.6: Operating Expenses to Sales Ratio ....................................................... 160
Table 5.7: Net Finance Expense to Sales Ratio ..................................................... 162
Table 5.8: Non-operating Income to Sales Ratio .................................................... 163
Table 5.9: Tax Expense to Sales Ratio .................................................................. 165
Table 5.10: Extraordinary Item Costs to Sales ....................................................... 167
Table 5.11: Return on Equity .................................................................................. 168
Table 5.12: Current Assets Ratio ........................................................................... 172
Table 5.13: Quick Assets Ratio .............................................................................. 174
Table 5.14: Days Sales in Accounts Receivables .................................................. 175
Table 5.15: Stock Turnover Ratio ........................................................................... 176
Table 5.16: Number of Days in Stock ..................................................................... 178
Table 5.17: Debt to Assets Ratio ............................................................................ 181
Table 5.18: Pearson’s Correlations among The Output and Inputs ........................ 184
Table 5.19: Multi-Collinearity Test (Pearson’s Correlations among The Independent
Variables) ............................................................................................ 198
Table 5.20: Multi-Collinearity - Variance Inflation Factors (VIF) ............................. 199
Table 5.21: Descriptive Statistics of Multivariate Regression Analysis ................... 200
Table 5.22: The Results of The Regression Analysis – OLS .................................. 202
Table 5.23: The Results of The Regression Analysis – Fixed Effects .................... 204
xv
LIST OF ABBREVIATIONS
AE Allocative Efficiency
BCC DEA Banker, Charnes and Cooper (1984) – Data
Envelopment Analysis (DEA)
CCR DEA Charnes, Cooper and Rhodes (1978) – Data
Envelopment Analysis (DEA)
CCR/AR Efficiency Ratio Assurance region efficiency ratio calculated from
Charnes, Cooper and Rhodes (1978) - DEA
model
CE Cost Efficiency
CNAICO The China National Automotive Industrial
Corporation
CIS
CISA
Community Innovation Surveys
China Iron and Steel Association
CRS Constant Return to Scale
CRSTE Technical Efficiency
CSR Corporate Social Responsibility
DEA Data Envelopment Analysis
DMUs Decision-making units
DRS Decreasing Return to Scale
FAW The First Automotive Works
FINLEV Financial Leverage
FOROWN The Largest Shareholding of Foreign Ownership
FYP Five Year Plan
GDP Gross Domestic Product
GFC Global Financial Crisis
GICS Global Industry Classification Standard
GOVOWN Government Ownership
ICs Integrated Chips
IDRA The Industries (Development and Regulation) Act
INOWN Institutional Ownership
IPR The Industrial Policy Resolution
xvi
IRS Increasing Return to Scale
INDUSSEC Industry Sector
JV Joint-Venture
NIRS Non-Increasing Returns to Scale
OEM Original Equipment Manufacturer
OPERLEV Operating Leverage
OICA The International Organisation of Motor Vehicle
Manufacturers, is also known as ‘Organisation
Internationale des Constructeurs d’Automobiles
OLS Ordinary Least Square
OSIRIS Bureau Van Dijk’s OSIRIS Database
RMB Renminbi, the unit of Chinese currency
RTS Return to Scale
ROA Return on Assets
ROE Return on Equity
SASAC State-owned Assets Supervision and
Administration Commission
SAW The Second Automotive Works
SBM Slacks-based Measures
STATECON State Control
SUSGROWTH Sustainable Growth Rate
SOEs State-owned Enterprises
TE Technical Efficiency
TFP Total Factor Productivity
Tobin’s Q The ratio of the market value of a company’s
assets divided by the book value of company’s
assets
VRSTE Pure Technical Efficiency
WTO World Trade Organisation
YrFE Year Fixed Effect
CoFE Company Fixed Effect
1
CHAPTER ONE
INTRODUCTION
1.1 Background to The Research
The world’s automobile industry has changed significantly over the last decade
with its rapid development in emerging markets such as Korea, China, Brazil and
India. The significant support provided by governments in these countries aims to
promote the automobile industry and the cost leadership strategy. This cost
leadership strategy, which is pursued by many automobile manufacturers, has been
the catalyst for remarkable success in the automobile industries of these countries.
The massive incentives provided by the government to foreign investors, and the
relatively low cost of production have enticed many leading automakers in developed
markets to relocate their production facilities to emerging markets, with a view to
reducing their production costs and being cost competitive in the global automobile
market (Mahidhar et al. 2009; Baker and Hyvonen 2011). Not surprisingly, with its
huge population and demand for automobiles as a result of its growing middle class
and massive government support, China has gone on to become the leading
manufacturer of automobiles among all emerging markets (Tang 2009; OICA 2016).
The industry was primarily built from scratch, beginning with reform in the 1970s and
an initial reliance on technology from Russia and Eastern Europe. By 2010, the
Chinese automobile industry1 had transformed into the largest market for new cars
(McKinsey 2015). China’s success has been mainly attributed to government policies
promoting the automobile industry, contributions made by foreign joint ventures and
the country’s low-cost manufacturing base (Hass 1987; Dent 1996;
Cheryinternational 2013, IBISWorld Industry Report 2016).
1 The term “Chinese automobile industry” is used in this study to describe all Chinese automobile manufacturers
including automobile manufacturers and component manufacturers.
2
The role that the Chinese automobile industry plays in the economic
development of the country is massive (Haugh et al. 2010). This is because
production in the automobile industry has prominent linkages to other pillar industries
in the country. One example is the steel and iron manufacturing industry for which
the automobile industry is a major end user of its products (CISA 2008; CNAICO
2010). The industry has become a huge contributor to the Chinese economy, not
only in manufacturing, but also in investments regarding building and equipping
plants, dealerships, distribution infrastructure, and services
such as finance, insurance, transportation, and hauling 24.6 million vehicles
across China every year (Richter, 2016). However, in recent years the Chinese
automobile industry has faced serious competition from other automobile
manufacturers in emerging markets. Further, the competiveness of the industry
appears to be declining due to increasing production costs, which lower the
profitability of automobile manufacturers in the country. The lack of improvement in
quality and innovation in the industry has also affected its exports. Consequently,
China’s closest rival, India, has now surpassed China as the biggest exporter of
vehicles, despite the fact that China is the largest automobile manufacturer in the
world. There are many challenges faced by the Chinese automobile industry
including production, marketing, and environmental and economic problems which
are prominently discussed in the academic literature. What is missing in the
academic literature is a discussion on Chinese companies’ cost competitiveness
from a managerial accounting perspective. Given this background, this study aims to
critically examine the major issues affecting the cost competitiveness of the Chinese
automobile industry through the lens of management accounting. The following
section highlights the underlined research problem of this study.
3
1.2 Research Problem
The growth of the Chinese automobile industry has been phenomenal over the
past 10-15 years; the industry has doubled in size over this period (Baker and
Hyvonen 2011). However in recent years, due to the economic slowdown in China
and the lack of attention given to improving certain aspects of the automobile
industry, Chinese automobile manufacturers are now faced with great challenges
when it comes to quality, innovation and costs of production. Real wages growth in
particular is a serious issue facing this industry in China. For example, the wages of
Chinese factory workers are now at their historical highest, reflecting 64% wage
growth since 2011. Increasing wages means increasing costs for companies,
causing them to lose their cost competitiveness (Niedermeyer 2014). A number of
major issues faced by the Chinese automobile industry are described below.
First, the quality of automobiles produced by Chinese manufacturers is still
not considered to be comparable to their competitors such as Japan’s Toyota or
Korea’s Hyundai, which have gained highly respected reputations in the global
market (Tang 2009). According to a report from the China Association of Automotive
Manufacturers (CAAM 2016), the export of Chinese-made automobiles fell by 20% in
from 2014 to 728,200 units in 2015. This sharp reduction in demand has raised
concerns about the way in which low-cost and low-tech models produced in China
and the lack of quality of the indigenous brands, act as significant impediments to the
development of the Chinese automobile industry (Chang 2016).
Second, there are a number of internal issues troubling the Chinese
automobile industry. For instance, the changing cost structure of firms, the use of
large volumes of unskilled labour (Berkowitz et al. 2015), the increasing labour costs
and materials costs, and the opportunistic behaviours of the managers in State-
4
owned enterprises (Chang 2016) are dampening the cost and efficiency
competitiveness of local automobile manufacturers. Although the Chinese
automobile industry embraces large volumes and scales of production, this has not
appeared to have translated into improvements in manufacturing efficiencies.
Third, the issues that hamper the cost and efficiency competitiveness are
related to impacts from the Joint Venture (JV) policy and co-operation between local
manufacturers and overseas investors. The Chinese central government opened the
investment policy to foreign investors in the early 1980s (Harwit 1995). International
car makers are only allowed to have a 50-50 joint-venture partnership with China’s
state-owned enterprises/manufacturers (SOEs) (Shi et al. 2014). With this condition,
the foreign investors have had to help newly-established Chinese automobile
manufacturers to modernize their production processes in the hope that one or two
of these manufacturers (SOEs) would be capable of producing quality automobiles
for the global market (Chang 2016). However, the local manufacturing environment
was not ready for advanced technology and Western styled capitalism (Young and
Lan, 1997; He and Mu, 2012; Ju et al. 2013). The lack of a skilled labour force, and
misunderstanding by Chinese leaders regarding the utilisation of resources invested
by Western automobile manufacturers, has further jeopardised the development of
the Chinese automobile industry.
What can prominently be seen from the weak exports of Chinese automobiles
to developed countries, especially in Europe, is that the Chinese automobile industry
is seriously lacking in environmentally-friendly technology to make their products
attractive to buyers in these markets (Chu 2011). Undoubtedly, this is the most
important advantage that European automobile firms have over the Chinese
5
competitors. However, Chinese manufacturers cannot embrace environmentally-
friendly technologies for two reasons:
(1) Their joint venture foreign partners are reluctant to provide Chinese
automobile companies with these technologies as it puts their business at
risk.
(2) It is extremely expensive to embrace these technologies in a Chinese
manufacturing setting, even if the technology is available. The cost
implication of integrating these technologies into Chinese automobiles is
huge and results in lowering their cost competiveness.
However, sooner or later, Chinese automobile companies will be forced to
embrace these technologies. For example, due to the severe state of air pollution in
China, the Chinese government is now introducing tough legislation to improve fuel
quality and economy.
The problems stated above highlight the need for a comprehensive empirical
examination of the performance of the industry through a longitudinal study to
assess how competitive Chinese automobile companies are in terms of their cost
and efficiency management. In addition the examination will identify the key factors
affecting the competitiveness of the Chinese automobile industry. It also makes the
case for a comprehensive examination of the performance of the automobile industry
in general, as prior studies that have been conducted to examine the performance
issues of the automobile industry have left a vacuum in the academic literature. This
vacuum is attributed to the fact that none of those studies have taken a managerial
accounting view in examining the underlying issues, as the current study intends to
do.
6
In particular, this study will:
1. Empirically analyse the cost performance of Chinese automobile
manufacturers and component manufacturers for the period of 2006 to 2014
in comparison to that of China’s closest competitor, India.
2. Empirically examine the level of efficiency— measured in terms of technical
efficiency, pure technical efficiency, scale efficiency, allocative efficiency and
cost efficiency—in the Chinese automobile and component manufacturers for
the period from 2006 to 2014.
3. Empirically examine the factors that have affected the performance,
measured by Return on Assets (ROA), Return on Equity (ROE), Tobin’s Q
(TQ) and Cost Efficiency (CE) of Chinese automobile and component
manufacturers for the period from 2006 to 2014.
4. Identify major issues that have affected the performance of Chinese
automobile and component manufacturers from the above-mentioned analysis
and recommend measures to enhance cost competitiveness of the industry.
1.3 Research Questions
The following research questions are addressed in relation to the above research
objectives:
1. Research Question 1[RQ1]: How competitive is the Chinese
automobile industry in terms of performance and financial status in
comparison to those of the Indian automobile industry?
2. Research Question 2[RQ2]: How have Chinese automobile companies
performed in terms of efficiency?
3. Research Question 3[RQ3]: What factors have affected the performance of
the Chinese automobile industry?
7
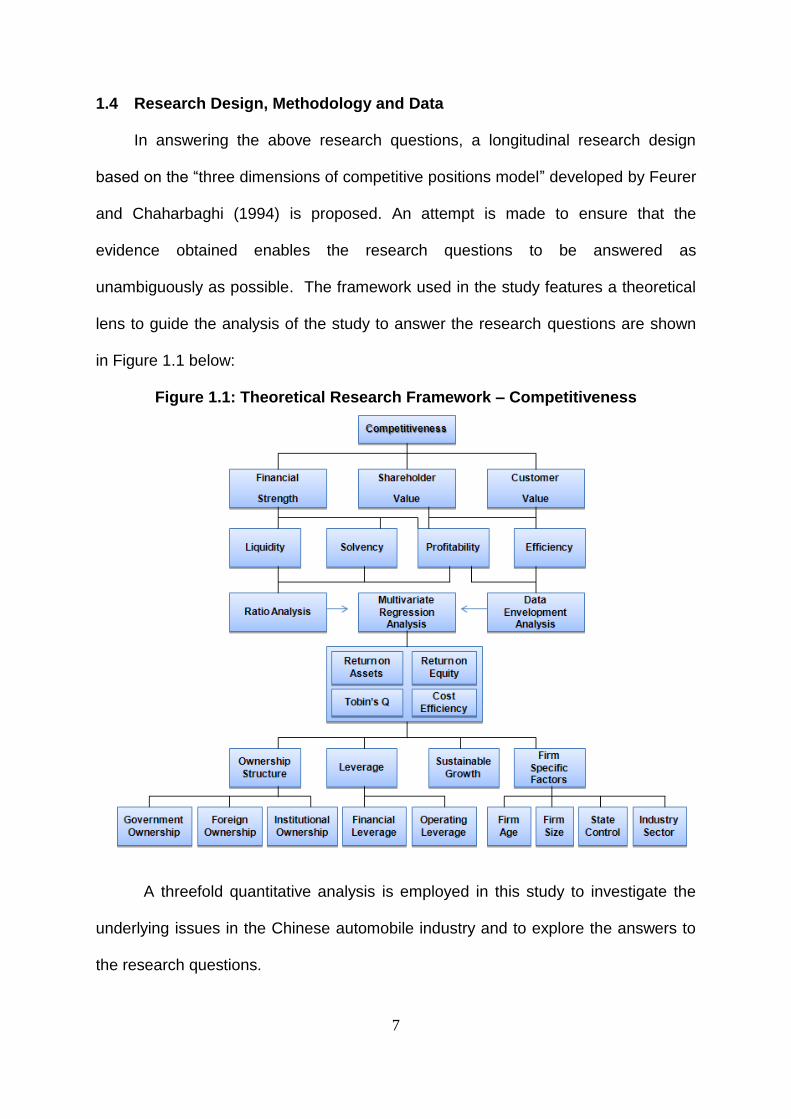
1.4 Research Design, Methodology and Data
In answering the above research questions, a longitudinal research design
based on the “three dimensions of competitive positions model” developed by Feurer
and Chaharbaghi (1994) is proposed. An attempt is made to ensure that the
evidence obtained enables the research questions to be answered as
unambiguously as possible. The framework used in the study features a theoretical
lens to guide the analysis of the study to answer the research questions are shown
in Figure 1.1 below:
Figure 1.1: Theoretical Research Framework – Competitiveness
A threefold quantitative analysis is employed in this study to investigate the
underlying issues in the Chinese automobile industry and to explore the answers to
the research questions.
8
Firstly, a comparative ratio analysis is conducted to assess the financial
strength of Chinese and Indian automobile and component manufacturers for a
period of nine years from 2006 to 2014. Also, on the basis of the results of this
analysis and statistical tests conducted, an assessment is made regarding the
relative financial strength of the Chinese automobile industry while identifying its
relative strengths and weaknesses.
Secondly, the level of operational efficiency in the Chinese automobile
industry is measured using Data Envelopment Analysis (DEA) under three
categories of efficiencies, which are technical efficiency, pure technical efficiency
and scale efficiency.
Thirdly, the factors impacting on performance, including levels of efficiency,
are examined using a multiple regression analysis.
The data for this study was obtained from Bureau Van Dijk’s OSIRIS
database (OSIRIS) which provides financial information on manufacturers under
industry categories based on the classification provided by the Global Industry
Classification Standards. The data set contains the financial information of all
manufacturers in the Chinese and Indian automobile industry from the year 2006 to
2014. The initial dataset consists of 1,215 observations of 135 Chinese
manufacturers and 1,233 observations of 137 Indian manufacturers. However, due
to the unavailability of data for some major variables, some firms in the sample will
be dropped from the study.
The following steps are carried out in conducting the research.
1. A review of the historical developments of the Chinese automobile industry is
carried out to understand the rudimental elements of the automobile industry
and its relevance to the country’s economy. This will also provide an
9
understanding of the imbedded and potential issues and problems existing in
the automobile industry from 1945 to the present.
2. A comprehensive literature review on the relevant issues within the Chinese
and Indian automobile industries is then conducted. First, a review of the
literature is conducted with regards to the theoretical framework of
competitiveness which forms the fundamental framework behind the cost
performance. Second, a literature review on studies that have examined the
cost performance of various industries in China and in other countries will be
carried out. Third, a literature review that examines the efficiency of various
industries in China and in other countries will also be carried out. Lastly, a
literature review on studies that have examined the various factors affecting
the performance of Chinese manufacturing companies and other countries will
be undertaken to identify the appropriate factors for further examination in this
study. This literature is expected to highlight the gaps present in the current
academic literature which this study aims to fill.
3. A framework for examining the underlined research issues will then be
developed to answer the main research questions of this study. While doing
so, sub research questions on each of the three research questions are
developed and presented. This is followed by identifying the research
methods which will be employed to examine the data on Chinese and Indian
automobile companies. Given the nature of the research problem and the
research questions, ratio analysis with statistical analysis is considered for
examining the cost performance between Chinese and Indian automobile
companies. The data envelopment analysis is used to analyse the efficiency
of Chinese automobile companies, and Multiple Regression analysis on OLS
10
and Panel data is used to estimate the relationship between firm-specific and
performance measurements.
4. Data required for the threefold data analysis is then collected and compiled
from the OSRIS database. The data will be carefully examined and outliers
will be removed. This will be followed by a series of statistical tests to examine
the reliability of the data set for the underlying analysis.
5. Finally, data analysis will be carried out using the three research methods
mentioned above and data will be analysed and interpreted. After this, based
on the results of the analysis, a conclusion will be drawn, answering the
research questions stated in this study. Furthermore, the limitations of this
study will be identified and future research directions will be suggested to
overcome the identified limitations of the study.
1.5 Significance and Contribution
Despite the significance of the automobile industry to the Chinese economy,
there is not a great deal of evidence regarding the importance of the cost and
efficiency performance of the automobile manufacturers as factors contributing to
their overall performance. This study attempts to contribute to fill this gap in the
literature and to provide valuable insights into Chinese automobile manufacturers,
policymakers and other relevant authorities on the following matters.
1. On the basis of the findings of the analysis conducted to examine the cost
competitiveness of Chinese automobile manufacturers, a comparative
comprehensive ratio analysis is undertaken using India as a benchmark. The
study expects to identify specific cost items within the broader areas of
profitability, liquidity and leverage, and examine their relevance. It aims to
take note of where Chinese Automobile manufactures performed well, identify
11
cost items where they have performed poorly, and identify the significant
improvements required to enhance their competitiveness.
2. On the basis of the findings of the analysis conducted to examine the
efficiency of Chinese automobile manufacturers using a comprehensive ratio
analysis, the study expects to identify the specific type of efficiency out of the
broader areas of efficiency (i.e. technical, pure technical, scale and cost)
which is the most crucial. It also aims to take into account where Chinese
automobile manufactures have performed well, the efficiency items where
they have performed poorly, and where they require significant improvements
to enhance their competitiveness.
3. On the basis of the findings of the analysis conducted to examine the
relationship between various factors and the performance of Chinese
automobile manufacturers using a multiple regression analysis, the study
expects to identify factors that require improvements in order to enhance the
competitiveness of the Chinese automobile industry.
1.6 Structure of This Thesis
This thesis is presented in six chapters as follows.
Chapter One of this thesis provides a background and details the motivation
behind conducting this study to examine the cost competitiveness of manufacturers
in the Chinese automobile industry. It also describes the research problem and the
major objectives of this study. Furthermore, research questions and research design
concepts are used to answer the research questions presented in this chapter,
before highlighting the expected contribution and presenting a thesis outline.
Chapter Two presents an overview of the historical development of the
Chinese automobile industry together with the political, economic and social
12
development of the country. It also identifies problems and issues that have plagued
the Chinese automobile industry throughout its development.
Chapter Three presents a review of the academic literature which has
examined the cost performances, efficiency issues and factors affecting the
performance of Chinese manufacturing companies as well as in other countries. This
literature review also identifies research gaps in the literature within the broader
areas of cost management of the global automobile industry.
Chapter Four further analyses the research question using sub-research
questions and presents the research design, data and research methods used in the
study to answer the research questions. It also provides a detailed discussion of the
research methodology, including descriptions of numerous variables used in the
study to examine cost and efficiency performance parameters.
Chapter Five reports the results of the data analysis conducted to answer the
research questions. The chapter is divided into three major sections. Section A
presents the results of the comparative ratio analysis. Section B presents the results
of the DEA analysis used to assess the efficiency of the Chinese automobile
companies. Section 3 presents the results of the multiple regression analysis
conducted to examine the relationships between the factors identified as having an
impact on firm performance, and the performance of the Chinese automobile
companies.
Chapter Six provides a summary of the key findings of the study. It then draws
conclusions based on the results of the threefold analysis conducted in the study.
This chapter also presents the study’s limitations, possible future research directions
and various policy implications.
13
CHAPTER TWO
OVERVIEW OF THE AUTOMOBILE INDUSTRY IN CHINA
2.1 Introduction
China has gone through major economic reforms since the late 1970s. The
economic and political development of the country has required modernisation to be
of paramount importance in all areas of the country. Consequently, the development
of the automobile industry has become one of the prominent measures of economic
growth in China. The automobile industry was set up with “zero foundations” due to
the poor infrastructure remaining as a result of the Chinese Civil War. The newly
constructed roads were occupied by inefficient, low-quality, unattractive and
unreliable vehicles (mainly trucks and agriculture equipment). However, today the
Chinese automobile industry plays an important role on the global stage of
manufacturing and production of automobile vehicles and components. The
advantageous pricing of Chinese products is determined by their cheap labour and
materials costs. These costs are an essential element for assessment in this
research. Such a cost advantage can be understood by reviewing the background of
the automobile industry, which highlights the characteristics that define the formation
of the industry and its surrounding environmental variables.
This chapter will first review the historical development of the Chinese
automobile industry by deconstructing industry development into different time
frames. The first phase is the early production period which spans from 1949 to
1965. The second phase is the development of the automotive industry under reform
policies from 1966 to 1976. The third phase is the industry characterised by post-
Mao development from the 1970s to 1980s. The fourth phase is the new production
phase of the 1990s, and the last phase is the modernised production phase, which
14
occurred after the 2000s. By reviewing its historical development, the issues and
problems of the automobile industry in China are clearly identified. Similar to the
Chinese automobile industry, Indian automobiles also have a cost advantage in
terms of labour and materials costs. Therefore, the Indian automobile industry is
selected for comparison with the Chinese automobile industry. This comparison
highlights the issues and threats to the competitive status of automobile makers in
China. The review of the Indian automobile industry is also conducted in terms of its
developments. This comparison features a distinct understanding of the cost
positions of the manufacturers operating within China’s automobile industry.
2.2 Development of Automotive Industry in China
2.2.1 Early Production and Policies: 1949-1965
The first phase is the early production phase of industrial development in
China which ran from 1949 to 1965. Prior to the production of the first vehicle, the
Chinese car market was mainly relying on imported vehicles. There was no ‘real’
production during the period. The country was relying heavily on agricultural
production and this phase was a non-machinery production phase. In 1949, the
installation of the Communist Chinese Government won the Civil War of China. The
Communist Government of China was desperate to rebuild the country. Thus they
encouraged industrial construction and tried to accelerate the demand for home-
made vehicles. The transportation of resources for agricultural development became
the main focus for the country’s development (Harwit 1995). In 1951, the First
Automotive Works (FAW) was established in Changchun, in the northeast region of
China (Chinacarforums.com 2011).
In 1956, the first ‘home-made’ four-wheel truck – “Jie Fang” meaning
‘freedom’, was produced. In October of the same year, FAW’s construction was
15
completed and it was deemed to be one of the 156 important projects in China’s
“First Five Year Plan”2. In 1957, FAW started manufacturing passenger cars
according to the models made in Western countries. They successfully made the first
CA71 Dongfeng passenger car, and the CA72 Red Flag passenger car. President
Mao later nominated the red flag passenger car to be used in all government
departments. Due to the Great Leap Forward from 1957, usage of cars increased
dramatically in China. The increasing need for passenger cars pushed the
government to set policies on producing cars to suit local needs. In 1964, China had
trialled the China automobile Industrial Company, which aimed to organise and plan
the production volume, capacity and development of the Chinese automobile
industry. However, the industry still lacked core production technical ability and
products to sustain the industry and push further for development.
There were many manufacturers involved in the production of automobiles in
China, among whom the following were prominent. The First Automotive Works
(FAW) who manufactured the “Jie Fang” Passenger car; Nanjing Automobile who
manufactured “Yue Jing” cars; Jinan Automobile who manufactured “HuangHe”
Heavy trucks; Beijing Automobile who manufactured the “Beijing” Jeep and Sichuan
Automobile who manufactured the “HongYan” heavy four-wheel vehicles. In addition,
there were also component manufacturers, logistics companies and motorcycle
manufacturers who were part of the industry during that time.
2 The Five Year Plans in China are a series of social and economic development initiatives which are used to
dedicate the plan for the country’s development in the ensuing five years. The initiatives involve planning for
the foundations and principles of Chinese socialism, designing strategies for economic development,
establishing growth targets and launching reforms. The first Five Year Plan was manifested in July 1955,
however the planning was aimed for the period from 1953 to 1957. It set the key target as the construction of
694 large and medium-sized projects, including 156 projects in collaboration with the Soviet Union. [Online]
available: http://dangshi.people.com.cn/GB/151935/204121/204122/12924999.html
16
During the Great Leap Forward in 1958, the Chinese automobile industry
experienced its first great development. In 27 provinces of China, almost 233 types
of cars were manufactured. However, most of them were subsequently abandoned.
The number of automobile manufacturers increased from only one manufacturer in
the industry in 1956 to 16 manufacturers in 1960. However, during this period, the
Chinese automotive production policy was ineffective in guiding the direction of
automobile companies. The government also lacked experience in managing and
understanding the connections between economic development and vehicle
production. Therefore, many manufacturers were established and expanded just to
suit the proposed governmental plan. This “first great development’ of the Chinese
automobile industry was later considered as a failure due to the substantial waste of
resources and decentralization of industry in the country (Sun et al. 2002). The
technologies and manufacturing plants from the Soviet Union further increased
competition with regards to production in the Chinese automobile industry (Lynch
1965). Since the capacity of production could not meet the required production
conditions, foreign innovation, technologies and equipment were seen as the most
painful of the various constraints upon the Chinese industry.
2.2.2 The Automobile Industry Under Revolutionary Policies 1966-1976
The rudiments of the automobile industry policies were formed during the late
1960s. The goals of the automobile industry were mass production, development of
local production bases in each province to avoid reliance on foreign technology, and
the design of Chinese vehicles to suit local conditions (Baranson 1969). Therefore, in
order to attain the goals of the automobile industry, the government refused to grant
licenses to foreign investors, which might otherwise have had a progressive impact
on local industry (Baranson 1969). With this policy, the government intended to have
17
a “closed economy”, which aimed to manufacture and consume everything in-house.
Although this policy regarding the automobile industry was good for government
control over resources, the control over foreign investment limited the development
of the automobile industry, since the industry required massive advanced
technologies to progress and improve industrial productivity and efficiency.
The second automotive works3 (SAW) was formed by the China National
Automotive Industrial Corporation (CNAICO)4 in order to increase the production of
locally made cars. However, the local consumption of vehicles was controlled by the
central government (CNAICO 2010). The usage of passenger cars was strictly
restricted to high-level officials, while private usage and ownership were prohibited.
As a consequence, the production of passenger cars was dramatically constrained
by the diminished consumption of vehicles (Szuprowicz & Szuprowicz 1978).
According to Harwit (1995), the production of passenger cars in China only
accounted for one percent of total automotive manufacturing in comparison to sixty
to ninety percent of passenger car production in developed countries during the
1960s.
Although the steps required for the automobile industry to develop were tough
and growth was slow (the industrialisation of China started from a zero base, the
central government lacked knowledge regarding the establishment and management
of modern factories to substitute for the old manufacturing process), there were 417
automobile factories all over the country in 1964, and the number increased to 1,950
(including small enterprises) by 1974 (China Automotive Industry Yearbook 1991).
3 The second automotive works (SAW) was founded in 1969, and is now known as the Dongfeng Motor
Corporation since 1992. The creation of SAW aimed to practice the self-reliance policies, however, the
production of vehicles was not fully operational until 1975 (Harwit 1995). 4 The China National Automotive Industrial Corporation (CNAIC) was founded in 1965 to oversee the
automobile firms and set plans for their industrial production (Gallagher 2006).
18
However the production capabilities of local manufacturers (defined as each
producing up to 10,000 units of trucks or other vehicles per year) were still
considered poor in comparison to the United States (where “local manufacturers”
each had an annual production capability of between 200,000 and 400,000 units of
trucks or other vehicles) (Edwards 1966).
When the central government started to construct enterprises for
manufacturing automobiles in the country, the demand for automobiles in the country
surpassed the supply. As a consequence, those manufacturers had to expand their
manufacturing activities in order to meet the excess demand, which created the
second great development (boom) for the Chinese automobile industry. In 1974, the
factories in China increased to 1,950 automobile assembly factories from 417
factories in 1964. However, due to a lack of technology, automobile production had
become repetitive and characterised by low-quality products.
After the founding of the People’s Republic, the industry was developed as a
large-scale vehicle industry with an emphasis on workers’ innovation at the
manufacturing level. However, with the subsequent Great Leap Forward policies, the
industry was pushed forward without professional engineers and new technologies.
This shift was regarded as a failure in the development of the industry. The
inefficiency of the usage and allocation of resources among the producers became
an impediment to the development of the industry, and further enlarged the gap
between the Chinese automobile industry and automobile makers in other developed
countries, especially Japan and the United States.
The policy guiding the automobile industry in China roughly paralleled the
political change during the first 15 years after the country was founded. Mao’s
19
policies greatly influenced the development of the Chinese automobile industry. In
particular, the influences of the Great Leap Forward, which failed to advance the
industry. The following issues existed in the Chinese automobile industry during the
period of the Great Leap (Gallagher 2003).
First, it resulted in an imbalance in the economic infrastructure, leading to
inefficient production in the automobile industry. The volatile development of the
economy also led to inefficient management in resource allocation, causing an
accumulation of waste which resulted in increased costs, low volume and low quality
production.
Second, the self-reliance or closed economy policy for the country led to a
great ignorance of the global market. This changed the competitive environment in
the local market and led to a lack of advanced technology which was needed to
stimulate the development of the automobile industry.
Third, the conflicts between the central government and local governments
resulted in an imbalance of control over vehicle production, volume quota
distribution, and a lack of competitive strategy within the local manufacturing
environment. Since the industry policies were made by the central government,
discrepancies emerged between central and local governments. As a result, local
governments became passive when they executed the policies.
Fourth, unequal distribution of manufacturing sites and over-decentralised
control on resource allocation led to most of the production being located in rural
areas of the country. This resulted in inefficiencies when transporting resources and
further contributed to lowering the performance of manufacturing (Harwit 1995).
20
The above issues summarise the problems that existed regarding the automobile
industry in China. The manufacturing chain connected every single part of production
from business plans, to research and development, manufacturing, purchase and
supply and the final development of a sensible product which is delivered to
customers. The challenges to the automobile industry in China were found in each
part of the manufacturing chain. The following sub-sections are based on reviewing
the historical development of the Chinese automobile industry and will demonstrate
the conditions and issues in the Chinese automobile industry at the production stage.
2.2.3 Post-Mao Era in the Automobile Sector: Late 1970s to 1980s
Due to Maoist political policies and the Cultural Revolution, the Chinese
automobile industry was left with many inefficient factories with small production
scales, greatly reduced manufacturing volumes, and low quality products as a result
of ineffective manufacturing processes and waste. In 1976, with the death of Mao,
the Maoist policies were abandoned by the government. The industry started to face
these issues and made plans more suitable for development in the late 1970s and
early 1980s.The first plan was to end the ‘self-reliant’ manufacturing pattern, since
requesting new technology was essential in order to boost industry efficiency. It also
aimed to limit the total number of factories. During the late 1970s, the increasing
need for specialization and co-operation was growing within the automobile industry
(Zhao and Xiong, 1981). The Chinese automobile manufacturers started to
rationalize and modernize the production process and equipment. Efficiency became
the major criterion in assessing the performance of automobile producers. This was
reinforced by a 1994 government announcement which indicated that inefficiencies
of the industry would cause manufacturers to ‘wither in the face of competition’
(Harwit 2001). At this time, the modernization of factories and the manufacturing
21
process was the first priority in the industrial development agenda. It was claimed by
the government that the aged cars on the road would soon be replaced by newer
automobiles.
There was a rapid growth in the automobile sector in the early 1980s in terms
of production value and volume. According to the Automotive Industry of China
(1989), a notification issued by the China Automotive Technology and Research
Centre, stated that the total production value in 1988 doubled to 37.3 billion renminbi
from 16.46 billion renminbi in 1984 (RMB, the unit of Chinese currency, hereafter
abbreviated as RMB). The figure was 4 times more than the production value in
1980 of 8.84 billion RMB. Although there was a slight change in the production
volume in manufacturing cars in the industry, with 1,819 cars produced in 1975 to
2,600 cars per year by 1985 (China Automotive Industry Yearbook, 1994), truck
production experienced a dramatic increase over the years, from 77,606 in 1975 to
119,501 in 1979 (China Automotive Industry Yearbook, 1991, p.124).
In the meantime, the country was developed with an open-economy which
resulted in significant boosts to trade and the demand for passenger cars to serve as
taxis. Additionally, foreign cars started flooding the local market and industry. Many
foreign manufacturers entered the Chinese market to compete with local brands.
However, issues also started to emerge with foreign vehicles due to competition. For
instance, domestic importers manipulated the selling prices of foreign vehicles and
took advantage of consumers and government policies. This created difficulties for
the government in managing the development of the domestic manufacturing
environment, especially when a great amount of government funding, that was
supposed to be spent on improving the local vehicle market and production, was
taken away by these ‘illegal traders’. As a consequence, the central government and
22
the automotive agencies had to tighten policies on imports. The local industry had a
lack of control and ineffective policies regarding the management of the sudden
inflow of foreign vehicles into China which resulted in market irregularities (Harwit
1995).
The turning point which saved the Chinese automobile industry from chaos
was in the mid-1980s. The automotive industry was at that time guided to increase
production due to the enhanced demand for passenger cars. Joint-ventures were
considered and developed as the most appropriate form for both Chinese automobile
manufacturers and foreign manufacturers, to co-operate and improve the
performance of the Chinese automobile industry in terms of advancing volume
production, quality of cars and technology. This is where “the Five-Year Plan” was
born subject to Chen Zutao, the leader of the CNAIC (Chen 1985). However, the
joint-venture also led to political conflicts when political bureaucracy was imposed on
foreign investors.
The realization of effective production and need for developed technology to
advance the automobile industry pushed the growth of car manufacturing in China
and the economy of the nation (Harwit 1995). However, the growth was insignificant
for the passenger car market. Furthermore, the production of the automobile industry
was mainly dominated by the Shanghai Vehicle Factory and the FAW. Thus, greater
efforts with regards to utilising advanced technologies, increasing production
volumes and bolstering local competition was required if the Chinese automobile
industry was to continue to grow.
At that time, along with the modernization of the automobile industry, the
country was importing foreign passenger cars (China Automotive Industry Yearbook
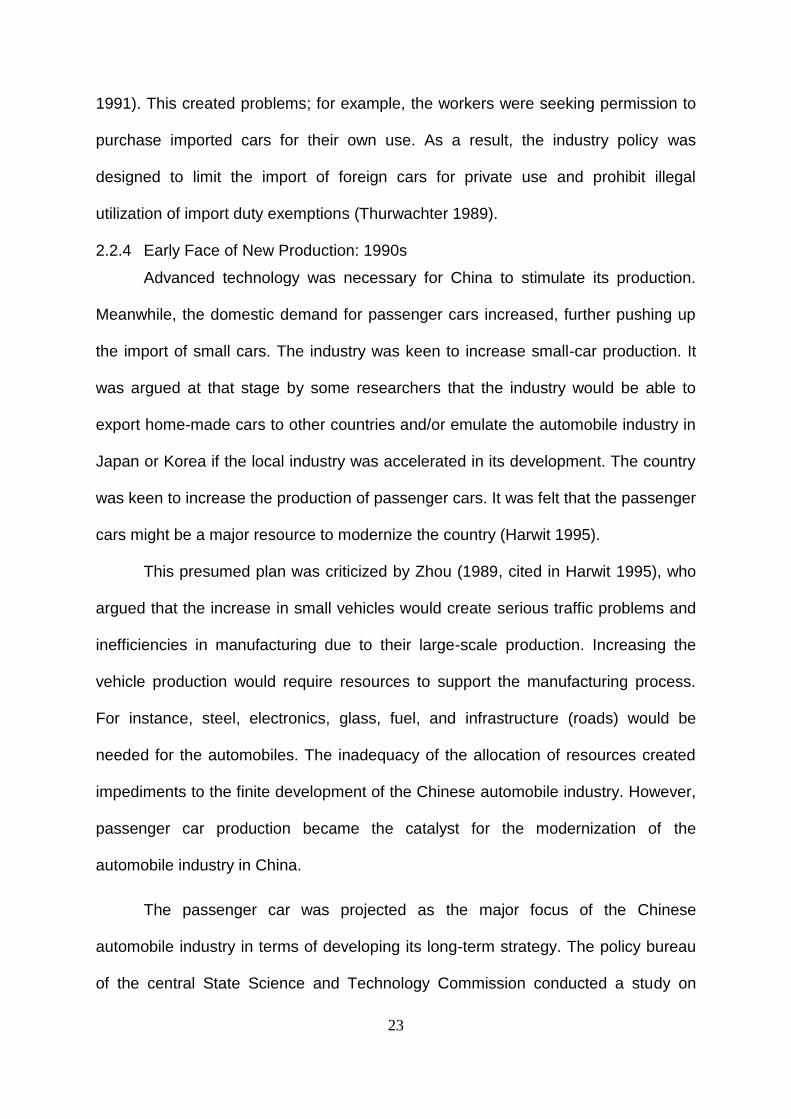
23
1991). This created problems; for example, the workers were seeking permission to
purchase imported cars for their own use. As a result, the industry policy was
designed to limit the import of foreign cars for private use and prohibit illegal
utilization of import duty exemptions (Thurwachter 1989).
2.2.4 Early Face of New Production: 1990s
Advanced technology was necessary for China to stimulate its production.
Meanwhile, the domestic demand for passenger cars increased, further pushing up
the import of small cars. The industry was keen to increase small-car production. It
was argued at that stage by some researchers that the industry would be able to
export home-made cars to other countries and/or emulate the automobile industry in
Japan or Korea if the local industry was accelerated in its development. The country
was keen to increase the production of passenger cars. It was felt that the passenger
cars might be a major resource to modernize the country (Harwit 1995).
This presumed plan was criticized by Zhou (1989, cited in Harwit 1995), who
argued that the increase in small vehicles would create serious traffic problems and
inefficiencies in manufacturing due to their large-scale production. Increasing the
vehicle production would require resources to support the manufacturing process.
For instance, steel, electronics, glass, fuel, and infrastructure (roads) would be
needed for the automobiles. The inadequacy of the allocation of resources created
impediments to the finite development of the Chinese automobile industry. However,
passenger car production became the catalyst for the modernization of the
automobile industry in China.
The passenger car was projected as the major focus of the Chinese
automobile industry in terms of developing its long-term strategy. The policy bureau
of the central State Science and Technology Commission conducted a study on
24
passenger car manufacturing which reinforced the focus on small car production (Su
1987). A decision was made to decentralize the power over the management of the
automobile industry away from the central government. This meant that the central
government moved away from the management of economic decisions for
automotive manufacturers and started playing a supportive role. In 1988, the central
government issued the “Big Three, Little Three” policy (San Da San Xiao) which
meant that the three major manufacturers of automobiles in China, The First Auto
Works in Changchun, the Second Auto Works in Hubei, and the Shanghai Vehicle
Factory were to have a joint-venture with Volkswagen. The three minor players in the
industry later made licensing agreements with Japan’s Daihatsu Motor Company.
They became joint-venture companies of Beijing Jeep, Guangzhou Peugeot, and the
Tianjing Automotive Corporation. This policy was mainly to control the production
output in the industry and also impose restrictions on imports of vehicles from
Western countries.
2.2.5 Post 2000: the Modernisation of the Chinese Automobile Industry
After 2000, the industry started developing quickly in terms of modernising the
manufacturing process. The government’s policies also indicated that it had
developed a better outlook on the contemporary issues related to the industry,
showing effective guidance allowing the industry to move forward. After the year
2000, the automobile industry of China entered a new age of production and sales,
supported by governmental policies. The imported numbers of vehicles would rise if
the tariff rates were reduced by the automobile industry official of China (Harwit
2001). As shown in Figure 2.1, China became the world’s top automobile
manufacturer in 2009, overtaking Japan and has continued to hold its top position
ever since. In 2015, China produced 24.5 million vehicles, which accounted for 27%
25
of the world’s automobile production, while the second placed nation produced 12.1
million, accounting for 13.3% of the total production. In fact, since 2009, annual
production of automobiles in China has exceeded that of the European Union or that
of the United States and Japan combined.
Figure 2.1: Total Annual Vehicle Production, 2006-2015
Data source: Production statistics, Organisation International des Constructeurs d’Automobiles (OICA), 2016.
The foreign joint ventures with local manufacturers required flexibility of
production and distribution as a condition of China joining the WTO. The price was
maintained to be competitive due to WTO tax cuts. The main focus among the major
players, such as the major foreign car manufacturers and governmental institutions,
was on the ‘sound improved efficiency’ (Harwit 2001). However, from that point in
time, Chinese automobile manufacturers were expected to produce high quality
products with greater efficiency (Ding and Xiao 2010).
The current conditions of the Chinese automobile Industry are discussed in
the following section. The issues discussed are market structures, product range as
well as opportunities and challenges that the industry is currently facing.
The manufacturing structure of the industry is driven by rising household
income. The increasing purchasing power of a household in the “open-economy” and
0
5000000
10000000
15000000
20000000
25000000
30000000
2006 2007 2008 2009 2010 2011 2012 2013 2014 2015
China
USA
Japan
Germany
South Korea
India
Mexico
Spain
Brazil
26
government allocation of resources in regional areas, have led to a sharp increase in
the sales of automobiles in 2014, with 23.7 million vehicles sold. The yearly increase
in production is estimated at 7.3% (The Automotive Market in China 2015).
Furthermore, government policies to increase the urbanisation of the country have
boosted the demand for vehicles. Due to the open-economy, many foreign firms are
flooding the Chinese automotive industry in the form of joint-ventures. Currently,
62% of the passenger vehicle segment is dominated by foreign brands and 90% of
the commercial vehicle segment is dominated by domestic brands (The Automotive
Market in China 2015). The Ministry of Industry and Information Technology (MIIT)
reported that there were 153 million registrations of vehicles in 2014 which is
forecasted to exceed 200 million by 2020. This surge in the vehicle market is mainly
due to the fast growth of the Chinese economy, low sale prices of domestically
manufactured vehicles manufactured (due to low cost labour and materials) and
increased demand from urban areas.
According to the plan issued by the government in 2012, the Chinese
automobile industry is considered to be the pillar industry of the economy of China .
The strong GDP growth rate and income growth, low penetration rate, strong
demand from the lower tier cities, declining prices of vehicles and government
support, are the key drivers of growth for automobiles in China. The GDP in 2014
had reached RMB 63.6 trillion dollars in 2014. This should support the automobile
industry to grow further and provide a boost in automobile sales. However, the
consumption of automobiles is still low in China as at the end of 2014 (105 units per
1,000 people), which is below the global average (140 units per 1,000 people).
Government policies to develop low tier cities, the demand for vehicles in many
regions such as Beijing, Shanghai and Guangzhou will lead to an increase in the
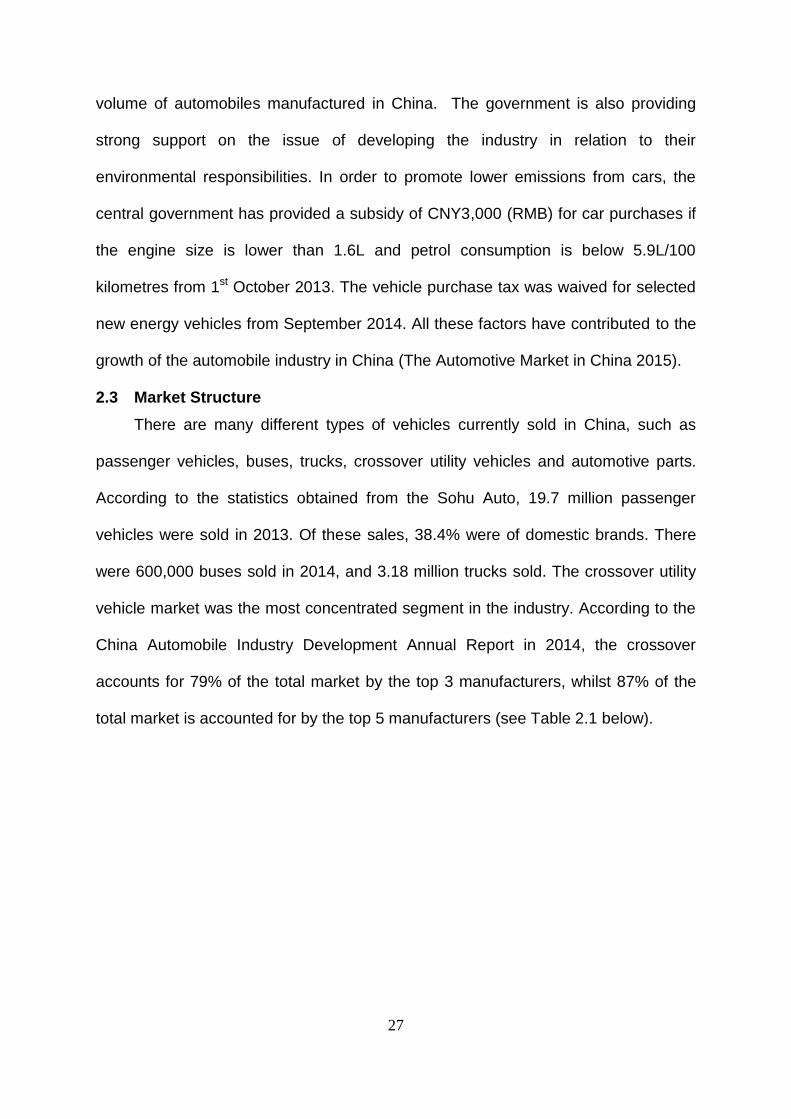
27
volume of automobiles manufactured in China. The government is also providing
strong support on the issue of developing the industry in relation to their
environmental responsibilities. In order to promote lower emissions from cars, the
central government has provided a subsidy of CNY3,000 (RMB) for car purchases if
the engine size is lower than 1.6L and petrol consumption is below 5.9L/100
kilometres from 1st October 2013. The vehicle purchase tax was waived for selected
new energy vehicles from September 2014. All these factors have contributed to the
growth of the automobile industry in China (The Automotive Market in China 2015).
2.3 Market Structure
There are many different types of vehicles currently sold in China, such as
passenger vehicles, buses, trucks, crossover utility vehicles and automotive parts.
According to the statistics obtained from the Sohu Auto, 19.7 million passenger
vehicles were sold in 2013. Of these sales, 38.4% were of domestic brands. There
were 600,000 buses sold in 2014, and 3.18 million trucks sold. The crossover utility
vehicle market was the most concentrated segment in the industry. According to the
China Automobile Industry Development Annual Report in 2014, the crossover
accounts for 79% of the total market by the top 3 manufacturers, whilst 87% of the
total market is accounted for by the top 5 manufacturers (see Table 2.1 below).
28
Table 2.1: Market Concentration by Segment
Type Top 3 Top 5
Sedan 34% 46%
MVP 63% 75%
SUV 30% 42%
Cross-over 79% 87%
Heavy Duty track 54% 83%
Medium Duty Track 57% 71%
Light Duty Track 42% 59%
Mini Track 69% 84%
Large Bus 53% 66%
Medium Bus 50% 61%
Light Bus 44% 58%
Source: 2014 China Automobile Industry Development Annual Report, The automotive market in China, 2015, p.13.
The automotive parts sector is facing severe competition, since foreign
enterprises have started to take market share from domestic manufacturers.
2.4 Industry Performance
Due to the Financial Crisis of 2008, exports decreased by 20.8% due to weak
demand from the overseas market (the foreign market might not recover from the
financial crisis). In 2009, the central government introduced a series of measures to
stimulate the sales which were damaged by the Financial Crisis in 2008. These
measures included a reduction in sales taxes and direct subsidies to rural
households for purchasing automobiles. The annual sales grew vastly in 2009 and
increased by 47.8% from 2008 to 2009. This increase went “viral” in 2010. However,
the economy slowed down in 2011 and the central government introduced policies to
limit the consumption of vehicles in large cities, such as Beijing, Shanghai and
Shenzhen (due to over usage of the roads) (Tang 2012). This led to a decrease in
consumption of commercial vehicles by 5.5%. However, the overall sales of vehicles
in 2013 experienced 13.9% growth (22 million vehicles). In 2014, although the
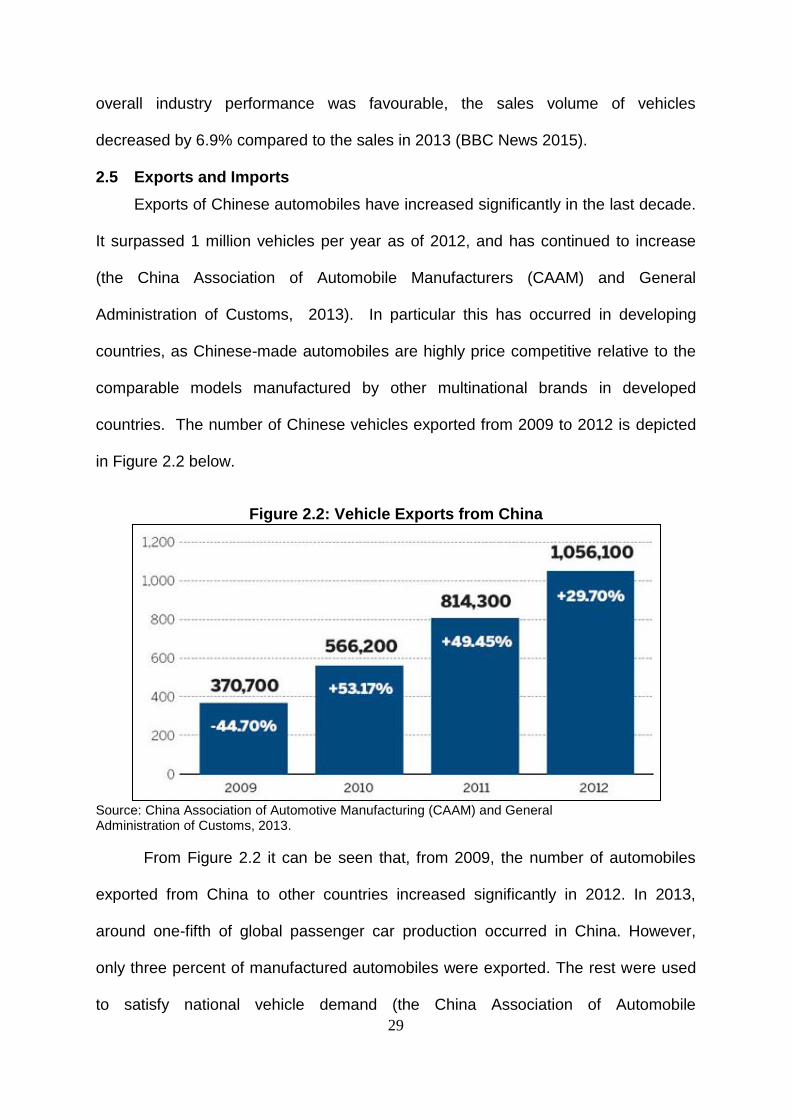
29
overall industry performance was favourable, the sales volume of vehicles
decreased by 6.9% compared to the sales in 2013 (BBC News 2015).
2.5 Exports and Imports
Exports of Chinese automobiles have increased significantly in the last decade.
It surpassed 1 million vehicles per year as of 2012, and has continued to increase
(the China Association of Automobile Manufacturers (CAAM) and General
Administration of Customs, 2013). In particular this has occurred in developing
countries, as Chinese-made automobiles are highly price competitive relative to the
comparable models manufactured by other multinational brands in developed
countries. The number of Chinese vehicles exported from 2009 to 2012 is depicted
in Figure 2.2 below.
Figure 2.2: Vehicle Exports from China
Source: China Association of Automotive Manufacturing (CAAM) and General Administration of Customs, 2013.
From Figure 2.2 it can be seen that, from 2009, the number of automobiles
exported from China to other countries increased significantly in 2012. In 2013,
around one-fifth of global passenger car production occurred in China. However,
only three percent of manufactured automobiles were exported. The rest were used
to satisfy national vehicle demand (the China Association of Automobile
30
Manufacturers, CAAM). The national demand has increased significantly over recent
years, due to the increase in household income and living standards. A large middle
class population has facilitated the consumption of cars and also burst the Chinese
vehicle market. The increase in the number of exported automobiles to other nations
indicates a significant cost advantage of Chinese automobile manufacturers relative
to other countries. Exports of automobile parts have increased by 9.6% from 2010 to
2015 (IBISWorld Industry Report 2016). The rate increased to 36.6% growth in 2010
due to the recovery of the global economy.
Imports have also increased during the past five years. This is due to the
demand for high quality products in China, which are imported (automobiles and
components). Domestic manufacturers are subsequently facing great pressure to
produce high quality and specialised automobile parts.
2.6 Manufacturing Environment
In this study, the Chinese automobile industry is divided into two main sectors,
automobile manufacturing and component manufacturing. They can be further split
into auto part replacement and the original equipment manufacturing. However,
vehicle production and sales are mainly driven by large foreign and domestic firms
due to their large capital share and scale of production. As shown in Table 2.2, the
automotive segments in China consist of manufacturing passenger vehicles, buses,
trucks, semi-trailer tractors and automotive parts.
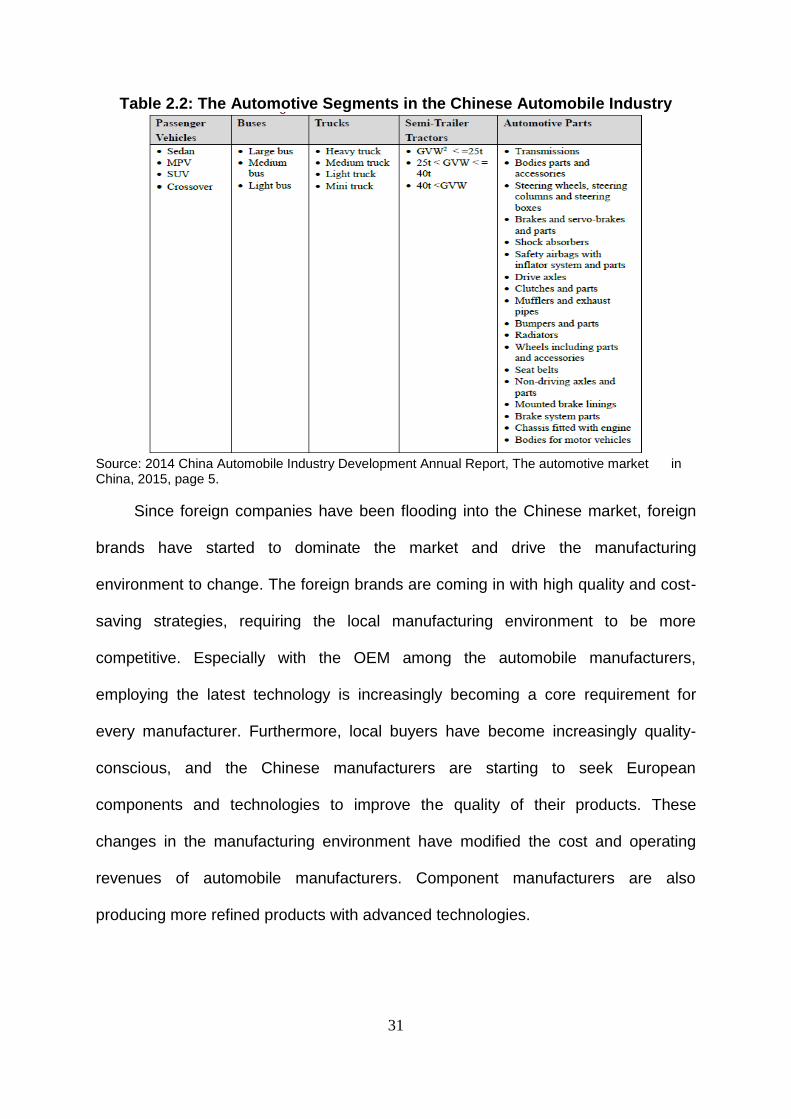
31
Table 2.2: The Automotive Segments in the Chinese Automobile Industry
Source: 2014 China Automobile Industry Development Annual Report, The automotive market in China, 2015, page 5.
Since foreign companies have been flooding into the Chinese market, foreign
brands have started to dominate the market and drive the manufacturing
environment to change. The foreign brands are coming in with high quality and cost-
saving strategies, requiring the local manufacturing environment to be more
competitive. Especially with the OEM among the automobile manufacturers,
employing the latest technology is increasingly becoming a core requirement for
every manufacturer. Furthermore, local buyers have become increasingly quality-
conscious, and the Chinese manufacturers are starting to seek European
components and technologies to improve the quality of their products. These
changes in the manufacturing environment have modified the cost and operating
revenues of automobile manufacturers. Component manufacturers are also
producing more refined products with advanced technologies.
32
2.7 Establishments and Wages
The manufacturing environment in China has changed vastly since 2000. Many
foreign manufacturers have brought advanced technologies to the manufacturing
environment as a result of joint ventures or mergers and acquisitions. This has
changed the local manufacturing environment, and domestic manufacturers have
started to focus on the market positions of domestic products, increasing their
market share and widening sales networks, all the while maintaining their cost
advantages.
However, the total industry average wages have also increased significantly in
the last five years. The average annual wage per employee has increased from RMB
6,848.7 in 2009 to RMB 10,343.7 in 2015 (Understand China 2016; Yao and
Rosettani 2015). This indicates there has been a great surge in labour costs in China
and also that there has been pressure from management regarding the labour cost
advantage.
2.8 Technology and Economies of Scale
According to the manufacturing report produced by the IBISWorld Industry
Report (2016), although the automobile industry has developed significantly in past
years, the manufacturers in the industry still apply backward technologies.
Economies of scale in the industry have not been completely developed yet. Many
small and medium enterprises operate in the industry alongside large manufacturers
(state-owned enterprises) who have large market shares and production scales.
Many small and medium manufacturers only produce a single product to supply to
the market at low prices. Small scale operations for these manufacturers limit their
capabilities to source advanced technologies which can improve their production
capacity and productivity. However, according to the manufacturing report, this
33
problem not only exists for small and medium manufacturers. Even large
manufacturers have limited capabilities to produce advanced or high quality
products. Products such as acoustic systems, automobile special-purpose ICs
(integrated chips), high-end sensors, and microprocessors, are still sourced from
developed countries. Although the Chinese-made products have the advantage of
lower costs in the market, the expensive materials, such as aluminium, magnesium,
titanium and some advanced plastic materials are not used in the products
manufactured by the Chinese automobile industry (Velso and Kumar 2002).
Another issue in this regard is the cost of research and development. The
domestic manufacturers have weak research and development capabilities due to a
lack of capital for investment. They fail to meet the demand of buyers who require
high quality products or parts within the fast growing automobile manufacturing
industry. The pressures from foreign automobile manufacturers who bring advanced
technology into China with patents and intellectual property rights further worsen the
competitive positions of local manufacturers.
2.9 Industry Globalisation and Increasing Competition
Industry globalization will be a major trend in the future as manufacturers
expand export markets, while continuing to satisfy domestic demand. China will
continue to be one of the largest manufacturers of automobile parts and accessories
in the world. However, the growing penetration level of foreign capital into the
automobile industry will further threaten the local automobile manufacturers. The
foreign investors are supplying high-end products, such as electronic controls, fuel
injection systems, and brake systems, and as a consequence, this will intensify the
competition in the domestic manufacturing environment (Sturgeon and Van
Biesebroeck 2010).
34
The ever-increasing competition from foreign competitors has become the key
concern for the automobile manufacturers. Many small players in the market are
however, experiencing low efficiency levels. This is due to their small scales of
production, low concentrations, and disorderly competition which inhibit the
development of the industry.
To maintain a consistent profitability level is challenging for automobile and
component manufacturers. Rising raw material costs and labour wages is likely to
further intensify the pressures on manufacturers, especially in the face of managing
a competitive market position against foreign manufacturers.
2.10 Social Issues- Sustainability and Corporate Social Responsibilities on Automobile Industry
One particular environmental problem in China, known as “grey smog”, rings
the alarm for the central government of China. The pollution has been described as
an “extraordinary and unnatural phenomenon” for the Chinese public (Floto 2014).
The globalised economy has brought increased fortune to the overall population, but
the growth has not translated into a better quality of social life. The environmental
disaster is no longer only an environmental degradation risk. The rise of
manufacturing, greater usage of cars and soaring energy demand has elevated the
issue of pollution to become a “huge political risk”. The automobile industry is central
to this issue. Increasing sales and production of vehicles in China have significantly
worsened the country’s environmental problems (Albert and Xu 2016).
The central government issued an announcement on the development and
plans for energy control and new-energy for the automobile industry in 2012. This
announcement focused on the environment. The automobile industry in China aims
to produce more than 200 million energy-saving cars by 2020 (Ma and Bi 2011). At
35
the same time, it plans to bring new technologies into manufacturing to facilitate
energy-saving and innovation such as new-energy cars which will act as key drivers
to allow the industry to grow.
2.11 Issues and Problems for the Automobile Industry in China
From this historical review of the automobile industry in China and the current
condition of the industry, it is clear that the Chinese automobile industry has its own
unique characteristics; for instance, its potential for large-scale production and low
labour costs. However, with increasing customer awareness of quality and foreign
brands, the industry itself is facing great challenges not only from global competitors,
but also from internal factors which have impedimental impacts on their production
(Harwit 1995;):
1) The auto component parts manufacturers are having difficulties in getting
advanced technologies due to monetary constraints.
2) The existing distribution networks and levels of brand recognition limit the
manufacturers’ abilities to develop long-term manufacturing strategies.
3) The market in China is geographically spread widely across the entire
country. Thus effective distribution networks are critical for allowing the
manufacturers to distribute products effectively to retail outlets
4) Since most of the automobile manufacturers in China are OEM, the lack of
brand recognition will constrain sales of other brands in the local market.
5) Cheap labour, which is essential to the survival of manufacturers in China, d
is one of the cost advantages that give manufacturers their edge. Having
sufficient and skilled labour is becoming a more expensive and critical issue
for automobile manufacturers. This is because utilising a skilled workforce is
36
necessary to deliver quality products and maintaining high operating
revenues.
6) There is rising competition from domestic players in winning the OEM
contracts. Although restrictions on foreign investments have been relaxed in
recent years and new innovations are rationalizing and modernizing the
production process of the Chinese automobile industry, the cost competitive
advantages of Chinese automobile manufacturers are not necessarily
assured.
7) The great advances in the Chinese automobile industry and its sales volume
and production have put pressure on the development of local infrastructure.
There is doubt whether the current local infrastructure will be able to cope with
the increasing number of automobiles being produced.
8) This also brings into consideration the environmental issues which
accompany the increasing usage of automobiles in the country. This causes
further pressures to be inflicted on automobile manufacturers in developing
new models to satisfy environmental regulations and manage sales at the
same time.
To assess the competitive status of the Chinese automobile industry, the Indian
automobile industry is considered for comparison. This is because the Indian
automobile industry shares similar phases of development from a historical
perspective, and also rivals Chinese automobile manufacturers regarding their
competitive cost advantage for global buyers. The following section discusses the
historical development of the Indian automobile industry and highlights the
importance of utilising the Indian automobile industry for comparison, in order to
assess the relative cost status of Chinese automobile manufacturers.
37
2.12 The Evolution of India’s Automobile Industry
The automobile industry in India has experienced increasing growth since the
liberalization of its industry policies, leading to expanding domestic demand and
export opportunities. The rapid transformation of India’s automobile industry at
present is providing great opportunities for the industry to grow. However, the status
of India’s automobile industry as an epi-centre for global investors has undergone
many phases of developmental hardship. The following section aims to demonstrate
the evolution of India’s automobile industry in four major phases; the first phase is
the government intervention era (1947 – 1965), the second phase is the increased
regulation and disparate segmental growth phase (1966 -1979), the third phase is
the limited liberation and foreign collaborations phase (1980 -1990) and the fourth
phase is the liberalization and globalization phase (1991 onwards).
2.12.1 Government Intervention Era: 1947-1965
The automobile industry in India has been established since the 1940s with
the production of the Morris Model (named the ‘Ambassador’) (Lee and Anderson
2006). With the social and economic conditions of India in mind, the central
government under the prime ministerial leadership of Jaawharlal Nehru proposed a
mixed economy for the country. This meant that issues of ‘what to produce’, ‘how to
produce’ and ‘how to distribute’ were controlled by the central government. This was
reinforced by the introduction of the Industrial Policy Resolution (IPR) which was
passed by the Indian Parliament in 1948, representing a significant level of state
intervention. Within the resolution, the automotive industry was categorized as one of
the ‘basic industries of importance’. According to the policies outlined in the IPR of
1948, the development, distribution of production, and the location of automotive
38
production, all of which demand economic resources and investments, are controlled
by the central government (Singh 2016).
In addition to highlighting the role of the state in automotive industrial
development, the IPR of 1948 also proposed that the state held the power to order
the raising of tariff barriers. This was proposed in order to avoid unfair foreign
competition and further ensure the mindful use of national foreign reserves. The first
automotive industrial policy was introduced in 1949 by the Ministry of Industry to
determine an amplified tariff on imported vehicles, which practically minimized the
amount of imported vehicles. However, foreign assemblers were permitted to
assemble CKD vehicles in the country. Meanwhile, PAL assembled Dodge-Fargo
trucks and HML assembled Studebaker trucks, which started quite early in this
phase, and led to a dramatic increase in the manufacture of trucks. As a
consequence, the side-manufacturing sectors, such as the repair and replacement
sectors, were also developed to complement the increased number of vehicles in the
country.
In 1951 a licensing system was established and implemented by the
Industries (Development and Regulation) Act (IDRA), in pursuance of the IPR of
1948. According to the Act, the industrial license requires that 50 or more workers
are needed to establish a new ‘unit’ and subsequently expand their output by 5%
annually (Kathuria 1996). Meanwhile, a Five-Year-Plan (FYP) was also introduced
for economic planning in India. A planning commission was established to oversee
the formulation and implementation of the FYP. The commission was assigned to be
responsible for assessing all the resources of the country, and ensuring the effective
and efficient use of available resources. With respect to the automobile industry, the
39
commission was responsible for the total volume of vehicle production in accordance
with the country’s needs and resources at its disposal.
In 1952, the Tariff Commission came to provide assistance to the automotive
industry to replace the hitherto ‘gut-reaction’ policy. Later, the Tariff Commission
recommended that the industry only allow units with plans for the progressive
manufacture of components and complete vehicles to operate in the country. In the
meantime, the government also recommended imposing more control on the sale
prices of manufactured vehicles. As a consequence, General Motors and Ford
closed down their operations in India due to low demand. At this time, India’s
automotive industry was considered to be exempt from foreign competition. By
imposing this progressive manufacturing program in the automotive industry, the
automobile firms adapted to the ‘self-reliance’ policy that was in alignment with the
government’s goals.
With the introduction of a second FYP which was effective from 1956 to 1961,
the automotive industry in India aimed to achieve rapid growth in terms of production
capacity, the boosting of local manufacturing volumes, the attraction of investment
from the public sector, and the maintenance of low production costs. However at the
time of the second FYP manufacturers in India were only permitted to produce one
model of vehicle per manufacturer. Due to the dramatic decrease in supply, the
prices of vehicles also increased. An ‘Informal price control’ mechanism was
consequently introduced to adjust the unjust price of the vehicles and provide
protection to the automotive industry.
The performance of automobile manufacturers in India during the 1950s was
not satisfactory due to the low quality of production and high costs in the
manufacturing process. In January of 1960, the L.K.Jha Committee reported the
40
issues existing in the automotive industry, which were neglect and inefficiencies in
production due to a lack of local competition. As a result, the committee
recommended developing a local automobile component industry to improve the
quality of production and achieve cost reductions. Moderate levels of foreign
collaborations were introduced along with in-house automobile manufacturing. As
such, the third FYP (1961-1966) was aimed at developing a local manufacturing
environment and escalating competition among the indigenized automobile and
component manufacturers. At this time, the priority of production was to manufacture
CVs and 2-wheelers (GOI 1961).
2.12.2 Segmental Growth: 1966-1979
During the 1960s, the economic conditions in India become increasingly poor
due to poor agricultural production, severe weather conditions and financial crises.
Although the International Monetary Fund provided some assistance, the country’s
situation led to an incapability to formulate and implement a fourth FYP. When Mrs.
Indira Gandhi was elected as the Prime Minister in 1967, the automotive policies
were altered by the central government. For instance, in 1966, the Tariff Commission
was asked by the government to look into the issues related to the cost structure and
selling prices of automobiles and provide protection to the industry. After the
investigations, the Tariff Commission recommended that the government maintain a
minimum efficiency level of the manufacturing process and impose price controls on
passenger cars. These recommendations became effective in September 1969.
The other impediment to the development of the automotive industry in India
was the Oil Crisis in 1973, which led to a steep rise in prices of common goods
including fuel. Due to the high price of oil, the demand for vehicles decreased
dramatically, which worsened the market for passenger cars. In order to regulate the
41
automobile industry, the government later removed the informal price controls on 2
or 3 wheelers and put in place statutory enforcement to relieve price controls on
passenger cars in 1975. In 1974, the Fifth FYP (1974-1979) was introduced and
aimed at increasing annual production of CVs to 60,000, 320,000 2 wheelers and
32,000 passenger cars by 1979 (GOI 1974).
In the 1960s, there were 800 Maruti produced by the joint venture between
Japan’s Suzuki and Indian carmaker Maruti (Basu 2003). Along with relaxed
government policies on foreign investments, joint ventures played an increasingly
dramatic and crucial role in the Indian automobile industry. According to Choudhury
(2006), Premier Automobiles Ltd. India now had the capacity in 2006 to produce
60,000 cars a year subject to its joint venture with Fiat Ltd.
2.12.3 Limited Liberalization and Foreign Collaborations: 1980 to 1990
From 1980 to 1990, the automotive industry in India developed into a
competitive manufacturing environment, with government allowances of an adequate
import of technology from foreign investors which was required for modernization.
The Sixth FYP (1980-1985) was introduced to improve vehicle exports. A
considerable level of liberalization and foreign collaboration; for instance, the import
of capital goods, technology and raw materials/components which were necessary
for achieving modernization of the automotive industry, were escalated during this
phase. Four Indian firms were permitted to pursue joint manufacturing of
automobiles with foreign car manufacturers, such as, Swaraj Mazda, DCM Toyota,
Allwyn Nissan and Eicher Mitsubishi, who commenced their production in 1985.
From then on, the Indian Automotive industry was deemed to be actively
participating in achieving competitiveness in both price and quality. Maruti Udyog
42
Ltd. (MUL) was one example of a state-owned enterprise having collaborations with
Suzuki in 1982.
Further, with the relaxation of the import policies, advanced technology was
introduced to local manufacturers which improved the fuel efficiency of locally
manufactured vehicles. Collaborations with Fiat (Italy), direct imports from Nissan
(Japan) for their fuel efficient Nissa engine, and purchased rights to manufacture the
Vauxhall Victor model from Vauxhall Motors (UK) all indicated a new era for the
automotive industry in India. The relaxation of regulations and more open import
policies had changed the industry fundamentally.
2.12.4 Liberalization and Ensuing Globalization: 1991 onwards
The government adopted a new policy in 1991 which aimed to liberalize the local
economy for foreign investors. With the introduction of a new industrial policy, the
automotive industry was considered to be creating a more competitive environment
where barriers to entry and growth of firms were removed. Some important policies
relevant to the development of the automotive industry are highlighted as follows
(GOI 2008b):
1. The industrial licensing system was abolished.
2. Automatic approval of FDI of up to 51% equity in the automotive industry was
instituted.
3. Automatic approval of permission for foreign technology agreements in the
automotive industry was instituted.
During this phase, the major change to the automotive industry was the
delicensing of the auto-component segment in July 1991 as well as the delicensing
of the passenger car segment in May 1993. With the liberalization of the industrial
policy, the local manufacturers were capable of adjusting their strategies according
43
to commercial judgements. For instance, they now had the freedom to exit or enter
the market and merge with other automobile manufacturers. Foreign investments
were also liberalized at this phase. Foreign direct investment was allowed
automatically if the equity component of foreign investors was below or equal to
51%. If the equity portion was above 51%, it required governmental permission
based on the evaluation of the projected exports, and the sophistication of the
technology required.
With this liberation, the automotive industry recovered from the negative growth
during 1991 and 1992, and became even better after the reform of the industrial
policy. Further, the reduction in tariffs and the internationalization of the currency
(Rupee), escalated the growth of the local market and globalized India’s automotive
industry.
In the meantime, the passenger car segment also experienced growth due to the
relaxation of government policy. With the entrance of foreign automotive firms, the
local automobile manufacturers learned to use foreign technology to further develop
their products to be suitable for indigenous design, domestic safety and
environmentally safe use in India. These collaborations included Mercedes-Benz
with TELCO, General Motors with HML and Peugeot with PAL in 1994, Daewoo with
the acquisition of DCM-Toyota and Honda Motors with Siel Ltd. in 1995, Ford with
M&M, Hyundai with a 100% subsidiary in 1996, Fiat with Tata Motor and Toyota with
the Kirlskar Group in 1997.
Due to these major developments in the Indian Automotive industry, the Auto
Policy 2002 was introduced by the government to address the issues the industry
had faced, and to assist the further development of the local industry in order to be
globally competitive and compatible with its World Trade Organization (WTO)
44
commitments. According to the Auto policy 2002, an automatic approval of foreign
equity investments of up to 100% for automobile and automobile component
manufacturing was granted. Furthermore, research & development activities were
greatly encouraged by the Auto Policy 2002. With the Auto Policy 2002 continuing to
apply even today, the production in India’s automotive industry had increased to
4,271,327 2-wheelers, 564,052 cars, 162,508 CVs, 212,748 3-wheelers and 105,667
UVs in 2002 (SIAM 2008f).
The local conditions of India also reflect the prosperity of the Indian
automobile industry. In the past ten years, the production of cars and SUVs has
increased by more than 500,000 units. This number is almost double the production
in 1995. Not only have the improvements been made in the production capacity, but
also in regards to the increasing concerns of managing quality products (Basu 2003).
Thus, the automotive industry in India has become more competitive,
globalized and technologically advanced due to its global entrance into the Chinese
market. The changes have been brought in not only by the increasing demand from
the local civilians, but also by the attention from global manufacturers, who intend to
develop the Indian Automotive industry into an international manufacturing hub with
good control on the cost of manufacturing and potential to produce high quality
vehicles.
2.13 Importance of Comparison of Automobile Industry in China with India
India shares a similar pathway with China in the field of the automobile
industry. For instance, both operate under heavy influence from government policies,
have undergone structural change, have encouraged foreign investment and
employed foreign technology (Dangayach and Deshmukh 2001). As at 2005, India
was regarded as the fourth largest car market in Asia and provides cost savings in
45
labour of up to 30% as compared to the auto giants in the U.S., Japan, and Germany
(ACMA 2007).
The competitive environment of the Indian automobile industry has also
changed. It has been indicated by Dangayach and Deshmukh (p.2, 2001) that the
new competition facing Indians is in terms of “reduced cost, improved quality,
products with higher performance, a wider range of products and better service, and
all delivered simultaneously”. This objective is consistent with the industry goals of
China. Further, with a large English speaking college-educated workforce, India has
the ability to achieve cost savings without compromising quality and to surpass
China in the future.
Although Indian manufacturing industries have gone through economic reform
since the early 1990s, there are many problems that still exist in the production
environment. A lack of proper infrastructure, the high cost of capital, and a lack of
economies of scale resulting from the protectionist regime, highlights the factors
contributing to any evaluation of the performance efficiency of firms in the Indian
automobile industry (Saranga 2009). As indicated in the above discussion,
comparison is necessary for assessing cost competitiveness by looking at the
operational performance of the automobile industry in different countries.
2.14 Summary
The chapter has provided a review of the historical development of the Chinese
automobile industry and identified a number of major issues that it is facing today.
The issues confronted by the Chinese automobile industry in its early stages include
the production inefficiencies caused by imbalanced economic infrastructure, a lack of
technology for mass production and conflicts between the central government and
local governments which resulted in serious inefficiencies in the industry. However,
46
more recent challenges have been mainly caused by increasing costs of production
and competition from other major players in the automobile market.
The chapter also highlighted the major features of the automobile industry
today, providing descriptions of the market structure, industry performance, exports
and imports performance, the current manufacturing environment, the current wage
structures, technology, globalisation, and other related social issues including
sustainability and corporate social responsibility. In addition to providing background
information on the Chinese automobile industry, this chapter also provided
background information on the Indian automobile industry. This provided
benchmarks for comparing the various measures of performance of the Chinese
automobile industry in Chapter Five of this thesis. The review on the historical
development of the Indian automobile industry revealed that it was subjected to
structural changes similar to those undergone by the Chinese automobile industry,
and therefore has achieved significant development in the industry with the full
backing of the Indian government. These developments in the automobile industry of
India have created the need for the Chinese automobile industry to assess its
relative strengths and weaknesses with a view to take the necessary actions to
enhance its cost competitiveness.
47
CHAPTER THREE
LITERATURE REVIEW
3.1 Introduction
As discussed in the previous chapter, the extensive number of issues facing
the automobile industry in China needs to be examined. These issues are
associated with the post-manufacturing stage during the post reform period. They
include: the low competitive status of Chinese automobile manufacturers relative to
newly-developed Indian automobile manufacturers (Feurer and Chaharbaghi 1994;
Dangayach and Deshmukh 2001), low efficiency levels due to the poor conditions in
the Chinese economy (Sun et al. 2002; Ding and Xiao 2010) and negative
implications of Chinese central government policies (Harwit 2001).
This chapter reviews the relevant literature that debates the evaluation of cost
performance and efficiency in the Chinese automobile industry. The current literature
on the cost performance and efficiency primarily concern other industries and other
countries, and lacks analysis of the cost performance and efficiency of the Chinese
automobile industry. Therefore this chapter, while reviewing the existing relevant
literature and highlighting the gaps in that literature, will also provide background to
the research problem and research questions of this study which are presented in
the next chapter.
This chapter is divided into eight sections. Following the above introduction, the
literature on the theoretical framework of cost competitiveness is presented in
Section 3.2 to provide guidance on how to investigate the cost positions of
automobile manufacturers. Section 3.3 provides a review of previous studies on cost
performance, including studies that used financial ratios while Section 3.4 reviews
the literature on the performance of the industry. Section 3.5 discusses efficiency
studies conducted with respect to the automobile industry using Data Envelopment
48
Analysis (DEA). Section 3.6 reviews earlier studies on various factors that have
impacted on firm performance, such as ownership structure, capital structure,
operating leverage and the sustainable growth rate of firms. Section 3.7 contains
concluding comments and transitions this study into the following chapter where
research methodologies are used to answer proposed research questions. Finally,
Section 3.8 provides a summary of the chapter.
3.2 Theory of Competitiveness
Competitiveness is proposed by Bloodgood and Katz (2004) as having a direct
relationship to a firm’s capacity, market share and number of potential competitors.
This means the larger the firm’s capacity is, the more competitiveness it has, and the
more potential competitors there are. Payne et al. (2009) extends this statement and
demonstrates that firms do not exist independently. Thus, in order to evaluate the
competitiveness of firms, competitors should also be taken into account. Gaining a
comparative advantage is also proposed as a competitive process. This involves the
adjustment of resources and output into certain areas in order to bring returns
flowing back in a manner which reduces a firm’s cost of capital (Jacobson & Hansen
2001). Furthermore, the empirical view of Porter (1985) outlines that cost leadership
and product differentiation form the foundations of gaining comparative advantage in
a given industry (Horngren et al. 2009).
Along with the development of industry and the globalized business
environment in China, joint ventures with foreign investors are viewed as effective
strategies to improve organizations’ competitive positions (Zineldin and Dodourove
2005). However, in order to have a thorough understanding of the competitiveness of
firms or an industry, a more in-depth analysis of their performance in relation to cost
is required. Therefore, this study uses a theoretical framework on competitiveness
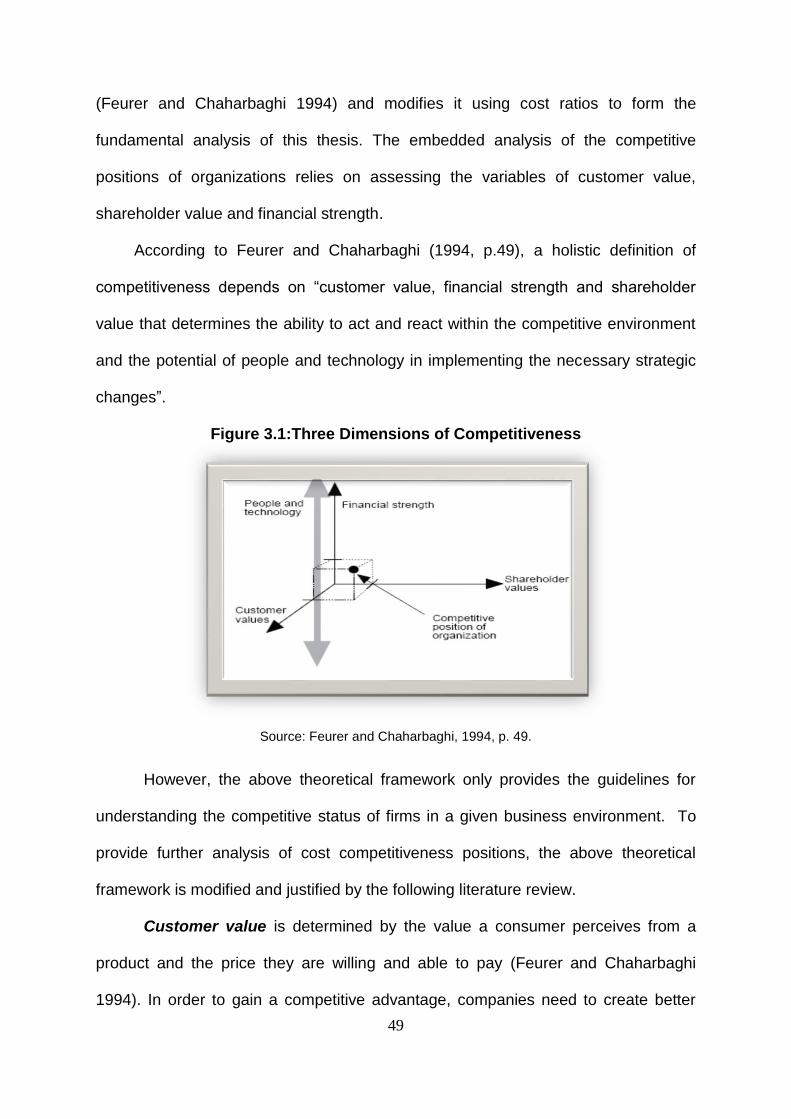
49
(Feurer and Chaharbaghi 1994) and modifies it using cost ratios to form the
fundamental analysis of this thesis. The embedded analysis of the competitive
positions of organizations relies on assessing the variables of customer value,
shareholder value and financial strength.
According to Feurer and Chaharbaghi (1994, p.49), a holistic definition of
competitiveness depends on “customer value, financial strength and shareholder
value that determines the ability to act and react within the competitive environment
and the potential of people and technology in implementing the necessary strategic
changes”.
Figure 3.1:Three Dimensions of Competitiveness
Source: Feurer and Chaharbaghi, 1994, p. 49.
However, the above theoretical framework only provides the guidelines for
understanding the competitive status of firms in a given business environment. To
provide further analysis of cost competitiveness positions, the above theoretical
framework is modified and justified by the following literature review.
Customer value is determined by the value a consumer perceives from a
product and the price they are willing and able to pay (Feurer and Chaharbaghi
1994). In order to gain a competitive advantage, companies need to create better
50
customer value for the same or lower cost than those offered by their competitors.
Customer value is the difference between realization and sacrifice, where realization
is what the customer receives and sacrifice is what is given up (Hansen and Mowen,
2013). Realization includes such attributes as product functionality (features),
product quality, and reliability of delivery, delivery response time, image and
reputation (Perrin 2005). Companies attempt to increase value for customers
through business strategies such as cost leadership, product differentiation and
focusing. As Bloodgood and Katz (2004) pointed out, demand for products that lead
to increases or decreases in a firm’s market share implicitly indicates the customer
value. Therefore, increasing the size of its market share has been argued as an
effective measure for motivating managers to make strategic decisions (Armstrong
and Collopy 1996). For example, Kotler (1988, p.333) stated that increases in market
share for a business ultimately leads to greater profitability.
Shareholder value is often referred to as the shareholders’ perception of the
competitive performance of an organization (Feurer and Chaharbaghi 1994) and is
measured by the share price of a company. Horngren et al. (2009) argue that the
way to increase shareholder value is to maintain revenue growth. Furthermore,
shareholder value can also be identified as the various ratios which are derived from
a firm’s performance, such as return on equity or investment (Palepu et al. 2010).
‘Sustainable shareholder value’ is the confidence of shareholders that they will retain
their shares in the firm into the foreseeable future. This is further beneficial to a firm,
since there must be sufficient capital for the firm to retain its market position and also
to manage more business functions and activities. Shareholder value does not only
reflect the value of the share price; it further indicates the sustainable growth of a
firm and its relationship to its cost structure. The effective cost structure of a firm
51
usually leads to successful operations. In conjunction with effective efforts in
corporate governance, the firm has the confidence to move production lines further
to boost sales and generate greater profitability. When shareholders are confident
with the operations of the firm, more capital will be retained in the firm, which will
smooth the operational cycle and push the firm to a more competitive position.
The third dimension, financial strength, takes the analysis beyond the
current state of profitability and enables forward exploration of the firm’s strategic
capabilities. The strategic capabilities are the abilities of a firm to respond to
solvency issues (e.g. financial crisis or an inability to pay off debts) and maintain
long-term survival.
Financial strength is critically important for the success of any business
organisation as it helps a company to gain a competitive advantage over its
competitors. Johnson and Scholes (1993) identified it as a critical factor that
determines a company’s strategic capabilities. Regarding the measurement of
financial strength, Feurer and Chaharbaghi (1994) pointed out that the measurement
of it depends on the organisation itself, as well as its competitive environment, and
there are varieties of financial and non-financial measures that can be used for
measuring financial strength. For example, fixed assets of a heavy manufacturing
industry is a critical strength of a company as fixed assets play a dominant role in
that industry, whereas fixed assets in a service company may not be a financial
strength as fixed assets do not play a dominant role in the service industries. When
making financial measurements, companies need to take into account their industry,
stage in the life cycle, time horizon, business objectives and economic conditions
(Chenhall and Langfield-Smith 1998). However, generally the financial strength of a
company is measured by examining the profitability, liquidity and solvency of a
52
company (Kaplan and Norton 1992), measurements which are further elaborated
upon Chapter 4 as they form parts of the model used in this study.
People and technology are aspects of the three-dimension system as they
have significant impacts on determining the ability of firms to sustain a competitive
position in the long term (Feurer and Chaharbaghi 1994). In the context of the
Chinese manufacturing environment, organisations are relying on low-cost human
capital, which greatly reduces the costs of production. Attaining a low-cost, skilled
and stable workforce is critical to manufacturers in China. Skilled and trained
workers can vastly diminish the default rate and improve efficiency and productivity
in the manufacturing process. To maintain this type of workforce usually requires
long-term involvement with labour and extensive investments. Further, maintaining
trained workers in the factory becomes another critical issue. This is because trained
workers are more competitive in the labour market and thus represent a higher
labour cost to manufacturers.
Technology is also essential to the cost competitive positions of
manufacturers, especially in the automobile sector. Due to large scale production,
having advanced technology vastly increases productivity and achieves cost savings
in terms of labour and reducing waste materials. However, investment in technology
is expensive due to the large set-up costs and continuous testing costs following
installation. Enhancing and retaining valuable people and technology is critical to a
firm’s success. This is because advanced human and technological resources have
the potential to generate supernormal returns, or at least persistent profits. On the
other hand, failure to keep these resources may result in loss not only in monetary
terms but also in terms of the competitive position of a firm (Liang et al. 2009). Thus,
53
this aspect is critical for firms to maintain and repair their comparative advantage and
increase their profitability.
Based on the above literature review, the cost competitive positions of firms
can be assessed and abstracted by those four aspects with a combination of cost
ratios; which are customer value, shareholder value, financial strength and people
and technology. This framework also helps to generate the first research question of
this thesis. That is, what are the cost positions of those manufacturers performing in
emerging markets such as China who are experiencing ever-increasing growth in the
local economy, while continuing to be plagued by jet-lagged issues from an older
established system?
3.3 Cost Competitiveness, Cost Ratios and Firm Performance
In the automobile manufacturing process, costs are attached to various steps of
production. Due to the segregation of the production process, costs are identified in
relation to each function of the manufacturing process. The fundamental cost
elements of the production process are the labour costs, inventory costs including
raw materials, work in process, finished goods, and overhead costs. All these
elements are later transferred into cost of goods sold to achieve the gross margin for
the accounting period (Horngren et al. 2009). To achieve cost competitiveness the
manufacturer needs to achieve a high amount of revenue on vehicle sales.
Furthermore, the manufacturer could adopt a strategy to manage its cost leadership
to maximize its profits.
Robert Kaplan (1983) initially identified the costs in the manufacturing
environment as either financial or non-financial. The financial measures of cost
performance are understood as the financial ratios, for instance, the profitability
ratios, return on assets, and return on investment. Whilst the non-financial measures
54
are qualified as productivity, quality, inventory costs, product leadership and
manufacturing flexibility, including using new technology in the production process.
He further identified problems with measurement of cost performance of
manufacturing firms in United States (U.S.) in comparison to Japanese
manufacturing firms. The latter is characterised by lower labour and inventory costs,
long-term manufacturing cost advantage, higher quality of products and higher
productivity in the manufacturing process (Kaplan 1983). Therefore, cost
competitiveness to some extent is translated into the manufacturers’ financial
performance. This is attributed to the fact that profitability incorporates the cost
elements of production and can indicate the efficiency of management. Furthermore,
liquidity and solvency can be used to represent the cost-related operational
performance of automobile manufacturers (Kaplan 1983; Lebreton and Tuma 2006;
Ramcharran 2001). For manufacturers in the automobile industry to manage
effective cost performance (meaning achieving cost reductions while maximising
revenue and profit), Droge et al. (2000) states that the critical factors for success are
competitive advantage, cost reduction and enhanced profitability.
3.4 Studies on the Performance of the Automobile Industry
There are many studies in the literature which have assessed the performance
of the automobile industry (Anderson et al. 1994; Pauwels et al. 2004). These
studies can be categorized according to related factors which have been determined
to have a link to performance. Examples include the relationship between customer
value and firm value (Anderson et al. 1994; Pauwels et al. 2004) as well as the
impacts from supply chain management on firm performance in the automotive
industry (Scannell and Vickery 2000; Chen et al. 2004 and Racharrran 2001). Some
studies further link supply chain management control with efficiency of inventory
55
management to assess the performance of automotive manufacturers (Kaplan 1983;
Sanchez and Perez 2005). It is also argued that innovative activities have prominent
influences on manufacturers’ performance (Clark and Fujimoto 1991; Becker and
Dietz 2004; Belderbos et al. 2004; Tseng and Wu 2006; Williams 2007). Certain
researchers, however, have proposed that firm size, takeover performance and
corporate governance also have impacts on the performance of automobile
manufacturers (Liu and Tylecote 2009; Humphery-Jenner et al. 2011). Nevertheless,
most studies have focused on the impacts of these factors on firm performance,
rather than conducting an in-depth analysis of firm performance or exploring internal
causations of firm performance.
3.4.1 Customer Value, Profitability and Firm Performance
As presented in the previous section, the performance of automobile
manufacturers can be linked to many aspects of the sophisticated production
process. Pauwels et al. (2004) identified the connections among new products, sales
promotions and financial performance of manufacturers in the automotive industry.
The authors argued that although new products are critical in achieving sales
revenue within the car industry, it could also lead to smaller profits due to the large
amounts of developmental and production costs involved. Further, the selling
expenses related to new product launches could also jeopardize the manufacturers’
abilities to achieve long-term profits (Srinivasan et al. 2004 cited in Pauwels et al.
2004). Moreover, Pauwels et al. (2004) argue that the introduction of new cars to the
market may not be reflected in shareholder returns immediately, as investors usually
have initial doubts regarding the success of new products in the market. However,
the investors’ reactions to the new product tend to stabilize in the long term; thus
56
Pauwels et al. (2004) found positive connections between new product introduction
and firm profitability performance.
3.4.2 Supply Chain Management and Firm Performance
The costs related to the supply chain are also important to manufacturers,
since the costs of parts purchased from suppliers determine the final product price in
the market. Chen et al. (2004) claim that the strategic role of purchasing has not
been researched enough in empirical studies. To support this claim they tested a
sample of 221 United States manufacturing firms to explore the relationships
between strategic purchasing, supply management and firm performance. They
argued that strategic purchasing can foster the firm’s capabilities in supply chain
management and further help sustain competitive advantage in a way that has a
profound impact on financial performance (Ellram and Liu 2002; Singhal and
Hendricks 2002). Chen et al. (2004) tested this hypothesis in relation to strategic
purchasing, supply chain management capabilities and firm performance. They
found there were significant relationships between them, and further extended their
findings to reveal positive links between manufacturing, corporate strategy and firm
performance. Thus, it can be stated that enhanced purchasing strategies can lead to
cost minimization and create value by improving product quality as a result of
manufacturers and suppliers co-operating. This would subsequently ensure robust
financial positions for both these performers in the industry.
Sanchez and Perez (2005) extended the research on the relationship
between supply chain management and firm performance by applying it to the
automobile industry. Sanchez and Perez (2005) aimed to establish the relationship
between supply chain flexibility and firm performance using a sample of automotive
suppliers. They surveyed 126 Spanish automotive suppliers, and used multivariate
57
analysis to identify the determinants of supply chain flexibility. Based on their
analysis, the authors found a positive relationship between supply chain flexibility
and firm performance. Firms with better supply chain flexibility tended to have better
capabilities in managing changing environments and technological complexity.
Further, Sanchez and Perez (2005) argued that flexibility has the potential to reflect
the efficiency level of a firm.
Ittner et al. (1999) extended the research on cost management through
exploring the links between strategic supplier management and firm performance
including profitability, product quality, product development cycle time and the
percentage of long-term acceptable suppliers. The automotive and computer
industries from Canada, Germany, Japan and the United States were selected to
investigate the extent to which performance is affected by supplier selections. The
study found that the organizations that perform worse are those without appropriate
supplier selections or monitoring practices; whilst those who are using more
appropriate supplier strategies have higher profits, better product quality, and larger
proportions of acceptable long-term suppliers. The selection of supplier strategies
requires extensive cost management. This includes evaluations of the quality of
materials and greater use of non-price selection criteria, including supplier
governance practices, which contribute to higher firm performance. Although the
study has investigated and compared the effects of supplier selection strategies on
firm performance, it has not reached the conclusion that specific cost management
elements definitively increase firm performance.
3.4.3 Technology and Firm Performance
A study by Scannell and Vickery (2000) indicated an interdependent
relationship between manufacturers and suppliers. Scannell and Vickery (2000)
58
argued that supply chain management and/or flexibility represent the first-tier of cost
to manufacturers. Cusumano (1988) asserted that the innovations in technology and
management of the Japanese automobile industry had contributed to high
productivity and enhanced process efficiency (e.g. high amounts of inventory
turnover). He further contended that the innovation in automobile production became
a source of competitive advantage for the manufacturers and led to higher levels of
profitability. Belderbos et al. (2004) examined the different types of research and
development and their corresponding influences on firm performance. Their analysis
involved four main variables; co-operation with competitors, suppliers, customers
and research institutes and universities. They used data from two consecutive
Community Innovation Surveys (CIS) conducted in 1996 and 1998 in the
Netherlands, as well as data from the production statistics database. The data was
used to test the relationship between the dependent variables (labour productivity
growth and innovative sales productivity growth) and the independent variables – co-
operation variables (R&D co-operation with competitors, suppliers, customers, and
universities or research institutes). The results of their study showed a strong
relationship between R&D co-operation and productivity growth. However, firm size
and the direction of innovative efforts showed no significant impacts on labour
productivity growth or innovative sales productivity growth. However, when there is
co-operation between R&D and suppliers, the input costs can be reduced and labour
productivity can be enhanced (Belderbos et al. 2004).
3.4.4 Human Resources and Firm Performance
Youndt et al. (1996) further examine the relationship between human capital
and organizational performance using two perspectives; the universal and the
contingency. They highlight the value of human capital and its critical influence on
59
product innovation. This innovation includes skills and capabilities to manage
advanced technology, statistical process control and computerised numerically
controlled machine tools which can lead to the value creating process of modern
manufacturing. This productive potential is claimed to lead to superior manufacturing
performance. Based on prior literature (Garvin 1993; Leon, Snyder and Ward 1990;
Schroeder, Anderson and Cleveland 1986; Upton 1995), Youndt et al. (1996) identify
three primary manufacturing strategies that manufacturers normally adopt: cost,
quality and flexibility. The role of human capital plays differently in each scenario to
improve organizational performance by either implementing cost reduction strategies
or focusing on quality, variety or service strategies (Osterman 1994).
3.5 Efficiency Studies in the Automobile Industry
Efficiency forms a significant portion of manufacturers’ performance, yet
relatively little is known about the efficiency level of Chinese automobile
manufacturers. Since the production volume of automobiles in China has surpassed
that of the USA to become the largest manufacturer in the world in 2015 (Jaruzelski
et al. 2015; Peters 2015; Gray 2015), the automobile industry is argued to be the
pillar industry of the Chinese economy (Harwit 1995; Harwit 2001). Consequently, it
becomes more urgent to gather research and process information to evaluate the
efficiency levels of those manufacturers (Soderbom and Teal 2002). Although many
studies have analysed the issues related to production efficiency in the automobile
industry (Harwit 1995; Saranga 2009), limited research has been done to conduct an
in-depth analysis. This in-depth analysis would involve dividing the industry into
automobile and component manufacturers, in order to consider the impacts of cost
performance on efficiency performance. Despite the limited research, the first major
issue that constrains efficiency in manufacturing can be identified as the long-term
60
governmental employee force, which some literature refers to as the ‘Iron rice bowl’.
Under this circumstance (in most cases state-owned enterprises in China), the
employees can secure their employment for a certain number of years, which may
jeopardize the efficiency of manufacturers (He et al. 2015; Berkowitz et al. 2015).
According to the China Labour Statistics Yearbook (2003), about 27 million State-
owned Enterprises (SOEs) workers were laid off from 1997 to 2002. This makes
labour one of the largest exogenous factors that impact efficiency performance in
China. The second issue is related to how technology is being efficiently utilized in
the production process. This has occurred as a result of China increasingly utilising
developing technology to push the industry to operate more efficiently and profitably
(Harwit 1995).
Therefore, the following section provides a review on the empirical studies
which evaluate efficiency. Subsequently, an overview of the variables which may
have impacts on the efficiency level of manufacturers is presented with a related
hypothesis development.
3.5.1 Review of Efficiency Studies
There are many studies which assess efficiency performance and research
has been conducted across different countries including both developed and
developing nations. The research also spans different industries, such as the
banking industry, universities, and the automobile industry. Various methods are
used to calculate and analyse efficiency, including production, cost and profit
functions with single equation estimation, stochastic frontier analysis, data
envelopment analysis (DEA) and the Malmquist total factor productivity (TFP) index
using DEA frontiers or SFA frontiers.
61
In this study, Data Envelopment Analysis (DEA) is used. “Data Envelopment
Analysis (DEA) involves the use of linear programming methods to construct a non-
parametric piecewise surface (or frontier) over the data, so as to be able to calculate
efficiencies relative to this surface (Coelli 1996, p.2). The DEA model was first used
by Charnes, Cooper, and Rhodes (1978) who relied on the pioneering work of
Farrell’s (1957) notion of technical efficiency. In recent decades, DEA has rapidly
grown into a new application area (Seiford 1996). There have been many studies
which have begun to address the issues of technical efficiency, pure technical
efficiency or scale efficiency in relation to various industries.
Farrell (1957) initially developed the efficiency measurement model to solve
the problem of measuring productive efficiency when faced with differing efficiency
points. These differing points exist as different economic systems and industries
require different combinations of inputs and outputs to achieve a satisfactory
measure of efficiency. For his model, Farrell aimed to provide a satisfactory measure
of productive efficiency, with respect to agricultural production in the United States,
which took into account all inputs. Although Farrell’s (1957) work was mentioned by
several researchers such as Shephard (1970) and Afriat (1972), who claimed to use
Farrell’s (1957) method to achieve tasks such as mathematical measurements, it
failed to receive significantly notable attention until a study by Charnes, Cooper and
Rhodes (1978), wherein they termed the method as Data Envelopment Analysis
(DEA).
The DEA approach has been used by Sherman and Gold (1985) to study the
operating efficiency of 14 branches of a savings bank in the United Sates. The
objective of the study was to provide an insightful suggestion on improving bank
branch efficiency. They claimed that the evaluation utilising DEA provided
62
meaningful insights which went beyond the analysis achieved by using accounting
ratios. This study identified the inputs as labour, office space and supply costs while
indentifying the outputs as the number of transactions. From their results, they found
that 6 out of 14 observed branches were relatively inefficient. However, Sherman
and Gold (1985) also revealed several issues related to the methodology. First, DEA
can only measure the efficiency performance of decision-making units in the same
sector. This meant that the DMUs must be homogenous. Second, DEA can only
measure relatively inefficient branches rather than all inefficient branches. Therefore,
management might only have their attention drawn to distinctly inefficient banking
branches. Lastly, the DEA did not indicate the reason or remedy for those inefficient
branches.
Sherman and Ladino (1995) extended the research of Shearman and Gold
(1985) using the DEA model to examine the productivity of 33 bank branches. In that
case, the DEA model was used to identify a potential annual saving of $6 million.
This study selected five resources and five types of service transactions based on
management assessments. The results from the study indicated substantial
improvements and cost reductions were required to enhance productivity
performance. In addition, the DEA model was considered to be the most effective
model to observe, compare and identify the most efficient entity with its underlying
resources (Sherman and Gold 1985).
Berger and Humphrey (1997) reviewed 130 studies which applied the frontier
efficiency analysis, including both non-parametric and parametric analysis, across 21
countries. The anticipated results drawn from the surveyed studies can be used to
assess the effects of deregulation, mergers, or market structure on efficiency.
Furthermore, they can assist government policy, and highlight the research issues
63
and problems faced when identifying the efficiency of an industry. It can also assist
in addressing the ‘best practices’ and ‘worse practices’ in relation to the measured
efficiency points. The authors also aimed to explore the related and effective
strategies for management to improve their operational performance.
The results from Berger and Humphrey’s (1997) study suggest that the
deregulation of financial institutions has double-sided impacts on the efficiency of
firms. The goal of deregulation is to reduce costs of operations and further stimulate
the efficiency of firms. However, the study found that banks in some countries still
experience lower efficiency despite rapid branch expansion and excessive asset
growth. This finding is similar to the scenario of mergers and acquisitions. For
instance, the combined institutions have a worse cost performance figure than the
separate institutions, although the consolidation was considered to improve cost
efficiency. The lack of literature on management performance efficiency makes
further analysis difficult. Berger and Humphrey (1997) suggest that the analysis of
bank branch efficiency might provide managers with a better way to identify the
troubled branches and then solve the issues by modifying existing operational
policies or procedures. However, only a few of the reviewed studies have provided
details regarding improvement in management performance. Thus to overcome the
shortcomings in applying the parametric or non-parametric analysis method, Berger
and Humphrey (1997) suggest that future studies should embrace comparison
amongst group observations rather than use individual observations. Furthermore, it
is also important to have financial institutions studies based on developing countries
in comparison to developed countries, such as the United States or European
countries.
64
Emrouznejad et al. (2008) further provide a survey and analysis based on 30
years of scholarly literature on DEA. The authors determined that from 1995 to 2003,
there were 226 publications per year concerning DEA, then from 2004 to 2006, the
number increased to 360 per year. The increasing number of publications on DEA
and the wide application of this methodology highlight the increased attention to, and
usage of DEA. Emrouznejad et al. (2008) however, point out that the collection of
information is limited only to journal publications and books. Thus the analysis and
application of DEA in regard to real-world scenarios should be addressed in more
diverse future research.
Rangan et al. (1988) measured technical efficiency from a sample of United
States banks which consisted of 215 independent banks from the 1986 Federal
Deposit Insurance Corporation data. Bank size, product diversity and bank location
were tested to determine their relationship to technical efficiency using regression
analysis. For the calculation of technical efficiency points, the inputs selected were
labour, capital and purchased funds. The outputs were real estate loans, commercial
and industrial loans, consumer loans, demand deposits, and time and saving
deposits. According to the results generated from the analysis, banks can only
generate 70% of outputs from the employed inputs. This indicates significant
inefficiency in the observed sample. However, the sources of inefficiency in relation
to pure technical and scale inefficiencies were relatively small.
Rangan et al. (1988) then developed the regression analysis using the
calculated technical efficiency points as dependent variables. The independent
variables were the bank size and product diversity. The bank deposits measure the
bank size, while the product diversity is measured by the total number of products
provided in proportion with a firms’ total dollar revenue accounted for by the i-th
65
products. The results from the regression analysis show that both efficiency points
were similar. This indicates that both technical and pure technical efficiency have a
positive relationship to bank size and a negative relationship to product diversity.
Similar research has also been conducted by Favero and Papi in 1995, who
conducted their research on Italian banks. They investigated the technical and scale
efficiency of 174 Italian banks in 1991 from the Centrale dei Bilanci-ABI data set
using non-parametric Data Envelopment Analysis. The specification of inputs and
outputs were derived based on the asset approach and the intermediation approach.
Under the asset approach, the selected inputs are labour (referring to the number of
full time employees), capital, and loanable funds including current accounts and
saving deposits. The outputs are loans, investment in securities and bonds and non-
interest income. Under the intermediation approach, the authors changed the
mixture of inputs and outputs. Consequently, the average efficiency for the observed
banks was 79% and scale efficiency was 84% in relation to the asset approach.
Under the intermediation approach, the average efficiency was 88% and scale
efficiency was 91%.
Favero and Papi (1995) later used the regression analysis to investigate the
relationship of the size of banks, productive specialization, ownership, market
structure and localization, to the calculated efficiency indicators. They found that
bank size had a perfect relationship to the efficiency points. This indicates that
efficiency might have small variations if bank size is used as a means to determine
differences. On the other hand, productive specialization was positively and
significantly related to efficiency under both the asset approach and the
intermediation approach. The ownership of banks, as a factor, had a significantly
66
lower level of efficiency, while market structure was found to have no explanatory
effect on the efficiency scores.
Taylor et al. (1997) used DEA and Linked-cone assurance region (LC-AR)
models to investigate the efficiency and profitability of Mexican banks, however they
selected different data for inputs and outputs from those selected by Rangan et al.
(1988) and Favero and Papi (1995). They selected 13 Mexican commercial banks
from 1989 to 1991, which was presented in panel data. Inputs were the total deposits
and total non-interest expense, while output was the total income. With respect to
the CCR DEA model, the number of extreme efficiency banks dropped from 6 in
1989 to 2 in 1991. In regards to the BCC DEA model, there were 6 to 8 efficient
banks operating at their most productive scale size showing the average efficiency at
75%, 72% and 69% from 1989 to 1991.
Unlike previous studies, Taylor et al. (1997) also drew attention to the
relationship between profit ratios and efficiency ratios. The results indicated that
there was a significantly highly positive correlation between the profit ratios and the
CCR/AR efficiency ratios, which were 0.96 in 1989, 0.98 in 1990, and 0.998 in 1991.
This means, the banks that are located in the best practice regions were spot on or
close to the efficient frontier. The study also indicates that some banks experience
different profit ratios although they have the same CCR efficiency performance.
From the observations it could be deduced that the banks that had effective income
management had poor interest and non-interest expense management. Banks with
less efficiency positions or weak income management had effective expenses
management. Despite this, contradictory observations existed which indicated that
some banks had effective income management as well as effective expense
management.
67
Drake (2001) analyzed the overall technical efficiency of the UK banking
sector by applying panel data from 1984 to 1995 with the DEA model. Drake (2001)
split the overall technical efficiency into pure technical efficiency and scale efficiency,
and later used the calculated scale efficiency to analyze returns to scale (i.e.
constant return to scale, increasing or decreasing return to scale). It subsequently
aimed to find the relationship between bank asset size and returns to scale. Further
it estimated the productivity growth in the UK banking sector from 1985 to 1995
using Malmquist productivity indices.
Drake (2001) employed two main approaches to specify the inputs and
outputs. The first approach was the intermediation approach, where the outputs are
measured by the values of interest-bearing assets on the balance-sheet, and the
inputs are the capital (fixed assets) and labour (number of employees). The second
approach employed is the production approach. The capital and labour are specified
as inputs while the number of accounts from various loans and deposits are
specified as outputs.
With respect to relationship among asset size, scale efficiency, and returns to
scale, the results showed a significant and positive relationship to size and scale
efficiency. In summary, the study suggests that the minimum efficient scale of
operation in the UK banking sector is when the asset size is between 18 billion
pounds and 23 billion pounds. However, Drake (2001) suggests that the decreasing
return to scale relies not only on the size of the firms, but also on the nature of the
firm itself, the production process, and product diversification. Therefore, further
investigation might be relevant to assess the issues related to the factors which have
impacts on the economies of scale/return to scale analysis.
68
Das and Gohsh (2006) investigated the efficiency performance of the Indian
commercial banking sector from 1992 to 2002 using the input-oriented DEA model.
They applied the three approaches; the intermediation approach, the value-added
approach, and the operating approach. Under the intermediation approach, the
inputs are specified as the deposits, labour (employee expense) and capital (the
operating and administrative expenses related to fixed assets), while the outputs are
the loans and investments. Under the value-added approach, the inputs are
measured as labour (employee expenses), capital (operating and administrative
expenses related to fixed assets) and interest expense, while the outputs are
measured as the deposits, loans and investments. Under the operating approach,
interest expenses, employee expenses and other operating expenses excluding
employee expenses are considered inputs and the related outputs are interest-
related revenues and non-interest revenues (commission, exchange, brokerage
etc.). The results indicate the average efficiency score is 78% under the
intermediation approach, 91% under the value-added approach, and 74% under the
operating approach.
In relation to the univariate approach, the calculated technical efficiency was
used to investigate the relationship between technical efficiency and their ownership,
size, capital adequacy, and non-performing loans. The ownership in this study is
identified as the public and private sector, and the results show that the public banks
are relatively more efficient than the private banks. However, Caprio and Peria
(2000) reported a different result, stating that increased government ownership is
somehow detrimental to the development of the banking system. This is further
approved by Das and Ghosh (2006), who stated that public banks performed less
efficiently as they are affected by government ownership. With respect to bank size,
69
the study indicates a positive relationship between technical efficiency and bank
size. This means that the higher the asset size the better efficiency scores that the
bank may achieve. Furthermore, the bank capital measured by the capital adequacy
ratio is also positively related to technical efficiency. However, the non-performing
loans were found to have a negative relationship with technical efficiency. This is
further supported by a study conducted by Berger and DeYoung (1997) regarding
bad management hypotheses.
Vahid and Sowlati (2007) studied the performance efficiency of the Canadian
Wood-product manufacturing subsectors using a DEA approach. The authors
separated the subsectors into six subsectors for efficiency analysis. They identified
labour, materials and energy as the inputs and revenues as output to assess the
efficiency status of the wood manufacturers from 1993 to 2003. The Canadian Wood
industry was found to have relatively high technical efficiency which indicates a
better ability to generate revenue with existing resources. They argued that those
industries with lower technical efficiency may need to make an improvement in their
inputs management. The current study also examines the average efficiency, which
comprises technical efficiency and scale efficiency. If a firm has a high technical
efficiency score but low scale efficiency, this indicates that the firm may operate
under disadvantageous scale conditions. These findings are crucial, since the
Canadian Wood industry is currently experiencing changing market conditions, and
maintaining its competitive status is a pressing priority.
The literature on the efficiency focus of DEA has expanded rapidly across
countries and in various contexts during the last few decades. DEA has been widely
adopted to evaluate performance efficiency measures in developed countries,
especially in the United States. Berger and Humphrey (1997) conducted 130
70
parametric and non-parametric studies in 21 countries. However, in the investigation
carried out by Berger and Humphrey (1997) only five% of the studies were
conducted for developing countries, such as India and Mexico. In addition,
Emrouznejad et al. (2008) performed a survey in regards to the first 30 years of the
use of DEA in empirical literature. However, once again most of the studies were
applied to developed nations. This raises the necessity of the DEA model being
applied to developing countries (Ataullah and Le 2006), especially to China and
India. This is because these countries have a rising influence on the global market.
Ataullah and Le (2006) assessed bank efficiency in India. They found that
public banks are more efficient than private banks. Furthermore, a positive
relationship was found between the size and the efficiency of larger banks. Also,
higher investment contributes to the higher efficiency level in Model A but lower
efficiency levels in model B. A negative relationship was found to exist between the
ratio of operating expenses to income, and efficiency level. A negative relationship
was also found between ROA and efficiency level in Model A, however a positive
relationship was present in model B. Ataullah and Le (2006) also used fiscal defects
as a percentage of GDP (DEF), private investment as a percentage of GDP (PI) and
the Herfindahl index of concentration (HERF), which is based on total assets of
banks, to represent the level of competition in the banking industry. In doing so, a
positive relationship between competiveness and efficiency performance was found.
Although Ataullah and Le (2006) focused on efficiency performance in the
developing country of India, the focus of previous studies was mainly on the banking
industry and rarely on the automobile industry in developing countries. This raises
the significance of this proposed study as it fills in a gap which exists in the previous
71
literature. The following section reviews the relevant literature on efficiency studies
on the automobile industry within the context of developing countries.
3.5.2 Overview of the Automobile Industry Efficiency Studies
The DEA approach is widely applied in the automobile industry to examine
efficiency in relation to different sectors. Saranga (2009), who investigated and
ranked the efficiencies of 50 automobile firms in India using publicly available
financial data corresponding to the year 2003, estimated the technical, input mix and
scale efficiencies of the Indian automobile Component industry by using DEA. The
investigation identified the factors in relation to operational efficiency, which were
presented by CRS, VRS and SBM models, and then sorted the results into scale
efficiency, pure technical efficiency and mix efficiency. According to Saranga (2009),
the CRS model calculates scale efficiency and pure technical efficiency, while the
VRS model calculates local pure technical efficiency. Since the labour input cannot
be controlled when used in the context of Indian automobile Component
manufacturers, this study only used three inputs. The inputs were capital, raw
materials and sundry expenses, while the output was gross income.
Saranga (2009) found that the automobile component industry in India was
suffering from various technical, scale and input mix inefficiencies. The longer new
working capital cycle was the main factor which led to the inefficiencies, in addition to
the negative impacts from local government policies. Saranga (2009) then
conducted a second stage analysis using OLS to identify the root causes of the
operational inefficiencies during the year 2003. At a 5% significance level testing of
hypotheses, capital employed was shown to have a positive relationship to
operational efficiencies (including input mix, scale and super efficiency measures at
1% levels of significance). Further, capital employed also had a positive relationship
72
to pure technical efficiency but at a lower significance level. A lack of capital is seen
to have a negative impact on managing efficient manufacturing processes. This is
primarily due to an inefficient input mix, as for instance, replacing automation with
labour might result in more defects and a higher usage of raw materials.
Consequently, observed firms might not perform well when there is a high volume of
production and lack of capital employed. Furthermore, capital employed also
indicates a strong relationship to the super efficiency score.
The higher than average inventory level is observed to provide a positive
contribution to operation efficiencies, except for scale efficiency. However, this is
contrary to the empirical results of previous studies. This means that firms with
higher average inventory levels had better management in delivering inventories with
unexpected demand, and thus had better super efficiency scores. The new working
capital cycle of this study indicates a significant impact on input mix inefficiency (at a
5% level), but not on other inefficiencies. This implies that by reducing the new
working capital cycle and increasing liquidity levels, firms may be able to achieve
higher efficiency. Cooper et al. (2001) used the DEA model to investigate
“Congestion” by presenting a comparison between the automobile and textile
industries in China. “Congestion” refers to “the amount of raw material inventory that
is accompanied by an improvement in production when it is removed”. The
background of this study is unique to the Chinese context. Given that in the 1990’s
the Chinese government “iron rice bowl policy” was swept away, and resulted in
massive layoffs and intensified social disruption, Cooper et al. (2001) question the
necessity of government policy in managing congestion. Further, Cooper et al.
(2001) aimed to demonstrate “how elimination of such managerial inefficiencies
could have led to output augmentation without reducing employment’. Cooper et al.
73
(2001) used labour and capital as inputs and production as an output. By examining
the results derived from the DEA, Cooper et al. (2001) identified that inefficiencies
existed in the automobile industry. He then detailed opportunities for improvement
and management of inefficiencies using three stages of analysis, the first stage
being the BCC model, the second being the congestion model, and lastly inefficiency
analysis in managing congestion.
Yousefi and Hadi-Vencheh (2010) further illustrate the DEA model through its
application to the automobile industry in order to compare the reliability of outcomes
of Multi-Criteria Decision-making techniques. These techniques combine the criteria
of technical features, beauty, economical aspects and social aspects. This study
brought a new perspective to the automobile industry. By using the DEA efficiency
points, Yousefi and Hadi-Vencheh (2010) demonstrated the level of importance
which pertains to features of automobiles in the Iranian market. As a consequence,
the DEA model indicated that the most important criteria is technical features,
followed by economic factors, in relation to selecting variables. Examples of such
important criteria include safety, price, spare part availability, and comfort.
Banker et al. (1984) and Callen (1991) describe other DEA models that
address specific applications and analytic objectives. Under the DEA model, an
efficient frontier is constructed upon selected firms. Those firms that are above the
efficient frontier are efficient, and those firms below the efficient frontier are inefficient
(Banker et al. 1984). Three major indicators regarding efficiency can also be derived
from Farrell’s (1957) model. Furthermore, he claimed it has been claimed, “The most
obvious measure of a firm’s efficiency is its costs”.
The above literature suggests that in general, the automobile industry
experiences inefficiency due to many factors such as poor productivity of labour,
74
production inefficiency in relation to usage of raw materials, and ineffective
management of the production environment. Despite these issues, the government
plays a vital role in the automobile industry as it is the pillar industry in the Chinese
economy. Given that China’s automobile industry receives and allocates a vast
amount of resources from its central government, the question becomes, how do
government policies impact on the manufacturers’ efficiency performance?
Based on the review of the above literature, the following research question is
formed: What is the technical efficiency (CRS/CRSTE), pure technical efficiency
(VRS/VRSTE) and scale efficiency status of Chinese automobile and component
manufacturers? This question will be assessed using data envelopment analysis
(DEA) and will be demonstrated further in Chapter Four, the methodology section.
3.6 Ownership Structure, Capital Structure and Firm Performance
In this section cost and efficiency ratios are used to analyse the manufacturing
performance of Chinese automobile manufacturers and test the hypotheses related
to various factors that may have an in-depth impact on manufacturers’ performance.
Firstly, the agency cost hypothesis is used as a theoretical framework to guide the
following analysis. The second section provides a review of the earlier studies on
factors that have an impact on firm performance, and which are assumed to have
influences on the performance of Chinese automobile manufacturers. The final part
of this section provides a summary of the hypotheses to be tested in this study.
3.6.1 Agency Cost Hypothesis
The Agency Theory is part of the Positive Accounting Theory, which assumes
that an agency relationship exists when the owner (principal) of the firm delegates
decision-making power to the manager (agent) (Deegan 2000, p.203; Gaffikin 2008).
Given, that the Positive Accounting Theory assumes that both principal and agent
75
act for their own interest, there will be opportunistic behaviours when conflicts of
interest arise. Due to these conflicts of interest, agency costs will be incurred in order
to solve the agency issue. These cost are generally monitoring costs, bonding costs
and residual costs (Deegan 2012).
There is a vast amount of earlier studies that have documented agency issues
and identified the agency costs that arise due to different managerial circumstances
(Alchian and Demsets 1972; Ross 1973; Jensen and Meckling 1976; Fama and
Jensen 1983; Watts and Zimmerman 1986; Eisenhardt 1989 and Jensen 2004).
Managerial misconduct occurs due to conflicts of interest among different interest
groups (Jensen and Meckling 1976). The conflicts of interest among the group can
be broken down into the interests of the dominant and the minority shareholders
(Akimova and Schwodiauer 2004).
3.6.2 Agency Cost Theory and Capital Structure
The Agency Cost Hypothesis assumes that agency costs will arise when there
are conflicts of interest among the owners, managers and shareholders. Berger and
Patti (2006) argue that this may be due to the separation of ownership and control;
managers will choose the inputs and outputs selectively in order to satisfy their own
interests which may in turn sabotage the interests of the company. Therefore, Berger
and Patti (2006) claim that capital structure is one of the instruments that could be
used to reduce agency costs and increase firm value.
The Agency Cost Hypothesis assumes that having a high level of financial
leverage leads to a higher portion of debt, or low equity ratio in the firm. This reduces
the agency costs by encouraging managers to align their interests with shareholders
(Jensen and Meckling 1976). A high level of leverage, however, presents the threat
of liquidation and may potentially negatively impact managers’ salaries (if there is a
76
bonus scheme, or managers’ payments are bound to the value of the firm).
Therefore, managers are imposed with greater pressures to generate more income
to repay their debts as a result of their highly leveraged position (Myers 1977;
Grossman and Hart 1982; Williams 1987).
On the other hand, high leverage may worsen the conflicts between debt
holders and shareholders, resulting in increased agency costs. This is because large
amounts of debt may lead to higher control risks when managing the repayments of
debts, as well as higher pressures for managers to generate consistent operating
income to service their debts. Therefore the firms, to some extent, may become
more vulnerable to financial distress or liquidation (Berger and Patti 2006).
Moreover, Margaristis and Psillaski (2010) argue that increased leverage
becomes a “disciplinary device’ which is used to reduce inefficiency in managing
cash flow (e.g. agency costs). This can be attributed to the fact that the threat of
liquidation places more pressure on managers to generate steady cash flow to pay
their debts. As a consequence, the firm enhances its value. On the other hand, the
conflicts that arise between debt holders and shareholders will further intensify the
risk on debts. This could lead to “under-investment” or “debt overhang” and
subsequently cause a negative impact on firm value. Margaristis and Psillaski (2010)
also demonstrate the relationship between financial leverage and firm growth rate.
They argue that for firms with a small number of growth opportunities, debt has had
a positive impact on firm performance. However, a study by McConnell and Servaes
(1995) concluded that for firms with higher growth opportunities, debt had a primarily
negative impact on firm performance.
77
3.6.3 Sustainable Growth and Firm Performance
The sustainable growth of firms in this study is defined as the retention rate
multiplied by ROE (OSIRIS database). The retention rate is calculated from the
dividend payout ratio. Sorensen (2002) considers the dividend pay out policy as one
of the measures of leverage, which in turn indicates how well shareholders’ wealth is
used to generate profits for a firm (Pandey 2005). Baker et al. (2002) argued that the
dividend policy has a direct impact on firm performance, since it indicates the
profitability of firms who are capable of distributing dividends to shareholders. Thus,
when the interests of shareholders are “protected” as such, shareholders are more
willing to retain their equity in the firm (Azhgaiah and Priya 2008).
There are a number of studies (Arnott and Asness 2003; Farsio et al. 22004;
Nissim and Ziv 2001) which have documented the relationship between dividend
policy and firm performance. Amidu (2007) argued that the dividend policy has a
positive and significant relationship to the firms’ profitability, which is measured as
return on assets, return on equity and growth in sales. Similarly, Howatt et al. (2009)
argued that the dividend policy has a positive impact on future changes in the
earning per share. On the other hand, Lie (2005) argued that the dividend policy
does not have a significant relationship to a firm’s performance.
3.6.4 Ownership Structure, Agency Costs and Firm Performance
The ownership structure is often based on the percentage of shares owned by
a firm’s shareholders (Demsets and Villalonga 2001). The ownership is classified
into three main categories; dominant shareholders, institutional shareholders and
outside shareholders (Farrar 2005). The impact of these three categories of
shareholders on firm performance will be discussed in this study.
78
3.6.4.1 Concentrated Ownership
Concentrated ownership is a type of shareholding in which the majority of
shares are held by the dominant shareholder group. As the shares are deemed with
voting power, to some extent, the concentrated shareholding is assumed to have the
incentive to influence the decision-making process (Prowse 1994; Coulton and
Taylor 2004). On one hand, the concentrated ownership may help to protect the firm
by minimizing agency costs and ensuring that the decisions made by the
management are aligned with the large shareholding group (Prowse 1994; Prowse
1996; Fischer and Pollock 2004; Deegan 2006). It is considered as one of the most
effective governance mechanisms in an environment where investor protection is
poor (Shleifer and Vishy 1997). On the other hand, concentrated ownership could be
used as the mediator for controlling shareholders to conceal information about the
firm to outside investors, and increase the cost of acquiring private information
(Johnson et al. 2000; Fan and Wong 2005 and Kim and Yi 2006). This implication is
more controversial in developing countries than the developed countries due to the
poor investor protection and less informative markets in developing countries (Jin
and Myers 2006; Fernandes and Ferreira 2008, 2009; Kim and Shi 2009; Gul et al.
2010). The most common types of concentrated ownership in China are government
ownership, foreign ownership and institutional ownership. These are further
described below.
3.6.4.2 Government Ownership
Corporate governance research documents the influences of government
ownership on firm performance (Sun et al. 2002; Lemmon and Lins 2003; Bhagat
and Bolton 2008). Sun et al. (2002) claim that many governments use privatization to
strengthen the performance of their state-owned enterprises (SOEs). However, there
79
is only limited literature which explores how the shift of ownership structure from
government to privatization impacts on firm performance. However, the literature
which is available argues that firms under government control normally perform
worse (in terms of profitability) than the privatized firms. This is because
governments generally favour following the goals of social and political policy over
profit maximization (Boycko, Shleifer and Vishny 1996; Dewenter and Malatesta
2001). Moreover, Vining and Boardman (1992), Boardman et al. (1986) and
Megginson, Nash and Van Randenborgh (1994) argue that government controlled
enterprises are less efficient than the privatized ones. However, some researchers
have argued that state-owned enterprises are not necessarily less efficient than
privatized ownership (Caves and Christensen 1980; Kay and Thompson 1986;
Vernon-Wortzel and Wortzel 1989; Martin and Parker 1995). Rather, they argue that
the profitability performance of firms is to some extent mixed before and after
privatization (Dewenter and Malatesta 1998). Further, Sun et al. (2002) shed light on
the issues related to Chinese state-owned enterprises. They found that Chinese
enterprises have their unique ownership scheme called the ‘share ownership
scheme’. This scheme states that as long as the assets of a state-owned enterprise
are not controlled by private investors, the SOE is still not privatized. Thereby, it is
rare to find any enterprise that has been privatized completely so far. Consequently,
the objective of Sun et al. (2002)’s study was to find the process that shows the
change in the mix of public and private ownership and its effect on the performance
of the SOEs. Based on their results, they found a positive relationship between
government ownership and firm performance. However, Sun et al. (2002) concluded
that sound profitability performance did not necessarily contribute to improvement in
a firm’s efficiency.
80
Another issue related to the influences of ownership structure on firm
performance is the impact of the East Asian Financial Crisis. Lemmon and Lins
(2003) took 800 firms from 8 East Asian countries to test the exogenous shock on
agency issues and related impacts on firm performance. Lemmon and Lins (2003)
posited their hypotheses to test whether firm value would decrease during a financial
crisis. Lemmon and Lins (2003) used the stock returns during the crisis period as a
function of firm’s ownership structure. They found that cumulative stock returns
during a financial crisis period, where managers owned high levels of control rights,
were 10 to 20 percentage points lower than the other firms who had separated
control and cash flow ownership. Therefore, a negative relationship between
separation of cash flow ownership, control and level of firm value was found.
3.6.4.3 Foreign Ownership
Foreign ownership refers to shares owned by foreign investors. Kim and Yi
(2009) concluded that foreign investors are more capable in terms of having
sufficient resources and skills to analyze firm-specific information and subsequently
acquire shares in developing countries. The Chinese stock exchange issues A-
shares and B-shares which are tradable in the Shanghai and Shenzhen stock
exchange. They also issue H-shares which are tradable in the Hong Kong stock
exchange. A-shares are mainly only issued to domestic investors, however some
may also be issued to foreign investors. B-shares and H-shares are those that can
be traded by foreign investors. Douma et al. (2006) argues that foreign investors,
despite having advanced monitoring capabilities and sufficient financial resources,
tend to focus more on the financial performance of firms. Consequently, foreign
investors are likely to take the exit strategy when the firm performance is poor
(Coffee 1991; Aguilera and Jackson 2003). On the other hand, Chibber and Majudar
81
(1999) argued that some foreign investors use their shareholding to gain access to
new markets and gain economic benefits from the low-cost production which
characterises emerging markets. Meanwhile, strategic foreign investors also bring in
new technology to improve production efficiency, which subsequently improves firm
performance (Douma et al. 2006).
3.6.4.4 Institutional Ownership
Cornett et al. (2007) consider institutional investors to be corporate monitors.
This is attributed to the fact that institutional investors who own large amounts of
shareholdings in a firm have the incentive to monitor corporate management in a
way that encourages investment on profitable projects. Furthermore, institutional
investors with interests in the firm may act strategically when the firm performs
poorly (Coffee 1991; Bhide 1994; Demirag 1998; Maug 1998). Despite this, with
sufficient resources, skills and capabilities, institutional investors are assumed to be
more effective in monitoring firm performance (Cornett et al. 2007).
Moreover, Duggal and Millar (1999) interpret the impact of institutional
investors on corporate performance in a similar way. Their investigation revealed
that institutional ownership has a significant and positive relationship to firm
performance (measured by the 22-day-announcement period of abnormal returns).
They argue that there are two ways that institutional investors are positively related
to corporate performance. First of all, institutional investors are claimed to have
sufficient resources to allow them to conduct quality research to enhance the
management of firms, target profitable investments and utilize resources for efficient
use. All these factors enable improvements in firm value (Lang et al. 1989 and
Servaes 1991). Second, there are strong incentives to monitor firm performance
when institutional investors have large shareholding stakes in the firm. The positive
82
relationship between institutional ownership and firm performance was also
confirmed by Smith (1996) and Del Guercio and Hawkins (1999).
3.6.4.5 Role of the State in Automotive Industry Enterprises and Influences of
Government Policy
The role of state enterprises is vital for the automotive industry to develop
during the current reform period. The reform of state enterprises has highly influential
consequences on the restructuring of the Chinese automobile industry. Although
Zhang and Freestone (2013) argue that non-state firms have outperformed state-
owned enterprises (SOEs) in terms of productivity, the role of the state is still
powerful in managing enterprises. The power of the state is also heightened due to
its role in controlling the pillar areas of the Chinese economy such as the automobile
industry.
The role of the state is thus important in analysing the performance of the
industry. The reform of SOEs began in the 1970s. Subsequently, through decades of
reform and improvements, changes in SOEs have transformed China from a
government centred economy to a market-oriented economy. Particularly in the past
two decades, SOEs in the automotive industry have restructured significantly due to
quasi-privatization. Consequently, they have experienced greater exposure to
competition due to the loosening of government controls. However, since control of
these enterprises is still in the hands of the government, the government through its
regulatory regimes still has considerable influence on decision-making in SOEs
within the automotive industry. Therefore, the changing roles of SOEs during the
reform period have evolutionary functions with regards to the reform of the
automotive industry. Furthermore, the requested efficient allocation of resources
83
from the state, which includes capital and labour, has a significant impact on the
performance of manufacturers in the industry.
Although improvements have been made to SOEs in China, there are issues
and problems which still limit the industry. These issues hinder the ability of the firms
to generate sufficient funds to repay their loans and debts. It was suggested by
Heytens (2003) that SOEs are less efficient in terms of operational efficiency in
comparison to other forms of ownership. This is due to the loosening of budget limits
(Kornai 1986; Kornai, Maskin and Roland 2003), higher costs as a result of political
pressures (Lin and Li 2008) and a lack of competition (Lins et al. 2003 and Carlin et
al. 2001). To solve the problems facing the Chinese manufacturing environment, the
government has set its key objective as improving the performance of
manufacturers. This government objective is planned to be achieved by constructing
a ‘modern enterprise system’. This is a system based on the goals of ‘clarification of
property rights and responsibilities; separation between government administration
and corporate business; and scientific management’. These goals are aimed at
restructuring the enterprises based on corporate governance with incentives to
achieve profits.
The ‘modern enterprise system’ has improved since then. However, SOE
reform has lagged from the early 2000s, especially during the Global Financial Crisis
(GFC) (Wu 2012b). The GFC resulted in rising unemployment and a large number of
SOEs were restructured. In order to save state assets and improve market
efficiency, the State-Owned Assets Supervision and Administration Commission
(SASAC) was established. By this time the SASAC had extraordinary status in the
industry. Wu (2012a), however argues that the emphasis on SASAC actually
84
encouraged the ‘growing and supervising of state assets rather than on reforming
and restructuring SOEs’.
By the end of 2010, SOEs had become more diversified in terms of their
ownership structure. Joint ventures, partnerships and public listing firms have all
increased the diversification of shareholdings in their firms (Yang 2013). Although
influences from the government on SOEs no longer carry a great weight of
importance, the government still plays a crucial role with regards to the performance
of manufacturers in the automobile industry (Pan and Tian 2013). Subsequently,
these questions promote the need to examine and assess the performance of SOEs
and non-state-owned enterprises in China’s automobile industry with regards to
‘modern reform’. Furthermore, this section is aimed at investigating whether and how
ownership structure affects corporate performance of listed automobile companies in
China.
Many empirical studies have suggested that firms that have adopted better
corporate governance mechanisms have better performance due to lower
managerial costs (Gompers et al. 2003). Brown and Caylor (2006) found that the
examined firms which had higher return on equity (ROE) and higher return on assets
(ROA) were associated with a better corporate governance structure. Also, higher
ownership concentration was suggested as a mean of improving corporate
governance and firm performance (Gedajlovic and Shapiro 2002; Joh 2003).
The empirical studies which examine the effectiveness of ownership structure
reform on improving the economic performance of SOEs in China have been very
limited in number and scope. Although Wu et al. (1996) is an exception, even the
results of their study are not generalizable since they only included 80 firms in a
85
single year, and they failed to consider potential confounding effects; such as firm
size, capital structure and industry type.
Charnes, Cooper and Rhodes (1981) proposed a method of analysis
regarding the influence of public versus private ownership on efficiency performance.
It involves three stages. Firstly, they divide the sample into public and private sub-
samples. Secondly, they project all observations into the DEA model. Thirdly, they
assess any difference in the mean efficiency of the two sub-samples. According to
the findings of Das and Ghosh (2006), there is a negative relationship between
ownership and efficiency performance which is statistically significant. This finding is
also supported by Das, Nag, & Ray, (2005); Mohan & Ray, (2004); and Sensarma,
(2005) cited in Das and Ghosh (2006). According to the prior literature (Xu and
Wang 1997; Dewenter and Malatesta 1997), there is widespread robust evidence
that the firms operating under state ownership are less efficient than privatized firms.
The reason for this is that state-owned manufacturers tend to receive more
government resources which are used to generate more income. Referring back to
the banking system, Caprio and Peria (2000) found that state-owned banks tend to
become a deterrent to the development of other banks in the system. Thus,
government ownership is observed to have an adverse impact on the efficiency
levels of banks.
Companies with state ownership tend to receive more government funds and
support which can be used to further assist their development. Examples of the ways
in which company development can be assisted include encouraging the
employment of low-skilled workers in manufacturing sector and promoting job
opportunities. State-owned manufacturers are determined to pursue their goals in
alignment with government policies. However, their closeness to the government
86
also results in adverse impacts on efficiency performance. This may occur for
various reasons. First, due to the opportunities offered and/or access to government
advantages, state-owned manufacturers may not bother to pursue and seize
potentially better external opportunities. Second, state-owned manufacturers are
closely linked to the government, and thus the effectiveness of government policies
have a great impact on the efficiency performance of manufacturers. As such, the
following hypothesis is used to test the technical efficiency of manufacturers.
3.7 Implications of Government Policies on the Automobile Industry in China
As indicated in Chapter 2, the central government of China has a heavy
influence on the automobile industry. This influence includes industrial policies,
proposed production targets with respect to volume, usage and waste disposal,
technological development, industry structural adjustment, brand recognition,
product development, component industrial planning, marketing networks,
investments, imports and exports, management and automobile consumption.
However, recently the government has started to focus on environmental
management which has vast impacts on firm performance. The following section
focuses on the newly released government policies regarding environmental issues
and the relevant literature associated with it.
3.7.1 Environmental Issues with the Chinese Automobile Industry
In 2012, the Chinese central government issued its new energy development
plan. It stated that the environmental issues associated with increasing the usage of
vehicles was becoming a major issue for the country’s strategic plan (MIIT 2016).
The “grey smog” rings alarmed the central government, and pollution in China was
described as an “extraordinary and unnatural phenomenon” to the Chinese public
(Floto 2014). The environmental disaster was no longer seen as a consequence of
87
environmental degradation but rather as a result of the rise of manufacturing, the
greater usage of cars and soaring energy demand. Therefore, the questions to ask
based on contemporary issues include; if environmental problems have been
addressed by companies ever since, how and why is pollution today becoming a
huge concern to the emerging economy of China? How effective is environmental
accounting when applied by major manufacturers through reporting according to the
corporate social responsibility reporting guidelines issued by the central government
of China in 2013?
In this study, through the discourse of ecological modernization, it is useful to
understand the subject of environmental reform. It is also important to investigate the
internalized social and economic conflicts which come as a result of the domination
of Western modernity in China.
3.7.2 Environmental Accounting and Corporate Social Reporting (CSR)
As environmental issues intensify and are considered to be a consequence of
industrial production, accounting practices with respect to the environment become
increasingly questioned. The issues relating to environmental accounting have been
discussed in various topics and levels.
With increasing concerns with regards to environmental issues, the reporting
from corporations has shifted as a result of public request to corporate social
reporting. According to Wiseman (1982), in order to satisfy the demand for
environmental reporting, the majority of Fortune 500 firms disclosed environmental
issues in the footnotes of their financial reports, as required by the SEC. However,
the quality of the environmental reporting continued to be a major concern. Jenkins
and Yakovleva (2006) investigated the trends in social and environmental reporting
by looking at the world’s 10 largest mining firms. The reports on corporate social
88
responsibility were found to be more sophisticated; however the variations in the
reporting terms of policy development, emissions, pollution and measurements used
for environmental performance were not comparable. This lack of uniformity and
ineffective standards for auditing were considered to be profoundly detrimental
factors.
3.7.3 The Relevance of the Chinese Automobile Industry
The automobile industry is regarded as the pillar industry in China and
indicates the important role played by the Chinese central government in determining
policies and future development in the industry. The ever-growing economy in China
accelerates the transformation of the local automobile industry in terms of sales,
production, technological innovation and efficiency. In the meantime, the
development of economic activities also brings forth negative impacts on society, for
instance, congestion, emissions and pollution. At this stage, the role of the state has
real significance. The central government of China functions not only in terms of
adjusting economic activities, but also in guiding industry policy. In order to be
legitimized and allied with central policies, automobile manufacturers are presumed
to be adopting the guidelines promoted by central government (for instance, the
corporate social reporting guidelines).
3.8 Summary
This chapter reviewed the literature relating to cost competitiveness and
efficiency issues within the automobile industry and their impact on firm performance
from different theoretical perspectives. The literature shows that the prior studies that
have been conducted to examine issues with performance in the automobile industry
are largely in the areas of customer value, supply chain management, and
technology and human resource management. A review of the studies conducted to
89
examine the level of efficiency also reveals that there have been no prior studies
examining the level of efficiency in the Chinese automobile industry. However, there
have been a number of studies assessing the level of efficiency of the automobile
industry in other countries. This literature review also identifies the various factors
affecting firm performance in general, and has identified a number of factors that
may play a critical part in determining firm performance in the automobile industry.
These factors include: company ownership consisting of government ownership,
foreign ownership and institutional ownership; leverage; sustainable growth and a
number of firm specific factors such as age and size of the firm. Overall, this chapter
indicated that there is a vacuum of research examining the performance of Chinese
automobile companies from both a financial and managerial accounting point of
view.
90
CHAPTER FOUR
RESEARCH DESIGN, METHODOLOGY AND DATA
4.1 Introduction
This research is conducted to examine the relative competitiveness of Chinese
automobile manufacturers and to identify the critical factors that Chinese automobile
manufacturers need to improve in order to enhance their competitiveness. In order to
achieve this research objective, first a comprehensive investigation was carried out
to examine the cost performances (financial strength) and level of efficiency of the
Chinese automobile industry for the period from 2006 to 2014 using a ratio analysis
and Data Envelopment Analysis (DEA). Based on the results of this analysis, the
relative strengths and weaknesses of the Chinese automobile industry are identified.
On the basis of these results and the literature review on the prior studies, a multiple
regression analysis is then carried out to identify various factors affecting the
performance of Chinese automobile manufacturers. This chapter describes the
research design, methodology and data used for conducting the above mentioned
analysis.
This chapter is organised as follows. First, section 4.2 describes the research
problem and section 4.3 describes the research questions. The research design,
which includes the research framework, research methods, selection of samples and
data collection is then presented in section 4.4. A detailed explanation of the three
analyses undertaken in the study, including the definitions and measurement of
variables, description of data and data analysis methods are then presented in
sections 4.5 to 4.7. Finally, section 4.8 provides a summary of the chapter.
91
4.2 Research Problem
The landscape of the world automobile industry has changed significantly over
the last decade with the rapid expansion of this industry in emerging markets such
as Korea, China, Brazil and India on the back of various government incentives to
promote the automobile industry and the cost leadership strategy, which has been
found to be a very successful strategy for these countries. As a result, many leading
automakers in developed markets have relocated their production facilities to
emerging markets with a view to reduce their production costs and to be cost
competitive with these automobile manufacturers in these countries (Mahidhar et al.
2009; Baker and Hyvonen, 2011). Not surprisingly, with huge demand for
automobiles from the growing middle class and massive government support, China
has gone on to become the leading manufacturer of automobiles among all the
emerging markets in the world. With this rapid development, China’s automobile
industry is now considered as the fastest growing automobile industry in the world
(Tang, 2009; OICA, 2016). It is believed that the diversified products and low-cost
manufacturing base in China have made major contributions to the tremendous
success that the Chinese automobile manufacturers enjoy in the global market (Hass
1987; Dent 1996; Cheryinternational 2013). According to a recent report produced by
the International Organization of Motor Vehicle Manufacturers, the Chinese
automobile industry is the largest automobile manufacturer and supplier of
automobile components in the world, with 24.5 million units of production in 2015
(OICA 2016). Furthermore, with increased foreign investments coming in the form of
joint ventures, China has been able to modernise its automobile industry with the
advanced technology of foreign operators, further increasing the strength of the
92
Chinese automobile industry and its market position. (IBISWorld Industry Report
2016).
While China is undertaking major economic reforms in its economy and has
experienced rapid economic growth in the past decades (Liang et al. 2009; Chang,
2016), the market strategies taken by the Chinese automobile industry, such as
providing diversified products at low prices, have helped it to enhance its
competitiveness to withstand the global competition (Hass 1987; Dent 1996). For
example, Chery Auto, which is one of the most prominent government-owned
automobile manufacturers, introduced a passenger car with fashionable designs to
the Australian market at remarkably low prices with tremendous success
(Cheryinternational 2016).
The Chinese automobile industry plays an important role in the overall Chinese
economy (Haugh et al. 2010). This is because the production in the automobile
industry has prominent linkages to the other pillar industries in the country, such as
steel and iron manufacturing, as the automobile industry is the major end user of
their products (CISA 2008; CNAICO 2010). The industry has become a huge
contributor to the Chinese economy, not only in manufacturing, but also in
investments in building and equipping plants, dealerships, distribution infrastructure,
and services such as finance and insurance, transportation, and hauling 24.6 million
vehicles across China (Richter, 2016).
Since the Chinese government has a significant influence on many of the
Chinese automobile companies through ownership and management control, and
the industrial policies governing the automobile industry, the success and continuous
growth in the automobile industry is very important to the government as the growth
93
in the industry is a reflection of the effectiveness of government policies designed to
improve the manufacturing base in the country (Naughton 2007).
The growth of the Chinese automobile industry has been phenomenal over the
past 10-15 years; the industry has doubled in size over this period (Baker and
Hyvonen 2011). However, because of the economic slowdown in China in recent
years and the lack of attention being paid to improve certain aspects of the
automobile industry, Chinese automobile manufacturers are now faced with great
challenges when it comes to quality, innovation and costs of production. Real wages
growth is a serious issue facing this industry in China. For example, the wages of
Chinese factory workers are now at their historical highest, showing a 64% wage
growth since 2011. Increasing wages means increasing costs for companies,
causing them to lose their cost competitiveness (Niedermeyer 2014). A number of
major issues faced by the Chinese automobile industry are described below.
First, the quality of automobiles produced by Chinese manufactures is still not
considered to be comparable to their competitors such as Japan’s Toyota or Korea’s
Hyundai, which have gained considerable positive reputations in the global market
(Tang 2009). According to a report from the China Association of Automotive
Manufacturers (CAAM 2016), the export of Chinese made automobiles fell by 20
percent from 2014 to 728,200 units in 2015. This sharp reduction in demand has
raised concerns about the low-cost and low-tech models produced in China, and the
lack of quality of the indigenous brands, as impediments to the development of the
Chinese automobile industry (Chang 2016).
Second, there are a number of internal issues troubling the Chinese
Automobile industry. For instance, the changing cost structure of firms, the use of a
large volume of unskilled labour (Berkowitz et al. 2015), the increasing labour costs
94
and materials costs, and the opportunistic behaviours of the managers in State-
owned enterprises (Chang 2016) are dampening the cost and efficiency
competitiveness of local automobile manufacturers. Although the Chinese
automobile industry embraces large volumes and scales of production, these do not
appear to have translated into improvements in manufacturing efficiencies.
Third, the issues that hamper the cost and efficiency competitiveness are
related to impacts from the Joint Venture (JV) policy and co-operation between the
local manufacturers and overseas investors. The Chinese central government
opened the investment policy to foreign investors in the early 1980s (Harwit 1995).
The international car makers are only allowed to have a 50-50 joint-venture
partnership with China’s state-owned enterprises/manufacturers (SOEs) (Shi et al.
2014). With this condition, the foreign investors had to help the newly established
Chinese automobile manufacturers to modernize their production process in the
hope that one or two of these manufacturers (SOEs) would be capable of producing
quality automobiles for the global market (Chang 2016). However, the local
manufacturing environment was not ready for the advanced technology and Western
styled capitalism (He and Mu, 2012; Ju et al., 2013). The lack of a skilled labour
force, and the misunderstanding from Chinese leaders on the utilisation of the
resources invested by Western automobile manufacturers, had further jeopardised
the development of the Chinese automobile industry.
This background described above shows the need for a comprehensive
empirical examination of the performance of the automobile industry through a
longitudinal study to identify the major cost and efficiency issues affecting the
competitiveness of the Chinese automobile industry. It also makes the case for a
comprehensive examination of the performance of the automobile industry in
95
general, as the prior studies that have been conducted to examine the performance
issues of the automobile industry have left a vacuum in the academic literature, as
none of those studies have taken a managerial accounting view in examining the
underlying issues, as the current study intends to do. For example, a study
conducted by Pauwels et al. (2004) on the US automobile industry focused on the
effects of new product introductions and sales promotions on the firm's top-line and
bottom-line products, on investor performance, and also analysed these effects from
a marketing point of view. The studies conducted by Ellram and Liu (2002), Singhal
and Hnedricks (2002) and Chen et al. (2004); Scannell and Vickery (2000); Chen et
al. (2004) and Luthra et al. (2011) on the automobile industry looked at the strategic
role of supply chain management in fostering the competitive advantages of firms.
Studies conducted by Leon, Snyder and Ward (1990) and Schroeder, Anderson and
Cleveland (1986) focused on human resource management issues in the automobile
industry, but did not extend the scope of these studies to include the cost impact that
HR issues have on automobile companies. Anderson et al. (1994) and Guajardo et
al. (2015) investigated the performance of the automobile industry, examining the
relationship between the customer, profitability and product quality, but ignored their
cost implications as they affect company competitiveness.
Given the vacuum in the academic literature in relation to the performance
management issues of the automobile industry in general, and the Chinese
automobile industry in particular, this study attempts to contribute to the existing
literature in a number of ways. First, it provides a comprehensive longitudinal
analysis on the performance of automobile companies in China over a period of nine
years from 2006 to 2014. Second, it compares the performance of Chinese
automobile companies over a period of nine years from 2006 to 2014, with the
96
performance of Indian automobile companies which are fiercely competing with
Chinese automobile companies, especially in emerging markets. Third, it analyses
the various cost efficiency parameters of the Chinese automobile industry to identify
the relative strengths and weaknesses of the industry, as such analysis is critically
important for any policy decisions that aim to enhance China’s competitiveness in
the global market. Finally, it examines the factors affecting the performance of
Chinese automobile companies and assesses the impact that these factors have on
both financial and non-financial performance measures of the automobile
companies. The factors identified through the literature review for this examination
are:
(1) Ownership, consisting of government ownership, foreign ownership and
institutional ownership.
(2) Leverage, consisting of operating and financial leverage.
(3) Sustainable growth.
(4) Firm age.
(5) Firm size.
(6) State control.
(7) Industry sector.
Since the impacts of these factors on the performances of Chinese automobile
companies have not been examined in previous studies, this study aims to fill this
gap in the literature. The specific research questions examined in this study are
stated in section 4.3 below and elaborated in section 4.4.
97
4.3 Research Questions
The research problem mentioned in section 4.2 leads to the following three
research questions and sub-research questions to be answered in this study.
Research Question 1[RQ1]:
How competitive is the Chinese automobile industry in terms of performance and financial status in comparison to those of the Indian automobile industry?
The following three sub-research questions are formed to answer the RQ1.
RQ1.a How have the Chinese automobile and component manufacturers performed in terms of profitability over the period 2006 to 2014 in comparison to that of the Indian automobile and component manufacturers over the same period?
RQ1.b How have the Chinese automobile and component manufacturers performed in terms of liquidity management over the period 2006 to 2014 in comparison to that of the Indian automobile and component manufacturers over the same period?
RQ1.c How have the Chinese automobile manufacturers performed in terms of solvency over the period 2006 to 2014 in comparison to that of the Indian automobile and component manufacturers over the same period?
Research Question 2[RQ2]:
How have the Chinese automobile companies performed in terms of operational efficiency?
The following three sub-research questions are formed to answer the RQ2.
RQ2.a What is the level of technical efficiency (CRSTE) of Chinese automobile and component manufacturers over the period from 2006 to 2014?
RQ2.b What is the level of pure technical efficiency (VRSTE)of Chinese automobile and component manufacturers over the period from 2006 to 2014?
RQ2.c What is the level of scale efficiency (SE) of Chinese automobile and component manufacturers over the period from 2006 to 2014?
RQ2.d What is the level of allocative efficiency (AE) of Chinese automobile and component manufacturers over the period from 2006 to 2014?
RQ2.e What is the level of cost efficiency (CE) of Chinese automobile and component manufacturers over the period from 2006 to 2014?
98
Research Question 3[RQ3]:
What factors have affected the performance of the Chinese automobile industry?
The following three sub-research questions are formed to answer the RQ3.
RQ3.a Does the ownership structure affect the performance of Chinese automobile and component manufacturing companies?
In answering RQ3.a, the relationship between the following three types
of ownership structure and firm performance is examined.
RQ3.a.1 Does the government ownership affect firm performance?
RQ3.a.2 Does the foreign ownership affect firm performance?
RQ3.a.3 Does the institutional ownership affect firm performance?
RQ3.b Does the capital structure affect the performance of Chinese automobile and component manufacturing companies?
In answering RQ3.b, the relationship between the following three types
of ownership structure and firm performance is examined.
RQ3.b.1 Does the financial leverage affect firm performance?
RQ3.b.2 Does the operating leverage affect firm performance?
RQ3.c Does the sustainable growth rate affect the performance of Chinese automobile and component manufacturing companies?
RQ3.d Does firm age affect the performance of Chinese automobile and component manufacturing companies?
RQ3.e Does firm size affect the performance of Chinese automobile and component manufacturing companies?
RQ3.f Does the state control affect the performance of Chinese automobile and component manufacturing companies?
RQ3.g Does the performance of Chinese automobile companies vary between the industry sectors?
4.4 Research Design and Approach
In order to answer the above research questions, a longitudinal research
design has been proposed in line with the review of literature in chapter 3 and the
theoretical model developed based on the Feurer and Chaharbaghi (1994)’s three
dimensions of competitive positions model. The main objective of the research is to
ensure that the evidence obtained enables the research questions to be answered
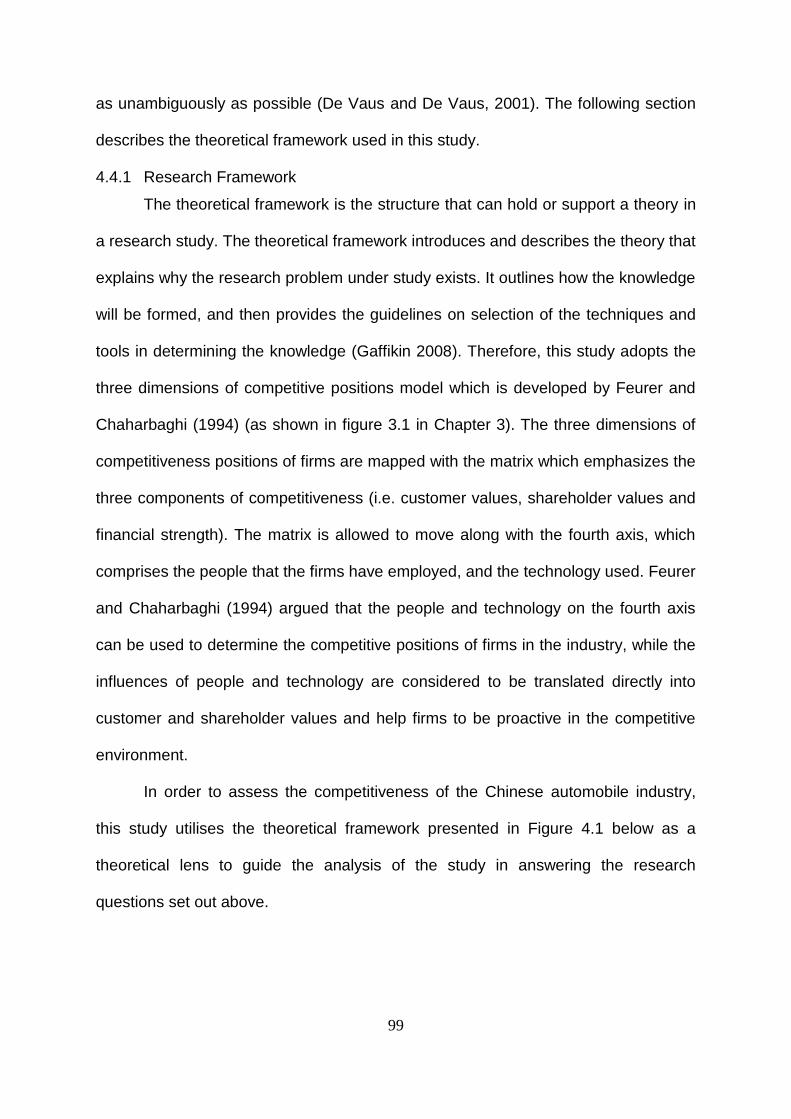
99
as unambiguously as possible (De Vaus and De Vaus, 2001). The following section
describes the theoretical framework used in this study.
4.4.1 Research Framework
The theoretical framework is the structure that can hold or support a theory in
a research study. The theoretical framework introduces and describes the theory that
explains why the research problem under study exists. It outlines how the knowledge
will be formed, and then provides the guidelines on selection of the techniques and
tools in determining the knowledge (Gaffikin 2008). Therefore, this study adopts the
three dimensions of competitive positions model which is developed by Feurer and
Chaharbaghi (1994) (as shown in figure 3.1 in Chapter 3). The three dimensions of
competitiveness positions of firms are mapped with the matrix which emphasizes the
three components of competitiveness (i.e. customer values, shareholder values and
financial strength). The matrix is allowed to move along with the fourth axis, which
comprises the people that the firms have employed, and the technology used. Feurer
and Chaharbaghi (1994) argued that the people and technology on the fourth axis
can be used to determine the competitive positions of firms in the industry, while the
influences of people and technology are considered to be translated directly into
customer and shareholder values and help firms to be proactive in the competitive
environment.
In order to assess the competitiveness of the Chinese automobile industry,
this study utilises the theoretical framework presented in Figure 4.1 below as a
theoretical lens to guide the analysis of the study in answering the research
questions set out above.
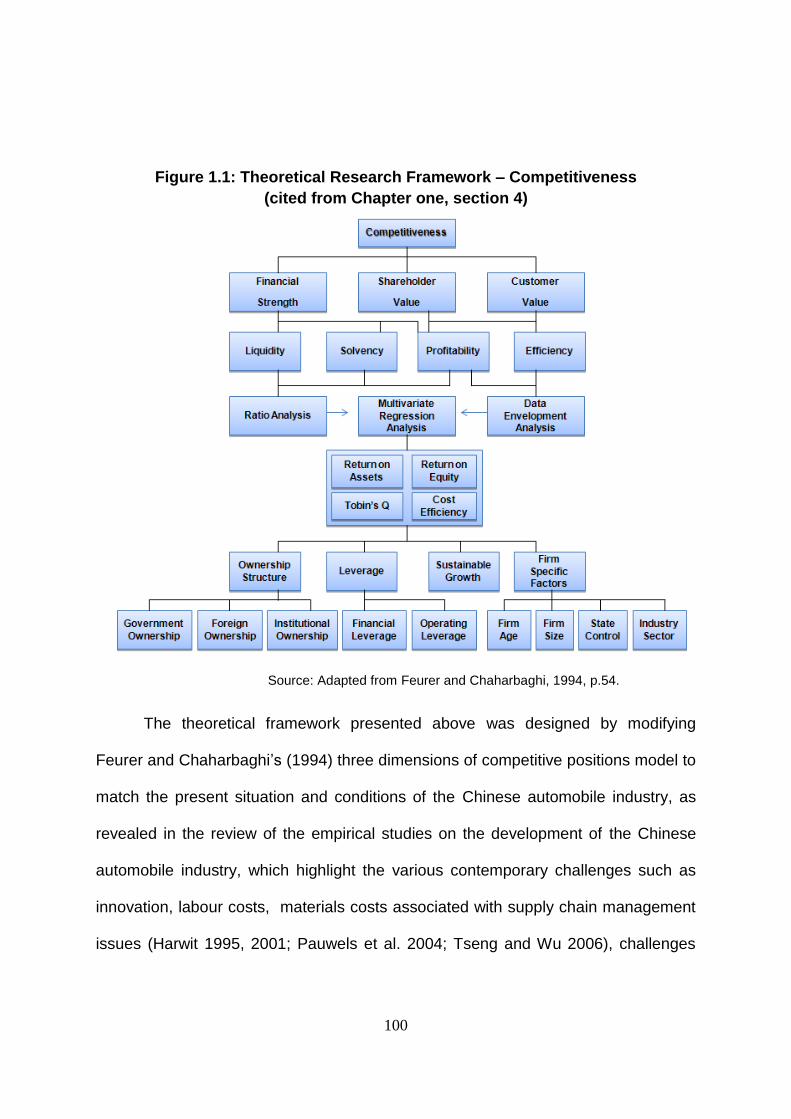
100
Figure 1.1: Theoretical Research Framework – Competitiveness
(cited from Chapter one, section 4)
Source: Adapted from Feurer and Chaharbaghi, 1994, p.54.
The theoretical framework presented above was designed by modifying
Feurer and Chaharbaghi’s (1994) three dimensions of competitive positions model to
match the present situation and conditions of the Chinese automobile industry, as
revealed in the review of the empirical studies on the development of the Chinese
automobile industry, which highlight the various contemporary challenges such as
innovation, labour costs, materials costs associated with supply chain management
issues (Harwit 1995, 2001; Pauwels et al. 2004; Tseng and Wu 2006), challenges
101
due to the unique ownership structure of Chinese companies (Sun et al. 2002), and
the competition from Indian manufacturers (Patra and Rao 2016).
4.4.2 Research Methods
A number of research methods are employed in this study to investigate the
underlying issues and to explore the answers to the research questions stated in
section 4.3. Based on the theoretical framework described in the previous section,
this research attempts to answer the research questions through a threefold
quantitative analysis. Firstly, a comparative ratio analysis is conducted to assess the
financial strength of the Chinese and Indian automobile and component
manufacturers for a period of nine years from 2006 to 2014. Also, on the basis of the
results of this analysis and statistical tests conducted, an assessment is made on the
relative financial strength of the Chinese automobile industry while identifying its
relative strengths and weaknesses. Secondly, the level of operational efficiency in
the Chinese automobile industry is measured using the Data Envelopment Analysis
(DEA) under three categories of efficiencies, which are technical efficiency, pure
technical efficiency and scale efficiency. Thirdly, the factors impacting on the
performance, including levels of efficiency, are examined using a multiple regression
analysis. Detailed information about these analyses are presented in sections 4.5 to
4.6 below.
4.4.3 Selection of Sample and Data Collection
The data for this study was obtained from Bureau Van Dijk’s OSIRIS
database (OSIRIS) which provides financial information on manufacturers under
industry categories based on the classification provided by the Global Industry
Classification Standards. Since this thesis focuses on the performance of
manufacturers in China, the data is categorised based on the following steps: by
world region – Far East and Central Asia (selecting China and India), by Global
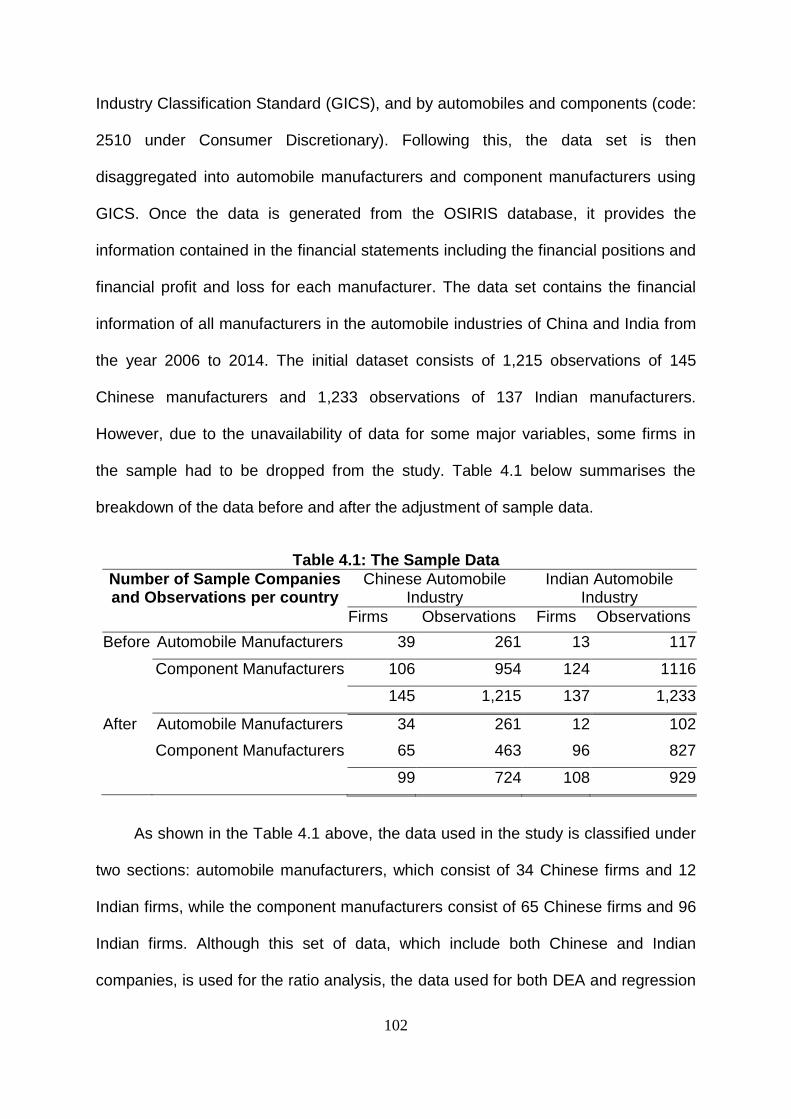
102
Industry Classification Standard (GICS), and by automobiles and components (code:
2510 under Consumer Discretionary). Following this, the data set is then
disaggregated into automobile manufacturers and component manufacturers using
GICS. Once the data is generated from the OSIRIS database, it provides the
information contained in the financial statements including the financial positions and
financial profit and loss for each manufacturer. The data set contains the financial
information of all manufacturers in the automobile industries of China and India from
the year 2006 to 2014. The initial dataset consists of 1,215 observations of 145
Chinese manufacturers and 1,233 observations of 137 Indian manufacturers.
However, due to the unavailability of data for some major variables, some firms in
the sample had to be dropped from the study. Table 4.1 below summarises the
breakdown of the data before and after the adjustment of sample data.
Table 4.1: The Sample Data
Number of Sample Companies and Observations per country
Chinese Automobile Industry
Indian Automobile Industry
Firms Observations Firms Observations
Before Automobile Manufacturers 39 261 13 117
Component Manufacturers 106 954 124 1116
145 1,215 137 1,233
After Automobile Manufacturers 34 261 12 102
Component Manufacturers 65 463 96 827
99 724 108 929
As shown in the Table 4.1 above, the data used in the study is classified under
two sections: automobile manufacturers, which consist of 34 Chinese firms and 12
Indian firms, while the component manufacturers consist of 65 Chinese firms and 96
Indian firms. Although this set of data, which include both Chinese and Indian
companies, is used for the ratio analysis, the data used for both DEA and regression
103
analysis was confined only to Chinese companies. As such, the number of
observations used for DEA analysis and regression analysis was further reduced to
624 and 600 observations respectively due to lack of data in relation to some of the
variables used in the two analysis. The data used in both of these analyses are
described further in section 4.6.2 and section 4.7.2.
The following three sections (Sec 4.5 – 4.6) while providing detailed information
on the threefold analysis, also provide further information on the data used for each
analysis.
4.5 Cost Competitiveness - Ratio Analysis
4.5.1 Introduction
Ratio analysis has been commonly used for assessing the firm performance
across firms as well as for longitudinal analysis. Particularly, many prior studies (For
example, Piplai 2001; Zubairi 2010; Afza and Hussian 2011; Lee 2011; Ray 2011;
Xu 2011; Jamali and Asadi 2012; Kumar and Bhatia 2014) that have examined the
performance of companies have used ratio analysis for their investigations. Among
the recent studies that have used ratio analysis for performance evaluation of
automobile companies, the following three studies are noteworthy:
(1) Piplai (2001) which critically examined the impacts of liberalisation on the
automobile sector in India using financial ratios as performance indicators. Piplai
(2001) used turnover ratios including total cost to net sales, operating profit/net
sales, interest borrowing, day’s sales outstanding, day’s raw material in cost of sales,
day’s sales in inventory, and debt to equity ratios as performance indicators to reveal
the cost efficiency of the automobile sector in India from 1992 to 1993 and 1995 to
1996. This study showed that the automobile industry experienced unstable growth
104
from the 1970s to the 1990s which was mainly due to the inefficient investments
made by the government and the worldwide recession.
(2) Zubairi (2010) which investigated the influences of working capital
management, capital structure (operating and financial leverage ratios) and liquidity
positions (measured by the current ratio) on the profitability of automobile firms in
Pakistan.
(3) Kumar and Bhatia (2014) which used financial ratios to evaluate the
financial performance of the manufacturers in the Indian automobile industry. The
financial ratios employed in Kumar and Bhatia (2014) were current ratio, quick ratio,
debt to equity ratio, equity ratio, gross margin ratio, net profit margin ratio, fixed
assets turnover ratio and capital employed turnover ratio.
Following the methodology used in prior research, a financial ratio analysis is
employed in this study to analyse the cost performance (financial strength) of
Chinese and Indian automobile companies on the basis of the modified theoretical
framework of cost competitiveness depicted in Figure 4.1 above. The remaining
sections of this chapter are organised as follows: section 4.5.2 describes the
selection of samples and data collection, section 4.5.3 demonstrates the method of
ratio analysis, while section 4.5.4 provides definitions of the accounting ratios used in
this study. Finally, section 4.5.5 discusses the limitations of the ratio analysis.
4.5.2 Selection of Samples and Data Collection
As presented in Table 4.1 above, the sample for this analysis consisted of 261
observations from Chinese automobile and component manufacturers and 954
observations from Indian automobile and component manufacturers. In the data
collection process, balance sheet and income statement data are first downloaded
from Bureau Van Dijk’s OSIRIS database (OSIRIS) for the period from 2006 to 2014.
105
Then using the financial data downloaded, the range of financial ratios is calculated
to assess the cost competitiveness of firms.
4.5.3 Method-Ratio Analysis
As shown in Figure 4.1: Theoretical Research Framework, the three
dimensions of the framework—customer value, shareholder value and financial
strength—reflect the competitiveness of the Chinese automobile industry. The
financial strength dimension of Chinese automobile companies is assessed using 16
financial ratios which are classified under three broad categories—profitability,
liquidity and solvency (Deng et al. 2015). The procedure followed for this analysis is
as follows.
First, the ratios are calculated based on the financial data of Chinese and Indian
companies for the period from 2006 to 2014, together with an overall average for
each ratio for the period. Second, independent-samples t-tests are carried out using
SPSS to compare the two mean values of each ratio between the two countries, to
understand whether the difference between the two ratios is statistically significant.
However, before carrying out this test, tests will be carried out to ensure that the data
set used for this analysis does not violate the following assumptions to ensure that
the independent t-test gives a valid result. The assumption tests are:
(1) The dependent variable should be measured on a continuous scale.
(2) The independent variable should consist of two categorical, independent
groups.
(3) There should be independence of observations.
(4) There should be no significant outliers.
(5) The dependent variable should be approximately normally distributed for
each group of the independent variable.
106
(6) There needs to be homogeneity of variances which can be tested using
Levene’s test for homogeneity of variances.
Third, after it is ensured that the data meet the assumptions, the data will be
analysed using SPSS and the results will be interpreted. Section 4.5.4 below
describes the ratios used in the study and their definitions.
4.5.4 Accounting Ratios and Definitions
4.5.4.1 Profitability
Profitability is the ability of a business to earn a profit. It is considered as the
primary goal of all business ventures as businesses will not be able to survive in the
long run without being profitable. A profit is what is left from the revenue after paying
all expenses directly related to the generation of the revenue, such as producing a
product (cost of goods sold), and other operating expenses related to the conduct of
the business activities. However, since profit is an absolute measure, it is important
to gauge the profit of a firm in comparison to the capital employed in the business to
estimate the profitability of the business (rate of return on investment). Therefore, the
analysis of the profitability is structured in terms of return on assets, profit margin,
asset turnover ratio, gross margin, cost of goods sold ratio, operating expense ratio,
and financial net profit ratio (Fridson 2011).
4.5.4.1.1 Return on Assets (ROA)
The ROA indicates the ability of a firm to generate profit from its total assets.
It is normally used by the investors to assess the profitability efficiency of a firm and
make decisions as to whether they are willing to invest more cash into the firm. The
ROA is not only important for investors and other users, but also critical for firm’s
managers, since it determines a firm’s overall level of operating efficiency (Joh 2003;
Klock et al. 2005). To have in-depth investigations on the ROA, it is necessary to
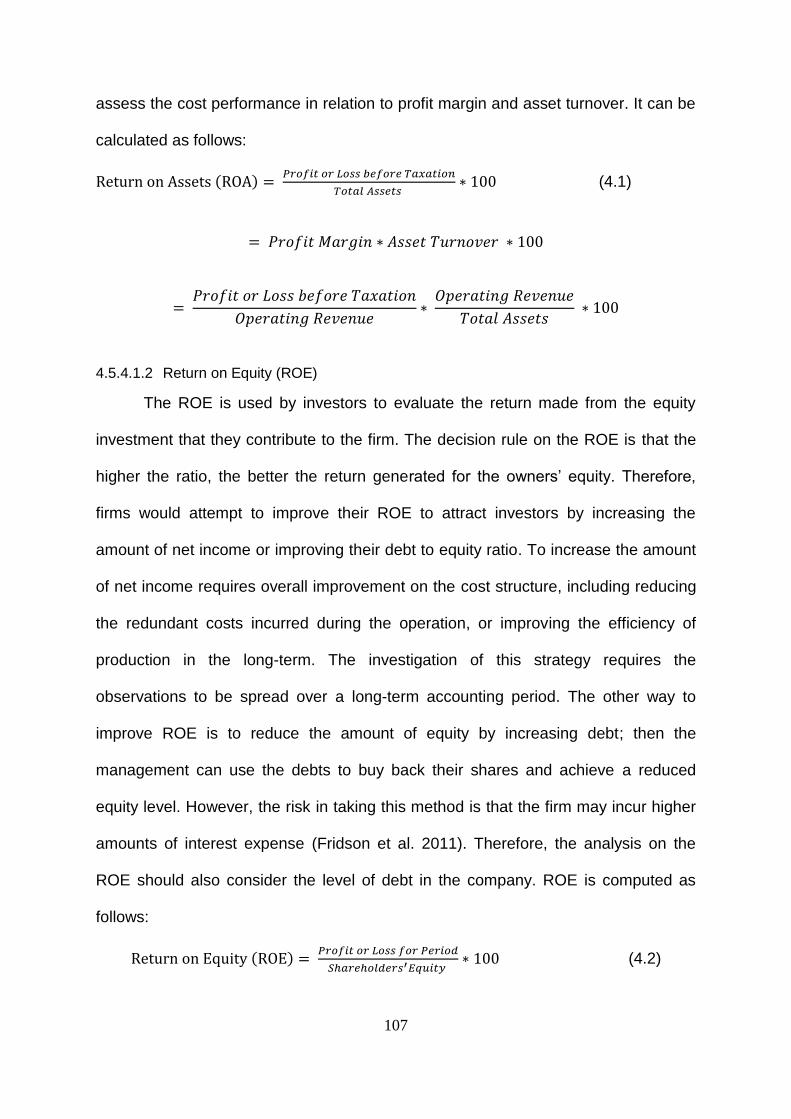
107
assess the cost performance in relation to profit margin and asset turnover. It can be
calculated as follows:
Return on Assets (ROA) = 𝑃𝑟𝑜𝑓𝑖𝑡 𝑜𝑟 𝐿𝑜𝑠𝑠 𝑏𝑒𝑓𝑜𝑟𝑒 𝑇𝑎𝑥𝑎𝑡𝑖𝑜𝑛
𝑇𝑜𝑡𝑎𝑙 𝐴𝑠𝑠𝑒𝑡𝑠 ∗ 100 (4.1)
= 𝑃𝑟𝑜𝑓𝑖𝑡 𝑀𝑎𝑟𝑔𝑖𝑛 ∗ 𝐴𝑠𝑠𝑒𝑡 𝑇𝑢𝑟𝑛𝑜𝑣𝑒𝑟 ∗ 100
= 𝑃𝑟𝑜𝑓𝑖𝑡 𝑜𝑟 𝐿𝑜𝑠𝑠 𝑏𝑒𝑓𝑜𝑟𝑒 𝑇𝑎𝑥𝑎𝑡𝑖𝑜𝑛
𝑂𝑝𝑒𝑟𝑎𝑡𝑖𝑛𝑔 𝑅𝑒𝑣𝑒𝑛𝑢𝑒∗
𝑂𝑝𝑒𝑟𝑎𝑡𝑖𝑛𝑔 𝑅𝑒𝑣𝑒𝑛𝑢𝑒
𝑇𝑜𝑡𝑎𝑙 𝐴𝑠𝑠𝑒𝑡𝑠 ∗ 100
4.5.4.1.2 Return on Equity (ROE)
The ROE is used by investors to evaluate the return made from the equity
investment that they contribute to the firm. The decision rule on the ROE is that the
higher the ratio, the better the return generated for the owners’ equity. Therefore,
firms would attempt to improve their ROE to attract investors by increasing the
amount of net income or improving their debt to equity ratio. To increase the amount
of net income requires overall improvement on the cost structure, including reducing
the redundant costs incurred during the operation, or improving the efficiency of
production in the long-term. The investigation of this strategy requires the
observations to be spread over a long-term accounting period. The other way to
improve ROE is to reduce the amount of equity by increasing debt; then the
management can use the debts to buy back their shares and achieve a reduced
equity level. However, the risk in taking this method is that the firm may incur higher
amounts of interest expense (Fridson et al. 2011). Therefore, the analysis on the
ROE should also consider the level of debt in the company. ROE is computed as
follows:
Return on Equity (ROE) = 𝑃𝑟𝑜𝑓𝑖𝑡 𝑜𝑟 𝐿𝑜𝑠𝑠 𝑓𝑜𝑟 𝑃𝑒𝑟𝑖𝑜𝑑
𝑆ℎ𝑎𝑟𝑒ℎ𝑜𝑙𝑑𝑒𝑟𝑠′𝐸𝑞𝑢𝑖𝑡𝑦 ∗ 100 (4.2)
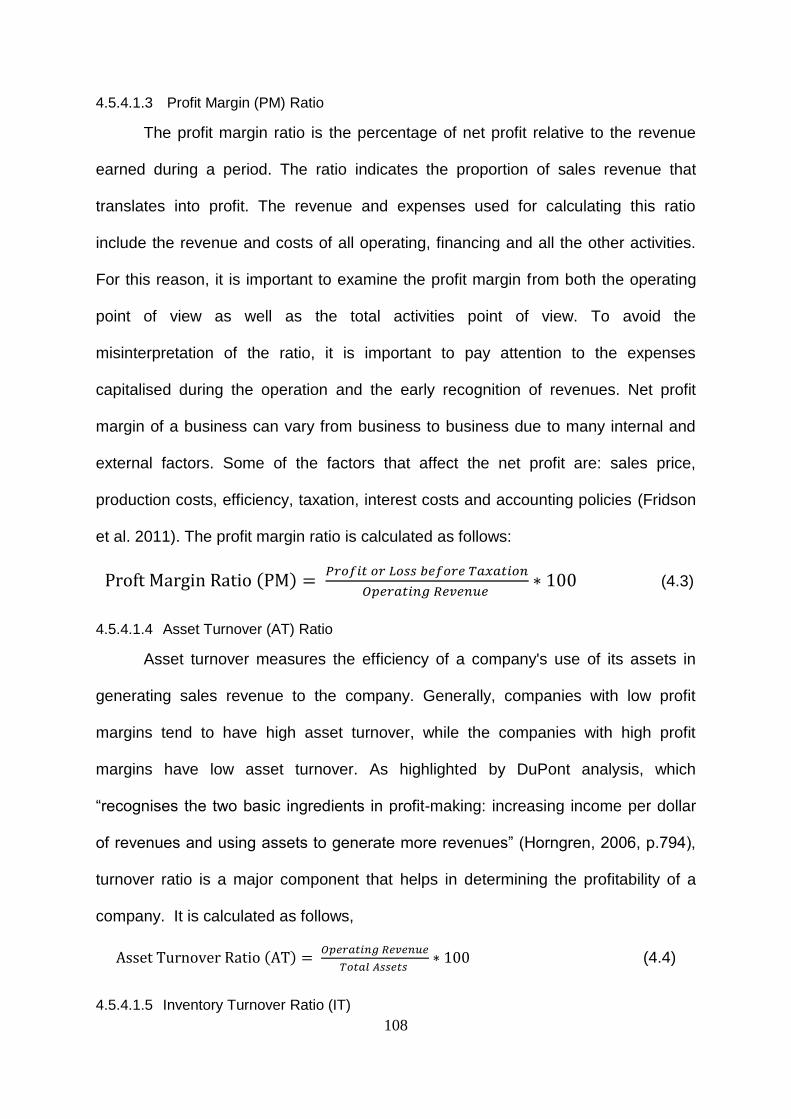
108
4.5.4.1.3 Profit Margin (PM) Ratio
The profit margin ratio is the percentage of net profit relative to the revenue
earned during a period. The ratio indicates the proportion of sales revenue that
translates into profit. The revenue and expenses used for calculating this ratio
include the revenue and costs of all operating, financing and all the other activities.
For this reason, it is important to examine the profit margin from both the operating
point of view as well as the total activities point of view. To avoid the
misinterpretation of the ratio, it is important to pay attention to the expenses
capitalised during the operation and the early recognition of revenues. Net profit
margin of a business can vary from business to business due to many internal and
external factors. Some of the factors that affect the net profit are: sales price,
production costs, efficiency, taxation, interest costs and accounting policies (Fridson
et al. 2011). The profit margin ratio is calculated as follows:
Proft Margin Ratio (PM) = 𝑃𝑟𝑜𝑓𝑖𝑡 𝑜𝑟 𝐿𝑜𝑠𝑠 𝑏𝑒𝑓𝑜𝑟𝑒 𝑇𝑎𝑥𝑎𝑡𝑖𝑜𝑛
𝑂𝑝𝑒𝑟𝑎𝑡𝑖𝑛𝑔 𝑅𝑒𝑣𝑒𝑛𝑢𝑒 ∗ 100 (4.3)
4.5.4.1.4 Asset Turnover (AT) Ratio
Asset turnover measures the efficiency of a company's use of its assets in
generating sales revenue to the company. Generally, companies with low profit
margins tend to have high asset turnover, while the companies with high profit
margins have low asset turnover. As highlighted by DuPont analysis, which
“recognises the two basic ingredients in profit-making: increasing income per dollar
of revenues and using assets to generate more revenues” (Horngren, 2006, p.794),
turnover ratio is a major component that helps in determining the profitability of a
company. It is calculated as follows,
Asset Turnover Ratio (AT) = 𝑂𝑝𝑒𝑟𝑎𝑡𝑖𝑛𝑔 𝑅𝑒𝑣𝑒𝑛𝑢𝑒
𝑇𝑜𝑡𝑎𝑙 𝐴𝑠𝑠𝑒𝑡𝑠 ∗ 100 (4.4)
4.5.4.1.5 Inventory Turnover Ratio (IT)
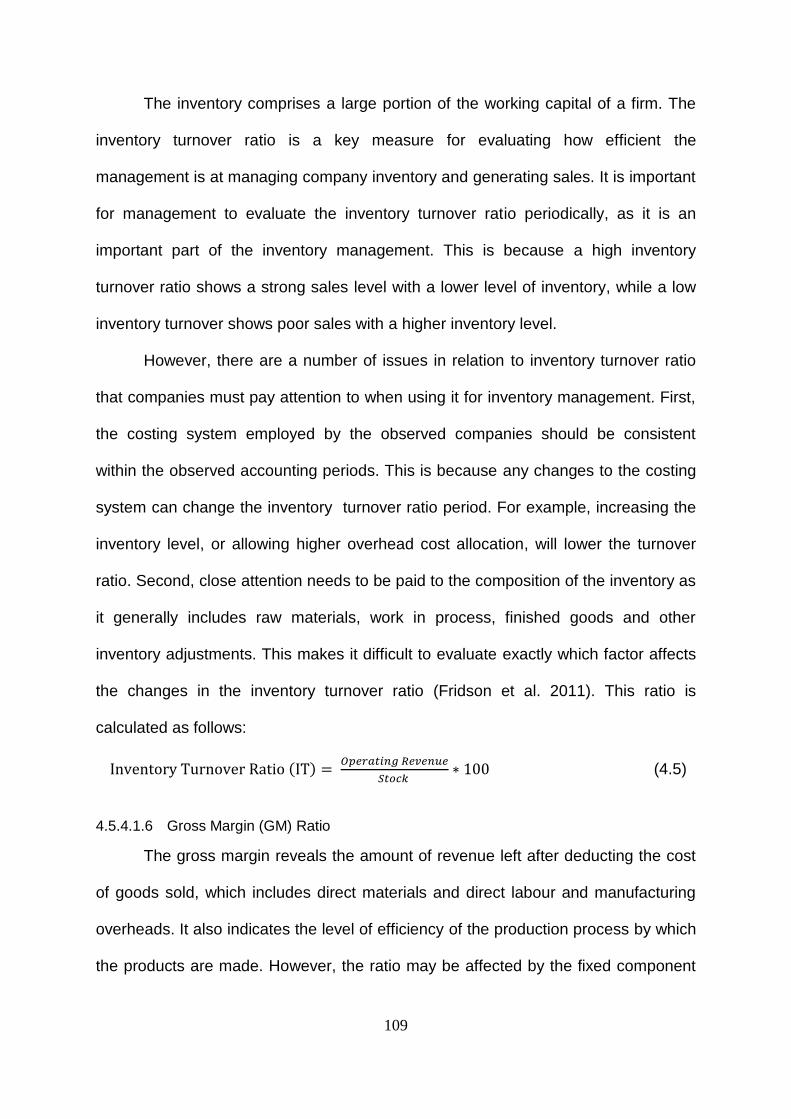
109
The inventory comprises a large portion of the working capital of a firm. The
inventory turnover ratio is a key measure for evaluating how efficient the
management is at managing company inventory and generating sales. It is important
for management to evaluate the inventory turnover ratio periodically, as it is an
important part of the inventory management. This is because a high inventory
turnover ratio shows a strong sales level with a lower level of inventory, while a low
inventory turnover shows poor sales with a higher inventory level.
However, there are a number of issues in relation to inventory turnover ratio
that companies must pay attention to when using it for inventory management. First,
the costing system employed by the observed companies should be consistent
within the observed accounting periods. This is because any changes to the costing
system can change the inventory turnover ratio period. For example, increasing the
inventory level, or allowing higher overhead cost allocation, will lower the turnover
ratio. Second, close attention needs to be paid to the composition of the inventory as
it generally includes raw materials, work in process, finished goods and other
inventory adjustments. This makes it difficult to evaluate exactly which factor affects
the changes in the inventory turnover ratio (Fridson et al. 2011). This ratio is
calculated as follows:
Inventory Turnover Ratio (IT) = 𝑂𝑝𝑒𝑟𝑎𝑡𝑖𝑛𝑔 𝑅𝑒𝑣𝑒𝑛𝑢𝑒
𝑆𝑡𝑜𝑐𝑘 ∗ 100 (4.5)
4.5.4.1.6 Gross Margin (GM) Ratio
The gross margin reveals the amount of revenue left after deducting the cost
of goods sold, which includes direct materials and direct labour and manufacturing
overheads. It also indicates the level of efficiency of the production process by which
the products are made. However, the ratio may be affected by the fixed component
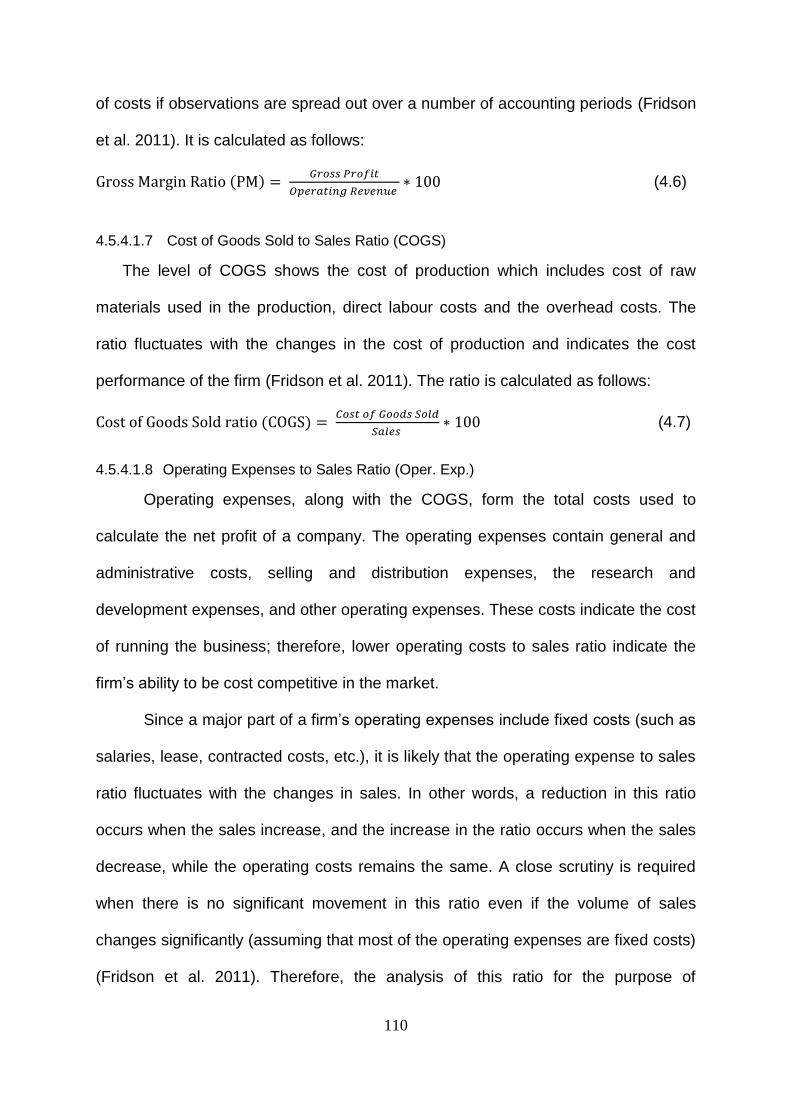
110
of costs if observations are spread out over a number of accounting periods (Fridson
et al. 2011). It is calculated as follows:
Gross Margin Ratio (PM) = 𝐺𝑟𝑜𝑠𝑠 𝑃𝑟𝑜𝑓𝑖𝑡
𝑂𝑝𝑒𝑟𝑎𝑡𝑖𝑛𝑔 𝑅𝑒𝑣𝑒𝑛𝑢𝑒 ∗ 100 (4.6)
4.5.4.1.7 Cost of Goods Sold to Sales Ratio (COGS)
The level of COGS shows the cost of production which includes cost of raw
materials used in the production, direct labour costs and the overhead costs. The
ratio fluctuates with the changes in the cost of production and indicates the cost
performance of the firm (Fridson et al. 2011). The ratio is calculated as follows:
Cost of Goods Sold ratio (COGS) = 𝐶𝑜𝑠𝑡 𝑜𝑓 𝐺𝑜𝑜𝑑𝑠 𝑆𝑜𝑙𝑑
𝑆𝑎𝑙𝑒𝑠 ∗ 100 (4.7)
4.5.4.1.8 Operating Expenses to Sales Ratio (Oper. Exp.)
Operating expenses, along with the COGS, form the total costs used to
calculate the net profit of a company. The operating expenses contain general and
administrative costs, selling and distribution expenses, the research and
development expenses, and other operating expenses. These costs indicate the cost
of running the business; therefore, lower operating costs to sales ratio indicate the
firm’s ability to be cost competitive in the market.
Since a major part of a firm’s operating expenses include fixed costs (such as
salaries, lease, contracted costs, etc.), it is likely that the operating expense to sales
ratio fluctuates with the changes in sales. In other words, a reduction in this ratio
occurs when the sales increase, and the increase in the ratio occurs when the sales
decrease, while the operating costs remains the same. A close scrutiny is required
when there is no significant movement in this ratio even if the volume of sales
changes significantly (assuming that most of the operating expenses are fixed costs)
(Fridson et al. 2011). Therefore, the analysis of this ratio for the purpose of
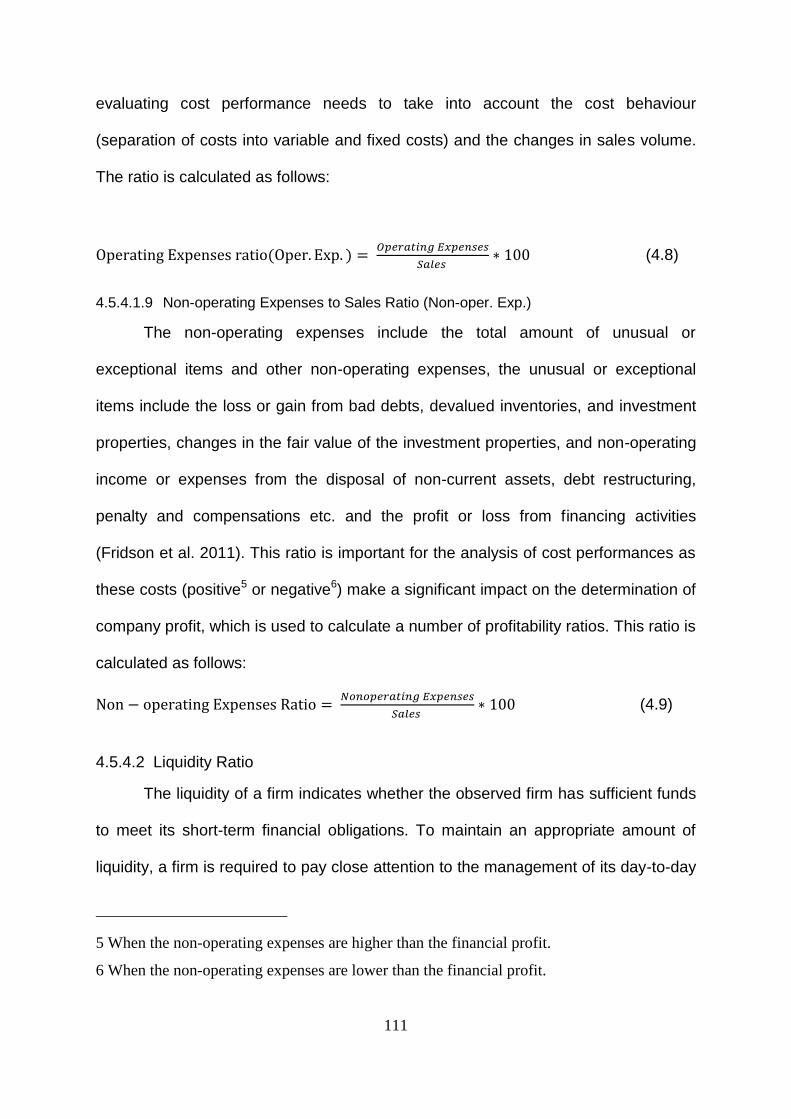
111
evaluating cost performance needs to take into account the cost behaviour
(separation of costs into variable and fixed costs) and the changes in sales volume.
The ratio is calculated as follows:
Operating Expenses ratio(Oper. Exp. ) = 𝑂𝑝𝑒𝑟𝑎𝑡𝑖𝑛𝑔 𝐸𝑥𝑝𝑒𝑛𝑠𝑒𝑠
𝑆𝑎𝑙𝑒𝑠 ∗ 100 (4.8)
4.5.4.1.9 Non-operating Expenses to Sales Ratio (Non-oper. Exp.)
The non-operating expenses include the total amount of unusual or
exceptional items and other non-operating expenses, the unusual or exceptional
items include the loss or gain from bad debts, devalued inventories, and investment
properties, changes in the fair value of the investment properties, and non-operating
income or expenses from the disposal of non-current assets, debt restructuring,
penalty and compensations etc. and the profit or loss from financing activities
(Fridson et al. 2011). This ratio is important for the analysis of cost performances as
these costs (positive5 or negative6) make a significant impact on the determination of
company profit, which is used to calculate a number of profitability ratios. This ratio is
calculated as follows:
Non − operating Expenses Ratio = 𝑁𝑜𝑛𝑜𝑝𝑒𝑟𝑎𝑡𝑖𝑛𝑔 𝐸𝑥𝑝𝑒𝑛𝑠𝑒𝑠
𝑆𝑎𝑙𝑒𝑠 ∗ 100 (4.9)
4.5.4.2 Liquidity Ratio
The liquidity of a firm indicates whether the observed firm has sufficient funds
to meet its short-term financial obligations. To maintain an appropriate amount of
liquidity, a firm is required to pay close attention to the management of its day-to-day
5 When the non-operating expenses are higher than the financial profit.
6 When the non-operating expenses are lower than the financial profit.
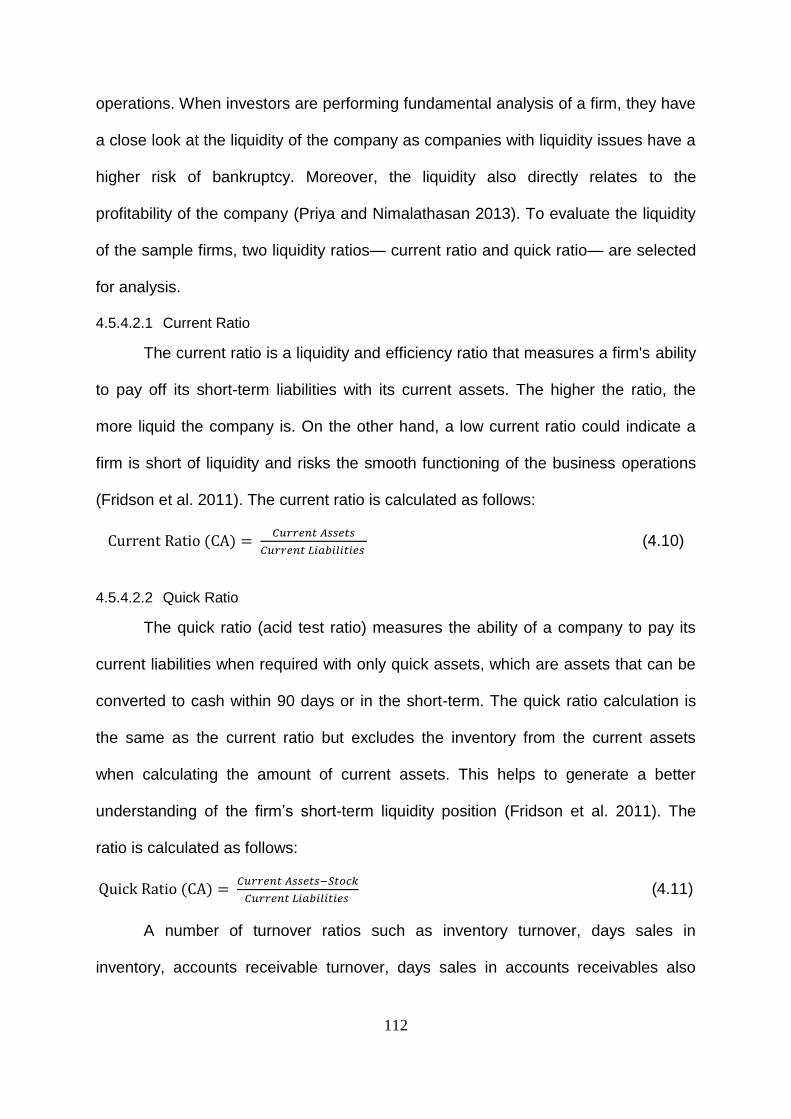
112
operations. When investors are performing fundamental analysis of a firm, they have
a close look at the liquidity of the company as companies with liquidity issues have a
higher risk of bankruptcy. Moreover, the liquidity also directly relates to the
profitability of the company (Priya and Nimalathasan 2013). To evaluate the liquidity
of the sample firms, two liquidity ratios— current ratio and quick ratio— are selected
for analysis.
4.5.4.2.1 Current Ratio
The current ratio is a liquidity and efficiency ratio that measures a firm's ability
to pay off its short-term liabilities with its current assets. The higher the ratio, the
more liquid the company is. On the other hand, a low current ratio could indicate a
firm is short of liquidity and risks the smooth functioning of the business operations
(Fridson et al. 2011). The current ratio is calculated as follows:
Current Ratio (CA) = 𝐶𝑢𝑟𝑟𝑒𝑛𝑡 𝐴𝑠𝑠𝑒𝑡𝑠
𝐶𝑢𝑟𝑟𝑒𝑛𝑡 𝐿𝑖𝑎𝑏𝑖𝑙𝑖𝑡𝑖𝑒𝑠 (4.10)
4.5.4.2.2 Quick Ratio
The quick ratio (acid test ratio) measures the ability of a company to pay its
current liabilities when required with only quick assets, which are assets that can be
converted to cash within 90 days or in the short-term. The quick ratio calculation is
the same as the current ratio but excludes the inventory from the current assets
when calculating the amount of current assets. This helps to generate a better
understanding of the firm’s short-term liquidity position (Fridson et al. 2011). The
ratio is calculated as follows:
Quick Ratio (CA) = 𝐶𝑢𝑟𝑟𝑒𝑛𝑡 𝐴𝑠𝑠𝑒𝑡𝑠−𝑆𝑡𝑜𝑐𝑘
𝐶𝑢𝑟𝑟𝑒𝑛𝑡 𝐿𝑖𝑎𝑏𝑖𝑙𝑖𝑡𝑖𝑒𝑠 (4.11)
A number of turnover ratios such as inventory turnover, days sales in
inventory, accounts receivable turnover, days sales in accounts receivables also
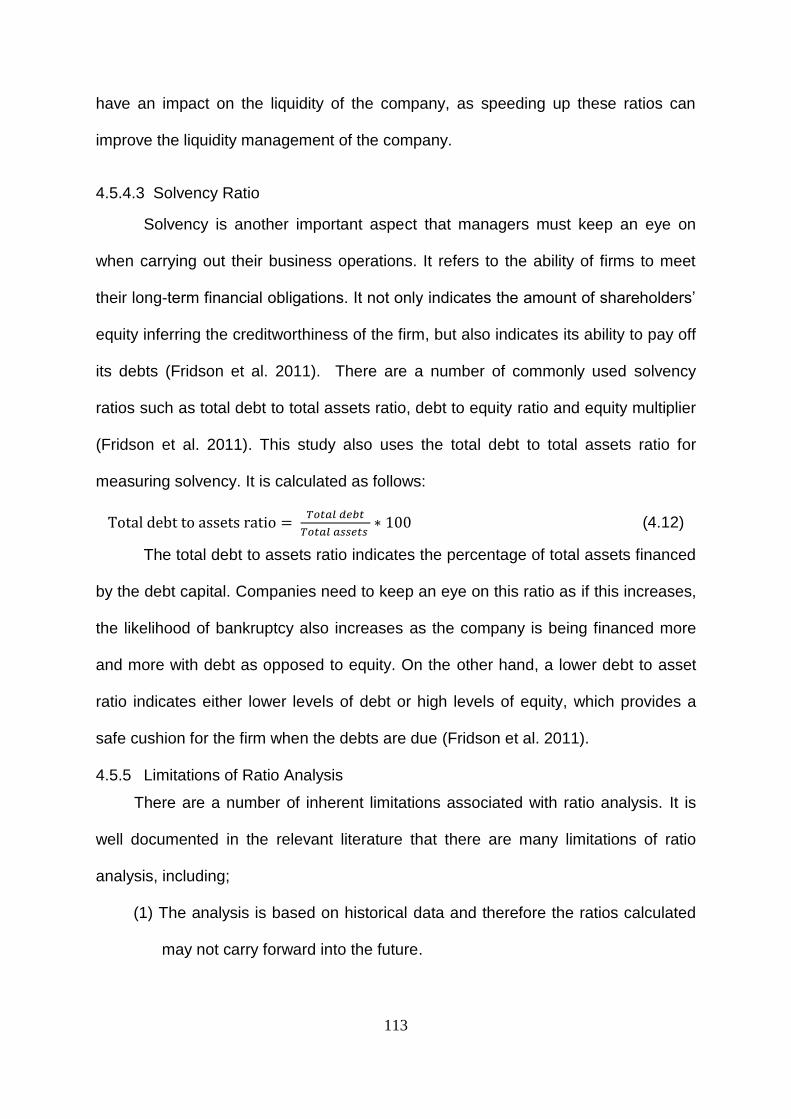
113
have an impact on the liquidity of the company, as speeding up these ratios can
improve the liquidity management of the company.
4.5.4.3 Solvency Ratio
Solvency is another important aspect that managers must keep an eye on
when carrying out their business operations. It refers to the ability of firms to meet
their long-term financial obligations. It not only indicates the amount of shareholders’
equity inferring the creditworthiness of the firm, but also indicates its ability to pay off
its debts (Fridson et al. 2011). There are a number of commonly used solvency
ratios such as total debt to total assets ratio, debt to equity ratio and equity multiplier
(Fridson et al. 2011). This study also uses the total debt to total assets ratio for
measuring solvency. It is calculated as follows:
Total debt to assets ratio = 𝑇𝑜𝑡𝑎𝑙 𝑑𝑒𝑏𝑡
𝑇𝑜𝑡𝑎𝑙 𝑎𝑠𝑠𝑒𝑡𝑠 ∗ 100 (4.12)
The total debt to assets ratio indicates the percentage of total assets financed
by the debt capital. Companies need to keep an eye on this ratio as if this increases,
the likelihood of bankruptcy also increases as the company is being financed more
and more with debt as opposed to equity. On the other hand, a lower debt to asset
ratio indicates either lower levels of debt or high levels of equity, which provides a
safe cushion for the firm when the debts are due (Fridson et al. 2011).
4.5.5 Limitations of Ratio Analysis
There are a number of inherent limitations associated with ratio analysis. It is
well documented in the relevant literature that there are many limitations of ratio
analysis, including;
(1) The analysis is based on historical data and therefore the ratios calculated
may not carry forward into the future.
114
(2) The fact that data from income statements is stated in current costs, while
the data from balance sheets is stated in historical costs, which may
produce unusual or misleading ratio results.
(3) Inflation can make comparisons across accounting periods difficult.
(4) The changes in aggregation, operational changes, accounting policies and
business conditions in past periods make comparisons difficult.
Despite these limitations, ratios are still considered to be critical analysis tools
for assessing performance and financial status of companies.
In addition to the above mentioned commonly known limitations, this study
encountered the following two limitations. First, companies included in the sample of
this study are publicly listed companies and may not include the small and medium
manufacturers in the industry. Second, since this research concentrates on
analysing the performance of manufacturers in the Chinese automobile industry from
2006 to 2014, it does not capture the different economic conditions which existed in
the industry outside the above time period.
4.6 Efficiency of Chinese Automobile Manufacturers
4.6.1 Introduction
In the previous section, ratio analysis was used to measure and evaluate the
performance of Chinese manufacturers. Since some researchers regard financial
ratios as instruments which only partially examine the performance of companies
(Sherman and Gold 1985), the level of efficiency in the Chinese automobile industry
can also be assessed using Data Envelopment Analysis (DEA) which examines the
cost performance of a company from a different point of view.
Sherman and Gold (1985) used DEA to compensate for the weakness of
accounting ratios which were traditionally used as the primary measurement of a
115
company’s performance. They argued that DEA was useful to investigate efficiency
performance, and would eventually be helpful in improving the productivity of
observed organisations. However, Rangan et al. (1988) criticised their study on the
ground that it used a small sample size and did not decompose the technical
efficiency into the pure technical efficiency and scale efficiency, leaving the results to
reflect the inefficiency in the usage of resources. Rangan et al. (1988) proposed to
decompose the technical efficiency to further explain the efficiency of operating units
with the constant returns to scale. Some contemporary literature also provides
justification for the usefulness of DEA as a methodology in investigating the
efficiency performance of financial institutions. Das and Ghosh (2006, 2012)
investigated the efficiency of the Indian commercial banking sector from 1992 to
2002. The study conducted by Rangan (1988) found that there was a positive
relationship between the size of companies and efficiency. Saranga (2009) extended
the DEA methodology and used the input-oriented DEA models to determine the
level of efficiency of Indian component manufacturers.
The following section is structured as follows: section 4.6.2 depicts the
selection of the sample and data collection for DEA analysis. Section 4.6.3 presents
the method of DEA which discusses the DEA model with input and output
orientations under constant return to scale (CRS) and variable return to scale (VRS)
technologies. Section 4.6.4 demonstrates and explains the variables used by the
DEA model and section 4.6.5 describes the limitations to the DEA model.
4.6.2 Selection of the Sample and Data Collection
As presented in Table 4.1 above, the sample for this analysis consisted of 724
observations from 99 listed Chinese Automobile manufacturers, including both
automobile manufacturers and component manufacturers, as classified by the Global
116
Industry Classification Code. However, due to lack of data, total number of
observations was reduced to 624 for the DEA analysis. This consists of 173
observations for 21 automobile manufacturers and 451 observations for 61
component manufacturers. Due to a lack of data, the Indian manufacturers are not
included in the efficiency analysis and, therefore, the analysis conducted in this
section is confined to an efficiency analysis of the Chinese automobile industry only.
In order to calculate the efficiency measures, which include technical
efficiency change, scale efficiency change and analysis on the return to scale, for all
automobile manufactures in China using the DEA model (both CRS and VRS DEA
model), the relevant data used for this analysis was first downloaded from Bureau
Van Dijk’s OSIRIS database (OSIRIS) for the period from 2006 to 2014. Then it was
analysed using the DEAP Version 2.1 computer program to assess the level of
efficiency in Chinese automobile companies.
4.6.3 Method – Data Envelopment Analysis
Data Envelopment Analysis (DEA) is used in this study for the analysis of the
efficiency of the automobile industry in China. DEA was first developed by Charnes,
Cooper and Rhodes (1978) as a linear programming technique to assess the
comparative efficiency of homogeneous operating units. It is developed on the
modern efficiency measurement concepts developed by Farrell (1957) whose work
was in turn influenced by the work of Debreu (1951) and Koopmans (1951).
Originally, the model proposed two efficiency components—technical efficiency and
allocative efficiency. Technical efficiency measures the ability of a firm to produce
the maximum amount of output from a given set of inputs, whilst the allocative
efficiency reflects how well the firm can use its input within given prices and given
production technology. The DEA analysis could be either input or output orientated.
117
In this study, the technical efficiency will be calculated and assessed in relation to
firm performance. A combination of technical efficiency and allocative efficiency is
termed total economic efficiency.
Once the efficiency frontier and efficiency measures of decision-making units
(DMUs) are estimated, the efficient and inefficient DMUs can then be determined.
While DMUs lying on the efficient frontier indicate the unit is a best practice entity
(efficient unit), those DMUs which lie below the frontier are considered as inefficient
units. In terms of measurements, the efficient units have perceived values of
efficiency as “1”, whilst the inefficient units have values varying from “0” to “1”
(Sathye 2001).
The productivity of a manufacturing process is defined by Coelli et al. (2005)
as the ratio of the outputs to the inputs it uses (also known as total factor
productivity). Total factor productivity is used to measure all factors of production.
The labour consumed in a factory, or time performed by a machine is referred to as
the partial factor of productivity.
Although the terms productivity and efficiency are often used interchangeably,
there are some clear differences between the two terms. To indicate the difference,
assume that there is a single input (x) and a single output (y). The 0F’ represents a
production frontier where describes the relationship between the input and the
output. The production frontier also represents the maximum amount of output can
be obtained from individual input level. The level of their production recognized on
the production frontier indicates the level of technology in the industry. When firms
are performing on the production frontier, they are considered technically efficient;
otherwise they are technically inefficient (Coelli et al. 2005). Figure 4.1 depicts this
scenario (X-axis denotes the inputs, Y-axis denotes the output). In Figure 4.1, point
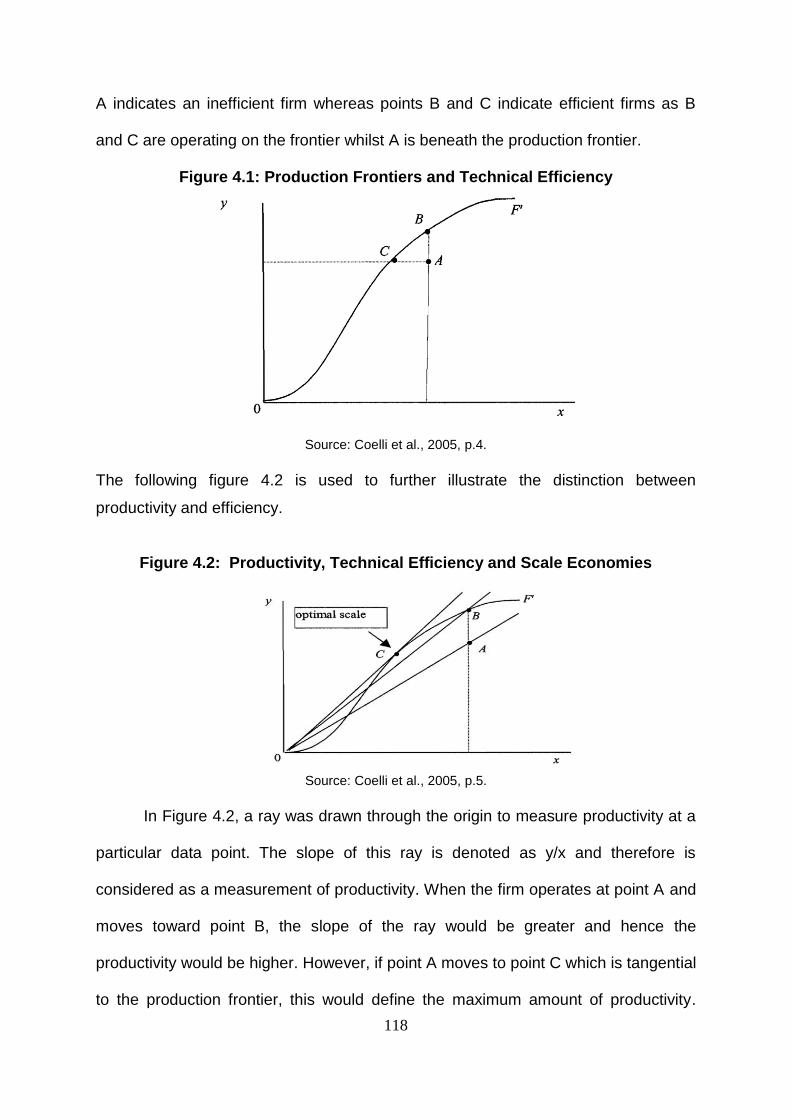
118
A indicates an inefficient firm whereas points B and C indicate efficient firms as B
and C are operating on the frontier whilst A is beneath the production frontier.
Figure 4.1: Production Frontiers and Technical Efficiency
Source: Coelli et al., 2005, p.4.
The following figure 4.2 is used to further illustrate the distinction between
productivity and efficiency.
Figure 4.2: Productivity, Technical Efficiency and Scale Economies
Source: Coelli et al., 2005, p.5.
In Figure 4.2, a ray was drawn through the origin to measure productivity at a
particular data point. The slope of this ray is denoted as y/x and therefore is
considered as a measurement of productivity. When the firm operates at point A and
moves toward point B, the slope of the ray would be greater and hence the
productivity would be higher. However, if point A moves to point C which is tangential
to the production frontier, this would define the maximum amount of productivity.
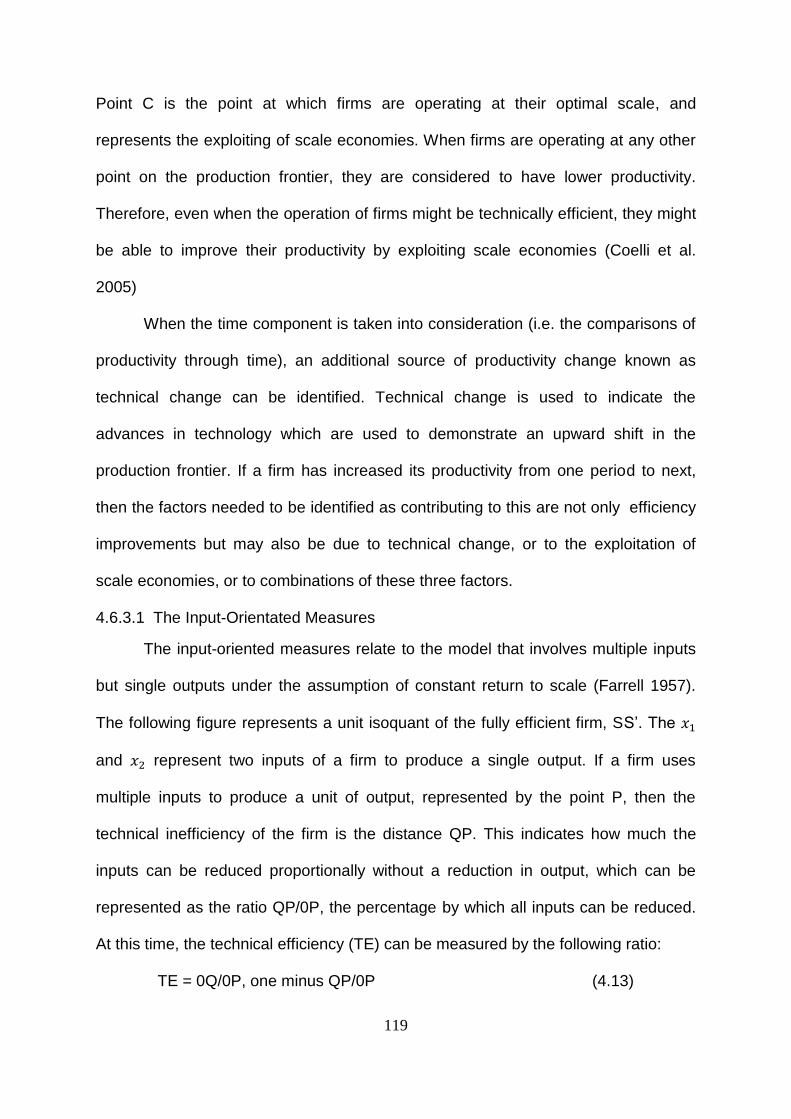
119
Point C is the point at which firms are operating at their optimal scale, and
represents the exploiting of scale economies. When firms are operating at any other
point on the production frontier, they are considered to have lower productivity.
Therefore, even when the operation of firms might be technically efficient, they might
be able to improve their productivity by exploiting scale economies (Coelli et al.
2005)
When the time component is taken into consideration (i.e. the comparisons of
productivity through time), an additional source of productivity change known as
technical change can be identified. Technical change is used to indicate the
advances in technology which are used to demonstrate an upward shift in the
production frontier. If a firm has increased its productivity from one period to next,
then the factors needed to be identified as contributing to this are not only efficiency
improvements but may also be due to technical change, or to the exploitation of
scale economies, or to combinations of these three factors.
4.6.3.1 The Input-Orientated Measures
The input-oriented measures relate to the model that involves multiple inputs
but single outputs under the assumption of constant return to scale (Farrell 1957).
The following figure represents a unit isoquant of the fully efficient firm, SS’. The 𝑥1
and 𝑥2 represent two inputs of a firm to produce a single output. If a firm uses
multiple inputs to produce a unit of output, represented by the point P, then the
technical inefficiency of the firm is the distance QP. This indicates how much the
inputs can be reduced proportionally without a reduction in output, which can be
represented as the ratio QP/0P, the percentage by which all inputs can be reduced.
At this time, the technical efficiency (TE) can be measured by the following ratio:
TE = 0Q/0P, one minus QP/0P (4.13)
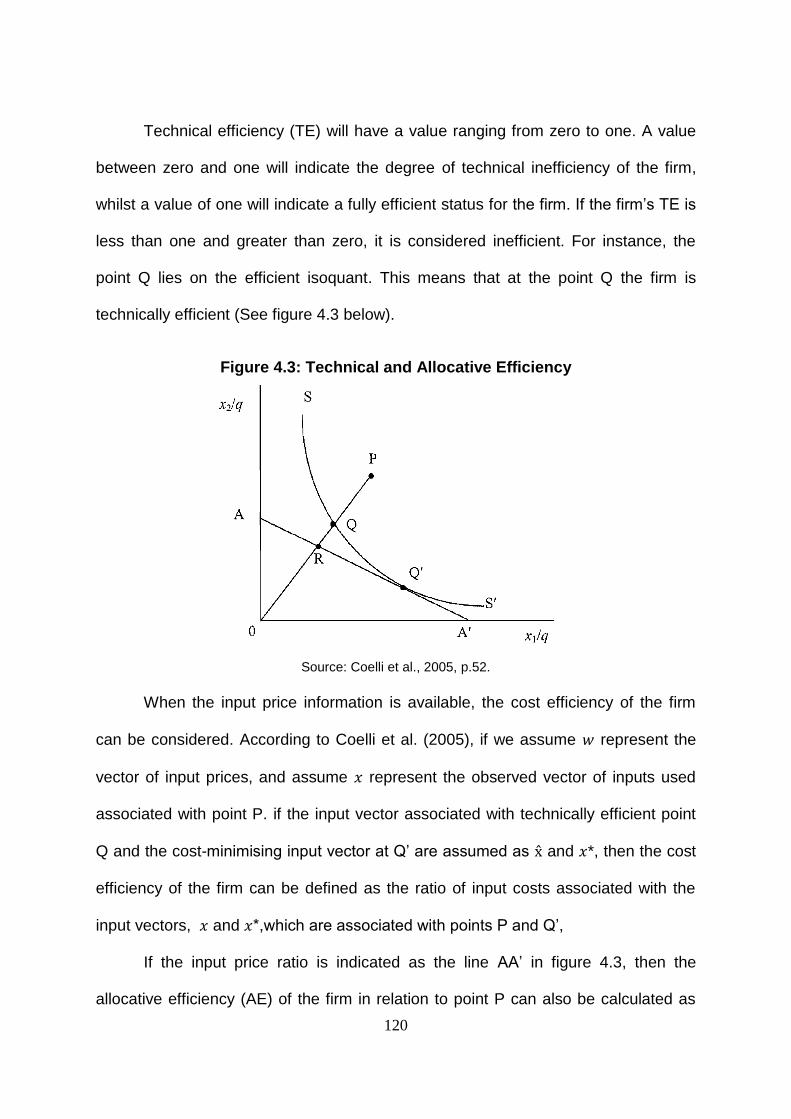
120
Technical efficiency (TE) will have a value ranging from zero to one. A value
between zero and one will indicate the degree of technical inefficiency of the firm,
whilst a value of one will indicate a fully efficient status for the firm. If the firm’s TE is
less than one and greater than zero, it is considered inefficient. For instance, the
point Q lies on the efficient isoquant. This means that at the point Q the firm is
technically efficient (See figure 4.3 below).
Figure 4.3: Technical and Allocative Efficiency
Source: Coelli et al., 2005, p.52.
When the input price information is available, the cost efficiency of the firm
can be considered. According to Coelli et al. (2005), if we assume 𝑤 represent the
vector of input prices, and assume 𝑥 represent the observed vector of inputs used
associated with point P. if the input vector associated with technically efficient point
Q and the cost-minimising input vector at Q’ are assumed as x̂ and 𝑥*, then the cost
efficiency of the firm can be defined as the ratio of input costs associated with the
input vectors, 𝑥 and 𝑥*,which are associated with points P and Q’,
If the input price ratio is indicated as the line AA’ in figure 4.3, then the
allocative efficiency (AE) of the firm in relation to point P can also be calculated as
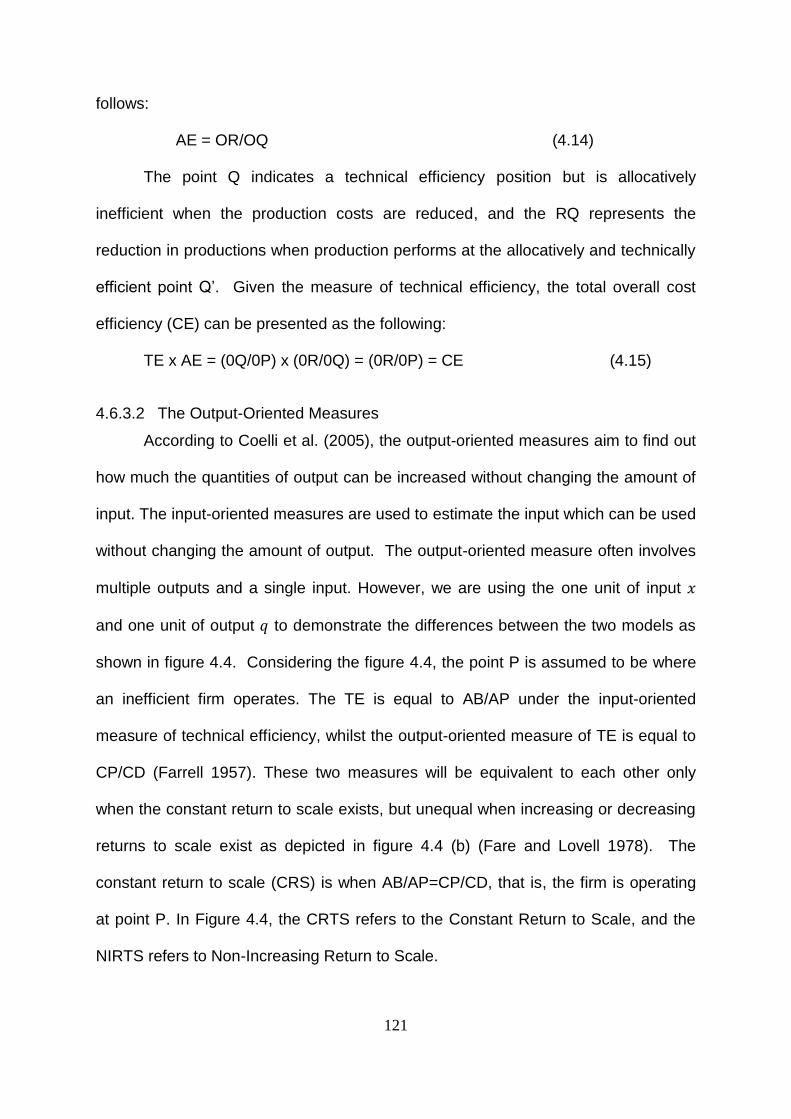
121
follows:
AE = OR/OQ (4.14)
The point Q indicates a technical efficiency position but is allocatively
inefficient when the production costs are reduced, and the RQ represents the
reduction in productions when production performs at the allocatively and technically
efficient point Q’. Given the measure of technical efficiency, the total overall cost
efficiency (CE) can be presented as the following:
TE x AE = (0Q/0P) x (0R/0Q) = (0R/0P) = CE (4.15)
4.6.3.2 The Output-Oriented Measures
According to Coelli et al. (2005), the output-oriented measures aim to find out
how much the quantities of output can be increased without changing the amount of
input. The input-oriented measures are used to estimate the input which can be used
without changing the amount of output. The output-oriented measure often involves
multiple outputs and a single input. However, we are using the one unit of input 𝑥
and one unit of output 𝑞 to demonstrate the differences between the two models as
shown in figure 4.4. Considering the figure 4.4, the point P is assumed to be where
an inefficient firm operates. The TE is equal to AB/AP under the input-oriented
measure of technical efficiency, whilst the output-oriented measure of TE is equal to
CP/CD (Farrell 1957). These two measures will be equivalent to each other only
when the constant return to scale exists, but unequal when increasing or decreasing
returns to scale exist as depicted in figure 4.4 (b) (Fare and Lovell 1978). The
constant return to scale (CRS) is when AB/AP=CP/CD, that is, the firm is operating
at point P. In Figure 4.4, the CRTS refers to the Constant Return to Scale, and the
NIRTS refers to Non-Increasing Return to Scale.
122
Figure 4.4: Input- and Output-Orientated Technical Efficiency
Source: Coelli et al., 2005, p.55.
4.6.3.3 The Constant Return to Scale
The constant return to scale (CRS) assumption was proposed by Charnes,
Cooper and Rhodes (1978) (CCR) in order to establish technical efficiency indices.
The CRS assumption is estimated to operate for firms which are at their optimal
scale of P.
It assumes that there are K inputs and M outputs for each of the decision-
making units (DMUs), and the number of DMUs is assumed to be 𝑖. The number of
DMUs is represented by the vector 𝑥𝑖 and 𝑦𝑖, respectively. Where N indicates the
data of all DMUs, the 𝑥 is represented as 𝐾 × 𝑁 input matrix, and 𝑌 is represented as
𝑀 × 𝑁 output matrix. The points produced from the DEA model lie on or below the
production frontier.
Since DEA is measured in a ratio form, a measure of the ratio of all outputs
over all inputs is indicated as 𝑢’𝑦𝑖/𝑣′𝑥𝑖, where 𝑢 is an 𝑀 × 1 vector of output
weights and 𝑣 is a 𝐾 × 1 vector of input weights. Therefore, the optimal weights for
the ratio of all outputs over all inputs are solved by the following mathematical
programming through the DEA model:
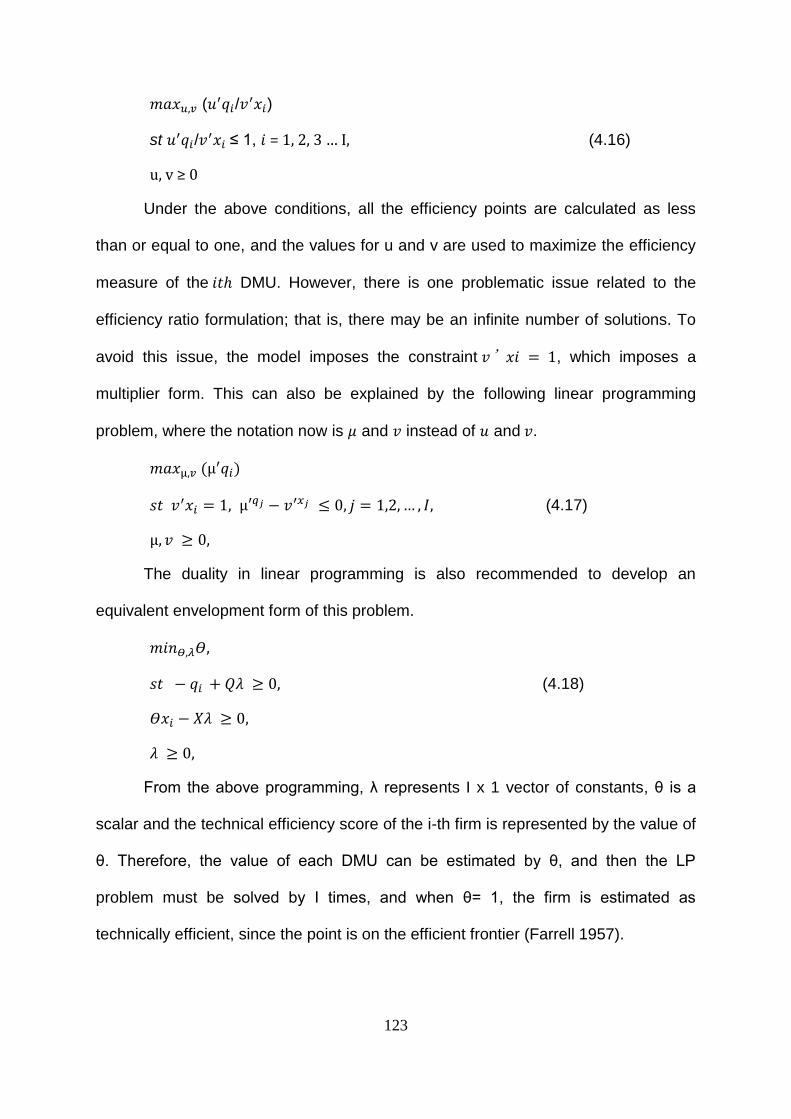
123
𝑚𝑎𝑥𝑢,𝑣 (𝑢′𝑞𝑖/𝑣′𝑥𝑖)
st 𝑢′𝑞𝑖/𝑣′𝑥𝑖 ≤ 1, 𝑖 = 1, 2, 3 … I, (4.16)
u, v ≥ 0
Under the above conditions, all the efficiency points are calculated as less
than or equal to one, and the values for u and v are used to maximize the efficiency
measure of the 𝑖𝑡ℎ DMU. However, there is one problematic issue related to the
efficiency ratio formulation; that is, there may be an infinite number of solutions. To
avoid this issue, the model imposes the constraint 𝑣’𝑥𝑖 = 1, which imposes a
multiplier form. This can also be explained by the following linear programming
problem, where the notation now is 𝜇 and 𝑣 instead of 𝑢 and 𝑣.
𝑚𝑎𝑥µ,𝑣 (µ′𝑞𝑖)
𝑠𝑡 𝑣′𝑥𝑖 = 1, µ′𝑞𝑗 − 𝑣′𝑥𝑗 ≤ 0, 𝑗 = 1,2, … , 𝐼, (4.17)
µ, 𝑣 ≥ 0,
The duality in linear programming is also recommended to develop an
equivalent envelopment form of this problem.
𝑚𝑖𝑛𝛳,𝜆𝛳,
𝑠𝑡 − 𝑞𝑖 + 𝑄𝜆 ≥ 0, (4.18)
𝛳𝑥𝑖 − 𝑋𝜆 ≥ 0,
𝜆 ≥ 0,
From the above programming, λ represents I x 1 vector of constants, θ is a
scalar and the technical efficiency score of the i-th firm is represented by the value of
θ. Therefore, the value of each DMU can be estimated by θ, and then the LP
problem must be solved by I times, and when θ= 1, the firm is estimated as
technically efficient, since the point is on the efficient frontier (Farrell 1957).
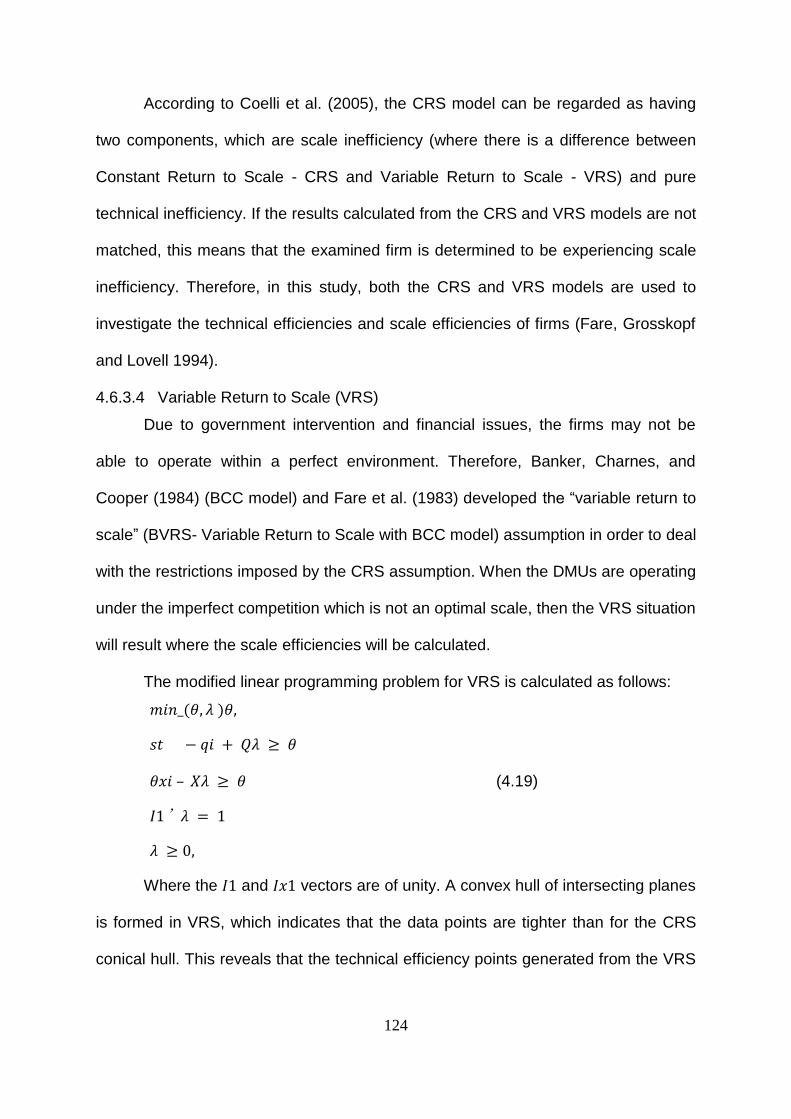
124
According to Coelli et al. (2005), the CRS model can be regarded as having
two components, which are scale inefficiency (where there is a difference between
Constant Return to Scale - CRS and Variable Return to Scale - VRS) and pure
technical inefficiency. If the results calculated from the CRS and VRS models are not
matched, this means that the examined firm is determined to be experiencing scale
inefficiency. Therefore, in this study, both the CRS and VRS models are used to
investigate the technical efficiencies and scale efficiencies of firms (Fare, Grosskopf
and Lovell 1994).
4.6.3.4 Variable Return to Scale (VRS)
Due to government intervention and financial issues, the firms may not be
able to operate within a perfect environment. Therefore, Banker, Charnes, and
Cooper (1984) (BCC model) and Fare et al. (1983) developed the “variable return to
scale” (BVRS- Variable Return to Scale with BCC model) assumption in order to deal
with the restrictions imposed by the CRS assumption. When the DMUs are operating
under the imperfect competition which is not an optimal scale, then the VRS situation
will result where the scale efficiencies will be calculated.
The modified linear programming problem for VRS is calculated as follows:
𝑚𝑖𝑛_(𝜃, 𝜆 )𝜃,
𝑠𝑡 − 𝑞𝑖 + 𝑄𝜆 ≥ 𝜃
𝜃𝑥𝑖 – 𝑋𝜆 ≥ 𝜃 (4.19)
𝐼1’𝜆 = 1
𝜆 ≥ 0,
Where the 𝐼1 and 𝐼𝑥1 vectors are of unity. A convex hull of intersecting planes
is formed in VRS, which indicates that the data points are tighter than for the CRS
conical hull. This reveals that the technical efficiency points generated from the VRS
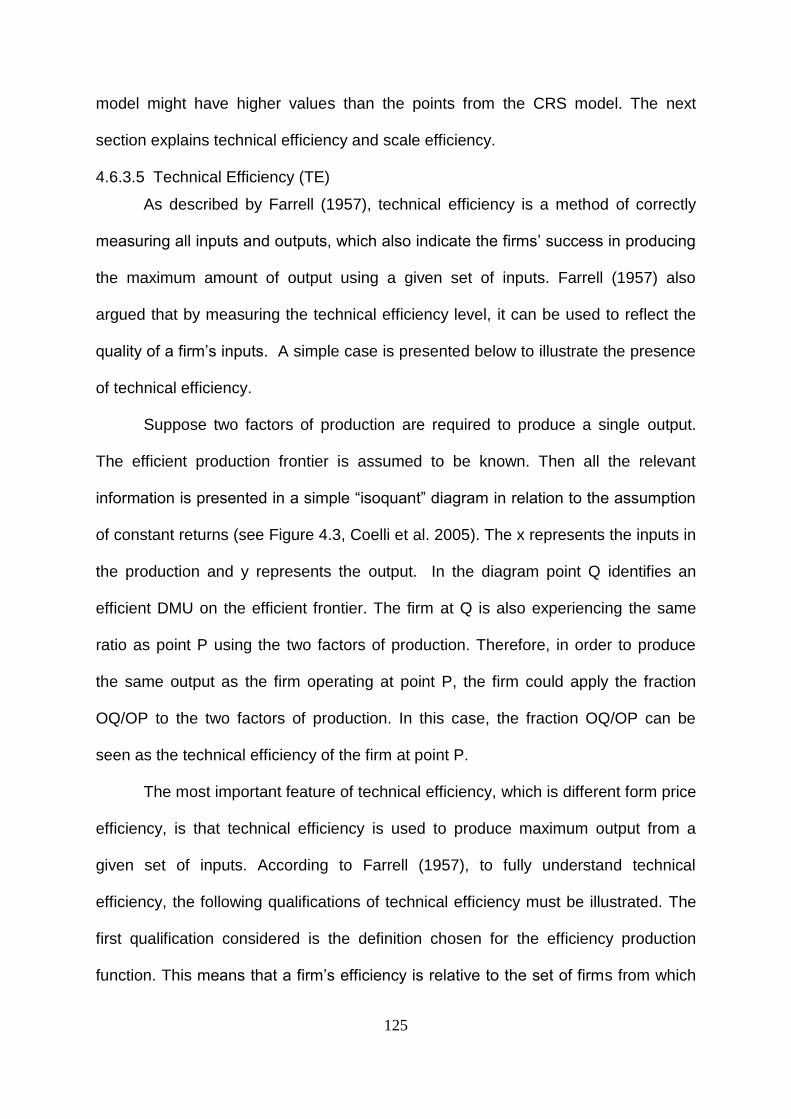
125
model might have higher values than the points from the CRS model. The next
section explains technical efficiency and scale efficiency.
4.6.3.5 Technical Efficiency (TE)
As described by Farrell (1957), technical efficiency is a method of correctly
measuring all inputs and outputs, which also indicate the firms’ success in producing
the maximum amount of output using a given set of inputs. Farrell (1957) also
argued that by measuring the technical efficiency level, it can be used to reflect the
quality of a firm’s inputs. A simple case is presented below to illustrate the presence
of technical efficiency.
Suppose two factors of production are required to produce a single output.
The efficient production frontier is assumed to be known. Then all the relevant
information is presented in a simple “isoquant” diagram in relation to the assumption
of constant returns (see Figure 4.3, Coelli et al. 2005). The x represents the inputs in
the production and y represents the output. In the diagram point Q identifies an
efficient DMU on the efficient frontier. The firm at Q is also experiencing the same
ratio as point P using the two factors of production. Therefore, in order to produce
the same output as the firm operating at point P, the firm could apply the fraction
OQ/OP to the two factors of production. In this case, the fraction OQ/OP can be
seen as the technical efficiency of the firm at point P.
The most important feature of technical efficiency, which is different form price
efficiency, is that technical efficiency is used to produce maximum output from a
given set of inputs. According to Farrell (1957), to fully understand technical
efficiency, the following qualifications of technical efficiency must be illustrated. The
first qualification considered is the definition chosen for the efficiency production
function. This means that a firm’s efficiency is relative to the set of firms from which
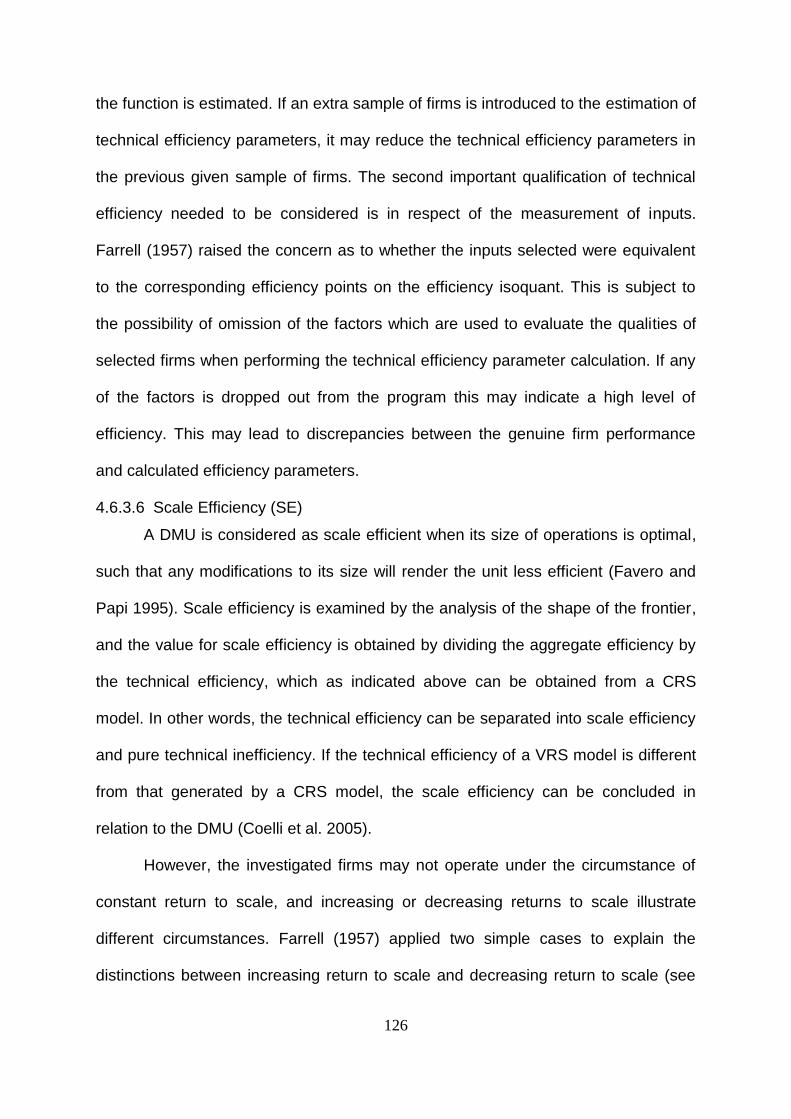
126
the function is estimated. If an extra sample of firms is introduced to the estimation of
technical efficiency parameters, it may reduce the technical efficiency parameters in
the previous given sample of firms. The second important qualification of technical
efficiency needed to be considered is in respect of the measurement of inputs.
Farrell (1957) raised the concern as to whether the inputs selected were equivalent
to the corresponding efficiency points on the efficiency isoquant. This is subject to
the possibility of omission of the factors which are used to evaluate the qualities of
selected firms when performing the technical efficiency parameter calculation. If any
of the factors is dropped out from the program this may indicate a high level of
efficiency. This may lead to discrepancies between the genuine firm performance
and calculated efficiency parameters.
4.6.3.6 Scale Efficiency (SE)
A DMU is considered as scale efficient when its size of operations is optimal,
such that any modifications to its size will render the unit less efficient (Favero and
Papi 1995). Scale efficiency is examined by the analysis of the shape of the frontier,
and the value for scale efficiency is obtained by dividing the aggregate efficiency by
the technical efficiency, which as indicated above can be obtained from a CRS
model. In other words, the technical efficiency can be separated into scale efficiency
and pure technical inefficiency. If the technical efficiency of a VRS model is different
from that generated by a CRS model, the scale efficiency can be concluded in
relation to the DMU (Coelli et al. 2005).
However, the investigated firms may not operate under the circumstance of
constant return to scale, and increasing or decreasing returns to scale illustrate
different circumstances. Farrell (1957) applied two simple cases to explain the
distinctions between increasing return to scale and decreasing return to scale (see
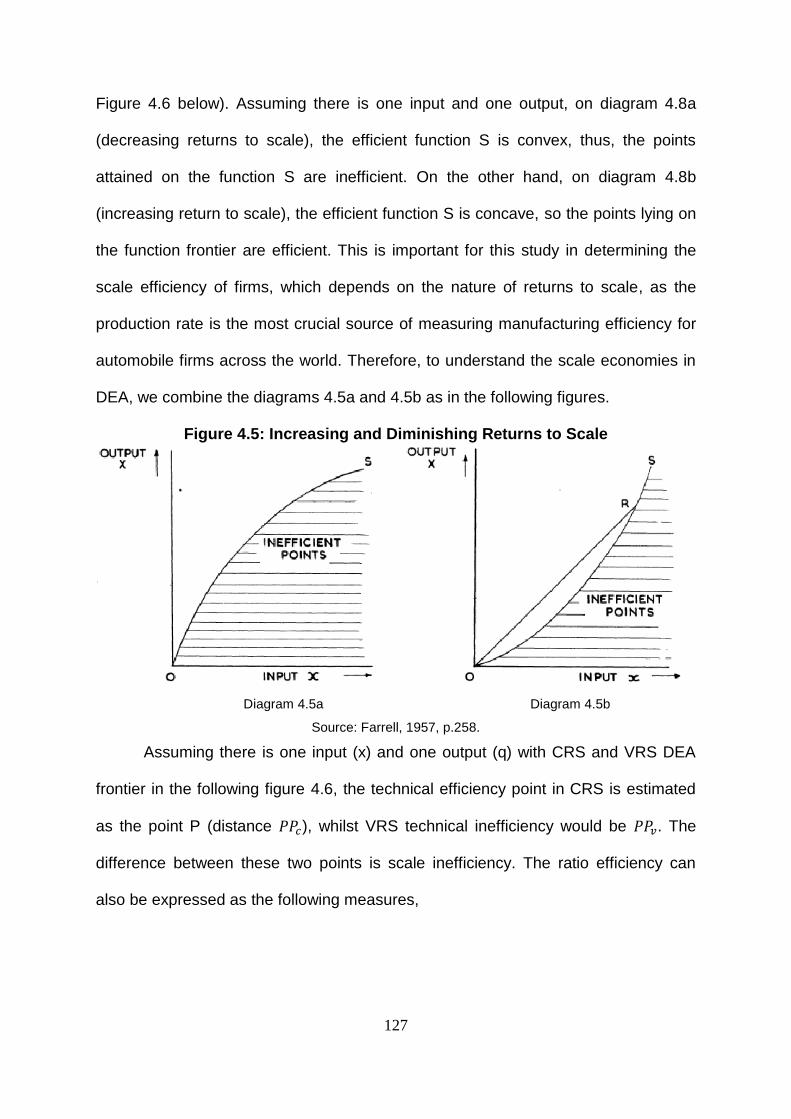
127
Figure 4.6 below). Assuming there is one input and one output, on diagram 4.8a
(decreasing returns to scale), the efficient function S is convex, thus, the points
attained on the function S are inefficient. On the other hand, on diagram 4.8b
(increasing return to scale), the efficient function S is concave, so the points lying on
the function frontier are efficient. This is important for this study in determining the
scale efficiency of firms, which depends on the nature of returns to scale, as the
production rate is the most crucial source of measuring manufacturing efficiency for
automobile firms across the world. Therefore, to understand the scale economies in
DEA, we combine the diagrams 4.5a and 4.5b as in the following figures.
Figure 4.5: Increasing and Diminishing Returns to Scale
Diagram 4.5a Diagram 4.5b
Source: Farrell, 1957, p.258.
Assuming there is one input (x) and one output (q) with CRS and VRS DEA
frontier in the following figure 4.6, the technical efficiency point in CRS is estimated
as the point P (distance 𝑃𝑃𝑐), whilst VRS technical inefficiency would be 𝑃𝑃𝑣. The
difference between these two points is scale inefficiency. The ratio efficiency can
also be expressed as the following measures,
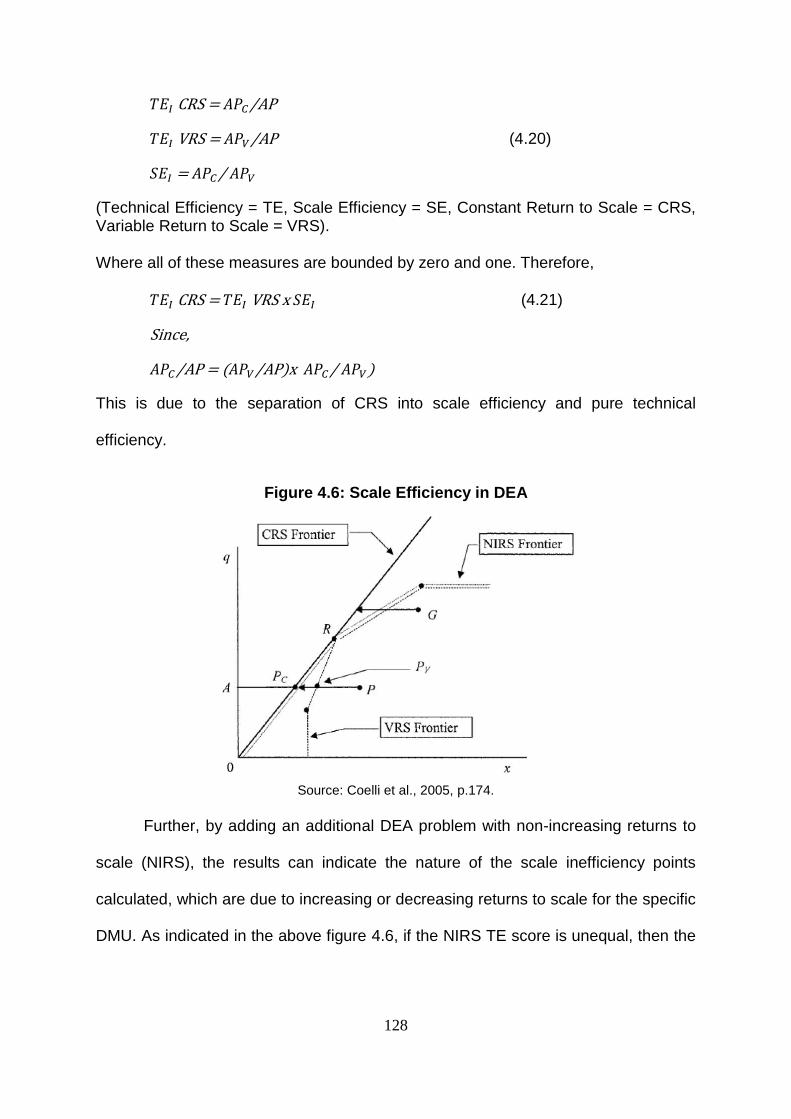
128
𝑇𝐸𝐼 CRS = 𝐴𝑃𝐶/AP
𝑇𝐸𝐼 VRS = 𝐴𝑃𝑉/AP (4.20)
𝑆𝐸𝐼 = 𝐴𝑃𝐶/ 𝐴𝑃𝑉
(Technical Efficiency = TE, Scale Efficiency = SE, Constant Return to Scale = CRS, Variable Return to Scale = VRS). Where all of these measures are bounded by zero and one. Therefore,
𝑇𝐸𝐼 CRS = 𝑇𝐸𝐼 VRS x 𝑆𝐸𝐼 (4.21)
Since,
𝐴𝑃𝐶/AP = (𝐴𝑃𝑉/AP)x 𝐴𝑃𝐶/ 𝐴𝑃𝑉)
This is due to the separation of CRS into scale efficiency and pure technical
efficiency.
Figure 4.6: Scale Efficiency in DEA
Source: Coelli et al., 2005, p.174.
Further, by adding an additional DEA problem with non-increasing returns to
scale (NIRS), the results can indicate the nature of the scale inefficiency points
calculated, which are due to increasing or decreasing returns to scale for the specific
DMU. As indicated in the above figure 4.6, if the NIRS TE score is unequal, then the
129
DMU has increasing returns to scale (point P), while, if they are equal (point Q in the
figure 4.3), the decreasing returns to scale exists (BIE 1994).
4.6.3.7 Nature of return to scale analysis
The return to scale analysis is described by a simple method by Zhu and
Shen (1995) with an explanation of the CRS and VRS scores (in this case the CRS)
which are represented by λ. The following situations can be used to determine the
returns to scale (RTS) of the DMU:
1. If CRS score = VRS score, the DMU is considered as having a constant
return to scale (CRS).
2. If CRS score ≠ VRS score, and Σ λ<1, the DMU is considered as having
an increasing return to scale (IRS)
3. If CRS score ≠ VRS score, and Σ λ>1, the DMU is considered as having a
decreasing return to scale (DRS)
According to Saranga (2009), the RTS indicates an unambiguous meaning
when DMUs are on the VRS efficiency frontier. Further, when the DMUs are CRS
inefficient firms while operating in the decreasing return to scale (DRS) region, this
implies that the DMUs are not operating at optimum scale levels, and any additional
unit of production results in smaller returns for those DMUs. On the other hand,
when the DMUs operate in the increasing return to scale (IRS) region, this implies
that the firms might have excess capacity to produce, and each additional unit of
production will result in a higher return. This may put these DMUs in a better position
to promote themselves with extra production volume and productive size scale.
130
4.6.3.8 Variables and variable measurements
The efficiency points are calculated using the labour (number of employees),
material costs (stock level consists of costs of work in process, finished goods),
capital (total amount of fixed assets) and operating expenses, while the output is
measured using the gross profit for year.
In order to calculate the relative efficiency on the observed DMUs, the inputs
and outputs of the firms in the Chinese automobile industry must be determined.
However, there is no consensus on the determinations of inputs and outputs.
According to Coelli et al. (2005), for the single-output firms, the output is often
measured by the number of units produced in the calendar year. However, there are
some issues that need to be considered with such measurement. In most cases, the
output is measured in terms of sales during the year. In this instance, the sales data
may need to be adjusted with the change in inventories that may have occurred
during the year in order to reflect the actual production of the year (if using the
production volume as the output). If the firms are producing different types of
products, the selection of data is more complicated and will impact on the quality of
the data. However, in many practical applications, if the firms are operating in the
same industry and selling products at similar volumes, then the nominal values of
sales can be considered as a precise measurement of the output (Coelli et al. 2005).
Coelli et al. (2005) also provides a guideline for classification of commonly-
used inputs which are capital (K), labour (L), energy (E), material inputs (M) and
purchased services (S). This classification is also referred as the KLEMS approach.
In this analysis, we use a similar approach to that of Coelli et al. (2005) to investigate
the efficiency performance of Chinese automobile and auto component
manufacturers. However, instead of using energy and purchased services (Coelli et
131
al. 2005), we use the operating expenses to substitute the “other input” (as
demonstrated in the following section). The following section provides further
justification for the selection of inputs and outputs.
In the context of the Chinese automobile industry, the following inputs (with
respect to the DEA program) are considered as prominent: the labour (human
capital), materials costs, capital and operating expenses (Wang 2003; Awan et al.
2014). The low labour cost, labour intensive manufacturing environment and low raw
materials costs have made the Chinese manufacturing industry highly competitive in
the global market (Awan et al. 2014; Morrison 2014). Contractor (2013) further
argued that cheap labour is the source of competitiveness of emerging markets,
including China, to develop a sustainable industry in the global market.
Labour is the most commonly used input (Cazals et al. 2002; Van den Bergh et
al. 2013) and is one of major components of the total manufacturing cost in many
manufacturing firms (Manello et al. 2016; Kapelko and Lansink 2017). Labour and
capital are considered as the two primary inputs to any firms and have considerable
importance. Coelli et al. (2005, p.142) identified some measures of the labour input:
4. Number of persons employed.
5. Number of hours of labour worked.
6. Number of full-time equivalent employees.
7. The total wages and salaries bill.
Number of employees is a most commonly used input variable (Saranga
2009). It indicates the capacity of firms that can be used or utilized in their production
process. Often, the number of employees can also be categorized into full-time and
part-time employees to have a more detailed analysis of the derived output level.
The number of hours of labour worked can also be used depending on the
132
availability of data. The number of employees who work on particular product can be
divided into full-time or part-time employees and used as input to demonstrate the
level of efficiency and productivity. Wages and salaries are also commonly used as
an input variable, although the quality of the data on this measure may be subject to
a number of limitations, such as variations in pay rates between the companies and
the different bases on which salaries and wages payments are determined.
Capital input is also considered as a significant input measurement (Coelli et al.
2005; Saranga 2009). Different from the material and labour input, the capital input
relates to the costs incurred by a firm for the purpose of generating income. Capital
input is commonly used from one accounting period to the next until the firm
disposes of the asset and replaces it with a new one. According to Coelli et al.
(2005), the capital input is commonly measured by total service flows from capital
assets, and the assets considered are the fixed assets used to generate profits in a
given accounting period. Coelli et al. (2005) provide some more examples of capital
inputs, such as inventory balance on a perpetual inventory system and replacement
value of capital stocks held by a firm.
Material input is another significant input used in DEA analysis. However,
collecting the data on this is considerably difficult and depends on the availability of
information provided by the observed firms. It reflects the efficiency and productivity
of firms at a single point of time.
Operating Expense is another component that has been widely used in DEA
analysis (Ataullah and Le 2006). In the context of a manufacturing firm, the operating
expenses represent the expenditure on the operating activities such as
administrative expenses, selling expenses rather than manufacturing activities. The
operating activities are the activities undertaken to improve the efficiency of the
133
product manufacturing process. The operating expense is important for the analyst
as it does partially reflect the efficiency of manufacturing and also represents the
efficiency of operations in relation to administrative matters, quality control and
corporate governance.
In an examination of efficiency in the Indian automobile component industry,
Saranga (2009) considered the costs of raw materials, labour, capital and sundry
expenses as the input variables while the gross income was regarded as the output
variable. Tomkins and Green (1988) in examining the efficiency of an accounting
department of a UK university, applied full time staff numbers as the inputs to
evaluate the outputs of undergraduates, research postgraduates, teaching
postgraduates and total income. After having considered the output variables used in
prior studies, the gross profit was chosen an appropriate output variable to examine
the efficiency of automobile industry in China.
Tangible and intangible fixed assets are considered as input in DEA
analysis. Tangible fixed assets include: net stated land (land subtract total land
depreciation), net stated buildings (buildings subtract total buildings depreciation),
net stated plant and machinery (plant and machinery subtract plant and machinery
depreciation), net transportation equipment (transportation equipment subtract
transportation equipment depreciation), net leased assets (leased assets subtract
leased assets depreciation), net other property plant and equipment (other property
plant and equipment subtract related depreciation) and accumulated depreciation.
Intangible fixed assets, on the other hand, include: the goodwill and other intangibles
(intangibles of capitalized development subtract net stated goodwill). Other fixed
assets include long term receivables, investments including investment in long term
associated companies, investment in properties, and other long term assets.
134
Since the main objective of this study is to examine the competitiveness and
efficiency of the Chinese automobile industry, the input variables selected for this
study are: labour (number of employees); the cost of inventory for the year as a
substitute for the raw materials and work in process costs; Gross Fixed Assets as a
proxy for “Investments in capital equipment” stated as capital employed (Saranga,
2009; Matthews 2013; Das and Kumbhakar, 2001 and Zhou et al.,2013) and
operating expenses, excluding depreciation/amortization expenses (Drake 2001 et
al. 1992, 1996; Drake 1992, 1995 and Miller and Noulas 1996).
4.6.3.9 Limitations of DEA
As stated by Coelli et al. (2005), the main limitations of DEA are as follows:
(1) The measurement errors and other noise may influence the shape and
position of the frontier. For instance, the measurement may be influenced
by contextual factors such as varied geographical locations, social
conditions, the ownership, regulatory policies and environmental conditions
and regulations.
(2) The outliers may influence the results to be invalid.
(3) The omission of an important input or output can result in biased results. (4)
The inclusion of extra firms (e.g. from other countries) may reduce
efficiency scores. When comparing the mean efficiency scores from two
studies, the scores may only reflect the dispersion of efficiencies within
each sample, and indicate nothing about the efficiency of one sample
relative to the other.
(5) The addition of an extra firm in a DEA analysis cannot result in an increase
in the TE scores of the existing firms.
135
(6) Treating inputs and/or outputs as homogenous commodities, when they are
in fact heterogeneous, may bias the results.
Therefore, it is important that the results of DEA analysis need to be interpreted
in light of these limitations.
4.7 Multivariate Regression Analysis
4.7.1 Introduction
In the previous section, the DEA model, which is used to investigate the level
of efficiency in the Chinese automobile industry, was described. In this section,
Multivariate Regression Analysis is used to examine the factors affecting various
performance indicators (ROA, ROE, Tobin’s q and Efficiency) of the Chinese
automobile Industry.
The following section is structured as follows: section 4.7.2 presents the
samples and data collection used for multivariate regression analysis. Section 4.7.3
introduces the multivariate regression analysis model used in this study. Section
4.7.4 describes the factors identified from the literature review which may affect the
performance of Chinese automobile companies while section 4.7.5 describes the
selected dependent variables used to measure the firm’s performances. Section
4.7.6 provides a description as to how each of the independent variables in the
model is measured. The final section (4.7.7) presents some of the limitations of the
regression method.
4.7.2 Selection of Sample and Data Collection
As in the case of DEA analysis, the data used in this section comes from the
OSIRIS database. However, due to lack of data for some variable used in the
regression analysis, the number of observations was reduced to 600 observations
for the initial total observation of 724 observations. This data set included both
Chinese Automobile and component manufacturers as classified by the Global
136
Industry Classification Code. Within the sample, 173 observations were made of 35
automobile manufacturers, whilst 516 observations were made of 84 component
manufacturers. Data on the technical efficiency of listed manufacturers in the
Chinese automobile industry, which is one of the dependent variables of this study,
is obtained from the DEA analysis described in the previous section.
4.7.3 Multivariate Regression Analysis Model
The multivariate regression model is a statistical technique in which the
independent and control variables have predictive power over the dependent
variables (Neuman 2011). Statistically, the R-squared value shows how well the
independent variables explain the changes in the dependent variables. The higher
the value of the R-squared, the more predictive power the independent variables
have on the dependent variables. It also indicates the direction and size of the effect
of each independent variable on the dependent variable. Neuman (2011) claimed
that the multivariate regression analysis measures the effect precisely and indicates
this with numerical values. The model can be used to perform tests to determine the
statistical significance of variable coefficients. The beta coefficient indicates the
correlation coefficient of independent variables. It can also be used to test the effect
from the control variables. For example, if the beta coefficient has no change before
and after adding the control variables to the regression model, then the control
variables can be argued as having no effect on the dependent variables, and vice
versa.
Using the multivariate regression analysis, this study attempts to examine the
impact which the tested factors have on the 4 performance measures of the Chinese
automobile companies. For this purpose, the following six factors have been
137
identified from the literature review as factors likely to be influencing the performance
of Chinese automobile companies.
4.7.4 Factors Affecting Firm Performance
The factors that have been selected for this examination are: the ownership
structure (Jensen and Meckling 1976), the capital structure (Myers 1977; Grossman
and Hart 1982; Williams 1986; Margaristis and Psillaski 2008), the sustainable
growth of firms (Coad et al. 2016; Kim et al. 2016), age of firms (Calantone et al.
2002; Fonseka et al. 2015), size of firms (Kole 1995; Chu 2011) and the state control
over the assessed manufacturers (Sun et al. 2002). These factors are described in
the following sections.
4.7.4.1 Government Ownership, Foreign Ownership and Institutional Ownership
Jensen and Meckling (1976) produced a classical model on the issues related
to the owner-manager relationship. They argued that if the managers have share-
ownership, this may help to align the interests of managers and shareholders.
Therefore, they argued that a larger proportion of ownership by management results
in better firm performance. In contrast, Demsetz (1983) argued that a share-
ownership may worsen the firm’s performance since the managers may act
opportunistically in managing their income.
Government ownership is considered to be a significant factor affecting firm
performance in China, due to the unique role the Chinese government plays in the
industry (Sun et al. 2002). Firstly, the Chinese automobile industry is controlled by
the Chinese government through the planning and execution of industrial policies
(CAAM 2016). These industrial policies include the planned production for the
forthcoming years and relevant policies for future development, including joint
ventures and innovation policies (CAAM 2016). Secondly, since the Chinese
138
automobile industry is the pillar industry in the Chinese economy, the central
government owns major portions of the major firms in the industry.
As a consequence, although the firms have been privatised, they are
controlled by the central government through management, since the majority of the
managers in the Chinese automobile manufacturers are appointed by the
government (Sun et al. 2002; Fan et al. 2014). However, there are consequences of
government ownership in the ownership structure of listed enterprises. Many studies
have argued that managers can be used as means to achieve political purposes
through governmental ownership (voting rights of the firm). For instance, the
managers can act as mediators between the interests of firms and public
shareholders. The state-owned enterprises (SOEs) are entitled to more resources,
support and opportunities through government ownership, and therefore perform
better (Chen 1998; Sun et al. 2002). Also, it is argued that firms maximise profit due
to designated governmental policies (Sun et al. 2002).
However, some studies also argue that the government ownership is not
necessarily affecting firm performance (Xu and Wang 1997; Dewenter and Malatesta
1998). Xu and Wang (1997) also argue that the state ownership leads to increased
conflicts among managers, government and shareholders, and therefore there is a
causal negative relationship between government ownership and firm performance.
During the 1990s reforms, the Chinese government allowed the state-owned
enterprises to be partially privatised by allocating the firm shares to individual
investors who could trade those shares in the Shenzhen and Shanghai stock
markets (Fan et al. 2013). Among the individual investors, foreign ownership plays
an important role to improve firm’s performances. Foreign ownership evidently has a
positive association with firm value. For instance, Ferreira and Matos (2008) found
139
that foreign institutional ownership had a positive relationship to a firms’ Tobin’s Q.
Results of a study by Aggarwal et al. (2011) also indicated that foreign ownership
consistently improved governance of firms and eventually led to increases in the
value of firms. Prior research, for instance by Djankov and Murrell (2002) and Estrin
et al. (2009) have found that the resources provided by foreign investors may further
help those firms who are restructuring through the privatisation process to perform
better at the post-privatisation stage (Megginson and Netter 2001; Estrin et al. 2009).
Additionally, the substantial amount of financial resources and advanced
technological knowledge contributed by foreign investors leads to higher valuations
of firms (Ding et al. 2013) Therefore, the current study expects to find that foreign
ownership has a positive effect on firm performance.
The institutional shares are classified as the shares owned by the Chinese
domestic legal entities, for instance, the government agencies, insurance companies
and other enterprises (Wei et al. 2005). There is a growing body of research which
has focused on the impact of institutional investors such as banks, insurance
companies, superannuation funds, investment banks, and large financial institutions
on firm performance. Many of those studies argue that the institutional owners are
willing and eager to spend money on monitoring costs which further empowers their
incentive to monitor firm performance (Grossman and Hart 1980; Duggal and Millar
1999; Cornett et al. 2007). As a result, firms will be able to reduce the agency costs
by minimizing managers’ opportunistic behaviour (McConnell and Servaes 1990;
Nesbitt 1994; Smith 1996 and Del Guercio and Hawkins 1999).
Furthermore, it is claimed that many of the institutional investors have sufficient
resources to perform quality research to target their investment at the more efficient
firms (Lang et al. 1989; Servaes 1991). Cornett et al. (2007) also found that the size
140
of shareholdings of institutional investors had an impact on firm performance. When
institutional ownership comprises a large portion of the shareholding, the firm
performs better and vice versa, and therefore there is a positive relationship between
institutional ownership and firm performance (Cornett 1991; Bhide 1994; Demirag
1998; Maug 1998). Many other researchers [for example, Nesbitt (1994), and Del
Guercio and Hawkins (1990)] have also found that institutional ownership is
positively related to firm performance. However, Faccio and Lasfer (2000) failed to
find any significant relationship between institutional ownership and firm
performance.
In the context of the Chinese automobile industry and its iconic status in the
Chinese economy, the institutional ownership is held through government agencies.
For instance the provincial governments, municipal or country governments may
have significance influence on the affairs of listed companies through their
shareholdings. Due to the uniqueness of the institutional details in the China share
issue program of the 1990s, institutional ownership is claimed to have had important
influences over the performance of firms (Wei et al. 2005).
4.7.4.2 Capital Structure and Operating Leverage
The decisions on the capital structure of firms in China have become
increasingly critical in recent years (Roberts and Zurawski 2016). According to the
announcement made by Zhou Xiaochuan, the Governor of the People’s Bank of
China (PBC), the country was at such risk with companies increasing their levels of
debt that it might result in a future banking crisis (PBC 2016). Zhou Xiaochuan also
pointed out that the key to manage the excessive debts building up in Chinese firms
was to emphasise managing the corporate leverage ratio (PBC 2016).
141
It is often argued that the capital structure of a firm can be used to mitigate its
agency costs (Jensen and Meckling 1976; Berger and Patti 2006). There have been
many studies conducted to examine the relationship between capital structure and
firm performance, as discussed in Chapter Three (Myers 1977; Grossman and Hart
1982; Williams 1986; Margaristis and Psillaski 2007). Most of the studies have found
that there is a positive relationship existing between the leverage ratio and firm
value. This is because those firms inject more debts in their capital structure,
anticipating a higher amount of return (Hadlock and Jaames 2002). Prior researchers
have suggested that a high leverage ratio could lead to higher profitability
performance (Roden and Lewellen 1995).
On the other hand, the decisions on capital structure could also lead to
inverse impacts on firm performance. When firms are placed in difficult financial
situations, high debt ratios may have negative impacts on the firms’ values. This is
because the firms require vast amounts of liquid assets to stimulate performance
and high debt levels may worsen the situations of firms (Booth et al. 2001).
Therefore, for the large firms to secure their financial positions during financial
distress, or to ensure their long-term security, they are often found to have lower
leverage ratios with respect to their capital structures (Graham 2000; Mesquita and
Lara 2003). Moreover, the high leverage ratio may intensify the conflicts among
shareholders, creditors and managers and hence generate more agency costs and
lead to a decrease in the firm’s value (Jensen and Meckling 1976; Fama and French
1998).
Capital structure may play a critical role in the determination of the
performance of Chinese automobile companies. Increasing amounts of debt in the
listed Chinese firms has been a concern for the Governor Zhou Xiaochuan (PBC

142
2016). Thus, it is reasonable to assume that automobile companies too are
susceptible to the same ill effects arising from higher debt levels if it is the case in
the automobile industry as well. According to the literature (Jesen and Meckling
1976; Berger and Patti 2006; Yu 2013), capital structure can have the effect of a
double-edged sword on firm performance. This is because while the capital structure
may have a positive impact on the firm’s performance, due to its potential influence
on the mitigation of agency costs by making managers spend more effort to get
results, due to the concern that the firm has accumulated too much debt (Jensen and
Meckling 1976; Berger and Patti 2006), it may also have a negative effect on
performance, as the accumulated debts may intensify the conflicts between
shareholders, managers and creditors (Jensen and Meckling 1976; Fama and
French 1998).
4.7.4.3 Sustainable Growth
Sustainable growth has been found to be a major factor affecting the
performance of companies (Coad et al. 2016; Kim et al. 2016). It refers to the
maximum growth that a company can sustain without having to increase its debt
capital. Basically, in order to achieve a sustainable growth, companies need to fund
their growth strategies through ways that are sustainable. For example, if the growth
strategy is funded through equity, then there is higher potential for businesses to
achieve a sustainable growth. However, if the company cannot obtain funds from
equity sources, then it may have to raise capital from debt to facilitate growth and the
growth achieved by such means may not be sustainable when the conditions of the
debts become unfavourable. In short, sustainable growth represents the company's
growth strategy and its ability to acquire sustainable resources to facilitate it.
143
There are many ways a company can achieve sustainable growth.
Constantine Churchill and Mullins (2001) identified cash-flow management as a way
to generate sustainable growth, suggesting that it can be achieved using operational
means without changing current investments and external funding. Another way to
achieve sustainable growth is to increase the retention rate, which is the earnings left
in the business after paying dividends. A study conducted by Rahim and Saad
(2014) found a positive and significant correlation between the sustainable growth
and the profitability of a company. According to Hartono and Utami (2016) there are
four factors that influence sustainable growth of a company: (1) profitability ratio, (2)
asset turnover ratio, (3) financial policy and (4) dividend policy. Given the above
arguments there is enough evidence to include sustainable growth in the regression
model as an explanatory factor for firm performance.
4.7.4.4 Age of Firms
Many prior studies have used firm age as a control variable, as it is possible
that the age of the firm have an impact on its performance. However, the results of
the empirical examinations conducted have been mixed. Since the mature and
experienced firms are more likely to manage their available resources well to
enhance profitability, the relationship between firm age and performance has been
found to be positive in many studies (Calantone et al. 2002; Fonseka et al. 2015). On
the contrary, many other studies have found a negative relationship between firm
age and firm performance, due to reasons such as investors’ uncertainties
concerning the abilities of old firms, management inefficiencies, and use of outdated
technology (Berger and Udell 1990; Pastor and Veronesi 2003; Loderer and Waelchli
2010). The age of the firm has also been found to have an indirect impact on firm
performance. For example, Holderness (2009) found that firm age had an inverse
144
relationship with ownership structure when the ownerships was positively related to
firm performance (Graham et al. 2008). Given that the prior literature has identified
the age of a firm as a control variable in the regression models that examined the
relationship between firm performance and other factors, and with mixed results, it
has been chosen as a control variable for this study as well.
4.7.4.5 Size of Firm
Firm size is another commonly used control variable used in regression
models that examine the relationship between firm performance and other factors
affecting firm performance. For example, Chu (2011) used firm size as a control
variable in a study that examined the relationship between firm performance and
family ownership. Similarly, Margaritis and Psillaki (2008) used firm size as a control
variable to investigate the relationship between capital structure, ownership structure
and firm performance of French manufacturing firms.
In the case of the automobile industry, firm size has been found to be a
significant factor affecting performance, as large automobile firms tend to enjoy
economies of scale due to their large production volume, and because they enjoy
higher profitability (Niresh and Thirunavukkarasu 2014; Chun et al. 2015). Since the
larger firms are expected to be better managed, better resourced, and to possess
better technology, there is a high likelihood that firm size may positively correlate
with firm performance. Hence, it is chosen as one of the control variables in the
regression model used in this study.
4.7.4.6 State Control
Unlike many other countries, the government plays an active role in running
businesses in China. China has many state owned companies. Also there are many
companies controlled by the government through management rights (state control).
145
In the sample companies of this study, 26% of companies are identified as state-
controlled firms. These are firms where government holds the managerial control of
the business through share ownership, or where managers appointed by the
government make key managerial decisions of the company. Some prior studies
have shown that since state-controlled firms are in an advantageous position in the
industry due to the support they get from the government, they are more likely to
perform better and to win major government projects (Fonseka et al. 2015).
However, there are also prior studies that have found a negative relationship
between state-control and firm performance. For example, Sun et al. (2002) argued
that poor management of state-controlled enterprises resulted in resource wastage
and poor financial performance. Harwit (1995) also found that the managers
appointed by the government lacked relevant knowledge in managing production
processes and as a result, the entities that they managed performed poorly. Given
the mixed results from the relevant literature, state control has been chosen as one
of the control variables in the regression model of this study to test whether it affects
the performance of automobile companies in China.
4.7.5 Measuring Variables-Dependent Variables
4.7.5.1 Dependent Variable: Firm Performance
There is no universal agreement as to how a firm’s performance can be
reliably measured (Johnson et al. 1996). In this study, a number of traditional
accounting measurements of firm performance, as suggested by Ghalayini and
Noble (1996), have been employed. Accordingly, market-based measurement and
technical efficiency scores are used as measurements of firm performance. These
performance variables are explained in the following sections.
146
4.7.5.2 Accounting Measurement of Firm Performance
The accounting measurements employed in this study are return on assets
(ROA) and return on equity (ROE). These have been widely used as the
measurements of firm performance in previous studies (Taylor et al. 1997; Ang and
Ding 2006; King and Santor 2008; Yu 2013). The ROA is calculated by dividing the
profit or loss before taxation by the total assets, whilst the ROE is calculated by
dividing the profit or loss for the period by the shareholders’ equity. Sloan (2001)
argued that since the accounting information is the major source of verified
information that users can get, the ROA and ROE are calculated from the accounting
information provided from the Chinese automobile manufacturers’ financial
statements, to provide more reliable measures of performance for users of financial
information.
4.7.5.3 Market-based Measurement of Firm Performance
“Tobin’s q” and/or the “market to book value ratio” has been used as a proxy
to measure firm performance in a large number of studies (Holderness and Sheehan
1988; McConell and Servaes 1990; Claessens, Djankov and Pohl 2002; Xu and
Wang 1997; Sarkar and Sarkar 2000; Demsetz and Villalonga 2001; Gugler et al.
2003; Zeitun and Tian 2007; Farooque et al. 2007a,b). It reflects the market value of
a firm’s assets relative to its book value. It is also used as a measurement of a firms’
future growth (King and Santor 2008). Davies and Madsen (2001) estimate the
Tobin’s q as the proxy for a firm’s value. Given the common use of Tobin’s q as a
market based measure of firm performance, this study also uses it as a market
based measurement of firm performance.
4.7.5.4 Efficiency
As explained in Section 4.6, efficiency refers to the “maximum proportional
expansion in outputs and contraction in inputs” that firms are able to achieve from
147
firm performance by eliminating technical inefficiency (Margaritis and Psillaki 2008,
p.8). Studies such as those by Leibenstein (1966), have laid the foundation for
subsequent studies which propose to use efficiency performance (X-inefficiency) as
a proxy for firm performance. Moreover, Demsetz et al. (1996) and Berger and
Bonaccorsi di Patti (2006) have also used “profit efficiency” as a substitute for firm
performance. Having considered the arguments presented in the prior literature,
efficiency has been selected as one of the performance measures of automobile
companies.
4.7.6 Measuring Variables- Independent Variables
4.7.6.1 Ownership Variables
Ownership structure is measured based on the percentage of shares owned
by different groups of stakeholders (Demsets and Villalonga 2001). In this study, the
stakeholders are classified into three categories: (a) government shareholders, (b)
foreign shareholders, (c) institutional shareholders. A large number of prior studies
have used this classification in their studies (for example, Short and Keasey 1999;
Demsets and Villaonga 2001; and Lins 2003).
The level of government ownership is measured by taking the percentage of
shares owned by the government. In the Chinese context, the government can be
categorized as the local, provincial or central government. However, this information
is ignored in the selection of variables, and “government ownership” is considered as
the shareholding owned by any category of government (including both provincial
and central government). Foreign ownership is measured by taking the percentage
of shares owned by the shareholders who reside overseas (the foreigners are only
allowed to purchase B-shares in the China Stock Exchange, including the Shanghai
Stock Exchange and Shenzhen Stock Exchange). The institutional ownership is
148
measured by taking the percentage of shares owned by institutions (for instance,
insurance firms or investment or commercial banks).
A variable named GOVOWN is used to indicate the percentage of shares
owned by the government. A variable named FOROWN is used to indicate the
percentage of shares owned by foreign investors. A variable named INOWN is used
to indicate the percentage of shares owned by the institutions.
4.7.6.2 Capital Structure
Capital structure is measured by using two leverage ratios—financial leverage
and operating leverage. This usage is consistent with many prior studies (for
example, studies by Jensen and Meckling 1976; Jensen 1986; Prowse 1994;
Agrawal and Knoeber 1996; Cho 1988; Graham et al. 2004). This study considers
“debt” as the total debts including both long-term debts and short-term debts. The
financial leverage ratio is calculated by dividing the total debts by the total assets
(Liu et al. 2012). The operating leverage is measured as the ratio of fixed assets to
total assets.
4.7.6.3 Sustainable Growth Rate
The sustainable growth rate in this study is defined as the retention ratio (1-
dividend payout ratio) multiplied by the return on equity (ROE) as used by Avkiran
(2011).
The following three variables: (1) Firm Size, (2) Firm Age, (3) State-owned
Enterprises, will serve as control variables in the model and are described below:
4.7.6.4 Firm Size
In this study, firm size is measured as the logarithm of the book value of total
assets, SIZE (Drake 2001).
149
4.7.6.5 Firm Age
In this study, age is defined as the firm age variable and is calculated as the
logarithm of the number of years since the establishment year of the firm.
4.7.6.6 State-owned Enterprises
In this study, the selected sample, including 99 listed manufacturers in
the automobile industry, is divided into state-owned enterprises (SOE) and
privately-owned enterprises (PRIVATE). The ownership is described as the
dummy variable. If the firm is an SOE, it is denoted as ‘1’. Otherwise, being
privately owned, it is denoted as ‘0’ (Liu et al. 2012).
4.7.7 Limitations of Regression Analysis
The regression analysis conducted in this study uses the data provided in the
OSIRIS database on the automobile and component manufacturing companies, as
classified by the Global Industry Classification Standard. The representation of the
automobile industry in China is limited by the availability of data in the database and
the accuracy of the classifications provided. In addition, this analysis may have
excluded some important factors that have a bearing on the performance due to the
unavailability of data on those variables.
4.8 Summary
This chapter presents the research questions including major and sub-
research questions, research design and methodology, and data. The study
proposes to answer the research questions and sub-research questions using a
three-fold analysis. First, performance and financial status of Chinese automobile
and component manufacturing companies are assessed using a ratio analysis,
combined with a statistical analysis, for comparing mean differences between the
Chinese and Indian automobile companies. Second, a DEA analysis is conducted to
derive the efficiency parameters to indicate the efficiency performance of
150
manufacturers in the Chinese automobile industry. Third, the relationship between
the 7 factors identified from the literature as factors affecting the performance of
automobile companies are examined to test their relationship with the performance
of automobile companies using a multiple regression analysis. The chapter also
describes the sample data used for the analysis and the variables used in all three
analyses.
151
CHAPTER FIVE
EMPIRICAL ANALYSIS AND RESULTS
5.1 Introduction
As stated in the previous chapter, this study aims to examine the cost
competitiveness of the Chinese automobile industry, which consists of automobile
and automobile component manufacturing. To achieve this objective, an empirical
analysis of the performance of the Chinese automobile industry has been carried out
following the research framework and methodology outlined in the previous chapter.
This analysis uses data collected from Chinese automobile and component
manufacturing companies over a nine-year period from 2006 to 2014. This chapter
presents the results of this analysis which will then be used to answer the research
questions posed in the previous chapter (for detailed calculations, see appendix A to
D).
This chapter is organised as follows: The first section of this chapter presents
a comparative analysis conducted to examine the relative operating performance
and financial status of Chinese and Indian automobile companies. In doing so, the
relative strengths and weaknesses of the Chinese automobile industry, in
comparison to the operating performance and financial status of Indian automobile
companies, can be identified. This is followed by an analysis of the efficiency of
Chinese automobile companies using Data Envelopment Analysis (DEA). The final
section of the chapter presents the results of this analysis.
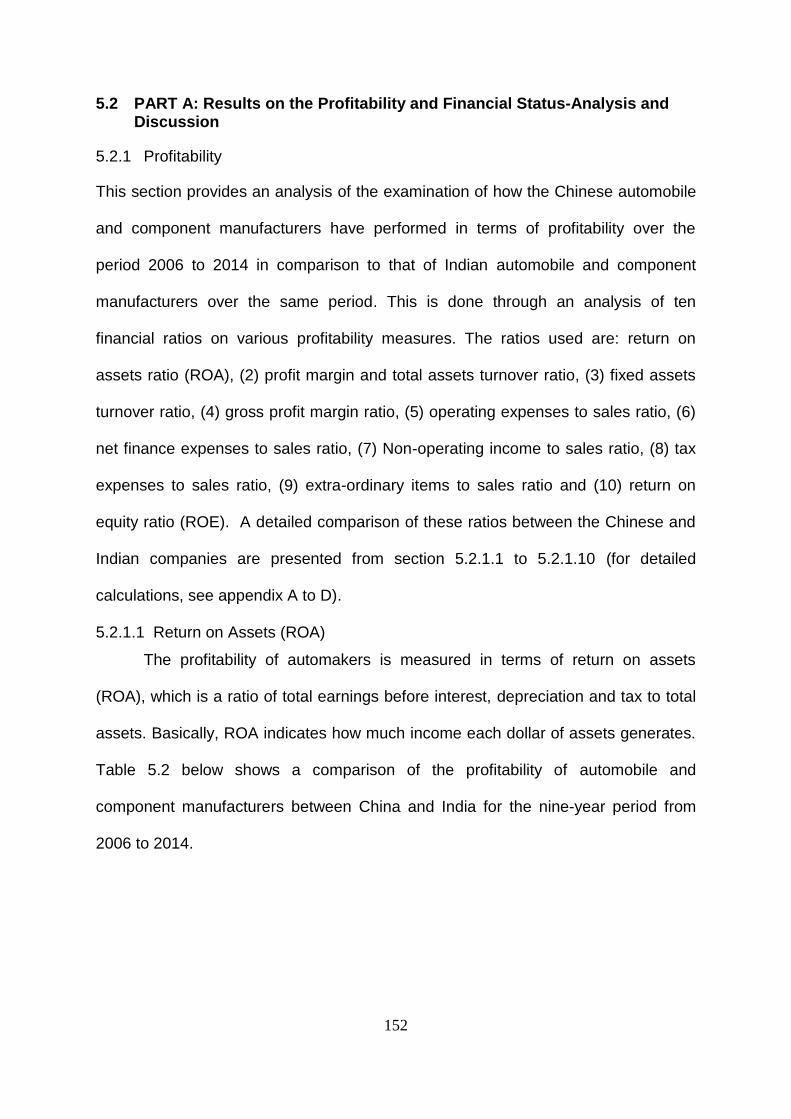
152
5.2 PART A: Results on the Profitability and Financial Status-Analysis and Discussion
5.2.1 Profitability
This section provides an analysis of the examination of how the Chinese automobile
and component manufacturers have performed in terms of profitability over the
period 2006 to 2014 in comparison to that of Indian automobile and component
manufacturers over the same period. This is done through an analysis of ten
financial ratios on various profitability measures. The ratios used are: return on
assets ratio (ROA), (2) profit margin and total assets turnover ratio, (3) fixed assets
turnover ratio, (4) gross profit margin ratio, (5) operating expenses to sales ratio, (6)
net finance expenses to sales ratio, (7) Non-operating income to sales ratio, (8) tax
expenses to sales ratio, (9) extra-ordinary items to sales ratio and (10) return on
equity ratio (ROE). A detailed comparison of these ratios between the Chinese and
Indian companies are presented from section 5.2.1.1 to 5.2.1.10 (for detailed
calculations, see appendix A to D).
5.2.1.1 Return on Assets (ROA)
The profitability of automakers is measured in terms of return on assets
(ROA), which is a ratio of total earnings before interest, depreciation and tax to total
assets. Basically, ROA indicates how much income each dollar of assets generates.
Table 5.2 below shows a comparison of the profitability of automobile and
component manufacturers between China and India for the nine-year period from
2006 to 2014.
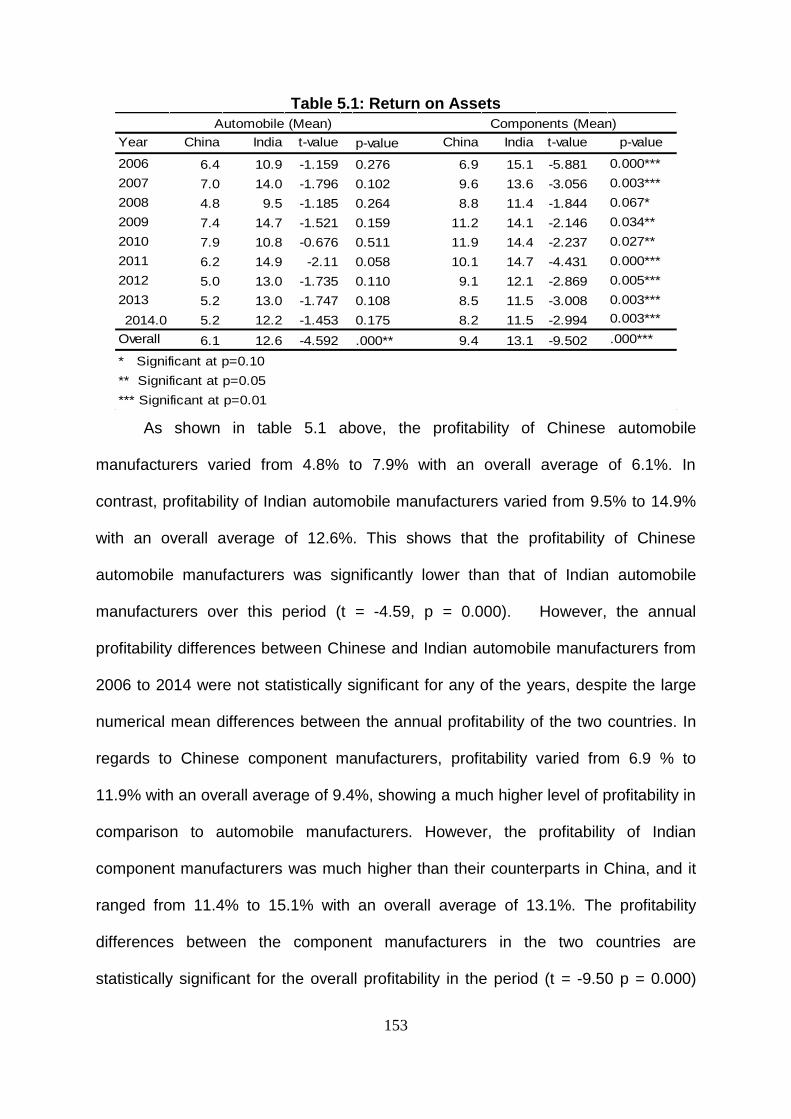
153
Table 5.1: Return on Assets
Year China India t-value China India t-value p-value
2006 6.4 10.9 -1.159 0.276 6.9 15.1 -5.881 0.000***
2007 7.0 14.0 -1.796 0.102 9.6 13.6 -3.056 0.003***
2008 4.8 9.5 -1.185 0.264 8.8 11.4 -1.844 0.067*
2009 7.4 14.7 -1.521 0.159 11.2 14.1 -2.146 0.034**
2010 7.9 10.8 -0.676 0.511 11.9 14.4 -2.237 0.027**
2011 6.2 14.9 -2.11 0.058 10.1 14.7 -4.431 0.000***
2012 5.0 13.0 -1.735 0.110 9.1 12.1 -2.869 0.005***
2013 5.2 13.0 -1.747 0.108 8.5 11.5 -3.008 0.003***
2014.0 5.2 12.2 -1.453 0.175 8.2 11.5 -2.994 0.003***
Overall 6.1 12.6 -4.592 .000** 9.4 13.1 -9.502 .000***
* Significant at p=0.10
** Significant at p=0.05
*** Significant at p=0.01
p-value
Automobile (Mean) Components (Mean)
As shown in table 5.1 above, the profitability of Chinese automobile
manufacturers varied from 4.8% to 7.9% with an overall average of 6.1%. In
contrast, profitability of Indian automobile manufacturers varied from 9.5% to 14.9%
with an overall average of 12.6%. This shows that the profitability of Chinese
automobile manufacturers was significantly lower than that of Indian automobile
manufacturers over this period (t = -4.59, p = 0.000). However, the annual
profitability differences between Chinese and Indian automobile manufacturers from
2006 to 2014 were not statistically significant for any of the years, despite the large
numerical mean differences between the annual profitability of the two countries. In
regards to Chinese component manufacturers, profitability varied from 6.9 % to
11.9% with an overall average of 9.4%, showing a much higher level of profitability in
comparison to automobile manufacturers. However, the profitability of Indian
component manufacturers was much higher than their counterparts in China, and it
ranged from 11.4% to 15.1% with an overall average of 13.1%. The profitability
differences between the component manufacturers in the two countries are
statistically significant for the overall profitability in the period (t = -9.50 p = 0.000)
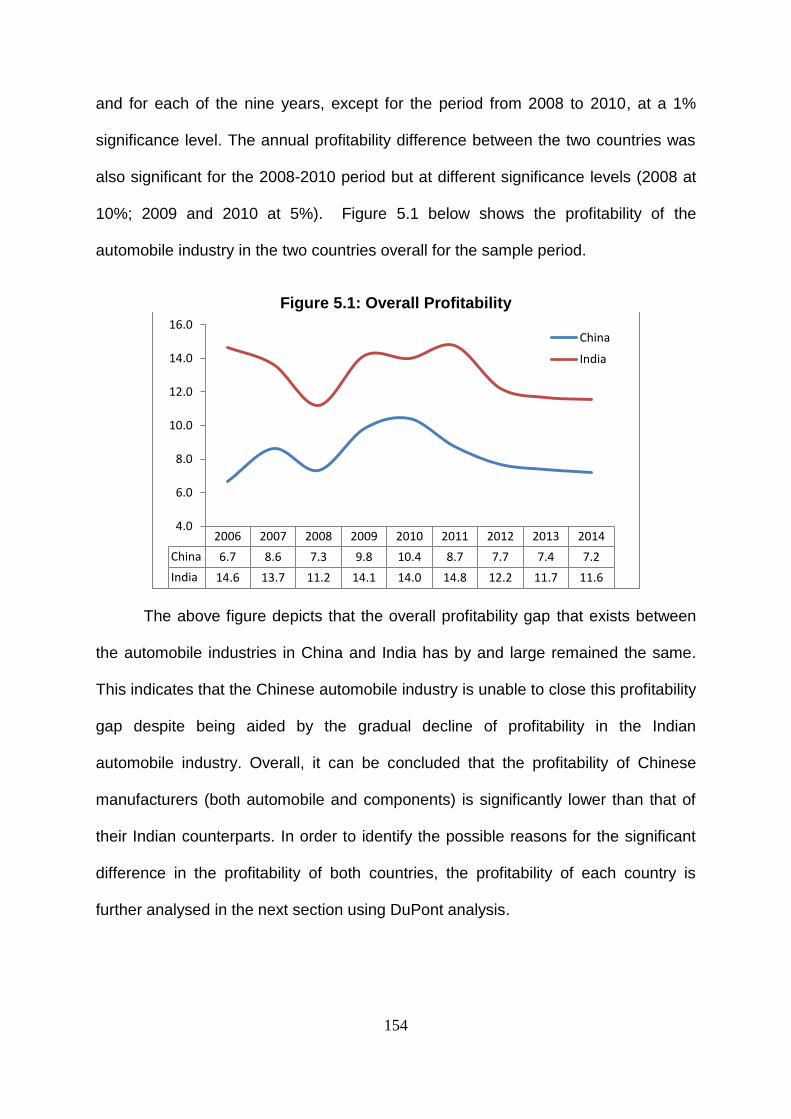
154
and for each of the nine years, except for the period from 2008 to 2010, at a 1%
significance level. The annual profitability difference between the two countries was
also significant for the 2008-2010 period but at different significance levels (2008 at
10%; 2009 and 2010 at 5%). Figure 5.1 below shows the profitability of the
automobile industry in the two countries overall for the sample period.
Figure 5.1: Overall Profitability
The above figure depicts that the overall profitability gap that exists between
the automobile industries in China and India has by and large remained the same.
This indicates that the Chinese automobile industry is unable to close this profitability
gap despite being aided by the gradual decline of profitability in the Indian
automobile industry. Overall, it can be concluded that the profitability of Chinese
manufacturers (both automobile and components) is significantly lower than that of
their Indian counterparts. In order to identify the possible reasons for the significant
difference in the profitability of both countries, the profitability of each country is
further analysed in the next section using DuPont analysis.
2006 2007 2008 2009 2010 2011 2012 2013 2014
China 6.7 8.6 7.3 9.8 10.4 8.7 7.7 7.4 7.2
India 14.6 13.7 11.2 14.1 14.0 14.8 12.2 11.7 11.6
4.0
6.0
8.0
10.0
12.0
14.0
16.0China
India
155
5.2.1.2 Profit Margin and Assets Turnover (DuPont analysis)
DuPont analysis separates the ROA ratio into the profit margin (PM) and
asset turnover ratios (AT). DuPont analysis recognises the two basic ingredients in
profit making: increasing income for dollar of revenues and using assets to generate
more revenues (Horngren 2009) For this purpose, profit margin ratio (%) is
calculated from the operating profit used in the ROA analysis above divided by the
operating revenues. The results of this analysis are shown in Table 5.2 below.
Table 5.2: Profit Margin Ratio
Year China India t-value p-value China India t-value p-value
2006 7.5 3.6 0.804 0.439 13.4 13.6 -0.13 0.900
2007 7.9 8.8 -0.321 0.750 13.2 12.4 0.359 0.720
2008 5.4 5.0 0.118 0.907 13.1 11.1 0.983 0.330
2009 7.6 8.8 -0.297 0.772 15.9 13.0 1.643 0.100*
2010 7.6 7.9 -0.133 0.896 16.2 12.6 2.428 0.020**
2011 6.1 7.3 -0.493 0.624 15.2 12.5 1.858 0.070*
2012 5.4 3.1 0.547 0.588 13.7 10.7 1.856 0.070*
2013 5.7 4.9 0.209 0.838 13.2 10.2 1.536 0.130
2014 4.5 0.6 0.551 0.592 12.5 10.2 1.055 0.290
Overall 6.4 5.5 0.562 0.575 14.1 11.8 3.664 0.000***
* Significant at p=0.10
** Significant at p=0.05
*** significant at p=0.01
Components (Mean)Automobile (Mean)
The results of the above table show that the profit margin of Chinese
automobile manufacturers varied from 4.5% to 7.9%, with an overall average of
6.4%. Comparatively, for Indian automobile manufacturers this ratio varied from
0.6% to 8.8%, with an overall average of 5.5%. However, the profit margin difference
between the two countries overall, and in relation to each of the nine years are not
statistically significant (t=0.562, p=0.572). In contrast, the overall profit margin of
component manufactures in China was 14.1%, ranging from 12.5% to 16.2%, while
that of India was 11.8%, ranging from 10.2% to 13.6%. This result indicates that the
overall profit margin of component manufacturers in China is significantly higher than
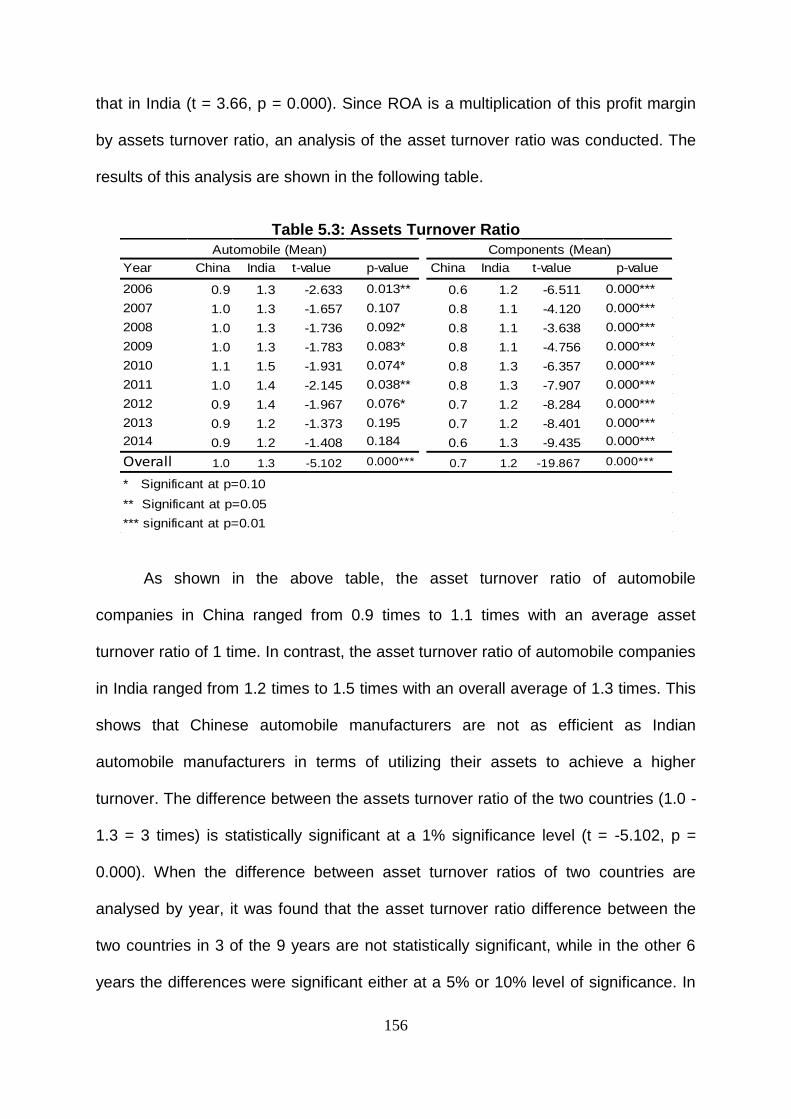
156
that in India (t = 3.66, p = 0.000). Since ROA is a multiplication of this profit margin
by assets turnover ratio, an analysis of the asset turnover ratio was conducted. The
results of this analysis are shown in the following table.
Table 5.3: Assets Turnover Ratio
Year China India t-value p-value China India t-value p-value
2006 0.9 1.3 -2.633 0.013** 0.6 1.2 -6.511 0.000***
2007 1.0 1.3 -1.657 0.107 0.8 1.1 -4.120 0.000***
2008 1.0 1.3 -1.736 0.092* 0.8 1.1 -3.638 0.000***
2009 1.0 1.3 -1.783 0.083* 0.8 1.1 -4.756 0.000***
2010 1.1 1.5 -1.931 0.074* 0.8 1.3 -6.357 0.000***
2011 1.0 1.4 -2.145 0.038** 0.8 1.3 -7.907 0.000***
2012 0.9 1.4 -1.967 0.076* 0.7 1.2 -8.284 0.000***
2013 0.9 1.2 -1.373 0.195 0.7 1.2 -8.401 0.000***
2014 0.9 1.2 -1.408 0.184 0.6 1.3 -9.435 0.000***
Overall 1.0 1.3 -5.102 0.000*** 0.7 1.2 -19.867 0.000***
* Significant at p=0.10
** Significant at p=0.05
*** significant at p=0.01
Automobile (Mean) Components (Mean)
As shown in the above table, the asset turnover ratio of automobile
companies in China ranged from 0.9 times to 1.1 times with an average asset
turnover ratio of 1 time. In contrast, the asset turnover ratio of automobile companies
in India ranged from 1.2 times to 1.5 times with an overall average of 1.3 times. This
shows that Chinese automobile manufacturers are not as efficient as Indian
automobile manufacturers in terms of utilizing their assets to achieve a higher
turnover. The difference between the assets turnover ratio of the two countries (1.0 -
1.3 = 3 times) is statistically significant at a 1% significance level (t = -5.102, p =
0.000). When the difference between asset turnover ratios of two countries are
analysed by year, it was found that the asset turnover ratio difference between the
two countries in 3 of the 9 years are not statistically significant, while in the other 6
years the differences were significant either at a 5% or 10% level of significance. In
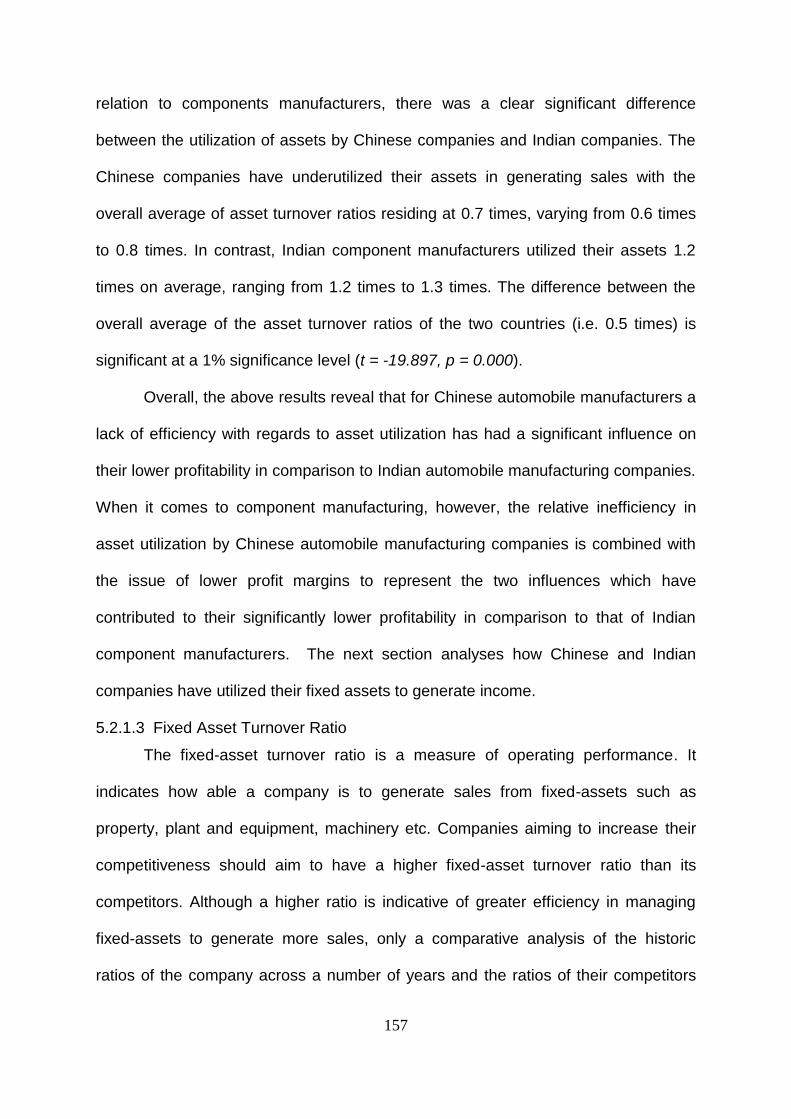
157
relation to components manufacturers, there was a clear significant difference
between the utilization of assets by Chinese companies and Indian companies. The
Chinese companies have underutilized their assets in generating sales with the
overall average of asset turnover ratios residing at 0.7 times, varying from 0.6 times
to 0.8 times. In contrast, Indian component manufacturers utilized their assets 1.2
times on average, ranging from 1.2 times to 1.3 times. The difference between the
overall average of the asset turnover ratios of the two countries (i.e. 0.5 times) is
significant at a 1% significance level (t = -19.897, p = 0.000).
Overall, the above results reveal that for Chinese automobile manufacturers a
lack of efficiency with regards to asset utilization has had a significant influence on
their lower profitability in comparison to Indian automobile manufacturing companies.
When it comes to component manufacturing, however, the relative inefficiency in
asset utilization by Chinese automobile manufacturing companies is combined with
the issue of lower profit margins to represent the two influences which have
contributed to their significantly lower profitability in comparison to that of Indian
component manufacturers. The next section analyses how Chinese and Indian
companies have utilized their fixed assets to generate income.
5.2.1.3 Fixed Asset Turnover Ratio
The fixed-asset turnover ratio is a measure of operating performance. It
indicates how able a company is to generate sales from fixed-assets such as
property, plant and equipment, machinery etc. Companies aiming to increase their
competitiveness should aim to have a higher fixed-asset turnover ratio than its
competitors. Although a higher ratio is indicative of greater efficiency in managing
fixed-assets to generate more sales, only a comparative analysis of the historic
ratios of the company across a number of years and the ratios of their competitors
158
could provide an indication of the level of efficiency in relation to fixed assets. Table
5.4 below provides such analysis.
Table 5.4: Fixed Assets Turnover Ratio
Year China India t-value p-value China India t-value p-value
2006 2.3 2.7 -0.789 0.436 1.3 2.5 -5.628 0.000***
2007 2.5 2.1 1.038 0.307 1.8 2.4 -2.490 0.010***
2008 2.6 2.5 0.142 0.888 1.8 2.2 -1.562 0.120
2009 2.6 2.1 1.170 0.250 2.0 2.4 -1.344 0.180
2010 3.0 2.7 0.701 0.488 2.3 2.7 -1.735 0.090**
2011 2.6 2.8 -0.430 0.670 2.2 2.7 -2.629 0.010***
2012 2.2 2.9 -1.330 0.191 1.8 2.5 -3.238 0.000***
2013 2.0 2.4 -0.931 0.358 1.7 2.4 -4.324 0.000***
2014 2.0 2.5 -0.928 0.372 1.5 2.6 -5.812 0.000***
Overall 2.4 2.5 -0.647 0.518 1.8 2.5 -9.179 0.000***
* Significant at p=0.10
** Significant at p=0.05
*** significant at p=0.01
Automobile (Mean) Components (Mean)
According to the results presented in the above table, the average
fixed-asset turnover ratio of Chinese automobile manufacturing companies was 2.4
times in comparison to 2.5 times for Indian automobile manufacturing companies.
The difference in this ratio between the two countries is not statistically significant,
either overall or for each of the nine sample years. Therefore, it can be concluded
that for automobile companies there is no significant difference between efficiency
with regards to utilising fixed assets to generate income in the two countries. In
contrast, the fixed-asset turnover ratio of component manufacturers in China was 1.8
times, a significantly lower rate in comparison to the 2.5 times ratio that their Indian
counterparts have been able to achieve. The difference of 0.7 times is statistically
significant at a 1% significance level (t = -9.179, p = 0.000). Moreover, the difference
in this ratio between the two countries is statistically significant at a 1% significance
level for each year from 2006 to 2014, except for the two year period of 2008-2009.
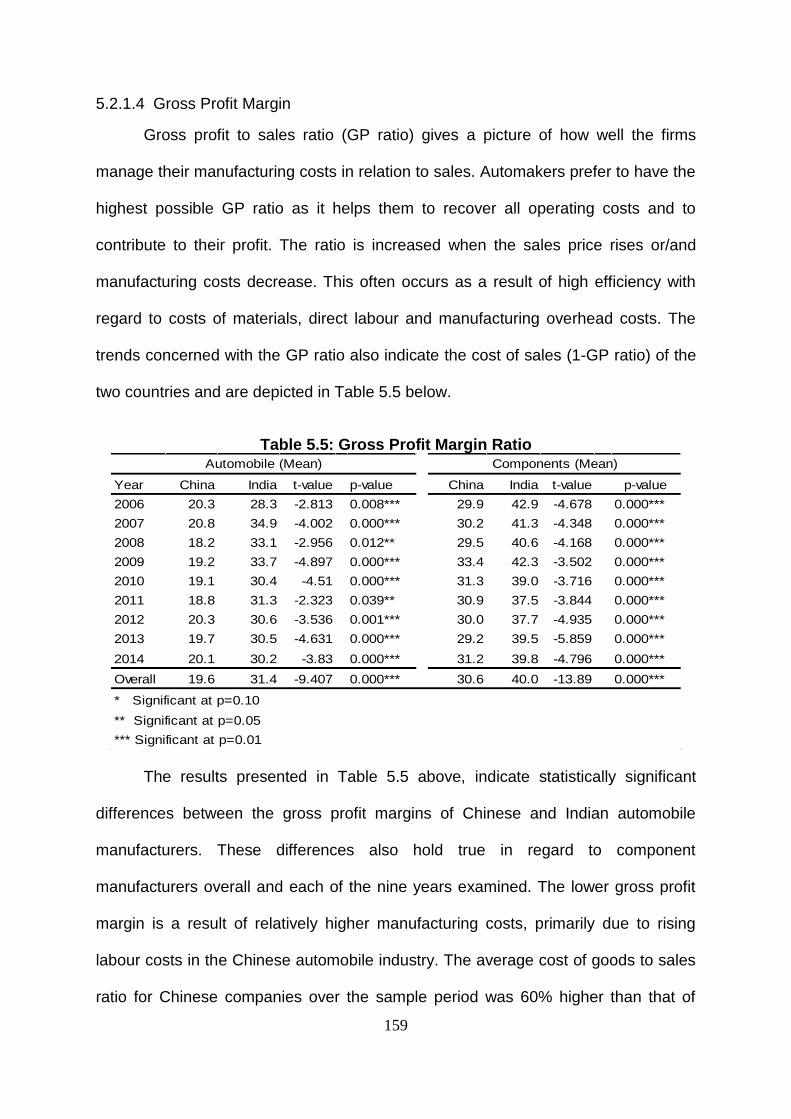
159
5.2.1.4 Gross Profit Margin
Gross profit to sales ratio (GP ratio) gives a picture of how well the firms
manage their manufacturing costs in relation to sales. Automakers prefer to have the
highest possible GP ratio as it helps them to recover all operating costs and to
contribute to their profit. The ratio is increased when the sales price rises or/and
manufacturing costs decrease. This often occurs as a result of high efficiency with
regard to costs of materials, direct labour and manufacturing overhead costs. The
trends concerned with the GP ratio also indicate the cost of sales (1-GP ratio) of the
two countries and are depicted in Table 5.5 below.
Table 5.5: Gross Profit Margin Ratio
Year China India t-value p-value China India t-value p-value
2006 20.3 28.3 -2.813 0.008*** 29.9 42.9 -4.678 0.000***
2007 20.8 34.9 -4.002 0.000*** 30.2 41.3 -4.348 0.000***
2008 18.2 33.1 -2.956 0.012** 29.5 40.6 -4.168 0.000***
2009 19.2 33.7 -4.897 0.000*** 33.4 42.3 -3.502 0.000***
2010 19.1 30.4 -4.51 0.000*** 31.3 39.0 -3.716 0.000***
2011 18.8 31.3 -2.323 0.039** 30.9 37.5 -3.844 0.000***
2012 20.3 30.6 -3.536 0.001*** 30.0 37.7 -4.935 0.000***
2013 19.7 30.5 -4.631 0.000*** 29.2 39.5 -5.859 0.000***
2014 20.1 30.2 -3.83 0.000*** 31.2 39.8 -4.796 0.000***
Overall 19.6 31.4 -9.407 0.000*** 30.6 40.0 -13.89 0.000***
* Significant at p=0.10
** Significant at p=0.05
*** Significant at p=0.01
Automobile (Mean) Components (Mean)
The results presented in Table 5.5 above, indicate statistically significant
differences between the gross profit margins of Chinese and Indian automobile
manufacturers. These differences also hold true in regard to component
manufacturers overall and each of the nine years examined. The lower gross profit
margin is a result of relatively higher manufacturing costs, primarily due to rising
labour costs in the Chinese automobile industry. The average cost of goods to sales
ratio for Chinese companies over the sample period was 60% higher than that of
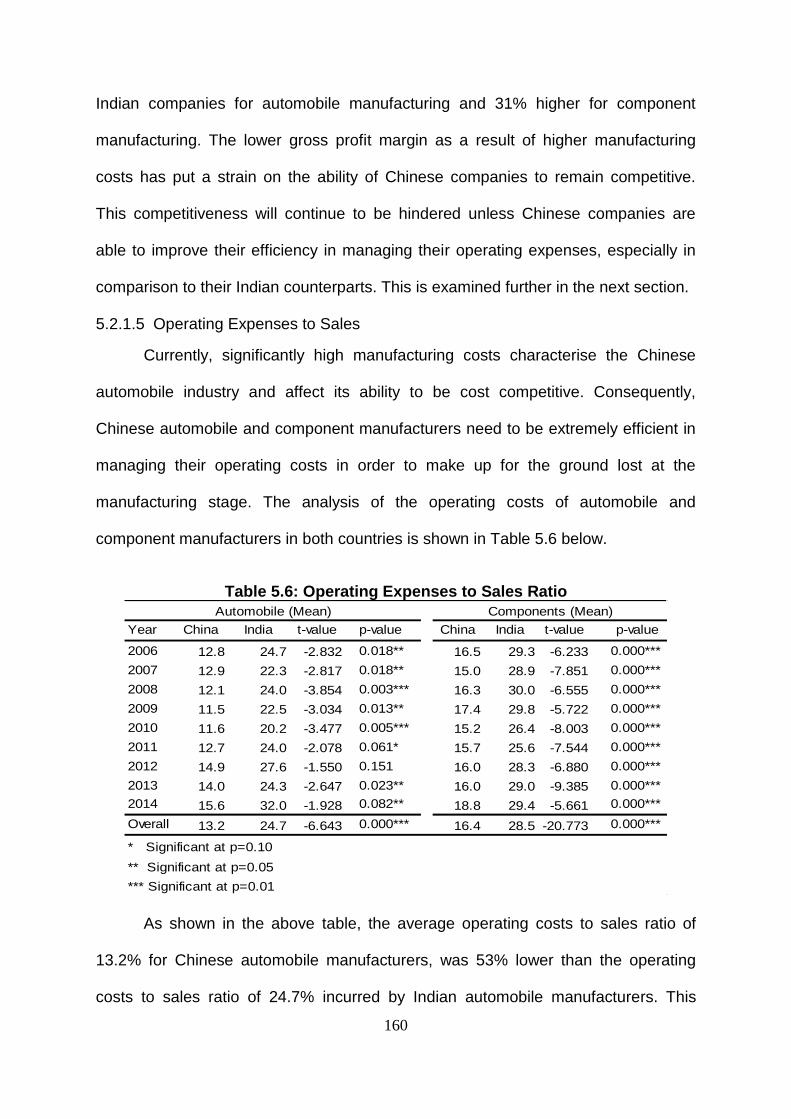
160
Indian companies for automobile manufacturing and 31% higher for component
manufacturing. The lower gross profit margin as a result of higher manufacturing
costs has put a strain on the ability of Chinese companies to remain competitive.
This competitiveness will continue to be hindered unless Chinese companies are
able to improve their efficiency in managing their operating expenses, especially in
comparison to their Indian counterparts. This is examined further in the next section.
5.2.1.5 Operating Expenses to Sales
Currently, significantly high manufacturing costs characterise the Chinese
automobile industry and affect its ability to be cost competitive. Consequently,
Chinese automobile and component manufacturers need to be extremely efficient in
managing their operating costs in order to make up for the ground lost at the
manufacturing stage. The analysis of the operating costs of automobile and
component manufacturers in both countries is shown in Table 5.6 below.
Table 5.6: Operating Expenses to Sales Ratio
Year China India t-value p-value China India t-value p-value
2006 12.8 24.7 -2.832 0.018** 16.5 29.3 -6.233 0.000***
2007 12.9 22.3 -2.817 0.018** 15.0 28.9 -7.851 0.000***
2008 12.1 24.0 -3.854 0.003*** 16.3 30.0 -6.555 0.000***
2009 11.5 22.5 -3.034 0.013** 17.4 29.8 -5.722 0.000***
2010 11.6 20.2 -3.477 0.005*** 15.2 26.4 -8.003 0.000***
2011 12.7 24.0 -2.078 0.061* 15.7 25.6 -7.544 0.000***
2012 14.9 27.6 -1.550 0.151 16.0 28.3 -6.880 0.000***
2013 14.0 24.3 -2.647 0.023** 16.0 29.0 -9.385 0.000***
2014 15.6 32.0 -1.928 0.082** 18.8 29.4 -5.661 0.000***
Overall 13.2 24.7 -6.643 0.000*** 16.4 28.5 -20.773 0.000***
* Significant at p=0.10
** Significant at p=0.05
*** Significant at p=0.01
Automobile (Mean) Components (Mean)
As shown in the above table, the average operating costs to sales ratio of
13.2% for Chinese automobile manufacturers, was 53% lower than the operating
costs to sales ratio of 24.7% incurred by Indian automobile manufacturers. This
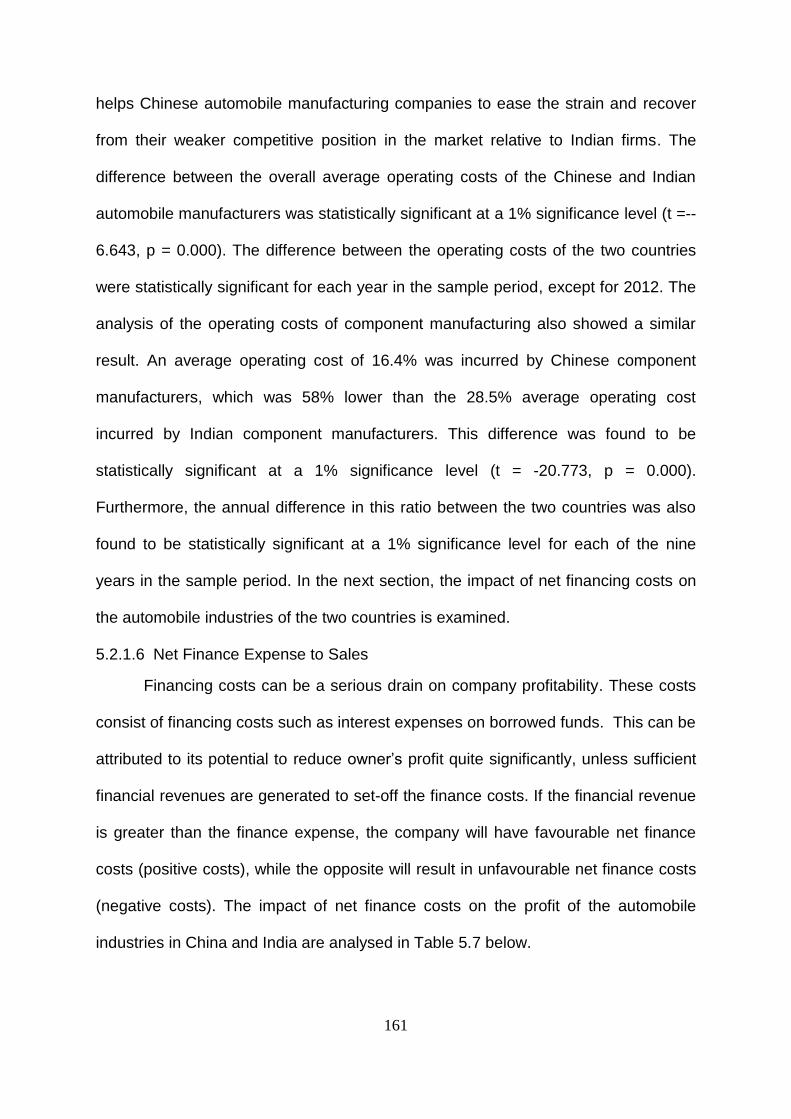
161
helps Chinese automobile manufacturing companies to ease the strain and recover
from their weaker competitive position in the market relative to Indian firms. The
difference between the overall average operating costs of the Chinese and Indian
automobile manufacturers was statistically significant at a 1% significance level (t =--
6.643, p = 0.000). The difference between the operating costs of the two countries
were statistically significant for each year in the sample period, except for 2012. The
analysis of the operating costs of component manufacturing also showed a similar
result. An average operating cost of 16.4% was incurred by Chinese component
manufacturers, which was 58% lower than the 28.5% average operating cost
incurred by Indian component manufacturers. This difference was found to be
statistically significant at a 1% significance level (t = -20.773, p = 0.000).
Furthermore, the annual difference in this ratio between the two countries was also
found to be statistically significant at a 1% significance level for each of the nine
years in the sample period. In the next section, the impact of net financing costs on
the automobile industries of the two countries is examined.
5.2.1.6 Net Finance Expense to Sales
Financing costs can be a serious drain on company profitability. These costs
consist of financing costs such as interest expenses on borrowed funds. This can be
attributed to its potential to reduce owner’s profit quite significantly, unless sufficient
financial revenues are generated to set-off the finance costs. If the financial revenue
is greater than the finance expense, the company will have favourable net finance
costs (positive costs), while the opposite will result in unfavourable net finance costs
(negative costs). The impact of net finance costs on the profit of the automobile
industries in China and India are analysed in Table 5.7 below.
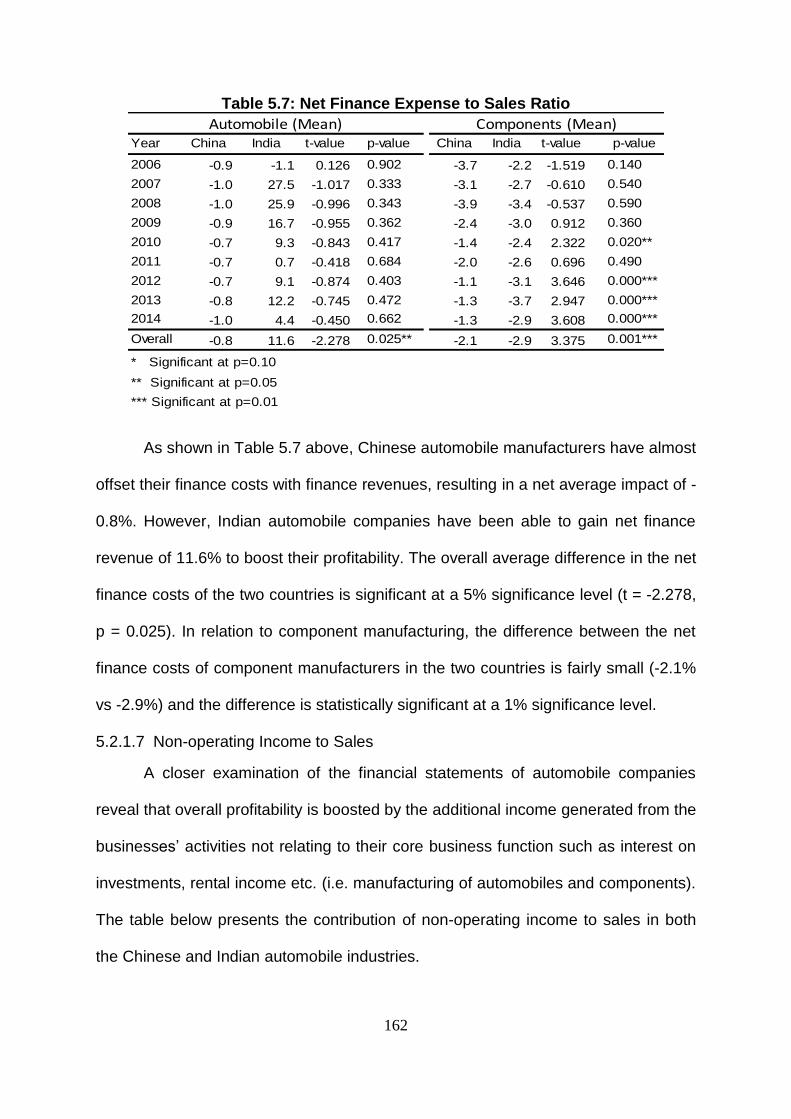
162
Table 5.7: Net Finance Expense to Sales Ratio
Year China India t-value p-value China India t-value p-value
2006 -0.9 -1.1 0.126 0.902 -3.7 -2.2 -1.519 0.140
2007 -1.0 27.5 -1.017 0.333 -3.1 -2.7 -0.610 0.540
2008 -1.0 25.9 -0.996 0.343 -3.9 -3.4 -0.537 0.590
2009 -0.9 16.7 -0.955 0.362 -2.4 -3.0 0.912 0.360
2010 -0.7 9.3 -0.843 0.417 -1.4 -2.4 2.322 0.020**
2011 -0.7 0.7 -0.418 0.684 -2.0 -2.6 0.696 0.490
2012 -0.7 9.1 -0.874 0.403 -1.1 -3.1 3.646 0.000***
2013 -0.8 12.2 -0.745 0.472 -1.3 -3.7 2.947 0.000***
2014 -1.0 4.4 -0.450 0.662 -1.3 -2.9 3.608 0.000***
Overall -0.8 11.6 -2.278 0.025** -2.1 -2.9 3.375 0.001***
* Significant at p=0.10
** Significant at p=0.05
*** Significant at p=0.01
Automobile (Mean) Components (Mean)
As shown in Table 5.7 above, Chinese automobile manufacturers have almost
offset their finance costs with finance revenues, resulting in a net average impact of -
0.8%. However, Indian automobile companies have been able to gain net finance
revenue of 11.6% to boost their profitability. The overall average difference in the net
finance costs of the two countries is significant at a 5% significance level (t = -2.278,
p = 0.025). In relation to component manufacturing, the difference between the net
finance costs of component manufacturers in the two countries is fairly small (-2.1%
vs -2.9%) and the difference is statistically significant at a 1% significance level.
5.2.1.7 Non-operating Income to Sales
A closer examination of the financial statements of automobile companies
reveal that overall profitability is boosted by the additional income generated from the
businesses’ activities not relating to their core business function such as interest on
investments, rental income etc. (i.e. manufacturing of automobiles and components).
The table below presents the contribution of non-operating income to sales in both
the Chinese and Indian automobile industries.
163
Table 5.8: Non-operating Income to Sales Ratio
Year China India t-value p-value China India t-value p-value
2006 1.6 -0.3 1.822 0.077* 2.9 -0.7 1.733 0.090*
2007 2.8 -0.3 2.058 0.047** 3.1 0.2 2.086 0.040**
2008 2.7 -0.1 2.205 0.035** 0.9 -0.9 1.568 0.120
2009 1.6 27.8 -1.019 0.332 0.5 -0.4 0.679 0.500
2010 3.9 35.0 -0.918 0.378 1.3 0.1 1.448 0.150
2011 2.9 -4.3 1.112 0.288 1.4 1.3 0.078 0.940
2012 8.1 0.4 0.900 0.373 4.1 -1.5 1.898 0.060*
2013 4.2 12.8 -0.983 0.348 1.8 -6.1 1.885 0.060*
2014 4.4 5.2 -0.247 0.806 1.9 -2.1 0.904 0.370
Overall 3.7 9.0 0.997 0.321 2.0 -1.2 3.241 0.001***
* Significant at p=0.10
** Significant at p=0.05
*** Significant at p=0.01
Automobile (Mean) Components (Mean)
The figures in the above table show that the average non-operating
income to sales ratio of Chinese automobile manufacturers was 3.7% in comparison
to 9.0% for Indian automobile manufacturers. However, due to the large variations in
this ratio over the sample period, the difference in this ratio between the two
countries was not statistically significant (t = 0.997, p = 0.321). In relation to
component manufacturing, the average non-operating income difference between
the component manufacturers of the two countries was statistically significant (t =
3.241, p = 0.001), despite showing a much smaller difference of 3.2%, relative to the
difference in the automobile manufacturing sector of 4.3%. The next section
examines the impact of tax on net profit in the automobile industries of the two
countries.
5.2.1.8 Tax Expense to Sales
All commercial businesses are required to pay corporate tax to the
government. This results in a substantial amount of cash generated through
business operations being taken out of the business rather than being re-invested in
the business or distributed to owners. This may be a significant impediment to the
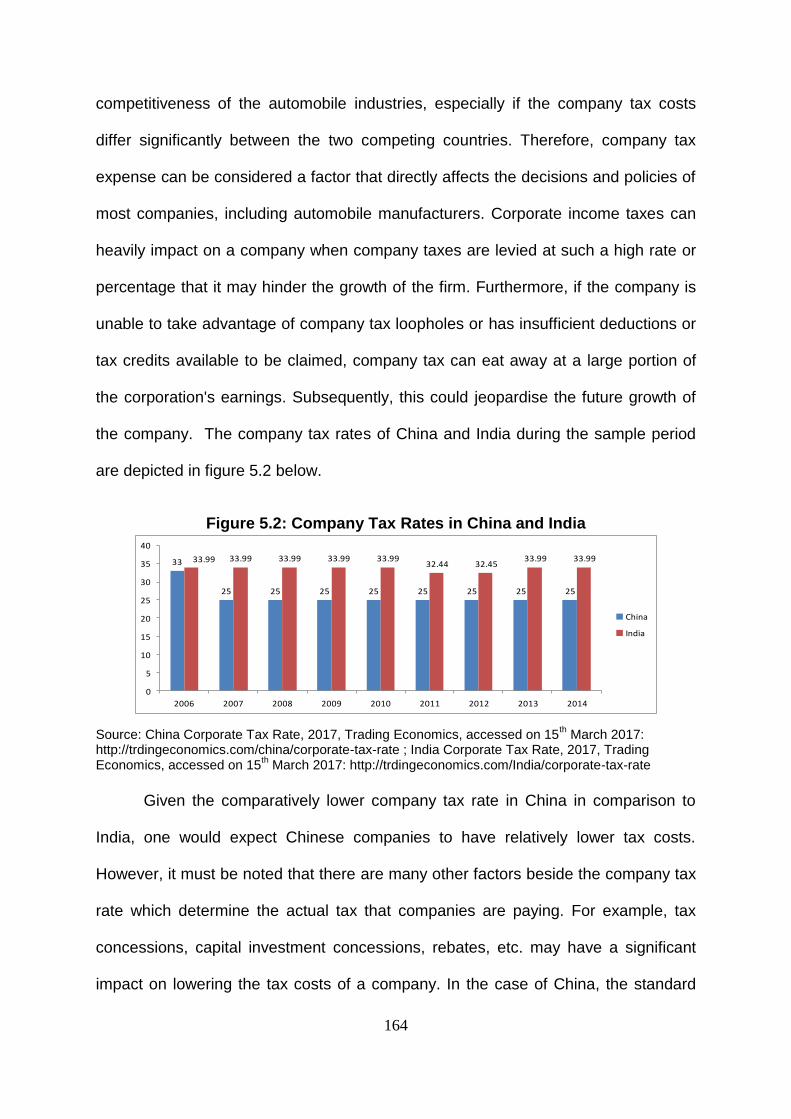
164
competitiveness of the automobile industries, especially if the company tax costs
differ significantly between the two competing countries. Therefore, company tax
expense can be considered a factor that directly affects the decisions and policies of
most companies, including automobile manufacturers. Corporate income taxes can
heavily impact on a company when company taxes are levied at such a high rate or
percentage that it may hinder the growth of the firm. Furthermore, if the company is
unable to take advantage of company tax loopholes or has insufficient deductions or
tax credits available to be claimed, company tax can eat away at a large portion of
the corporation's earnings. Subsequently, this could jeopardise the future growth of
the company. The company tax rates of China and India during the sample period
are depicted in figure 5.2 below.
Figure 5.2: Company Tax Rates in China and India
33
25 25 25 25 25 25 25 25
33.99 33.99 33.99 33.99 33.9932.44 32.45
33.99 33.99
0
5
10
15
20
25
30
35
40
2006 2007 2008 2009 2010 2011 2012 2013 2014
China
India
Source: China Corporate Tax Rate, 2017, Trading Economics, accessed on 15th March 2017:
http://trdingeconomics.com/china/corporate-tax-rate ; India Corporate Tax Rate, 2017, Trading Economics, accessed on 15
th March 2017: http://trdingeconomics.com/India/corporate-tax-rate
Given the comparatively lower company tax rate in China in comparison to
India, one would expect Chinese companies to have relatively lower tax costs.
However, it must be noted that there are many other factors beside the company tax
rate which determine the actual tax that companies are paying. For example, tax
concessions, capital investment concessions, rebates, etc. may have a significant
impact on lowering the tax costs of a company. In the case of China, the standard
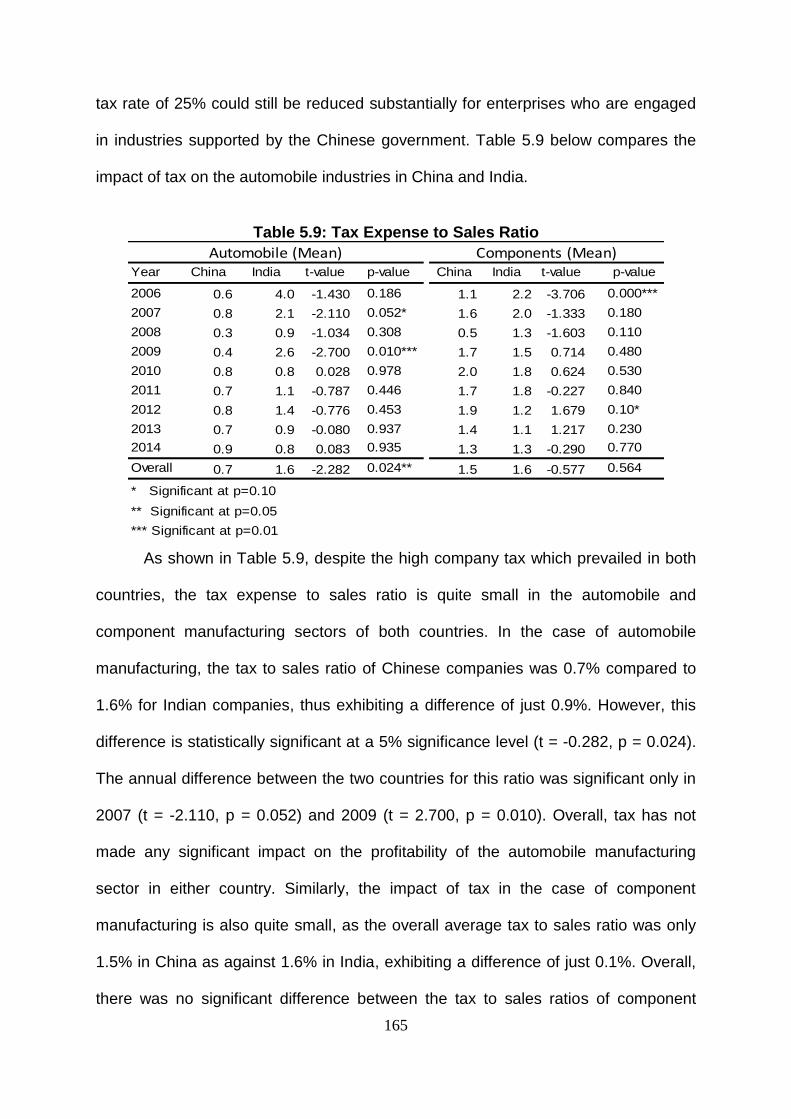
165
tax rate of 25% could still be reduced substantially for enterprises who are engaged
in industries supported by the Chinese government. Table 5.9 below compares the
impact of tax on the automobile industries in China and India.
Table 5.9: Tax Expense to Sales Ratio
Year China India t-value p-value China India t-value p-value
2006 0.6 4.0 -1.430 0.186 1.1 2.2 -3.706 0.000***
2007 0.8 2.1 -2.110 0.052* 1.6 2.0 -1.333 0.180
2008 0.3 0.9 -1.034 0.308 0.5 1.3 -1.603 0.110
2009 0.4 2.6 -2.700 0.010*** 1.7 1.5 0.714 0.480
2010 0.8 0.8 0.028 0.978 2.0 1.8 0.624 0.530
2011 0.7 1.1 -0.787 0.446 1.7 1.8 -0.227 0.840
2012 0.8 1.4 -0.776 0.453 1.9 1.2 1.679 0.10*
2013 0.7 0.9 -0.080 0.937 1.4 1.1 1.217 0.230
2014 0.9 0.8 0.083 0.935 1.3 1.3 -0.290 0.770
Overall 0.7 1.6 -2.282 0.024** 1.5 1.6 -0.577 0.564
* Significant at p=0.10
** Significant at p=0.05
*** Significant at p=0.01
Automobile (Mean) Components (Mean)
As shown in Table 5.9, despite the high company tax which prevailed in both
countries, the tax expense to sales ratio is quite small in the automobile and
component manufacturing sectors of both countries. In the case of automobile
manufacturing, the tax to sales ratio of Chinese companies was 0.7% compared to
1.6% for Indian companies, thus exhibiting a difference of just 0.9%. However, this
difference is statistically significant at a 5% significance level (t = -0.282, p = 0.024).
The annual difference between the two countries for this ratio was significant only in
2007 (t = -2.110, p = 0.052) and 2009 (t = 2.700, p = 0.010). Overall, tax has not
made any significant impact on the profitability of the automobile manufacturing
sector in either country. Similarly, the impact of tax in the case of component
manufacturing is also quite small, as the overall average tax to sales ratio was only
1.5% in China as against 1.6% in India, exhibiting a difference of just 0.1%. Overall,
there was no significant difference between the tax to sales ratios of component
166
manufacturers in China and India in eight of the nine sample years and overall. The
only significant difference between the tax to sales ratios of the two countries was
observed in 2006. In 2006, Chinese companies had a 1.1% tax to sales ratio as
against a 2.2% tax to sales ratio for Indian companies, showing a statistically
significant difference at a 1% significance level (t = -3.706, p = 0.000). In the next
section, whether the extraordinary item costs had any significant impact on the
profitability of automobile companies in the two countries is examined.
5.2.1.9 Extraordinary Item Costs to Sales
An extraordinary item consists of gains or losses included on a company's
income statement from events, which are unusual and infrequent in nature. Usually
they are the result of unforeseen and atypical events such as abnormal losses due to
machine defects, loss of inventory by fire, etc. Companies show an extraordinary
item separately from their operating earnings, because it is typically recorded as a
one-time charge or income and thus it is not expected to recur in the future.
However, in some industries these costs could be substantial and may significantly
reduce the earnings available to owners. To examine whether extraordinary items
had any impact on the profitability of automobile companies, such costs are analysed
in Table 5.10 below.
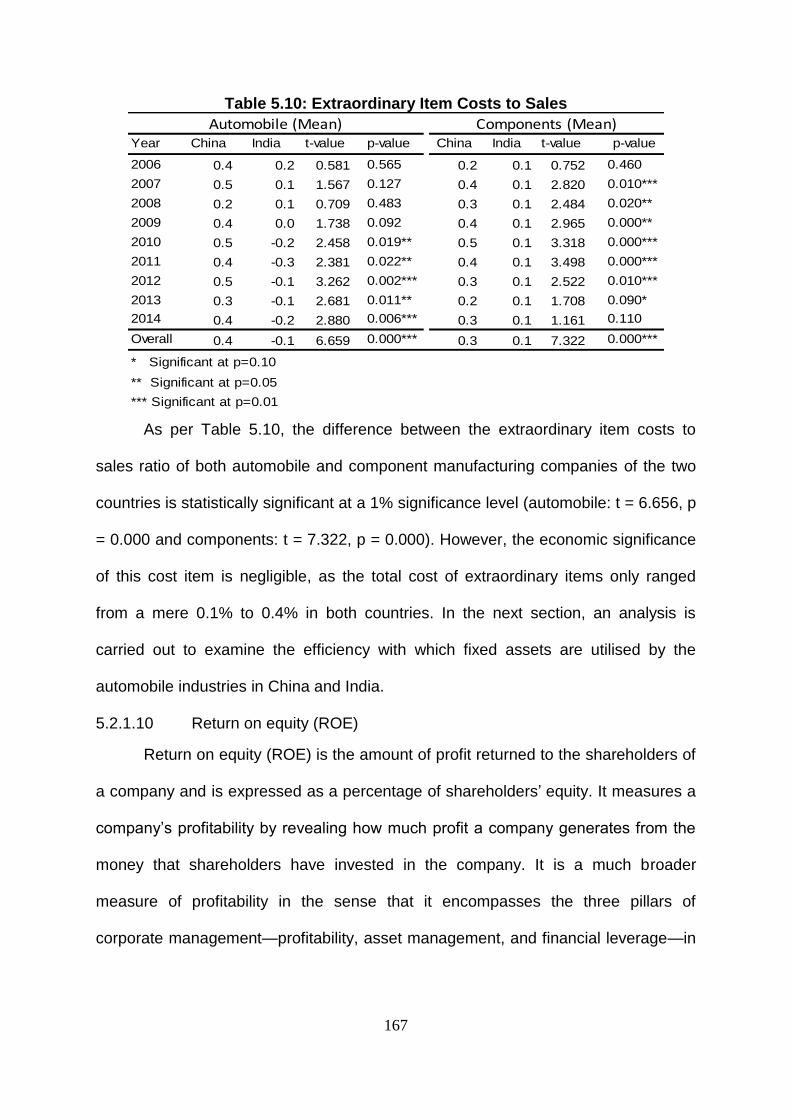
167
Table 5.10: Extraordinary Item Costs to Sales
Year China India t-value p-value China India t-value p-value
2006 0.4 0.2 0.581 0.565 0.2 0.1 0.752 0.460
2007 0.5 0.1 1.567 0.127 0.4 0.1 2.820 0.010***
2008 0.2 0.1 0.709 0.483 0.3 0.1 2.484 0.020**
2009 0.4 0.0 1.738 0.092 0.4 0.1 2.965 0.000**
2010 0.5 -0.2 2.458 0.019** 0.5 0.1 3.318 0.000***
2011 0.4 -0.3 2.381 0.022** 0.4 0.1 3.498 0.000***
2012 0.5 -0.1 3.262 0.002*** 0.3 0.1 2.522 0.010***
2013 0.3 -0.1 2.681 0.011** 0.2 0.1 1.708 0.090*
2014 0.4 -0.2 2.880 0.006*** 0.3 0.1 1.161 0.110
Overall 0.4 -0.1 6.659 0.000*** 0.3 0.1 7.322 0.000***
* Significant at p=0.10
** Significant at p=0.05
*** Significant at p=0.01
Automobile (Mean) Components (Mean)
As per Table 5.10, the difference between the extraordinary item costs to
sales ratio of both automobile and component manufacturing companies of the two
countries is statistically significant at a 1% significance level (automobile: t = 6.656, p
= 0.000 and components: t = 7.322, p = 0.000). However, the economic significance
of this cost item is negligible, as the total cost of extraordinary items only ranged
from a mere 0.1% to 0.4% in both countries. In the next section, an analysis is
carried out to examine the efficiency with which fixed assets are utilised by the
automobile industries in China and India.
5.2.1.10 Return on equity (ROE)
Return on equity (ROE) is the amount of profit returned to the shareholders of
a company and is expressed as a percentage of shareholders’ equity. It measures a
company’s profitability by revealing how much profit a company generates from the
money that shareholders have invested in the company. It is a much broader
measure of profitability in the sense that it encompasses the three pillars of
corporate management—profitability, asset management, and financial leverage—in
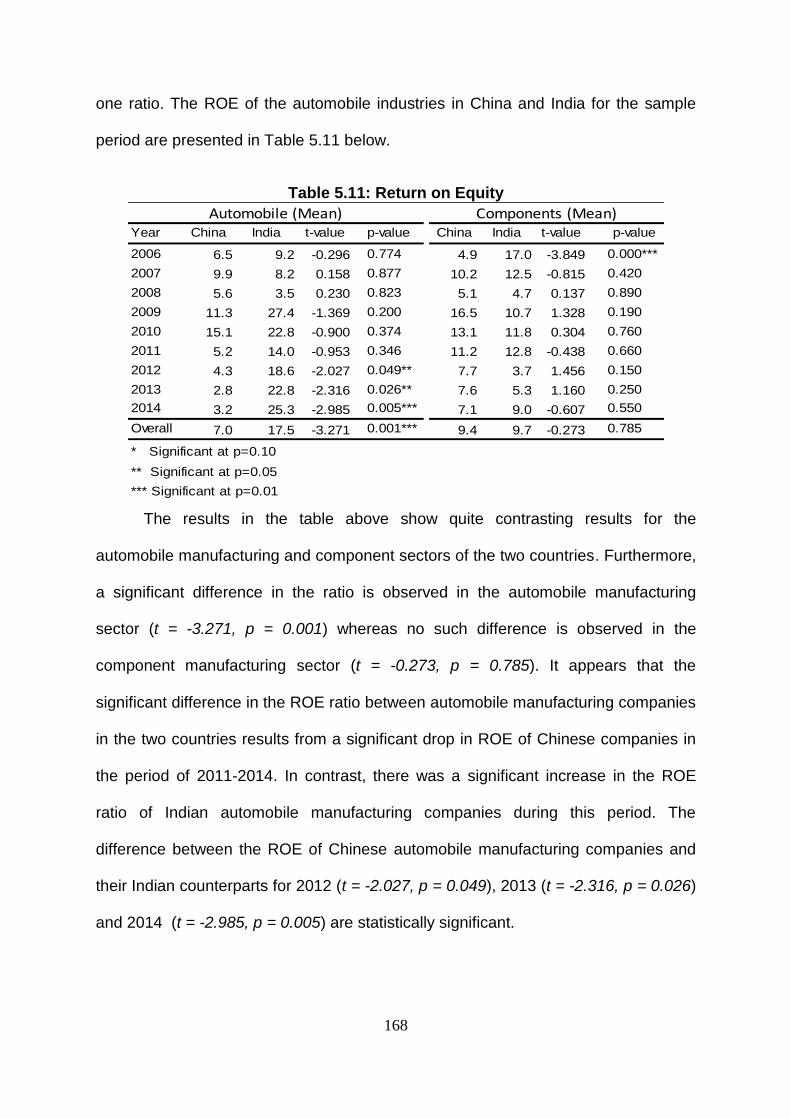
168
one ratio. The ROE of the automobile industries in China and India for the sample
period are presented in Table 5.11 below.
Table 5.11: Return on Equity
Year China India t-value p-value China India t-value p-value
2006 6.5 9.2 -0.296 0.774 4.9 17.0 -3.849 0.000***
2007 9.9 8.2 0.158 0.877 10.2 12.5 -0.815 0.420
2008 5.6 3.5 0.230 0.823 5.1 4.7 0.137 0.890
2009 11.3 27.4 -1.369 0.200 16.5 10.7 1.328 0.190
2010 15.1 22.8 -0.900 0.374 13.1 11.8 0.304 0.760
2011 5.2 14.0 -0.953 0.346 11.2 12.8 -0.438 0.660
2012 4.3 18.6 -2.027 0.049** 7.7 3.7 1.456 0.150
2013 2.8 22.8 -2.316 0.026** 7.6 5.3 1.160 0.250
2014 3.2 25.3 -2.985 0.005*** 7.1 9.0 -0.607 0.550
Overall 7.0 17.5 -3.271 0.001*** 9.4 9.7 -0.273 0.785
* Significant at p=0.10
** Significant at p=0.05
*** Significant at p=0.01
Automobile (Mean) Components (Mean)
The results in the table above show quite contrasting results for the
automobile manufacturing and component sectors of the two countries. Furthermore,
a significant difference in the ratio is observed in the automobile manufacturing
sector (t = -3.271, p = 0.001) whereas no such difference is observed in the
component manufacturing sector (t = -0.273, p = 0.785). It appears that the
significant difference in the ROE ratio between automobile manufacturing companies
in the two countries results from a significant drop in ROE of Chinese companies in
the period of 2011-2014. In contrast, there was a significant increase in the ROE
ratio of Indian automobile manufacturing companies during this period. The
difference between the ROE of Chinese automobile manufacturing companies and
their Indian counterparts for 2012 (t = -2.027, p = 0.049), 2013 (t = -2.316, p = 0.026)
and 2014 (t = -2.985, p = 0.005) are statistically significant.
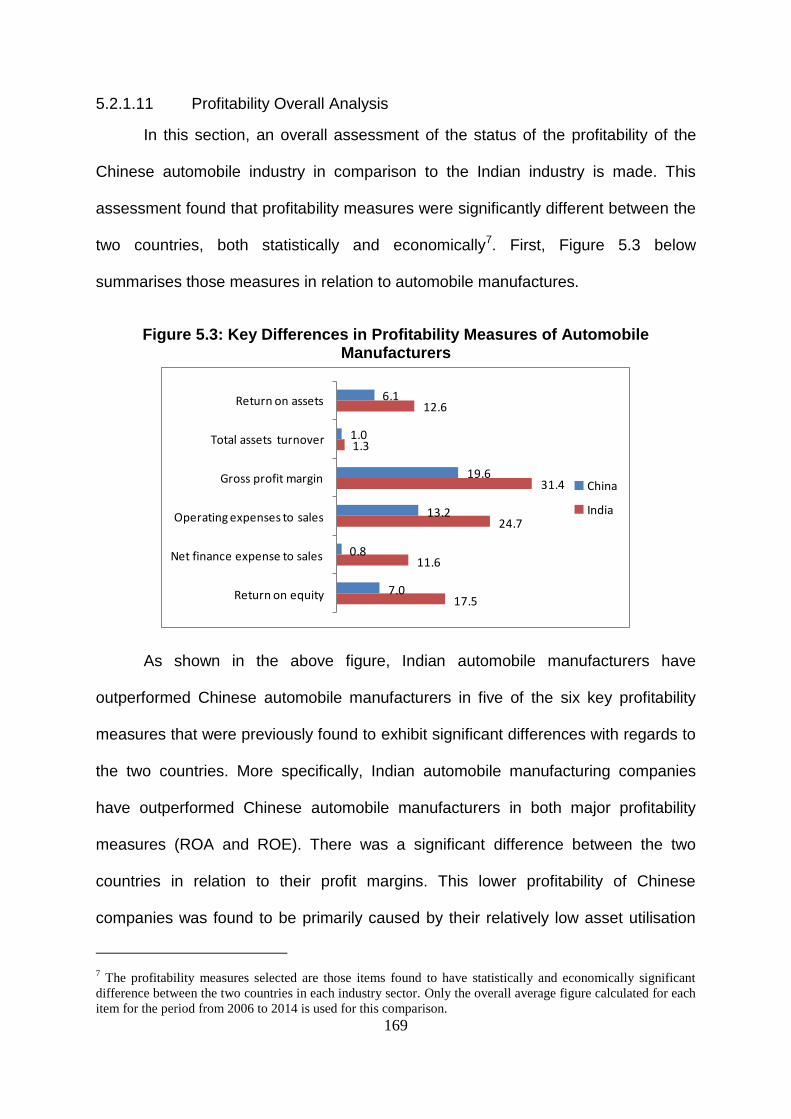
169
5.2.1.11 Profitability Overall Analysis
In this section, an overall assessment of the status of the profitability of the
Chinese automobile industry in comparison to the Indian industry is made. This
assessment found that profitability measures were significantly different between the
two countries, both statistically and economically7. First, Figure 5.3 below
summarises those measures in relation to automobile manufactures.
Figure 5.3: Key Differences in Profitability Measures of Automobile Manufacturers
6.1
1.0
19.6
13.2
0.8
7.0
12.6
1.3
31.4
24.7
11.6
17.5
Return on assets
Total assets turnover
Gross profit margin
Operating expenses to sales
Net finance expense to sales
Return on equity
China
India
As shown in the above figure, Indian automobile manufacturers have
outperformed Chinese automobile manufacturers in five of the six key profitability
measures that were previously found to exhibit significant differences with regards to
the two countries. More specifically, Indian automobile manufacturing companies
have outperformed Chinese automobile manufacturers in both major profitability
measures (ROA and ROE). There was a significant difference between the two
countries in relation to their profit margins. This lower profitability of Chinese
companies was found to be primarily caused by their relatively low asset utilisation
7 The profitability measures selected are those items found to have statistically and economically significant
difference between the two countries in each industry sector. Only the overall average figure calculated for each
item for the period from 2006 to 2014 is used for this comparison.
170
and lower levels of debt capital used. Also, contrary to the general perception that
the cost of production in China is the lowest in the world, this study found that the
cost of goods sold in the Chinese automobile manufacturing sector are significantly
higher in the Indian automobile manufacturing sector. This results in significantly
lower gross profit margins for Chinese automobile companies, causing them to
reduce their operating costs in order to contribute to their net profit. As for the next
finance costs (cost–revenue) Indian companies have been able to generate more
finance revenue to offset finance expenses. This has resulted a significant cost
advantage for Indian automobile manufactures over their Chinese counterparts. The
only area where Chinese automobile manufacturers outperformed Indian automobile
manufactures was in the management of operating expenses. For this expenses,
Chinese companies have been able to keep their costs significantly lower than their
Indian counterparts, giving them a chance to recover from the lost advantage they
faced as a result of having higher costs of sales. However, despite the efficiency with
which these two expenses are managed, Chinese companies have a significantly
lower level of profitability. If this profitability issue is not addressed promptly, the
long-term competitiveness of Chinese automobile companies will be jeopardised.
The Figure 5.4 below depicts the profitability measures that are found to be
significant between automobile component manufacturers in China and India.
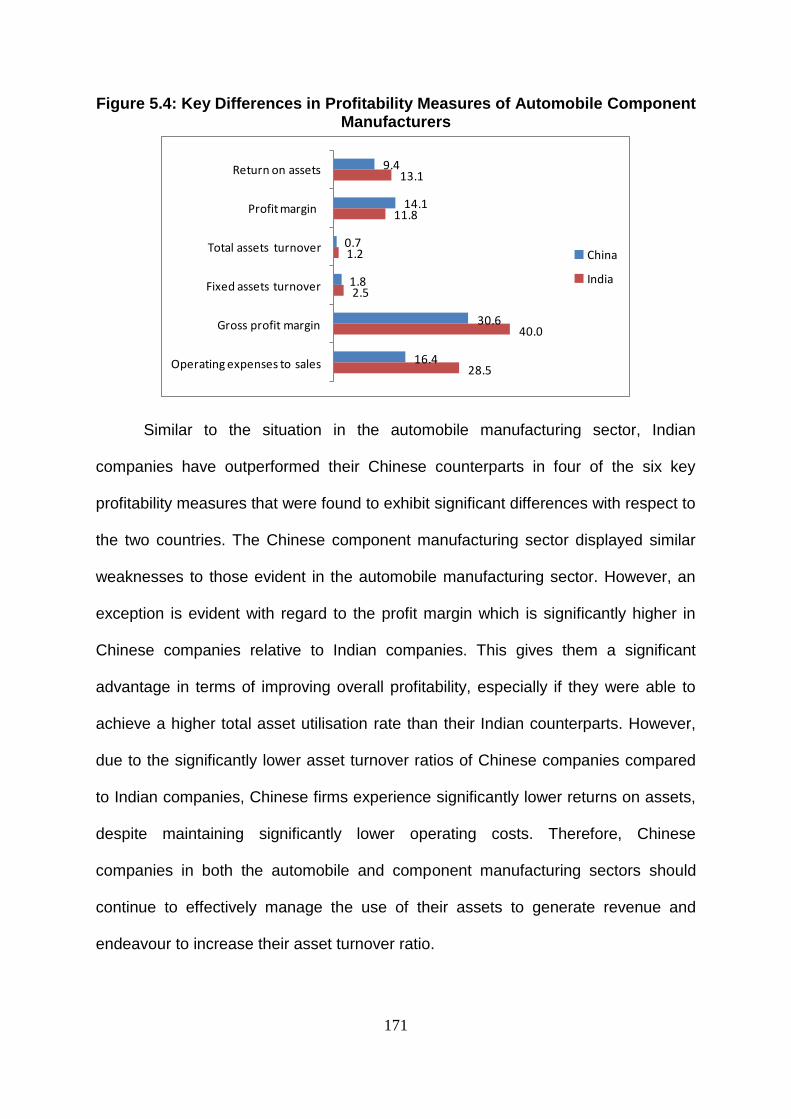
171
Figure 5.4: Key Differences in Profitability Measures of Automobile Component Manufacturers
9.4
14.1
0.7
1.8
30.6
16.4
13.1
11.8
1.2
2.5
40.0
28.5
Return on assets
Profit margin
Total assets turnover
Fixed assets turnover
Gross profit margin
Operating expenses to sales
China
India
Similar to the situation in the automobile manufacturing sector, Indian
companies have outperformed their Chinese counterparts in four of the six key
profitability measures that were found to exhibit significant differences with respect to
the two countries. The Chinese component manufacturing sector displayed similar
weaknesses to those evident in the automobile manufacturing sector. However, an
exception is evident with regard to the profit margin which is significantly higher in
Chinese companies relative to Indian companies. This gives them a significant
advantage in terms of improving overall profitability, especially if they were able to
achieve a higher total asset utilisation rate than their Indian counterparts. However,
due to the significantly lower asset turnover ratios of Chinese companies compared
to Indian companies, Chinese firms experience significantly lower returns on assets,
despite maintaining significantly lower operating costs. Therefore, Chinese
companies in both the automobile and component manufacturing sectors should
continue to effectively manage the use of their assets to generate revenue and
endeavour to increase their asset turnover ratio.
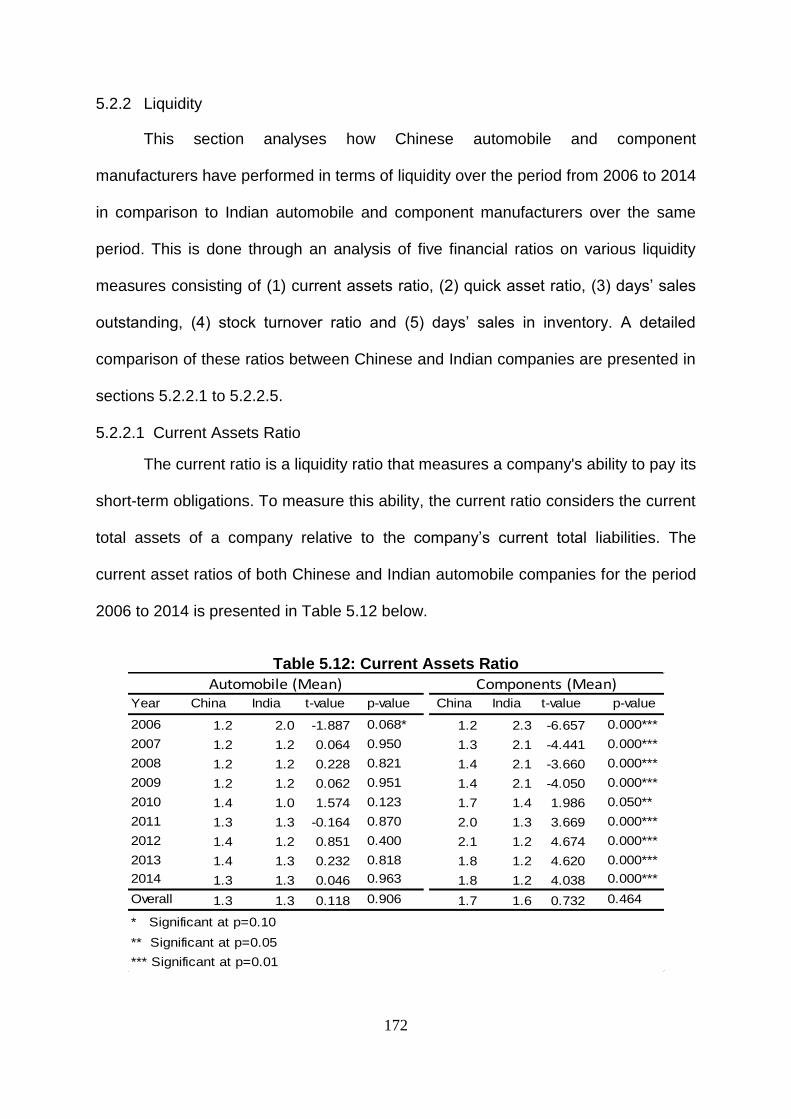
172
5.2.2 Liquidity
This section analyses how Chinese automobile and component
manufacturers have performed in terms of liquidity over the period from 2006 to 2014
in comparison to Indian automobile and component manufacturers over the same
period. This is done through an analysis of five financial ratios on various liquidity
measures consisting of (1) current assets ratio, (2) quick asset ratio, (3) days’ sales
outstanding, (4) stock turnover ratio and (5) days’ sales in inventory. A detailed
comparison of these ratios between Chinese and Indian companies are presented in
sections 5.2.2.1 to 5.2.2.5.
5.2.2.1 Current Assets Ratio
The current ratio is a liquidity ratio that measures a company's ability to pay its
short-term obligations. To measure this ability, the current ratio considers the current
total assets of a company relative to the company’s current total liabilities. The
current asset ratios of both Chinese and Indian automobile companies for the period
2006 to 2014 is presented in Table 5.12 below.
Table 5.12: Current Assets Ratio
Year China India t-value p-value China India t-value p-value
2006 1.2 2.0 -1.887 0.068* 1.2 2.3 -6.657 0.000***
2007 1.2 1.2 0.064 0.950 1.3 2.1 -4.441 0.000***
2008 1.2 1.2 0.228 0.821 1.4 2.1 -3.660 0.000***
2009 1.2 1.2 0.062 0.951 1.4 2.1 -4.050 0.000***
2010 1.4 1.0 1.574 0.123 1.7 1.4 1.986 0.050**
2011 1.3 1.3 -0.164 0.870 2.0 1.3 3.669 0.000***
2012 1.4 1.2 0.851 0.400 2.1 1.2 4.674 0.000***
2013 1.4 1.3 0.232 0.818 1.8 1.2 4.620 0.000***
2014 1.3 1.3 0.046 0.963 1.8 1.2 4.038 0.000***
Overall 1.3 1.3 0.118 0.906 1.7 1.6 0.732 0.464
* Significant at p=0.10
** Significant at p=0.05
*** Significant at p=0.01
Automobile (Mean) Components (Mean)
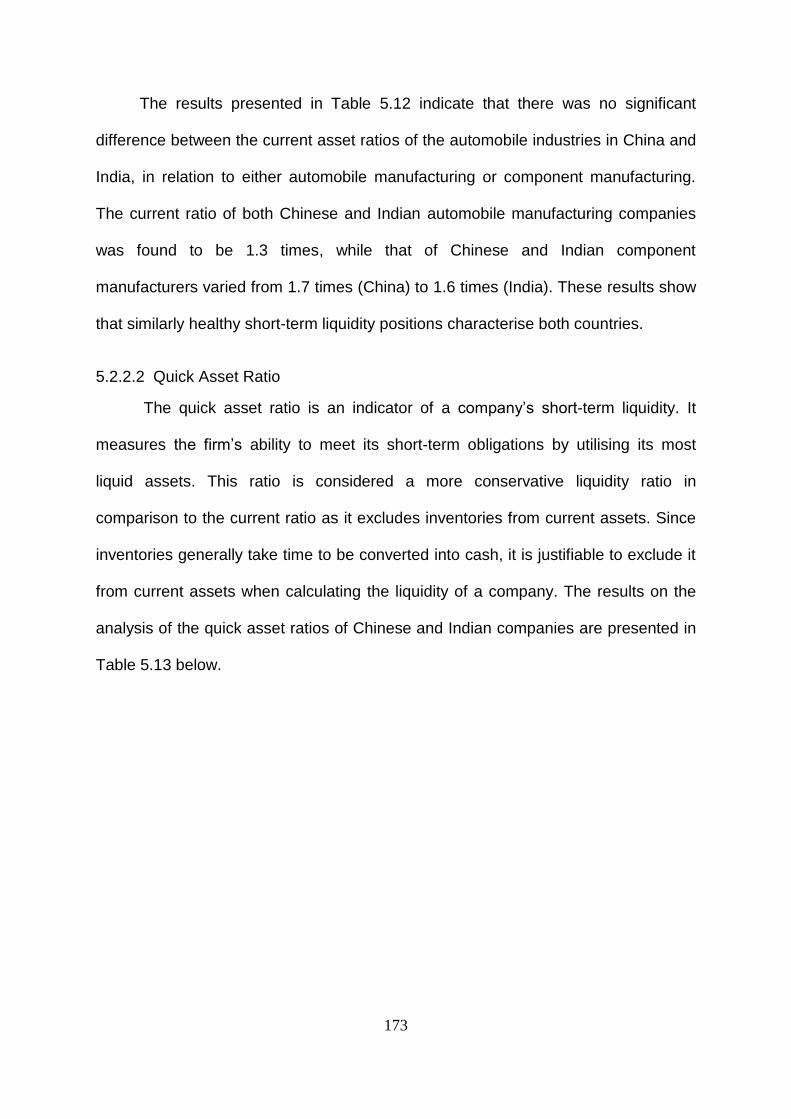
173
The results presented in Table 5.12 indicate that there was no significant
difference between the current asset ratios of the automobile industries in China and
India, in relation to either automobile manufacturing or component manufacturing.
The current ratio of both Chinese and Indian automobile manufacturing companies
was found to be 1.3 times, while that of Chinese and Indian component
manufacturers varied from 1.7 times (China) to 1.6 times (India). These results show
that similarly healthy short-term liquidity positions characterise both countries.
5.2.2.2 Quick Asset Ratio
The quick asset ratio is an indicator of a company’s short-term liquidity. It
measures the firm’s ability to meet its short-term obligations by utilising its most
liquid assets. This ratio is considered a more conservative liquidity ratio in
comparison to the current ratio as it excludes inventories from current assets. Since
inventories generally take time to be converted into cash, it is justifiable to exclude it
from current assets when calculating the liquidity of a company. The results on the
analysis of the quick asset ratios of Chinese and Indian companies are presented in
Table 5.13 below.
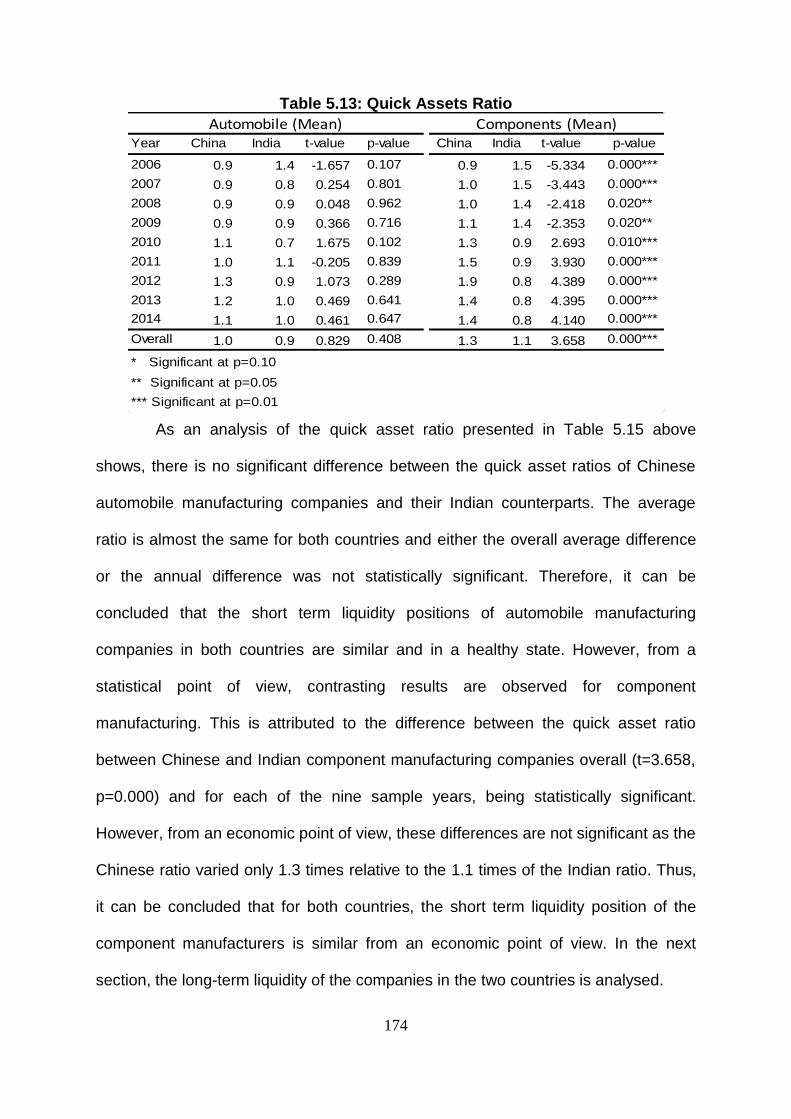
174
Table 5.13: Quick Assets Ratio
Year China India t-value p-value China India t-value p-value
2006 0.9 1.4 -1.657 0.107 0.9 1.5 -5.334 0.000***
2007 0.9 0.8 0.254 0.801 1.0 1.5 -3.443 0.000***
2008 0.9 0.9 0.048 0.962 1.0 1.4 -2.418 0.020**
2009 0.9 0.9 0.366 0.716 1.1 1.4 -2.353 0.020**
2010 1.1 0.7 1.675 0.102 1.3 0.9 2.693 0.010***
2011 1.0 1.1 -0.205 0.839 1.5 0.9 3.930 0.000***
2012 1.3 0.9 1.073 0.289 1.9 0.8 4.389 0.000***
2013 1.2 1.0 0.469 0.641 1.4 0.8 4.395 0.000***
2014 1.1 1.0 0.461 0.647 1.4 0.8 4.140 0.000***
Overall 1.0 0.9 0.829 0.408 1.3 1.1 3.658 0.000***
* Significant at p=0.10
** Significant at p=0.05
*** Significant at p=0.01
Automobile (Mean) Components (Mean)
As an analysis of the quick asset ratio presented in Table 5.15 above
shows, there is no significant difference between the quick asset ratios of Chinese
automobile manufacturing companies and their Indian counterparts. The average
ratio is almost the same for both countries and either the overall average difference
or the annual difference was not statistically significant. Therefore, it can be
concluded that the short term liquidity positions of automobile manufacturing
companies in both countries are similar and in a healthy state. However, from a
statistical point of view, contrasting results are observed for component
manufacturing. This is attributed to the difference between the quick asset ratio
between Chinese and Indian component manufacturing companies overall (t=3.658,
p=0.000) and for each of the nine sample years, being statistically significant.
However, from an economic point of view, these differences are not significant as the
Chinese ratio varied only 1.3 times relative to the 1.1 times of the Indian ratio. Thus,
it can be concluded that for both countries, the short term liquidity position of the
component manufacturers is similar from an economic point of view. In the next
section, the long-term liquidity of the companies in the two countries is analysed.
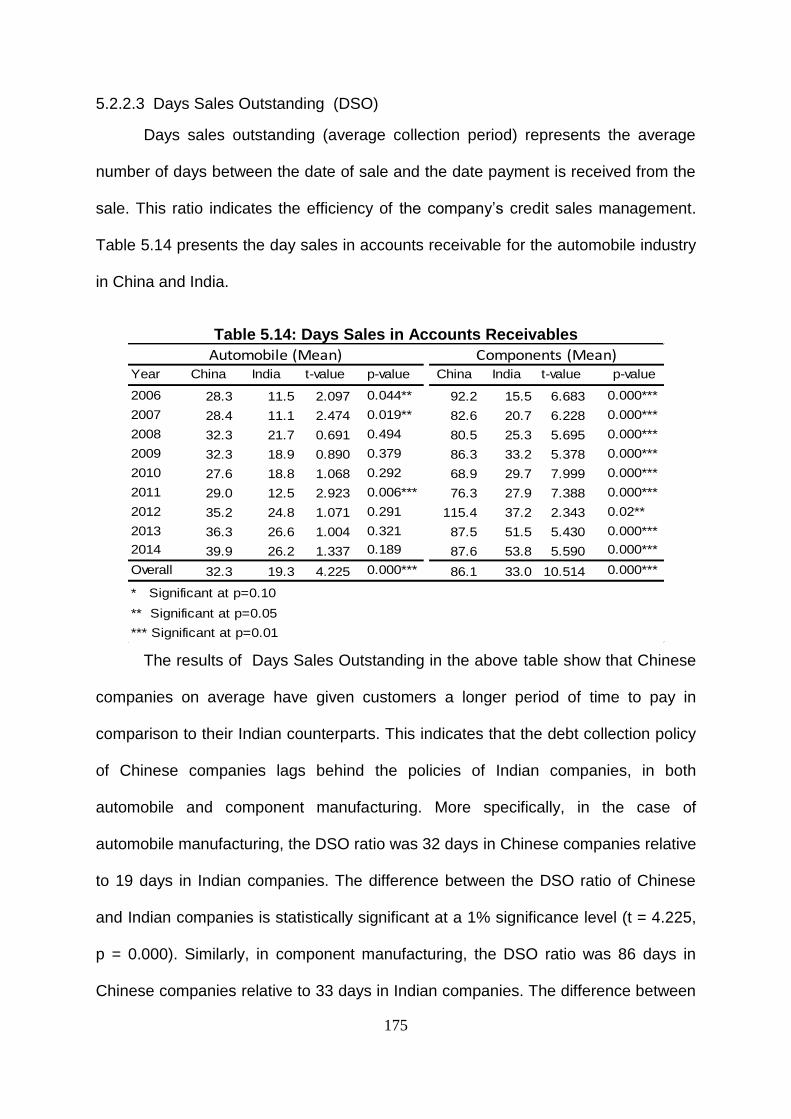
175
5.2.2.3 Days Sales Outstanding (DSO)
Days sales outstanding (average collection period) represents the average
number of days between the date of sale and the date payment is received from the
sale. This ratio indicates the efficiency of the company’s credit sales management.
Table 5.14 presents the day sales in accounts receivable for the automobile industry
in China and India.
Table 5.14: Days Sales in Accounts Receivables
Year China India t-value p-value China India t-value p-value
2006 28.3 11.5 2.097 0.044** 92.2 15.5 6.683 0.000***
2007 28.4 11.1 2.474 0.019** 82.6 20.7 6.228 0.000***
2008 32.3 21.7 0.691 0.494 80.5 25.3 5.695 0.000***
2009 32.3 18.9 0.890 0.379 86.3 33.2 5.378 0.000***
2010 27.6 18.8 1.068 0.292 68.9 29.7 7.999 0.000***
2011 29.0 12.5 2.923 0.006*** 76.3 27.9 7.388 0.000***
2012 35.2 24.8 1.071 0.291 115.4 37.2 2.343 0.02**
2013 36.3 26.6 1.004 0.321 87.5 51.5 5.430 0.000***
2014 39.9 26.2 1.337 0.189 87.6 53.8 5.590 0.000***
Overall 32.3 19.3 4.225 0.000*** 86.1 33.0 10.514 0.000***
* Significant at p=0.10
** Significant at p=0.05
*** Significant at p=0.01
Automobile (Mean) Components (Mean)
The results of Days Sales Outstanding in the above table show that Chinese
companies on average have given customers a longer period of time to pay in
comparison to their Indian counterparts. This indicates that the debt collection policy
of Chinese companies lags behind the policies of Indian companies, in both
automobile and component manufacturing. More specifically, in the case of
automobile manufacturing, the DSO ratio was 32 days in Chinese companies relative
to 19 days in Indian companies. The difference between the DSO ratio of Chinese
and Indian companies is statistically significant at a 1% significance level (t = 4.225,
p = 0.000). Similarly, in component manufacturing, the DSO ratio was 86 days in
Chinese companies relative to 33 days in Indian companies. The difference between
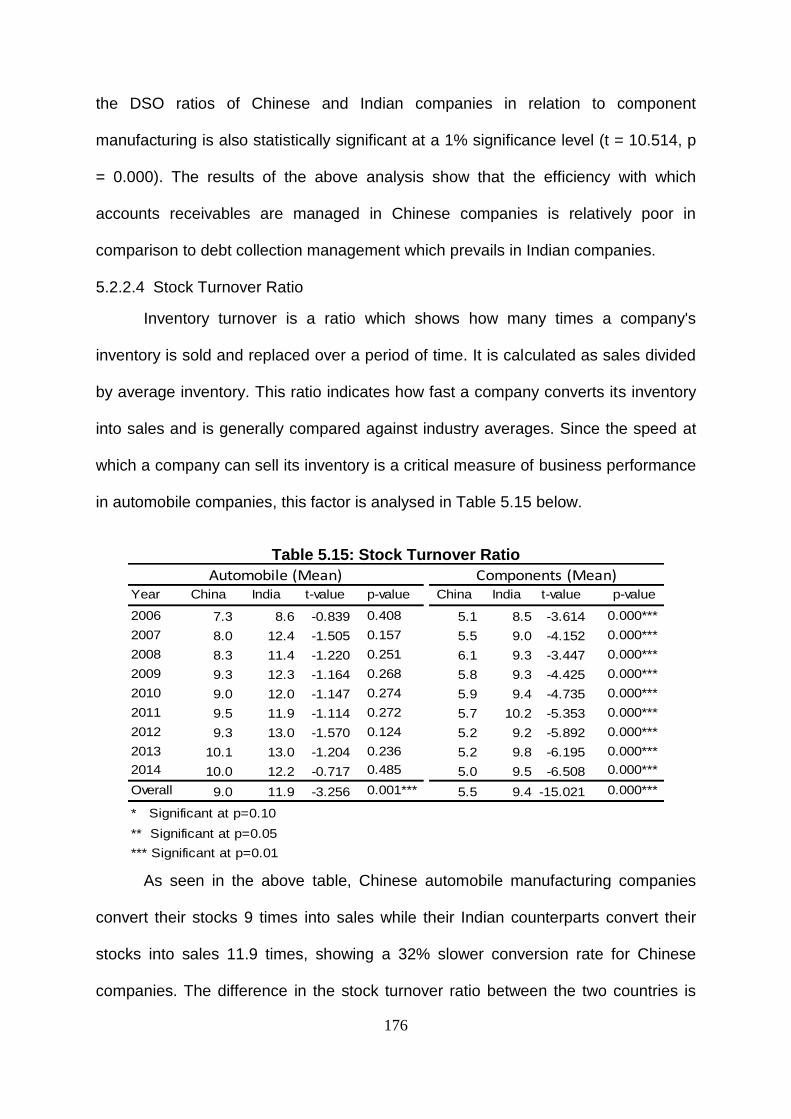
176
the DSO ratios of Chinese and Indian companies in relation to component
manufacturing is also statistically significant at a 1% significance level (t = 10.514, p
= 0.000). The results of the above analysis show that the efficiency with which
accounts receivables are managed in Chinese companies is relatively poor in
comparison to debt collection management which prevails in Indian companies.
5.2.2.4 Stock Turnover Ratio
Inventory turnover is a ratio which shows how many times a company's
inventory is sold and replaced over a period of time. It is calculated as sales divided
by average inventory. This ratio indicates how fast a company converts its inventory
into sales and is generally compared against industry averages. Since the speed at
which a company can sell its inventory is a critical measure of business performance
in automobile companies, this factor is analysed in Table 5.15 below.
Table 5.15: Stock Turnover Ratio
Year China India t-value p-value China India t-value p-value
2006 7.3 8.6 -0.839 0.408 5.1 8.5 -3.614 0.000***
2007 8.0 12.4 -1.505 0.157 5.5 9.0 -4.152 0.000***
2008 8.3 11.4 -1.220 0.251 6.1 9.3 -3.447 0.000***
2009 9.3 12.3 -1.164 0.268 5.8 9.3 -4.425 0.000***
2010 9.0 12.0 -1.147 0.274 5.9 9.4 -4.735 0.000***
2011 9.5 11.9 -1.114 0.272 5.7 10.2 -5.353 0.000***
2012 9.3 13.0 -1.570 0.124 5.2 9.2 -5.892 0.000***
2013 10.1 13.0 -1.204 0.236 5.2 9.8 -6.195 0.000***
2014 10.0 12.2 -0.717 0.485 5.0 9.5 -6.508 0.000***
Overall 9.0 11.9 -3.256 0.001*** 5.5 9.4 -15.021 0.000***
* Significant at p=0.10
** Significant at p=0.05
*** Significant at p=0.01
Automobile (Mean) Components (Mean)
As seen in the above table, Chinese automobile manufacturing companies
convert their stocks 9 times into sales while their Indian counterparts convert their
stocks into sales 11.9 times, showing a 32% slower conversion rate for Chinese
companies. The difference in the stock turnover ratio between the two countries is
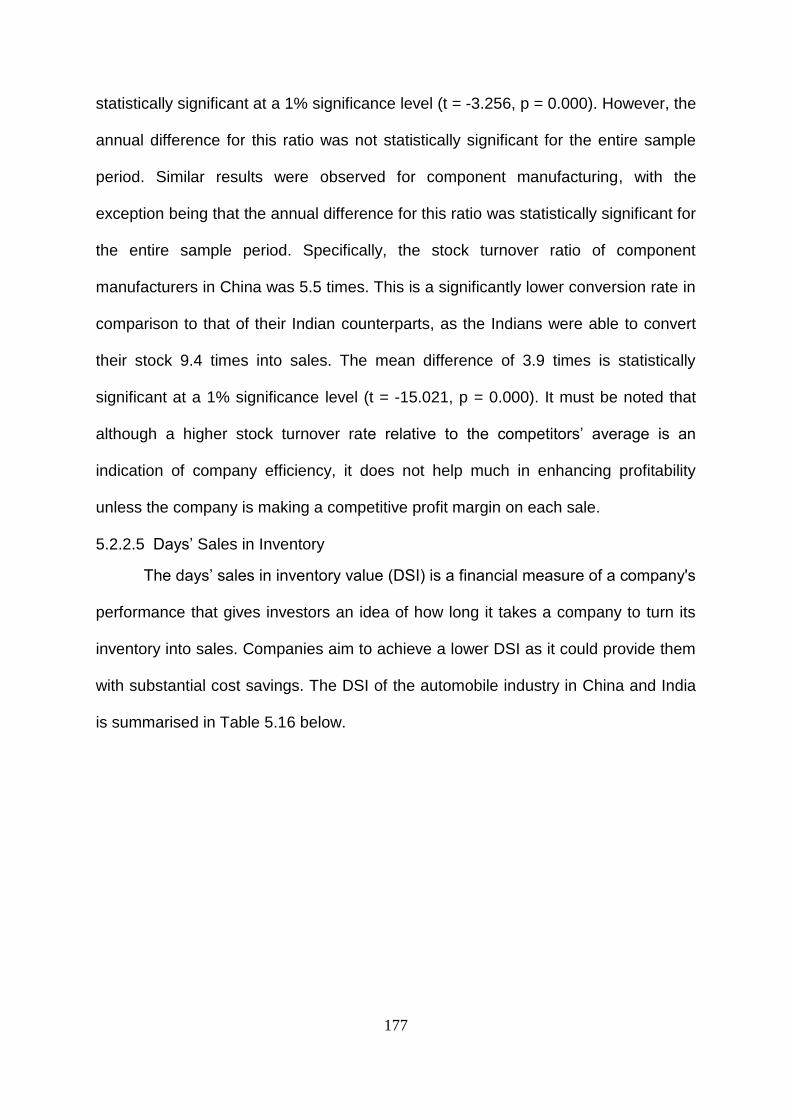
177
statistically significant at a 1% significance level (t = -3.256, p = 0.000). However, the
annual difference for this ratio was not statistically significant for the entire sample
period. Similar results were observed for component manufacturing, with the
exception being that the annual difference for this ratio was statistically significant for
the entire sample period. Specifically, the stock turnover ratio of component
manufacturers in China was 5.5 times. This is a significantly lower conversion rate in
comparison to that of their Indian counterparts, as the Indians were able to convert
their stock 9.4 times into sales. The mean difference of 3.9 times is statistically
significant at a 1% significance level (t = -15.021, p = 0.000). It must be noted that
although a higher stock turnover rate relative to the competitors’ average is an
indication of company efficiency, it does not help much in enhancing profitability
unless the company is making a competitive profit margin on each sale.
5.2.2.5 Days’ Sales in Inventory
The days’ sales in inventory value (DSI) is a financial measure of a company's
performance that gives investors an idea of how long it takes a company to turn its
inventory into sales. Companies aim to achieve a lower DSI as it could provide them
with substantial cost savings. The DSI of the automobile industry in China and India
is summarised in Table 5.16 below.
178
Table 5.16: Number of Days in Stock
Year China India t-value p-value China India t-value p-value
2006 66.8 49.9 0.645 0.523 109.4 54.4 3.172 0.000***
2007 79.4 42.1 0.949 0.349 88.0 52.4 3.393 0.000***
2008 73.1 39.4 0.948 0.350 83.4 60.5 1.611 0.110
2009 44.4 35.2 1.187 0.243 69.8 56.8 1.868 0.06*
2010 66.5 39.8 0.790 0.434 72.6 50.0 4.060 0.000***
2011 68.4 37.0 0.778 0.441 78.0 51.4 4.338 0.000***
2012 70.6 40.2 0.737 0.465 87.8 55.0 3.865 0.000***
2013 44.3 42.4 0.200 0.843 92.2 53.0 4.283 0.000***
2014 46.3 71.9 -1.100 0.293 98.1 52.1 4.895 0.000***
Overall 61.9 44.3 1.747 0.082* 86.0 53.9 10.203 0.000***
* Significant at p=0.10
** Significant at p=0.05
*** Significant at p=0.01
Automobile (Mean) Components (Mean)
As per the results shown in Table 5.16 above, Chinese companies, both
automobile and component manufactures, have a significantly higher DSI ratio than
their Indian counterparts. More specifically, the DSI of automobile manufacturers
was 62 days in China relative to 44 days in India and this difference is significant at a
10% significance level (t = 1.747, p = 0.082). Similarly, the DSI of automobile
component manufacturers was 54 days in China relative to 10 days in India and this
difference is significant at a 10% significance level (t = 10.203, p = 0.000). When this
ratio is analysed by year, the annual difference in this ratio for automobile
manufacturing was not statistically significant for any of the nine years in the sample.
This is in contrast to component manufacturing where except for 2008, the annual
difference in the DSI ratio was statistically significant. Since the DSI is one measure
of inventory effectiveness and shows the average length of time that a company’s
cash is tied up in inventory, the relatively higher DSI ratio of Chinese companies
shows a lack of efficiency in inventory management by Chinese companies in
comparison to their Indian counterparts.
179
5.2.2.6 Liquidity Overall Analysis
In this section, an overall assessment of the liquidity of the Chinese
automobile industry relative to the Indian industry is made. This assessment is
conducted on the basis of liquidity measures that were found to significantly differ
between the two countries both statistically and economically8. The results
presented in the previous sections show that there is no significant difference
between the levels of liquidity in Chinese and Indian companies with regards to both
automobile and component sectors. However, an exception is present with reference
to the quick ratio in the component sector where the difference was significant at a
1% significance level, despite the difference having no economic significance.
Therefore, on the basis of this result, it can be concluded that there is no difference
between the two countries with regards to liquidity. However, significant differences
were observed between the two countries in relation to days sales in accounts
receivables, and days sales in inventory ratios. Both these ratios indicate that the
management of accounts receivables and inventory by Chinese companies was poor
in comparison to that of Indian companies with regards to both the automobile
manufacturing and component manufacturing sectors. More specifically, Chinese
automobile manufacturers on average take 32 days and component manufacturers
take 86 days to collect debt, while Indian companies on average take only 19 and 33
days respectively to collect their debts. Similarly, when it comes to inventory
management, Chinese companies on average needed 61 and 86 days respectively
to sell their entire inventory, while the Indian companies on average needed 44 and
53 days respectively to sell their inventory. This shows that Indian companies have
8 The liquidity measures selected are those items found to have statistically and economically significant
difference between the two countries in each industry sector. Only the overall average figure calculated for each
item for the period from 2006 to 2014 is used for this comparison.
180
outperformed Chinese companies in accounts receivables and inventory
management. This indicates that Chinese companies need to improve on both
aspects in order to avoid liquidity issues in the future. The following section
examines the long term liquidity status of the automobile industries in China and
India through an analysis of the total debt to assets ratio.
5.2.3 Leverage
This section analyses how the Chinese automobile and component manufacturers
have performed in terms of solvency (leverage) over the period from 2006 to 2014 in
comparison to that of Indian automobile and component manufacturers over the
same period. This is done through an analysis of the total debt to total assets ratio,
which is a leverage ratio that indicates the total amount of debt relative to assets.
This ratio provides a measure of the level of leverage and financial risk of a
company. The higher the total debt ratio, the more debt the company has in its
capital structure while the lower the total debt ratio, the more equity the company has
in its capital structure. Table 5.17 below shows the results concerning the debt to
assets ratio for the automobile industries in China and India.
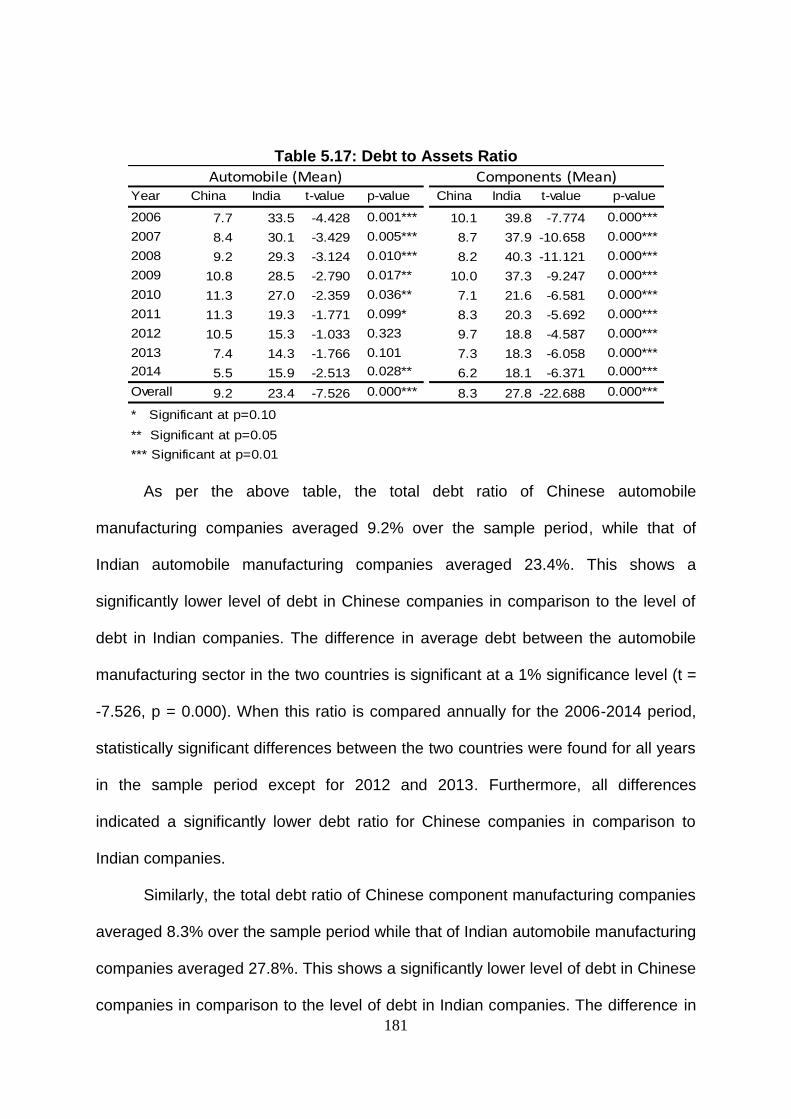
181
Table 5.17: Debt to Assets Ratio
Year China India t-value p-value China India t-value p-value
2006 7.7 33.5 -4.428 0.001*** 10.1 39.8 -7.774 0.000***
2007 8.4 30.1 -3.429 0.005*** 8.7 37.9 -10.658 0.000***
2008 9.2 29.3 -3.124 0.010*** 8.2 40.3 -11.121 0.000***
2009 10.8 28.5 -2.790 0.017** 10.0 37.3 -9.247 0.000***
2010 11.3 27.0 -2.359 0.036** 7.1 21.6 -6.581 0.000***
2011 11.3 19.3 -1.771 0.099* 8.3 20.3 -5.692 0.000***
2012 10.5 15.3 -1.033 0.323 9.7 18.8 -4.587 0.000***
2013 7.4 14.3 -1.766 0.101 7.3 18.3 -6.058 0.000***
2014 5.5 15.9 -2.513 0.028** 6.2 18.1 -6.371 0.000***
Overall 9.2 23.4 -7.526 0.000*** 8.3 27.8 -22.688 0.000***
* Significant at p=0.10
** Significant at p=0.05
*** Significant at p=0.01
Automobile (Mean) Components (Mean)
As per the above table, the total debt ratio of Chinese automobile
manufacturing companies averaged 9.2% over the sample period, while that of
Indian automobile manufacturing companies averaged 23.4%. This shows a
significantly lower level of debt in Chinese companies in comparison to the level of
debt in Indian companies. The difference in average debt between the automobile
manufacturing sector in the two countries is significant at a 1% significance level (t =
-7.526, p = 0.000). When this ratio is compared annually for the 2006-2014 period,
statistically significant differences between the two countries were found for all years
in the sample period except for 2012 and 2013. Furthermore, all differences
indicated a significantly lower debt ratio for Chinese companies in comparison to
Indian companies.
Similarly, the total debt ratio of Chinese component manufacturing companies
averaged 8.3% over the sample period while that of Indian automobile manufacturing
companies averaged 27.8%. This shows a significantly lower level of debt in Chinese
companies in comparison to the level of debt in Indian companies. The difference in
182
average debt between the automobile manufacturing sectors in the two countries is
significant at a 1% significance level (t = -22.688, p = 0.000). When this ratio is
compared annually for the 2006-2014 period, statistically significant differences
between the two countries were found for all years in the sample period. Further, as
in the case of the automobile manufacturing sector, all the differences indicated a
significantly lower debt ratio for Chinese companies in comparison to Indian
companies.
5.3 PART B: Results on the Analysis of Efficiency and Discussion
The main aim of this section is to conduct an empirical analysis of the efficiency of
manufacturers in the Chinese automobile industry from 2006 to 2014. Data
Envelopment Analysis (DEA) is used for this purpose to measure, compare and
explain the performance of automobile manufacturers in regards to their efficiency.
The Chinese automobile industry (as discussed in Chapter 2 and Chapter 3) was
rather inefficient at the early stage of the industry and characterised by low-quality
production. This inefficiency was attributed primarily to a lack of technology and
imbalance in the economic infrastructure of the country (Harwit 1995). Although the
central government in China aimed to develop industrial policies to make local
producers more efficient, there were concerns and issues relating to collaborations
with foreign investors who brought advanced technology. Consequently, automobile
and component manufactures in the country continued to struggle to enhance the
production efficiency, owing to the limited capabilities of producers to make high
quality products while maintaining a low-cost strategy.
The DEA approach used here to analyse efficiency is presented in two-stages
of analysis using the computer programme DEAP Version 2.1 The first stage of DEA
is used to estimate the parameters of the efficiency frontier function of observed
183
decision-making units (DMUs). The analysis is conducted using firm-level data
obtained from 2006 to 2014. The data is sourced from the OSIRIS database which
contains 99 manufacturers, with 624 observations from the Chinese automobile
industry. The estimation is conducted in the following categories: by aggregate
manufacturers; by automobile manufacturers; by component manufacturers; and by
size, smaller or equal to 2 million US dollars and greater than 2 million US dollars.
The second stage of DEA is conducted using multivariate regression analysis which
is presented in Part C of this Chapter.
Section 5.4.1 provides an initial assessment of the data used to ensure that
the selected output variable is related to the selected input variables. Section 5.4.2
presents the analysis and empirical results regarding the efficiency performance of
the automobile industry. The proposed empirical results are carried out based on the
global industry classification code. Further, three subsections are designed to
answer the research questions regarding efficiency performance. This constitutes
the analysis on the auto industry as a whole, the automobile manufacturers, and the
component manufacturers.
5.4.1 Initial Data Assessment
In this analysis, inputs are explained by the following variables: the number of
employees that are substituted as labour, total fixed assets including tangible and
intangible used as capital, stock which represents the materials used in the industry
for manufacturing products, operating expenses including material handling, and
selling and administration expenses are all included in the expenditures incurred
from the manufacturing process; and the output is the gross profit of the year. The
relevant data was sourced from the OSIRIS database (see Appendix E- for
“Descriptive statistics of inputs and output”).
184
To ensure that the gross profit (output) relates to the selected inputs (labour,
capital, materials expense, operating expense), the initial assessment was
performed using correlation analysis which is shown in Table 5.18 below.
Table 5.18: Pearson’s Correlations among the Output and Inputs Gross
Profit Labour Capital Material
Costs Operating Expenses
Gross Profit Pearson Correlation 1
Sig.(2-tailed)
N 624
Labour Pearson Correlation 0.723 1
Sig.(2-tailed) 0.000***
N 624 624
Capital Pearson Correlation 0.828 0.692 1
Sig.(2-tailed) 0.000*** 0.000***
N 624 624 624 Material Costs Pearson Correlation 0.781 0.668 0.806 1
Sig.(2-tailed) 0 0.000*** 0.000***
N 624 624 624 624 Operating Expenses Pearson Correlation 0.930 0.667 0.813 0.759 1
Sig.(2-tailed) 0.000*** 0.000*** 0.000*** 0.000***
N 624 624 624 624 624
***Correlation is significant at the 0.01 level (2-tailed) **Correlation is significant at the 0.05 level (2-tailed) *Correlation is significant at the 0.10 level (2-tailed)
The results in the above table show that the labour, capital, material costs and
operating expenses are significantly correlated with gross profit at a 1% level of
significance. The correlation between the input variables is within the interval of
0.667 and 0.930. The highest correlation is between the operating expenses and
gross profit. The results indicate that output (gross profit) is related to all the input
(labour, capital, material costs, operating expenses).
5.4.2 Technical Efficiency Performance of the Automobile Industry
To examine the research questions presented in section 4.3 and assess the
current level of operational efficiency in the Chinese automobile industry, the input-
oriented DEA model was used. This section provides empirical results generated
185
from the first-stage of the two-stage DEA analysis of manufacturers in the Chinese
automobile industry. The results are organised in two groups which are the
automobile manufacturers and the component manufacturers, in order to conduct the
DEA analysis on each homogenous group. The input-oriented VRS model of DEA
was used to calculate the technical efficiency on (1) constant return to scale
(CRSTE), (2) pure technical efficiency (VRSTE) on variable constant scale and (3)
scale efficiency (SCALE) points for the observed decision-making units (DMUs). The
allocative efficiency (AE) and cost efficiency (CE) are calculated thereafter on the
DMUs. As described in Chapter 4, the technical efficiency is used to measure the
maximum amount of output which can be generated from inputs (see Appendix F- for
“Descriptive statistics of Efficiency scores”).
The assumption with technical efficiency is that all the firms operate utilising
their optimal scale. The observed results for technical efficiency of manufacturers are
presented in Figure 5. 5 below (see appendix G for detailed calculations).
Figure 5.5: Constant Return to Scale Technical Efficiency (CRSTE)
As shown in Figure 5.5 above, efficiency measured with the constant returns
to scale (CRSTE) of automobile manufactures varied from 0.84 in 2006 to 0.94 in
2006 2007 2008 2009 2010 2011 2012 2013 2014
Automobile 0.84 0.89 0.78 0.84 0.91 0.90 0.90 0.90 0.94
Component 0.78 0.84 0.80 0.85 0.90 0.89 0.84 0.84 0.85
0.70
0.75
0.80
0.85
0.90
0.95
1.00
Components
Automobile
186
2014. It recorded the lowest score of 0.78 in 2008 but has steadily improved since
then. The efficiency levels for component manufacturers increased, varying from
0.78 in 2006 to 0.85 in 2014, showing a similar pattern until around 2011. The
efficiency of component manufacturers dropped in 2012 to 0.84 and has remained
plateaued since. The drop in CRSTE of both automobile and component
manufacturing in 2008 can be attributable to the Global Financial Crisis, which drove
up inefficiency in production due to a lack of demand in the market which would
otherwise have acted to fund production or improve labour efficiency. However, the
recent drop in efficiency in component manufacturing is a concern as it is likely to
have been caused by inefficiencies within the manufacturing processes.
The second technical efficiency parameter estimated from DEA is pure
technical efficiency as indicated by the variable to scale technical efficiency
(VRSTE). This is used to indicate the productivity level when firms are not operating
at the optimal level, for instance, when there is government intervention, regulation
and imperfect competition. Therefore, the level of pure technical efficiency (PTE)
may indicate input performance when there are imperfect conditions in the market
(Coelli et al. 2005). This is depicted in Figure 5.6 below.
187
Figure 5.6: Variable Return to Scale Technical Efficiency (VRSTE)
As shown in Figure 5.6 above, VRSTE parameters are maintained at a higher
level than the CRSTE parameters, which might indicate the capabilities of both
automobile and component manufacturers to manage their level of efficiency with
government intervention. However, component manufacturers show a lower level of
VRSTE compared to automobile manufacturers, which might indicate that their
efficiency is more sensitive in the presence of government intervention or imperfect
market conditions.
5.4.3 Scale Efficiency
Scale efficiency is achieved when the observed DMUs are all operating at the
optimal scale. The scale efficiency of both automobile and component manufacturing
companies for the period from 2006 to 2014 are presented in Figure 5.7 below.
2006 2007 2008 2009 2010 2011 2012 2013 2014
Automobile 0.97 0.98 0.93 0.95 0.98 0.95 0.94 0.95 0.96
Component 0.92 0.91 0.91 0.92 0.94 0.93 0.88 0.89 0.92
0.7
0.75
0.8
0.85
0.9
0.95
1Automobile
Components
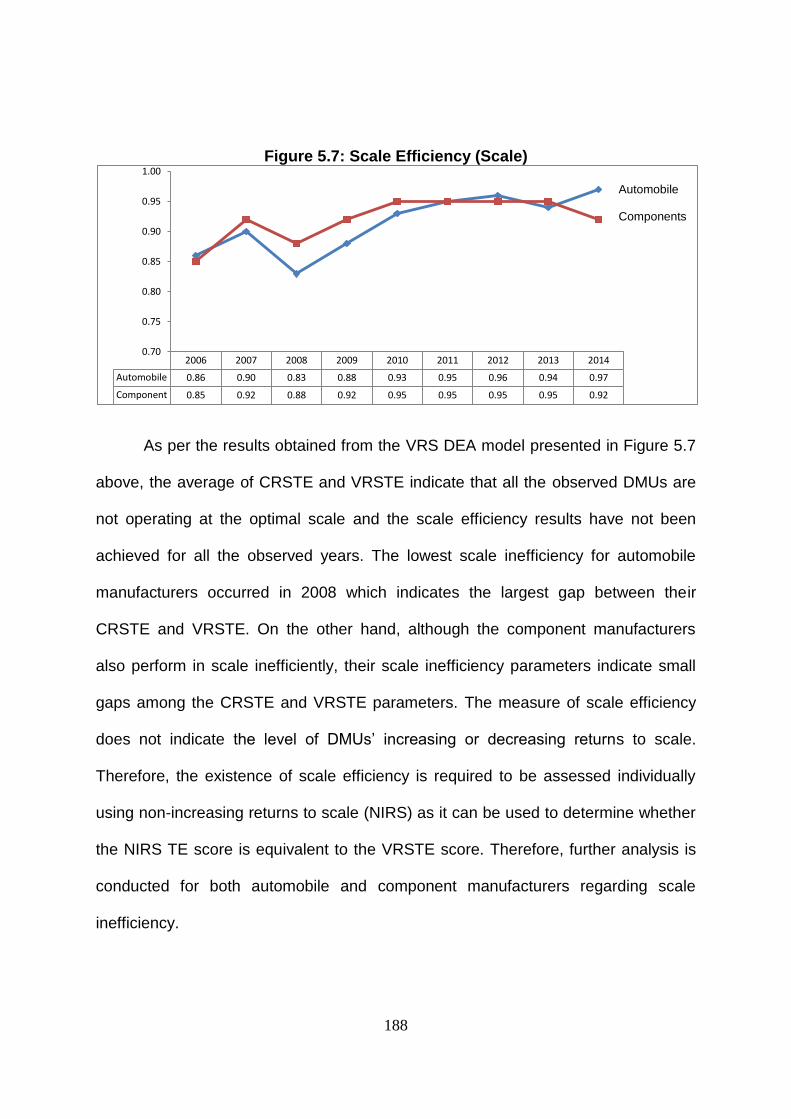
188
Figure 5.7: Scale Efficiency (Scale)
As per the results obtained from the VRS DEA model presented in Figure 5.7
above, the average of CRSTE and VRSTE indicate that all the observed DMUs are
not operating at the optimal scale and the scale efficiency results have not been
achieved for all the observed years. The lowest scale inefficiency for automobile
manufacturers occurred in 2008 which indicates the largest gap between their
CRSTE and VRSTE. On the other hand, although the component manufacturers
also perform in scale inefficiently, their scale inefficiency parameters indicate small
gaps among the CRSTE and VRSTE parameters. The measure of scale efficiency
does not indicate the level of DMUs’ increasing or decreasing returns to scale.
Therefore, the existence of scale efficiency is required to be assessed individually
using non-increasing returns to scale (NIRS) as it can be used to determine whether
the NIRS TE score is equivalent to the VRSTE score. Therefore, further analysis is
conducted for both automobile and component manufacturers regarding scale
inefficiency.
2006 2007 2008 2009 2010 2011 2012 2013 2014
Automobile 0.86 0.90 0.83 0.88 0.93 0.95 0.96 0.94 0.97
Component 0.85 0.92 0.88 0.92 0.95 0.95 0.95 0.95 0.92
0.70
0.75
0.80
0.85
0.90
0.95
1.00
Automobile
Components
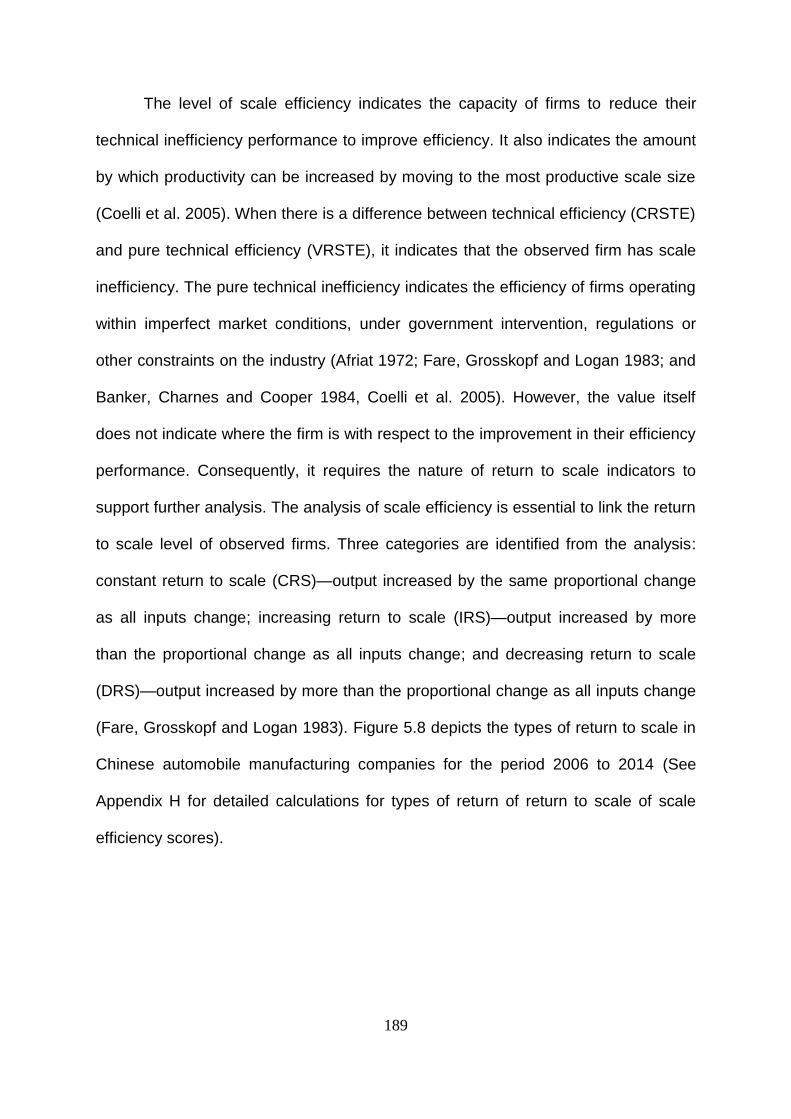
189
The level of scale efficiency indicates the capacity of firms to reduce their
technical inefficiency performance to improve efficiency. It also indicates the amount
by which productivity can be increased by moving to the most productive scale size
(Coelli et al. 2005). When there is a difference between technical efficiency (CRSTE)
and pure technical efficiency (VRSTE), it indicates that the observed firm has scale
inefficiency. The pure technical inefficiency indicates the efficiency of firms operating
within imperfect market conditions, under government intervention, regulations or
other constraints on the industry (Afriat 1972; Fare, Grosskopf and Logan 1983; and
Banker, Charnes and Cooper 1984, Coelli et al. 2005). However, the value itself
does not indicate where the firm is with respect to the improvement in their efficiency
performance. Consequently, it requires the nature of return to scale indicators to
support further analysis. The analysis of scale efficiency is essential to link the return
to scale level of observed firms. Three categories are identified from the analysis:
constant return to scale (CRS)—output increased by the same proportional change
as all inputs change; increasing return to scale (IRS)—output increased by more
than the proportional change as all inputs change; and decreasing return to scale
(DRS)—output increased by more than the proportional change as all inputs change
(Fare, Grosskopf and Logan 1983). Figure 5.8 depicts the types of return to scale in
Chinese automobile manufacturing companies for the period 2006 to 2014 (See
Appendix H for detailed calculations for types of return of return to scale of scale
efficiency scores).
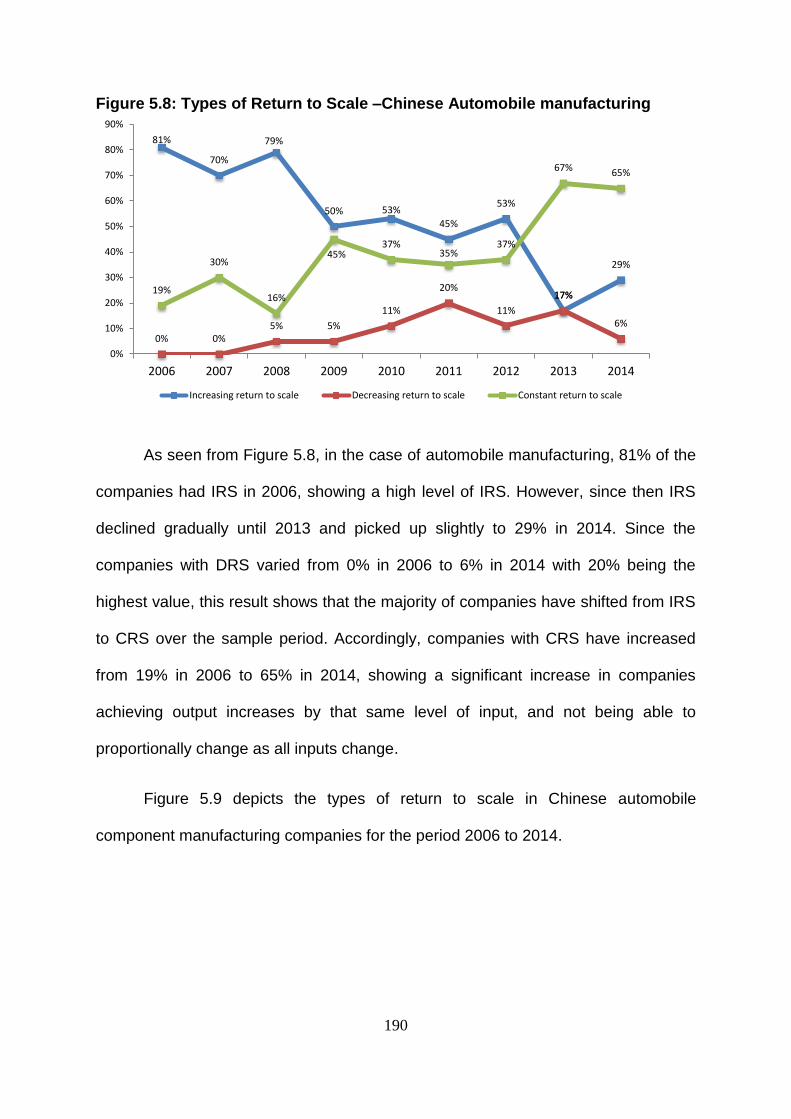
190
Figure 5.8: Types of Return to Scale –Chinese Automobile manufacturing
As seen from Figure 5.8, in the case of automobile manufacturing, 81% of the
companies had IRS in 2006, showing a high level of IRS. However, since then IRS
declined gradually until 2013 and picked up slightly to 29% in 2014. Since the
companies with DRS varied from 0% in 2006 to 6% in 2014 with 20% being the
highest value, this result shows that the majority of companies have shifted from IRS
to CRS over the sample period. Accordingly, companies with CRS have increased
from 19% in 2006 to 65% in 2014, showing a significant increase in companies
achieving output increases by that same level of input, and not being able to
proportionally change as all inputs change.
Figure 5.9 depicts the types of return to scale in Chinese automobile
component manufacturing companies for the period 2006 to 2014.
81%
70%
79%
50% 53%
45%
53%
17%
29%
0% 0% 5% 5%
11%
20%
11%
17%
6%
19%
30%
16%
45% 37%
35% 37%
67% 65%
0%
10%
20%
30%
40%
50%
60%
70%
80%
90%
2006 2007 2008 2009 2010 2011 2012 2013 2014
Increasing return to scale Decreasing return to scale Constant return to scale
191
Figure 5.9: Types of Return to Scale –Chinese Component Manufacturing
The results shown in Figure 5.9 show a slightly different picture when it comes
to the trend in both DRS and CRS. As in the case of automobile manufacturing, the
percentage of component companies with IRS decreased from a high of 68% in
2006 to a low of 20% in 2014 after having recorded the highest score of 71% in
2008.. What is worrying, however, is that the component companies with DRS
increased from low 8% in 2007 to a fairly high 47% in 2014, indicating a significant
drop in efficiency over this period. The CRS, although it showed an increase in the
period from 2009 to 2010, remained fairly steady ranging from 24% in 2006 to 33%
in 2014. The results further indicate concerns over the efficiency performance of
component manufacturers in the Chinese automobile industry, who lack the
capabilities to utilise their existing scale and to perform at the optimal level.
In order to demonstrate an in-depth understanding of efficiency performance,
both automobile and component manufacturers are divided into two categories
according to the firm size of manufacturers (the amount of the total assets of the
year). Firm size is divided into smaller than 2 million USD, and larger than or equal to
68% 65%
71%
44%
36%
38%
51%
28%
20%
9% 8%
17% 13%
16%
22%
30%
43% 47%
24% 28%
12%
42%
48%
40%
20%
28% 33%
0%
10%
20%
30%
40%
50%
60%
70%
80%
2006 2007 2008 2009 2010 2011 2012 2013 2014
Increasing return to scale Decreasing return to scale Constant return to scale
192
2 million USD. There are 594 observations which have a firm size smaller than 2
million USD whilst 30 observations fall into the category of larger than or equal to 2
million USD in regards to their total asset amount. Based on the estimation of the
CRSTE and VRSTE, the large automobile manufacturers are more technically
efficient than small automobile manufacturers. The sector of component
manufacturers shares a similar trend to automobile manufacturers, with the large
size manufacturers tending to be more technically efficient than small size
component manufacturers.
5.4.4 Allocative Efficiency and Cost Efficiency Performance
The overall cost efficiency (economic efficiency) of Chinese automobile and
component manufactures can be measured using the technical efficiency (CRSTE),
which measures the deviation of the firm’s operation from the efficient frontier and
the allocative efficiency, which measures the deviation of the firm’s operation from
the efficient production frontier (Coelli et al. 2005). In other words, technical
efficiency examines the production of maximum output using minimum input, while
allocative efficiency examines the right mix of inputs to achieve the given output.
(Coelli et al. 2005, Burki and Niazi 2006; Odeck and Braathen 2012). It is possible
for a company to be technically efficient without being allocatively efficient, or
allocative efficient without being technically efficient. The former is a case of the
company extracting the maximum output from the inputs deployed without
minimizing costs of inputs, while the latter is a case of the company using the optimal
mix of inputs given the prices it faces without maximizing production from the given
input mix. The level of cost efficiency measured in terms of technical and allocative
efficiency of automobile manufacturing companies for the period from 2006 to 2011
193
is depicted in the Figure 5.10 Below (See appendix I for detailed calculations of
allocative efficiency and cost efficiency scores).
Figure 5.10: Technical Efficiency, Allocative Efficiency and Cost Efficiency in Chinese Automobile Manufacturing
2006 2007 2008 2009 2010 2011 2012 2013 2014
TE (CRSTE) 0.84 0.89 0.78 0.84 0.91 0.90 0.90 0.90 0.94
Allocative Efficiency 0.80 0.79 0.77 0.83 0.88 0.85 0.84 0.81 0.80
Cost Efficiency 0.67 0.70 0.60 0.71 0.81 0.77 0.76 0.74 0.75
0.500.550.600.650.700.750.800.850.900.951.00
As shown in Figure 5.10, the level of technical efficiency of Chinese
automobile manufacturing companies has increased gradually from 84% in 2006 to
94% in 2014, despite a dip in this ratio around 2008 due to the impact of the GFC.
However, the cost advantage that could have been gained from this increase in
technical efficiency has been offset by the gradual decrease in allocative efficiency
since around 2010. As a result, automobile manufacturing companies have not been
able to enhance their cost efficiency along with the technical improvements.
However, given that the cost efficiency has increased from 67% in 2006 to 75% in
2014 with highest recorded efficiency level of 81% in 2010, it can be said that
progress has been made in enhancing cost efficiency of the automobile
manufacturing companies. The results of the cost efficiency measured in terms of
technical and allocative efficiency of component manufacturing companies for the
period from 2006 to 2011 are presented in Figure 5.11 below.
Technical Efficiency
Cost Efficiency
Allocative Efficiency
194
Figure 5.11: Technical Efficiency, Allocative Efficiency and Cost Efficiency in Chinese Component Manufacturing
2006 2007 2008 2009 2010 2011 2012 2013 2014
TE (CRSTE) 0.78 0.84 0.80 0.85 0.90 0.89 0.84 0.84 0.85
Allocative Efficiency 0.75 0.79 0.80 0.87 0.90 0.86 0.80 0.77 0.73
Cost Efficiency 0.60 0.67 0.64 0.76 0.81 0.77 0.68 0.66 0.63
0.500.550.600.650.700.750.800.850.900.95
As shown in the above Figure, the trends in efficiency measures are heading
in the wrong direction for component manufacturing. Although the technical
efficiency has improved from 78% in 2006 to 85% in 2014, there has been no
significant improvement in the ratio in the last 3 years after having recorded the
highest technical efficiency of 90% in 2010. As in the case of technical efficiency,
allocative efficiency started with a low base of 75% in 2006 and gradually improved
to 90% in 2010. However, since then the allocative efficiency has deteriorated at a
faster rate than the technical efficiency and has dropped down to 73% in 2014,
almost the same level as in 2006 9 years ago. This means that over the last 9 years
there has not been an improvement with the way the input mix is managed to
minimise the costs with a view to increasing the profitability. The lack of improvement
in technical efficiency coupled with the declining allocative efficiency has resulted in
cost efficiency dropping to a low of 63% in 2014, from the highest cost efficiency
level of 81% recorded in 2010. Therefore, as in the case of allocative efficiency, cost
Cost Efficiency
Allocative Efficiency
Technical Efficiency
195
efficiency has virtually shown no improvement over the 9 year period as the rate has
only changed from low 60% in 2004 to 63% in 2014.
5.4 PART C : Results on the Analysis of Factors Affecting the Firm Performance of Manufacturers in the Chinese Automobile Industry and Discussion
5.4.1 Introduction
The analysis conducted in Part A and Part B revealed the critical issues in relation to
performance, financial status and efficiency faced by the Chinese automobile and
component manufacturers in their efforts to enhance the competiveness of the
Chinese automobile industry. After having identified such issues, this section
examines the relationship between the factors identified from the literature review as
having impacts on the performance of Chinese automobile and component
manufacturing companies, measured using a number of performance measures,
using a Multivariate Regression model and data described in the Section 4.7 of the
previous chapter.
5.4.2 Multivariate Regression Model
To test the hypotheses outlined in the attached table, multivariate regression
analysis is employed to evaluate the effect of capital structure on firm performance
within the Chinese automobile industry. The following equation is used:
𝑅𝑂𝐴 = 𝛽0 + 𝛽1 𝐺𝑂𝑉𝑇𝑂𝑊𝑁 + 𝛽2𝐹𝑂𝑅𝐸𝑂𝑊𝑁 + 𝛽3𝐼𝑁𝑆𝑇𝑂𝑊𝑁 + 𝛽4 𝐹𝐼𝑁𝐿𝐸𝑉
+ 𝛽5𝑂𝑃𝐸𝑅𝐿𝐸𝑉 + 𝛽6𝑆𝑈𝑆𝐺𝑅𝑂𝑊𝑇𝐻 + 𝛽7𝐴𝐺𝐸 + 𝛽8𝑆𝐼𝑍𝐸 + 𝛽9 𝑆𝑇𝐴𝑇𝐸𝐶𝑂𝑁
+ 𝛽10𝐼𝑁𝐷𝑈𝑆𝑆𝐸𝐶 + 𝑌𝑟𝐹𝐸 + 𝐶𝑜𝐹𝐸 + 𝜀𝑖
𝑅𝑂𝐸 = 𝛽11 + 𝛽12 𝐺𝑂𝑉𝑇𝑂𝑊𝑁 + 𝛽13𝐹𝑂𝑅𝐸𝑂𝑊𝑁 + 𝛽14𝐼𝑁𝑆𝑇𝑂𝑊𝑁 + 𝛽15 𝐹𝐼𝑁𝐿𝐸𝑉
+ 𝛽16𝑂𝑃𝐸𝑅𝐿𝐸𝑉 + 𝛽17𝑆𝑈𝑆𝐺𝑅𝑂𝑊𝑇𝐻 + 𝛽18𝐴𝐺𝐸 + 𝛽19𝑆𝐼𝑍𝐸
+ 𝛽20 𝑆𝑇𝐴𝑇𝐸𝐶𝑂𝑁 + 𝛽21𝐼𝑁𝐷𝑈𝑆𝑆𝐸𝐶 + 𝑌𝑟𝐹𝐸 + 𝐶𝑜𝐹𝐸 + 𝜀𝑖
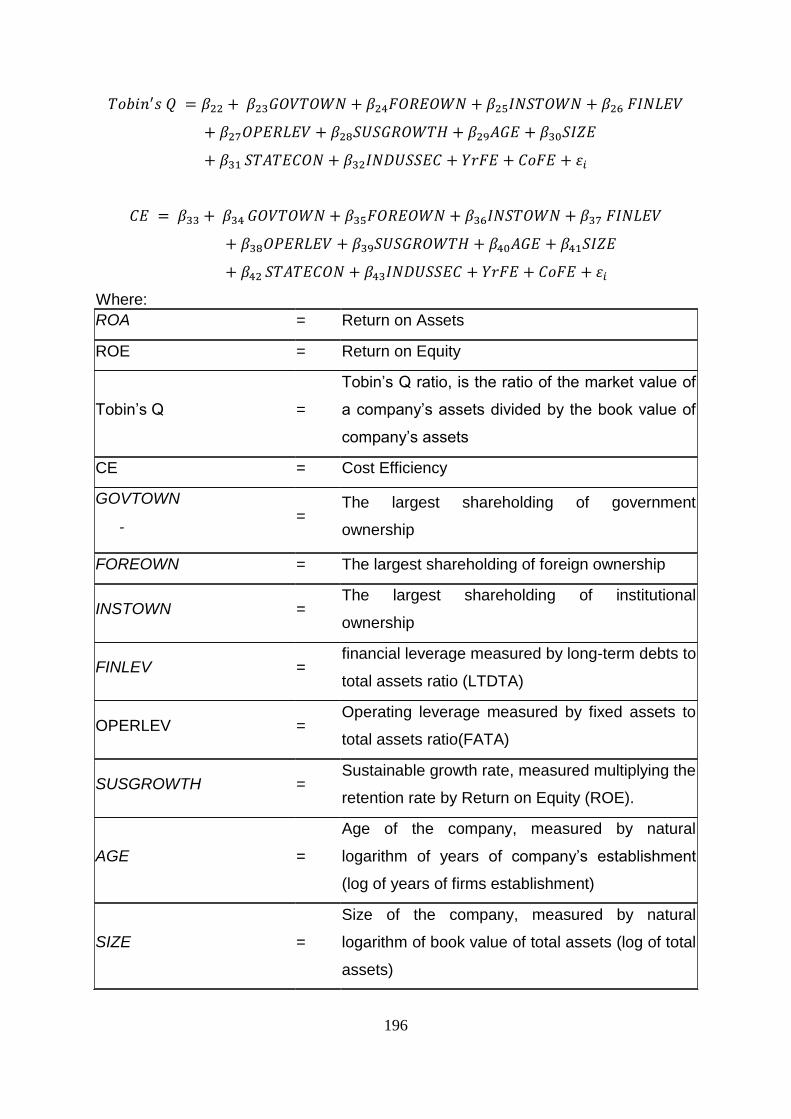
196
𝑇𝑜𝑏𝑖𝑛′𝑠 𝑄 = 𝛽22 + 𝛽23𝐺𝑂𝑉𝑇𝑂𝑊𝑁 + 𝛽24𝐹𝑂𝑅𝐸𝑂𝑊𝑁 + 𝛽25𝐼𝑁𝑆𝑇𝑂𝑊𝑁 + 𝛽26 𝐹𝐼𝑁𝐿𝐸𝑉
+ 𝛽27𝑂𝑃𝐸𝑅𝐿𝐸𝑉 + 𝛽28𝑆𝑈𝑆𝐺𝑅𝑂𝑊𝑇𝐻 + 𝛽29𝐴𝐺𝐸 + 𝛽30𝑆𝐼𝑍𝐸
+ 𝛽31 𝑆𝑇𝐴𝑇𝐸𝐶𝑂𝑁 + 𝛽32𝐼𝑁𝐷𝑈𝑆𝑆𝐸𝐶 + 𝑌𝑟𝐹𝐸 + 𝐶𝑜𝐹𝐸 + 𝜀𝑖
𝐶𝐸 = 𝛽33 + 𝛽34 𝐺𝑂𝑉𝑇𝑂𝑊𝑁 + 𝛽35𝐹𝑂𝑅𝐸𝑂𝑊𝑁 + 𝛽36𝐼𝑁𝑆𝑇𝑂𝑊𝑁 + 𝛽37 𝐹𝐼𝑁𝐿𝐸𝑉
+ 𝛽38𝑂𝑃𝐸𝑅𝐿𝐸𝑉 + 𝛽39𝑆𝑈𝑆𝐺𝑅𝑂𝑊𝑇𝐻 + 𝛽40𝐴𝐺𝐸 + 𝛽41𝑆𝐼𝑍𝐸
+ 𝛽42 𝑆𝑇𝐴𝑇𝐸𝐶𝑂𝑁 + 𝛽43𝐼𝑁𝐷𝑈𝑆𝑆𝐸𝐶 + 𝑌𝑟𝐹𝐸 + 𝐶𝑜𝐹𝐸 + 𝜀𝑖
Where:
ROA = Return on Assets
ROE = Return on Equity
Tobin’s Q =
Tobin’s Q ratio, is the ratio of the market value of
a company’s assets divided by the book value of
company’s assets
CE = Cost Efficiency
GOVTOWN
- =
The largest shareholding of government
ownership
FOREOWN = The largest shareholding of foreign ownership
INSTOWN = The largest shareholding of institutional
ownership
FINLEV = financial leverage measured by long-term debts to
total assets ratio (LTDTA)
OPERLEV = Operating leverage measured by fixed assets to
total assets ratio(FATA)
SUSGROWTH = Sustainable growth rate, measured multiplying the
retention rate by Return on Equity (ROE).
AGE =
Age of the company, measured by natural
logarithm of years of company’s establishment
(log of years of firms establishment)
SIZE =
Size of the company, measured by natural
logarithm of book value of total assets (log of total
assets)
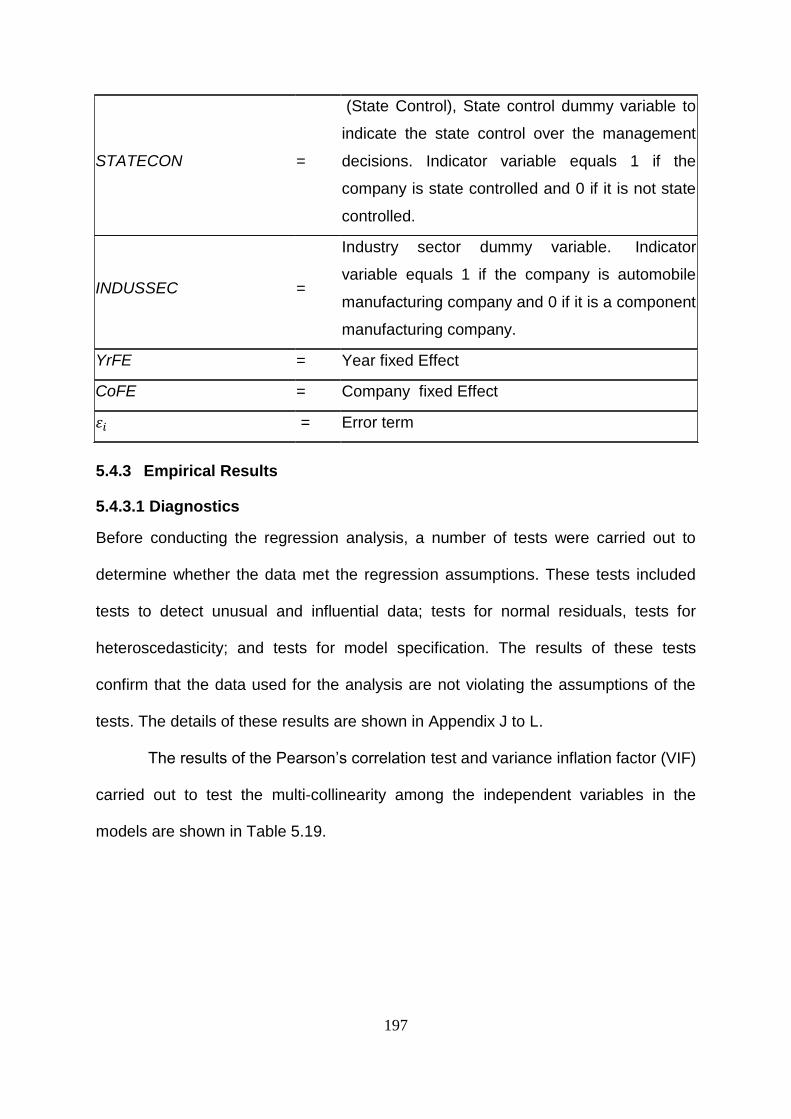
197
STATECON =
(State Control), State control dummy variable to
indicate the state control over the management
decisions. Indicator variable equals 1 if the
company is state controlled and 0 if it is not state
controlled.
INDUSSEC =
Industry sector dummy variable. Indicator
variable equals 1 if the company is automobile
manufacturing company and 0 if it is a component
manufacturing company.
YrFE = Year fixed Effect
CoFE = Company fixed Effect
𝜀𝑖 = Error term
5.4.3 Empirical Results
5.4.3.1 Diagnostics
Before conducting the regression analysis, a number of tests were carried out to
determine whether the data met the regression assumptions. These tests included
tests to detect unusual and influential data; tests for normal residuals, tests for
heteroscedasticity; and tests for model specification. The results of these tests
confirm that the data used for the analysis are not violating the assumptions of the
tests. The details of these results are shown in Appendix J to L.
The results of the Pearson’s correlation test and variance inflation factor (VIF)
carried out to test the multi-collinearity among the independent variables in the
models are shown in Table 5.19.
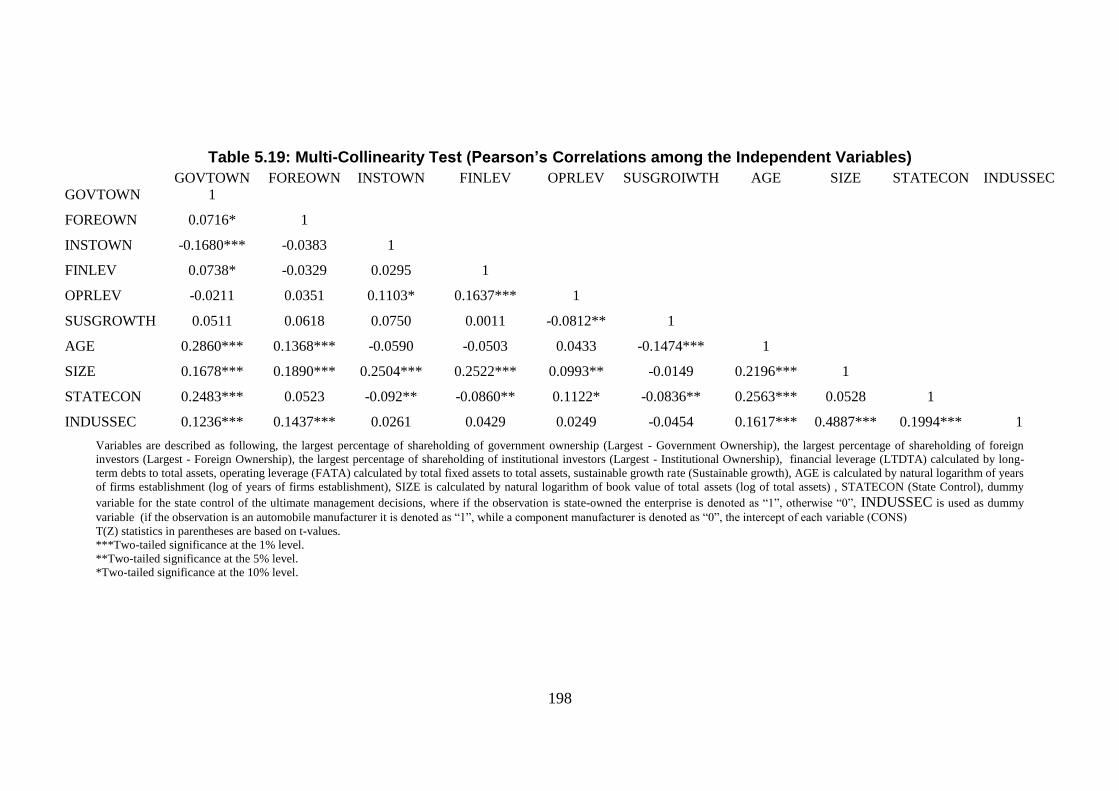
198
Table 5.19: Multi-Collinearity Test (Pearson’s Correlations among the Independent Variables)
GOVTOWN FOREOWN INSTOWN FINLEV OPRLEV SUSGROIWTH AGE SIZE STATECON INDUSSEC
GOVTOWN 1
FOREOWN 0.0716* 1
INSTOWN -0.1680*** -0.0383 1
FINLEV 0.0738* -0.0329 0.0295 1
OPRLEV -0.0211 0.0351 0.1103* 0.1637*** 1
SUSGROWTH 0.0511 0.0618 0.0750 0.0011 -0.0812** 1
AGE 0.2860*** 0.1368*** -0.0590 -0.0503 0.0433 -0.1474*** 1
SIZE 0.1678*** 0.1890*** 0.2504*** 0.2522*** 0.0993** -0.0149 0.2196*** 1
STATECON 0.2483*** 0.0523 -0.092** -0.0860** 0.1122* -0.0836** 0.2563*** 0.0528 1
INDUSSEC 0.1236*** 0.1437*** 0.0261 0.0429 0.0249 -0.0454 0.1617*** 0.4887*** 0.1994*** 1
Variables are described as following, the largest percentage of shareholding of government ownership (Largest - Government Ownership), the largest percentage of shareholding of foreign
investors (Largest - Foreign Ownership), the largest percentage of shareholding of institutional investors (Largest - Institutional Ownership), financial leverage (LTDTA) calculated by long-
term debts to total assets, operating leverage (FATA) calculated by total fixed assets to total assets, sustainable growth rate (Sustainable growth), AGE is calculated by natural logarithm of years
of firms establishment (log of years of firms establishment), SIZE is calculated by natural logarithm of book value of total assets (log of total assets) , STATECON (State Control), dummy
variable for the state control of the ultimate management decisions, where if the observation is state-owned the enterprise is denoted as “1”, otherwise “0”, INDUSSEC is used as dummy
variable (if the observation is an automobile manufacturer it is denoted as “1”, while a component manufacturer is denoted as “0”, the intercept of each variable (CONS)
T(Z) statistics in parentheses are based on t-values.
***Two-tailed significance at the 1% level.
**Two-tailed significance at the 5% level.
*Two-tailed significance at the 10% level.
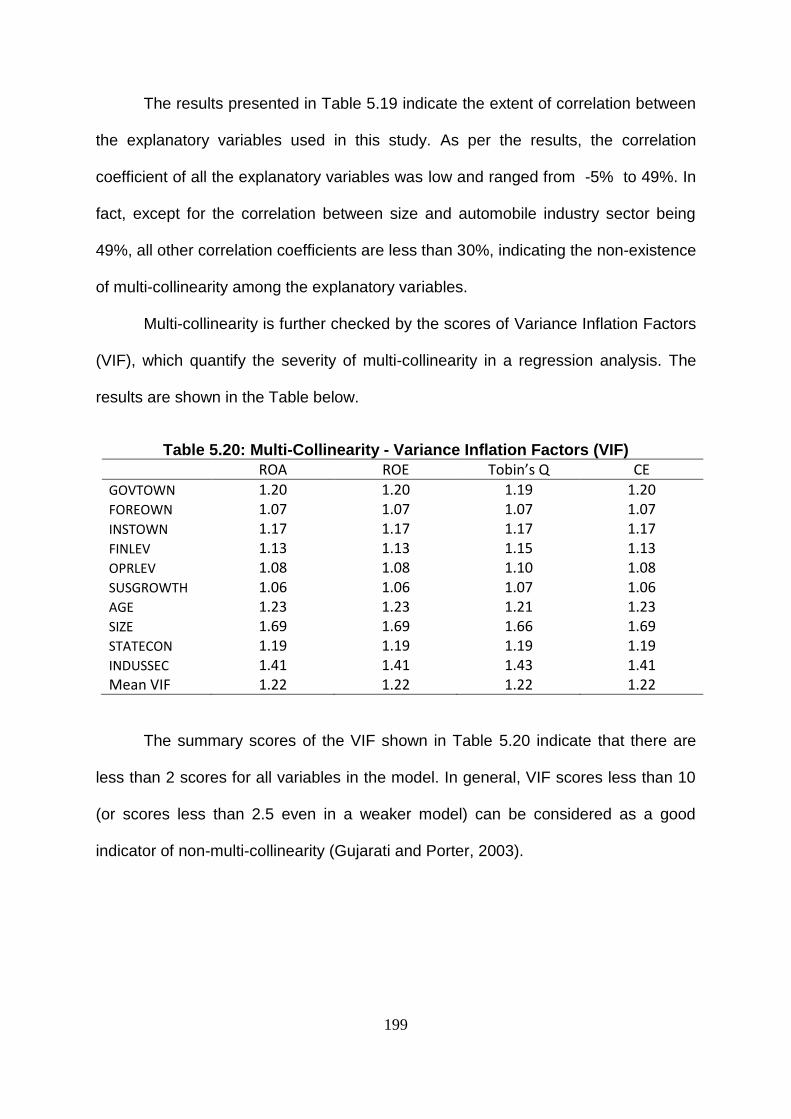
199
The results presented in Table 5.19 indicate the extent of correlation between
the explanatory variables used in this study. As per the results, the correlation
coefficient of all the explanatory variables was low and ranged from -5% to 49%. In
fact, except for the correlation between size and automobile industry sector being
49%, all other correlation coefficients are less than 30%, indicating the non-existence
of multi-collinearity among the explanatory variables.
Multi-collinearity is further checked by the scores of Variance Inflation Factors
(VIF), which quantify the severity of multi-collinearity in a regression analysis. The
results are shown in the Table below.
Table 5.20: Multi-Collinearity - Variance Inflation Factors (VIF)
ROA ROE Tobin’s Q CE
GOVTOWN 1.20 1.20 1.19 1.20 FOREOWN 1.07 1.07 1.07 1.07 INSTOWN 1.17 1.17 1.17 1.17 FINLEV 1.13 1.13 1.15 1.13 OPRLEV 1.08 1.08 1.10 1.08 SUSGROWTH 1.06 1.06 1.07 1.06 AGE 1.23 1.23 1.21 1.23 SIZE 1.69 1.69 1.66 1.69 STATECON 1.19 1.19 1.19 1.19 INDUSSEC 1.41 1.41 1.43 1.41 Mean VIF 1.22 1.22 1.22 1.22
The summary scores of the VIF shown in Table 5.20 indicate that there are
less than 2 scores for all variables in the model. In general, VIF scores less than 10
(or scores less than 2.5 even in a weaker model) can be considered as a good
indicator of non-multi-collinearity (Gujarati and Porter, 2003).
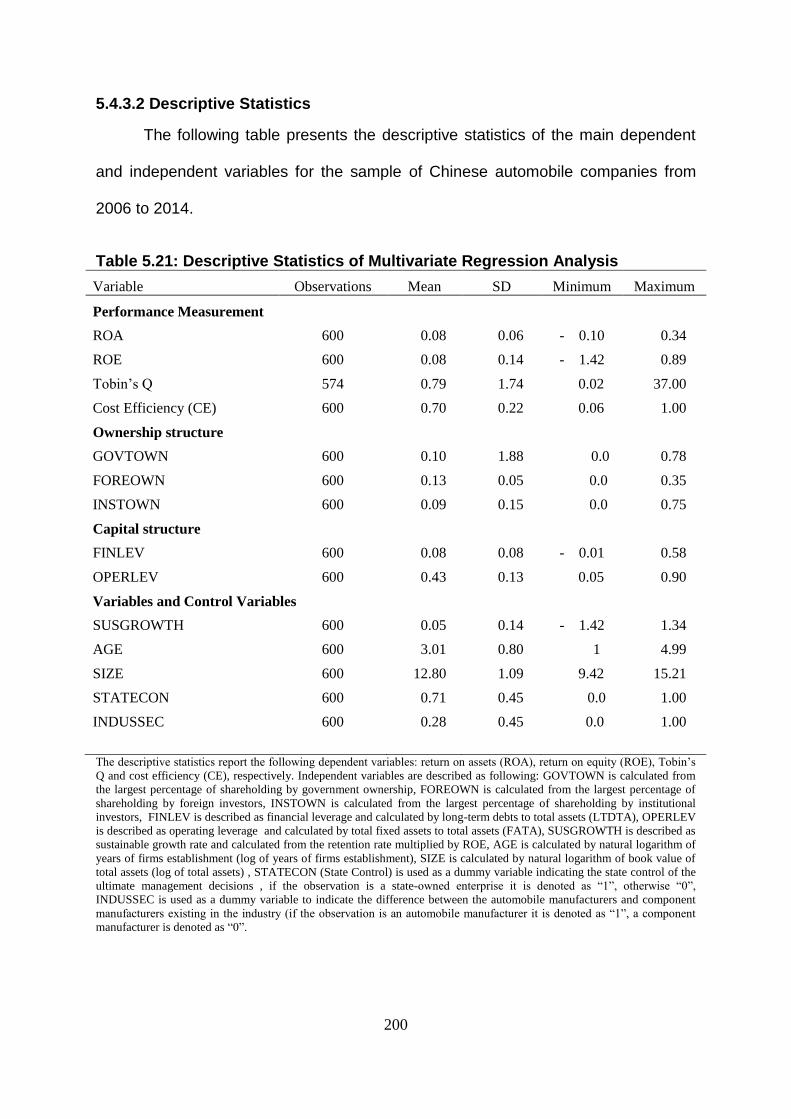
200
5.4.3.2 Descriptive Statistics
The following table presents the descriptive statistics of the main dependent
and independent variables for the sample of Chinese automobile companies from
2006 to 2014.
Table 5.21: Descriptive Statistics of Multivariate Regression Analysis
Variable Observations Mean SD Minimum Maximum
Performance Measurement ROA 600 0.08 0.06 - 0.10 0.34
ROE 600 0.08 0.14 - 1.42 0.89
Tobin’s Q 574 0.79 1.74 0.02 37.00
Cost Efficiency (CE) 600 0.70 0.22 0.06 1.00
Ownership structure GOVTOWN 600 0.10 1.88 0.0 0.78
FOREOWN 600 0.13 0.05 0.0 0.35
INSTOWN 600 0.09 0.15 0.0 0.75
Capital structure FINLEV 600 0.08 0.08 - 0.01 0.58
OPERLEV 600 0.43 0.13 0.05 0.90
Variables and Control Variables SUSGROWTH 600 0.05 0.14 - 1.42 1.34
AGE 600 3.01 0.80 1 4.99
SIZE 600 12.80 1.09 9.42 15.21
STATECON 600 0.71 0.45 0.0 1.00
INDUSSEC 600 0.28 0.45 0.0 1.00
The descriptive statistics report the following dependent variables: return on assets (ROA), return on equity (ROE), Tobin’s
Q and cost efficiency (CE), respectively. Independent variables are described as following: GOVTOWN is calculated from
the largest percentage of shareholding by government ownership, FOREOWN is calculated from the largest percentage of
shareholding by foreign investors, INSTOWN is calculated from the largest percentage of shareholding by institutional
investors, FINLEV is described as financial leverage and calculated by long-term debts to total assets (LTDTA), OPERLEV
is described as operating leverage and calculated by total fixed assets to total assets (FATA), SUSGROWTH is described as
sustainable growth rate and calculated from the retention rate multiplied by ROE, AGE is calculated by natural logarithm of
years of firms establishment (log of years of firms establishment), SIZE is calculated by natural logarithm of book value of
total assets (log of total assets) , STATECON (State Control) is used as a dummy variable indicating the state control of the
ultimate management decisions , if the observation is a state-owned enterprise it is denoted as “1”, otherwise “0”,
INDUSSEC is used as a dummy variable to indicate the difference between the automobile manufacturers and component
manufacturers existing in the industry (if the observation is an automobile manufacturer it is denoted as “1”, a component
manufacturer is denoted as “0”.
201
As per Table 5.21, Chinese automobile and component manufacturers have
an average return on assets (ROA) of 8.4% and an average return on equity (ROE)
of 7.8%. The mean of the Tobin’s Q is 79.3% and the mean of the cost efficiency is
70.04%. As per the above Table, the largest shareholdings of the government
ownership, foreign ownership and institutional ownership were 10%, 13% and 9%
respectively, all three types sharing fairly equal percentages of ownership in these
companies. It is interesting to note that the foreign ownership is slightly higher than
the government ownership, contradicting the widely held belief that foreign
investment in Chinese companies is restrictive The financial leverage (long-term
debts to total assets) of Chinese companies was at a fairly low level of 8% while the
operating leverage (total fixed assets to total assets) was at a reasonably high level
of 43%. This indicates that the management has been able to enhance operating
leverage of the company and boost the profitability without relying on debt capital.
The average sustainable growth rate of companies is 5% with a standard deviation
of 14%, indicating a significant variation in this rate among the companies. Similarly,
the average age of sample companies is 3.01 log years, indicating that the sample
included many young and old manufacturers. The size of companies measured in
terms of log of total assets indicates an average asset value of 12.8 with a standard
deviation of 1.1, indicating relatively smaller deviations between the sizes of the
sample companies. The dummy variable of SOECON which represents the ultimate
control by the state, shows that 70.8% of the sample firms are state controlled.
Furthermore, the automobile industry sector dummy variable indicates that 28% of
the selected sample belongs to automobile manufacturing.
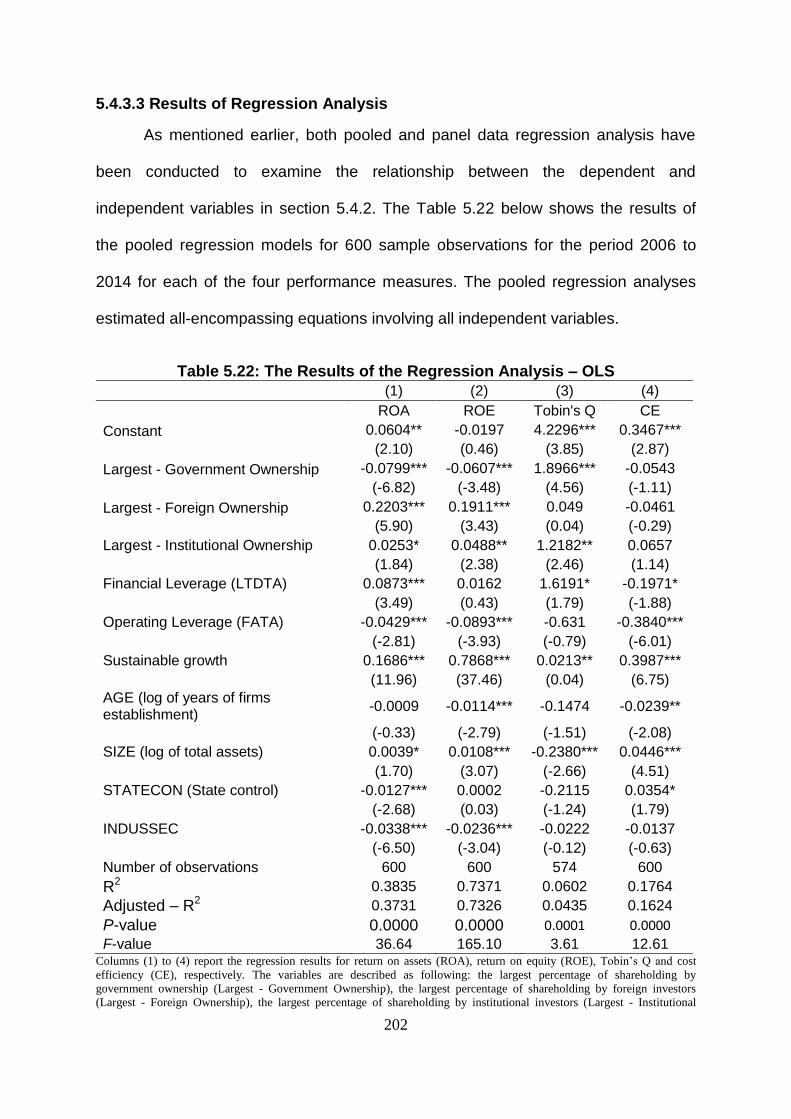
202
5.4.3.3 Results of Regression Analysis
As mentioned earlier, both pooled and panel data regression analysis have
been conducted to examine the relationship between the dependent and
independent variables in section 5.4.2. The Table 5.22 below shows the results of
the pooled regression models for 600 sample observations for the period 2006 to
2014 for each of the four performance measures. The pooled regression analyses
estimated all-encompassing equations involving all independent variables.
Table 5.22: The Results of the Regression Analysis – OLS
(1) (2) (3) (4)
ROA ROE Tobin's Q CE
Constant 0.0604** -0.0197 4.2296*** 0.3467***
(2.10) (0.46) (3.85) (2.87)
Largest - Government Ownership -0.0799*** -0.0607*** 1.8966*** -0.0543
(-6.82) (-3.48) (4.56) (-1.11)
Largest - Foreign Ownership 0.2203*** 0.1911*** 0.049 -0.0461
(5.90) (3.43) (0.04) (-0.29)
Largest - Institutional Ownership 0.0253* 0.0488** 1.2182** 0.0657
(1.84) (2.38) (2.46) (1.14)
Financial Leverage (LTDTA) 0.0873*** 0.0162 1.6191* -0.1971*
(3.49) (0.43) (1.79) (-1.88)
Operating Leverage (FATA) -0.0429*** -0.0893*** -0.631 -0.3840***
(-2.81) (-3.93) (-0.79) (-6.01)
Sustainable growth 0.1686*** 0.7868*** 0.0213** 0.3987***
(11.96) (37.46) (0.04) (6.75)
AGE (log of years of firms establishment)
-0.0009 -0.0114*** -0.1474 -0.0239**
(-0.33) (-2.79) (-1.51) (-2.08)
SIZE (log of total assets) 0.0039* 0.0108*** -0.2380*** 0.0446***
(1.70) (3.07) (-2.66) (4.51)
STATECON (State control) -0.0127*** 0.0002 -0.2115 0.0354*
(-2.68) (0.03) (-1.24) (1.79)
INDUSSEC -0.0338*** -0.0236*** -0.0222 -0.0137
(-6.50) (-3.04) (-0.12) (-0.63)
Number of observations 600 600 574 600
R2 0.3835 0.7371 0.0602 0.1764
Adjusted – R2 0.3731 0.7326 0.0435 0.1624
P-value 0.0000 0.0000 0.0001 0.0000 F-value 36.64 165.10 3.61 12.61
Columns (1) to (4) report the regression results for return on assets (ROA), return on equity (ROE), Tobin’s Q and cost
efficiency (CE), respectively. The variables are described as following: the largest percentage of shareholding by
government ownership (Largest - Government Ownership), the largest percentage of shareholding by foreign investors
(Largest - Foreign Ownership), the largest percentage of shareholding by institutional investors (Largest - Institutional
203
Ownership), financial leverage (LTDTA) calculated by long-term debts to total assets, operating leverage (FATA)
calculated by total fixed assets to total assets, sustainable growth rate (Sustainable growth), AGE is calculated by natural
logarithm of years of firms establishment (log of years of firms establishment), SIZE is calculated by natural logarithm of
book value of total assets (log of total assets), STATECON (State Control), is the dummy variable for the state control of the
ultimate management decisions, where if the observation is a state-owned enterprise it is denoted as “1”, otherwise “0”),
INDUSSEC is used as a dummy variable (if the observation is an automobile manufacturer it is denoted as “1”, component
manufacturer is denoted as “0”, the intercept of each variable (CONS)
T(Z) statistics in parentheses are based on t-values.
***Two-tailed significance at the 1% level.
**Two-tailed significance at the 5% level.
*Two-tailed significance at the 10% level
In addition, a further analysis is carried out to examine whether time-invariant
inter-firm heterogeneity of Chinese companies has led to different performance
impacts from the explanatory factors examined. For this purpose, the panel data
models are also estimated with 600 observations. On the basis of the Hausman
Test, a random effect model was chosen for the regression model that measured
performance on ROA and Tobin’s Q as the p values of the2 tests are significant. As
for the regression model that measured performance in terms of ROE and Cost
Efficiency, a fixed effect model was chosen as the p values of the2 tests are not
significant, so the random effect model was rejected in favour of the fixed effect
model. The results of this analysis are presented in Table 5.23.
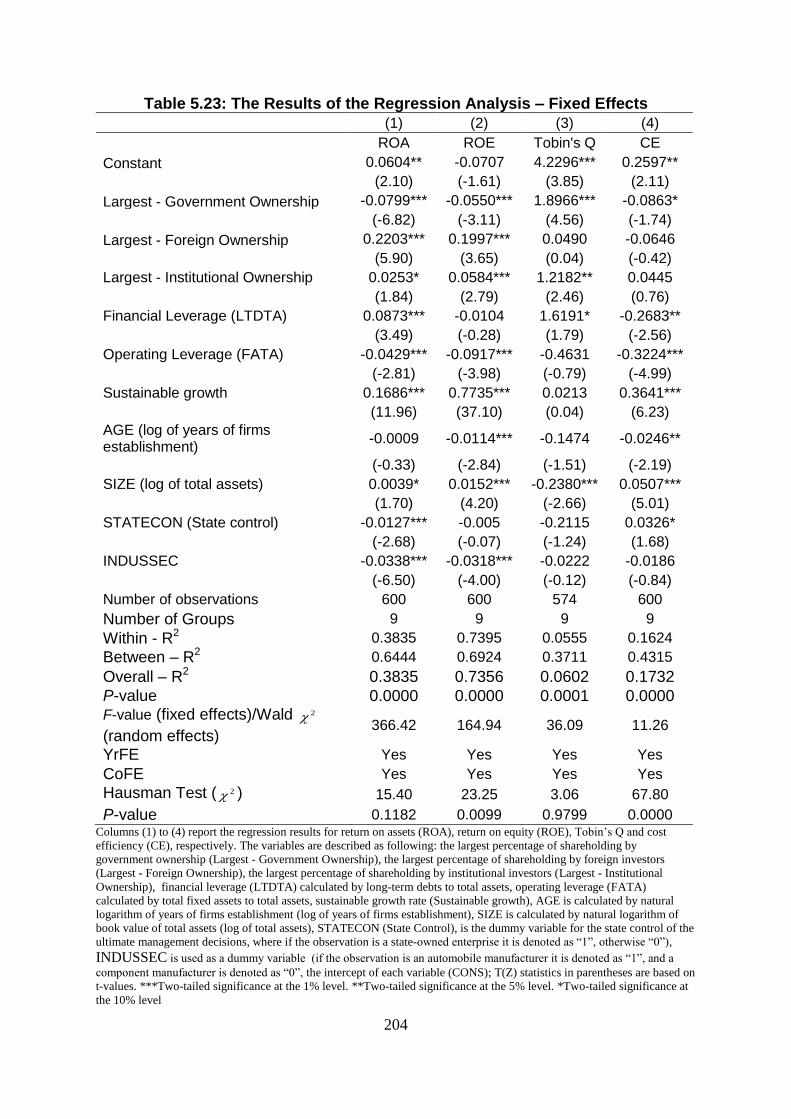
204
Table 5.23: The Results of the Regression Analysis – Fixed Effects
(1) (2) (3) (4)
ROA ROE Tobin's Q CE
Constant 0.0604** -0.0707 4.2296*** 0.2597**
(2.10) (-1.61) (3.85) (2.11)
Largest - Government Ownership -0.0799*** -0.0550*** 1.8966*** -0.0863*
(-6.82) (-3.11) (4.56) (-1.74)
Largest - Foreign Ownership 0.2203*** 0.1997*** 0.0490 -0.0646
(5.90) (3.65) (0.04) (-0.42)
Largest - Institutional Ownership 0.0253* 0.0584*** 1.2182** 0.0445
(1.84) (2.79) (2.46) (0.76)
Financial Leverage (LTDTA) 0.0873*** -0.0104 1.6191* -0.2683**
(3.49) (-0.28) (1.79) (-2.56)
Operating Leverage (FATA) -0.0429*** -0.0917*** -0.4631 -0.3224***
(-2.81) (-3.98) (-0.79) (-4.99)
Sustainable growth 0.1686*** 0.7735*** 0.0213 0.3641***
(11.96) (37.10) (0.04) (6.23)
AGE (log of years of firms establishment)
-0.0009 -0.0114*** -0.1474 -0.0246**
(-0.33) (-2.84) (-1.51) (-2.19)
SIZE (log of total assets) 0.0039* 0.0152*** -0.2380*** 0.0507***
(1.70) (4.20) (-2.66) (5.01)
STATECON (State control) -0.0127*** -0.005 -0.2115 0.0326*
(-2.68) (-0.07) (-1.24) (1.68)
INDUSSEC -0.0338*** -0.0318*** -0.0222 -0.0186
(-6.50) (-4.00) (-0.12) (-0.84)
Number of observations 600 600 574 600
Number of Groups 9 9 9 9
Within - R2 0.3835 0.7395 0.0555 0.1624
Between – R2 0.6444 0.6924 0.3711 0.4315
Overall – R2 0.3835 0.7356 0.0602 0.1732
P-value 0.0000 0.0000 0.0001 0.0000 F-value (fixed effects)/Wald 2
(random effects) 366.42 164.94 36.09 11.26
YrFE Yes Yes Yes Yes
CoFE Yes Yes Yes Yes
Hausman Test ( 2 ) 15.40 23.25 3.06 67.80
P-value 0.1182 0.0099 0.9799 0.0000 Columns (1) to (4) report the regression results for return on assets (ROA), return on equity (ROE), Tobin’s Q and cost
efficiency (CE), respectively. The variables are described as following: the largest percentage of shareholding by
government ownership (Largest - Government Ownership), the largest percentage of shareholding by foreign investors
(Largest - Foreign Ownership), the largest percentage of shareholding by institutional investors (Largest - Institutional
Ownership), financial leverage (LTDTA) calculated by long-term debts to total assets, operating leverage (FATA)
calculated by total fixed assets to total assets, sustainable growth rate (Sustainable growth), AGE is calculated by natural
logarithm of years of firms establishment (log of years of firms establishment), SIZE is calculated by natural logarithm of
book value of total assets (log of total assets), STATECON (State Control), is the dummy variable for the state control of the
ultimate management decisions, where if the observation is a state-owned enterprise it is denoted as “1”, otherwise “0”), INDUSSEC is used as a dummy variable (if the observation is an automobile manufacturer it is denoted as “1”, and a
component manufacturer is denoted as “0”, the intercept of each variable (CONS); T(Z) statistics in parentheses are based on
t-values. ***Two-tailed significance at the 1% level. **Two-tailed significance at the 5% level. *Two-tailed significance at
the 10% level
205
An analysis of Table 5.22 and Table 5.23 shows that almost all explanatory
variables have had an impact on the performance of Chinese automobile companies
to varying degrees. On the basis of these results, a detailed explanation of the
impact that these factors have on the four performance measures are provided in
section 5.4.3.5 below.
5.4.3.5 Factors Affecting Performance
The analysis conducted in section 5.4.3.3 and 5.4.3.4 examined the relationship
between the performance of automobile companies, and some key factors identified
from the literature as influential factors for determining the performance of
automobile companies. The factors examined are: ownership structure
(government, foreign and institutional), leverage (operational and financial),
sustainable growth, state control, age, size and industry. Based on the results of
pooled and panel data regressions conducted above, the relationships between
these variables and the performance of automobile companies are described below.
5.4.3.5.1 Ownership Structure and Firm Performance
The ownership structure which consists of government ownership, foreign
ownership and institutional ownership, was identified from the literature as a major
factor that may affect the performance of business organisations. This is a
particularly important factor in the automobile industry in China as it is a pillar
industry which drives economic growth in the country (Yu 2013). As such, the
Chinese government is actively involved in the financing of, and operating affairs of,
companies in this industry.
The results of the regression analysis of both the OLS and Panel models
show that government ownership has a significantly negative impact on firm
206
performance when it is measured by ROA, ROE and Cost Efficiency. When the
performance is measured by the market measure of Tobin’s Q, this relationship was
found to be significantly positive. These results are consistent with the results of
studies conducted by Wei et al. (2003), Sun and Tong (2003) and Sun et al. (2002)
which indicated that the performance of firms is likely to decrease when the
government ownership of a firm increases. The major reason for this is that there
appear to be significant inefficiencies in the operational affairs of the business when
the government has a higher level of ownership. However, since the market is
rewarding companies with higher government ownership because of the long term
stability that it brings about, the market performance measure of Tobin’s Q was
found to be passively associated with government ownership. This situation is also
consistent with the prior literature on Chinese business organisation (Chen 1998).
The significantly negative relationship found between the Cost efficiency (CE) and
government ownership in the Chinese automobile industry was also consistent with
prior studies, for example, Sun et al. (2002). In another study, Megginson, Nash and
Van Randenborgh (1994) found that government controlled enterprises tended to be
less efficient.
The investigation of the impact that foreign ownership has on firm
performance is important given the implementation of the share issue privatisation
program (SIP) which is intended to improve the performance of domestic firms with
advanced technology and managerial skills that could be provided by foreign
investors. (Wei et al. 2005). This would in turn further improve market conditions
and make the domestic firms more competitive in the global market. It was argued by
Aguilera and Jackson (2003) that foreign investors have more focus on financial
performance, and that therefore this has a positive impact on the firm’s performance.
207
The regression results of this study showed a positive and significant association
between foreign ownership and performance as measured by ROA and ROE,
confirming the generally held view that foreign investors can improve the
performance of automobile companies. The association between the Tobin’s Q and
foreign ownership was positive but insignificant. This view is consistent with findings
by Huang and Shiu (2006). Surprisingly, however, the relationship between cost
efficiency and foreign ownership was found to be negative but not significant. Since
one would expect foreign investments to improve the cost efficiencies through
process improvements with advanced technologies and knowhow that they may
bring to the industry, this non-significant negative relationship to foreign ownership is
puzzling and needs further investigation.
Institutional ownership is argued to have an increasing influence on
managerial decision-making as institutions often have a large proportion of the
shareholdings in the company and they need to protect their interest in the invested
firms (Chen et al. 2005, Cornett et al. 2007). Furthermore, the largest shareholders
are considered to have a greater incentive to monitor and improve the firm’s
performance (Shleifer and Vishny 1986). The empirical results of the regression
analysis showed a positive and significant relationship between institutional
ownership and all of the four measurements of performance. Given, the influence of
institutional investors in public affairs, the automobile and component manufacturers
find more opportunities to win grants from government projects with the backing of
the institutional investors (Berkowitz et al., 2015).
208
5.4.3.5.1 Leverage and Firm Performance
The leverage, measured in terms of financial and operating leverage, is a
major factor affecting the performance of companies in many industries. The
importance for the manufacturers of having long term debts in the capital structure,
to reduce their financing costs for better returns to shareholders, has been
highlighted by a number of prior studies (see for example, Li et al. 2009; Berger and
Bonaccorsi di Patti, 2006). In the case of the sample companies, as indicated in the
descriptive statistics, the observed manufacturers have a low level of financial
leverage in their capital structure, with an average of 8.4% long-term debt in relation
to total assets. However, despite this low level of financial leverage, it is a significant
factor affecting the performance of automobile companies in China as the regression
models show the positive significant impact that it has on performance when it is
measured in terms of ROA and Tobin’s Q. For ROE, however, this relationship was
not significant due to the low impact that interest on debt has on company income.
Financial leverage was also found to have a significant negative impact on cost
efficiency. This indicates that increasing debt will increase the input cost of
companies, without necessarily having resulting higher output increases. This
argument is in line with that of Sun et al. (2002) who highlighted that the Chinese
SOEs have circular debt problems, causing negative impacts on the firm’s
performance.
The relationship between the operating leverage and firm performance was
found to be significantly negative, where the firm’s performance is measured in ROA,
ROE and cost efficiency. This indicates that the Chinese automobile companies
have not been able to utilise their fixed assets effectively to generate income and to
improve the profitability of their manufacturing. These results confirm the view
209
expressed by Chu (2011) who indicated that despite the Chinese automobile
manufacturers’ expansion of production through capital investments to compete with
the worlds’ top manufacturers, they have not been able to gain the necessary
efficiency improvement and cost savings to boost their profitability, due to the
inefficiencies in their capital investment management. Similar concerns have been
raised by Titman and Wessels (1988), Rajan and Zingales (1995) and Frank and
Goyal (2003) who are of the view that Chinese automobile manufacturers have failed
to utilise their fixed assets effectively to achieve operational efficiency.
5.4.3.5.2 Sustainable Growth and Firm Performance
The sustainable growth rate, measured by the retention ratio multiplied by
ROE, is a key driver of performance in any business organisation as it provides the
company with internally generated cash flows for business operations. This is
expected to be the case with Chinese automobile companies as well. The results of
the regression confirmed the generally held view that there is a significantly positive
association between sustainable growth and company performance. As per the
results in Tables 5.22 and 5.23, this relationship is significant for all performance
measures at a 1% significant level, except for Tobin’s Q under the panel data model
which indicated a positive but not significant relationship. In fact, from the
standardised coefficient of 0.382 for the ROA model, this factor was found to be the
most significant factor in contributing to the performance of automobile companies in
China.
5.4.3.5.3 Firm Age and Firm Performance
It is a well-known fact that the firm’s age can make a positive impact on firm
performance, as older firms often have an advantage over the younger firms in terms
of experience and resources to manage business affairs (See for example, Morck et
al. 1988; McConnell and Servaes 1990; Cho 1998; Majumdar and Chhibber 1999;
210
Short and Keasey 1999; Xu and Wang 1997; Lins 2003). Surprisingly, however, age
is found to have a significantly negative impact on firm performance for all
performance measures, except for Tobin’s Q which is negatively related to firm age
although it indicates it is not a significant factor in affecting its performance. As the
descriptive statics show, the average age of sample firms is 32 years, and 50% of
the companies are more than 19 years old. The results of the study indicate that
younger firms are performing better than older firms in the automobile industry. This
may be because younger firms are employing the latest technologies and better
administrative processes that deliver lower operational costs and higher profit
margins. The reasons that contribute to older firms having a lower performance level
in comparison to younger firms needs further investigation.
5.4.3.5.4 Firm Size and Firm Performance
The results of the studies that examined the firm size in relation to company
performance were mixed. A number of studies examining the impact of firm size on
firm performance found a significant positive relationship between the two (see for
example, Gleason et al., 2000, Zeitun and Tian, 2007) while some studies (see for
example, Tzelepis and Skuras, 2004, Durand and Coeuderoy, 2001, and Lauterbach
and Vaninsky, 1999) found a positive but insignificant impact of firm size on the firm's
performance. The regression results of this study showed a significant and positive
relationship between firm size and company performance measured in ROA, ROE
and Cost Efficiency on both OLS and panel regression models. The firm size is
measured by the natural logarithm of total assets. The relationship between the
Tobin’s Q and the company size was not significant. Since larger automobile
companies are enjoying scale benefits, it is natural for larger firms to have higher
211
profitability and cost efficiencies, and the results of the study confirm this generally
held view.
5.4.3.5.5 State Control
As discussed in Chapter 3, the state had a vital role to play in the
development of the automobile industry during and after the reform period of the
industry in China. The firms with ultimate state control tended to have more
government support than the non-state controlled firms (Garcia-Herrero et al. 2009
and Liu et al. 2012). However, the state control existing in the firms might also
sabotage the firms’ profitability due to the lack of managerial experience. Therefore,
the state control variable is used as a dummy variable to indicate whether the firms’
financing decisions are ultimately made by the state. This variable is used to further
investigate the influences of state control over manufacturers in the Chinese
automobile industry. The empirical results indicate that state control (SOECON) is
significantly and positively related to cost efficiency. This is consistent with the
findings of Liu et al. (2012) that a positive relationship exists between state control
and the operational performance of a firm. However, as the results of both the OLS
and panel models indicated, the performance of state controlled automobile
companies tends to decline with increasing state control. The Chinese automobile
industry is highly regulated by government policies including controls on planning,
production and developing strategic plans (CAAM 2016). Therefore, as Berkowitz et
al. (2015) argued, firms with state control tend to receive more resources and these
resources were used to meet the needs of planned targets, including satisfying the
excess labour force and eventually leading to inefficient management.
212
5.4.3.5.6 The Automobile Industry Sector and Firm Performance
Within the automobile industry, the automobile manufacturers are some of the
oldest manufacturers in the country, playing significant roles in managing the
industrial policy during the initial establishment, for instance, of the first automobile
works (FAW) (Chu 2011). It has embraced large scale production and inherited
many more resources than the component manufacturers. However, as the results of
the regression analysis showed, the performance of the automobile manufacturing
companies is lower than that of the component manufacturing companies. This may
be due to the relative inefficiency in the asset utilisation by the automobile
manufacturers as revealed in the results of the ratio analysis.
5.5 Summary
This chapter presented results of the threefold analysis undertaken to answer the
research questions outlined in the previous chapter.
First, the ratio analysis was conducted to examine the profitability, liquidity and
leverage of Chinese automobile and component manufacturers for the period from
2006 to 2014. The results of this analysis revealed that Indian automobile
manufacturing companies have outperformed Chinese automobile and component
manufactures in many of the profitability measures examined. Such differences
were not observed for the level of liquidity between the Chinese and Indian
companies in both automobile and component manufacturing sectors, although
some of the liquidity measures indicated weakening liquidity positions in the Chinese
companies. With regard to the leverage, the study found significantly lower levels of
debt in Chinese automobile and component manufacturing companies in comparison
to their Indian counterparts and this was identified as a factor affecting the relatively
lower rate of return on equity in Chinese automobile companies.
213
Second, the level of efficiency of Chinese automobile companies was
examined using the DEA method. The results showed that technical efficiency of
Chinese manufacturers has steadily improved since 2008, while that of component
manufacturers has plateaued in the last few years after a significant drop in 2012,
indicating the technical inefficiencies in that sector. The average of CRSTE and
VRSTE indicate that all the observed DMUs are not operating at the optimal scale,
and the scale efficiency results have not been achieved for all the observed years.
Further analysis revealed the deteriorating IRS of automobile manufacturing over the
sample period, while CRS increased over the same period, indicating deteriorating
scale efficiency of the automobile manufacturing companies. A similar situation was
observed for the IRS for automobile component manufacturing, but unlike the
automobile manufacturing it is the DRS which is on the rise, indicating the situation is
even worse for component manufacturing. Also, the study found that allocative
inefficiencies have dragged down the potential improvements to cost efficiency which
could have been gained from improvements in the technical efficiency of automobile
manufacturing. As for the component manufacturing, allocative efficiency has
deteriorated at a faster rate than the technical efficiency and has dropped down to
the level similar to the level that existed in 2006. As a result, cost efficiency has
virtually shown no improvement over the 9 year period in this sector, requiring
remedial action for improvement.
Thirdly, the relationship between factors affecting firm performance
(ownership structure, leverage, sustainable growth, state control, age, size and
industry) and firm performance measured in four performance measures were
examined using pooled and panel regression models. Empirical findings indicated
that government ownership, operating leverage, and state control have significantly
214
negative relationships to performance as measured by ROA and ROE, while foreign
and institutional ownership, financial leverage, and sustainable growth have
significantly positive relationships with performance. The relationship between firm
age and firm performance was negative but not significant. As expected, size of the
firm has a positive impact on performance, and performance of the automobile
manufacturing sector is significantly lower than that of the component manufacturing
sector. When the performance was measured by a market performance of Tobin’s
Q, government and institutional ownership, financial leverage, and sustainable
growth were all found to be major factors affecting firm performance. When the
performance is measured by cost efficiency, it was found that the leverage (both
financial and operating) and age of the firms had significantly negative relationships
with performance, while size and state control were the only two factors that were
significantly positively related to firm performance.
215
CHAPTER SIX
SUMMARY AND CONCLUSION
6.1 Introduction
This study has examined the cost competitiveness of the Chinese automobile
industry using a threefold data analysis. The Chinese automobile industry is an
industry with massive economic significance to China. It utilises a substantial amount
of technology, capital, human resources and industry linkages (Maritz and Shieh,
2013), making a massive contribution to China’s GDP and economic growth. The
Chinese automobile industry has been supported by a growing middle class which
has created a huge demand for automobiles and massive government support. This
has enabled China to become the leading manufacturer of automobiles among all
the emerging markets in the world, producing a massive 24.5 million units of
production in 2015 (OICA 2016). The development of the Chinese automobile
industry has been rapid in comparison to that of the industry in US and Europe,
which each took more than 100 years to achieve the standard of today (Shanghai
Daily, 2014).
However, as the Chinese automobile industry grows and increases its
exposure to the global market, the issues relating to enhancement of its cost
competitiveness, through production and operation efficiencies, has become a major
challenge for the industry. Although the industry has come a long way and has
doubled in size from what it was about 10 years ago, it now faces great challenges
going into the future, with the expectation of increasing production of vehicles by
many millions over the next 10 years.
One of the major challenges facing this industry is the need to improve the
level of quality and innovation while moving away from the “copycat culture” which
still pervades some of the industry in China. The quality of vehicles produced in
216
China is a particularly significant barrier to further expansion of the industry, as it has
put Chinese automobiles in a less prestigious position in the world market due to the
perceptions of their products being of low quality. The recent drop in exports of
automobiles manufactured in China by 20% in 2015 compared to the previous year
has raised concerns over the competitiveness of the models (low-cost and low-tech)
produced in China. The lack of good quality indigenous brands produced in China
has restricted the industry’s ability to attract customers from other countries,
especially from developed countries (Chang 2016). The fact that the Indian
passenger car exports for FY2016 totaled 532,053 units when the Chinese
passenger car exports for the same period totalled 409,800 units (Kulkarni 2016) is a
clear indication of the precarious state of the Chinese automobile industry today.
This shows that despite the fact the amount of passenger cars produced in China is
much higher than that of India, Chinese automobile industry has not been able to
match Indian automobile industry in the export market. Confirming this data, Forbes
in its list of the world’s largest car exporting countries lists India as the 20th largest
exporter in the world compared to China, which sits at the 22nd position despite
being the world’s largest manufacturer of automobiles. Furthermore, India’s
automotive sector also emerged a winner in terms of year-on-year growth in
comparison to China’s by registering an impressive annual growth rate of 8.7% as
opposed to China’s 4.3%. Passenger car sales in India rose 10.2% as compared to
China’s 6.5% (Kulkarni 2016). These data clearly indicate that the Chinese
automobile industry lags behind its major competitor, India, in a number of fronts.
Along with the lack of quality and innovation in the industry, a sharp increase
in production and operational costs has started to affect its competitiveness. The
factors that appear to have caused concern are the changing cost structures of the
217
firms, the large volume of the unskilled labour force (Berkowitz et al. 2015),
increasing wages and materials costs and the opportunistic behaviours of managers
in state-owned enterprises (Sun et al. 2002; Chang 2016). Unfortunately, the large
volume and scale of production that the Chinese automobile industry has embraced
for some time now does not seem to be contributing to increased manufacturing
efficiency and increased competitiveness.
Since the biggest car manufacturers in China are joint ventures between
Western and Chinese owners, it is critical for the industry to continue to attract
foreign investment into the automobile industry for further development. With a view
to develop the industry with foreign assistance, the Chinese central government
opened the door to foreign investment in the early 1980s (Harwit 1995). However,
given the strict regulations on foreign investment and frequent government
intervention in the industry, the continuous flow of foreign investment into the
industry has been significantly obstructed. At present, international car makers are
only allowed to have a 50-50 joint-venture partnership with China’s state-owned
enterprises/manufacturers (SOEs) (Shi et al. 2014). Under these conditions, the
foreign investors are obliged to help the newly established Chinese automobile
manufacturers to modernize their production process with the hope that one or two
of these manufacturers (SOEs) will be capable of producing quality automobiles that
are competitive in the global market in terms of quality (Chang 2016). However,
progress has been slow due to the fact that the conditions of the local manufacturing
environment were not ready for embracing advanced technology and Western styled
capitalism (Young and Lan 1997;He and Mu 2012; Ju et al. 2013). Therefore, it is
crucial for the Chinese automobile industry to address the underutilization of
218
resources owned by Western automobile manufacturers and the inefficiencies
caused by the unskilled workforce in order to enhance competitiveness.
Given the above background, it is extremely important to identify the critical
factors that have impacted the cost competitiveness of the Chinese automobile
industry with a view to enhancing the industry’s declining cost competitiveness. This
study has done so by taking a managerial accounting approach to examine the
underlying issues that have contributed to the declining cost competitiveness of the
automobile industry in China. For this purpose, a threefold data analysis was carried
out. First, the study used a comprehensive ratio analysis of profitability, liquidity and
leverage of Chinese automobile and component manufacturing companies for a
period of nine years from 2006 to 2014. The results of this analysis were then
compared with a similar analysis carried out on Indian automobile and component
manufacturing companies for the same time period. Second, using DEA analysis,
various cost efficiency parameters of Chinese automobile and component
manufacturing companies were analysed for a period of nine years from 2006 to
2014 to identify the relative strengths and weaknesses of the industry. Third, using
multiple regression analysis, the impact of seven factors identified from the literature
as factors affecting the performance of the Chinese automobile industry were
analysed for a period of nine years from 2006 to 2014. The seven factors consisted
of:
(1) Ownership, consisting of government ownership, foreign ownership and
institutional ownership.
(2) Leverage, consisting of operating and financial leverage.
(3) Sustainable growth.
(4) Firm age.
219
(5) Firm size.
(6) State control.
(7) The Industry sector.
Section 6.2 below summarizes the major findings of the above mentioned analysis.
6.2 Summary of Major Findings
(1) Profitability: The profitability of Chinese automobile and component
manufacturers was found to be significantly lower than that of Indian automobile
and component manufacturers over the period from 2006 to 2014. The
significantly lower profitability of Chinese companies may significantly affect the
competitiveness of the Chinese automobile industry, as it provides a lower level
of net cash flows to Chinese companies in comparison to their international
competitors.
(2) Profit Margin: The profit margin of the Chinese automobile manufacturers was
found to be slightly higher than that of Indian automobile manufacturers, but the
difference between the two ratios was not statistically significant. However, the
overall profit margin of component manufacturers in China was significantly
higher in favour of Chinese companies. This helps to improve the overall return
on capital invested in this sector. The lower profit margin in the automobile
manufacturing sector is a major concern and thus requires close scrutiny for
improvement.
(3) Assets Turnover: Assets utilisation of Chinese automobile manufacturing and
component manufacturing companies was found to be significantly lower than
that of Indian automobile manufacturing companies. This lack of efficiency in the
use of total assets to generate revenue is an issue to be addressed as it has a
significant impact on the lower profitability of Chinese companies.
220
(4) Fixed Asset Turnover: No significant difference was found between automobile
manufacturing companies in the two countries in relation to efficiency of fixed
asset utilisation. However, in the case of component manufacturing, the
difference (1.8 times vs 2.5 times) indicates poor fixed asset utilisation in the
component sector of China, causing a negative impact on its profitability.
(5) Gross Profit Margin: The average gross profit margin of Chinese companies
(both automobile and component manufacturing) was significantly lower than that
of their Indian counterparts. The significantly lower gross profit margin was due to
the higher cost of sales in Chinese companies. Since this has significantly
impacted the competitiveness of Chinese automobile companies, the ways in
which cost of sales could be reduced need to be examined in order to improve
the cost effectiveness of Chinese automobile companies.
(6) Operational Expenses: The management of operational expenses in Chinese
automobile companies was found to be significantly efficient relative to their
Indian counterparts in both the automobile and component manufacturing
sectors. This efficient management of operating costs of Chinese automobile
companies has helped to lessen the negative impact of their higher costs of
sales. This has been found to be the one area where Chinese companies have
excelled well above their competitors.
(7) Net Finance Expense to Sales: The net impact of finance costs on the
profitability of Chinese automobile manufacturing companies was low as finance
revenues have virtually off-set almost all finance costs. However, their Indian
counterparts have performed better in this respect as they have been able to gain
significantly higher net finance revenue to boost their profitability. Since the
difference between the ratios of the automobile manufacturing companies in the
221
two countries is statistically significant in favour of Indian companies, Chinese
automobile manufacturing companies may need to seek higher finance revenues
to match their Indian counterparts. The difference between the ratios for the
component manufacturing sectors in the two countries was found not to be
significant. Therefore, this is not a matter of concern for this sector.
(8) Non-operating Income to Sales: The study did not find that non-operating costs
were a major factor affecting the profitability difference between the automobile
manufacturing sectors in China and India. The same can be said in relation to
their component manufacturing sectors due to the small numerical difference
between the ratios for the component manufacturing sectors in the two countries.
However, this difference was statistically significant.
(9) Tax Expense to Sales: Despite the lower company tax rate in China (25%)
relative to India (34%), the tax expense to sales ratio was found to be quite small
in the automobile and component manufacturing sectors of both countries. This
may be due to the numerous tax concessions that the automobile industry enjoys
in both countries. Therefore, this study found that tax expense is not a factor
affecting the competitiveness of automobile companies in China.
(10) Extraordinary Item Costs to Sales: The difference between the
extraordinary item costs to sales ratios of both the automobile and component
manufacturing companies of the two countries was found to be statistically
significant. However, the economic significance of this cost item is low as the
total cost of this item is a minute percentage of total sales. Therefore, this factor
was found to have an insignificant effect on profitability.
(11) Return on Equity (ROE): This study found a significant difference between
the ROE of Chinese automobile manufacturing companies and their Indian
222
counterparts. This is shown by the significant drop in ROE of Chinese
companies in the period of 2011-2014, whereas the ROE of Indian automobile
manufacturing companies experienced a significant increase at this time. The
difference between the ROE of Chinese component manufacturing companies
and their Indian counterparts was found to not be statistically significant. The
lower return on equity for the Chinese automobile companies can therefore be
regarded as a significant barrier to attracting equity capital into the automobile
industry.
(12) Current Assets Ratio: The liquidity position of automobile and component
manufacturing companies in both China and India, measured by the current asset
ratio, were found to be quite similar. Although the short term liquidity position did
not differ significantly between the two countries, the level of current assets is
well below the norm of 2 times current liabilities, raising concerns over the
adequacy of liquidity in the industry.
(13) Quick Asset Ratio: The level of quick assets maintained by both Chinese
and Indian automobile and component manufacturing companies was found to be
similar and within the industry benchmarked level. As such, the short term
liquidity position, when measured by the quick assets of automobile
manufacturing companies, was found to be in a healthy state in both countries.
This rules it out as an important factor behind performance improvement in the
automobile industry.
(14) Days Sales Outstanding (DSO): The number of days of credit that Chinese
companies on average have given to their customers was found to be
significantly lower in comparison to that of their Indian counterparts. This
223
indicates a weaker debt collection policy resulting in a longer operating cash flow
cycle and increasing working capital funding costs for the industry.
(15) Stock Turnover: The rate of conversion of stocks into sales in the Chinese
automobile and component manufacturing companies was significantly lower
than that of their Indian counterparts. The slower stock conversion rate
significantly affects the profitability of Chinese companies as it indicates
increased overhead costs and lower operational efficiency. Since increasing
inventory costs result in higher costs of goods sold, the weak stock turnover may
be directly linked to the higher cost of goods sold in Chinese companies
observed earlier. By getting this rate to increase, Chinese companies could
enhance their profitability as they would be making a more competitive profit
margin on sales.
(16) Days’ Sales in Inventory (DSI): DSI of Chinese companies, both automobile
and component manufactures, was found to be significantly higher than for their
Indian counterparts. Since DSI is a measure of inventory effectiveness and
shows the average length of time that a company’s cash is tied up in inventory,
the relatively higher DSI ratio of Chinese companies shows a lack of efficiency in
inventory management by Chinese companies in comparison to their Indian
counterparts.
(17) Leverage: The level of financial leverage of Chinese automobile companies
was found to be significantly lower than that of Indian automobile companies.
Since automobile manufacturing is a highly capital-intensive business,
automobile companies worldwide utilize debt extensively in their capital structure.
The lower leverage is a positive for the industry due to the lower debt service
costs and financial risk. However, debt can also be beneficial for companies, if
224
the debt is used in the capital structure appropriately to increase return for equity
shareholders, without jeopardising the financial stability of the company. The
fairly low level of debt in the Chinese automobile companies is due to their use of
non-interest-bearing repayable grants from the government for funding their
operations. This significantly reduces the burden on Chinese companies for
borrowings. Another reason that may explain the lower leverage is the high loan
regulations by the government restricting the companies’ abilities to borrow freely
from the open market. Therefore, further investigation is necessary to examine
the appropriateness of the current level of leverage in Chinese automobile
companies, considering the fact that Indian automobile companies have been
able to achieve a higher level of profitability with a significantly higher level of
leverage in their companies.
(18) Constant Returns to Scale (CRSSE) Efficiency: The manufacturing
efficiency of automobile manufacturers, as measured by the constant returns to
scale (CRSTE) has increased gradually to 94% in 2014, after having recorded
the lowest level of 78% in 2008 due to the impact of the GFC. Similarly, the
efficiency levels for component manufacturers showed the highest score of 90%
in 2010 after having recorded the lowest level of 80% in 2008 due to the impact
of the GFC. What is concerning is the sharp drop of the CRSTE from 90% in
2010 to 84% in 2012 and that it has plateaued since then. The lack of increase in
efficiency in component manufacturing in recent years is an issue that needs to
be addressed.
(19) Variable Return to Scale (VRSTE) Efficiency: Both automobile and
component manufacturing companies were found to have maintained the VRSTE
parameters at a higher level than the CRSTE parameters, indicating their
225
capability to manage their levels of efficiency with government intervention.
However, the relatively lower VRSTE of component manufacturers indicates that
their efficiency is more sensitive in the presence of government intervention or
imperfect market conditions.
(20) Scale Efficiency: The scale efficiency, which is achieved when the observed
DMUs are all operating at the optimal scale (identified by observation of the
average of CRSTE and VRSTE) was found to be not at the optimum level for all
DMUs overall and for all the observed years. The rate of scale efficiency showed
a similar trend until 2013 for both automobile and component manufacturing.
However in 2014, while the scale efficiency of automobile manufacturing
continued to increase from the previous year, scale efficiency of component
manufacturing showed a sharp drop. The reasons for the changing trends need
to be examined as they will have implications for future profitability unless
remedial actions are taken to reverse the trend.
(21) Types of Return to Scale –Automobile Manufacturing: Further analysis of
scale efficiency has highlighted a glaring trend that lowers the efficiency of the
automobile manufacturing sector. The study observed an unfavourable trend of
automobile companies experiencing increasing return to scale (IRS) efficiency,
while experiencing an increase in the constant return to scale (CRS) efficiency in
its place. This trend indicates that the majority of automobile companies are now
achieving output increases by that same level of input, and are not able to
proportionally increase output higher than their input as they used to do during
the early years in the sample period.
(22) Types of Return to Scale –Component Manufacturing: The scale
efficiency trend in component manufacturing was found to be even worse than
226
the trend in automobile manufacturing, as the trend of decreasing IRS over the
sample period has been replaced by the increasing trend of Decreasing Return to
Scale (SRS), not CRS as in the case of automobile manufacturing. This means
that almost half of component manufacturers are now able to achieve less output
for their input. The results further indicated concerns over the efficiency
performance of component manufacturers in the Chinese automobile industry,
who lack the capability to utilise their existing scale to perform at the optimal
level.
(23) Size of Firm and Efficiency: When the efficiency levels of the automobile
and component manufacturing companies are examined by size, it was found
that based on the estimation of the CRSTE and VRSTE, large companies are
more technically efficient than small automobile manufacturers.
(24) Allocative Efficiency and Cost Efficiency Performance in Automobile
Manufacturing: The study found that the level of technical efficiency of Chinese
automobile manufacturing companies has increased gradually from 84% in 2006
to 94% in 2014. However, the cost advantage that could have been gained from
this increase in technical efficiency has been offset by the gradual decrease in
allocative efficiency since around 2010. As a result, automobile manufacturing
companies were found to be struggling to enhance their cost efficiency and
technical improvements.
(25) Allocative Efficiency and Cost Efficiency Performance in Component
Manufacturing: The study found weakening efficiencies in the component
manufacturing sector, with no significant technical efficiency improvement in the
last 3 years, after having recorded the highest technical efficiency of 90% in
2010. This, along with the decline in allocative efficiency, has resulted in the
227
level of cost efficiency dropping to 63% in 2014 from the highest cost efficiency
level of 81% recorded in 2010. This shows that this sector has virtually not shown
any cost efficiency improvements over the 9 year period.
(26) Government Ownership and Firm Performance: Government ownership
was found to have a significant negative impact on firm performance of
automobile companies when it is measured by ROA, ROE and Cost Efficiency,
but a significant positive impact on firm performance when it is measured by
Tobin’s Q.
(27) Foreign Ownership and Firm Performance: The study found a significant
positive association between foreign ownership and performance as measured
by ROA and ROE, confirming the generally held view that foreign investors can
improve the performance of automobile companies.
(28) Institutional Ownership and Firm Performance: The relationship between
the institutional ownership and performance of automobile firms was found to be
positive and significant under all four measurements of performance.
(29) Financial Leverage and Firm Performance: Despite the low level of
financial leverage in Chinese companies, it was found to have a significant
positive impact on firm performance when it was measured in terms of ROA and
Tobin’s Q. In contrast, financial leverage was found to have a significant negative
impact on cost efficiency, indicating that increasing debt will increase the input
cost of companies without necessarily producing output increases.
(30) Operating Leverage and Firm Performance: The relationship between
operating leverage and firm performance was found to be significant and
negative when firm performance is measured by ROA, ROE and cost efficiency.
228
This indicates an inability by Chinese automobile companies to utilise their fixed
assets effectively to generate more income to improve profitability.
(31) Sustainable Growth and Firm Performance: The study found a significant
and positive association between sustainable growth and company performance
when performance is measured by ROA, ROE and Cost efficiency. The
relationship between sustainable growth and Tobin’s Q was also found to be
positive but not significant. The standardised coefficient of 0.382 for the ROA
mode indicated this is the most significant factor contributing to the performance
of automobile companies in China. As Harford et al. (2006) stated, the higher
sustainable growth rate leads to better cash holding positions for firms, helping to
improve firm profitability. The findings of this study confirm the previous findings
of Harford et al. (2006) and Officer (2006), that manufacturers with high
sustainable growth rates tend to have higher Tobin’s Q, are more profitable and
more cost efficient.
(32) Firm Age and Firm Performance: The study found a significant and negative
relationship between firm age and performance when performance is measured
by ROE and Cost Efficiency. Although not significant, a negative relationship was
found for the other performance measures of ROA and Tobin’s Q. The results
indicated that the older the firm, the weaker the performance of the firm. This may
be because newer firms employ the latest technologies and better administrative
processes that deliver lower operational costs and higher profit margins,
compared to older firms which tend to have many operational inefficiencies built
up over a long period of time (Das and Gosh 2006). Similarly, Loderer and
Waelchli (2010) found that due to their long period of operations, the experience
of older manufacturers may be offset by the possession of old machinery,
229
equipment and software which negatively impacts upon performance, while
young firms are more committed to utilising modern plant, equipment and
advanced technology which could be used to enhance their profitability. It must
be noted, however, that the prior empirical results concerning this aspect are
mixed. For example, Graham et al. (2008) found that older firms are likely to
achieve better performance because they have improved their managerial skills
through the years, and tend to have well-established strategic plans for
responding to emergency breakdowns in the production process.
(33) Firm Size and Firm Performance: The results of the study showed a
significant and positive relationship between firm size and company performance
when measured by ROA, ROE and Cost Efficiency. Since larger automobile
companies are enjoying scale benefits which result in higher profitability and cost
efficiencies, the results of the study confirm this generally held view (Margaritis
and Psillaki 2008). Furthermore, the increased firm size can also lead the
manufacturers to have greater access to a skilled labour force, capital and new
technology.
(34) State Control and Firm Performance: This study found a significant and
negative relationship between state control and ROA. This is consistent with the
established relationship between state ownership and performance, indicating
that a similar reasoning exists to explain this relationship. However, when the
relationship between state control and cost efficiency was examined, it was found
that the relationship is significant and positive. This result is not consistent with
the generally held view that firms with state control tend to receive more
resources and these resources are used to meet the needs of planned targets,
including satisfying the excess labour force and eventually leading to inefficient
230
management. Therefore, further investigation is required to identify the possible
reasons for this unexpected relationship. Another significant factor that may have
a negative impact on performance, is the composition of the controlling
shareholders. In China, the automobile manufacturers and component
manufacturers are normally associated with different controlling shareholders
who come from different regions of China, representing different provinces with
different levels of power. This power structure is found to have a significant
impact on receiving resources from the government and allocating them in an
efficient manner. In the case of many companies, a higher level of state controls
has led to poor performance (Faccio et al. 2010).
(35) The Automobile Industry Sector and Firm Performance: The regression
analysis found that the performance of the automobile manufacturing companies
is lower than that of the component manufacturing companies. This may be due
to the relative inefficiency in asset utilisation by the automobile manufacturers, as
elaborated in the results of the ratio analysis. The Chinese transition economy
has provided its automobile industry with a unique institutional background, which
includes the privatisation of state-owned enterprises from the 1990s (Sun et al.
2002) and the share split structure reform (Fan and Wong 2002; Sun and Tong
2004). However, government ownership and control over this vital industry has
led to some inefficiencies, as these companies are subject to strict government
policies and regulations. These restrictions may have contributed to the lower
level of performance in the automobile manufacturing sector in comparison to
that in the component manufacturing sector, which was not subjected to the
same level of government scrutiny. The automobile industry sector dummy in the
231
regression model is used to capture the exogenous impact of these factors on the
automobile manufacturing sector.
6.2.1 Conclusions and Recommendations
Based on the results of the analysis explained in Chapter 4 and the findings
summarized in the previous section, the following conclusions are made in the form
of answers to the research questions specified in section 4.2 of the thesis.
Research Question 1 [RQ1]:
How competitive is the Chinese Automobile industry in terms of performance and financial status in comparison to those of the Indian Automobile industry?
The answer to this question was sought through a comprehensive
comparative investigation of various performance and financial status ratios of
Chinese and Indian automobile and component manufacturing firms over the period
from 2006 to 2014. In answering this research question, three sub research
questions based on profitability (RQ1.a); Liquidity (RQ1.b) and Leverage (RQ1.c)
were formed. Based on the results of the analysis in these investigations, the
following conclusions are made.
In terms of profitability, Indian automobile manufacturers have outperformed
Chinese automobile manufacturers in the key profitability measures of ROA, ROE,
gross profit margins, net-finance expenses and asset utilisation. The only area where
Chinese automobile manufacturers have excelled was in the management of
operating expenses which were significantly lower than that of their Indian
counterparts. If it was not for this cost item, the overall profitably would have been
much lower for Chinese companies. As for component manufacturing, Indian
companies have outperformed their Chinese counterparts in four of the six key
profitability measures. The results show that the Chinese component manufacturing
232
sector displayed similar weaknesses to those evident in the automobile
manufacturing sector with the exception of their profit margin ratios, which are
significantly higher in Chinese companies relative to Indian companies, giving the
Chinese a slight competitive edge. However, due to the significantly lower asset
turnover ratios of Chinese companies compared to Indian companies, Chinese firms
experience significantly lower returns on assets, despite maintaining significantly
lower operating costs.
In terms of liquidity, the results of the analysis on the major liquidity indicators
of current asset ratio and quick asset ratio, did not show a significant difference
between the levels of liquidity in Chinese and Indian companies with regards to both
automobile and component sectors. However, there was an exception for the quick
ratio in the component sector, where the difference was found to be statistically
significant. However, the other indicators of liquidity showed significant differences
between the two countries, highlighting areas of concern. The ratios of days sales in
accounts receivable and days sales in inventory ratios indicated that the
management of accounts receivable and inventory by Chinese companies was poor
in comparison to that of Indian companies, with regards to both the automobile
manufacturing and component manufacturing sectors. This indicates that Chinese
companies need to improve on both aspects in order to avoid liquidity issues in the
future.
In terms of leverage (Financial), Chinese automobile companies (both
automobile and component manufacturing) were found to have significantly lower
levels of leverage than that of their Indian counterparts. Since financial leverage is
widely regarded as having a positive association with company performance,
Chinese companies appeared to have missed out on the opportunity to increase
233
profitability through increased financial leverage. Given the low level of financial
leverage in Chinese companies, there seems to be plenty of room to increase
financial leverage to increase profitability, as many automobile companies around
the world have done, in order to increase their profitability. The fairly low level of debt
in Chinese automobile companies appears to be due to their use of non-interest-
bearing repayable grants from the government to fund their operations, and the strict
loan regulations imposed by the government restricting the company’s abilities to
borrow freely from the open market. Overall, there appears to be room for
improvement in working out the optimum capital structure for Chinese automobile
companies on operational grounds rather than on legislative grounds.
Overall, in comparison to the Indian automobile industry, Chinese automobile
companies have fared poorly in terms of performance and financial status. More
specifically, they have been unable to match or better many crucial profitability
measures of their closest competitor. With regards to liquidity, despite being on par
with Indian automobile companies on main liquidity ratios, they have performed
poorly in a number of key liquidity measures. This has the potential to cause serious
liquidity issues if remedial action is not taken to rectify the situation. Finally, financial
leverage has been underutilised for legislative reasons, and as a result Chinese
automobile companies have not been able to use it effectively to enhance their
profitability.
Research Question 2[RQ2]:
How have the Chinese Automobile companies performed in terms of operational efficiency?
The answer to this question was sought through a comprehensive
investigation of various efficiency measures of Chinese automobile and component
manufacturing companies over the period from 2006 to 2014. The analysis was
234
conducted using the Data Envelopment Analysis method. In answering this research
question, five sub research questions based on technical efficiency (RQ2.a); pure
technical efficiency (RQ2.b), scale efficiency (RQ2.c), allocative efficiency (RQ2.d)
and cost efficiency (RQ2.e) were formed. Based on the results of the analysis of
these investigations, the following conclusions are made.
In terms of Technical Efficiency (Use of minimal input to achieve a given level
of output), Chinese automobile manufacturing companies have performed well
during the sample period, as they have gradually increased technical efficiency from
78% in 2008 to 94% in 2014, a significant and favourable development. On the other
hand, component manufacturing companies have not performed as well as they
have previously, with a gradual decrease in technical efficiency from 90% in 2010 to
85% in 2014, a significant drop and an unfavourable development. The reasons for
the decline in technical efficiency in the component manufacturing sector need to be
investigated and remedial action needs to be taken for improvement.
In terms of Pure Technical Efficiency (technical efficiency without scale
efficiency), both automobile and component manufacturing companies have
performed well, as VRSTE parameters were found to be at a higher level than the
CRSTE parameters. This indicates capabilities to manage their levels of efficiency
even while subject to government intervention, and shows a high level of
managerial performance within Chinese automobile companies in organizing inputs
in the production process. However, the relatively lower pure technical efficiency of
component manufacturers highlights the need for improving managerial performance
in this sector.
In terms of Scale Efficiency (achieved when the observed DMUs are all
operating at the optimal scale), both automobile and component manufacturing
235
companies performed reasonably well until 2013, and since then the scale efficiency
of automobile manufacturing continued to increase from the previous year, while the
scale efficiency in component manufacturing showed a sharp drop. A closer look at
the scale efficiency of automobile manufacturers indicates that the majority of
automobile manufacturing companies are now achieving output increases by that
same level of input, and are not able to proportionally increase output higher than
their input as they used to do during the early years in the sample period. The
situation is even more serious for component manufacturing, as the trend of
decreasing IRS over the sample period has been replaced by the increasing trend of
Decreasing Return to Scale (SRS). These results highlight the need for enhancing
scale efficiencies in both sectors.
In terms of Allocative Efficiency (right mix of inputs to achieve the given
output), both the automobile and component manufacturing companies have
performed similarly over the sample period. The allocative efficiency rate of
automobile manufacturing companies was 80% in 2006, and after 9 years of
operations it remained at 80% in 2014, after having recorded the highest efficiency
level of 88% in 2010. Similarly, the allocative efficiency rate of component
manufacturing companies was 75% in 2006 and dropped down slightly to 73% in
2014, after having recorded the highest efficiency level of 90% in 2010. This
declining trend in allocative efficiency is a major concern for the sector as it has a
direct negative impact on cost efficiency, profitability and competitiveness.
In terms of cost efficiency (ratio of minimum cost of producing the outputs to
observed cost of producing the outputs for the DMU), Chinese automobile
manufacturing companies have performed better than the component manufacturing
companies. As for the automobile manufacturing, the cost efficiency ratio has
236
increased from 67% to 75% during the 9 year sample period. At the same time, the
cost efficiency ratio of component manufacturing increased only from 60% to 63%.
Both industries recorded an 81% cost efficiency ratio in 2010, which is a substantially
higher level of cost efficiency compared to the current level. In order to improve the
cost efficiency, automobile companies need to improve their allocative efficiency with
the view to obtain maximum cost savings by increasing their technical efficiency. As
for component manufacturing, they need to improve both their technical efficiency
and their allocative efficiency to have higher cost efficiency.
Overall, Chinese automobile and component manufacturing companies have
not performed at the optimum efficiency level during the sample period. However,
since the level of efficiency measured under different measures is closer to 1. (1 unit
is regarded as full efficiency –see Copper et al. 2006; Bai and Dai 2006) than to 0.5
which indicates 50% efficiency, the current level of efficiency is not unsatisfactory.
The major concern with regards to the efficiency, however, is the trend over the
sample period which has stagnated or declined in relation to many critical efficiency
measures, particularly in the component sector.
The results of the regression analysis which examined the factors affecting
the cost efficiency of the Chinese automobile companies found that sustainable
growth rate, size of firms and state control had significant and positive impacts on
the cost efficiency of automobile companies. The sustainable growth rate indicates
that the cash flow available from internally generated funds for growth, and its size,
was an indication of the investments made in both current and fixed assets in order
to generate more income. Both these factors reflect an increase in resources which
have helped companies to increase production efficiencies. State control, which has
negatively impacted on performance when measured by the accounting measures of
237
ROA and ROE, has had a positive impact on cost efficiency. This may be due to the
influence that state control has in getting government resources and allocating them
into productive investment opportunities for these companies. However, state control
has negatively affected the overall profitability of companies. Thus, despite its
positive impact it is not recommended that state control should be increased. These
two factors—sustainable growth and firm size—are critical for getting further cost
efficiencies and performance improvement. Therefore, it is recommended that
automobile companies look for improvements with regard to these two factors for
enhancing company competitiveness.
Four other factors had significant and negative impacts on cost efficiency.
They were: financial leverage, operating leverage, government ownership and firm
age. Although it is difficult to identify how these factors have impacted performance
to date, since both financial leverage and operating leverage are often used to
increase profitability and efficiency through increased assets and less expensive
finance sources, the reasons why these factors have not contributed to firm
performance in the ways expected need to be investigated and action needs to be
taken to remedy the situation. There is no denial of the fact that these two measures
are powerful managerial tools for enhancing performance, although they have not
delivered the expected results to the Chinese automobile industry. On the other
hand, government ownership has been found to be a drag on efficiency and
performance in a number of prior studies. Therefore, it is recommended that
automobile companies continue to promote lowering government ownership. As for
firm age, it is obvious that firms tend to drop efficiency as they age (see for example,
Das and Gosh, 2006 and Loderer and Waelchli, 2010). This is due to many reasons,
some of which are mentioned in Section 6.2 (35) above. It is recommended that
238
older automobile companies try to rejuvenate their workforce and acquire productive
assets through renewal, reorganisation, and modernisation.
In addition to the factors mentioned above, a number of other measures need
to be taken into account to address the weakening efficiency of the automobile
industry. First, measures need to be taken to improve its efficiency with inputs, given
the current technology, with a view to operate on its most efficient production frontier.
The inputs utilised in the DEA model to calculate the efficiency performance were
labour, material costs, capital and operating expenses. Therefore, it is essential that
action needs to be taken to improve labour cost and quality efficiency, material price
and quantity efficiency, and to find an optimum mixture of capital. While companies
make attempts to find efficiencies with these inputs, attempts should be made to
continue to improve product quality, as it has been seen as a major obstacle to
enhancing the competitiveness of the Chinese automobile industry.
One of the main reasons for the negative impact on technical efficiency is the
increasingly unskilled workforce in Chinese industries, including the automobile
industry. This is due to Chinese companies employing large numbers of low-cost,
unskilled workers to take advantage of the low labour costs, and not putting enough
effort into attaining a skilled labour force once the workers are hired (Admassie and
Matambalya 2002; Batra and Tan 2003; Charoenrat and Harvie 2011). Therefore,
action needs to be taken to hire more skilled workers in the workforce and to
increase the skills of the current workforce to increase labour efficiency.
Research Question 3[RQ3]:
What factors have affected the performance of the Chinese automobile industry?
The answer to this question was sought through a comprehensive
investigation of the impact of 7 factors (10 variables). These factors were identified
239
from the literature as having an impact on the performance of Chinese automobile
and component manufacturing companies over the period from 2006 to 2014 using
OLS and Panel regression analysis. In answering this research question, ten sub
research questions were formed and answered. These nine sub questions were
based on (1) government ownership (RQ3.a.1); (2) foreign ownership (RQ3.a.2); (3)
institutional ownership (RQ3.a.3); (4) financial leverage (RQ3.b.1); (5) operating
leverage (RQ3.b.2); (6) sustainable growth (RQ3.c); (7) firm age (RQ3.d); (8) firm
size (RQ3.e); (9) state control (RQ3.f); and (10) industry sector (RQ3.g). Based on
the results of the analysis of these investigations, the following conclusions are
made.
When performance is measured by accounting measures of ROA and ROE,
four factors are found to have a significant positive impact on firm performance.
These are: foreign ownership; institutional ownership; sustainable growth and size of
the company. Therefore, in order to improve the performance of Chinese automobile
companies, an attempt should be made to gradually increase foreign and institutional
ownership and to increase the sustainable growth rate through reduced payouts to
shareholders. Also, in order to maximize scale efficiency, automobile companies
should continue to expand their productive assets to generate income while trying to
utilise their existing assets more efficiently.
Another important factor that has had a significant impact on profitability, as
measured by ROA, is financial leverage. Given the lower level of leverage in
automobile companies due to government restrictions, there appears to be room to
increase financial leverage to enhance profitability, as financing the assets through
debt capital is a less expensive option given the current low interest environment
worldwide. However, financial leverage was not found have a significant impact on
240
ROE, which is consistent with the generally held view that financial leverage
may decrease or increase ROE under different conditions. The conditions that
prevented leverage from having a significant impact on ROE need to be examined.
Two other factors—government ownership and operating leverage— have
been found to have significant impacts on performance when it is measured by ROA
and ROE. This result is consistent with findings by previous studies on Chinese
companies. The negative relationship between government ownership and
performance can partly be explained by the agency cost hypothesis, which states
that there is a conflict of interests among the controlling shareholding groups under
disproportionate ownership structures, similar to those which prevail in Chinese
companies. As a result, these agency problems might be intensified, resulting in
negative performance. Although reasons for this relationship is not known, this result
indicates that Chinese automobile companies have not been able to utilize their
operating leverage to enhance their profitability. As Dou (2012) pointed out, the
Chinese automobile industry lacks an efficient and fixed asset management system.
Since the current level of operating leverage is detrimental to profits, automobile
companies need to examine the optimum level of operating leverage that would
bring in more gains from each additional sale and to increase profit margins at a
faster pace than sales.
The other two factors that have had significant and negative impact on
performance were state control and industry sector. Given that government
ownership has had a negative impact on firm performance, it is not surprising that
state control had a similar effect on profitability. However, unlike government
ownership which affected both ROA and ROE negatively, state control only affected
ROA and had no significant impact on the ROE. Since the main factor that separates
241
ROA and ROE is financial leverage, an explanation for ROE not being significantly
impacted can be found through a further investigation of financial leverage and
profitability. The significant and negative impact that the industry sector has had on
ROA and ROE indicates a lower level of performance in the automobile
manufacturing sector in comparison to the component manufacturing sector. These
results are confirmed and further explained by the results of the ratio analysis.
When performance is measured by the market measure of Tobin’s Q, which is
a reflection of the market’s expectations about future profitability contrary to ROA
and ROE which are related to current profitability, four factors were found to have a
significant positive impact on Tobin’s Q. These factors are: government ownership,
institutional ownership, financial leverage and sustainable growth. From a market
point of view, all these factors are positive indicators of strong and stable companies
that investors are willing to reward with a higher market price for their shares.
Therefore, from the market perspective, Chinese automobile companies should
focus on increasing institutional ownership, financial leverage and sustainable
growth for a higher Tobin Q. These three factors are also positively associated with
ROA and ROE. Although the increase in government ownership may increase
Tobin’s Q, it is not recommended due to the fact that it has a significant negative
relationship with the accounting performances of ROA and ROE. Given the fact that
China’s stock prices have been extremely volatile and contain a large noise
component (Xu and Wang, 1997), the use of Tobin’s Q as a performance measure
may be problematic in China ( Jiang et al. 2008). Firm size was found to be the only
factor that has had a significant and negative relationship with Tobin’s Q. Since it is
also significantly and positively associated with ROA and ROE, Chinese automobile
242
companies are encouraged to increase their asset bases for improved performance
in both accounting and market measures.
6.3 Limitations of This Study and Future Research Areas
Despite the theoretical and empirical contributions of this thesis, it contains a
number of limitations that offer possibilities for further research, as follows.
(1) The ratio analysis conducted to compare the performance of Chinese automobile
companies with the Indian automobile companies was limited to 16 ratios due to
the unavailability of certain data. Although the number of ratios chosen is
considered adequate for this type of investigation, further studies should aim to
utilize more ratios, such as ratios on market value indicators, as they can provide
a broader perspective of company operations.
(2) The DEA analysis conducted was based on four commonly used input measures
–labour, capital, materials and operating expenses—and gross profit as the
output measure. Since there are no universally acceptable input or out variables
for a given industry, and different studies have used different input and output
measures, it is difficult to compare the results of this study with results of a similar
study conducted in another country, although such a comparison would be
worthwhile. Therefore, future researchers investigating the efficiency
performance of automobile industries in other countries are encouraged to use
the same input and output measures which were used in this study to facilitate
future comparative studies.
(3) The efficiency measurements of this study were calculated using a DEA
approach. However, the validity of the measurements could have been increased
if the efficiency measurements were also calculated using other available
methods within DEA, such as the Bootstrap DEA approach developed by Simar
243
and Wilson (2007), as that would have given a clear indication about the levels of
efficiency of firms under investigation.
(4) This study utilised cross-sectional firm-level data of the Chinese automobile
industry from the OCISRIS database for the period from 2006 to 2014 to conduct
the ratio analysis, DEA analysis and regression analysis. However, due to the
unavailability of data, the comparative analysis was limited to examine the
performance of Chinese and Indian automobile companies only. Future research
should extend to examine the performance of automobile companies in other
countries as well, utilising both the DEA and regression analysis as used in this
study.
(5) Due to the significant number of missing data and outliers in the data set used in
this study, the data analysis was conducted using unbalanced panel data.
Although the use of unbalanced panel data for similar studies is a common
practice, the use of balanced panel data may have helped to make more valid
findings.
(6) For the estimation in the regression analysis, the ownership structure of Chinese
companies was calculated based on the percentages of the largest shareholdings
of government, institutional investors and foreign investors. If data is available,
the actual percentage of shares owned by each shareholder group should be
used as it provides a better estimate of the ownership. Furthermore, this study
did not consider subtypes of ownership holdings, such as the type of institutional
investors, although such classifications would have provided additional
information about the relationship between the ownership structure and firm
performance.
244
(7) The analysis conducted in this study was limited to examining the listed Chinese
automobile and component manufacturing companies, due to the unavailability of
data on any other types of company data on the OSIRIS Database. However,
since there are many other types of automobile companies, such as private
companies and SMEs, making significant contributions to the Chinese automobile
industry, future studies should make an attempt to expand the sample to include
those other types of studies excluded in this study.
(8) The conclusions of this study were drawn based on the results of the data
analysis conducted in this study. However, the source of the data used in the
study was confined to the financial and non-financial data available on the
OSIRIS Database and automobile company websites. The sources of data, such
as questionnaire surveys, and interviews, could also have provided more validity
to the findings of the study as they provide different perspectives on the issues
examined. Future research may focus on the issues examined in this study by
using other sources of data to provide a better understanding of, and other
perspectives on, the underlying issues.
6.4 Policy Implications
The findings and conclusions stated in the previous sections provide valuable
insights for the government, the automobile industry and other relevant policymakers
in China to develop and improve polices to address the deteriorating
competitiveness of the automobile industry. Listed below are some key areas that
require policy improvements to address the problems and issues identified in the
study.
1. The study identified a deteriorating profitability in the industry, which will
significantly erode the competitive edge that the Chinese automobile industry
245
has had over its counterparts in the developed countries on the cost of
production. Policy makers need to look at ways to put downward pressure on
the significant cost of production in the industry. Particularly, action needs to
be taken to improve the cost structure of automobile manufacturers, skills in
the work force, the efficiency of the labour costs to counter the increasing
labour costs, the supply chain for increasing the quality of the materials, and
to lower materials costs. Since the current cost of sales of the Chinese
automobile industry is higher than that of the Indian industry, measures need
to be taken to lower the cost of sales through increased cost efficiencies.
2. The results concerning the efficiency of the industry suggest that the
manufacturers in the Chinese automobile industry were experiencing
technical and cost inefficiencies. Even with the current level of technology, the
industry should be able to address these issues partly through gains in input
efficiencies. Policy makers need to design policies to lift the level of efficiency
existing in the industry.
3. The regulatory and institutional frameworks governing the automobile industry
need improvement. As this study found, government ownership has led to
weaker performance in the industry. Therefore, policy makers need to re-
examine the effectiveness of the current government policy of being involved
in the business affairs of the industry through government ownership, as the
results of this study suggest that the lowering of government ownership would
most likely improve the performance of Chinese automobile companies.
4. Foreign investment needs to be encouraged as foreign ownership is positively
associated with firm performance. Despite the apparent advantages of
increased foreign investment and its contribution to profitability, the
246
government has restricted foreign ownership, limiting the capacity of
foreigners to develop the industry. Although foreign firms have been providing
automobile technology to China for a century, more often the technology
introduced was already dated, if not obsolete, and only a very few of the
foreign technologies have been refreshed once they were in production in
China. In order to achieve their full potential, the existing policy on foreign
investment in the automobile industry needs to be re-examined and changed
to entice foreign companies to make genuine capital and technological
investments in the Chinese automobile industry.
5. The study found that financial leverage is positively associated with firm
performance. Therefore, increased financial leverage is more likely to
enhance the profitability of the automobile companies. Policy makers need to
examine the current restrictions and grant schemes that prevent/discourage
automobile companies from increasing their financial leverage, and make
necessary changes to legislation to allow companies to make leverage
decisions based on its operational viability.
6. A company’s sustainable growth rate was also found to have a significant
impact on profitability. Despite this being the main factor found to contribute to
higher performance, the sustainable growth rate remains lower than many
developed countries, and has been on the decline in recent years due to
increased payout ratios. Therefore, the automobile industry needs to provide
policy direction to automobile companies, highlighting the need to improve on
this ratio for better performance.
7. The examination of the performance implications of state control shows that it
has a negative impact on firm performance. It seems the unique and
247
complicated governance structure of Chinese companies that allows
government involvement in management control of their business affairs
appears to hinder company performance. The effectiveness of the
government policy of involving the government in controlling the management
of automobile firms needs to be re-examined and necessary action needs to
be taken to lower such managerial control by the government.
8. The study highlighted the need for better utilisation of assets in the automobile
industry. Since the size of the companies is positively associated with firm
performance, it is beneficial for companies to continue to expand business
operations despite the concerns of structural over-capacity in the industry,
which is a result of falling demand due to lacklustre exports. In order to
increase demand for Chinese automobiles, the existing quality level must be
improved. Since the capacity of these companies to increase quality with the
current level of technology is low, the Chinese automobile industry needs to
explore better ways to encourage the transfer of technology from their foreign
collaborators. It is widely reported that Chinese automobile companies have
benefited more from companies such as General Motors which have taken
high-risk approaches with technology transfer, in comparison with companies
such as Chrysler and Ford which have taken more cautious and conservative
approaches to technology transfer (Gallagher 2003). Policy makers need to
look at ways to reduce the risk that foreign collaborators face in order to
encourage genuine technological transfer to China from the foreign
collaborators. This enables the Chinese to lift their product quality to make it
comparable to that which exists in the developed markets, to enhance
demand for Chinese automobiles in those markets.
248
Given the declining competitiveness of the Chinese automobile industry in
recent years as a result of fierce competition, profitably pressures mainly due to
increasingly poor asset utilisation, and falling demand for Chinese automobiles in
overseas markets, the industry needs to take immediate action to address the critical
issues identified in this study as factors affecting the performance of companies in
the automobile industry. This study provides valuable insights into areas where these
improvements can be made to enhance the competitiveness of the Chinese
automobile industry.
249
BIBLIOGRAPHY
ACMA 2007, ‘Indian Automotive Component Industry – Engine of Growth Driving the Indian Manufacturing Sector’, Automotive Component Manufacturers Association of Indian (ACMA), New Delhi.
Ab Razak, NH, Ahmad, R, & Aliahmed, H 2008, ‘Government ownership and performance: An analysis of listed companies in Malaysia’, Corporate ownership and control, vol.6, no.2, pp. 434-442.
Abernathy, WJ 1978, ‘The productivity dilemma : roadblock to innovation in the automobile industry’, Baltimore :Johns Hopkins University Press.
Acs, ZJ & Audretsch, DB 1988, ‘Innovation and firm size in manufacturing’, Technovation, vol.7, no.3, pp.197-210.
Afza, T & Hussain, A 2011, ‘Determinants of capital structure: A case study of automobile sector of Pakistan’ Interdisciplinary Journal of Contemporary Research in Business, vol.2, no.10, pp.219.
Afriat, SN 1972, ‘Efficiency estimation of production functions’, International Economic Review, vol.13, no.3, pp.568-598.
Aggarwal, R, Erel, I, Ferreira, M and Matos, P 2011, ‘Does governance travel around the world? Evidence from institutional investors’, Journal of Financial Economics, vol.100, no.1, pp.154-181.
Agrawal, A and Knoeber, CR 1996, ‘Firm performance and mechanisms to control agency problems between managers and shareholders’, Journal of Financial and Quantitative analysis, vol.31, no.03, pp.377-397.
Aguilera, RV & Jackson, G 2003, ‘The cross-national diversity of corporate governance: Dimensions and determinants’, Academy of Management Review, vol.28, no.3, pp. 447-465.
Ahrens, N. (2013). China's Competitiveness: Myth, Reality, and Lessons for the United States and Japan: Case Study: Huawei.
Ajanthan, A 2013, ‘The relationship between dividend payout and firm profitability: A study of listed hotels and restaurant companies in Sri Lanka’, International Journal of Science and Research Publications, vol.3, no.6, pp.1-6.
Akben-Selcuk, E 2016, ‘Factors Affecting Firm Competitiveness: Evidence from an Emerging Market’, International Journal of Financial Studies, vol.4, no.2, pp.9.
Akimova, I and Schwodiauer, G 2004, ‘Ownership structure, corporate governance, and enterprise performance: empirical results for Ukraine’, International Advances in Economics, vol.10, no.1, pp.28-42.
Albert, E and Xu, B 2016, ‘China’s Environmental Crisis’, Councial on Foreign Relations, accessed on 18th August 2016: https://www.cfr.org/backgrounder/chinas-environmental-crisis
Alchian, AA & Demsetz, H 1972, ‘Production, Information Costs, and Economic Organization’, The American Economic Review, vol.62, no.5, pp.777-795.
250
Al-Rashidi, A 2016, ‘Data envelopment analysis for measuring the efficiency of head trauma care in England and Wales’, Salford University.
Altman, EI 1968, ‘Financial Ratios, Discriminant Analysis and the Prediction of Corporate Bankruptcy’, The Journal of Finance, vol.23, no.4, pp. 589-609
Amidu, M 2007, ‘Determinants of capital structure of banks in Ghana: an empirical approach’, Baltic Journal of Management, vol.2, no.1, pp.67-79.
Amran, NA & Aripin, N 2015, ‘Financial ratios: A tool for conveying information and decision making’, Global Review of Accounting and Finance, vol.6, no.1, pp.151-164.
Anderson, BS & Eshima, Y 2013, ‘The influence of firm age and intangible resources on the relationship between entrepreneurial orientation and firm growth among Japanese SMEs’, Journal of Business Venturing, vol.28, no.3, pp.413-429.
Anderson, EW, Fornell, C & Lehmann, DR 1994, ‘Customer Satisfaction, Market Share, and Profitability: Findings From Sweden’, Journal of Marketing, vol.58, no.3, pp.53.
Anderson, RC & Reeb, DM 2003, ‘Founding‐family ownership and firm performance: evidence from the S&P 500’, The Journal of Finance, vol.58, no.3, pp.1301-1328.
Anderson, SW 1995, ‘A Framework for Assessing Cost Management System Changes: The Case of Activity-Based Costing Implementation at General Motors, 1986-1993’, working paper, University of Michigan, School of Business Administration, Research Support.
Anderson, SW 1995, ‘Measuring the Impact of Product Mix Heterogeneity on Manufacturing Overhead Cost’, The Accounting Review, vol.70, no.3, pp.363-387.
Anderson, SW, Hesford, JW and Young SM 2002, ‘Factors influencing the performance of activity based costing teams: a field study of ABC model development time in the automobile industry’, Accounting, Organisation and Society, vol.27, iss.3, pp.195-211.
Ang, JS and Ding DK 2006, ‘Government ownership and the performance of government-linked companies: The case of Singapore’, Journal of Multinational Financial Management, vol.16, no.1, pp.64-88.
Anonymous 1994, ‘China Automotive industry industrial policy’, East Asian Executive Reports, vol.16, no.9, pp.23-27.
Archel, P, Husillos, J, Larrinaga, C, & Spence, C 2009, ‘Social disclosure, legitimacy theory and the role of the state’, Accounting, Auditing & Accountability Journal, vol.22, no.8, pp.1284-1307.
Arjomandi, A, Seufert, JH & Salim, R 2016 ‘Good corporate governance is good for banks' bottom line’, The Conversation, pp.1-3.
Armstrong, JS & Collopy, F 1996, ‘Competitor orientation Effects of objectives and information on managerial decisions and profitability’, Journal of Marketing Research, vol.33, no.2, pp.188-199.
251
Arnott, RD & Asness, CS 2003, ‘Surprise! Higher dividends higher earnings growth’, Financial Analysts Journal, vol.59, no.1, pp.70-87.
Ataullah, A & Le, H 2006, ‘Economic reforms and bank efficiency in developing countries: the case of the Indian banking industry’, Applied Financial Economics, vol.16, no.9, pp.653-663.
Audretsch, DB 1995, ‘Innovation, growth and survival’, International Journal of Industrial Organization, vol.13, no.4, pp.441-457.
Automobile Manufacturers in the United States. (2004) (pp. 1): Datamonitor Plc.
Automobile & Motor Vehicle Manufacturing Industry 2011, United States Automobile & Motor Vehicle Manufacturing Industry Report, pp.1-56.
Autor, DH, Dorn, D & Hanson, GH 2016, ‘The China Shock: Learning from Labor-Market Adjustment to Large Changes in Trade’, Annual Review of Economics, vol.8, pp.205-240.
Avkiran, NK 2011, ‘Association of DEA super-efficiency estimates with financial ratios: Investigating the case for Chinese banks’, Omega, vol.39, no.3, pp.323-334.
Awan, AG, Ahmad, W, Shahid, P and Hassan, J 2014, ‘Factors affecting foreign direct investment in Pakistan’, International Journal of Business and Management Review, vol. no.4, pp.21-35.
Azhagaiah, R & Priya, S 2008, ‘The impact of dividend policy on shareholders’ wealth’, International Research Journal of Finance and Economics, vol.20, no.8, pp.180-187.
Azzoni, CR & De Menezes, TA 2009, ‘Cost Competitiveness of International Destinations’, Research notes and reports/Annals of Tourism Research, vol.36, pp.715-734.
BAI, X & DAI, X 2006, ‘Production Efficiency Appraisal to China’s Main Car Manufactures Based on DEA Model’, Journal of Finance and Economics, vol.32, no.10, pp.35-47.
Baker, HK, Powell, GE & Veit, ET 2002, ‘Revisiting the dividend puzzle: Do all of the pieces now fit?’, Review of Financial Economics, vol.11, no.4, pp.241-261.
Baker, M and Hyvonen, M 2011, ‘The emergence of the Chinese automobile sector’, RBA Bullentin.
Balk, BM 2001, ‘Scale Efficiency and Productivity Change’, Journal of Productivity Analysis, vol.15, no.3, pp.159-183.
Ball, R & Brown, P 1968, ‘An Empirical Evaluation of Accounting Income Numbers’, Journal of Accounting Research, vol.6, no.2, pp.159-178.
Ban, L., Belzowski, B.M., Gumbrich, S. and Zhao, J 2005, ‘Inside China-Chinese
view their automotive future’, IBM, accessed online on 15th March 2017
https://www.google.com.au/search?q=Measuring+Business+Financial+Streng
th&hl=en&gws_rd=ssl#hl=en&q=Inside+China+The+chinese+view+their+auto
motive+future&*&spf=384
252
Banker, RD, Charnes, A & Cooper, WW 1984, ‘Some Models for Estimating
Technical and Scale Inefficiencies in Data Envelopment Analysis’,
Management Science, vol.30, iss.9, pp.1078-1092.
Banker, RD & Johnston, HH 1993, ‘An empirical study of cost drivers in the US airline industry’, The Accounting Review, vol.68, no.3, pp.576-601.
Baranson, J 1969, ‘Automotive Industry in developing Countries’, Baltimore: Johns Hopking Press.
Barney, JB 1986, ‘Strategic factor markets: Expectations, luck and business strategy’, Management Science, vol.32, no.10, pp.1231-1241.
Basu, I 2003, ‘India's Auto Industry Comes of Age’, Asia Times Online, accessed online on 15th March 2017: http://www.atimes.com/atimes/printN.html
Bauer, PW 1990, ‘Decomposing TFP growth in the presence of cost inefficiency, non-constant returns to scale, and technological progress’, The Journal of Productivity, vol.1, pp.287-299.
Baumgarten, D, Bonenkamp, U & Homburg, C 2010, ‘The Information Content of the SG&A Ratio’, Journal of Management Accounting Research, vol.22, no.1, pp.1-22.
Bayldon, R, Woods, A & Zafiris, N 1984, ‘A Note on the ‘Pyramid’ Technique of Financial Ratio Analysis of Firms’ Performance’, Journal of Business Finance & Accounting, vol.11, no.1, pp.99-106.
Becchetti, L & Sierra, J 2003, ‘Bankruptcy risk and productive efficiency in manufacturing firms’, Journal of Banking & Finance, vol.27, no.11, pp.2099-2120.
Beck, T, Demirgüç‐Kunt, A & Maksimovic, V 2005, ‘Financial and legal constraints to growth: Does firm size matter?’, The Journal of Finance, vol.60, no.1, pp.137-177.
Becker, W & Dietz, J 2004, ‘R&D cooperation and innovation activities of firms—evidence for the German manufacturing industry’, Research Policy, vol.33, no.2, pp.209-223.
Belderbos, R, Carree, M & Lokshin, B 2004, ‘Cooperative R&D and firm performance’, Research Policy, vol.33, no.10, pp.1477-1492.
Belderbos, R, Van Roy, V & Duvivier, F 2013, ‘International and domestic technology transfers and productivity growth: firm level evidence’, Industrial & Corporate Change, vol.22, no.1, pp.1-32.
Belkaoui, A 1976, ‘The impact of the disclosure of the environmental effects of organizational behavior on the market’, Financial Management, pp.26-31.
Bentley, G, Bailey, D & MacNeill, S 2013, ‘The changing geography of the European auto industry’, Handbook of industry studies and economic geography, ed. F. Giarratani, G. Hewings, and P. McCann, pp.67-98.
Bentzen, J, Madsen, E. S & Smith, V 2012, ‘Do firms’ growth rates depend on firm size?’, Small Business Economics, vol.39, no.4, pp.937-947.
253
Berger, AN & Bonaccorsi di Patti, E 2006, ‘Capital structure and firm performance: A new approach to testing agency theory and an application to the banking industry’, Journal of Banking & Finance, vol.30, no.4, pp.1065-1102.
Berger, AN & DeYoung, R 1997, ‘Problem loans and cost efficiency in commercial banks’, Journal of Banking & Finance, vol.21, no.6, pp.849-870.
Berger, AN & Hannan, TH 1998, ‘The Efficiency Cost of Market Power in the Banking Industry: A Test of the 'Quiet Life' and Related Hypotheses’, The Review of Economics and Statistics, vol.80, no.3, pp.454-465.
Berger, AN & Humphrey, DB 1997, ‘Efficiency of financial institutions: International survey and directions for future research’, European Journal of Operational Research, vol.98, no.2, pp.175-212.
Berger, AN & Udell, GF 2006, ‘A more complete conceptual framework for SME finance’, Journal of Banking & Finance, vol.30, no.11, pp.2945-2966.
Berkert, PJ 2017, ‘Measuring Business Financial Strength’, Financial Review, Iss. 44, accessed online on 15th March 2017, http://www.pinnacle-business.com/newsletter/Financial%20Review%20By%20Pinnacle%20Consultants%20042611.htm
Berkowitz, D, Ma, H, & Nishioka, S 2015, ‘Recasting the Iron Rice Bowl: The Reform of China's State Owned Enterprises’, Review of Economics and Statistics.
Berliner, C & Brimson, JA 1988, ‘Cost Management in Today's Advanced Manufacturing: The CAM-I Conceptual Design’, Boston, MA: Harvard Business School Press.
Berman, SL, Wicks, AC, Kotha, S and Jones, TM 1999, ‘Does Stakeholder Orientation Matter? The Relationship between Stakeholder Management Models and Firm Financial Performance’, The Academy of Management Journal, vol.42, no.5, pp.488-506.
Berry, RH & Nix, S 1991, ‘Regression Analysis v. Ratios in the Cross-section Analysis of Financial Statements’, Accounting & Business Research (Wolters Kluwer UK), vol.21, no.82, pp.107-117.
Bertrand, M, Mehta, P & Mullainathan, S 2000, ‘Ferreting out tunnelling: An application to Indian business groups’, National Bureau of Economic Research.
Bhagat, S & Bolton, B 2008, ‘Corporate governance and firm performance’, Journal of Corporate Finance, vol.14, no.3, pp.257-273.
BIE (Bureu of Industry Economics), 1994, International Performance Indicators: Gas Supply, Canberra: AGPS.
Bhide, A 1994, ‘How entrepreneurs craft strategies that work’, Harvard Business Review, vol.72, no.2, pp.150-161.
Biesebroeck, JV 2007, ‘The cost of Flexibility’, Assembly Automation, vol.27, no.1, pp.55-64.
Bloodgood, JM & Katz, JP 2004, ‘Manufacturing Capacity, Market Share, and Competitiveness’, Competitiveness Review, vol.14, no.1/2, pp.60.
254
Boardman, A, Freedman, R & Eckel, C 1986, ‘The price of government ownership: A study of the Domtar takeover’, Journal of Public Economics, vol.31, no.3, pp.269-285.
Boardman, AE & Vining, AR 1989, ‘Ownership and performance in competitive environments: A comparison of the performance of private, mixed, and state-owned enterprises’, JL & Econ., vol.32, pp.1.
Bokpin, GA & Arko, AC 2009, ‘Ownership Structure, Corporate Governance and Capital Structure Decisions of Firms: Empirical Evidence from Ghana’, Studies in Economics and Finance, vol.26, no.4, pp.246-256.
Bonesrønning, H & Rattsø, J 1994, ‘Efficiency variation among the Norwegian High Schools: Consequences of equalization policy’, Economics of Education Review, vol.13, no.4, pp.289-304.
Booth, L, Aivazian, V, Demirguc‐Kunt, A & Maksimovic, V 2001, ‘Capital structures in developing countries’, The Journal of Finance, vol.56, no.1, pp.87-130.
Bourlakis, M, Maglaras, G, Aktas, E, Gallear, D & Fotopoulos, C 2016, ‘Does Firm Size Influence Sustainable Performance in Food Supply Chains: Insights from Greek SMEs’, Developments in Logistics and Supply Chain Management,pp. 253-265.
Bowman, EH 1978, ‘Strategy, annual reports, and alchemy’, California Management Review, vol.20, no.3, pp.64-71.
Boycko, M, Shleifer, A & Vishny, RW 1996, ‘A theory of privatisation’, The Economic Journal, pp.309-319.
Brand Papers: Made in China, 2005, Brand Strategy, pp.30-31.
Brent, W & Jeong, J 2011, ‘Mia motors the arrival of a foreign multinational firm into the US automobile market’, Journal of the international Academy for Case Studies, vol.17, no.5, pp.123-130.
Bresnahan, TF 1987, ‘competition and collusion in the American automobile industry the 1955 price war’, The Journal of Industrial Economics, vol.XXXV, no.4, pp.457-482.
Brissimis, SN, Delis, MD & Tsionas, EG 2010, ‘Technical and allocative efficiency in European banking’, European Journal of Operational Research, vol.204, no.1, pp.153-163.
Brown, A., Van der Wiele, T. and Loughton, K 1998, ‘Smaller enterprises experiences with ISO9000’, International Journal of Quality & Reliability Management, vol.15, no.3, pp.373-385.
Brown, LD & Caylor, ML 2006, ‘Corporate governance and firm valuation’, Journal of Accounting and Public Policy,vol25, no.4, pp.409-434.
Buckley, PJ, Clegg, J, Zheng, P, Siler, PA & Giorgioni, G 2010, ‘The impact of foreign direct investment on the productivity of China’s automotive industry’, Foreign direct investment, China and the world economy (pp. 284-304): Springer.
Burki, AA and Niazi, GSK 2006, ‘Impact of Financial Reforms on Efficiency of State-owned’, Private and Foreign Banks in Pakistan.
255
Burnett, RD & H., D. R 2008, ‘Ecoefficiency: Defining a role for environmental cost management’, Accounting, Organizations and Society, vol.33, no.6, pp.551-581.
Burrows, GH 1994, ‘Allocations and Common Costs in Long-Run Investing and Pricing Decisions: An Historical Analysis’, Abacus, vol.30, no.1, pp.50-64.
Bylinsky, G 1983, February 21, ‘The Race to the Automotive Factory’, Fortune, pp.52-64.
Cachon, GP & Olivares, M 2010, ‘Drivers of Finished-Goods Inventory in the U.S. Automobile Industry’, Management Science, vol.56, no.1, pp.202-216.
Calantone, RJ, Cavusgil, ST and Zhao, Y 2002, ‘Learning orientation, firm innovation capability, and firm performance’, Industrial Marketing Management, vol.31, no.6, pp.515-524.
Callen, JL 1991, ‘Data Envelopment Analysis: Partial survey and applications for management accounting’, Journal of Management Accounting Research, vol.3, pp.35-56.
Calmasur, G 2016, ‘Technical Efficiency Analysis in the Automotive Industry: A Stochastic Frontier Approach’, International Journal of Economics, Commerce and Management, vol.4, no.4, pp.120-137.
Chery International, (2011, 2013 2016). Accessed online on 15th March 2017: http://www.cheryinternational.com/
China’s car sales growth halves in 2014, 2015, BBC News, accessed on 17th September 2016: http://www.bbc.com/news/business-30775309
China Corporate Tax Rate, 2017, Trading Economics, accessed on 15th March 2017: http://trdingeconomics.com/china/corporate-tax-rate
China National Automotive Industry International Corporation (CNAICO), 2010, accessed online on 28th May 2011: http://ma2.mofcom.gov.cn/aarticle/supplydemandofchina/200706/20070604771612.html
Capon, N, Farley, JU, & Hoenig, S 2012, ‘Toward an integrative explanation of corporate financial performance’, Springer Science & Business Media.
Caprio Jr,G & Peria, S 2000, ‘Avoiding Disaster: Policies to Reduce the Risk of Banking Crises’, In E. Cardoso and A. Galal, eds., Monetary Policy and Exchange Rate Regimes: Options for the Middle East. Cairo, Egypt: The Egyptian Center for Economic Studies.
Cardinaels, E 2008, ‘The interplay between cost accounting knowledge and presentation formats in cost-based decision-making’, Accounting, Organizations and Society, vol.33, no.6, pp.582-602.
Carlin, W, Fries, S, Schaffer, ME & Seabright, P 2001, ‘Competition and enterprise performance in transition economies’, Evidence from a cross-country survey.
Carmona, S, Ezzamel, M and Gutiérrez, F 2002, ‘The relationship between accounting and spatial practices in the factory’, Accounting, Organizations and Society, vol.27, no.3, pp.239-274.
256
Caves, DW, Christensen, LR, Tretheway, MW and Windle, R.J 1987, ‘An assessment of efficiency of U.S. airline deregulation via an international comparison’, In Public Regulation: New Perspective on Institutions and Policies.
Caves, DW & Christensen, LR 1980, ‘The relative efficiency of public and private firms in a competitive environment: the case of Canadian railroads’, The Journal of Political Economy, pp.958-976.
Cazals, C, Florens, JP & Simar, L 2002, ‘Nonparametric frontier estimation: a robust approach’, Journal of econometrics, vol.106, no.1, pp.1-25.
Chan, V 2005, ‘Competitiveness Which model should Cambodia Follow’, Cambodia-Canada Legislative Support Project, Accessed online on 15th March 2017, http://www.google.com.au/url?sa=t&rct=j&q=&esrc=s&source=web&cd=1&ved=0ahUKEwisifH5xoDTAhUETrwKHeG9DAAQFggZMAA&url=http%3A%2F%2Fwww.eicambodia.org%2Fevents%2Fupfile%2Fcompetitiveness_whichmodel_chanvuthy.pdf&usg=AFQjCNGnE1PEuT4BpQe5qceKLAkt_K9Edg&bvm=bv.151325232,d.dGc
Chang, C 2016, ‘China’s 13th Five-Year Plan Implications for the Automobile Industry’, Testimony of U.S.-China Economic and Security Review Commission, accessed online on 15th March 2017, https://www.uscc.gov/sites/default/files/Crystal%20Chang_Written%20Testimony%20042716.pdf.
Chang, C, Chen, X & Liao, G 2014, ‘What are the reliably important determinants of capital structure in china?’, Pacific-Basin Finance Journal, vol.30, pp.87-113.
Charnes, A, Cooper, WW & Rhodes, E 1978, ‘Measuring the efficiency of decision making units’, European Journal of Operational Research, vol.2, no.6, pp.429-444.
Charoenrat, T 2012, ‘The technical efficiency of Thai manufacturing small and medium sized enterprises: a comparison between the pre-and post-financial crisis of 1997’, University of Wollongong.
Chen, G, Firth, M & Xu, L 2009, ‘Does the type of ownership control matter? Evidence from China’s listed companies’, Journal of Banking & Finance, vol.33, no.1, pp.171-181.
Chen, IJ, Paulraj, A & Lado, AA 2004, ‘Strategic purchasing, supply management, and firm performance’, Journal of Operations Management, vol.22, no.5, pp.505-523.
Chen, S, Sun, Z, Tang, S & Wu, D 2011, ‘Government intervention and investment efficiency: Evidence from China’, Journal of Corporate Finance, vol.17, no.2, pp.259-271.
Chen, WC & McGinnis, LF 2007, ‘Reconciling ratio analysis and DEA as performance assessment tools’, European Journal of Operational Research, vol.178, no.1, pp.277-291.
Chen, X, Skully, M & Brown, K 2005, ‘Banking efficiency in China: Application of DEA to pre- and post-deregulation eras: 1993–2000’, China Economic Review, vol.16, no.3, pp.229-245.
257
Chen, Y & Iqbal Ali, A 2002, ‘Output–input ratio analysis and DEA frontier’, European Journal of Operational Research, vol.142, no.3, pp.476-479.
Chen, Z. (1985). Woguo qiche gongye da fazhan de ji xiang juece (Policies of the general development of our automotive industry. Juece yu xinxi (Policy and information)(2), 12-15.
Chenhall, RH 2005, ‘Integrative strategic performance measurement systems, strategic alignment of manufacturing, learning and strategic outcomes an exploratory study’, Accounting, Organizations and Society, vol.30, no.5, pp.395-422.
Chenhall, RH & Langfield-Smith, K 1998, ‘The relationship between strategic priorities, management techniques and management accounting An empirical investigation using a systems approaches’, Accounting, Organizations and Society, vol.23, no.3, pp.243-264.
Chhibber, PK & Majumdar, SK 1999, ‘Foreign Ownership and Profitability: Property Rights, Control, and the Performance of Firms in Indian Industry’, The Journal of Law and Economics, vol.42, no.1, pp.209-238.
Chhibber, PK & Majumdar, SK 2005, ‘Property rights and the control of strategy: Foreign ownership rules and domestic firm globalization in Indian industry’, Law & Policy, vol. 27, no.1, pp.52-80.
China Association of Automobile Manufacturers (CAAM), 2016, Automotive Statistics, accessed online on 15th March 2016, http://www.caam.org.cn/english/newslist/a101-1.html
Chinese auto industry faces major challenges, 2014. Shanghai Daily, accessed online on 15th March 2017, http://www.shanghaidaily.com/business/auto/Chinese-auto-industry-faces-major-challenges/shdaily.shtml
China’s vehicle exports top 1-million mark for first time, the China Association of Automobile Manufacturers (CAAM) and General Administration of Customs, 2013, China Daily, accessed on 21st July 2017, http://www.chinadaily.com.cn/beijing/2013-01/22/content_16152516.htm
Choudhury, S 2006, ‘Tata Motors, Fiat Forge Auto Pact In Indian Market’, Wall Street Journal, pp. A.6.
Chow, I. H.-s. 2006, ‘The relationship between entrepreneurial orientation and firm performance in China’, SAM Advanced Management Journal, vol.71, no.3, p.11.
China Iron and Steel Association (CISA) 2008, ‘China’s Huge Appetite for Auto Steel Expected’, accessed on 21st March 2016: http://www.chinaisa.org.cn/news.php?id=2142126
Chu, W 2011, ‘Family ownership and firm performance: Influence of family management, family control, and firm size’, Asia Pacific Journal of Management, vol.28, no.4, pp.833-851.
Chu, WW 2011, ‘How the Chinese government promoted a global automobile industry’, Industrial and Corporate Change, vol.20, no.5, pp.1235-1276.
258
Chun, D, Chung, Y & Bang, S 2015, ‘Impact of firm size and industry type on R&D efficiency throughout innovation and commercialisation stages: evidence from Korean manufacturing firms’, Technology Analysis & Strategic Management, vol.27, no.8, pp.895-909.
Chun-yao, T., & Lei-yu, W. 2007, ‘Innovation quality in the automobile industry: measurement indicators and performance implications’, International Journal of Technology Management, vol.37, no.1/2, pp.162-177.
Churhill, NC and Mullins, JW 2001, ‘How fast can your company afford to grow’, Harvard Business Review, vol.79, no.5, pp.135-142.
Cho, MH 1988, ‘Ownership structure, investment, and the corporate value: an empirical analysis’, Journal of Financial Economics, vol.47, no.1, pp.103-121.
Claessens, S., Djankov, S., Fan, J. P., & Lang, L. H. 2002, ‘Disentangling the incentive and entrenchment effects of large shareholdings’, The Journal of Finance, vol.57, no.6, pp.2741-2771.
Clark, P 1979, ‘The Japanese Company’, New Haven: Yale University Press.
Clark KB and Fujimoto T 1991, Product development performance: Strategy, organization, and management in the world auto industry, Boston, Massachusetts: Harvard Business School Press.
CNN 2006, ‘India's Influence Soars’, A Summary of Time Magazine cover story.
Coad, A., & Rao, R 2010, ‘Firm growth and R&D expenditure’, Economics of Innovation and New Technology, vol.19, no.2, pp.127-145.
Coad, A & Tamvada, JP 2012, ‘Firm growth and barriers to growth among small firms in India’, Small Business Economics, vol.39, no.2, pp.383-400.
Coelli, T 1996, ‘A Guide to DEAP Version 2.1: A Data Envelopment Analysis (Computer) Program’, Centre for Efficiency and Productivity Analysis, Working Paper 96/08.
Coelli, T, Rao, P, O’Donnell, J and Battese GE 2005, An introduction to efficiency and productivity analysis ,2nd ed., New York : Springer.
Coffee, JC 1991, ‘Liquidity versus control: The institutional investor as corporate monitor’, Columbia law review, vol.91, no.6, pp.1277-1368.
Cole, R. E 1980, Work, mobility, and participation : a comparative study of American and Japanese industry, Berkeley : University of California Press.
Collier, HW, Grai, T, Haslitt, S & McGowan, C 2004, ‘An example of the use of financial ratio analysis: the case of Motorola’.
Cooper, WW, Deng, H, Gu, B, Li, S, & Thrall, RM 2001, ‘Using DEA to improve the management of congestion in Chinese industries (1981–1997)’, Socio-Economic Planning Sciences, vol.35, no.4, pp.227-242.
Cooper, W. W., Gu, B, & Li, S 2001, ‘Comparisons and evaluations of alternative approaches to the treatment of congestion in DEA’, European Journal of Operational Research, vol.132, no.1, pp.62-74.
259
Cornett, M. M., Marcus, A. J., Saunders, A., & Tehranian, H 2007, ‘The impact of institutional ownership on corporate operating performance’, Journal of Banking & Finance, vol.31, no.6, pp.1771-1794.
Cornett, MM, Marcus, AJ & Tehranian, H 2008, ‘Corporate governance and pay-for-performance: The impact of earnings management’ Journal of Financial Economics, vol.87, no.2, pp.357-373.
Coulton, J, & Taylor, S 2004, ‘ Director’s duties and Corporate Governance: Have too far?’, Australian Accounting Review, vol.14, no.1, pp.17.
Cowen, SS, Ferreri, LB & Parker, LD 1987, ‘The impact of corporate characteristics on social responsibility disclosure: A typology and frequency-based analysis’, Accounting, Organizations and Society, vol.12, no.2, pp.111-122.
Cull, R, Li, W, Sun, B & Xu, LC 2015, ‘Government connections and financial constraints: Evidence from a large representative sample of Chinese firms’, Journal of Corporate Finance, vol.32, pp.271-294.
Cusumano, M 1985, ‘The Japanese automotive industry’, Cambridge, MA: Harvard University Press.
Cusumano, M 1988, ‘Manufacturing innovation: Lessons from the Japanese auto industry’, MIT Sloan Management Review, vol.30, no.1, p.29.
Dangayach, GS & Deshmukh, SG 2001, ‘Practice of manufacturing strategy: Evidence from select Indian automobile companies’, International Journal of Production Research, vol.39, no.11, pp.2353-2393.
Dangayach, GS & D, SG 2001, ‘Manufacturing strategy: Literature review and some issues’, International Journal of Operations & Production Management, vol.21, no.7, pp.884-932.
Das, A, & Ghosh, S 2006, ‘Financial deregulation and efficiency: An empirical analysis of Indian banks during the post reform period’, Review of Financial Economics, vol.15, no.3, pp.193-221.
Das, A, & Kumbhakar, SC 2012, ‘Productivity and efficiency dynamics in Indian banking: An input distance function approach incorporating quality of inputs and outputs’, Journal of Applied Econometrics, vol.27, no.2, pp.205-234.
Das, A, Nag, A & Ray, SC 2005, ‘Liberalisation, ownership and efficiency in Indian banking: a nonparametric analysis’, Economic and political weekly, pp.1190-1197.
Datar, SM, Kekre, S, Mukhopadhyay, T and Srinivasan, K 1993, ‘Simultaneous estimation of cost drivers’ The Accounting Review, vol.68, no.3, pp.602-614.
Davies, EP and Madsen, J 2001, ‘Productivity and Equity Returns: A Century of Evidence for 9 OECD countries’, Brunel University Department of Economics and Finance Working Paper, no.01-12.
Davies, K 2013, ‘China investment policy: An update’, OECD Working Papers on International Investment, no.1, p.1.
Davis, JL, Kennedy, KH and Payne, GT 2009, ‘Competitive dynamics among service SMEs’, Journal of Small Business Management, vol.47, no.4, p.421.
260
D'costa, AP 1995, ‘The restructuring of the Indian automobile industry: Indian state and Japanese capital’, World Development, vol.23, no.3, pp.485-502.
Debreu, G 1951, ‘Econometrica, vol.19, pp.273-292.
De Tibum, A., Nassimbeni, G., and Tonchia, S 1997, ‘An integrated production performance measurement system’, Industrial Management and Data Systems, vol.97, no.5, pp.180-186.
De Treville, S, Ketokivi, M & Singhal, V 2017, ‘Competitive manufacturing in a high-cost environment’, Introduction to the special issue: Elsevier.
Deegan, CM 2006, Financial accounting theory, 2nd ed.,North Ryde, N.S.W : McGraw Hill Australia.
Deegan, CM 2012, Financial accounting theory, 4th edition., North Ryde, N.S.W. McGraw-Hill Education (Australia).
Del Guercio, D & Hawkins, J 1999, ‘The motivation and impact of pension fund activism’, Journal of Financial Economics, vol.52, no.3, pp.293-340.
Delen, D, Kuzey, C & Uyar, A 2013, ‘Measuring firm performance using financial ratios: A decision tree approach’, Expert Systems with Applications, vol.40, no.10, pp.3970-3983.
Demsetz, H 1983, ‘The structure of ownership and the theory of the firm’, The journal of Law and Economics, vol.26, no.2, pp.375-390.
Demirag, I 1998, ‘Corporate governance, accountability, and pressures to perform: an international study’, Jai Press.
Demsetz, H & Villalonga, B 2001, ‘Ownership structure and corporate performance’, Journal of Corporate Finance, vol.7, no.(3), pp.209-233.
Demski, JS, Fellingham, JC and Lin, HH 2008, ‘Useful additional evaluation measures’, Journal of Management Accounting Research, vol.20, (Special Issue), 165-173.
Deng, H and M., AC 2010, ‘Market structure and pricing strategy of China automobile industry. The Journal of Industrial Economics, vol.LVIII, no. (4), pp.818-845.
Deng, Y, De Zoysa, A and Bhati, S, 2015, ‘A Cross-Country Comparison of Performance of Chinese and Indian Automobile Companies’, Global Review of Accounting and Finance, Vol. 16, No.1, Mar Issue, pp.106-117.
Dent, JF 1996, ‘Global competition challenges for management accounting and control’, Management Accounting Research, vol.7, no. pp.247-269.
De Vaus, DA and Da Vaus, D 2001, Reserch design in social research, Sage.
Dewenter, KL, & Malatesta, PH 1997, ‘Public offerings of state‐owned and privately‐owned enterprises: an international comparison’, The Journal of Finance, vol.52, no. (4), pp.1659-1679.
Dewenter, KL, & Malatesta, PH 2001, ‘State-owned and privately owned firms: An empirical analysis of profitability, leverage, and labor intensity’, The American Economic Review, vol.91, no. (1), pp.320-334.
261
Diez-Ticio, A, & Mancebon, MJ 2002, ‘The efficiency of the Spanish police service: an application of the multiactivity DEA model’, Applied Economics, vol.34, no. (3), pp.351-362.
Ding, M. and Xiao, J 2010, ‘Countermeasures on Reconstruction and Integration of Automobile Industry in China’, Asian Social Science, vol.6, no.9, pp.74-77.
Distexhe, V, & Perelman, S 1994, ‘Technical efficiency and productivity growth in an era of deregulation: the case of airlines’, Swiss Journal of Economics and Statistics, vol.130, no.4, pp.669-689.
Distexhe, V and Perelman, S 1993, ‘Technical efficiency and productivity growth in an era of deregulation: the case of airlines. Paper presented at the The Third European Workshop on Efficiency and Productivity Measurement, Belgium.
Djankov, S and Murrell, P 2002, ‘Enterprise restructuring in transition: a quantitative survey’, Journal of Economics and Literature, vol.40, no.3, pp.739-792.
Dlugosz, J, Fahlenbrach, R, Gompers, P, & Metrick, A 2006, ‘Large blocks of stock: Prevalence, size, and measurement’, Journal of Corporate Finance, vol.12, no.3, pp.594-618.
Dore, R 1973, British factory, Japanese factory: the origins of national diversity in industrial relations, London: Allen and Unwin.
Douma, S, George, R, & Kabir, R 2006, ‘Foreign and domestic ownership, business groups, and firm performance: Evidence from a large emerging market’, Strategic Management Journal, vol.27, no.7, pp.637-657.
Drake, L 2001, ‘Efficiency and productivity change in UK banking’, Applied Financial Economics, vol.11, no.5, pp.557-571.
Dröge, C., Jayaram, J., & Vickery, S. K 2000, ‘The Ability to Minimize the Timing of New Product Development and Introduction: An Examination of Antecedent Factors in the North American Automobile Supplier Industry’, Journal of Product Innovation Management, vol.17, no.1, pp.24-40.
Duasa, J, Raihan Syed Mohd Zain, S, & Tarek Al-Kayed, L 2014, ‘The relationship between capital structure and performance of Islamic banks’, Journal of Islamic Accounting and Business Research, vol.5, no.2, pp.158-181.
Duggal, R & Millar, JA 1999, ‘Institutional ownership and firm performance: The case of bidder returns’, Journal of Corporate Finance, 5, no.2, pp.103-117.
Duh, R.-R., Xiao, JZ & Chow, CW 2008, ‘An Overview and Assessment of Contemporary Management Accounting Research in China’, Journal of Management Accounting Research, vol.20(Special Issue), pp.129-164.
Durand, R and Coeurderoy, R 2001, ‘Age, order of entry, strategic orientation, and organizational performance’, Journal of Business Venturing, vol.16, no.5, pp.471-494.
Echeverri-Carroll, EL 1999, ‘Knowledge flows in innovation networks: a comparative analysis of Japanese and US high-technology firms’, Journal of Knowledge Management, vol. 3, no.4, pp.296-303.
Edmonds, TP, McNair, FM, Olds, PR, & Milam, EE 2011, Fundamental financial accounting concepts: McGraw-Hill Irwin New York, NY.
262
Edwards, CE 1966, Dynamics of the United States Automobile Industry’, Columbia: University of South Carolina Press.
Edwards, L. and Golub, SS 2004, ‘South Africa's International Cost Competitiveness and Exports in Manufacturing’, World Development, vol.32, no.8, pp.1323-1339.
Eisenhardt, KM 1989, ‘Agency Theory: An Assessment and Review’, Academy of Management Review, vol.14, no.1, pp.57-74.
Ellram, LM 1991, ‘A managerial guideline for the development and implementation of purchasing partnerships’, International Journal of Purchasing and Materials Management, vol.27, no.2, pp.2-8.
Ellram LM and Liu B 2002, ‘The Financial Impact of Supply Management’, Supply Chain Management Review,vol.6, no.6, pp.30-37.
Emrouznejad, A, Parker, BR & Tavares, G 2008, ‘Evaluation of research in efficiency and productivity: A survey and analysis of the first 30 years of scholarly literature in DEA’, Socio-Economic Planning Sciences, vol.42, no.3, pp.151-157.
Encaoua, D 1991, ‘Liberalizing European airlines cost and factor productivity evidence’, International Journal of Industrial Organization, 9, pp.109-124.
Engelke, MK, Mahmud, K, Britton, BP and Rains, DB 2000, ‘Measuring costs and Quality of TeleHomecare’, Home Health Care Management & Practice, vol.12, no.4, pp. 27-32.
England, GW, & Harpaz, I 1983, ‘Some methodological and analytic considerations in cross-national comparative research’, Journal of International Business Studies, vol.14, no.2, pp.49-59.
England, GW and Harpaz, I 1983, ‘Some Methodological and Analytic Considerations in Cross-National Comparative Research’, Journal of International Business Studies, vol.14, no.2, pp.49-59.
Estrin, S, Hanoushek, J, Kocenda, E and Svejnar, J 2009, ‘The effects of privatisation and ownership in transition economies’, Journal of Economic Literature, vol.47, pp.699-728.
Evans, JH, Kim, K, Nagarajan, NJ & Patro, S 2010, ‘Nonfinancial Performance Measures and Physician Compensation’, Journal of Management Accounting Research, vol.22, no.1, pp.31-56.
Everett, J & Neu, D 2000, ‘Ecological modernization and the limits of environmental accounting?’, Paper presented at the Accounting Forum.
Fare, R, Grosskopf, S and Norris, M 1997, ‘Productivity Growth, Technical Progress, and Efficiency Change in Industrialized Countries: Reply’, The American Economic Review, vol. 87, no.5, pp.1040-1044.
Fama, EF, & Jensen, MC 1983, ‘Agency Problems and Residual Claims’, The Journal of Law & Economics, vol.26, no.2, pp.327-349.
Fama, EF, & Jensen, MC 1983, ‘Separation of Ownership and Control’, The Journal of Law & Economics, vol. 26, no.2, pp.301-325.
263
Fan, JP, Wong, T, & Zhang, T 2005, ‘The emergence of corporate pyramids in China’
Fan, JP, Wong, T, & Zhang, T 2013, ‘Institutions and organizational structure: The case of state-owned corporate pyramids’, Journal of Law, Economics, and Organization, vol.29, no.6, pp.1217-1252.
Fan, JP, & Wong, TJ 2005, ‘Do external auditors perform a corporate governance role in emerging markets? Evidence from East Asia’, Journal of Accounting Research, vol.43, no.1, pp.35-72.
Fan, JP, Wong, TJ, & Zhang, T 2007, ‘Politically connected CEOs, corporate governance, and Post-IPO performance of China's newly partially privatized firms’, Journal of Financial Economics, 84, no.2, pp.330-357.
Färe, R, Grosskopf, S & Lovell, CK 2013, ‘The measurement of efficiency of production’, Vol. 6: Springer Science & Business Media.
Färe, R & Knox Lovell, CA 1978, ‘Measuring the technical efficiency of production.’, Journal of Economic Theory, vol.19, no.1, pp.150-162.
Farooque, OA, Van Zijl, T, Dunstan K and Karim AKM 2007, ‘Corporate governance in Bangladesh: link between ownership and financial performance’, Corporate Governance: an international review, vol.15, no.6, pp.1453-1468.
Farrar, J 2005, ‘Corporate Governance; Toothless Tiger-All roar and no bite’, New Zealand Management, vol.72.
Farrell, MJ 1957, ‘The Measurement of Productive Efficiency’, Journal of the Royal Statistical Society’, Series A (General), vol.120, no.3, pp.253-290.
Farsio, F, Geary, A & Moser, J 2004, ‘The relationship between dividends and earnings’, Journal for Economic Educators, vol.4, no.4, pp.1-5.
Favero, CA & Papi, L 1995, ‘Technical efficiency and scale efficiency in the Italian banking sector: a non-parametric approach’, Applied Economics, vol.27, no.4, 385-395.
Feinberg, SE & Majumdar, SK 2001, ‘Technology spillovers from foreign direct investment in the Indian pharmaceutical industry’, Journal of International Business Studies, vol.32, no.3, pp.421-437.
Fenn, GW & Liang, N 2001, ‘Corporate payout policy and managerial stock incentives’, Journal of Financial Economics, vol.60(1), pp.45-72.
Fernandes, N & Ferreira, MA 2008, ‘Does international cross-listing improve the information environment’, Journal of Financial Economics, vol.88, no.2, pp. 216-244.
Fernandes, N & Ferreira, MA 2009, ‘Insider trading laws and stock price informativeness’, Review of Financial Studies, vol.22, no.5, pp.1845-1887.
Ferreira, MA and Matos, P 2008, ‘The colors of investors’ money: The role of institutional investors around the world’, Journal of Financial Economics, vol.88, no.3, pp.499-533.
Feroz, EH, Goel, S and Raab, RL 2008, ‘Performance measurement for accountability in corporate governance: A data envelopment analysis approach’, Review of Accounting and Finance, vol.7, no.2, pp.121-130.
264
Feroz, E. H, Kim, S & Raab, RL 2003, ‘Financial Statement Analysis: A Data Envelopment Analysis Approach’, The Journal of the Operational Research Society, vol.54, no.1, pp.48-58.
Feurer, R & Chaharbaghi, K 1994, ‘Defining Competitiveness A Holistic Approach’, Management Decision, vol.32, no.2, pp.49.
Floto, J 2014, ‘Understanding the Politics of Chinese smog’, BBC News China Blog, accessed online on 25th February 2014, http://www.bbc.co.uk/news/blogs-china-blog-26333744.
Fired, HO, Lovell, CAK & Schmidt, SS 2008, The Measurement of Productive Efficiency and Productive Growth’, New York: Oxford University Press.
Fischer, HM & Pollock, TG 2004, ‘Effects of social capital and power on surviving transformational change: The case of initial public offerings’, Academy of Management Journal, vol.47, no.4, pp.463-481.
Flegg, AT & Allen, DO 2009, ‘Congestion in the Chinese automobile and textile industries revisited’, Socio-Economic Planning Sciences, vol.43, no.3, 177-191.
Fleischman, RK & Parker, LD 1991, ‘British entrepreneurs and pre industrial revolution: Evidence of cost management’, The Accounting Review, vol.66, no.2, pp.361-375.
Flint, DJ & Golicic, SL 2009, ‘Searching for competitive advantage through sustainability: A qualitative study in the New Zealand wine industry’, International Journal of Physical Distribution & Logistics Management, vol.39, no.10, pp.841-860.
Flint, P 1998, ‘Measuring carrier cost competitiveness’, Air Transport World, vol.35, no.2, pp.59-62.
Foker, LB 1996, ‘The contribution of quality to business performance’, International Journal of Operations & Production Management, vol.16, no.8, pp.44-62.
Ford Motor Company Posts February U.S. Sales, 2012, Professional Services Close - Up, n/a.
Forughi, SHZ & De Zoysa, A 2012, ‘Australian banks performance during the global financial crisis: an analysis on the efficiency and productivity’.
Forums, CC (2011). Accessed on 15th March 2017: http://www.chinacarforums.com/FAW.html
Fonseka, MM, Yang, X, Tian, GL and Colombage, SR 2015, ‘Political connections, ownership structure and private-equity placement decision: evidence from Chinese listed firms’, Applied Economics, vol.47, no.52, pp.5648-5666.
Foster, G and Gupta, M 1990, ‘Manufacturing overhead cost driver analysis’, Journal of Accounting and Economics, vol.12, pp.309-337.
Foster, G and Swenson, DW 1997, ‘Measuring the success of Activity-Based Cost Management and Its Determinants’, Journal of Management Accounting Research, vol. 9, pp.109.
Frank, MZ and Goyal, VK 2003, ‘Testing the pecking order theory of capital structure’, Journal of Financial Economics, vol.67, no.2, pp.217-248.
265
Frank Qu, Z & Zhao, Z 2014, ‘Evolution of the Chinese rural-urban migrant labor market from 2002 to 2007’, China Agricultural Economic Review, vol.6, no.2, pp.316-334.
Freedman, M & Jaggi, B 1982, ‘Pollution disclosures, pollution performance and economic performance’, Omega, vol.10, no.2, pp.167-176.
Friedlaender, AF, Winston, C and Wang, K 1983, ‘Costs, Technology, and Productivity in the U.S. Automobile Industry’, The Bell Journal of Economics, vol.14(1), pp.1-20.
Fridson, MS and Alvarez, F 2011, Financial statement analysis, Hoboken, N.J.: Wiley.
Fry, FL & Hock, RJ 1976, ‘Who claims corporate responsibility? The biggest and the worst’, Business and society Review, vol.18, no.18, pp.62-65.
Fuchs, C 2006, ‘The implications of new information and communication technologies for sustainability’, Environment, Development and Sustainability, vol.10, no.3, pp.291-309.
Fuchs, ERH, Field, FR, Roth, R & Kirchain, RE 2011, ‘Plastic cars in China? The significance of production location over markets for technology competitiveness in the United States versus the People's Republic of China’, International Journal of Production Economics, vol.132, no.1, pp.79-92.
Fuglister, J 1997, ‘A comparative ratio analysis between Chinese and US firms’, Advances in international Accounting, vol.10, pp.185-206.
Fuss, MA and Waveman, L 1992, Cost and Productivity in Automobile Production: The Challenge of Japanese Efficiency, New York: Cambridge University Press.
Fuss, MA and Waveman, L 1994, ‘Cost and Productivity in Automobile Production The Challenge of Japanese Efficiency’, Journal of Economic Behaviour and Organisation, vol. 24, pp.379-391.
G. RodrÍGuez-PÉRez, J. S., M. SolÀ, M. Torrent, and I. Vilardell 2011, ‘Assessing the Impact of Fair-Value Accounting on Financial Statement Analysis: A Data Envelopment Analysis Approach’, Abacus, vol.47, no.1, pp.61-84.
Gaffikin, MJR 2008, ‘Accounting theory : research, regulation and accounting practice, Frenchs Forest, N.S.W. : Pearson Education.
Gallagher, KS 2003, ‘Foreign technology in China’s automobile industry: implications for energy’, economic development, and environment’, China Environment Series, vol. 6, pp.1-18.
Gallagher, KS 2006, ‘Limits to leapfrogging in energy technologies? Evidence from the Chinese automobile industry’, Energy Policy, vol.34, no.4, pp.383-394.
Gallo, MÁ, Tàpies, J & Cappuyns, K 2004, ‘Comparison of family and nonfamily business: Financial logic and personal preferences’, Family Business Review, vol.17, no.4, pp.303-318.
Gao, P, Sha S, Zipser D and Baan W 2016, ‘Finding the fast lane: Emerging trends in China’s auto market’, Automotive & Assembly’, McKinsey & Company, accessed online on 15th March 2017,
266
http://www.mckinsey.com/industries/automotive-and-assembly/our-insights/finding-the-fast-lane-emerging-trends-in-chinas-auto-market
Garcia-Herrero, a, Gavila, S and Santabarbara, D 2009, ‘What explains the low profitability of Chinese banks?’, Journal of Banking and Finance, vol.33, no.11, pp.2080-2092.
Garvin, DA 1993, ‘Manufacturing Strategic Planning. California Management Review, vol.35, no.4, pp.85-106.
Gatsi, JG, Gadzo, SG, & Akoto, RK 2013, ‘Degree of Financial and Operating Leverage and Profitability of Insurance Firms in Ghana’, International Business and Management, vol. 7, no.2, pp.57-65.
Gedajlovic, E, & Shapiro, DM 2002, ‘ Ownership structure and firm profitability in Japan’, Academy of Management Journal, vol.45, no.3, pp.565-575.
Ghalayini, AM and Noble, JS 1996, ‘The changing basis of performance measurement’, International Journal of Operations & Production Management, vol.16, no.8, pp.63-80.
Gietzmann, MB 1996, ‘Incomplete contracts and the make or buy decision: Governance design and attainable flexibility’, Accounting, Organizations and Society, vol.21, no.6, pp.611-626.
Gillen, D. a. Lall, A 1997, ‘Developing measures of airport productivity and performance: an application of data envelopment analysis’, Transportation Research Part E: Logistics and Transportation Review, vol.33, no.4, pp.261-273.
Gillen, DM, Oum, TH and Tretheway, MW 1985, ‘ Airline Cost and Performance: Implications for Public and Industry Policies’, Vancouver: University of Columbia.
Gleason, KC, Mathur, LK and Mathur, I 2000, ‘The interrelationship between culture, capital structure and performance: evidence from European retailers’, Journal of Business Research, vol.50, no.2, pp.185-191.
Global Automobile Industry analysis Essay, 2017, Accessed online on 15th March 2017: http://www.essay.ws/automobile-industry-analysis-essay/
Godfrey, J. M. (2006). Accounting theory, 6th ed., Milton, Qld. : John Wiley & Sons Australia, 2006.
GOI 1961, ‘3rd Five Year Plan (Chapter 26: Industries)’, Planning Commission, Government of India, New Delhi, accessed on 18th May 2013, http://www.planningcommission.nic.in/plans/planrel/fiveyr/3rd/3planch26.html
GOI 1974, ‘5th Five Year Plan (Annexure 1: Chapter II, para 2.9)’, Planning Commission, Government of India, New Delhi, accessed online on 18th May 2013, http://www.planningcommission.nic.in/plans/planre/fiveyr/5th/5planch7.html.
GOI 2008b, ‘India’s industrial policies from 1948 to 1991’, Office of the Development Commissioner (Small Scale Industries), Ministry of Small Scale Industries, Government of India, New Delhi, accessed online on 18th May 2013, http://www.laghu-udyog.com/policies/iip.htm
267
Goldberg, PK 1995, ‘ Product differentiation and oligopoly in international markets the case of the US automobile industry’, Econometrica, vol. 63, no.4, pp.891-951.
Gombola, MJ and Ketz, JE 1983, ‘Financial Ratio Patterns in Retail and Manufacturing Organizations’, Financial Management, vol.12, no.2, pp.45-56.
Good, DH, Nadiri, MI, Roller, L and Sickless, RC 1993, ‘Efficiency and productivity growth comparisons of European and U.S. air carriers a first look at the data’, The Journal of Productivity Analysis, vol. 4, pp.115-125.
GOVINDARAJAN, V 1988, ‘A contingency approach to strategy implementation at the business unit level Integrating administrative mechanisms with strategy’, Academy of Management Journal, vol.31, no.4, pp.826-853.
Graham, JR 2000, ‘How big are the tax benefits of debt?’, The Journal of Finance, vol.55, no.5, pp.1901-1941.
Graham, JR, Li, S and Qiu, J 2008, ‘Corporate misreporting and bank loan contracting’, Journal of Financial Economics, vol. 89, no.1, pp.44-61.
Gray, J 2015, False dawn: the delusions of global capitalism, London:Granta.
Grossman, SJ & Hart, OD 1980, ‘ Takeover Bids, The Free-Rider Problem, and the Theory of the Corporation, 42.
Grossman, SJ and Hart, OD 1982, Corporate Financial Structure and Managerial Incentives: University of Chicago Press.
Grumbine, E 2007, ‘Chinas emergence and the prospects for global sustainability’, Bioscience, vol.57, no.3, pp.249.
Gompers, P,Ishii J, and Metrick A 2003, ‘Corporate governance and equity prices’, Quarterly Journal of Economics, vol.118, no.1, pp.107-155.
Guajardo, JA, Cohen, MA and Netessine, S 2015, ‘Service Competition and Product quality in the US automobile Industry’, Management science, vol.62, no.7, pp.1860-1877.
Gugler, K, Mueller, DC, Yurtoglu, BB and Zulehner, C 2003, ‘The effects of mergers: an international comparison’, International journal of industrial organization, vol.21, no.5, pp.625-653.
Gujarati, D and Porter, D 2003, ‘Multicollinearity: What happens if the repressors are correlated’, Basic Econometrics, pp.363.
Gul, FA, Kim, JB, & Qiu, AA 2010, ‘ Ownership concentration, foreign shareholding, audit quality, and stock price synchronicity: Evidence from China’, Journal of Financial Economics, vol.95, no.3, pp.425-442.
Gupta, PD, Guha, S & Krishnaswami, SS 2013, ‘ Firm growth and its determinants’, Journal of Innovation and Entrepreneurship, vol.2, no.1, pp.1.
Hadian, E and Ha, AA 2004, ‘ Measuring the Efficiency of the Iranian Banking System Using DEA Approach’, Quarterly Iranian Economic Researches, vol.20, pp.1-25.
Halim, SA, Jaafar, M & Osman, O 2011 Measuring the Efficiency of the Iranian Banking System Using DEA Approach Assessment of the Financial Health of
268
Malaysian Construction Firms using Financial Ratio Analysis’, International Journal of Academic Research, vol. 3, no.1.
Halkos, GE & Tzeremes, NG 2012, ‘ Industry performance evaluation with the use of financial ratios: An application of bootstrapped DEA’, Expert Systems with Applications, vol.39, no.5, pp.5872-5880.
Han, C, Porterfield, T & Li, X 2012, ‘Impact of industry competition on contract manufacturing: An empirical study of U.S. manufacturers’, International Journal of Production Economics, vol.138, pp.159-169.
Hansen, DR and Mowen MM 2013, Cornerstones of Cost Management, 2nd ed., Mason, Ohio: South-Western Cengage Learning.
Hadlock, CJ and James, CM 2002, ‘Do banks provide financial slack?’, the Journal of Finance, vol.57, no.3, pp.1383-1419.
Hartono, GC & Utami, SR 2016,’The Comparison of Sustainable Growth Rate, Firm’s Performance and Value among the Firm in Sri Kehati Index and IDX30 Index in Indonesia Stock Exchange’, International Journal of Advanced Research in Management and Social Sciences, vol.5, no.5, pp.68-81.
Harwit, E 1995, ‘ China's Automobile Industry: Policies, Problems, and Prospects,1st ed.,New York: M.E. Sharpe Inc.
Harwit, E 2001, ‘The Impact of WTO Membership on the Automobile in China’, China Quarterly.
Hass, EA 1987, ‘Breakthrough Manufacturing’, Harvard Business Review.
Haugh, D, Mourougane, A and Chatal, O 2010, ‘Automobile Industry in and Beyond Crisis’, OECD, Economics Department Working Papers, no.745.
He H., Huang, F., Liu, Z. and Zhu, D, 2015, ‘Breaking the Iron Rice Bowl: evidence of Precaustionary savings from Chinese state-owned Enteprises reform 1’, Accessed online on 8th June 2016, http://www.bankofcanada.ca/wp-content/uploads/2015/05/Zheng-Liu-Slides.pdf
He, K, Pan, X & Tian, GG 2016, Legal liability, Government intervention, and auditor behaviour: Evidence from structural reform of audit firms in China: Research Online.
He, X & Mu, Q 2012, ‘How Chinese firms learn technology from transnational corporations: A comparison of the telecommunication and automobile industries’, Journal of Asian Economics, vol.23, no.3, pp.270-287.
Healy, PM & Palepu, KG 2012, ‘Business Analysis Valuation: Using Financial Statements: Cengage Learning.
Henderson, BB & Kingwell, RS 2002, ‘An Investigation of the Technical and Allocative Efficiency of Broadacre Farmers. Paper presented at the Conference (46th), Canberra from Australian Agricultural and Resource Economics Society. Australia.
Heytens, P 2003, ‘State enterprise reforms. Tseng, Wanda; Rodlauer, Markus (Hg.): China-Competing in the global Economy. Washington, DC: International Monetary Fund, pp.124-148.
269
Hill, RC 1989, ‘Comparing transnational production systems: the automobile industry in the USA and Japan’, International Journal of Urban and Regional Research, vol.13, no.3, pp.462-480.
Holderness, CG 2009, ‘The myth of diffuse ownership in the United States’, Review of Financial Studies, vol.22, no.4, pp.1377-1408.
Holderness, CG & Sheehan, DP 1988, ‘The role of majority shareholders in publicly held corporations: An exploratory analysis‘, Journal of Financial Economics, vol.20, pp.317-346.
Hopwood, AG 2008, ‘Management Accounting Research in a Changing World’, Journal of Management Accounting Research, Twenty, pp.3-13.
Horngren, CT, Datar, SM, Foster, G, Rajan, M and Ittner, C 2009, Cost Accounting: A Managerial Emphasis, 13th ed., New Jersey: Pearson Prentice Hall.
Horrigan, JO 1965, ‘Some Empirical Bases of Financial Ratio Analysis’, The Accounting Review, vol.40, no.3, pp.558-568.
Howatt, B, Zuber, RA, Gandar, JM & Lamb, RP 2009, ‘Dividends, earnings volatility and information’, Applied Financial Economics, vol.19, no.7, pp. 551-562.
Howes, C and Singh, A 2000, ‘Competitiveness Matters : Industry and Economic Performance in the U. S.’,USA University of Michigan Press
Huafang, X, & Jianguo, Y 2007, ‘Ownership structure, board composition and corporate voluntary disclosure: Evidence from listed companies in China’, Managerial Auditing Journal, vol.22, no.6, pp.604-619.
Huang, RD and Shiu, CY 2009, ‘Local effects of foreign ownership in an emerging financial market: Evidence from qualified foreign institutional investors in Taiwan’, Financial Management, vol.38, no.3, pp.567-602.
Humphery-Jenner, ML & Powell, RG 2011, ‘Firm size, takeover profitability, and the effectiveness of the market for corporate control: Does the absence of anti-takeover provisions make a difference?’, Journal of Corporate Finance, vol.17, no.3, pp.418-437.
IBISWorld Industry Report – Auto Parts Manufacturing in China, 2016, accessed online on 15th March 2017,
https://www.ibisworld.com/industry/china/auto-parts-manufacturing.html
Ichiko, F 2005, ‘Toyota's production line leads from lab to road’, Nature, vol.415, no.7045, pp.1026.
India Corporate Tax Rate, 2017, Trading Economics, accessed on 15th March 2017: http://trdingeconomics.com/India/corporate-tax-rate
Ingram, RW & Frazier, KB 1980, ‘Environmental performance and corporate disclosure’, Journal of Accounting Research, pp.614-622.
Inyang, HI, Schwarz, PM & Mbamalu, GE 2009, ‘Sustaining sustainability: Approaches and contexts’, Journal of Environmental Management, vol.90, no.12, pp.3687-3689.
270
Ittner, CD, Larcker, DF, Nagar, V and Rajan, MV 1999, ‘Supplier selection, monitoring practices, and firm performance’, Journal of Accounting and Public Policy, vol.18, pp.253-281.
J. Contractor, F 2013, ‘Punching above their weight” The sources of competitive advantage for emerging market multinationals’, International Journal of Emerging Markets, vol.8, no.4, pp.304-328.
Jackson, TW 2007, ‘Customer value exchange’, Journal of Financial Services Marketing, vol. 11, no.4, pp.314-332.
Jacobs, M, Droge, C, Vickery, SK & Calantone, R 2011, ‘Product and process modularity's effects on manufacturing agility and firm growth performance’, Journal of Product Innovation Management, vol.28, no.1, pp.123-137.
Jacobson, R & Hanson, G 2001, ‘Modelling the Competitive Process’, Managerial and Decision Economics, vol.22, pp.251-263.
Jahan, H 2013, Towards sustainable development of shrimp farming in Bangladesh: The Economy versus the Environment.
Jain, S, Triantis, KP & Liu, S 2011, ‘Manufacturing performance measurement and target setting: A data envelopment analysis approach’, European Journal of Operational Research, vol.214, no.3, pp.616-626.
Jamali, AH & Asadi, A 2012, ‘Management efficiency and profitability in Indian automobile industry: from theory to practice’, Indian Journal of Science and Technology, vol.5, no.5, pp.2779-2781.
Jaruzelski, B, Schwartz, K and Staack V 2015, ‘Innovations’ New World Order’, Strategy and Business, Iss. 81, pp.2-16.
Jenkins, H & Yakovleva, N 2006, ‘Corporate social responsibility in the mining industry: Exploring trends in social and environmental disclosure’, Journal of Cleaner Production, vol.14, no.3, pp. 271-284.
Jensen, MC & Meckling, WH 1976, ‘Theory of the firm: Managerial behaviour, agency costs and ownership structure’, Journal of Financial Economics, vol. 3, no.4, pp.305-360.
Jiang, BB, Laurenceson, J and Tang, KT 2008, ‘Share reform and performance of China’s listed companies’, China Economic Review, vol.19, no.3, pp.489-501.
Jin, L & Myers, SC 2006, ‘R 2 around the world: New theory and new tests’, Journal of Financial Economics, vol.79, no.2, pp.257-292.
Joe, Z & Zhao-Han, S 1995, ‘A discussion of testing DMUs' returns to scale’, European Journal of Operational Research, vol.81, no.3, pp. 590-596.
Joh, SW 2003, ‘Corporate governance and firm profitability: evidence from Korea before the economic crisis’, Journal of Financial Economics, vol. 68, no.2, pp.287-322.
Johnson, C 1982, ‘MITI and the Japanese miracle’, Stanford: Stanford University Press.
Johnson, G and Scholes, K 1993, Exploring Corporate Strategy, Text and Cases, London: Prentice Hall.
271
Johnson, HT 1975a, ‘Management Accounting in an Early Integrated Industrial: E.I. DuPont de Nemours Powder Company’, Business History Review, pp.1903-1912.
Johnson, HT 1978, ‘Management Accounting in an Early Multidivisional Organization: General Motors in the 1920s’, Business History Review, pp.490-517.
Johnson, HT and Kaplan, RS 1991, The Relevance Lost: The Rise and Fall of Management Accounting. Massachusetts: Harvard Business School Press.
Johnson, MD, Nader, G and Fornell, C 1996, ‘Expectations, perceived performance and customer satisfaction for a complex service: the case of bank loans’, Journal of Economic Psychology, vol.17, no.2, pp.163-182.
Johnson, S, Boone, P, Breach, A & Friedman, E 2000, ‘Corporate governance in the Asian financial crisis’, Journal of Financial Economics, vol.58, no.1, pp.141-186.
Jones, DT and Womack, JP 1985, ‘Developing countries and the future of the automobile industry’, World Development, vol.13, no.3, pp.393-407.
Jordan, E, Gross, ME, Javernick-Will, AN and Garvin, MJ 2011, ‘Use and misuse of qualitative comparative analysis’, Construction Management and Economics, vol.29, no.11, pp.1159-1173.
Joshi, D, Nepal, B, Rathore, APS & Sharma, D 2013, ‘On supply chain competitiveness of Indian automotive component manufacturing industry’, International Journal of Production Economics, vol.143, no.1, pp.151-161.
Ju, M, Zhou, K. Z, Gao, G. Y & Lu, J 2013, ‘Technological capability growth and performance outcome: Foreign versus local firms in China’, Journal of International Marketing, vol.21, no.2, pp.1-16.
Klock, MS, Mansi, SA and Maxwell, WF 2005, ‘Does corporate governance matter to bondholders?’, Journal of Financial and Quantitative Analysis, pp.693-719.
Kapelko, M, & Lansink, AO 2017, ‘Dynamic multi-directional inefficiency analysis of European dairy manufacturing firms’, European Journal of Operational Research, vol.257, no.1, pp.338-344.
Kaplan, RS 1983, ‘Measuring Manufacturing Performance: A New Challenge for Managerial Accounting Research’, The Accounting Review, vol.LVIII, no.4, pp.686-705.
Kaplan, RS 1984, ‘The Evolution of Management Accounting’, The Accounting Review, vol.LIX, no.3, pp.390-418.
Kaplan, RS 1990, ‘Measures for Manufacturing Excellence’, Boston, MA: Harvard Business School Press.
Kaplan, RS & Norton, DP 1992, ‘The balanced scorecard: Measures that drive performance’, Harvard Business Review, vol.70, no.1, pp.71-79.
Kathuria, S 1996, ‘Competing through technology and manufacturing: A study of the Indian commercial vehicles industry’, USA: Oxford University Press.
Kay, JA & Thompson, DJ 1986, ‘Privatisation: a policy in search of a rationale’, The Economic Journal, vol. 96, no.381, pp.18-32.
272
Ke, J & Diao, Z 2016, ‘Chinese Automotive Industry Performance Evaluation of Each Month in 2014 via DEA’, International Journal of u-and e-Service, Science and Technology, vol.9, no.6, pp.193-200.
Kearney, A 2013, The Contribution of the Automobile Industry to Technology and Value Creation.
Ketkar, KW, Noulas, AG and Agarwal, MM 2003, ‘An analysis of efficiency and productivity growth of the Indian banking sector’, Finance India, 17, no.2, pp. 511-521.
Ketokivi, M, Turkulainen, V, Seppälä, T, Rouvinen, P & Ali-Yrkkö, J 2017, ‘Why locate manufacturing in a high-cost country? A case study of 35 production location decisions’, Journal of Operations Management.
Khana, N and Tice, S 2005, ‘Pricing, exit, and location decisions of firms: Evidence on the role of debt and operating efficiency’, Journal of Financial Economics, vol.75, no.2, pp.397-427.
Kim, J & Yi, C 2009, ‘Foreign versus domestic institutional investors: who contribute more to stock price informativeness?’, Korean evidence’ City University of Hong Kong and The Hong Kong Polytechnic University, Unpublished working paper.
Kim, JB & Yi, CH 2006, ‘Ownership structure, business group affiliation, listing status, and earnings management: Evidence from Korea’, Contemporary Accounting Research, vol.23, no.2, pp.427-464.
Kim, JB & Shi, H 2008, ‘International financial reporting standards, analyst following, institutional infrastructure, and stock price synchronicity around the world: Working Paper, The Hong Kong Polytechnic University.
King, MR and Santor, E 2008, ‘Family values: Ownership structure, performance and capital structure of Canadian firms’, Journal of Banking & Finance, vol.32, no.11, pp.2423-2432.
Klepper, S 2002, ‘The capabilities of new firms and the evolution of the US automobile industry’, Industrial and Corporate Change, vol. 11, no.4, pp. 645-666.
Kmenta, J. 1986, ‘Elements of Econometrics’, 2nd ed, Macmillan, New York, p.431.
Kojima, S and Kaplinsky, R 2004, ‘The use of a lean production index in explaining the transition to global competitiveness: The auto components sector in South Africa’, Technovation, vol. 24 (pp.199-206).
Kole, SR 1995, ‘Measuring managerial equity ownership: a comparison of sources of ownership data’, Journal of Corporate Finance, vol.1, no.3, pp.413-435.
Kolter, P 1988, ‘Marketing Management: Analysis, Planning, Implementation and Control (6th ed.). Englewood Cliffs, NJ: Prentice-Hall.
Koopmans, TC 1951, Activity Analysis of Production and Allocation, New York: Wiley.
Kornai, J 1986, ‘The soft budget constraint’, Kyklos, vol.39, no.1, pp.3-30.
Kornai, J, Maskin, E & Roland, G 2003, ‘Understanding the soft budget constraint’, Journal of economic literature, vol.41, no.4, pp.1095-1136.
273
Krivonozhko, VE, Piskunov, AA & Lychev, AV 2011, ‘On comparison of ratio analysis and data envelopment analysis as performance assessment tools’, IMA Journal of Management Mathematics, vol.22, no.4, pp.357-370.
Kulkarni, T 2016, ‘Indian surpasses China in passenger car exports”, Auto Car Pro, accessed on 15th March, 2016: http://www.autocarpro.in/analysis-reports/india-surpasses-china-passenger-car-exports-20221
Kumar, J 2004, ‘Does ownership structure influence firm value? Evidence from India’, The Journal of Entrepreneurial Finance and Business Ventures, vol.9, no.2, pp.61-93.
Kumar, S & Bhatia, GK 2014, ‘Financial performance of Indian automobile companies after liberalization: A comparative study of Maruti Suzuki and Tata Motors’, International Journal of Advanced Research in Management and Social Sciences, vol.3, no.9, pp.186-195.
Kyereboah‐Coleman, A 2007, ‘The impact of capital structure on the performance of microfinance institutions’, The Journal of Risk Finance, vol.8, no.1, pp.56-71.
Lang, L, Ofek, E & Stulz, R 1996, ‘Leverage, investment, and firm growth’, Journal of Financial Economics, vol.40, no.1, pp.3-29.
Lang, LH, Stulz, R & Walkling, RA 1989, ‘Managerial performance, Tobin's Q, and the gains from successful tender offers’, Journal of Financial Economics, vol. 24, no.1, pp.137-154.
Laosirihongthong, T, Paul, H and Speece, M 2003, ‘Evaluation of new manufacturing technology implementation: an empirical study in the Thai automotive industry’, Technovation, vol.23, pp. 321-331.
Lau, RSM 2002, ‘Competitive factors and their relative importance in the US electronics and computer industries’, Internal Journal of Operations & Production Management, vol.22, no.1, pp.125-135.
Lau, RSM and Hurley, C.N 1997, ‘Outsourcing through strategic alliances’, Production and Inventory Management Journal, vol.18, no.2, pp.6-10.
Lauterbach, B and Vaninsky, A 1999, ‘Ownership structure and firm performance: Evidence from Israel’, Journal of Management and Governance, vol.3, no.2, pp.189-201.
Lebreton, B & Tuma, A 2006, ‘A quantitative approach to assessing the profitability of car and truck tire remanufacturing’, International Journal of Production Economics, vol.104, no.2, pp. 639-652.
Lee, HS and Anderson, BB 2006, ‘Automobile Industry in China and India: Backgrounds, Trends and Perspectives’, The Business Review, 6(1), pp.308.
Lee, K-H 2011, ‘Integrating carbon footprint into supply chain management: the case of Hyundai Motor Company (HMC) in the automobile industry’, Journal of Cleaner Production, vol.19, no.11, pp.1216-1223.
Lehman, C & Tinker, T 1987, ‘The “real” cultural significance of accounts’, Accounting, Organizations and Society, vol.12, no.5, 503-522.
Leibenstein, H 1966, ‘Allocative efficiency vs." X-efficiency"’, The American Economic Review, 56, no.3, pp.392-415.
274
Leibenstein, H 1966, ‘Incremental capital-output ratios and growth rates in the short run’, The Review of Economics and Statistics, pp.20-27.
Lemmon, ML & Lins, KV 2003, ‘Ownership structure, corporate governance, and firm value: Evidence from the East Asian financial crisis’, The Journal of Finance, vol.58, no.4, pp.1445-1468.
Leong, GK, Snyder, DL & Ward, PT 1990, ‘Research in the process and content of manufacturing strategy’, Omega, vol.18, no.2, pp.109-122.
Levy, B 1991, ‘Transactions costs, the size of firms and industrial policy: Lessons from a comparative case study of the footwear industry in Korea and Taiwan’, Journal of Development Economics, vol.34, pp.151-178.
Li, D, Tang, T, Hu, D, Song, F & Luo, L 2017, ‘The challenge to china’s enterprises from increasing labour costs: the product quality perspective’, China Economic Journal, vol.10, no.1, pp.18-33.
Li, H, Meng, L, Wang, Q & Zhou, L-A 2008, ‘Political connections, financing and firm performance: Evidence from Chinese private firms’, Journal of Development Economics, vol.87, no.2, pp. 283-299.
Li, K, Yue, H & Zhao, L 2009, ‘Ownership, institutions, and capital structure: Evidence from China’, Journal of Comparative Economics, vol.37, no.3, pp.471-490.
Li, L 2000, ‘An analysis of sources of competitiveness and performance of Chinese manufacturers’, International Journal of Operations & Production Management.
Liang, X, Lin, L and Wu, G, Liang, X, Lin, L and Wu, G 2009, ‘Evolution of the Chinese Automobile Industry form a Sectoral System of Innovation Perspective’, Industry and Innovation, vol.16, no.4-5, pp. 463-478.
Lie, E 2005, ‘Financial flexibility, performance, and the corporate payout choice’, The Journal of Business, vol.78, no.6, pp.2179-2202.
Lie, E 2005, ‘Operating performance following dividend decreases and omissions’, Journal of Corporate Finance, vol. 12, no.1, pp.27-53.
Li-Hua, R and Simon, D 2007, ‘Benchmarking China firm competitiveness: a strategic framework’, Journal of Technology Management in China, vol. 2, no.2, pp.105-105.
Liker, JK and Wu, YC 2000, ‘Japanese Automakers, U.S. Suppliers and Supply-Chain Superiority’, MIT Sloan Management Review, vol.42, no.1, pp.81-93.
Lillis, AM 2002, ‘Managing multiple dimensions of manufacturing performance ‚Äî an exploratory study’, Accounting, Organizations and Society, 27, no.6, pp.497-529.
Lin, JC, Hu,J. L and Sung, KL 2005, ‘The Effect of Electronic Banking on the Cost Efficiency of Commercial Banks: An Empirical Study’, International Journal of Management, vol.22, no.4, pp.605-611.
Lin, JY & Li, Z 2008, ‘Policy burden, privatization and soft budget constraint’, Journal of Comparative Economics, vol.36, no.1, pp.90-102.
275
Lin, X & Germain, R 2003, ‘Organizational structure, context, customer orientation, and performance: lessons from Chinese state‐owned enterprises’, Strategic Management Journal, vol.24(11), pp.1131-1151.
Lins, KV 2003, ‘Equity ownership and firm value in emerging markets’, Journal of Financial and Quantitative analysis, vol.38, no.01, pp.159-184.
LiPuma, JA, Newbert, SL & Doh, JP 2013, ‘The effect of institutional quality on firm export performance in emerging economies: a contingency model of firm age and size’, Small Business Economics, vol.40, no.4, pp.817-841.
Liu, J & Tylecote, A 2009, ‘Corporate Governance and Technological Capability Development: Three Case Studies in the Chinese Auto Industry’, Industry and Innovation, vol.16, no.4-5, pp.525-544.
Liu, Y.-C & Chen, Y.-H 2016, ‘Which One is More Efficient? German or Japanese Automobile Industry: A Meta-frontier with Technology Gap Comparison’, International Business Research, vol.9, no.10, pp.13.
Li, Y 2010, ‘The relationship of governance regulation and performance of small corporations in the manufacturing industry in Australia’, Faculty of Business and Law, Candidature Proposal.
Loderer, CF and Waelchi, U 2010, ‘Firm age and performance’, accessed on 15th August 2016, https://papers.ssrn.com/sol3/papers.cfm?abstract_id=1342248
Loderer, CF and Waelchi, U 2010, ‘Protecting minority shareholders: Listed versus unlisted firms’, Financial Management, vol.39, no.1, pp.33-57.
Luthra, S, Kumar, V, Kumar, S and Haleem, A 2011, ‘Barriers to implement green supply chain management in automobile industry using interpretive structural modelling technique: An Indian perspective’, Journal of Industrial Engineering and Management, vol.4, no.2, pp.231-257.
Lynch, C 1965, China: One Fourth of the World, Toronto: McClelland and Stewart.
Lyons, TF, Krachenberg, A. R, Henke, John W and Jr. 1990, ‘Mixed Motive Marriages: What's Next for Buyer-Supplier Relations’, Sloan Management Review, vol.31, no.3, pp. 29-29.
Maani, KE, Putterill, MS and Sluti, DG 1994, ‘Empirical analysis of quality improvement in manufacturing’, The International Journal of Quality & Reliability Management, vol.11, no.7, pp.19-19.
Ma, H and Bi, J 2011, ‘China, Set to Add 220 Million Vehicles, Aims to Green Transportation Sector’, Revolt, accessed on 18th August 2016: http://blogs.worldwatch.org/revolt/china-aims-to-green-transportation-sector/
Mahidhar, V and Giffi, C, Kambil, A and Alvanos, R 2009, ‘Rethinking emerging market strategies: From off shoring to strategic expansion’, Deloitte Review.
Majumdar, SK 2004, ‘The hidden hand and the license raj to an evaluation of the relationship between age and the growth of firms in India’, Journal of Business Venturing, vol.19, no.1, pp.107-125.
Majumdar, SK & Chhibber, P 1999, ‘Capital structure and performance: Evidence from a transition economy on an aspect of corporate governance’, Public choice, vol.98, no.3-4, pp.287-305.
276
Manello, A, Calabrese, GG & Frigero, P 2016, ‘Technical efficiency and productivity growth along the automotive value chain: evidence from Italy’, Industrial and Corporate Change, vol.25, no.2, pp.245-259.
Mao, W & Koo, WW 1997, ‘Productivity growth, technological progress, and efficiency change in Chinese agriculture after rural economic reforms: a DEA approach’, China Economic Review, vol.8, no.2, pp.157-174.
Margaritis, D & Psillaki, M 2007, ‘Capital Structure and Firm Efficiency’, Journal of Business Finance & Accounting, vol.34, no.9-10, pp.1447-1469.
Margaritis, D & Psillaki, M 2010, ‘Capital structure, equity ownership and firm performance’, Journal of Banking & Finance, vol. 34, no.3, pp. 621-632.
Marion, TJ, Thevenot, HJ & Simpson, TW 2007, ‘A cost-based methodology for evaluating product platform commonality sourcing decisions with two examples’, International Journal of Production Research, vol.45, no.22, pp.5285-5308.
Maritz, A & Shieh, C.-J 2013, ‘Performance analysis of automobile industry in Taiwan with data envelopment analysis’, International Journal of Applied Mathematics and Statistics™, vol.38, no.8, pp. 84-95.
Martin, S & Parker, D 1995, ‘Privatization and economic performance throughout the UK business cycle. Managerial and Decision Economics, vol.16, no.3, pp.225-237.
Martin, S & Parker, D 2003, ‘The Impact of Privatization: Ownership and Corporate Performance in the United Kingdom’: Routledge.
Market Summary Australia, 2016, ‘Asia-Pacific Small Business Survey 2016,CPA Australia.
Matthews, K 2013, ‘Risk management and managerial efficiency in Chinese banks: A network DEA framework’, Omega, vol.41, no.2, pp.207-215.
Maug, E 1998, ‘Large shareholders as monitors: is there a trade‐off between liquidity and control? The Journal of Finance, vol.53, no.1, pp.65-98.
Mazumder, R & Adhikary, M 2010, ‘Measuring technical efficiency in the Indian automobile industry’, South Asia Economic Journal, vol.11, no.1, pp.53-67.
McCaleb, A 2015, ‘China’s automobile industry: development, policies, internationalization’, Gdańskie Studia Azji Wschodniej, no.8, pp.163-172.
McConnell, JJ & Servaes, H 1990, ‘Additional evidence on equity ownership and corporate value’, Journal of Financial Economics, vol.27, no.2, pp.595-612.
McConnell, JJ & Servaes, H 1995, ‘Equity ownership and the two faces of debt’, Journal of Financial Economics, vol.39, no.1, pp.131-157.
Mckinsey, 2015, ‘A road map to the future for the auto industry’, Mckinsy Quarterly, October, accessed online on 21st July 2015: http://www.mckinsey.com/industries/automotive-and-assembly/our-insights/a-road-map-to-the-future-for-the-auto-industry
277
McTeer, MM and Dale, BG 1994, ‘Are the ISO9000 series of quality management system standards of value to small companies’, European Journal of Purchasing and Supply Management, vol. 1, no.4, pp.227-235.
Megginson, WL, Nash, RC & Randenborgh, M 1994, ‘The financial and operating performance of newly privatized firms: An international empirical analysis’, The Journal of Finance, vol.49, no.2, pp.403-452.
Megginson, WL and Netter, JM 2001, ‘From state to market: A survey of empirical studies on privatization’, Journal of Economic Literature, vol.39, pp.321-389.
Mesquita, JMC and Lara JE 2003, ‘Capital structure and profitability: the Brazilian case,’ Academy of Business and Administration Sciences Conference, Vancouver, July 11-13.
Ministry of Industry and Information Technology of the People’s Republic of China (miit), 2016, accessed on 31st March 2016, http://www.miit.gov.cn/
Miles, RE and Snow, CC 1978, ‘Organizational Strategy, Structure and Process’, New York: McGraw-Hill.
Miller, SM & Noulas, AG 1996, ‘The technical efficiency of large bank production’, Journal of Banking & Finance, vol.20, no.3, pp.495-509.
Min, H & Seong Jong, J 2006, ‘Benchmarking the operational efficiency of third party logistics providers using data envelopment analysis’, Supply Chain Management, vol.11, no.3, pp.259-265.
Mohan, TR & Ray, SC 2004, ‘Comparing performance of public and private sector banks: a revenue maximisation efficiency approach’, Economic and political weekly, pp.1271-1276.
Mok, V, Yeung, G, Han, Z & Li, Z 2007, ‘Leverage, Technical Efficiency and Profitability: an application of DEA to foreign-invested toy manufacturing firms in China’, Journal of Contemporary China, vol.16, no.51, pp.259-274.
Mondal, WI 2011, ‘Entrepreneurship In U.S. Auto Industry: Ford Stays Ahead’, Journal of Business Case Studies, vol.7, no.1, pp. 31-37.
Montgomery, CA 1985, ‘Academy of Management Journal, vol.28, no.4, pp.789-798.
Moosa, I 2016, Exchange rate forecasting: techniques and applications: Springer.
Morrison, WM 2012, ‘China's economic conditions’, Current Politics and Economics of Northern and Western Asia, vol.21, no.3/4, pp.289.
Morrison, WM 2014, ‘China's economic rise: history, trends, challenges, and implications for the United States’, Current Politics and Economics of Northern and Western Asia, vol.23, no.4, pp. 493.
Murakami, N, Liu, D & Otsuka, K 1994, ‘Technical and allocative efficiency among socialist enterprises: The case of the garment industry in China’, Journal of Comparative Economics, vol.19, no.3, pp.410-433.
Myers, SC 1977, ‘Determinants of corporate borrowing’, Journal of Financial Economics, vol.5, no.2, pp.147-175.
Nahm, J & Steinfeld, ES 2014, ‘Scale-up nation: China’s specialization in innovative manufacturing’, World Development, vol.54, pp.288-300.
278
Nakane, J 1986, ‘Manufacturing Futures Survey in Japan: A Comparative Survey 1983-1986’, Tokyo: System Science Institute.
Narins, TP 2016, ‘Evaluating Chinese Economic Engagement in Africa versus Latin America’, Geography Compass, vol.10, no.7, pp.283-292.
Naughton, B 2007, The Chinese Economy: Transitions and Growth, Cambridge, Massachusetts:The MIT Press.
Neef, A, Kask, C and Sparks, C 1993, ‘International comparisons of manufacturing unit labor costs’, Monthly Labor Review, vol. 116, no.12, pp.47.
Nesbitt, SL 1994, ‘Long-term Rewards from Shareholder activism: A study of the “Call Effect”, Journal of Applied Corporate Finance, vol.6, no.4, pp.75-80.
Neu, D, Warsame, H & Pedwell, K 1998, ‘Managing public impressions: environmental disclosures in annual reports’, Accounting, Organizations and Society, vol. 23, no.3, pp.265-282.
Neuman, WL 2011, Social research methods: qualitative and quantitative approaches, Boston: Pearson.
Niedermeyer, E 2014, ‘How China protects its Auto Industry’, Bloomberg View, accessed online on 20th August 2017: https://www.bloomberg.com/view/articles/2014-08-15/how-china-protects-its-auto-industry
Niresh, A & Thirunavukkarasu, V 2014, ‘Firm size and profitability: A study of listed manufacturing firms in Sri Lanka’, International Journal of Business and Management, vol.9, no.4.
Nissim, D & Ziv, A 2001, ‘Dividend changes and future profitability’, The Journal of Finance, vol.56, no.6, pp. 2111-2133.
Nolan, P 2002, ‘China and global business revolution’, Cambridge Journal of Economics, vol.26, pp.119-137.
Norouzi, A, Jafarizadeh, AA, Karbalaei, M & Najafi, Y 2013, ‘The effective major factors on customer perceived value in service context: The application of ANFIS method’, European Online Journal of Natural and Social Sciences, vol. 2, no.3, pp.408.
Odeck, J and Brathen, S 2012, ‘A meta-analysis of DEA and SFA studies of the technical efficiency of seaports: A comparison of fixed and random-effects regression models’, Transportation Research Part A: Policy and Practice, vol.46, no.10, pp.1574-1585.
Oh, I, Lee, J-D, Hwang, S & Heshmati, A 2010, ‘Analysis of product efficiency in the Korean automobile market from a consumer’s perspective’, Empirical Economics, vol.38, no.1, pp.119-137.
Olujide, JO 2000, ‘Exposure to financial ratio analyses of three operating firms in the beer industry in Nigeria’, Journal of Financial Management & Analysis, vol.13, no.1, pp.69.
Oosterloo, S, De Haan, J and Jong-A-Pin, R 2007, ‘Financial stability reviews: A first empirical analysis’, Journal of Financial Stability, vol.2, no.4, pp.337-355.
279
Organisation Internationale des Constructeurs d’Automobiles (OICA), 2016, accessed online on 15th March 2017, http://www.oica.net/
Orsato, RJ, & Wells, P 2007, ‘The Automobile Industry & Sustainability’, Journal of Cleaner Production, vol.15, no.11-12, pp.989-993.
Orsato, RJ & Wells, P 2007, ‘U-turn: the rise and demise of the automobile industry’, Journal of Cleaner Production, vol.15, no.11-12, pp.994-1006.
Osterman, P 1994, ‘Supervision, Discretion, and Work Organization’, The American Economic Review, vol.84, no.2, pp.380-384.
Oum, TH & Zhang, Y 1995, ‘Competition and allocative efficiency: the case of the US telephone industry’, The Review of Economics and Statistics, pp.82-96.
Oum, TH and Yu, C 1998, ‘Cost competitiveness of major airlines: an international comparison’, Transportation Research Part A: Policy and Practice, vol.32, no.6, pp.407-422.
Ouma, OP 2012, ‘The relationship between dividend payout and firm performance: a study of listed companies in Kenya’, European scientific journal, vol.8(9).
Palepu, K, Healy, P, Bernard, V, Wright, S, Bradbury, M and Lee, P 2010, Business Analysis and Valuation: Using Financial Statements, 1st ed., Cengage Learning.
Pan, X & Tian, GG 2013, ‘Does bank ownership imply efficient monitoring? Evidence from bank lending and firm investment efficiencies in China’, Paper presented at the 26th Australasian Finance and Banking Conference.
Pandey, I 2005, What drives the shareholder value? : Citeseer.
Papahristodoulou, C 1997, ‘A DEA model to evaluate car efficiency’, Applied Economics, vol.29, no.11, pp.1493-1508.
Parahalad, CK 1999, ‘Changes in the competitive battlefield’, Financial Times.
Parthasarathy, G, Hart, R, Jamro, E & Miner, L 2005, ‘Value of sustainability: perspectives of a chemical manufacturing site’, Clean Technologies and Environmental Policy, vol.7, no.3, pp.219-229.
Pastor, L and Veronesi, P 2003, ‘Stock prices and IPO waves’, National Bureau of Economic Research.
Patra, T and Rao, MJ 2016, ‘Technology Adoption and Growth of Firms during Post Liberalisation: A Study of Indian Automobile Industry’, Journal of Applied Economics & Business Research, vol.6, no.3.
Pauwels, K, Silva-Risso, J, Srinivasan, S & Hanssens, DM 2004, ‘New Products, Sales Promotions, and Firm Value: The Case of the Automobile Industry’, pp.142.
Payne, BC 2011, ‘On the financial characteristics of firms that initiated new dividends during a period of economic recession and financial market turmoil’, Journal of Economics and Finance, vol.35, no.2, pp.149-163.
Payne, A, Storbacka, K and Frow, P 2009, ‘Co-creating brands: Diagnosing and designing the relationship experience’, Journal of Business Research, vol.62, iss.3, pp.379-389.
280
Peng, MW & Luo, Y 2000, ‘Managerial ties and firm performance in a transition economy: The nature of a micro-macro link’, Academy of Management Journal, vol.43, no.3, pp.486-501.
People’s Bank of China (PBC) 2016, ‘Transcript of Governor Zhou’s Xiaochuan’s press conference, Beijing, 10th March, accessed online from, http//:pbc.gov.cn/English/130721/3029330/index.html
Perrin, B 2005, ‘Customer Value drives manufacturing's future’, Plant, vol.64, no.2, pp.38.
Peters, ED 2015, ‘Relations between Latin America and the Caribbean and China Trade and Strategic Relations in a World in Transition’, Latin America, the Caribbean and China: Sub-regional strategic scenarios, CAF, pp.21-49.
Pinches, GE, Mingo, KA and Caruthers, JK 1973, ‘The Stability of Financial Patterns in Industrial Organizations’, The Journal of Finance, vol.28(2), pp.389-396.
Piplai, T 2001, ‘Automobile Industry: Shifting Strategic Focus’, Economic and political weekly, pp.2892-2897.
Platt, HD & Platt, MB 2002, ‘Predicting corporate financial distress: reflections on choice-based sample bias’, Journal of Economics and Finance, vol.26, no.2, pp.184-199.
Poon, WPH, Firth, M and Fung, H 1999, ‘A multivariate analysis of the determinants of Moody’s bank financial strength ratings’, Journal of International Financial Markets, Institutions and Money, vol. 9, no.3, pp. 267-283.
Porter, ME 1980, Competitive Strategy: Techniques for Analysing Industries and Competitors. New York: The Free Press.
Porter, ME 1985, Competitive Advantage: Creating and sustaining superior performance. New York: The Free Press.
Prasad, R & Sridhar, V 2009, ‘Allocative efficiency of the mobile industry in India and its implications for spectrum policy’, Telecommunications Policy, vol.33, no.9, pp.521-533.
Priya, K and Nimalathasan, B 2013, ‘Liquidity management and profitability: A case study of listed manufacturing companies in Sri Lanka’, International Journal of Technological Exploration and Learning, vol.2, no.4, pp.135-151.
Prowse, SD 1994, ‘Corporate governance in an international perspective: a survey of corporate control mechanisms among large firms in the United States’, the United Kingdom, Japan and Germany: Bank for International Settlements.
Prowse, SD 1996, ‘Corporate finance in international perspective: Legal and regulatory influences on financial system development. Economic Review-Federal Reserve Bank of Dallas, 2.
Psillaki, M. and M., D 2008, ‘Long-run interdependence and dynamic linkages in international stock markets: evidence from France Germany and the US’, Journal of Money, Investment and Banking.
Puig-Junoy, J 2000, ‘Partitioning input cost efficiency into its allocative and technical components: an empirical DEA application to hospitals’, Socio-Economic Planning Sciences, vol. 34, no.3, pp.199-218.
281
Putre, L 2015, ‘Hard Times Ahead for China’s Auto Industry’, Industry Week, accessed online on 20th August 2016, http://www.industryweek.com/global-economy/hard-times-ahead-chinas-auto-industry
Raghunathan, TS, Rao, SS and Solis, LE 1997, ‘A comparative study of quality practices: USA, China and India’, Industrial Management + Data Systems, vol.97, no.5, pp.192-200.
Rahim, N and Saad, N 2014, ‘Sustainable Growth of Public Listed Companies (PLC) using capital structure Choices and Firm performance in an Asean Market’, Proceeding of the Global Summit on Education GSE, pp.4-5.
Rajan, RG and Zingales, L 1995, ‘What do we know about capital structure? Some evidence from international data’, The Journal of Finance, vol.50, no.5, pp.1421-1460.
Ramcharran, H 2001, ‘Inter-Firm Linkages and Profitability in the Automobile Industry: The Implications for Supply Chain Management’, Journal of Supply Chain Management, vol.37, no.4, pp.11-17.
Rangan, N, Grabowski, R, Aly, HY & Pasurka, C 1988, ‘The technical efficiency of US banks’, Economics Letters, vol.28, no.2, pp.169-175.
Ray, S 2011, ‘Assessing corporate financial distress in automobile industry of India: an application of Altman’s model’, Research Journal of Finance and Accounting, vol.2, no.3, pp.26-43.
Ray, S and Hu, X 1993, ‘A nonparametric decomposition of the Malmquist productivity index: a study of airlines’ data’, Paper presented at the Third European Workshop on Productivity, Belgium.Raynor, P and P., LJ 1991, ‘BS5750/ISO9000-the experiences of small and medium-sized firms’, International Journal of Quality & Reliability Management, vol.8, no.6, pp.16-28.
Richter, W. 2016, ‘Chinse Government Now Fretting about Auto Industry’, Wolf Street, accessed online on 20th August 2016, http://wolfstreet.com/2016/05/13/auto-industry-industry-hype-chinese-government-warns-about-rampant-overcapacity/
Rios, AR & Shively, GE 2016, Farm size and nonparametric efficiency measurements for coffee farms in Vietnam.
Roberts, I & Zurawski, A 2016, ‘ Changing Patterns of Corporate Leverage in China: Evidence from listed companies. China's New Sources of Economic Growth: Vol. 1: Reform, Resources and Climate Change, pp.271.
Roberts, RW 1992, ‘Determinants of corporate social responsibility disclosure: An application of stakeholder theory’, Accounting, Organizations and Society, vol.17, no.6, pp.595-612.
Rockness, JW 1985, ‘An assessment of the relationship between US corporate environmental performance and disclosure’, Journal of Business Finance & Accounting, vol.12, no.3, pp.339-354.
Roden, DM and Lewellen, WG 1995, ‘Corporate capital structure decisions: Evidence from leveraged buyouts’, Financial Management, vol.24, no.2, pp.76-87.
282
Ross, SA 1973, ‘The Economic Theory of Agency: The Principal's Problem,’ The American Economic Review, vol.63, no.2, pp.134-139.
Rostas, L 1948, Productivity, Prices and Distribution in Selected British Industries: Cambridge University Press.
Ruan, W, Tian, G & Ma, S 2011, ‘Managerial Ownership, Capital Structure and Firm Value: Evidence from China’s Civilian-run Firms: Research Online.
San, OT & Heng, TB 2011, ‘Capital structure and corporate performance of Malaysian construction sector’, International Journal of Humanities and Social Science, vol.1, no.2, pp.28-36.
Sanchez, A. M & Perez, MP 2005, ‘Lean indicators and manufacturing strategies’, International Journal of Operations & Production Management, vol.21, no.11, pp.1433-1451.
Saranga, H 2009, ‘The Indian auto component industry – Estimation of operational efficiency and its determinants using DEA’, European Journal of Operational Research, vol.196, no.2, pp.707-718.
Saranga, H & Moser, R 2010, ‘Performance evaluation of purchasing and supply management using value chain DEA approach’, European Journal of Operational Research, vol.207, no.1, pp.197-205.
Saricam, C & Erdumlu, N 2012, ‘Evaluating efficiency levels comparatively: Data envelopment analysis application for Turkish textile and apparel industry’, Journal of Industrial Engineering and Management, vol. 5, no.2, pp.518.
Sarkar, J and Sarkar, S 2000, ‘Large shareholder activism in corporate governance in developing countries: Evidence from India’, International Review of Finance, vol.1, no.3, pp.161-194.
Saruta, M 2006, ‘Toyota Production Systems: The ‘Toyota Way’ and Labour–Management Relations’, Asian Business & Management, vol. 5, no.4, pp. 487-506.
Sathye, M 2001, ‘X-efficiency in Australian banking: An empirical investigation’, Journal of Banking & Finance, vol.25, no.3, pp.613-630.
Scannell, TV and Vickery SK 2000, ‘Upstream supply chain management and competitive performancein the automotive supply industry’, Journal of Business, vol.21, no.1, pp.23-48.
Schaeffer, KH 1984, ‘Structural change in the U.S. automobile industry: Jeffrey Allen Hunker, Lexington Books D.C. Heath and Company, Lexington, MA and Toronto, 1983, pp. 265.
Schroeder, RG, Anderson, JC & Cleveland, G 1986, ‘Special Combined Issue The content of manufacturing strategy: An empirical study’, Journal of Operations Management, vol.6, no.3, pp.405-415.
Schwarz, LH 1999, ‘Sustainability: the materials role. Metallyrgical and Materials Transactions, vol.30A, no.4, pp.895.
Seiford, LM 1996, ‘Data Envelopment Analysis: The Evolution of the State of the Art (1978-1995)’, Journal of Productivity Analysis, vol. 7, no.2/3, pp.99-137.
283
Seiford, LM & Zhu, J 1998, ‘On alternative optimal solutions in the estimation of returns to scale in DEA’, European Journal of Operational Research, vol.108, no.1, pp.149-152.
Seiford, LM & Zhu, J 1998, ‘Stability regions for maintaining efficiency in data envelopment analysis’, European Journal of Operational Research, vol.108, no.1, pp.127-139.
Seiford, LM & Zhu, J 1999, ‘An investigation of returns to scale in data envelopment analysis’, Omega, vol.27, no.1, pp.1-11.
Selvanathan, EA and Rao, D.S.P 1994, ‘Index Numbers. Ann Harbour: University of Michigan Press.
Sensarma, R 2005, ‘Cost and profit efficiency of Indian banks during 1986-2003: A stochastic frontier analysis’, Economic and political weekly, pp.1198-1209.
Servaes, H 1991, ‘Tobin's Q and the Gains from Takeovers’, The Journal of Finance, vol.46, no.1, pp.409-419.
Sharma, B. and F., T 1997, ‘Functional strategies and competitiveness: an empirical analysis using data from Australian manufacturing’, Benchmarking for Quality Management & Technology, vol.4, no.4, pp.286-286.
Sheard, P 1983, ‘Auto-production systems in Japan: organisational and locational features’, Australian Geographical Studies, vol.21, no.1, pp.49-68.
Shephard, RW 1970, The Theory of Cost and Production Functions, Princeton, NJ: Princeton University Press.
Sherman, HD & Gold, F 1985, ‘Bank branch operating efficiency: Evaluation with Data Envelopment Analysis’, Journal of Banking & Finance, vol. 9, no.2, pp.297-315.
Sherman, HD & Ladino, G 1995, ‘Managing Bank Productivity Using Data Envelopment Analysis (DEA)’, Interfaces, vol.25, no.2, pp.60-73.
Sherman, WR 2011, ‘Sustainable mobility: a look at the automotive industry’, Journal of Business & Economics Research (JBER), vol.9(10), pp. 47-64.
Shih, MSH 1996, ‘Optimal transfer pricing method and fixed cost allocation’, Abacus, 32, no.2, pp.178.
Shi, WS, Markoczy, L and Stan, CV 2014, ‘The continuing importance of political ties in China’, The Academy of Management, vol.28, no.1, pp.57-75.
Shleifer, A & Vishny, RW 1997, ‘The limits of arbitrage’, The Journal of Finance, vol.52, no.1, pp.35-55.
Shleifer, A & Vishny, RW 1997, ‘A survey of corporate governance’, The Journal of Finance, vol.52, no.2, pp.737-783.
SIAM 2008f, ‘Excise duty’, Society of Indian Automobile Manufacturers (SIAM), New Delhi, accessed online on 15th March 2017, http://www.siamindia.com/scripts/excise-duty.aspx
Simar, L and Wilson, PW 2007, ‘Estimation and inference in two-stage, semi-parametric models of production processes’, Journal of Econometrics, vol.136, no.1, pp.31-64.
284
Singh, J 2016, ‘Summary of India’s Industrial Policy’, Economics Disscussion, accessed on 20th September 2016: http://www.economicsdiscussion.net/acts/summary-of-indias-industrial-policy/6511
Singh, J & Pandey, S 2008, ‘Impact of working capital management in the profitability of Hindalco Industries Limited’, The IUP Journal of Financial Economics, 6(4), pp.62-72.
Singhal, VR and Hendrickan s, KB 2002, ‘How Supply Chain Glitches Torpedo Shareholder Value’, Supply Chain Management Review, vol.6, no.1, pp.18-24.
Sirikrai, S. B. and T., J. C. S. 2006, ‘Industrial competitiveness analysis: Using the analytic hierarchy process’, The Journal of High Technology Management Research, vol.17, no.1, pp.71-83.
Sloan, RG 2001, ‘Financial accounting and corporate governance: a discussion’, Journal of Accounting and Economics, vol.32, no.1, pp.335-347.
Smith, MP 1996, ‘Shareholder activism by institutional investors: Evidence from CalPERS’, The Journal of Finance, vol.51, no.1, pp.227-252.
Söderbom, M & Teal, F 2004, ‘Size and efficiency in African manufacturing firms: evidence from firm-level panel data’, Journal of Development Economics, vol.73, no.1, pp.369-394.
Solomon, J 2010, ‘Corporate governance and accountability’, 3rd ed., Hoboken, N.J. : Wiley.
Solomon, J & Solomon, A 2004, ‘Corporate governance and accountability / Jill Solomon and Aris Solomon: New York : John Wiley, 2004.
Song, X. M. and P., ME 1997, ‘A cross-national comparative study of new product development processes: Japan and the United States’, Journal of Marketing, vol.61, no.2, pp.1-18.
Sørensen, JB 2002, ‘The Strength of Corporate Culture and the Reliability of Firm Performance’, Administrative Science Quarterly, vol.47, no.1, pp.70-91.
Srairi, SA 2010, ‘Cost and profit efficiency of conventional and Islamic banks in GCC countries’, Journal of Productivity Analysis, vol.34, no.1, pp.45-62.
Srinivasan, S, Pauwels, K, Hanssens, DM & Dekimpe, MG 2004, ‘Do Promotions Benefit Manufacturers, Retailers, or Both?’, Management Science, vol.50, no.5, pp.617-629.
Stalley, P 2009, ‘Can Trade Green China? Participation in the global economy and the environmental performance of Chinese firms’, Journal of Contemporary China, vol.18, no.61, pp.567-590.
Sturgeon, T and Van Biesebroeck, J 2010, ‘Effects of the crisis on the automotive industry in developing countries: a global values chain perspective’, The World Bank Policy Research Working Paper, accessed on 28th June 2016: https://openknowledge.worldbank.org/bitstream/handle/10986/3815/WPS5330.pdf?se
285
Su, L 1987, ‘Lun qiche gongye de diwei he zuoyong (On the automotive industry's status and effect). Gongye jingji guanli chongkan (Industrial Economic Management Collection), vol.9, pp.12-19.
Sufian, F 2011, ‘Benchmarking the efficiency of the Korean banking sector: a DEA approach’, Benchmarking: An International Journal, vol.18, no.1, pp.107-127.
Sun, Q, & Tong, WH 2003, ‘China share issue privatization: the extent of its success’, Journal of Financial Economics, vol.70, no.2, pp.183-222.
Sun, Q, Tong, WH & Tong, J 2002, ‘How does government ownership affect firm performance? Evidence from China’s privatization experience’, Journal of
Business Finance & Accounting, vol.29, no.1‐2, pp.1-27.
Sung, S, Kim, Y& Chang, H 2016, ‘Improving collaboration between large and small-medium enterprises in automobile production’, Enterprise Information Systems, pp.1-17.
Szuprowicz, M and Szuprowicz, B 1978, ‘Doing Business with the People's Republic of China. New York: Wiley.
Tam, EKL 2002, ‘Challenges in using environmental indicators for measuring sustainability practices’, Journal of Environmental Engineering and Science, vol.1, no.6, pp.417-425.
Tang, R 2009, ‘The rise of China's auto industry and its impact on the US motor vehicle industry’, Congressional Research Service.
Tang, R 2012, ‘China’s Auto Sector Development and Policies: Issues and Implications’, Congressional Research Service.
Taylor, WM, Thompson, RG, Thrall, RM & Dharmapala, PS 1997, ‘DEA/AR efficiency and profitability of Mexican banks a total income model’, European Journal of Operational Research, vol. 98, no.2, pp.346-363.
Teeratansirikool, L, Siengthai, S, Badir, Y & Charoenngam, C 2013, ‘Competitive strategies and firm performance: the mediating role of performance measurement’, International Journal of Productivity and Performance Management, vol.62, no.2, pp.168-184.
Tehrani, R, Mehragan, MR & Golkani, MR 2012, ‘A Model For Evaluating Financial Performance of Companies by Data Envelopment Analysis: A case study of 36 corporations affiliated with a private organization’, International Business Research, vol.5, no.8, pp.8.
Thanassoulis, E, Boussofiane, A and Dyson, RG 1996, ‘A comparison of data envelopment analysis and ratio analysis as tools for performance assessment’, Omega, vol.24, no.3, pp.229-244.
The Automobile Industry, 2004, ‘Business & Economics Research Advisor,Iss.2, accessed online on 15th March 2017: https://www.loc.gov/rr/business/BERA/issue2/manufacturing.html
The Automotive Market in China, 2015, EU SME Centre and China-Britain Business Council, accessed on 21st July 2016: https://www.ccilc.pt/sites/default/files/eu_sme_centre_sector_report_-_the_automotive_market_in_china_update_-_may_2015.pdf.
286
The Allen Consulting Group, 2013, ‘The strategic role of the australian automotive manufacturing industry’, accessed on 20th August 2016: http://www.google.com.au/url?sa=t&rct=j&q=&esrc=s&source=web&cd=3&ved=0ahUKEwj7k7iTzYDTAhVRObwKHX4PBnQQFggiMAI&url=http%3A%2F%2Fwww.acilallen.com.au%2Fcms_files%2FACILAllen_FCAI_September2013.pdf&usg=AFQjCNE81L_lWVt7ZqjIaSNOrLQ9rtEcbg
The Five Year Plan, 2015, accessed on 18th August 2015: http://dangshi.people.com.cn/GB/151935/204121/204122/12924999.html
Thrall, RM 1997, ‘Duality, classification and slacks in DEA’, Annals of Operations Research, vol.73, no.1-4, pp.109-138.
Thurwachter, T 1989, ‘Development of the Chinese Auto Industry: Foreign Participation and Opportunities’, Guangzhou: U.S. and Foreign Commercial Service document.
Tian, G, Chu, J, Hu, H & Li, H 2014, ‘Technology innovation system and its integrated structure for automotive components remanufacturing industry development in China’, Journal of Cleaner Production, vol. 85, pp.419-432.
Tian, L & Estrin, S 2008, ‘Retained state shareholding in Chinese PLCs: does government ownership always reduce corporate value?’, Journal of Comparative Economics, vol.36, no.1, pp.74-89.
Titman, S and Wessels R 1988, ‘The determinants of capital structure choice’, The Journal of Finance, vol.43, no.1, pp.1-19.
Tofallis, C 1996, ‘Input efficiency profiling: an application to airlines’, The Business School, University of Hertfordshire, U.K.
Tomkins, C. and G., R 1988, ‘An Experiment in the use of Data Envelopment Analysis for evaluating the efficiency of UK university departments of Accounting’, Financial Accountability & Management, vol.4, no.2, pp.147.
Tracey, M, Vonderembse, MA and Lim, JS 1999, ‘Manufacturing technology and strategy formulation: keys to enhancing competitiveness and improving performance’, Journal of Operations Management, 17, no.4, pp.411-428.
Trotman, KT & Bradley, GW 1981, ‘Associations between social responsibility disclosure and characteristics of companies’, Accounting, Organizations and Society, vol.6, no.4, pp.355-362.
Tseng, C-Y & Wu, L-Y 2006, ‘Innovation quality in the automobile industry: measurement indicators and performance implications’, International Journal of Technology Management, vol.37, no.1-2, pp.162-177.
Tseng, M-L, Wu, K-J, & Nguyen, TT 2011, ‘Information technology in supply chain management: a case study’, Procedia-Social and Behavioural Sciences, vol.25, pp. 257-272.
Tzepepis, D and Sakuras, D 2004, ‘The effects of regional capital subsidies on firm performance: and empirical study’, Journal of Small Business and Enterprise Development, vol.11, no.1, pp.121-129.
U.S. AUTO INDUSTRY REVIVED, CREATING MANUFACTURING JOBS, 2011, United States, Lanham.
287
Upton, DM 1995, ‘Flexibility as process mobility: The management of plant capabilities for quick response manufacturing’, Journal of Operations Management, 12, no.3, pp.205-224.
Vahid, S & Sowlati, T 2007, ‘Efficiency analysis of the Canadian wood-product manufacturing subsectors: A DEA approach’, Forest Products Journal, vol.57, no.1/2, pp.71-77.
Van den Bergh, J, De Bruecker, P, Beliën, J, De Boeck, L & Demeulemeester, E 2013, ‘A three-stage approach for aircraft line maintenance personnel rostering using MIP, discrete event simulation and DEA’, Expert Systems with Applications, vol.40, no.7, pp.2659-2668.
Veloso, F and Kumar, R 2002, ‘The automotive supply chain: Global trends and Asian Perspectives’, Carnegie Mellon University, accessed on 15th March 2017: http://repository.cmu.edu/cgi/viewcontent.cgi?article=1131&context=epp&sei-redir=1&referer=http%3A%2F%2Fscholar.google.com.au%2Fscholar%3Fq%3Dacoustic%2Bsystems%2Bin%2BChinese%2Bautomobile%2Bindustry%2Band%2Bcost%26btnG%3D%26hl%3Den%26as_sdt%3D0%252C5#search=%22acoustic%20systems%20Chinese%20automobile%20industry%20cost%22
Vernon-Wortzel, H & Wortzel, LH 1989, ‘Privatization: Not the only answer’, World Development, vol.17, no.5, pp.633-641.
Vickery, S, Calantone, R & Dröge, C 1999, ‘Supply Chain Flexibility: An Empirical Study’, Journal of Supply Chain Management, vol.35, no.2, pp.16-24.
Villalonga, B & Amit, R 2006, ‘How do family ownership, control and management affect firm value?’, Journal of Financial Economics, vol. 80, no.2, pp.385-417.
Vining, AR & Boardman, AE 1992, ‘Ownership versus competition: Efficiency in public enterprise’, Public choice, vol.73, no.2, pp. 205-239.
Vishnani, S & Shah, BK 2007, ‘Impact of working capital management policies on corporate performance—An empirical study’, Global Business Review, vol.8, no.2, pp.267-281.
Vu, HD 2016, ‘Technical efficiency of FDI firms in the Vietnamese manufacturing sector’, Review of Economic Perspectives, vol.16, no.3, pp.205-230.
Wang, H 2003, ‘Policy reforms and foreign direct investment: The case of the Chinese automobile industry’, Journal of Economics and Business, vol.6, no.1, pp.287-314.
Wang, K 1983, ‘Technology, demand, and market structure of United States automobile industry’, Transportation Research Part A: General, vol.17, no.6, pp. 531.
Wasti, S. N. and L., J. K 1999, ‘Collaborating with suppliers in product development: a US and Japan comparative study’, Engineering Management, IEEE Transactions on, vol.46, no.4, pp.444-460.
Watts, RL & Zimmerman, JL 1986, ‘Positive accounting theory / Ross L. Watts, Jerold L. Zimmerman: Englewood Cliffs, N.J. : Prentice-Hall.
288
Weber, C. A. and D., A 1996, ‘Determination of paths to vendor market efficiency using parallel coordinates representation: A negotiation tool for buyers’, European Journal of Operational Research, vol. 90, no.1, pp.142-155.
Wei, YD, Zhou, Y, Sun, Y & Lin, GC 2012, ‘Production and R&D networks of foreign ventures in China: Implications for technological dynamism and regional development’, Applied Geography, vol.32, no.1, pp.106-118.
Wei, Z, Xie, F & Zhang, S 2005, ‘Ownership structure and firm value in China's privatized firms: 1991–2001’, Journal of Financial and Quantitative analysis, vol.40, no.01, pp.87-108.
Wheel Wright, SC 1984, ‘Manufacturing strategy: Defining the missing link’, Strategic Management Journal, vol.5, no.1, pp.77-91.
Wheelock, DC and Wilson, P W 1999, ‘Technical Progress, Inefficiency, and Productivity Change in U.S. Banking, 1984-1993’, Journal of Money, Credit and Banking, vol.31, no.2, pp.212-234.
Why the ‘Made in China’ tag may soon cease to exist, 2017, News, accessed online on 15th March 2017, http://www.news.com.au/finance/economy/world-economy/why-the-made-in-china-tag-may-soon-cease-to-exist/news-story/ab31ca2c00a9b2a8200ce913a013a1e0
Wilkinson, A. and H., M and Gollan, P 2001, ‘The sustainability debate’, International Journal of Operations & Production Management, vol.21, no.12, pp.1492-1502.
Williams, A 2007, ‘Product service systems in the automobile industry: contribution to system innovation?’, Journal of Cleaner Production, vol.15, no.11–12, pp.1093-1103.
Williams, BR & O'Donovan, G 2015, ‘The accountants’ perspective on sustainable business practices in SMEs’, Social Responsibility Journal, vol. 11, no.3, pp. 641-656.
Williams, J 1987, ‘Perquisites, Risk, and Capital Structure’, Journal of Finance, vol.42, no.1, pp.29.
Wilson, RMS and Chua, WF 1993, Management Accounting: Method and Meaning, 2nd ed., London: Chapman & Hall.
Wilson, RMS and McHugh, G 1996, ‘Financial Analysis: A Managerial Introduction’, 3rd ed., London: Cassell Educational Limited.
Windle, RJ 1991, ‘The World’s Airlines: A Cost and Productivity Comparison’, Journal of Transport Economics and Policy, vol.25, no.1, pp.31-49.
Wiseman, J 1982, ‘An evaluation of environmental disclosures made in corporate annual reports’, Accounting, Organizations and Society, vol.7, no.1, pp.53-63.
Wu, F 2009, ‘Environmental Politics in China: An Issue Area in Review’, Journal of Chinese Political Science, vol.14, no.4, pp.383-406.
Wu, H 2014, ‘The Relationship between Ownership and Company Performances: Evidence from Chinese Company-Level Data.
Wu, J 2012a, ‘Economics and China’s Economics Rise’, in Aoki, Masahiko and Wu J (eds) The Chinese Economy: A New Transition, Palgrave MacMillan.
289
Wu, J 2012b, ‘Guojing mingtui dade jingre’ (state sector advancing and private sector retreating has become surprisingly serious), accessed online on 15th March 2017, http://www.jrjia.com/2012/01/28/714.shtml
Xia, F & Walker, G 2015, ‘How much does owner type matter for firm performance? Manufacturing firms in China 1998–2007’, Strategic Management Journal, vol.36, no.4, pp.576-585.
Xia, Y & Tang, T. L-P 2011, ‘Sustainability in supply chain management: suggestions for the auto industry’, Management Decision, vol. 49, no.4, pp.495-512.
Xiamen Employee Wage & Labour Cost Information 2016, Understand China, accessed on 18th August 2016:
http://understand-china.com/manufacturing/xiamen-labor-costs/
Xiao, C & Dong, J 2000, ‘Ownership Pluralization, Firm Performance and Industry Competition’, Economic Research Journal, vol.8, pp.003.
Xinhua (24th Oct 2012), ‘China pledges further reforms for state-dominated sectors’, accessed online on 15th March 2017, http://news.xinhuanet.com/emgish.indepth/2012-10/24/c_131928023.htm
Xu, WJ 2011, ‘The empirical analysis of market performance of automobile industry market in China’, Paper presented at the Applied Mechanics and Materials.
Xu, X and Wang, Y 1997, Ownership structure, corporate governance, and corporate performance: The case of Chinese stock companies’, World Bank Publications , vol.1794,.
Yang, C.-H & Chen, K.-H 2009, ‘Are small firms less efficient?’, Small Business Economics, vol.32, no.4, pp.375-395.
Yang, Y 2013, ‘China Focus: China to diversity SOE shareholding’, Xinhuanet.
Yao, R and Rosettani, E 2015, ‘A Complete Guide to 2015 Minimum Wage Levels Across China’, China Briefing, accessed on 18th August 2016: http://www.china-briefing.com/news/2015/05/26/complete-guide-2015-minimum-wage-levels-across-china.html
Young, S and Lan, P 1997, ‘Technology transfer to China through foreign direct investment’, Regional Studies, vol. 31, no.7, pp.669-679.
Yongnian, Z & Tong, SY 2014, ‘China's Evolving Industrial Policies and Economic Restructuring: Routledge.
Youndt, MA, Snell, SA, Dean, JJW & Lepak, DP 1996, ‘Human Resource Management, Manufacturing Strategy, and firm performance’, Academy of Management Journal, vol.39, no.4 pp., 836-866.
Young, A 2013, ‘GM, Ford, VW Dominate China’s Auto Industry: Why Can’t Chinese Companies Like SAIC, Dongfeng, Geely, and GAC make cars that people want to buy?, IBTIMES, Accessed online on 15th March 2017: http://www.ibtimes.com/
Yousefi, A & Hadi-Vencheh, A 2010, ‘An integrated group decision making model and its evaluation by DEA for automobile industry’, Expert Systems with Applications, vol. 37, no.12, pp.8543-8556.
290
Yu, M 2013, ‘State ownership and firm performance: Empirical evidence from Chinese listed companies’, China Journal of Accounting Research, vol.6, no.2, pp.75-87.
Zeitun, R and Tian, GG 2007, ‘Does ownership affect a firm’s performance and default risk in Jordan?’, Corporate Governance: the International journal of Business in Society, vol.7, no.1, pp.66-82.
Zhan, XJ 1993, ‘The role of foreign direct investment in market-oriented reforms and economic development: the case of China’, Transnational Corporations, vol.2, no.3, pp.121-148.
Zhang, D & Freestone, O 2013, ‘China's unfinished state-owned enterprise reforms’, Economic Round-up, no.2, pp.77.
Zhang, H.-C & Mallur, S 1994, ‘An integrated model of process planning and production scheduling’, International Journal of Computer Integrated Manufacturing, vol.7, no.6, pp.356-364.
Zhao, H and Xiong, Z 1981, ‘Dui Tiaozheng woguo qiche gongye de kanfa (Opinions on adjusting our automotive industry)’, Caizheng yanjiu ziliao (Financial Research Data), vol. 90, pp.26-30.
Zhao, J & Gao, L 2009, ‘How to be competitive in Chinese automobile industry’, International Journal of Economics and Finance, vol.1, no.2, pp.144.
Zheng, J, Liu, X & Bigsten, A 2003, ‘Efficiency, technical progress, and best practice in Chinese state enterprises (1980–1994)’, Journal of Comparative Economics, vol.31, no.1, pp.134-152.
Zhongguo qiche gongye nianjian (Chinese Automotive Industry Yearbook), 1991, Changchun: Jiling Kexue jishu chubanshe (House Jilin Science and Technology Press).
Zhongguo qiche gongye nianjian (Chinese Automotive Industry Yearbook), 1994,Changchun: Jiling Kexue jishu chubanshe (House Jilin Science and Technology Press).
Zhou, J 1989, ‘China's Passenger Car Industry’, Paper presented at the Graduate School of the Academia Sinica.
Zhou, Y, Xing, X, Fang, K, Liang, D & Xu, C 2013, ‘Environmental efficiency analysis of power industry in China based on an entropy SBM model’, Energy Policy, vol.57, pp.68-75.
Zhu, J 1996, ‘Robustness of the efficient DMUs in data envelopment analysis‘, European Journal of Operational Research, vol.90, no.3, pp.451-460.
Zhu, Q, Sarkis, J & Lai, K.-h 2007, ‘Green supply chain management: pressures, practices and performance within the Chinese automobile industry’, Journal of Cleaner Production, vol.15, no.11-12, pp.1041-1052.
Zhu, S & Pickles, J 2014, ‘Bring in, go up, go west, go out: Upgrading, regionalisation and delocalisation in China’s apparel production networks’, Journal of Contemporary Asia, 44, no.1, pp.36-63.
Zimmer, S 2006, ‘Automakers Embraces sustainability' Light & Medium Truck, 19, no.3, pp.30.

291
Zineldin, M & Dodourove, M 2005, ‘Motivation, achievements and failure of strategic alliances: The case of Swedish auto-manufacturers in Russia’, European Business Review, vol.17, no.5, pp.460-470.
Zubairi, HJ 2011, ‘Impact of working capital management and capital structure on profitability of automobile firms in Pakistan’, Paper presented at the Finance and Corporate Governance Conference.
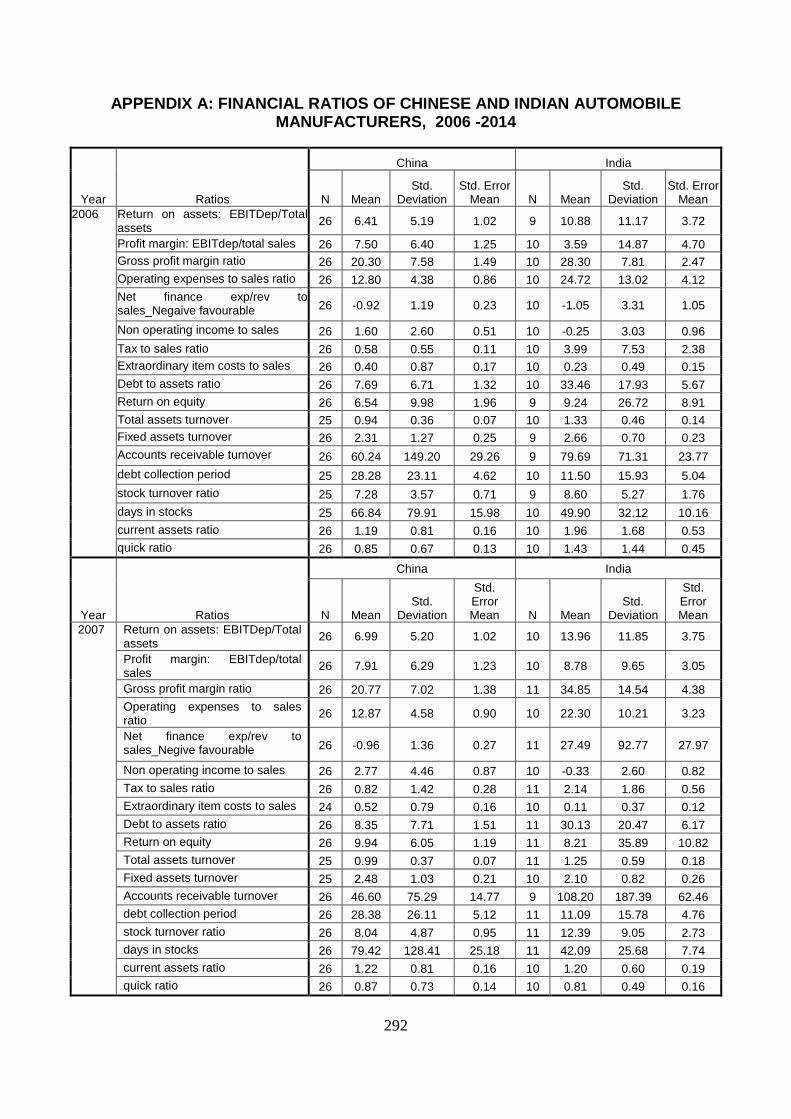
292
APPENDIX A: FINANCIAL RATIOS OF CHINESE AND INDIAN AUTOMOBILE MANUFACTURERS, 2006 -2014
Year Ratios
China India
N Mean Std.
Deviation Std. Error
Mean N Mean Std.
Deviation Std. Error
Mean
2006 Return on assets: EBITDep/Total assets
26 6.41 5.19 1.02 9 10.88 11.17 3.72
Profit margin: EBITdep/total sales 26 7.50 6.40 1.25 10 3.59 14.87 4.70
Gross profit margin ratio 26 20.30 7.58 1.49 10 28.30 7.81 2.47
Operating expenses to sales ratio 26 12.80 4.38 0.86 10 24.72 13.02 4.12
Net finance exp/rev to sales_Negaive favourable 26 -0.92 1.19 0.23 10 -1.05 3.31 1.05
Non operating income to sales 26 1.60 2.60 0.51 10 -0.25 3.03 0.96
Tax to sales ratio 26 0.58 0.55 0.11 10 3.99 7.53 2.38
Extraordinary item costs to sales 26 0.40 0.87 0.17 10 0.23 0.49 0.15
Debt to assets ratio 26 7.69 6.71 1.32 10 33.46 17.93 5.67
Return on equity 26 6.54 9.98 1.96 9 9.24 26.72 8.91
Total assets turnover 25 0.94 0.36 0.07 10 1.33 0.46 0.14
Fixed assets turnover 26 2.31 1.27 0.25 9 2.66 0.70 0.23
Accounts receivable turnover 26 60.24 149.20 29.26 9 79.69 71.31 23.77
debt collection period 25 28.28 23.11 4.62 10 11.50 15.93 5.04
stock turnover ratio 25 7.28 3.57 0.71 9 8.60 5.27 1.76
days in stocks 25 66.84 79.91 15.98 10 49.90 32.12 10.16
current assets ratio 26 1.19 0.81 0.16 10 1.96 1.68 0.53
quick ratio 26 0.85 0.67 0.13 10 1.43 1.44 0.45
Year Ratios
China India
N Mean Std.
Deviation
Std. Error Mean N Mean
Std. Deviation
Std. Error Mean
2007 Return on assets: EBITDep/Total assets
26 6.99 5.20 1.02 10 13.96 11.85 3.75
Profit margin: EBITdep/total sales
26 7.91 6.29 1.23 10 8.78 9.65 3.05
Gross profit margin ratio 26 20.77 7.02 1.38 11 34.85 14.54 4.38
Operating expenses to sales ratio
26 12.87 4.58 0.90 10 22.30 10.21 3.23
Net finance exp/rev to sales_Negive favourable 26 -0.96 1.36 0.27 11 27.49 92.77 27.97
Non operating income to sales 26 2.77 4.46 0.87 10 -0.33 2.60 0.82
Tax to sales ratio 26 0.82 1.42 0.28 11 2.14 1.86 0.56
Extraordinary item costs to sales 24 0.52 0.79 0.16 10 0.11 0.37 0.12
Debt to assets ratio 26 8.35 7.71 1.51 11 30.13 20.47 6.17
Return on equity 26 9.94 6.05 1.19 11 8.21 35.89 10.82
Total assets turnover 25 0.99 0.37 0.07 11 1.25 0.59 0.18
Fixed assets turnover 25 2.48 1.03 0.21 10 2.10 0.82 0.26
Accounts receivable turnover 26 46.60 75.29 14.77 9 108.20 187.39 62.46
debt collection period 26 28.38 26.11 5.12 11 11.09 15.78 4.76
stock turnover ratio 26 8.04 4.87 0.95 11 12.39 9.05 2.73
days in stocks 26 79.42 128.41 25.18 11 42.09 25.68 7.74
current assets ratio 26 1.22 0.81 0.16 10 1.20 0.60 0.19
quick ratio 26 0.87 0.73 0.14 10 0.81 0.49 0.16
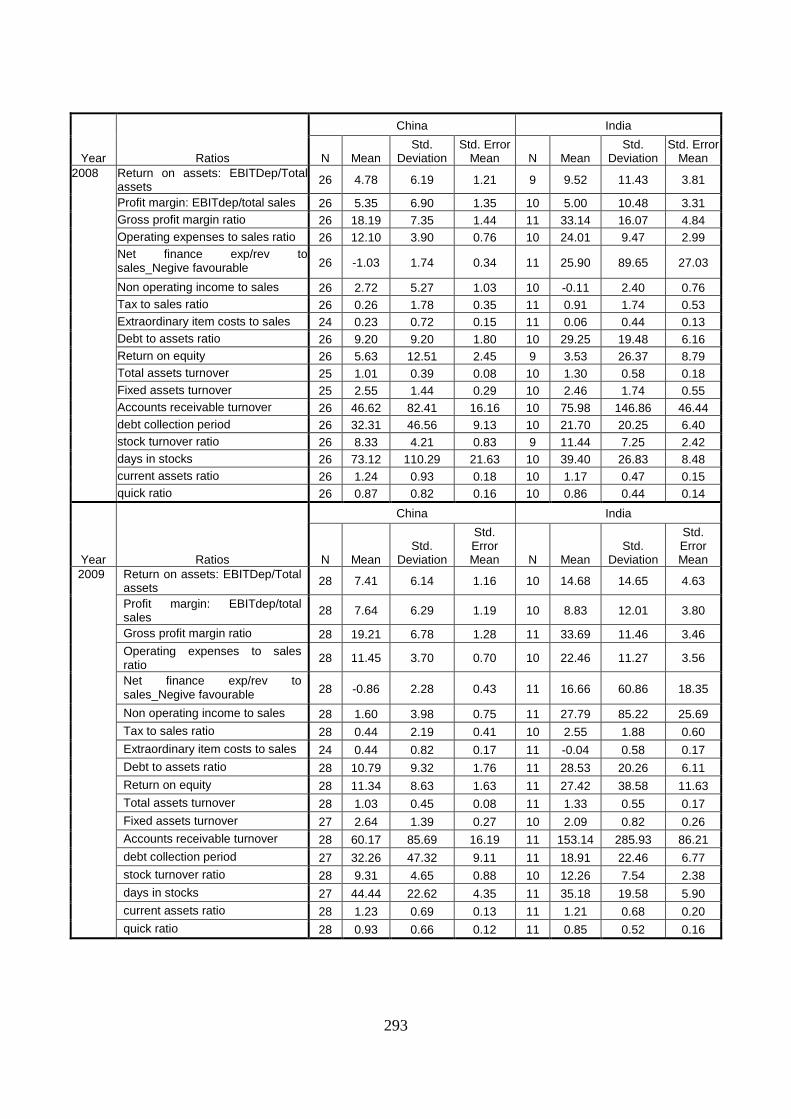
293
Year Ratios
China India
N Mean Std.
Deviation Std. Error
Mean N Mean Std.
Deviation Std. Error
Mean
2008 Return on assets: EBITDep/Total assets
26 4.78 6.19 1.21 9 9.52 11.43 3.81
Profit margin: EBITdep/total sales 26 5.35 6.90 1.35 10 5.00 10.48 3.31
Gross profit margin ratio 26 18.19 7.35 1.44 11 33.14 16.07 4.84
Operating expenses to sales ratio 26 12.10 3.90 0.76 10 24.01 9.47 2.99
Net finance exp/rev to sales_Negive favourable 26 -1.03 1.74 0.34 11 25.90 89.65 27.03
Non operating income to sales 26 2.72 5.27 1.03 10 -0.11 2.40 0.76
Tax to sales ratio 26 0.26 1.78 0.35 11 0.91 1.74 0.53
Extraordinary item costs to sales 24 0.23 0.72 0.15 11 0.06 0.44 0.13
Debt to assets ratio 26 9.20 9.20 1.80 10 29.25 19.48 6.16
Return on equity 26 5.63 12.51 2.45 9 3.53 26.37 8.79
Total assets turnover 25 1.01 0.39 0.08 10 1.30 0.58 0.18
Fixed assets turnover 25 2.55 1.44 0.29 10 2.46 1.74 0.55
Accounts receivable turnover 26 46.62 82.41 16.16 10 75.98 146.86 46.44
debt collection period 26 32.31 46.56 9.13 10 21.70 20.25 6.40
stock turnover ratio 26 8.33 4.21 0.83 9 11.44 7.25 2.42
days in stocks 26 73.12 110.29 21.63 10 39.40 26.83 8.48
current assets ratio 26 1.24 0.93 0.18 10 1.17 0.47 0.15
quick ratio 26 0.87 0.82 0.16 10 0.86 0.44 0.14
Year Ratios
China India
N Mean Std.
Deviation
Std. Error Mean N Mean
Std. Deviation
Std. Error Mean
2009 Return on assets: EBITDep/Total assets
28 7.41 6.14 1.16 10 14.68 14.65 4.63
Profit margin: EBITdep/total sales
28 7.64 6.29 1.19 10 8.83 12.01 3.80
Gross profit margin ratio 28 19.21 6.78 1.28 11 33.69 11.46 3.46
Operating expenses to sales ratio
28 11.45 3.70 0.70 10 22.46 11.27 3.56
Net finance exp/rev to sales_Negive favourable 28 -0.86 2.28 0.43 11 16.66 60.86 18.35
Non operating income to sales 28 1.60 3.98 0.75 11 27.79 85.22 25.69
Tax to sales ratio 28 0.44 2.19 0.41 10 2.55 1.88 0.60
Extraordinary item costs to sales 24 0.44 0.82 0.17 11 -0.04 0.58 0.17
Debt to assets ratio 28 10.79 9.32 1.76 11 28.53 20.26 6.11
Return on equity 28 11.34 8.63 1.63 11 27.42 38.58 11.63
Total assets turnover 28 1.03 0.45 0.08 11 1.33 0.55 0.17
Fixed assets turnover 27 2.64 1.39 0.27 10 2.09 0.82 0.26
Accounts receivable turnover 28 60.17 85.69 16.19 11 153.14 285.93 86.21
debt collection period 27 32.26 47.32 9.11 11 18.91 22.46 6.77
stock turnover ratio 28 9.31 4.65 0.88 10 12.26 7.54 2.38
days in stocks 27 44.44 22.62 4.35 11 35.18 19.58 5.90
current assets ratio 28 1.23 0.69 0.13 11 1.21 0.68 0.20
quick ratio 28 0.93 0.66 0.12 11 0.85 0.52 0.16
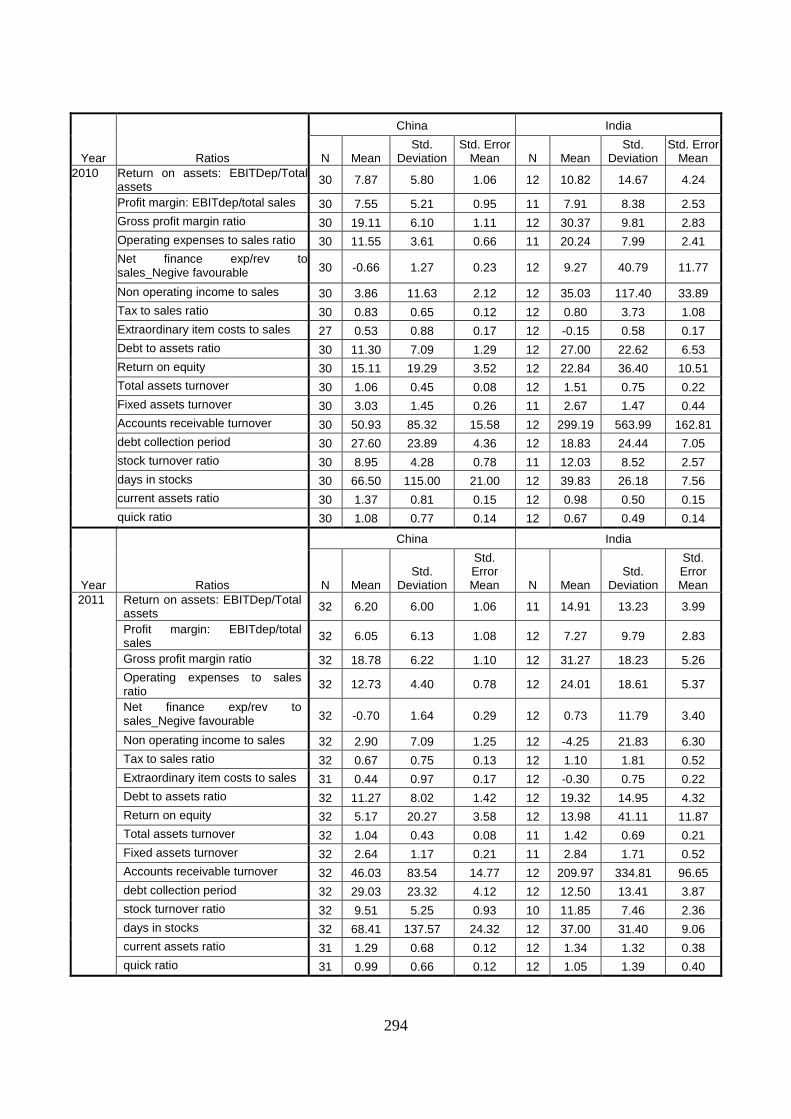
294
Year Ratios
China India
N Mean Std.
Deviation Std. Error
Mean N Mean Std.
Deviation Std. Error
Mean
2010 Return on assets: EBITDep/Total assets
30 7.87 5.80 1.06 12 10.82 14.67 4.24
Profit margin: EBITdep/total sales 30 7.55 5.21 0.95 11 7.91 8.38 2.53
Gross profit margin ratio 30 19.11 6.10 1.11 12 30.37 9.81 2.83
Operating expenses to sales ratio 30 11.55 3.61 0.66 11 20.24 7.99 2.41
Net finance exp/rev to sales_Negive favourable 30 -0.66 1.27 0.23 12 9.27 40.79 11.77
Non operating income to sales 30 3.86 11.63 2.12 12 35.03 117.40 33.89
Tax to sales ratio 30 0.83 0.65 0.12 12 0.80 3.73 1.08
Extraordinary item costs to sales 27 0.53 0.88 0.17 12 -0.15 0.58 0.17
Debt to assets ratio 30 11.30 7.09 1.29 12 27.00 22.62 6.53
Return on equity 30 15.11 19.29 3.52 12 22.84 36.40 10.51
Total assets turnover 30 1.06 0.45 0.08 12 1.51 0.75 0.22
Fixed assets turnover 30 3.03 1.45 0.26 11 2.67 1.47 0.44
Accounts receivable turnover 30 50.93 85.32 15.58 12 299.19 563.99 162.81
debt collection period 30 27.60 23.89 4.36 12 18.83 24.44 7.05
stock turnover ratio 30 8.95 4.28 0.78 11 12.03 8.52 2.57
days in stocks 30 66.50 115.00 21.00 12 39.83 26.18 7.56
current assets ratio 30 1.37 0.81 0.15 12 0.98 0.50 0.15
quick ratio 30 1.08 0.77 0.14 12 0.67 0.49 0.14
Year Ratios
China India
N Mean Std.
Deviation
Std. Error Mean N Mean
Std. Deviation
Std. Error Mean
2011 Return on assets: EBITDep/Total assets
32 6.20 6.00 1.06 11 14.91 13.23 3.99
Profit margin: EBITdep/total sales
32 6.05 6.13 1.08 12 7.27 9.79 2.83
Gross profit margin ratio 32 18.78 6.22 1.10 12 31.27 18.23 5.26
Operating expenses to sales ratio
32 12.73 4.40 0.78 12 24.01 18.61 5.37
Net finance exp/rev to sales_Negive favourable 32 -0.70 1.64 0.29 12 0.73 11.79 3.40
Non operating income to sales 32 2.90 7.09 1.25 12 -4.25 21.83 6.30
Tax to sales ratio 32 0.67 0.75 0.13 12 1.10 1.81 0.52
Extraordinary item costs to sales 31 0.44 0.97 0.17 12 -0.30 0.75 0.22
Debt to assets ratio 32 11.27 8.02 1.42 12 19.32 14.95 4.32
Return on equity 32 5.17 20.27 3.58 12 13.98 41.11 11.87
Total assets turnover 32 1.04 0.43 0.08 11 1.42 0.69 0.21
Fixed assets turnover 32 2.64 1.17 0.21 11 2.84 1.71 0.52
Accounts receivable turnover 32 46.03 83.54 14.77 12 209.97 334.81 96.65
debt collection period 32 29.03 23.32 4.12 12 12.50 13.41 3.87
stock turnover ratio 32 9.51 5.25 0.93 10 11.85 7.46 2.36
days in stocks 32 68.41 137.57 24.32 12 37.00 31.40 9.06
current assets ratio 31 1.29 0.68 0.12 12 1.34 1.32 0.38
quick ratio 31 0.99 0.66 0.12 12 1.05 1.39 0.40
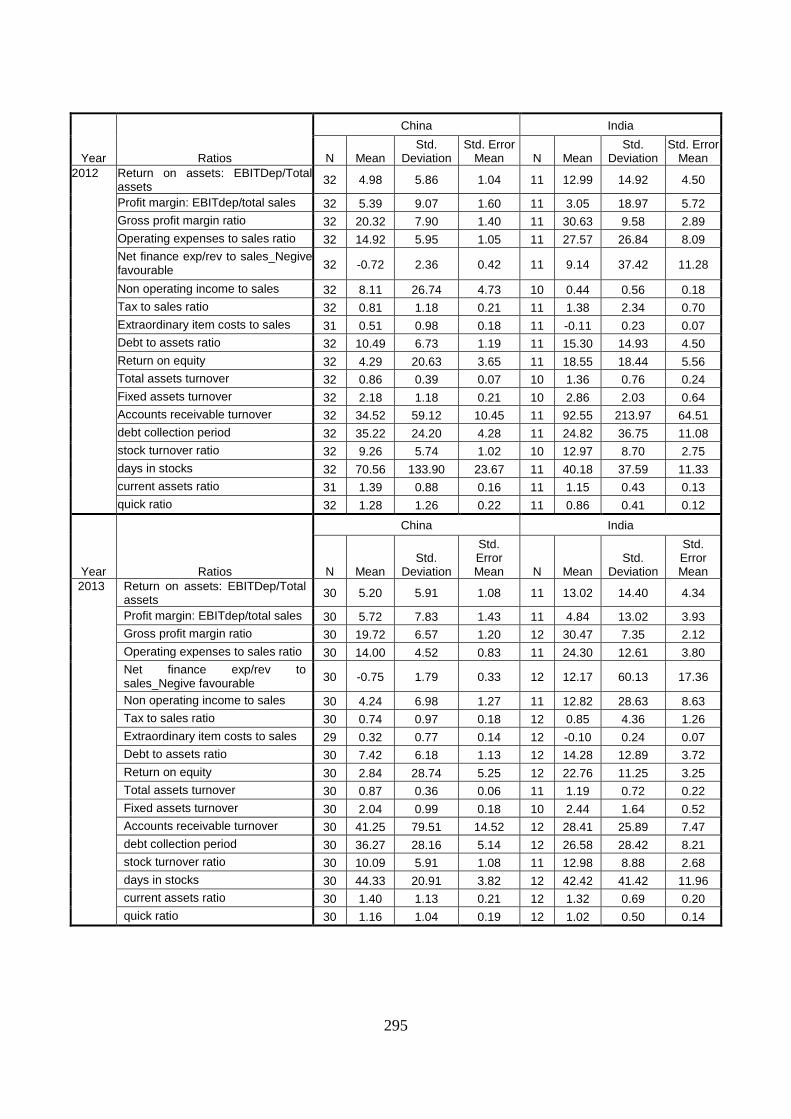
295
Year Ratios
China India
N Mean Std.
Deviation Std. Error
Mean N Mean Std.
Deviation Std. Error
Mean
2012 Return on assets: EBITDep/Total assets
32 4.98 5.86 1.04 11 12.99 14.92 4.50
Profit margin: EBITdep/total sales 32 5.39 9.07 1.60 11 3.05 18.97 5.72
Gross profit margin ratio 32 20.32 7.90 1.40 11 30.63 9.58 2.89
Operating expenses to sales ratio 32 14.92 5.95 1.05 11 27.57 26.84 8.09
Net finance exp/rev to sales_Negive favourable 32 -0.72 2.36 0.42 11 9.14 37.42 11.28
Non operating income to sales 32 8.11 26.74 4.73 10 0.44 0.56 0.18
Tax to sales ratio 32 0.81 1.18 0.21 11 1.38 2.34 0.70
Extraordinary item costs to sales 31 0.51 0.98 0.18 11 -0.11 0.23 0.07
Debt to assets ratio 32 10.49 6.73 1.19 11 15.30 14.93 4.50
Return on equity 32 4.29 20.63 3.65 11 18.55 18.44 5.56
Total assets turnover 32 0.86 0.39 0.07 10 1.36 0.76 0.24
Fixed assets turnover 32 2.18 1.18 0.21 10 2.86 2.03 0.64
Accounts receivable turnover 32 34.52 59.12 10.45 11 92.55 213.97 64.51
debt collection period 32 35.22 24.20 4.28 11 24.82 36.75 11.08
stock turnover ratio 32 9.26 5.74 1.02 10 12.97 8.70 2.75
days in stocks 32 70.56 133.90 23.67 11 40.18 37.59 11.33
current assets ratio 31 1.39 0.88 0.16 11 1.15 0.43 0.13
quick ratio 32 1.28 1.26 0.22 11 0.86 0.41 0.12
Year Ratios
China India
N Mean Std.
Deviation
Std. Error Mean N Mean
Std. Deviation
Std. Error Mean
2013 Return on assets: EBITDep/Total assets
30 5.20 5.91 1.08 11 13.02 14.40 4.34
Profit margin: EBITdep/total sales 30 5.72 7.83 1.43 11 4.84 13.02 3.93
Gross profit margin ratio 30 19.72 6.57 1.20 12 30.47 7.35 2.12
Operating expenses to sales ratio 30 14.00 4.52 0.83 11 24.30 12.61 3.80
Net finance exp/rev to sales_Negive favourable
30 -0.75 1.79 0.33 12 12.17 60.13 17.36
Non operating income to sales 30 4.24 6.98 1.27 11 12.82 28.63 8.63
Tax to sales ratio 30 0.74 0.97 0.18 12 0.85 4.36 1.26
Extraordinary item costs to sales 29 0.32 0.77 0.14 12 -0.10 0.24 0.07
Debt to assets ratio 30 7.42 6.18 1.13 12 14.28 12.89 3.72
Return on equity 30 2.84 28.74 5.25 12 22.76 11.25 3.25
Total assets turnover 30 0.87 0.36 0.06 11 1.19 0.72 0.22
Fixed assets turnover 30 2.04 0.99 0.18 10 2.44 1.64 0.52
Accounts receivable turnover 30 41.25 79.51 14.52 12 28.41 25.89 7.47
debt collection period 30 36.27 28.16 5.14 12 26.58 28.42 8.21
stock turnover ratio 30 10.09 5.91 1.08 11 12.98 8.88 2.68
days in stocks 30 44.33 20.91 3.82 12 42.42 41.42 11.96
current assets ratio 30 1.40 1.13 0.21 12 1.32 0.69 0.20
quick ratio 30 1.16 1.04 0.19 12 1.02 0.50 0.14
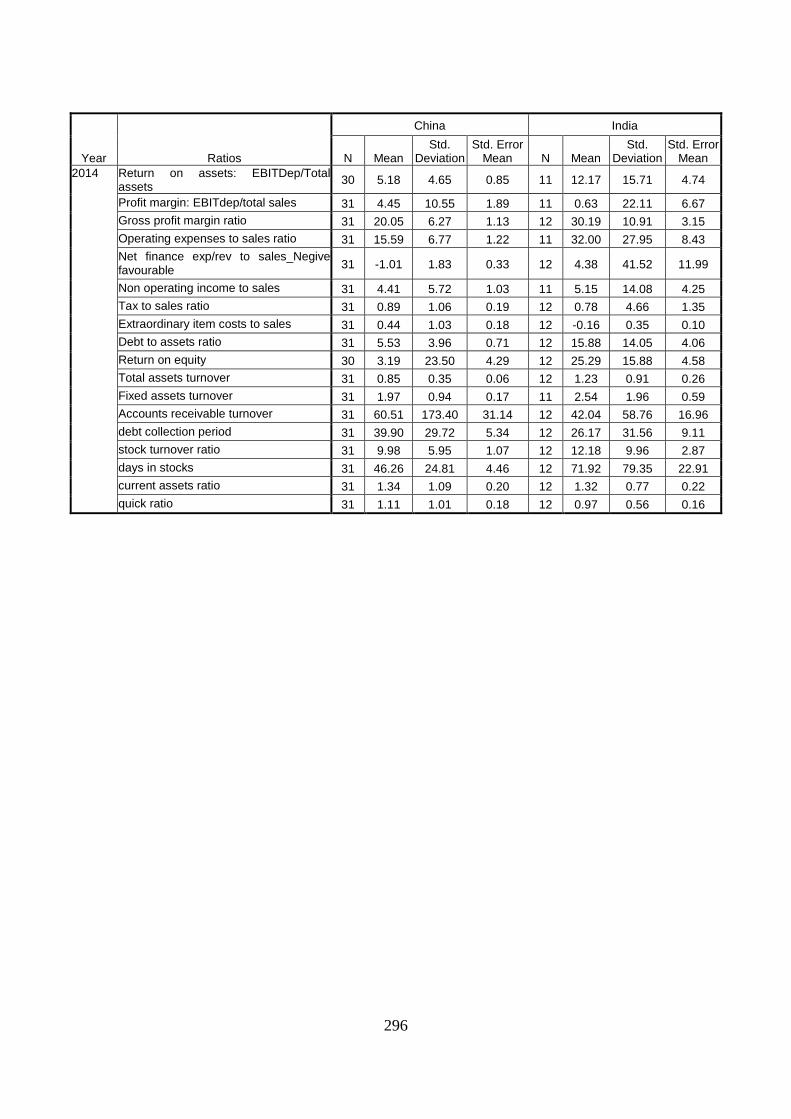
296
Year Ratios
China India
N Mean Std.
Deviation Std. Error
Mean N Mean Std.
Deviation Std. Error
Mean
2014 Return on assets: EBITDep/Total assets
30 5.18 4.65 0.85 11 12.17 15.71 4.74
Profit margin: EBITdep/total sales 31 4.45 10.55 1.89 11 0.63 22.11 6.67
Gross profit margin ratio 31 20.05 6.27 1.13 12 30.19 10.91 3.15
Operating expenses to sales ratio 31 15.59 6.77 1.22 11 32.00 27.95 8.43
Net finance exp/rev to sales_Negive favourable
31 -1.01 1.83 0.33 12 4.38 41.52 11.99
Non operating income to sales 31 4.41 5.72 1.03 11 5.15 14.08 4.25
Tax to sales ratio 31 0.89 1.06 0.19 12 0.78 4.66 1.35
Extraordinary item costs to sales 31 0.44 1.03 0.18 12 -0.16 0.35 0.10
Debt to assets ratio 31 5.53 3.96 0.71 12 15.88 14.05 4.06
Return on equity 30 3.19 23.50 4.29 12 25.29 15.88 4.58
Total assets turnover 31 0.85 0.35 0.06 12 1.23 0.91 0.26
Fixed assets turnover 31 1.97 0.94 0.17 11 2.54 1.96 0.59
Accounts receivable turnover 31 60.51 173.40 31.14 12 42.04 58.76 16.96
debt collection period 31 39.90 29.72 5.34 12 26.17 31.56 9.11
stock turnover ratio 31 9.98 5.95 1.07 12 12.18 9.96 2.87
days in stocks 31 46.26 24.81 4.46 12 71.92 79.35 22.91
current assets ratio 31 1.34 1.09 0.20 12 1.32 0.77 0.22
quick ratio 31 1.11 1.01 0.18 12 0.97 0.56 0.16
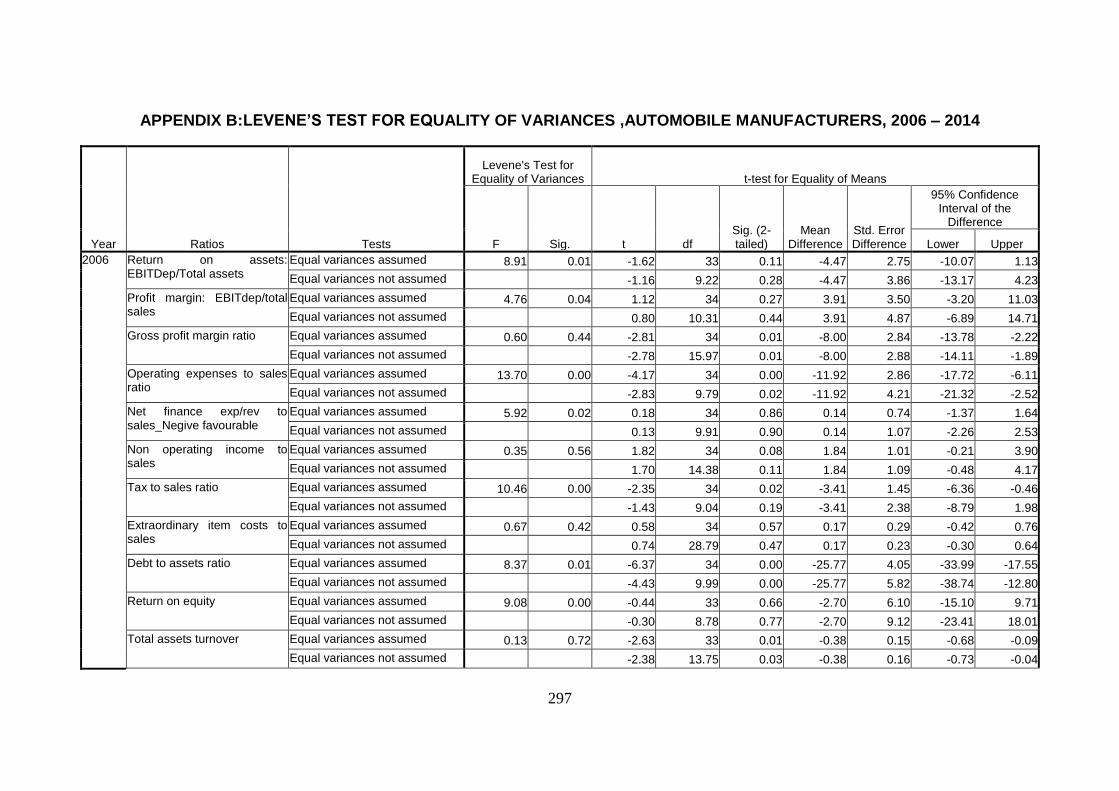
297
APPENDIX B:LEVENE’S TEST FOR EQUALITY OF VARIANCES ,AUTOMOBILE MANUFACTURERS, 2006 – 2014
Year Ratios Tests
Levene's Test for Equality of Variances t-test for Equality of Means
F Sig. t df Sig. (2-tailed)
Mean Difference
Std. Error Difference
95% Confidence Interval of the
Difference
Lower Upper
2006 Return on assets: EBITDep/Total assets
Equal variances assumed 8.91 0.01 -1.62 33 0.11 -4.47 2.75 -10.07 1.13
Equal variances not assumed -1.16 9.22 0.28 -4.47 3.86 -13.17 4.23
Profit margin: EBITdep/total sales
Equal variances assumed 4.76 0.04 1.12 34 0.27 3.91 3.50 -3.20 11.03
Equal variances not assumed 0.80 10.31 0.44 3.91 4.87 -6.89 14.71
Gross profit margin ratio Equal variances assumed 0.60 0.44 -2.81 34 0.01 -8.00 2.84 -13.78 -2.22
Equal variances not assumed -2.78 15.97 0.01 -8.00 2.88 -14.11 -1.89
Operating expenses to sales ratio
Equal variances assumed 13.70 0.00 -4.17 34 0.00 -11.92 2.86 -17.72 -6.11
Equal variances not assumed -2.83 9.79 0.02 -11.92 4.21 -21.32 -2.52
Net finance exp/rev to sales_Negive favourable
Equal variances assumed 5.92 0.02 0.18 34 0.86 0.14 0.74 -1.37 1.64
Equal variances not assumed 0.13 9.91 0.90 0.14 1.07 -2.26 2.53
Non operating income to sales
Equal variances assumed 0.35 0.56 1.82 34 0.08 1.84 1.01 -0.21 3.90
Equal variances not assumed 1.70 14.38 0.11 1.84 1.09 -0.48 4.17
Tax to sales ratio Equal variances assumed 10.46 0.00 -2.35 34 0.02 -3.41 1.45 -6.36 -0.46
Equal variances not assumed -1.43 9.04 0.19 -3.41 2.38 -8.79 1.98
Extraordinary item costs to sales
Equal variances assumed 0.67 0.42 0.58 34 0.57 0.17 0.29 -0.42 0.76
Equal variances not assumed 0.74 28.79 0.47 0.17 0.23 -0.30 0.64
Debt to assets ratio Equal variances assumed 8.37 0.01 -6.37 34 0.00 -25.77 4.05 -33.99 -17.55
Equal variances not assumed -4.43 9.99 0.00 -25.77 5.82 -38.74 -12.80
Return on equity Equal variances assumed 9.08 0.00 -0.44 33 0.66 -2.70 6.10 -15.10 9.71
Equal variances not assumed -0.30 8.78 0.77 -2.70 9.12 -23.41 18.01
Total assets turnover Equal variances assumed 0.13 0.72 -2.63 33 0.01 -0.38 0.15 -0.68 -0.09
Equal variances not assumed -2.38 13.75 0.03 -0.38 0.16 -0.73 -0.04
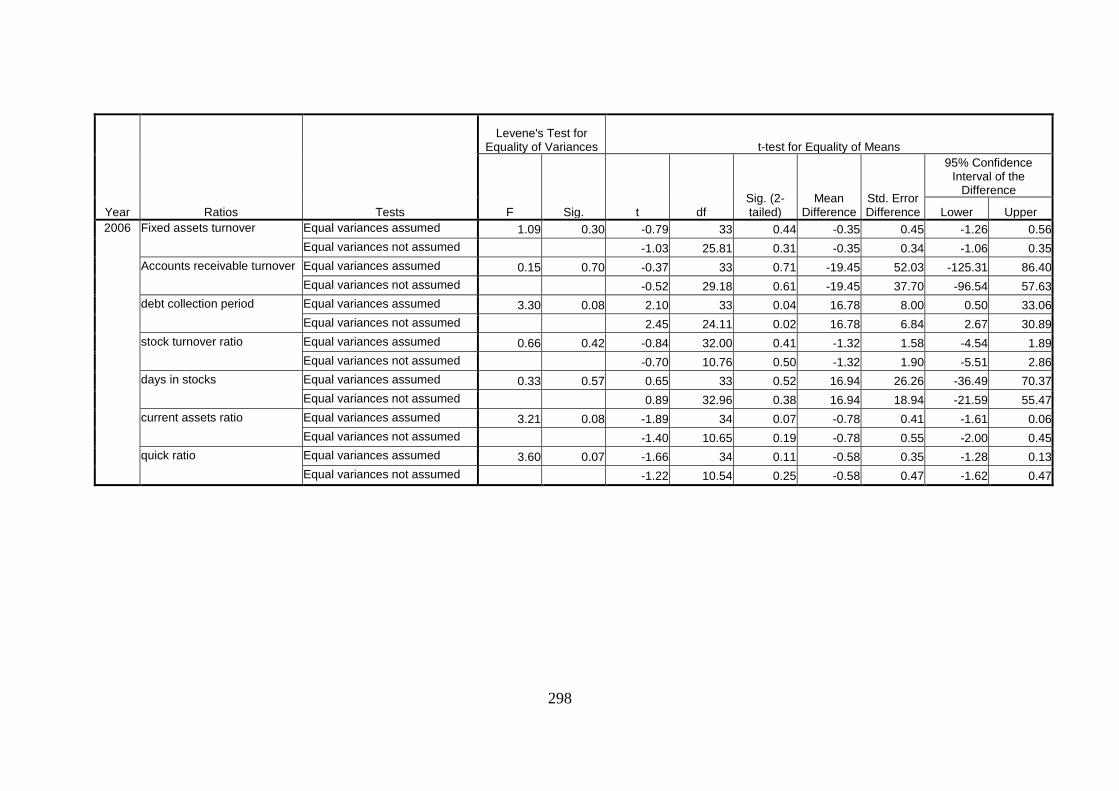
298
Year Ratios Tests
Levene's Test for Equality of Variances t-test for Equality of Means
F Sig. t df Sig. (2-tailed)
Mean Difference
Std. Error Difference
95% Confidence Interval of the
Difference
Lower Upper
2006 Fixed assets turnover Equal variances assumed 1.09 0.30 -0.79 33 0.44 -0.35 0.45 -1.26 0.56
Equal variances not assumed -1.03 25.81 0.31 -0.35 0.34 -1.06 0.35
Accounts receivable turnover Equal variances assumed 0.15 0.70 -0.37 33 0.71 -19.45 52.03 -125.31 86.40
Equal variances not assumed -0.52 29.18 0.61 -19.45 37.70 -96.54 57.63
debt collection period Equal variances assumed 3.30 0.08 2.10 33 0.04 16.78 8.00 0.50 33.06
Equal variances not assumed 2.45 24.11 0.02 16.78 6.84 2.67 30.89
stock turnover ratio Equal variances assumed 0.66 0.42 -0.84 32.00 0.41 -1.32 1.58 -4.54 1.89
Equal variances not assumed -0.70 10.76 0.50 -1.32 1.90 -5.51 2.86
days in stocks Equal variances assumed 0.33 0.57 0.65 33 0.52 16.94 26.26 -36.49 70.37
Equal variances not assumed 0.89 32.96 0.38 16.94 18.94 -21.59 55.47
current assets ratio Equal variances assumed 3.21 0.08 -1.89 34 0.07 -0.78 0.41 -1.61 0.06
Equal variances not assumed -1.40 10.65 0.19 -0.78 0.55 -2.00 0.45
quick ratio Equal variances assumed 3.60 0.07 -1.66 34 0.11 -0.58 0.35 -1.28 0.13
Equal variances not assumed -1.22 10.54 0.25 -0.58 0.47 -1.62 0.47
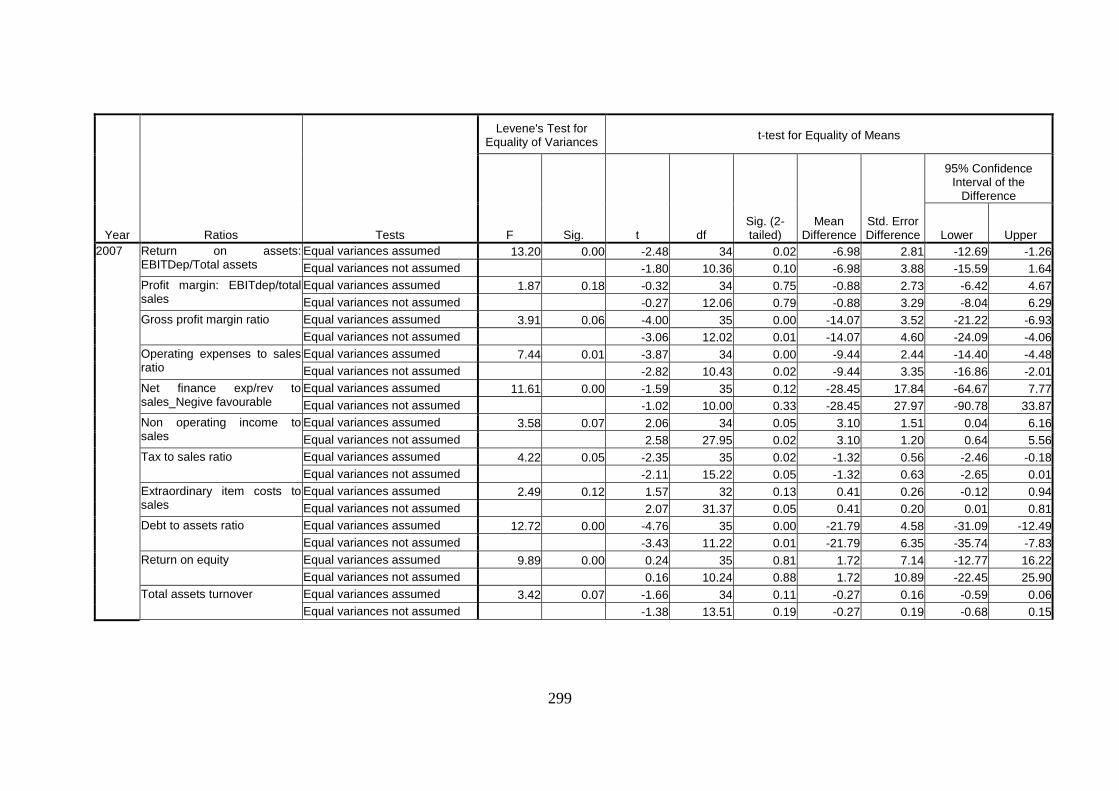
299
Year Ratios Tests
Levene's Test for Equality of Variances
t-test for Equality of Means
F Sig. t df Sig. (2-tailed)
Mean Difference
Std. Error Difference
95% Confidence Interval of the
Difference
Lower Upper
2007 Return on assets: EBITDep/Total assets
Equal variances assumed 13.20 0.00 -2.48 34 0.02 -6.98 2.81 -12.69 -1.26
Equal variances not assumed -1.80 10.36 0.10 -6.98 3.88 -15.59 1.64
Profit margin: EBITdep/total sales
Equal variances assumed 1.87 0.18 -0.32 34 0.75 -0.88 2.73 -6.42 4.67
Equal variances not assumed -0.27 12.06 0.79 -0.88 3.29 -8.04 6.29
Gross profit margin ratio Equal variances assumed 3.91 0.06 -4.00 35 0.00 -14.07 3.52 -21.22 -6.93
Equal variances not assumed -3.06 12.02 0.01 -14.07 4.60 -24.09 -4.06
Operating expenses to sales ratio
Equal variances assumed 7.44 0.01 -3.87 34 0.00 -9.44 2.44 -14.40 -4.48
Equal variances not assumed -2.82 10.43 0.02 -9.44 3.35 -16.86 -2.01
Net finance exp/rev to sales_Negive favourable
Equal variances assumed 11.61 0.00 -1.59 35 0.12 -28.45 17.84 -64.67 7.77
Equal variances not assumed -1.02 10.00 0.33 -28.45 27.97 -90.78 33.87
Non operating income to sales
Equal variances assumed 3.58 0.07 2.06 34 0.05 3.10 1.51 0.04 6.16
Equal variances not assumed 2.58 27.95 0.02 3.10 1.20 0.64 5.56
Tax to sales ratio Equal variances assumed 4.22 0.05 -2.35 35 0.02 -1.32 0.56 -2.46 -0.18
Equal variances not assumed -2.11 15.22 0.05 -1.32 0.63 -2.65 0.01
Extraordinary item costs to sales
Equal variances assumed 2.49 0.12 1.57 32 0.13 0.41 0.26 -0.12 0.94
Equal variances not assumed 2.07 31.37 0.05 0.41 0.20 0.01 0.81
Debt to assets ratio Equal variances assumed 12.72 0.00 -4.76 35 0.00 -21.79 4.58 -31.09 -12.49
Equal variances not assumed -3.43 11.22 0.01 -21.79 6.35 -35.74 -7.83
Return on equity Equal variances assumed 9.89 0.00 0.24 35 0.81 1.72 7.14 -12.77 16.22
Equal variances not assumed 0.16 10.24 0.88 1.72 10.89 -22.45 25.90
Total assets turnover Equal variances assumed 3.42 0.07 -1.66 34 0.11 -0.27 0.16 -0.59 0.06
Equal variances not assumed -1.38 13.51 0.19 -0.27 0.19 -0.68 0.15
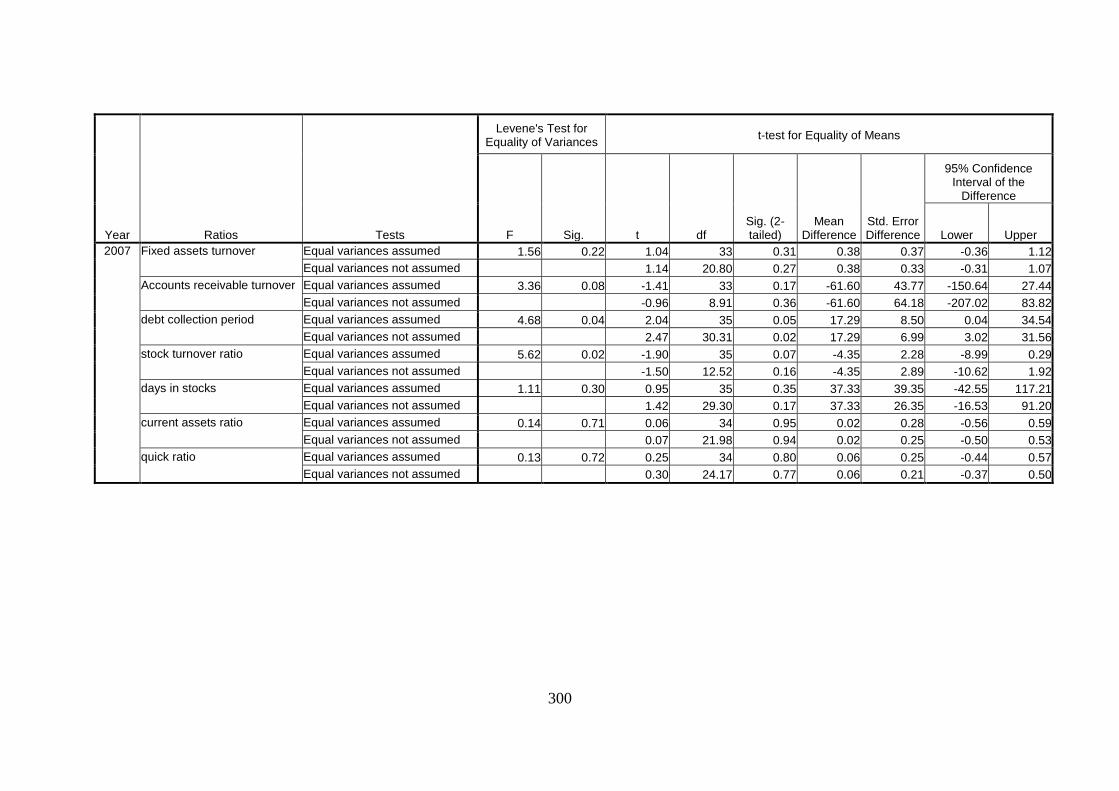
300
Year Ratios Tests
Levene's Test for Equality of Variances
t-test for Equality of Means
F Sig. t df Sig. (2-tailed)
Mean Difference
Std. Error Difference
95% Confidence Interval of the
Difference
Lower Upper
2007 Fixed assets turnover Equal variances assumed 1.56 0.22 1.04 33 0.31 0.38 0.37 -0.36 1.12
Equal variances not assumed 1.14 20.80 0.27 0.38 0.33 -0.31 1.07
Accounts receivable turnover Equal variances assumed 3.36 0.08 -1.41 33 0.17 -61.60 43.77 -150.64 27.44
Equal variances not assumed -0.96 8.91 0.36 -61.60 64.18 -207.02 83.82
debt collection period Equal variances assumed 4.68 0.04 2.04 35 0.05 17.29 8.50 0.04 34.54
Equal variances not assumed 2.47 30.31 0.02 17.29 6.99 3.02 31.56
stock turnover ratio Equal variances assumed 5.62 0.02 -1.90 35 0.07 -4.35 2.28 -8.99 0.29
Equal variances not assumed -1.50 12.52 0.16 -4.35 2.89 -10.62 1.92
days in stocks Equal variances assumed 1.11 0.30 0.95 35 0.35 37.33 39.35 -42.55 117.21
Equal variances not assumed 1.42 29.30 0.17 37.33 26.35 -16.53 91.20
current assets ratio Equal variances assumed 0.14 0.71 0.06 34 0.95 0.02 0.28 -0.56 0.59
Equal variances not assumed 0.07 21.98 0.94 0.02 0.25 -0.50 0.53
quick ratio Equal variances assumed 0.13 0.72 0.25 34 0.80 0.06 0.25 -0.44 0.57
Equal variances not assumed 0.30 24.17 0.77 0.06 0.21 -0.37 0.50
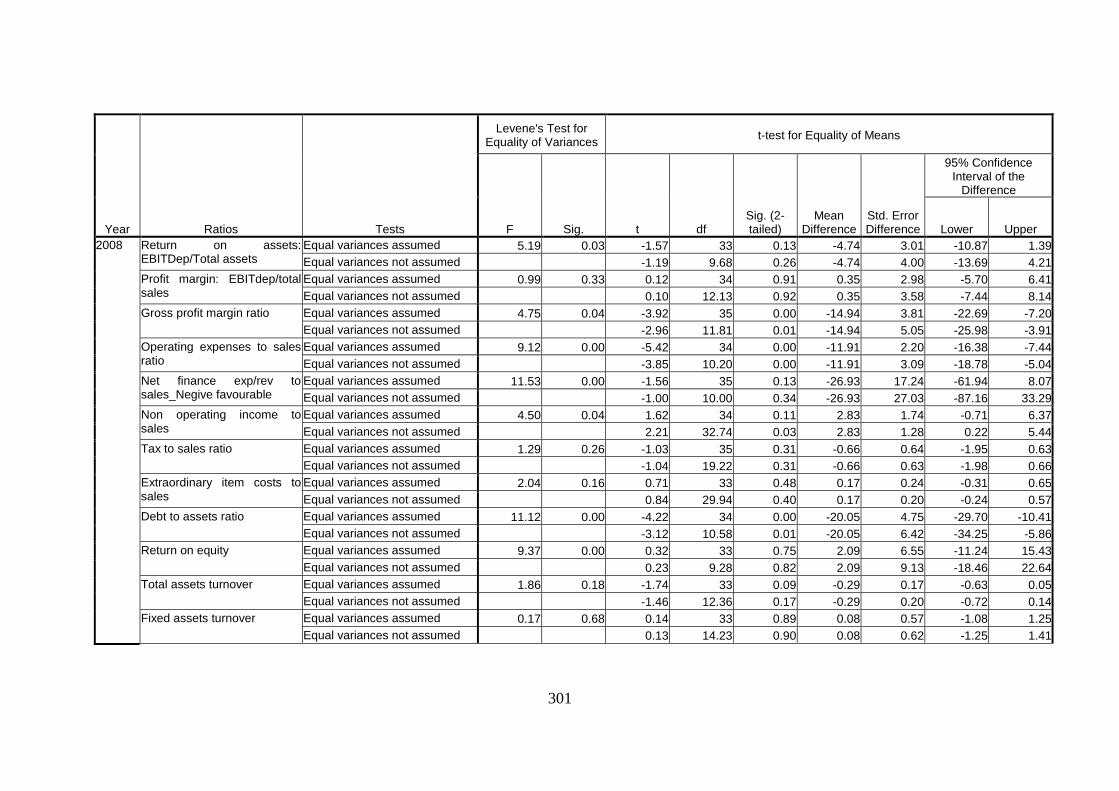
301
Year Ratios Tests
Levene's Test for Equality of Variances
t-test for Equality of Means
F Sig. t df Sig. (2-tailed)
Mean Difference
Std. Error Difference
95% Confidence Interval of the
Difference
Lower Upper
2008 Return on assets: EBITDep/Total assets
Equal variances assumed 5.19 0.03 -1.57 33 0.13 -4.74 3.01 -10.87 1.39
Equal variances not assumed -1.19 9.68 0.26 -4.74 4.00 -13.69 4.21
Profit margin: EBITdep/total sales
Equal variances assumed 0.99 0.33 0.12 34 0.91 0.35 2.98 -5.70 6.41
Equal variances not assumed 0.10 12.13 0.92 0.35 3.58 -7.44 8.14
Gross profit margin ratio Equal variances assumed 4.75 0.04 -3.92 35 0.00 -14.94 3.81 -22.69 -7.20
Equal variances not assumed -2.96 11.81 0.01 -14.94 5.05 -25.98 -3.91
Operating expenses to sales ratio
Equal variances assumed 9.12 0.00 -5.42 34 0.00 -11.91 2.20 -16.38 -7.44
Equal variances not assumed -3.85 10.20 0.00 -11.91 3.09 -18.78 -5.04
Net finance exp/rev to sales_Negive favourable
Equal variances assumed 11.53 0.00 -1.56 35 0.13 -26.93 17.24 -61.94 8.07
Equal variances not assumed -1.00 10.00 0.34 -26.93 27.03 -87.16 33.29
Non operating income to sales
Equal variances assumed 4.50 0.04 1.62 34 0.11 2.83 1.74 -0.71 6.37
Equal variances not assumed 2.21 32.74 0.03 2.83 1.28 0.22 5.44
Tax to sales ratio Equal variances assumed 1.29 0.26 -1.03 35 0.31 -0.66 0.64 -1.95 0.63
Equal variances not assumed -1.04 19.22 0.31 -0.66 0.63 -1.98 0.66
Extraordinary item costs to sales
Equal variances assumed 2.04 0.16 0.71 33 0.48 0.17 0.24 -0.31 0.65
Equal variances not assumed 0.84 29.94 0.40 0.17 0.20 -0.24 0.57
Debt to assets ratio Equal variances assumed 11.12 0.00 -4.22 34 0.00 -20.05 4.75 -29.70 -10.41
Equal variances not assumed -3.12 10.58 0.01 -20.05 6.42 -34.25 -5.86
Return on equity Equal variances assumed 9.37 0.00 0.32 33 0.75 2.09 6.55 -11.24 15.43
Equal variances not assumed 0.23 9.28 0.82 2.09 9.13 -18.46 22.64
Total assets turnover Equal variances assumed 1.86 0.18 -1.74 33 0.09 -0.29 0.17 -0.63 0.05
Equal variances not assumed -1.46 12.36 0.17 -0.29 0.20 -0.72 0.14
Fixed assets turnover Equal variances assumed 0.17 0.68 0.14 33 0.89 0.08 0.57 -1.08 1.25
Equal variances not assumed 0.13 14.23 0.90 0.08 0.62 -1.25 1.41
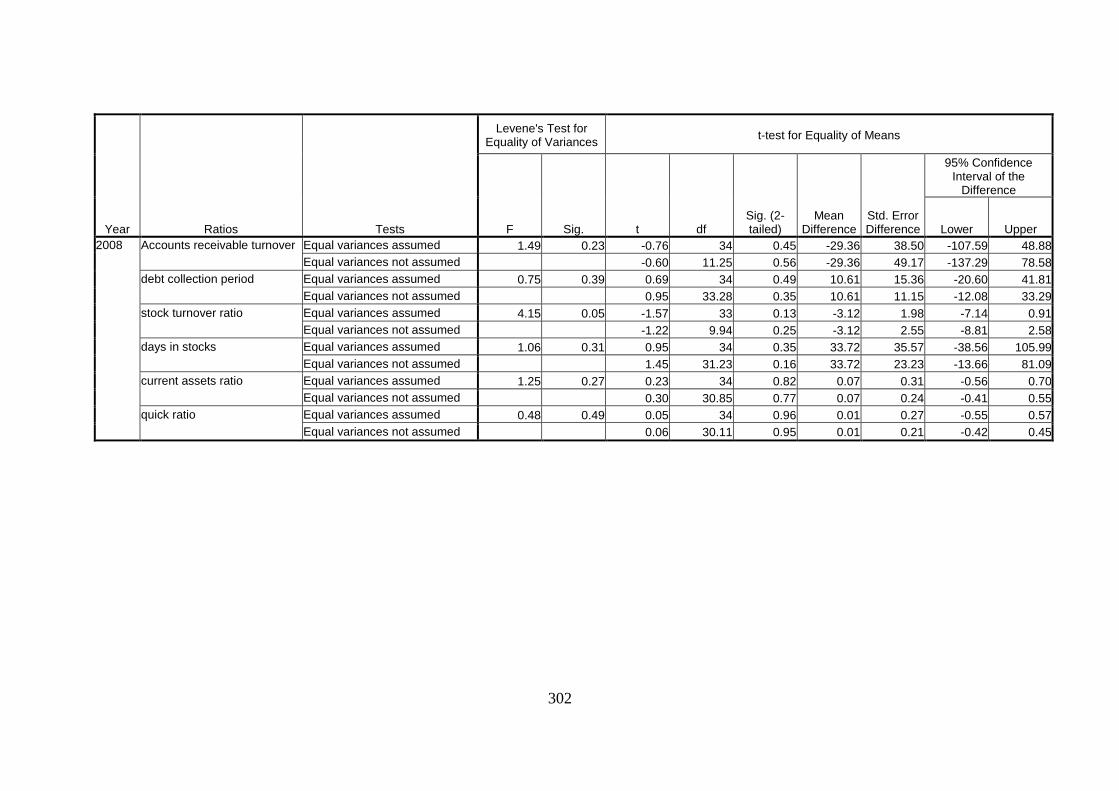
302
Year Ratios Tests
Levene's Test for Equality of Variances
t-test for Equality of Means
F Sig. t df Sig. (2-tailed)
Mean Difference
Std. Error Difference
95% Confidence Interval of the
Difference
Lower Upper
2008 Accounts receivable turnover Equal variances assumed 1.49 0.23 -0.76 34 0.45 -29.36 38.50 -107.59 48.88
Equal variances not assumed -0.60 11.25 0.56 -29.36 49.17 -137.29 78.58
debt collection period Equal variances assumed 0.75 0.39 0.69 34 0.49 10.61 15.36 -20.60 41.81
Equal variances not assumed 0.95 33.28 0.35 10.61 11.15 -12.08 33.29
stock turnover ratio Equal variances assumed 4.15 0.05 -1.57 33 0.13 -3.12 1.98 -7.14 0.91
Equal variances not assumed -1.22 9.94 0.25 -3.12 2.55 -8.81 2.58
days in stocks Equal variances assumed 1.06 0.31 0.95 34 0.35 33.72 35.57 -38.56 105.99
Equal variances not assumed 1.45 31.23 0.16 33.72 23.23 -13.66 81.09
current assets ratio Equal variances assumed 1.25 0.27 0.23 34 0.82 0.07 0.31 -0.56 0.70
Equal variances not assumed 0.30 30.85 0.77 0.07 0.24 -0.41 0.55
quick ratio Equal variances assumed 0.48 0.49 0.05 34 0.96 0.01 0.27 -0.55 0.57
Equal variances not assumed 0.06 30.11 0.95 0.01 0.21 -0.42 0.45
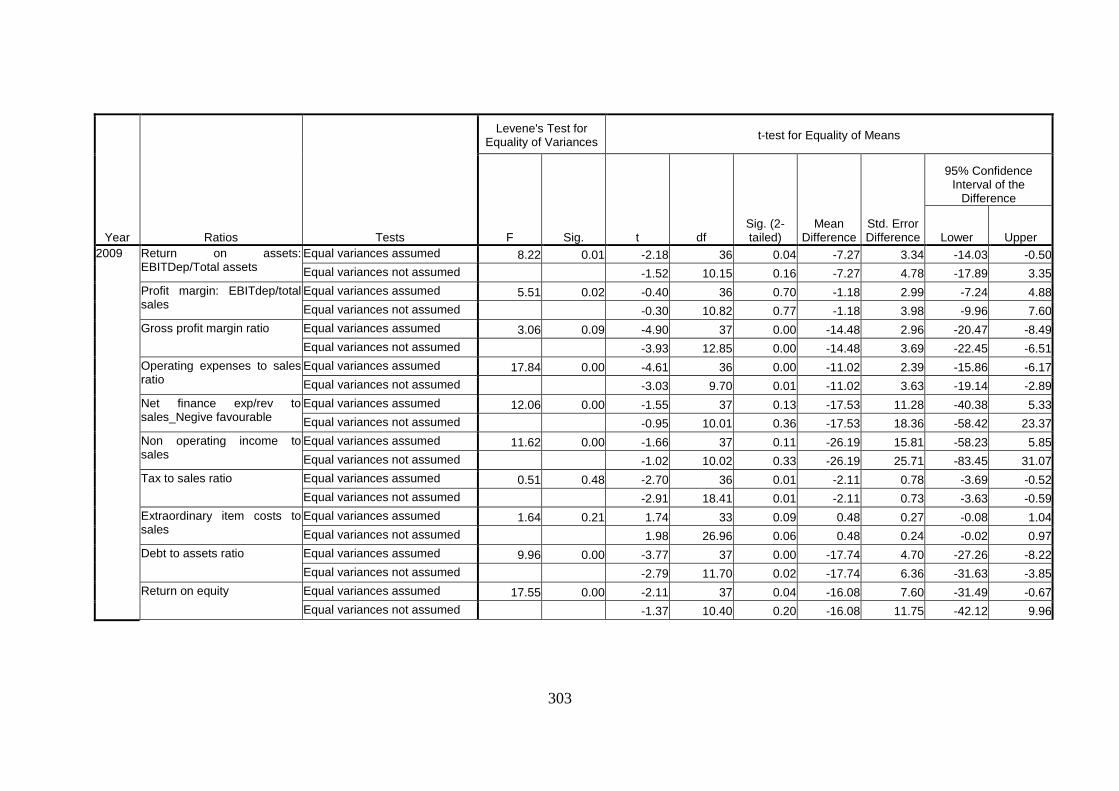
303
Year Ratios Tests
Levene's Test for Equality of Variances
t-test for Equality of Means
F Sig. t df Sig. (2-tailed)
Mean Difference
Std. Error Difference
95% Confidence Interval of the
Difference
Lower Upper
2009 Return on assets: EBITDep/Total assets
Equal variances assumed 8.22 0.01 -2.18 36 0.04 -7.27 3.34 -14.03 -0.50
Equal variances not assumed -1.52 10.15 0.16 -7.27 4.78 -17.89 3.35
Profit margin: EBITdep/total sales
Equal variances assumed 5.51 0.02 -0.40 36 0.70 -1.18 2.99 -7.24 4.88
Equal variances not assumed -0.30 10.82 0.77 -1.18 3.98 -9.96 7.60
Gross profit margin ratio Equal variances assumed 3.06 0.09 -4.90 37 0.00 -14.48 2.96 -20.47 -8.49
Equal variances not assumed -3.93 12.85 0.00 -14.48 3.69 -22.45 -6.51
Operating expenses to sales ratio
Equal variances assumed 17.84 0.00 -4.61 36 0.00 -11.02 2.39 -15.86 -6.17
Equal variances not assumed -3.03 9.70 0.01 -11.02 3.63 -19.14 -2.89
Net finance exp/rev to sales_Negive favourable
Equal variances assumed 12.06 0.00 -1.55 37 0.13 -17.53 11.28 -40.38 5.33
Equal variances not assumed -0.95 10.01 0.36 -17.53 18.36 -58.42 23.37
Non operating income to sales
Equal variances assumed 11.62 0.00 -1.66 37 0.11 -26.19 15.81 -58.23 5.85
Equal variances not assumed -1.02 10.02 0.33 -26.19 25.71 -83.45 31.07
Tax to sales ratio Equal variances assumed 0.51 0.48 -2.70 36 0.01 -2.11 0.78 -3.69 -0.52
Equal variances not assumed -2.91 18.41 0.01 -2.11 0.73 -3.63 -0.59
Extraordinary item costs to sales
Equal variances assumed 1.64 0.21 1.74 33 0.09 0.48 0.27 -0.08 1.04
Equal variances not assumed 1.98 26.96 0.06 0.48 0.24 -0.02 0.97
Debt to assets ratio Equal variances assumed 9.96 0.00 -3.77 37 0.00 -17.74 4.70 -27.26 -8.22
Equal variances not assumed -2.79 11.70 0.02 -17.74 6.36 -31.63 -3.85
Return on equity Equal variances assumed 17.55 0.00 -2.11 37 0.04 -16.08 7.60 -31.49 -0.67
Equal variances not assumed -1.37 10.40 0.20 -16.08 11.75 -42.12 9.96
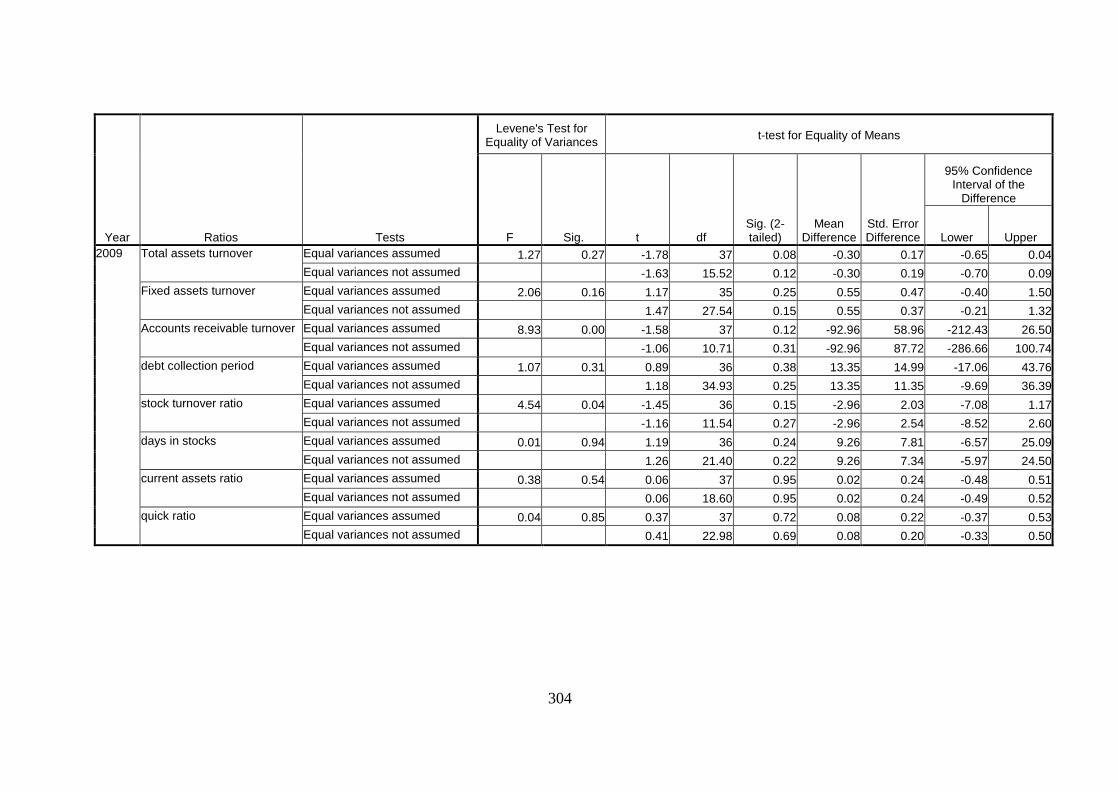
304
Year Ratios Tests
Levene's Test for Equality of Variances
t-test for Equality of Means
F Sig. t df Sig. (2-tailed)
Mean Difference
Std. Error Difference
95% Confidence Interval of the
Difference
Lower Upper
2009 Total assets turnover Equal variances assumed 1.27 0.27 -1.78 37 0.08 -0.30 0.17 -0.65 0.04
Equal variances not assumed -1.63 15.52 0.12 -0.30 0.19 -0.70 0.09
Fixed assets turnover Equal variances assumed 2.06 0.16 1.17 35 0.25 0.55 0.47 -0.40 1.50
Equal variances not assumed 1.47 27.54 0.15 0.55 0.37 -0.21 1.32
Accounts receivable turnover Equal variances assumed 8.93 0.00 -1.58 37 0.12 -92.96 58.96 -212.43 26.50
Equal variances not assumed -1.06 10.71 0.31 -92.96 87.72 -286.66 100.74
debt collection period Equal variances assumed 1.07 0.31 0.89 36 0.38 13.35 14.99 -17.06 43.76
Equal variances not assumed 1.18 34.93 0.25 13.35 11.35 -9.69 36.39
stock turnover ratio Equal variances assumed 4.54 0.04 -1.45 36 0.15 -2.96 2.03 -7.08 1.17
Equal variances not assumed -1.16 11.54 0.27 -2.96 2.54 -8.52 2.60
days in stocks Equal variances assumed 0.01 0.94 1.19 36 0.24 9.26 7.81 -6.57 25.09
Equal variances not assumed 1.26 21.40 0.22 9.26 7.34 -5.97 24.50
current assets ratio Equal variances assumed 0.38 0.54 0.06 37 0.95 0.02 0.24 -0.48 0.51
Equal variances not assumed 0.06 18.60 0.95 0.02 0.24 -0.49 0.52
quick ratio Equal variances assumed 0.04 0.85 0.37 37 0.72 0.08 0.22 -0.37 0.53
Equal variances not assumed 0.41 22.98 0.69 0.08 0.20 -0.33 0.50
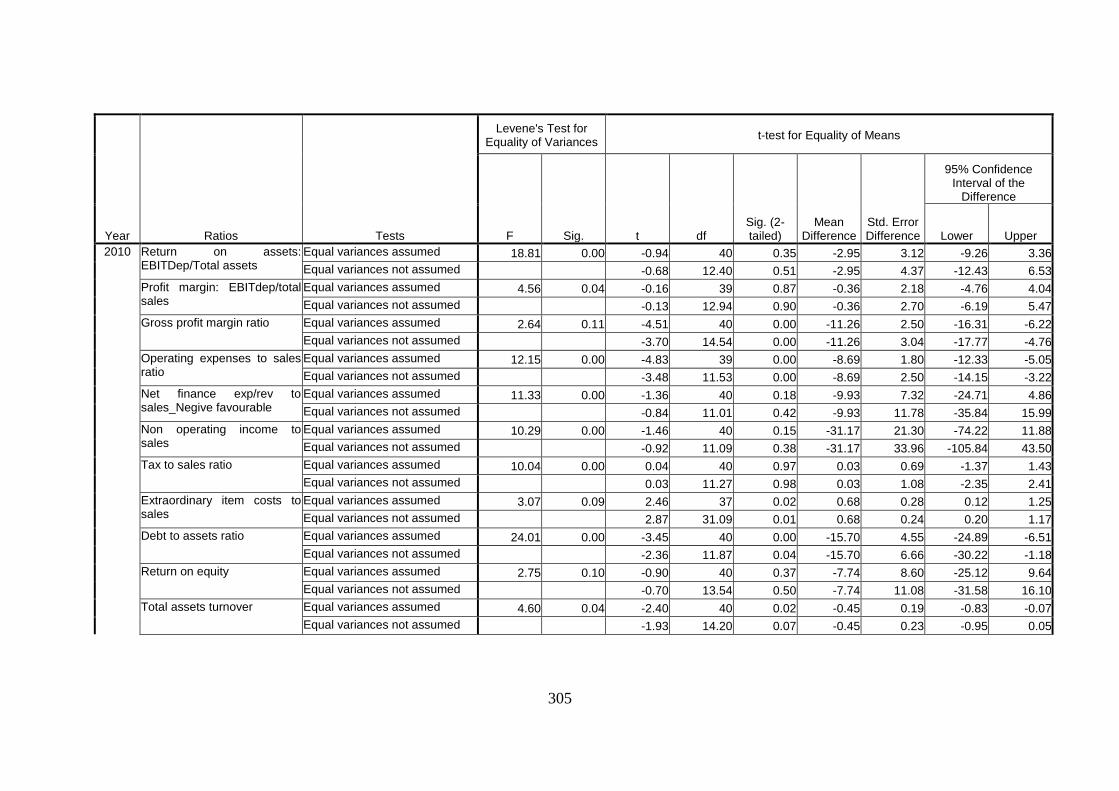
305
Year Ratios Tests
Levene's Test for Equality of Variances
t-test for Equality of Means
F Sig. t df Sig. (2-tailed)
Mean Difference
Std. Error Difference
95% Confidence Interval of the
Difference
Lower Upper
2010 Return on assets: EBITDep/Total assets
Equal variances assumed 18.81 0.00 -0.94 40 0.35 -2.95 3.12 -9.26 3.36
Equal variances not assumed -0.68 12.40 0.51 -2.95 4.37 -12.43 6.53
Profit margin: EBITdep/total sales
Equal variances assumed 4.56 0.04 -0.16 39 0.87 -0.36 2.18 -4.76 4.04
Equal variances not assumed -0.13 12.94 0.90 -0.36 2.70 -6.19 5.47
Gross profit margin ratio Equal variances assumed 2.64 0.11 -4.51 40 0.00 -11.26 2.50 -16.31 -6.22
Equal variances not assumed -3.70 14.54 0.00 -11.26 3.04 -17.77 -4.76
Operating expenses to sales ratio
Equal variances assumed 12.15 0.00 -4.83 39 0.00 -8.69 1.80 -12.33 -5.05
Equal variances not assumed -3.48 11.53 0.00 -8.69 2.50 -14.15 -3.22
Net finance exp/rev to sales_Negive favourable
Equal variances assumed 11.33 0.00 -1.36 40 0.18 -9.93 7.32 -24.71 4.86
Equal variances not assumed -0.84 11.01 0.42 -9.93 11.78 -35.84 15.99
Non operating income to sales
Equal variances assumed 10.29 0.00 -1.46 40 0.15 -31.17 21.30 -74.22 11.88
Equal variances not assumed -0.92 11.09 0.38 -31.17 33.96 -105.84 43.50
Tax to sales ratio Equal variances assumed 10.04 0.00 0.04 40 0.97 0.03 0.69 -1.37 1.43
Equal variances not assumed 0.03 11.27 0.98 0.03 1.08 -2.35 2.41
Extraordinary item costs to sales
Equal variances assumed 3.07 0.09 2.46 37 0.02 0.68 0.28 0.12 1.25
Equal variances not assumed 2.87 31.09 0.01 0.68 0.24 0.20 1.17
Debt to assets ratio Equal variances assumed 24.01 0.00 -3.45 40 0.00 -15.70 4.55 -24.89 -6.51
Equal variances not assumed -2.36 11.87 0.04 -15.70 6.66 -30.22 -1.18
Return on equity Equal variances assumed 2.75 0.10 -0.90 40 0.37 -7.74 8.60 -25.12 9.64
Equal variances not assumed -0.70 13.54 0.50 -7.74 11.08 -31.58 16.10
Total assets turnover Equal variances assumed 4.60 0.04 -2.40 40 0.02 -0.45 0.19 -0.83 -0.07
Equal variances not assumed -1.93 14.20 0.07 -0.45 0.23 -0.95 0.05

306
Year Ratios Tests
Levene's Test for Equality of Variances
t-test for Equality of Means
F Sig. t df Sig. (2-tailed)
Mean Difference
Std. Error Difference
95% Confidence Interval of the
Difference
Lower Upper
2010 Fixed assets turnover Equal variances assumed 0.14 0.71 0.70 39 0.49 0.36 0.51 -0.68 1.40
Equal variances not assumed 0.69 17.56 0.50 0.36 0.52 -0.73 1.45
Accounts receivable turnover Equal variances assumed 21.13 0.00 -2.39 40 0.02 -248.27 104.02 -458.51 -38.03
Equal variances not assumed -1.52 11.20 0.16 -248.27 163.55 -607.45 110.92
debt collection period Equal variances assumed 0.01 0.91 1.07 40 0.29 8.77 8.21 -7.83 25.36
Equal variances not assumed 1.06 19.91 0.30 8.77 8.29 -8.54 26.07
stock turnover ratio Equal variances assumed 4.46 0.04 -1.54 39 0.13 -3.08 2.00 -7.13 0.97
Equal variances not assumed -1.15 11.90 0.27 -3.08 2.68 -8.93 2.77
days in stocks Equal variances assumed 0.68 0.41 0.79 40 0.43 26.67 33.77 -41.59 94.92
Equal variances not assumed 1.20 35.43 0.24 26.67 22.31 -18.61 71.95
current assets ratio Equal variances assumed 1.25 0.27 1.57 40 0.12 0.40 0.25 -0.11 0.90
Equal variances not assumed 1.91 32.24 0.06 0.40 0.21 -0.03 0.82
quick ratio Equal variances assumed 0.79 0.38 1.67 40 0.10 0.40 0.24 -0.08 0.89
Equal variances not assumed 2.02 31.53 0.05 0.40 0.20 0.00 0.81
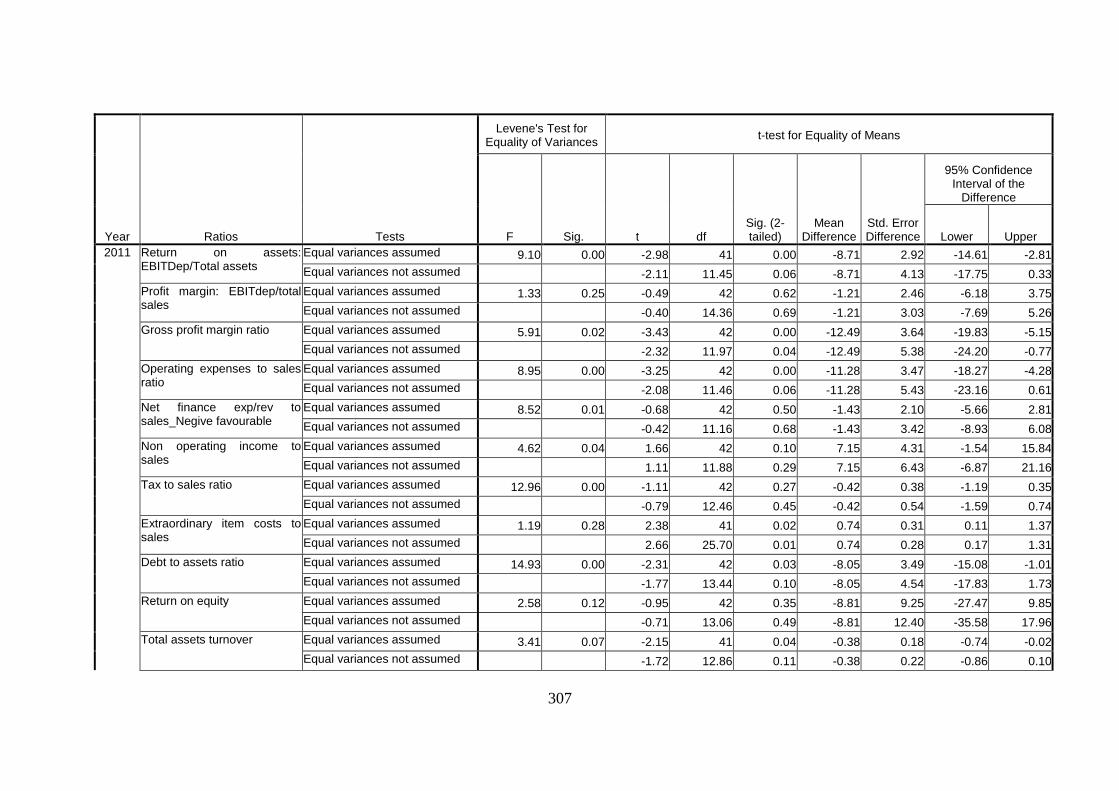
307
Year Ratios Tests
Levene's Test for Equality of Variances
t-test for Equality of Means
F Sig. t df Sig. (2-tailed)
Mean Difference
Std. Error Difference
95% Confidence Interval of the
Difference
Lower Upper
2011 Return on assets: EBITDep/Total assets
Equal variances assumed 9.10 0.00 -2.98 41 0.00 -8.71 2.92 -14.61 -2.81
Equal variances not assumed -2.11 11.45 0.06 -8.71 4.13 -17.75 0.33
Profit margin: EBITdep/total sales
Equal variances assumed 1.33 0.25 -0.49 42 0.62 -1.21 2.46 -6.18 3.75
Equal variances not assumed -0.40 14.36 0.69 -1.21 3.03 -7.69 5.26
Gross profit margin ratio Equal variances assumed 5.91 0.02 -3.43 42 0.00 -12.49 3.64 -19.83 -5.15
Equal variances not assumed -2.32 11.97 0.04 -12.49 5.38 -24.20 -0.77
Operating expenses to sales ratio
Equal variances assumed 8.95 0.00 -3.25 42 0.00 -11.28 3.47 -18.27 -4.28
Equal variances not assumed -2.08 11.46 0.06 -11.28 5.43 -23.16 0.61
Net finance exp/rev to sales_Negive favourable
Equal variances assumed 8.52 0.01 -0.68 42 0.50 -1.43 2.10 -5.66 2.81
Equal variances not assumed -0.42 11.16 0.68 -1.43 3.42 -8.93 6.08
Non operating income to sales
Equal variances assumed 4.62 0.04 1.66 42 0.10 7.15 4.31 -1.54 15.84
Equal variances not assumed 1.11 11.88 0.29 7.15 6.43 -6.87 21.16
Tax to sales ratio Equal variances assumed 12.96 0.00 -1.11 42 0.27 -0.42 0.38 -1.19 0.35
Equal variances not assumed -0.79 12.46 0.45 -0.42 0.54 -1.59 0.74
Extraordinary item costs to sales
Equal variances assumed 1.19 0.28 2.38 41 0.02 0.74 0.31 0.11 1.37
Equal variances not assumed 2.66 25.70 0.01 0.74 0.28 0.17 1.31
Debt to assets ratio Equal variances assumed 14.93 0.00 -2.31 42 0.03 -8.05 3.49 -15.08 -1.01
Equal variances not assumed -1.77 13.44 0.10 -8.05 4.54 -17.83 1.73
Return on equity Equal variances assumed 2.58 0.12 -0.95 42 0.35 -8.81 9.25 -27.47 9.85
Equal variances not assumed -0.71 13.06 0.49 -8.81 12.40 -35.58 17.96
Total assets turnover Equal variances assumed 3.41 0.07 -2.15 41 0.04 -0.38 0.18 -0.74 -0.02
Equal variances not assumed -1.72 12.86 0.11 -0.38 0.22 -0.86 0.10
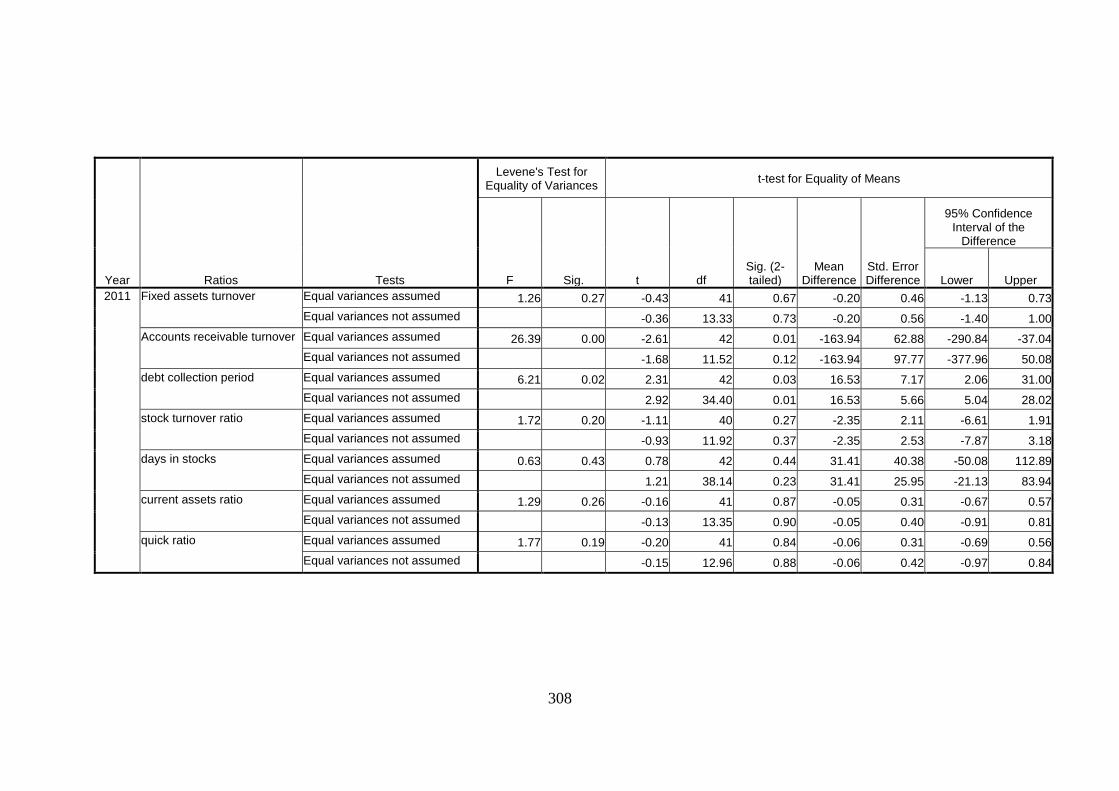
308
Year Ratios Tests
Levene's Test for Equality of Variances
t-test for Equality of Means
F Sig. t df Sig. (2-tailed)
Mean Difference
Std. Error Difference
95% Confidence Interval of the
Difference
Lower Upper
2011 Fixed assets turnover Equal variances assumed 1.26 0.27 -0.43 41 0.67 -0.20 0.46 -1.13 0.73
Equal variances not assumed -0.36 13.33 0.73 -0.20 0.56 -1.40 1.00
Accounts receivable turnover Equal variances assumed 26.39 0.00 -2.61 42 0.01 -163.94 62.88 -290.84 -37.04
Equal variances not assumed -1.68 11.52 0.12 -163.94 97.77 -377.96 50.08
debt collection period Equal variances assumed 6.21 0.02 2.31 42 0.03 16.53 7.17 2.06 31.00
Equal variances not assumed 2.92 34.40 0.01 16.53 5.66 5.04 28.02
stock turnover ratio Equal variances assumed 1.72 0.20 -1.11 40 0.27 -2.35 2.11 -6.61 1.91
Equal variances not assumed -0.93 11.92 0.37 -2.35 2.53 -7.87 3.18
days in stocks Equal variances assumed 0.63 0.43 0.78 42 0.44 31.41 40.38 -50.08 112.89
Equal variances not assumed 1.21 38.14 0.23 31.41 25.95 -21.13 83.94
current assets ratio Equal variances assumed 1.29 0.26 -0.16 41 0.87 -0.05 0.31 -0.67 0.57
Equal variances not assumed -0.13 13.35 0.90 -0.05 0.40 -0.91 0.81
quick ratio Equal variances assumed 1.77 0.19 -0.20 41 0.84 -0.06 0.31 -0.69 0.56
Equal variances not assumed -0.15 12.96 0.88 -0.06 0.42 -0.97 0.84
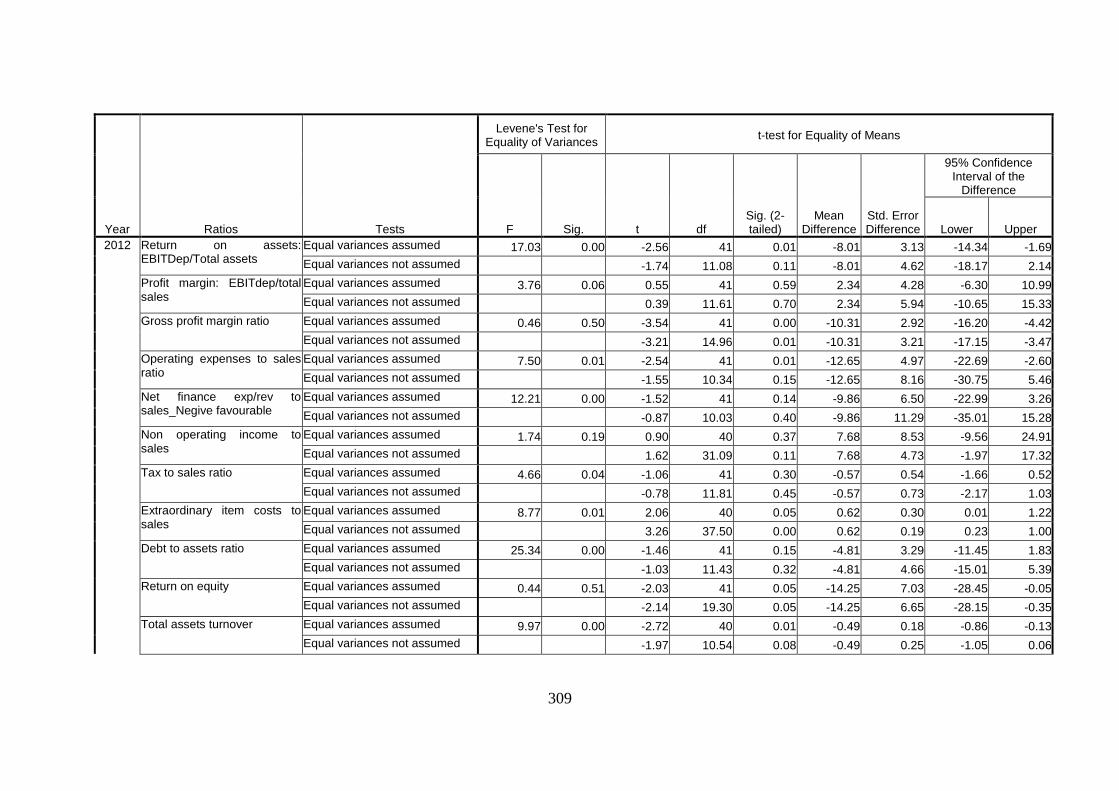
309
Year Ratios Tests
Levene's Test for Equality of Variances
t-test for Equality of Means
F Sig. t df Sig. (2-tailed)
Mean Difference
Std. Error Difference
95% Confidence Interval of the
Difference
Lower Upper
2012 Return on assets: EBITDep/Total assets
Equal variances assumed 17.03 0.00 -2.56 41 0.01 -8.01 3.13 -14.34 -1.69
Equal variances not assumed -1.74 11.08 0.11 -8.01 4.62 -18.17 2.14
Profit margin: EBITdep/total sales
Equal variances assumed 3.76 0.06 0.55 41 0.59 2.34 4.28 -6.30 10.99
Equal variances not assumed 0.39 11.61 0.70 2.34 5.94 -10.65 15.33
Gross profit margin ratio Equal variances assumed 0.46 0.50 -3.54 41 0.00 -10.31 2.92 -16.20 -4.42
Equal variances not assumed -3.21 14.96 0.01 -10.31 3.21 -17.15 -3.47
Operating expenses to sales ratio
Equal variances assumed 7.50 0.01 -2.54 41 0.01 -12.65 4.97 -22.69 -2.60
Equal variances not assumed -1.55 10.34 0.15 -12.65 8.16 -30.75 5.46
Net finance exp/rev to sales_Negive favourable
Equal variances assumed 12.21 0.00 -1.52 41 0.14 -9.86 6.50 -22.99 3.26
Equal variances not assumed -0.87 10.03 0.40 -9.86 11.29 -35.01 15.28
Non operating income to sales
Equal variances assumed 1.74 0.19 0.90 40 0.37 7.68 8.53 -9.56 24.91
Equal variances not assumed 1.62 31.09 0.11 7.68 4.73 -1.97 17.32
Tax to sales ratio Equal variances assumed 4.66 0.04 -1.06 41 0.30 -0.57 0.54 -1.66 0.52
Equal variances not assumed -0.78 11.81 0.45 -0.57 0.73 -2.17 1.03
Extraordinary item costs to sales
Equal variances assumed 8.77 0.01 2.06 40 0.05 0.62 0.30 0.01 1.22
Equal variances not assumed 3.26 37.50 0.00 0.62 0.19 0.23 1.00
Debt to assets ratio Equal variances assumed 25.34 0.00 -1.46 41 0.15 -4.81 3.29 -11.45 1.83
Equal variances not assumed -1.03 11.43 0.32 -4.81 4.66 -15.01 5.39
Return on equity Equal variances assumed 0.44 0.51 -2.03 41 0.05 -14.25 7.03 -28.45 -0.05
Equal variances not assumed -2.14 19.30 0.05 -14.25 6.65 -28.15 -0.35
Total assets turnover Equal variances assumed 9.97 0.00 -2.72 40 0.01 -0.49 0.18 -0.86 -0.13
Equal variances not assumed -1.97 10.54 0.08 -0.49 0.25 -1.05 0.06
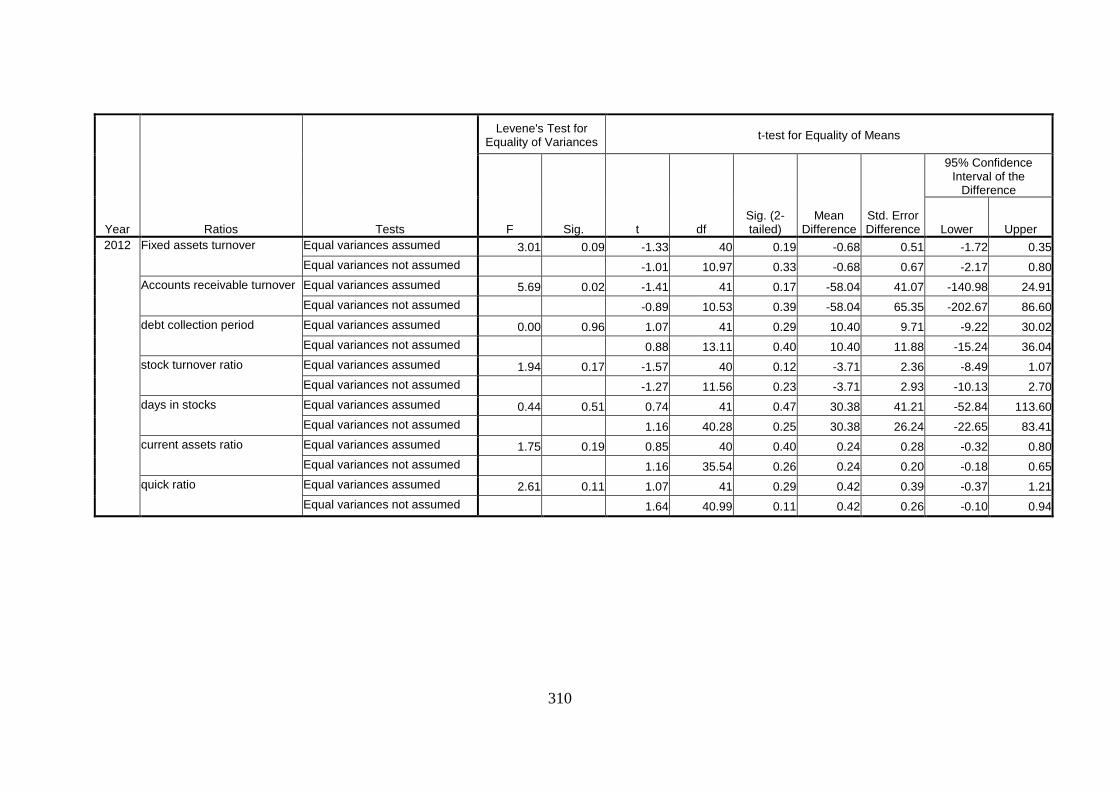
310
Year Ratios Tests
Levene's Test for Equality of Variances
t-test for Equality of Means
F Sig. t df Sig. (2-tailed)
Mean Difference
Std. Error Difference
95% Confidence Interval of the
Difference
Lower Upper
2012 Fixed assets turnover Equal variances assumed 3.01 0.09 -1.33 40 0.19 -0.68 0.51 -1.72 0.35
Equal variances not assumed -1.01 10.97 0.33 -0.68 0.67 -2.17 0.80
Accounts receivable turnover Equal variances assumed 5.69 0.02 -1.41 41 0.17 -58.04 41.07 -140.98 24.91
Equal variances not assumed -0.89 10.53 0.39 -58.04 65.35 -202.67 86.60
debt collection period Equal variances assumed 0.00 0.96 1.07 41 0.29 10.40 9.71 -9.22 30.02
Equal variances not assumed 0.88 13.11 0.40 10.40 11.88 -15.24 36.04
stock turnover ratio Equal variances assumed 1.94 0.17 -1.57 40 0.12 -3.71 2.36 -8.49 1.07
Equal variances not assumed -1.27 11.56 0.23 -3.71 2.93 -10.13 2.70
days in stocks Equal variances assumed 0.44 0.51 0.74 41 0.47 30.38 41.21 -52.84 113.60
Equal variances not assumed 1.16 40.28 0.25 30.38 26.24 -22.65 83.41
current assets ratio Equal variances assumed 1.75 0.19 0.85 40 0.40 0.24 0.28 -0.32 0.80
Equal variances not assumed 1.16 35.54 0.26 0.24 0.20 -0.18 0.65
quick ratio Equal variances assumed 2.61 0.11 1.07 41 0.29 0.42 0.39 -0.37 1.21
Equal variances not assumed 1.64 40.99 0.11 0.42 0.26 -0.10 0.94
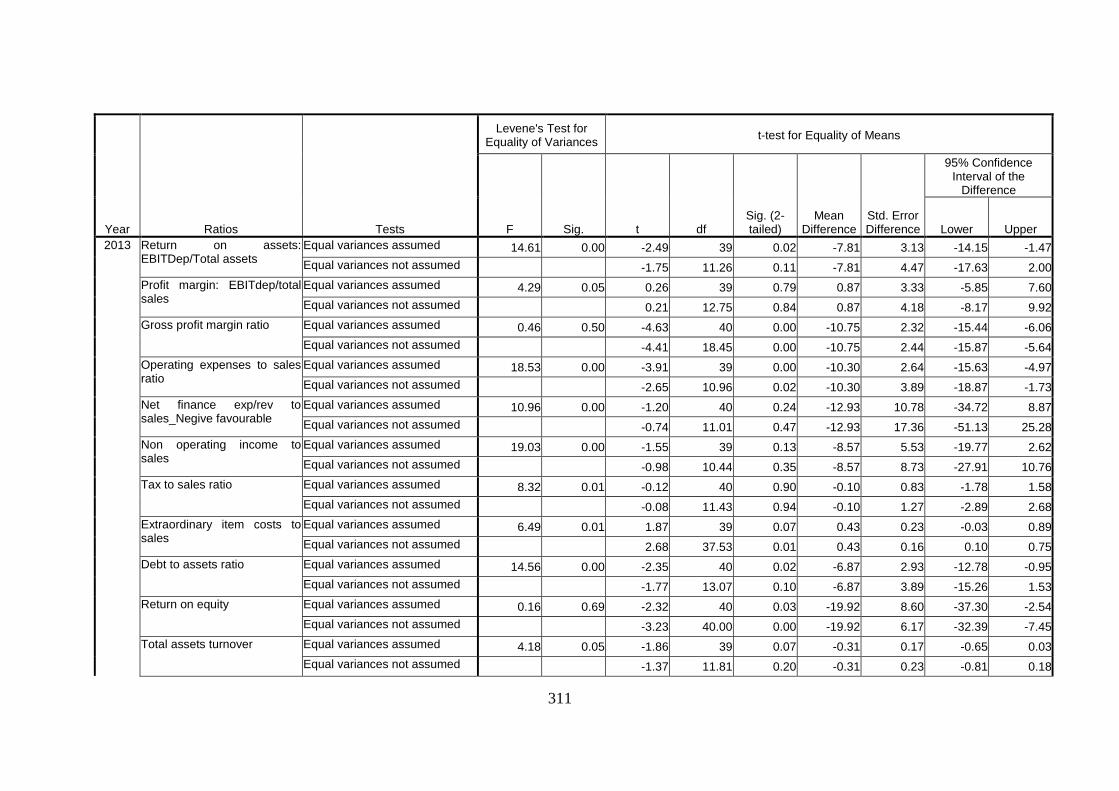
311
Year Ratios Tests
Levene's Test for Equality of Variances
t-test for Equality of Means
F Sig. t df Sig. (2-tailed)
Mean Difference
Std. Error Difference
95% Confidence Interval of the
Difference
Lower Upper
2013 Return on assets: EBITDep/Total assets
Equal variances assumed 14.61 0.00 -2.49 39 0.02 -7.81 3.13 -14.15 -1.47
Equal variances not assumed -1.75 11.26 0.11 -7.81 4.47 -17.63 2.00
Profit margin: EBITdep/total sales
Equal variances assumed 4.29 0.05 0.26 39 0.79 0.87 3.33 -5.85 7.60
Equal variances not assumed 0.21 12.75 0.84 0.87 4.18 -8.17 9.92
Gross profit margin ratio Equal variances assumed 0.46 0.50 -4.63 40 0.00 -10.75 2.32 -15.44 -6.06
Equal variances not assumed -4.41 18.45 0.00 -10.75 2.44 -15.87 -5.64
Operating expenses to sales ratio
Equal variances assumed 18.53 0.00 -3.91 39 0.00 -10.30 2.64 -15.63 -4.97
Equal variances not assumed -2.65 10.96 0.02 -10.30 3.89 -18.87 -1.73
Net finance exp/rev to sales_Negive favourable
Equal variances assumed 10.96 0.00 -1.20 40 0.24 -12.93 10.78 -34.72 8.87
Equal variances not assumed -0.74 11.01 0.47 -12.93 17.36 -51.13 25.28
Non operating income to sales
Equal variances assumed 19.03 0.00 -1.55 39 0.13 -8.57 5.53 -19.77 2.62
Equal variances not assumed -0.98 10.44 0.35 -8.57 8.73 -27.91 10.76
Tax to sales ratio Equal variances assumed 8.32 0.01 -0.12 40 0.90 -0.10 0.83 -1.78 1.58
Equal variances not assumed -0.08 11.43 0.94 -0.10 1.27 -2.89 2.68
Extraordinary item costs to sales
Equal variances assumed 6.49 0.01 1.87 39 0.07 0.43 0.23 -0.03 0.89
Equal variances not assumed 2.68 37.53 0.01 0.43 0.16 0.10 0.75
Debt to assets ratio Equal variances assumed 14.56 0.00 -2.35 40 0.02 -6.87 2.93 -12.78 -0.95
Equal variances not assumed -1.77 13.07 0.10 -6.87 3.89 -15.26 1.53
Return on equity Equal variances assumed 0.16 0.69 -2.32 40 0.03 -19.92 8.60 -37.30 -2.54
Equal variances not assumed -3.23 40.00 0.00 -19.92 6.17 -32.39 -7.45
Total assets turnover Equal variances assumed 4.18 0.05 -1.86 39 0.07 -0.31 0.17 -0.65 0.03
Equal variances not assumed -1.37 11.81 0.20 -0.31 0.23 -0.81 0.18
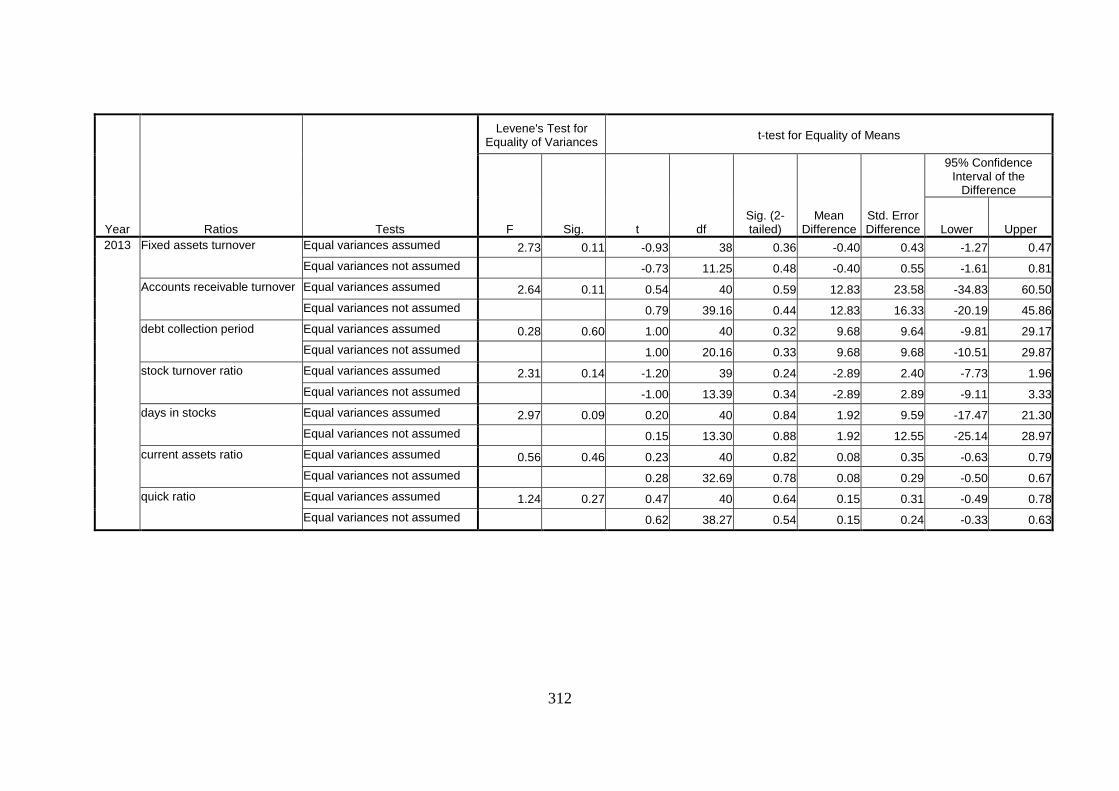
312
Year Ratios Tests
Levene's Test for Equality of Variances
t-test for Equality of Means
F Sig. t df Sig. (2-tailed)
Mean Difference
Std. Error Difference
95% Confidence Interval of the
Difference
Lower Upper
2013 Fixed assets turnover Equal variances assumed 2.73 0.11 -0.93 38 0.36 -0.40 0.43 -1.27 0.47
Equal variances not assumed -0.73 11.25 0.48 -0.40 0.55 -1.61 0.81
Accounts receivable turnover Equal variances assumed 2.64 0.11 0.54 40 0.59 12.83 23.58 -34.83 60.50
Equal variances not assumed 0.79 39.16 0.44 12.83 16.33 -20.19 45.86
debt collection period Equal variances assumed 0.28 0.60 1.00 40 0.32 9.68 9.64 -9.81 29.17
Equal variances not assumed 1.00 20.16 0.33 9.68 9.68 -10.51 29.87
stock turnover ratio Equal variances assumed 2.31 0.14 -1.20 39 0.24 -2.89 2.40 -7.73 1.96
Equal variances not assumed -1.00 13.39 0.34 -2.89 2.89 -9.11 3.33
days in stocks Equal variances assumed 2.97 0.09 0.20 40 0.84 1.92 9.59 -17.47 21.30
Equal variances not assumed 0.15 13.30 0.88 1.92 12.55 -25.14 28.97
current assets ratio Equal variances assumed 0.56 0.46 0.23 40 0.82 0.08 0.35 -0.63 0.79
Equal variances not assumed 0.28 32.69 0.78 0.08 0.29 -0.50 0.67
quick ratio Equal variances assumed 1.24 0.27 0.47 40 0.64 0.15 0.31 -0.49 0.78
Equal variances not assumed 0.62 38.27 0.54 0.15 0.24 -0.33 0.63
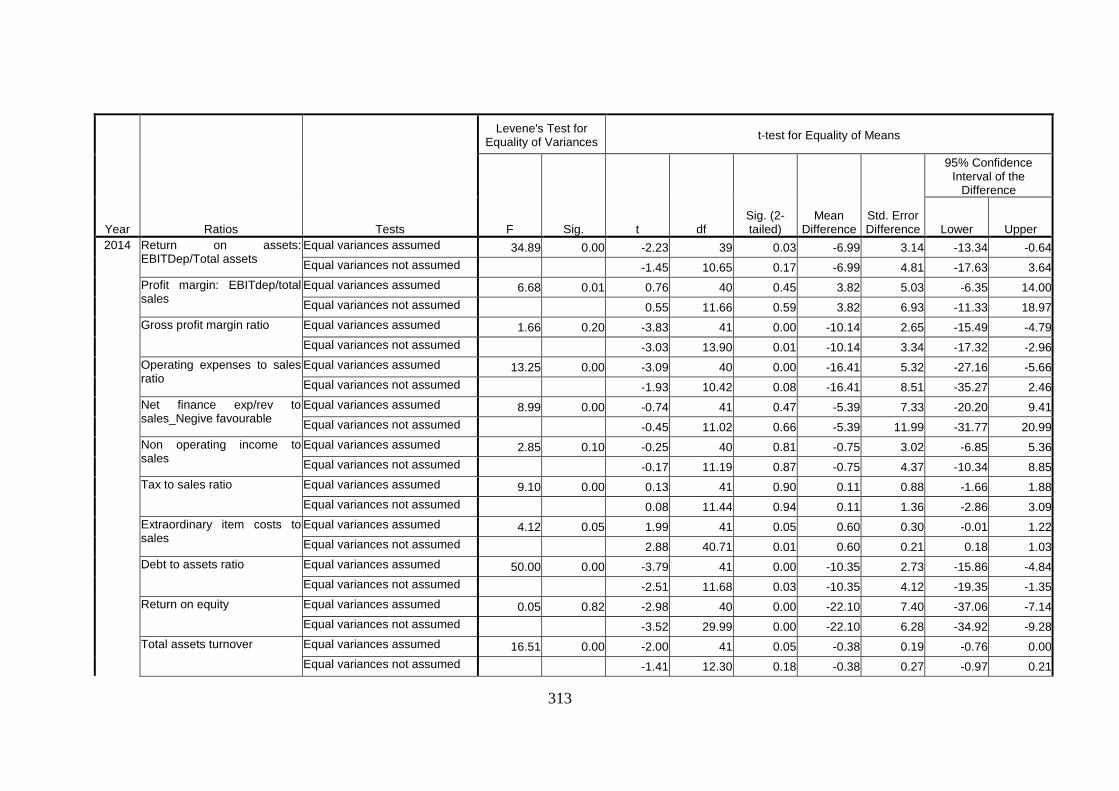
313
Year Ratios Tests
Levene's Test for Equality of Variances
t-test for Equality of Means
F Sig. t df Sig. (2-tailed)
Mean Difference
Std. Error Difference
95% Confidence Interval of the
Difference
Lower Upper
2014 Return on assets: EBITDep/Total assets
Equal variances assumed 34.89 0.00 -2.23 39 0.03 -6.99 3.14 -13.34 -0.64
Equal variances not assumed -1.45 10.65 0.17 -6.99 4.81 -17.63 3.64
Profit margin: EBITdep/total sales
Equal variances assumed 6.68 0.01 0.76 40 0.45 3.82 5.03 -6.35 14.00
Equal variances not assumed 0.55 11.66 0.59 3.82 6.93 -11.33 18.97
Gross profit margin ratio Equal variances assumed 1.66 0.20 -3.83 41 0.00 -10.14 2.65 -15.49 -4.79
Equal variances not assumed -3.03 13.90 0.01 -10.14 3.34 -17.32 -2.96
Operating expenses to sales ratio
Equal variances assumed 13.25 0.00 -3.09 40 0.00 -16.41 5.32 -27.16 -5.66
Equal variances not assumed -1.93 10.42 0.08 -16.41 8.51 -35.27 2.46
Net finance exp/rev to sales_Negive favourable
Equal variances assumed 8.99 0.00 -0.74 41 0.47 -5.39 7.33 -20.20 9.41
Equal variances not assumed -0.45 11.02 0.66 -5.39 11.99 -31.77 20.99
Non operating income to sales
Equal variances assumed 2.85 0.10 -0.25 40 0.81 -0.75 3.02 -6.85 5.36
Equal variances not assumed -0.17 11.19 0.87 -0.75 4.37 -10.34 8.85
Tax to sales ratio Equal variances assumed 9.10 0.00 0.13 41 0.90 0.11 0.88 -1.66 1.88
Equal variances not assumed 0.08 11.44 0.94 0.11 1.36 -2.86 3.09
Extraordinary item costs to sales
Equal variances assumed 4.12 0.05 1.99 41 0.05 0.60 0.30 -0.01 1.22
Equal variances not assumed 2.88 40.71 0.01 0.60 0.21 0.18 1.03
Debt to assets ratio Equal variances assumed 50.00 0.00 -3.79 41 0.00 -10.35 2.73 -15.86 -4.84
Equal variances not assumed -2.51 11.68 0.03 -10.35 4.12 -19.35 -1.35
Return on equity Equal variances assumed 0.05 0.82 -2.98 40 0.00 -22.10 7.40 -37.06 -7.14
Equal variances not assumed -3.52 29.99 0.00 -22.10 6.28 -34.92 -9.28
Total assets turnover Equal variances assumed 16.51 0.00 -2.00 41 0.05 -0.38 0.19 -0.76 0.00
Equal variances not assumed -1.41 12.30 0.18 -0.38 0.27 -0.97 0.21
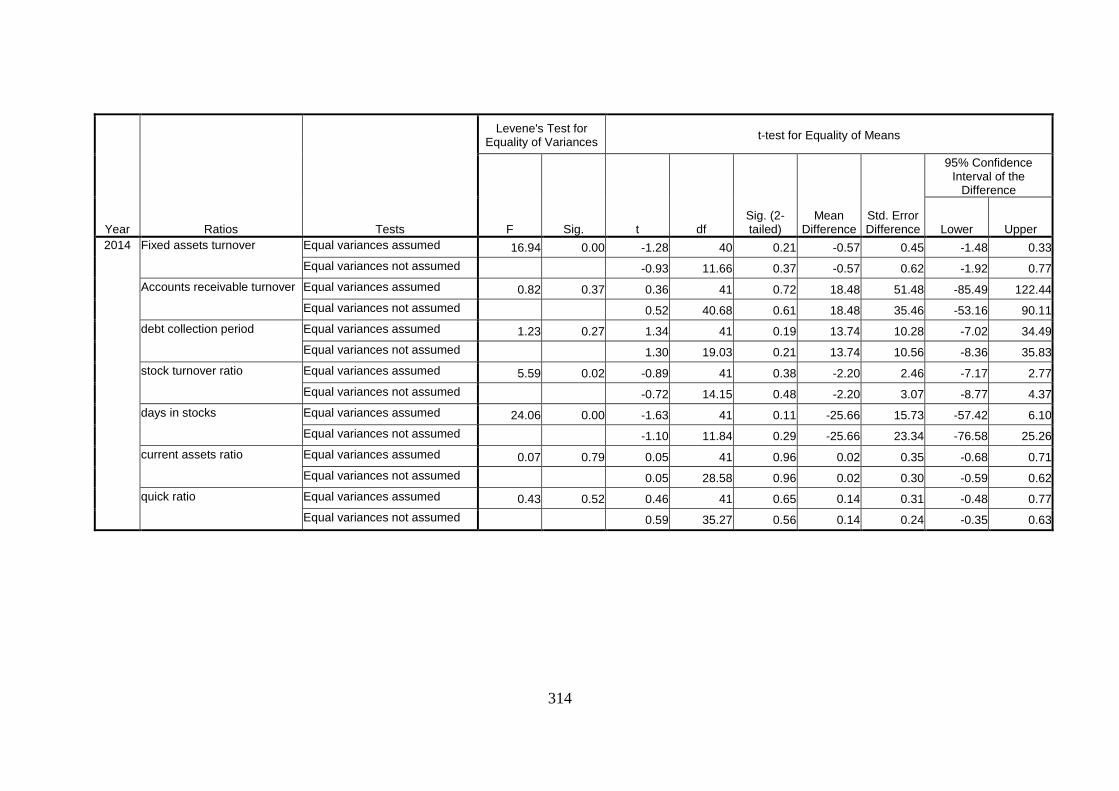
314
Year Ratios Tests
Levene's Test for Equality of Variances
t-test for Equality of Means
F Sig. t df Sig. (2-tailed)
Mean Difference
Std. Error Difference
95% Confidence Interval of the
Difference
Lower Upper
2014 Fixed assets turnover Equal variances assumed 16.94 0.00 -1.28 40 0.21 -0.57 0.45 -1.48 0.33
Equal variances not assumed -0.93 11.66 0.37 -0.57 0.62 -1.92 0.77
Accounts receivable turnover Equal variances assumed 0.82 0.37 0.36 41 0.72 18.48 51.48 -85.49 122.44
Equal variances not assumed 0.52 40.68 0.61 18.48 35.46 -53.16 90.11
debt collection period Equal variances assumed 1.23 0.27 1.34 41 0.19 13.74 10.28 -7.02 34.49
Equal variances not assumed 1.30 19.03 0.21 13.74 10.56 -8.36 35.83
stock turnover ratio Equal variances assumed 5.59 0.02 -0.89 41 0.38 -2.20 2.46 -7.17 2.77
Equal variances not assumed -0.72 14.15 0.48 -2.20 3.07 -8.77 4.37
days in stocks Equal variances assumed 24.06 0.00 -1.63 41 0.11 -25.66 15.73 -57.42 6.10
Equal variances not assumed -1.10 11.84 0.29 -25.66 23.34 -76.58 25.26
current assets ratio Equal variances assumed 0.07 0.79 0.05 41 0.96 0.02 0.35 -0.68 0.71
Equal variances not assumed 0.05 28.58 0.96 0.02 0.30 -0.59 0.62
quick ratio Equal variances assumed 0.43 0.52 0.46 41 0.65 0.14 0.31 -0.48 0.77
Equal variances not assumed 0.59 35.27 0.56 0.14 0.24 -0.35 0.63
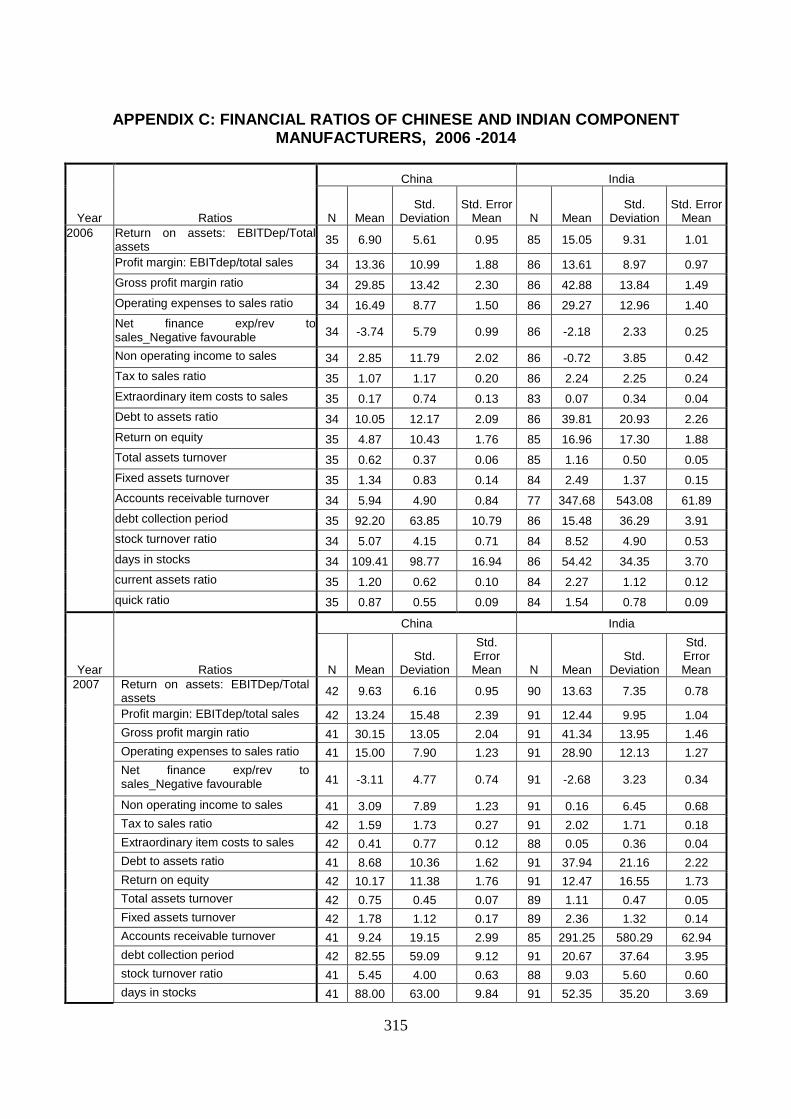
315
APPENDIX C: FINANCIAL RATIOS OF CHINESE AND INDIAN COMPONENT MANUFACTURERS, 2006 -2014
Year Ratios
China India
N Mean Std.
Deviation Std. Error
Mean N Mean Std.
Deviation Std. Error
Mean
2006 Return on assets: EBITDep/Total assets
35 6.90 5.61 0.95 85 15.05 9.31 1.01
Profit margin: EBITdep/total sales 34 13.36 10.99 1.88 86 13.61 8.97 0.97
Gross profit margin ratio 34 29.85 13.42 2.30 86 42.88 13.84 1.49
Operating expenses to sales ratio 34 16.49 8.77 1.50 86 29.27 12.96 1.40
Net finance exp/rev to sales_Negative favourable 34 -3.74 5.79 0.99 86 -2.18 2.33 0.25
Non operating income to sales 34 2.85 11.79 2.02 86 -0.72 3.85 0.42
Tax to sales ratio 35 1.07 1.17 0.20 86 2.24 2.25 0.24
Extraordinary item costs to sales 35 0.17 0.74 0.13 83 0.07 0.34 0.04
Debt to assets ratio 34 10.05 12.17 2.09 86 39.81 20.93 2.26
Return on equity 35 4.87 10.43 1.76 85 16.96 17.30 1.88
Total assets turnover 35 0.62 0.37 0.06 85 1.16 0.50 0.05
Fixed assets turnover 35 1.34 0.83 0.14 84 2.49 1.37 0.15
Accounts receivable turnover 34 5.94 4.90 0.84 77 347.68 543.08 61.89
debt collection period 35 92.20 63.85 10.79 86 15.48 36.29 3.91
stock turnover ratio 34 5.07 4.15 0.71 84 8.52 4.90 0.53
days in stocks 34 109.41 98.77 16.94 86 54.42 34.35 3.70
current assets ratio 35 1.20 0.62 0.10 84 2.27 1.12 0.12
quick ratio 35 0.87 0.55 0.09 84 1.54 0.78 0.09
Year Ratios
China India
N Mean Std.
Deviation
Std. Error Mean N Mean
Std. Deviation
Std. Error Mean
2007 Return on assets: EBITDep/Total assets
42 9.63 6.16 0.95 90 13.63 7.35 0.78
Profit margin: EBITdep/total sales 42 13.24 15.48 2.39 91 12.44 9.95 1.04
Gross profit margin ratio 41 30.15 13.05 2.04 91 41.34 13.95 1.46
Operating expenses to sales ratio 41 15.00 7.90 1.23 91 28.90 12.13 1.27
Net finance exp/rev to sales_Negative favourable 41 -3.11 4.77 0.74 91 -2.68 3.23 0.34
Non operating income to sales 41 3.09 7.89 1.23 91 0.16 6.45 0.68
Tax to sales ratio 42 1.59 1.73 0.27 91 2.02 1.71 0.18
Extraordinary item costs to sales 42 0.41 0.77 0.12 88 0.05 0.36 0.04
Debt to assets ratio 41 8.68 10.36 1.62 91 37.94 21.16 2.22
Return on equity 42 10.17 11.38 1.76 91 12.47 16.55 1.73
Total assets turnover 42 0.75 0.45 0.07 89 1.11 0.47 0.05
Fixed assets turnover 42 1.78 1.12 0.17 89 2.36 1.32 0.14
Accounts receivable turnover 41 9.24 19.15 2.99 85 291.25 580.29 62.94
debt collection period 42 82.55 59.09 9.12 91 20.67 37.64 3.95
stock turnover ratio 41 5.45 4.00 0.63 88 9.03 5.60 0.60
days in stocks 41 88.00 63.00 9.84 91 52.35 35.20 3.69
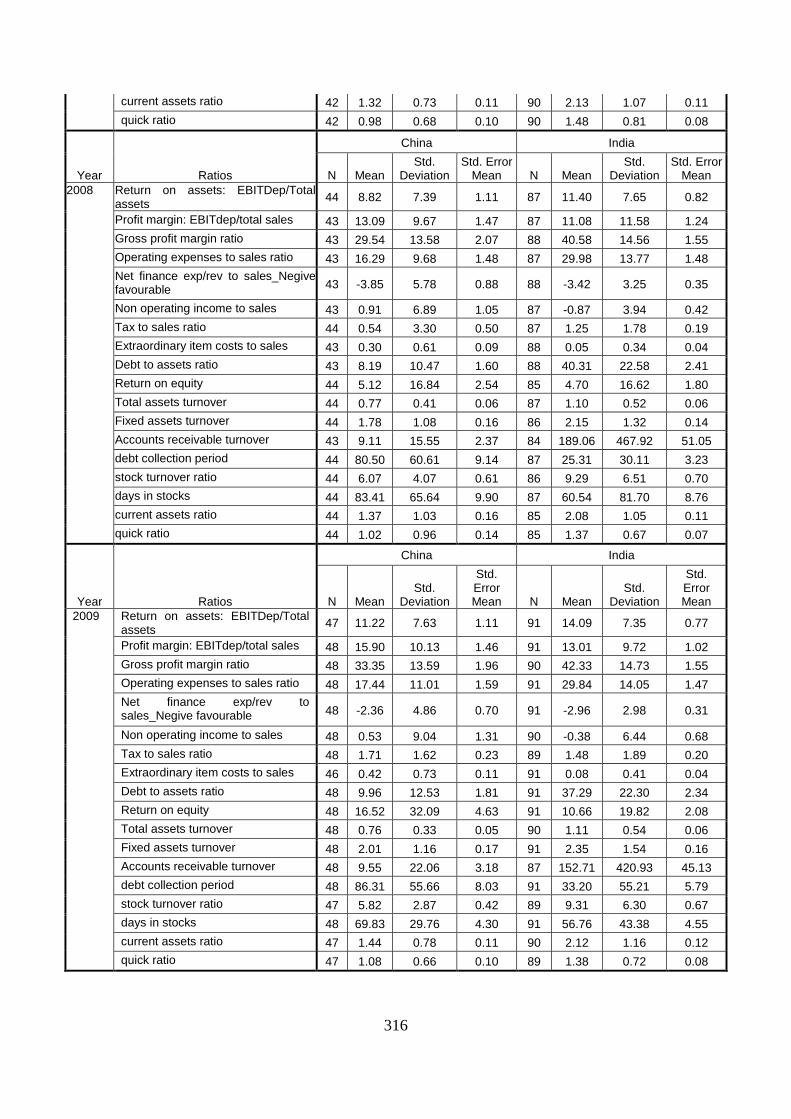
316
current assets ratio 42 1.32 0.73 0.11 90 2.13 1.07 0.11
quick ratio 42 0.98 0.68 0.10 90 1.48 0.81 0.08
Year Ratios
China India
N Mean Std.
Deviation Std. Error
Mean N Mean Std.
Deviation Std. Error
Mean
2008 Return on assets: EBITDep/Total assets
44 8.82 7.39 1.11 87 11.40 7.65 0.82
Profit margin: EBITdep/total sales 43 13.09 9.67 1.47 87 11.08 11.58 1.24
Gross profit margin ratio 43 29.54 13.58 2.07 88 40.58 14.56 1.55
Operating expenses to sales ratio 43 16.29 9.68 1.48 87 29.98 13.77 1.48
Net finance exp/rev to sales_Negive favourable 43 -3.85 5.78 0.88 88 -3.42 3.25 0.35
Non operating income to sales 43 0.91 6.89 1.05 87 -0.87 3.94 0.42
Tax to sales ratio 44 0.54 3.30 0.50 87 1.25 1.78 0.19
Extraordinary item costs to sales 43 0.30 0.61 0.09 88 0.05 0.34 0.04
Debt to assets ratio 43 8.19 10.47 1.60 88 40.31 22.58 2.41
Return on equity 44 5.12 16.84 2.54 85 4.70 16.62 1.80
Total assets turnover 44 0.77 0.41 0.06 87 1.10 0.52 0.06
Fixed assets turnover 44 1.78 1.08 0.16 86 2.15 1.32 0.14
Accounts receivable turnover 43 9.11 15.55 2.37 84 189.06 467.92 51.05
debt collection period 44 80.50 60.61 9.14 87 25.31 30.11 3.23
stock turnover ratio 44 6.07 4.07 0.61 86 9.29 6.51 0.70
days in stocks 44 83.41 65.64 9.90 87 60.54 81.70 8.76
current assets ratio 44 1.37 1.03 0.16 85 2.08 1.05 0.11
quick ratio 44 1.02 0.96 0.14 85 1.37 0.67 0.07
Year Ratios
China India
N Mean Std.
Deviation
Std. Error Mean N Mean
Std. Deviation
Std. Error Mean
2009 Return on assets: EBITDep/Total assets
47 11.22 7.63 1.11 91 14.09 7.35 0.77
Profit margin: EBITdep/total sales 48 15.90 10.13 1.46 91 13.01 9.72 1.02
Gross profit margin ratio 48 33.35 13.59 1.96 90 42.33 14.73 1.55
Operating expenses to sales ratio 48 17.44 11.01 1.59 91 29.84 14.05 1.47
Net finance exp/rev to sales_Negive favourable 48 -2.36 4.86 0.70 91 -2.96 2.98 0.31
Non operating income to sales 48 0.53 9.04 1.31 90 -0.38 6.44 0.68
Tax to sales ratio 48 1.71 1.62 0.23 89 1.48 1.89 0.20
Extraordinary item costs to sales 46 0.42 0.73 0.11 91 0.08 0.41 0.04
Debt to assets ratio 48 9.96 12.53 1.81 91 37.29 22.30 2.34
Return on equity 48 16.52 32.09 4.63 91 10.66 19.82 2.08
Total assets turnover 48 0.76 0.33 0.05 90 1.11 0.54 0.06
Fixed assets turnover 48 2.01 1.16 0.17 91 2.35 1.54 0.16
Accounts receivable turnover 48 9.55 22.06 3.18 87 152.71 420.93 45.13
debt collection period 48 86.31 55.66 8.03 91 33.20 55.21 5.79
stock turnover ratio 47 5.82 2.87 0.42 89 9.31 6.30 0.67
days in stocks 48 69.83 29.76 4.30 91 56.76 43.38 4.55
current assets ratio 47 1.44 0.78 0.11 90 2.12 1.16 0.12
quick ratio 47 1.08 0.66 0.10 89 1.38 0.72 0.08
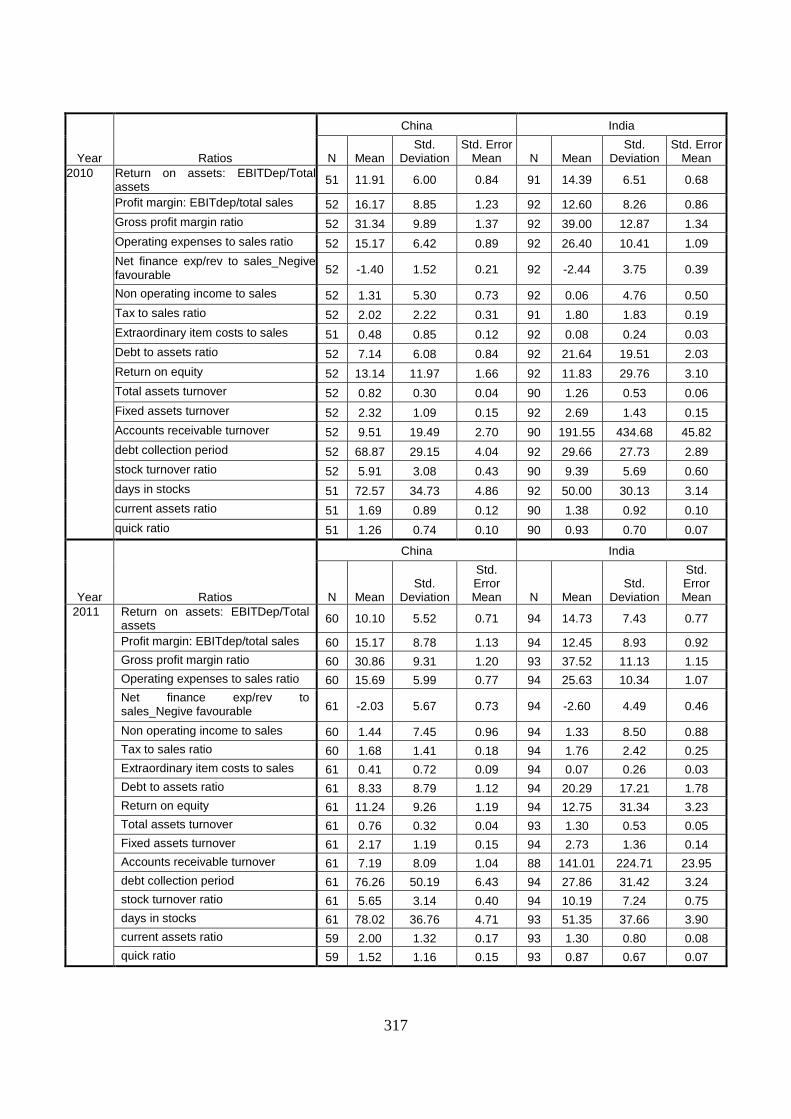
317
Year Ratios
China India
N Mean Std.
Deviation Std. Error
Mean N Mean Std.
Deviation Std. Error
Mean
2010 Return on assets: EBITDep/Total assets
51 11.91 6.00 0.84 91 14.39 6.51 0.68
Profit margin: EBITdep/total sales 52 16.17 8.85 1.23 92 12.60 8.26 0.86
Gross profit margin ratio 52 31.34 9.89 1.37 92 39.00 12.87 1.34
Operating expenses to sales ratio 52 15.17 6.42 0.89 92 26.40 10.41 1.09
Net finance exp/rev to sales_Negive favourable 52 -1.40 1.52 0.21 92 -2.44 3.75 0.39
Non operating income to sales 52 1.31 5.30 0.73 92 0.06 4.76 0.50
Tax to sales ratio 52 2.02 2.22 0.31 91 1.80 1.83 0.19
Extraordinary item costs to sales 51 0.48 0.85 0.12 92 0.08 0.24 0.03
Debt to assets ratio 52 7.14 6.08 0.84 92 21.64 19.51 2.03
Return on equity 52 13.14 11.97 1.66 92 11.83 29.76 3.10
Total assets turnover 52 0.82 0.30 0.04 90 1.26 0.53 0.06
Fixed assets turnover 52 2.32 1.09 0.15 92 2.69 1.43 0.15
Accounts receivable turnover 52 9.51 19.49 2.70 90 191.55 434.68 45.82
debt collection period 52 68.87 29.15 4.04 92 29.66 27.73 2.89
stock turnover ratio 52 5.91 3.08 0.43 90 9.39 5.69 0.60
days in stocks 51 72.57 34.73 4.86 92 50.00 30.13 3.14
current assets ratio 51 1.69 0.89 0.12 90 1.38 0.92 0.10
quick ratio 51 1.26 0.74 0.10 90 0.93 0.70 0.07
Year Ratios
China India
N Mean Std.
Deviation
Std. Error Mean N Mean
Std. Deviation
Std. Error Mean
2011 Return on assets: EBITDep/Total assets
60 10.10 5.52 0.71 94 14.73 7.43 0.77
Profit margin: EBITdep/total sales 60 15.17 8.78 1.13 94 12.45 8.93 0.92
Gross profit margin ratio 60 30.86 9.31 1.20 93 37.52 11.13 1.15
Operating expenses to sales ratio 60 15.69 5.99 0.77 94 25.63 10.34 1.07
Net finance exp/rev to sales_Negive favourable 61 -2.03 5.67 0.73 94 -2.60 4.49 0.46
Non operating income to sales 60 1.44 7.45 0.96 94 1.33 8.50 0.88
Tax to sales ratio 60 1.68 1.41 0.18 94 1.76 2.42 0.25
Extraordinary item costs to sales 61 0.41 0.72 0.09 94 0.07 0.26 0.03
Debt to assets ratio 61 8.33 8.79 1.12 94 20.29 17.21 1.78
Return on equity 61 11.24 9.26 1.19 94 12.75 31.34 3.23
Total assets turnover 61 0.76 0.32 0.04 93 1.30 0.53 0.05
Fixed assets turnover 61 2.17 1.19 0.15 94 2.73 1.36 0.14
Accounts receivable turnover 61 7.19 8.09 1.04 88 141.01 224.71 23.95
debt collection period 61 76.26 50.19 6.43 94 27.86 31.42 3.24
stock turnover ratio 61 5.65 3.14 0.40 94 10.19 7.24 0.75
days in stocks 61 78.02 36.76 4.71 93 51.35 37.66 3.90
current assets ratio 59 2.00 1.32 0.17 93 1.30 0.80 0.08
quick ratio 59 1.52 1.16 0.15 93 0.87 0.67 0.07
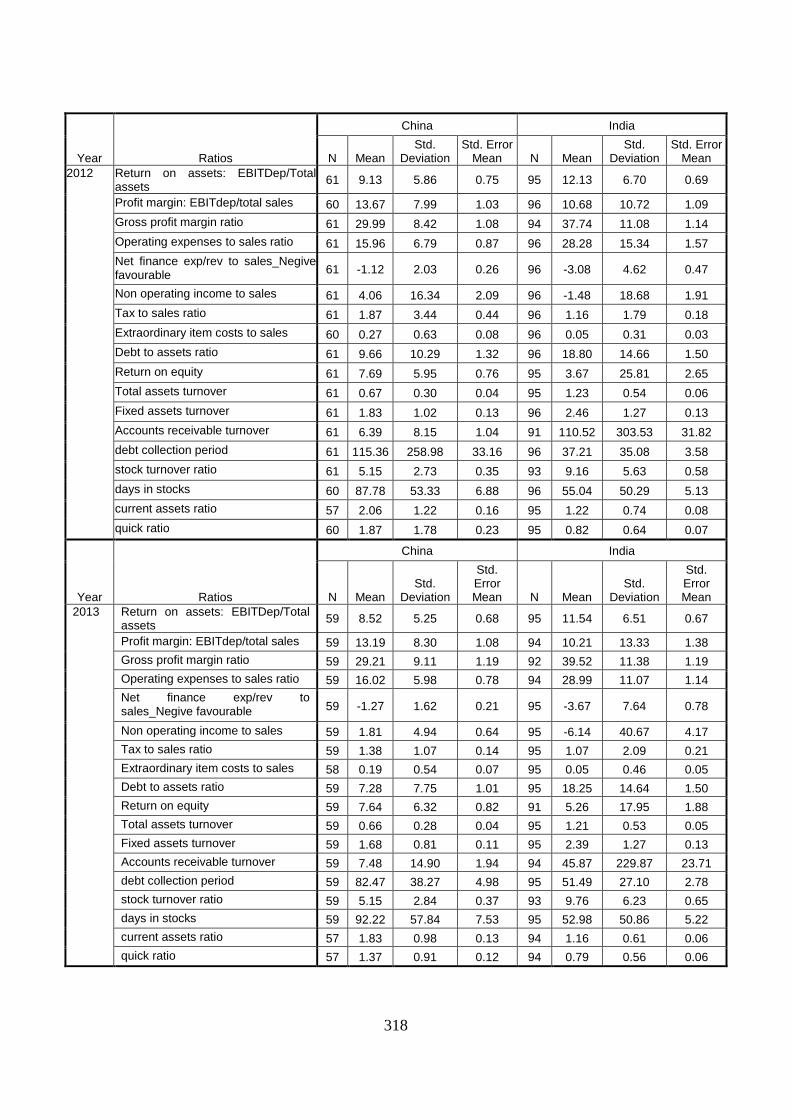
318
Year Ratios
China India
N Mean Std.
Deviation Std. Error
Mean N Mean Std.
Deviation Std. Error
Mean
2012 Return on assets: EBITDep/Total assets
61 9.13 5.86 0.75 95 12.13 6.70 0.69
Profit margin: EBITdep/total sales 60 13.67 7.99 1.03 96 10.68 10.72 1.09
Gross profit margin ratio 61 29.99 8.42 1.08 94 37.74 11.08 1.14
Operating expenses to sales ratio 61 15.96 6.79 0.87 96 28.28 15.34 1.57
Net finance exp/rev to sales_Negive favourable 61 -1.12 2.03 0.26 96 -3.08 4.62 0.47
Non operating income to sales 61 4.06 16.34 2.09 96 -1.48 18.68 1.91
Tax to sales ratio 61 1.87 3.44 0.44 96 1.16 1.79 0.18
Extraordinary item costs to sales 60 0.27 0.63 0.08 96 0.05 0.31 0.03
Debt to assets ratio 61 9.66 10.29 1.32 96 18.80 14.66 1.50
Return on equity 61 7.69 5.95 0.76 95 3.67 25.81 2.65
Total assets turnover 61 0.67 0.30 0.04 95 1.23 0.54 0.06
Fixed assets turnover 61 1.83 1.02 0.13 96 2.46 1.27 0.13
Accounts receivable turnover 61 6.39 8.15 1.04 91 110.52 303.53 31.82
debt collection period 61 115.36 258.98 33.16 96 37.21 35.08 3.58
stock turnover ratio 61 5.15 2.73 0.35 93 9.16 5.63 0.58
days in stocks 60 87.78 53.33 6.88 96 55.04 50.29 5.13
current assets ratio 57 2.06 1.22 0.16 95 1.22 0.74 0.08
quick ratio 60 1.87 1.78 0.23 95 0.82 0.64 0.07
Year Ratios
China India
N Mean Std.
Deviation
Std. Error Mean N Mean
Std. Deviation
Std. Error Mean
2013 Return on assets: EBITDep/Total assets
59 8.52 5.25 0.68 95 11.54 6.51 0.67
Profit margin: EBITdep/total sales 59 13.19 8.30 1.08 94 10.21 13.33 1.38
Gross profit margin ratio 59 29.21 9.11 1.19 92 39.52 11.38 1.19
Operating expenses to sales ratio 59 16.02 5.98 0.78 94 28.99 11.07 1.14
Net finance exp/rev to sales_Negive favourable 59 -1.27 1.62 0.21 95 -3.67 7.64 0.78
Non operating income to sales 59 1.81 4.94 0.64 95 -6.14 40.67 4.17
Tax to sales ratio 59 1.38 1.07 0.14 95 1.07 2.09 0.21
Extraordinary item costs to sales 58 0.19 0.54 0.07 95 0.05 0.46 0.05
Debt to assets ratio 59 7.28 7.75 1.01 95 18.25 14.64 1.50
Return on equity 59 7.64 6.32 0.82 91 5.26 17.95 1.88
Total assets turnover 59 0.66 0.28 0.04 95 1.21 0.53 0.05
Fixed assets turnover 59 1.68 0.81 0.11 95 2.39 1.27 0.13
Accounts receivable turnover 59 7.48 14.90 1.94 94 45.87 229.87 23.71
debt collection period 59 82.47 38.27 4.98 95 51.49 27.10 2.78
stock turnover ratio 59 5.15 2.84 0.37 93 9.76 6.23 0.65
days in stocks 59 92.22 57.84 7.53 95 52.98 50.86 5.22
current assets ratio 57 1.83 0.98 0.13 94 1.16 0.61 0.06
quick ratio 57 1.37 0.91 0.12 94 0.79 0.56 0.06
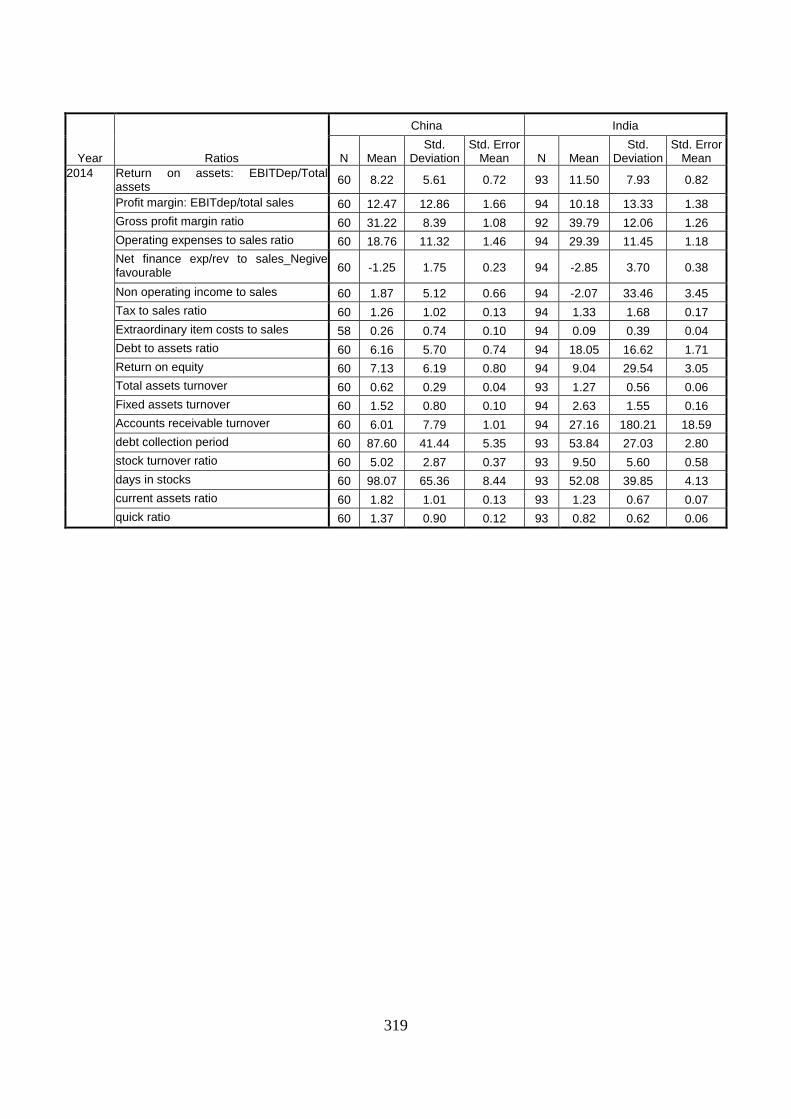
319
Year Ratios
China India
N Mean Std.
Deviation Std. Error
Mean N Mean Std.
Deviation Std. Error
Mean
2014 Return on assets: EBITDep/Total assets
60 8.22 5.61 0.72 93 11.50 7.93 0.82
Profit margin: EBITdep/total sales 60 12.47 12.86 1.66 94 10.18 13.33 1.38
Gross profit margin ratio 60 31.22 8.39 1.08 92 39.79 12.06 1.26
Operating expenses to sales ratio 60 18.76 11.32 1.46 94 29.39 11.45 1.18
Net finance exp/rev to sales_Negive favourable 60 -1.25 1.75 0.23 94 -2.85 3.70 0.38
Non operating income to sales 60 1.87 5.12 0.66 94 -2.07 33.46 3.45
Tax to sales ratio 60 1.26 1.02 0.13 94 1.33 1.68 0.17
Extraordinary item costs to sales 58 0.26 0.74 0.10 94 0.09 0.39 0.04
Debt to assets ratio 60 6.16 5.70 0.74 94 18.05 16.62 1.71
Return on equity 60 7.13 6.19 0.80 94 9.04 29.54 3.05
Total assets turnover 60 0.62 0.29 0.04 93 1.27 0.56 0.06
Fixed assets turnover 60 1.52 0.80 0.10 94 2.63 1.55 0.16
Accounts receivable turnover 60 6.01 7.79 1.01 94 27.16 180.21 18.59
debt collection period 60 87.60 41.44 5.35 93 53.84 27.03 2.80
stock turnover ratio 60 5.02 2.87 0.37 93 9.50 5.60 0.58
days in stocks 60 98.07 65.36 8.44 93 52.08 39.85 4.13
current assets ratio 60 1.82 1.01 0.13 93 1.23 0.67 0.07
quick ratio 60 1.37 0.90 0.12 93 0.82 0.62 0.06
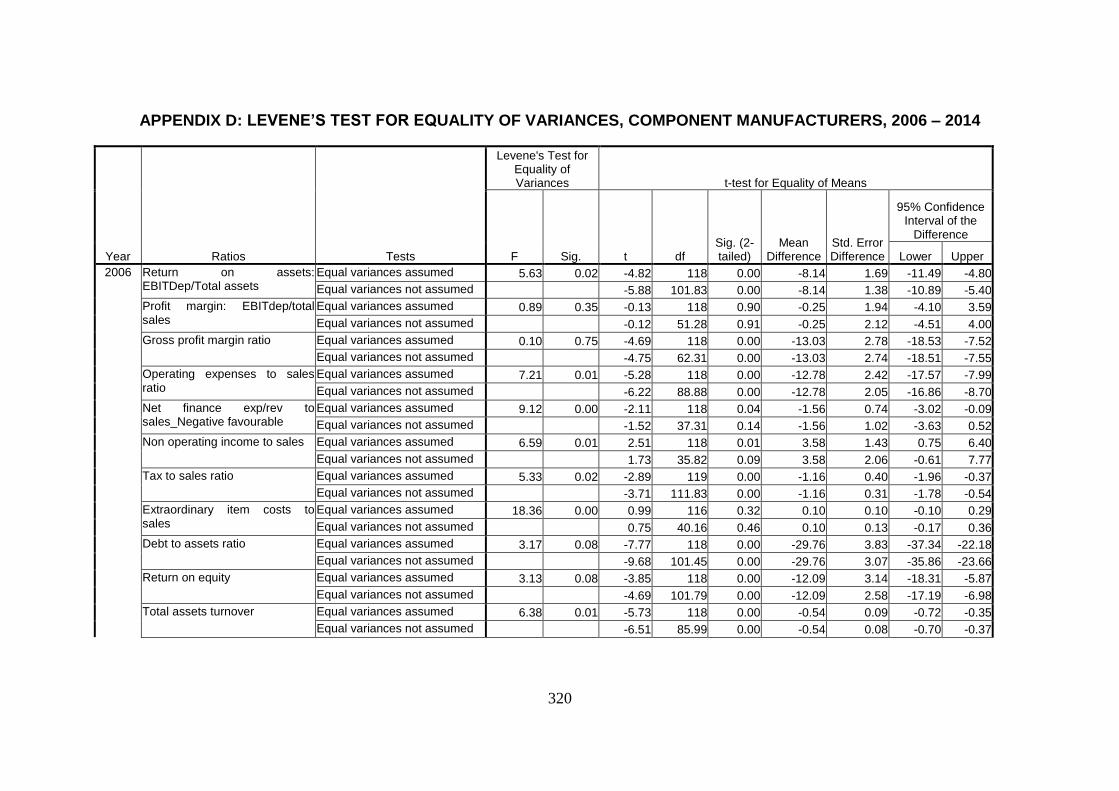
320
APPENDIX D: LEVENE’S TEST FOR EQUALITY OF VARIANCES, COMPONENT MANUFACTURERS, 2006 – 2014
Year Ratios Tests
Levene's Test for Equality of Variances t-test for Equality of Means
F Sig. t df Sig. (2-tailed)
Mean Difference
Std. Error Difference
95% Confidence Interval of the
Difference
Lower Upper
2006 Return on assets: EBITDep/Total assets
Equal variances assumed 5.63 0.02 -4.82 118 0.00 -8.14 1.69 -11.49 -4.80
Equal variances not assumed -5.88 101.83 0.00 -8.14 1.38 -10.89 -5.40
Profit margin: EBITdep/total sales
Equal variances assumed 0.89 0.35 -0.13 118 0.90 -0.25 1.94 -4.10 3.59
Equal variances not assumed -0.12 51.28 0.91 -0.25 2.12 -4.51 4.00
Gross profit margin ratio Equal variances assumed 0.10 0.75 -4.69 118 0.00 -13.03 2.78 -18.53 -7.52
Equal variances not assumed -4.75 62.31 0.00 -13.03 2.74 -18.51 -7.55
Operating expenses to sales ratio
Equal variances assumed 7.21 0.01 -5.28 118 0.00 -12.78 2.42 -17.57 -7.99
Equal variances not assumed -6.22 88.88 0.00 -12.78 2.05 -16.86 -8.70
Net finance exp/rev to sales_Negative favourable
Equal variances assumed 9.12 0.00 -2.11 118 0.04 -1.56 0.74 -3.02 -0.09
Equal variances not assumed -1.52 37.31 0.14 -1.56 1.02 -3.63 0.52
Non operating income to sales Equal variances assumed 6.59 0.01 2.51 118 0.01 3.58 1.43 0.75 6.40
Equal variances not assumed 1.73 35.82 0.09 3.58 2.06 -0.61 7.77
Tax to sales ratio Equal variances assumed 5.33 0.02 -2.89 119 0.00 -1.16 0.40 -1.96 -0.37
Equal variances not assumed -3.71 111.83 0.00 -1.16 0.31 -1.78 -0.54
Extraordinary item costs to sales
Equal variances assumed 18.36 0.00 0.99 116 0.32 0.10 0.10 -0.10 0.29
Equal variances not assumed 0.75 40.16 0.46 0.10 0.13 -0.17 0.36
Debt to assets ratio Equal variances assumed 3.17 0.08 -7.77 118 0.00 -29.76 3.83 -37.34 -22.18
Equal variances not assumed -9.68 101.45 0.00 -29.76 3.07 -35.86 -23.66
Return on equity Equal variances assumed 3.13 0.08 -3.85 118 0.00 -12.09 3.14 -18.31 -5.87
Equal variances not assumed -4.69 101.79 0.00 -12.09 2.58 -17.19 -6.98
Total assets turnover Equal variances assumed 6.38 0.01 -5.73 118 0.00 -0.54 0.09 -0.72 -0.35
Equal variances not assumed -6.51 85.99 0.00 -0.54 0.08 -0.70 -0.37
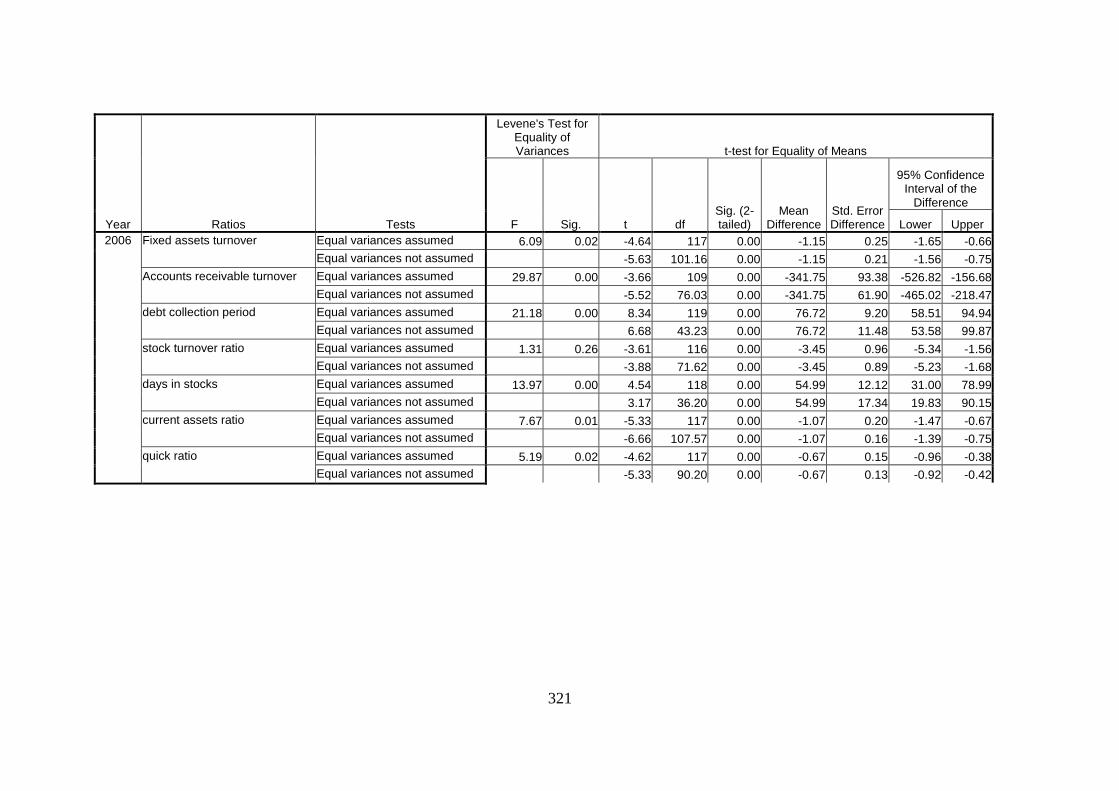
321
Year Ratios Tests
Levene's Test for Equality of Variances t-test for Equality of Means
F Sig. t df Sig. (2-tailed)
Mean Difference
Std. Error Difference
95% Confidence Interval of the
Difference
Lower Upper
2006 Fixed assets turnover Equal variances assumed 6.09 0.02 -4.64 117 0.00 -1.15 0.25 -1.65 -0.66
Equal variances not assumed -5.63 101.16 0.00 -1.15 0.21 -1.56 -0.75
Accounts receivable turnover Equal variances assumed 29.87 0.00 -3.66 109 0.00 -341.75 93.38 -526.82 -156.68
Equal variances not assumed -5.52 76.03 0.00 -341.75 61.90 -465.02 -218.47
debt collection period Equal variances assumed 21.18 0.00 8.34 119 0.00 76.72 9.20 58.51 94.94
Equal variances not assumed 6.68 43.23 0.00 76.72 11.48 53.58 99.87
stock turnover ratio Equal variances assumed 1.31 0.26 -3.61 116 0.00 -3.45 0.96 -5.34 -1.56
Equal variances not assumed -3.88 71.62 0.00 -3.45 0.89 -5.23 -1.68
days in stocks Equal variances assumed 13.97 0.00 4.54 118 0.00 54.99 12.12 31.00 78.99
Equal variances not assumed 3.17 36.20 0.00 54.99 17.34 19.83 90.15
current assets ratio Equal variances assumed 7.67 0.01 -5.33 117 0.00 -1.07 0.20 -1.47 -0.67
Equal variances not assumed -6.66 107.57 0.00 -1.07 0.16 -1.39 -0.75
quick ratio Equal variances assumed 5.19 0.02 -4.62 117 0.00 -0.67 0.15 -0.96 -0.38
Equal variances not assumed -5.33 90.20 0.00 -0.67 0.13 -0.92 -0.42
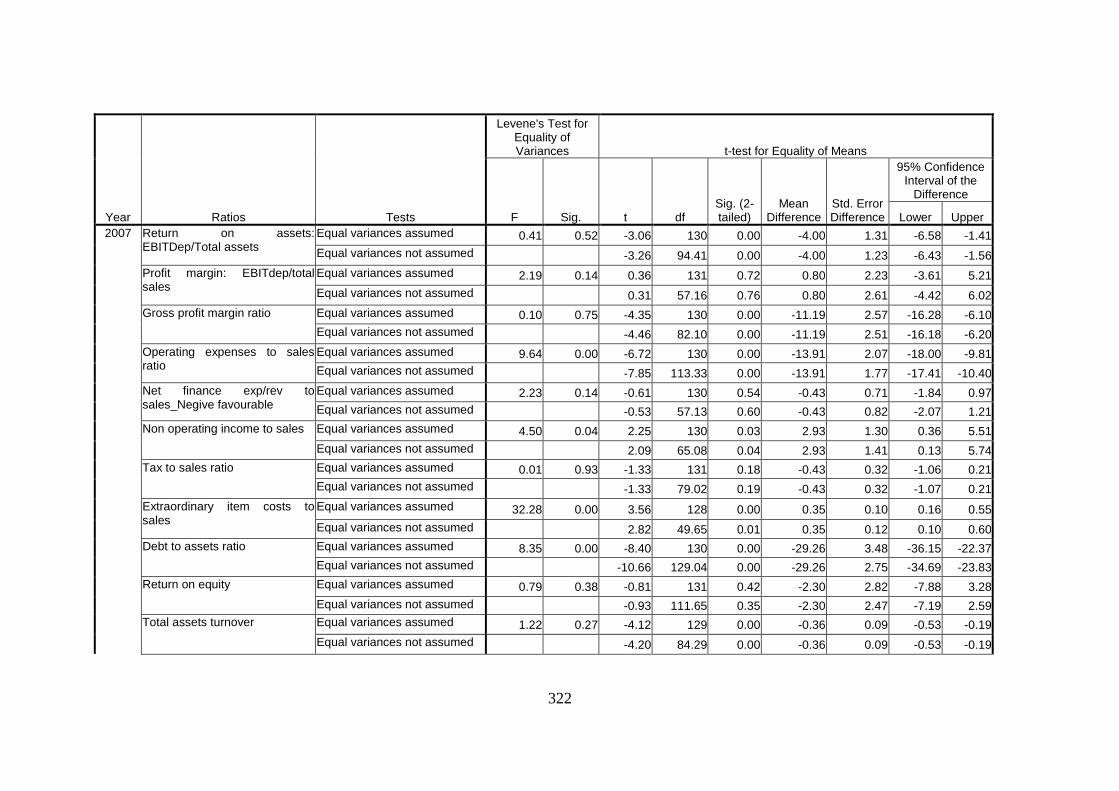
322
Year Ratios Tests
Levene's Test for Equality of Variances t-test for Equality of Means
F Sig. t df Sig. (2-tailed)
Mean Difference
Std. Error Difference
95% Confidence Interval of the
Difference
Lower Upper
2007 Return on assets: EBITDep/Total assets
Equal variances assumed 0.41 0.52 -3.06 130 0.00 -4.00 1.31 -6.58 -1.41
Equal variances not assumed -3.26 94.41 0.00 -4.00 1.23 -6.43 -1.56
Profit margin: EBITdep/total sales
Equal variances assumed 2.19 0.14 0.36 131 0.72 0.80 2.23 -3.61 5.21
Equal variances not assumed 0.31 57.16 0.76 0.80 2.61 -4.42 6.02
Gross profit margin ratio Equal variances assumed 0.10 0.75 -4.35 130 0.00 -11.19 2.57 -16.28 -6.10
Equal variances not assumed -4.46 82.10 0.00 -11.19 2.51 -16.18 -6.20
Operating expenses to sales ratio
Equal variances assumed 9.64 0.00 -6.72 130 0.00 -13.91 2.07 -18.00 -9.81
Equal variances not assumed -7.85 113.33 0.00 -13.91 1.77 -17.41 -10.40
Net finance exp/rev to sales_Negive favourable
Equal variances assumed 2.23 0.14 -0.61 130 0.54 -0.43 0.71 -1.84 0.97
Equal variances not assumed -0.53 57.13 0.60 -0.43 0.82 -2.07 1.21
Non operating income to sales Equal variances assumed 4.50 0.04 2.25 130 0.03 2.93 1.30 0.36 5.51
Equal variances not assumed 2.09 65.08 0.04 2.93 1.41 0.13 5.74
Tax to sales ratio Equal variances assumed 0.01 0.93 -1.33 131 0.18 -0.43 0.32 -1.06 0.21
Equal variances not assumed -1.33 79.02 0.19 -0.43 0.32 -1.07 0.21
Extraordinary item costs to sales
Equal variances assumed 32.28 0.00 3.56 128 0.00 0.35 0.10 0.16 0.55
Equal variances not assumed 2.82 49.65 0.01 0.35 0.12 0.10 0.60
Debt to assets ratio Equal variances assumed 8.35 0.00 -8.40 130 0.00 -29.26 3.48 -36.15 -22.37
Equal variances not assumed -10.66 129.04 0.00 -29.26 2.75 -34.69 -23.83
Return on equity Equal variances assumed 0.79 0.38 -0.81 131 0.42 -2.30 2.82 -7.88 3.28
Equal variances not assumed -0.93 111.65 0.35 -2.30 2.47 -7.19 2.59
Total assets turnover Equal variances assumed 1.22 0.27 -4.12 129 0.00 -0.36 0.09 -0.53 -0.19
Equal variances not assumed -4.20 84.29 0.00 -0.36 0.09 -0.53 -0.19

323
Year Ratios Tests
Levene's Test for Equality of Variances t-test for Equality of Means
F Sig. t df Sig. (2-tailed)
Mean Difference
Std. Error Difference
95% Confidence Interval of the
Difference
Lower Upper
2007 Fixed assets turnover Equal variances assumed 1.64 0.20 -2.49 129 0.01 -0.59 0.24 -1.05 -0.12
Equal variances not assumed -2.64 93.27 0.01 -0.59 0.22 -1.03 -0.14
Accounts receivable turnover Equal variances assumed 22.35 0.00 -3.10 124 0.00 -282.01 90.84 -461.81 -102.21
Equal variances not assumed -4.48 84.38 0.00 -282.01 63.01 -407.31 -156.71
debt collection period Equal variances assumed 10.17 0.00 7.30 131 0.00 61.88 8.48 45.10 78.65
Equal variances not assumed 6.23 56.89 0.00 61.88 9.94 41.98 81.77
stock turnover ratio Equal variances assumed 5.53 0.02 -3.69 127 0.00 -3.59 0.97 -5.52 -1.66
Equal variances not assumed -4.15 105.76 0.00 -3.59 0.86 -5.30 -1.88
days in stocks Equal variances assumed 5.12 0.03 4.16 130 0.00 35.65 8.58 18.68 52.62
Equal variances not assumed 3.39 51.59 0.00 35.65 10.51 14.56 56.74
current assets ratio Equal variances assumed 3.40 0.07 -4.44 130 0.00 -0.81 0.18 -1.17 -0.45
Equal variances not assumed -5.07 112.13 0.00 -0.81 0.16 -1.13 -0.49
quick ratio Equal variances assumed 0.45 0.50 -3.44 130 0.00 -0.49 0.14 -0.78 -0.21
Equal variances not assumed -3.67 94.33 0.00 -0.49 0.13 -0.76 -0.23
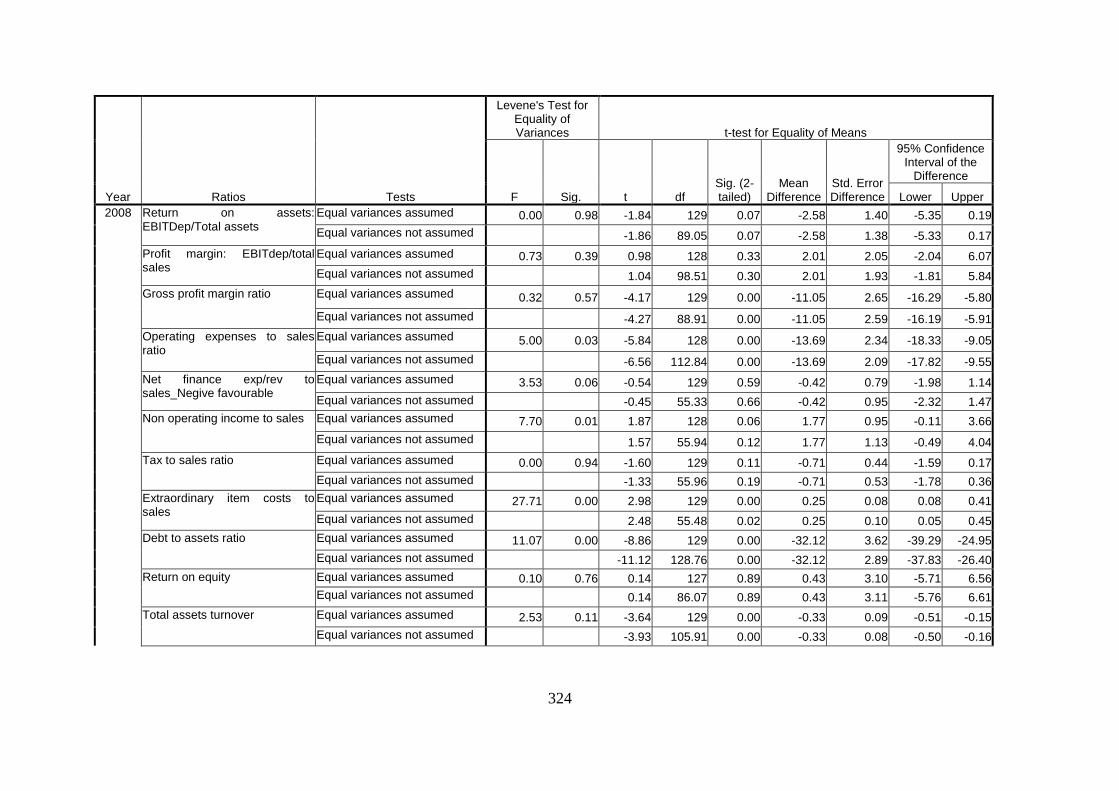
324
Year Ratios Tests
Levene's Test for Equality of Variances t-test for Equality of Means
F Sig. t df Sig. (2-tailed)
Mean Difference
Std. Error Difference
95% Confidence Interval of the
Difference
Lower Upper
2008 Return on assets: EBITDep/Total assets
Equal variances assumed 0.00 0.98 -1.84 129 0.07 -2.58 1.40 -5.35 0.19
Equal variances not assumed -1.86 89.05 0.07 -2.58 1.38 -5.33 0.17
Profit margin: EBITdep/total sales
Equal variances assumed 0.73 0.39 0.98 128 0.33 2.01 2.05 -2.04 6.07
Equal variances not assumed 1.04 98.51 0.30 2.01 1.93 -1.81 5.84
Gross profit margin ratio Equal variances assumed 0.32 0.57 -4.17 129 0.00 -11.05 2.65 -16.29 -5.80
Equal variances not assumed -4.27 88.91 0.00 -11.05 2.59 -16.19 -5.91
Operating expenses to sales ratio
Equal variances assumed 5.00 0.03 -5.84 128 0.00 -13.69 2.34 -18.33 -9.05
Equal variances not assumed -6.56 112.84 0.00 -13.69 2.09 -17.82 -9.55
Net finance exp/rev to sales_Negive favourable
Equal variances assumed 3.53 0.06 -0.54 129 0.59 -0.42 0.79 -1.98 1.14
Equal variances not assumed -0.45 55.33 0.66 -0.42 0.95 -2.32 1.47
Non operating income to sales Equal variances assumed 7.70 0.01 1.87 128 0.06 1.77 0.95 -0.11 3.66
Equal variances not assumed 1.57 55.94 0.12 1.77 1.13 -0.49 4.04
Tax to sales ratio Equal variances assumed 0.00 0.94 -1.60 129 0.11 -0.71 0.44 -1.59 0.17
Equal variances not assumed -1.33 55.96 0.19 -0.71 0.53 -1.78 0.36
Extraordinary item costs to sales
Equal variances assumed 27.71 0.00 2.98 129 0.00 0.25 0.08 0.08 0.41
Equal variances not assumed 2.48 55.48 0.02 0.25 0.10 0.05 0.45
Debt to assets ratio Equal variances assumed 11.07 0.00 -8.86 129 0.00 -32.12 3.62 -39.29 -24.95
Equal variances not assumed -11.12 128.76 0.00 -32.12 2.89 -37.83 -26.40
Return on equity Equal variances assumed 0.10 0.76 0.14 127 0.89 0.43 3.10 -5.71 6.56
Equal variances not assumed 0.14 86.07 0.89 0.43 3.11 -5.76 6.61
Total assets turnover Equal variances assumed 2.53 0.11 -3.64 129 0.00 -0.33 0.09 -0.51 -0.15
Equal variances not assumed -3.93 105.91 0.00 -0.33 0.08 -0.50 -0.16

325
Year Ratios Tests
Levene's Test for Equality of Variances t-test for Equality of Means
F Sig. t df Sig. (2-tailed)
Mean Difference
Std. Error Difference
95% Confidence Interval of the
Difference
Lower Upper
2008 Fixed assets turnover Equal variances assumed 1.03 0.31 -1.56 128 0.12 -0.36 0.23 -0.82 0.10
Equal variances not assumed -1.67 103.28 0.10 -0.36 0.22 -0.79 0.07
Accounts receivable turnover Equal variances assumed 16.22 0.00 -2.52 125 0.01 -179.95 71.52 -321.49 -38.41
Equal variances not assumed -3.52 83.36 0.00 -179.95 51.11 -281.60 -78.30
debt collection period Equal variances assumed 14.36 0.00 6.98 129 0.00 55.19 7.91 39.54 70.84
Equal variances not assumed 5.69 53.98 0.00 55.19 9.69 35.76 74.62
stock turnover ratio Equal variances assumed 6.67 0.01 -2.99 128 0.00 -3.22 1.08 -5.35 -1.09
Equal variances not assumed -3.45 122.78 0.00 -3.22 0.93 -5.06 -1.37
days in stocks Equal variances assumed 0.05 0.83 1.61 129 0.11 22.87 14.19 -5.21 50.95
Equal variances not assumed 1.73 104.65 0.09 22.87 13.22 -3.34 49.07
current assets ratio Equal variances assumed 0.46 0.50 -3.66 127 0.00 -0.71 0.19 -1.10 -0.33
Equal variances not assumed -3.69 88.90 0.00 -0.71 0.19 -1.09 -0.33
quick ratio Equal variances assumed 1.12 0.29 -2.42 127 0.02 -0.35 0.15 -0.64 -0.06
Equal variances not assumed -2.17 65.49 0.03 -0.35 0.16 -0.67 -0.03
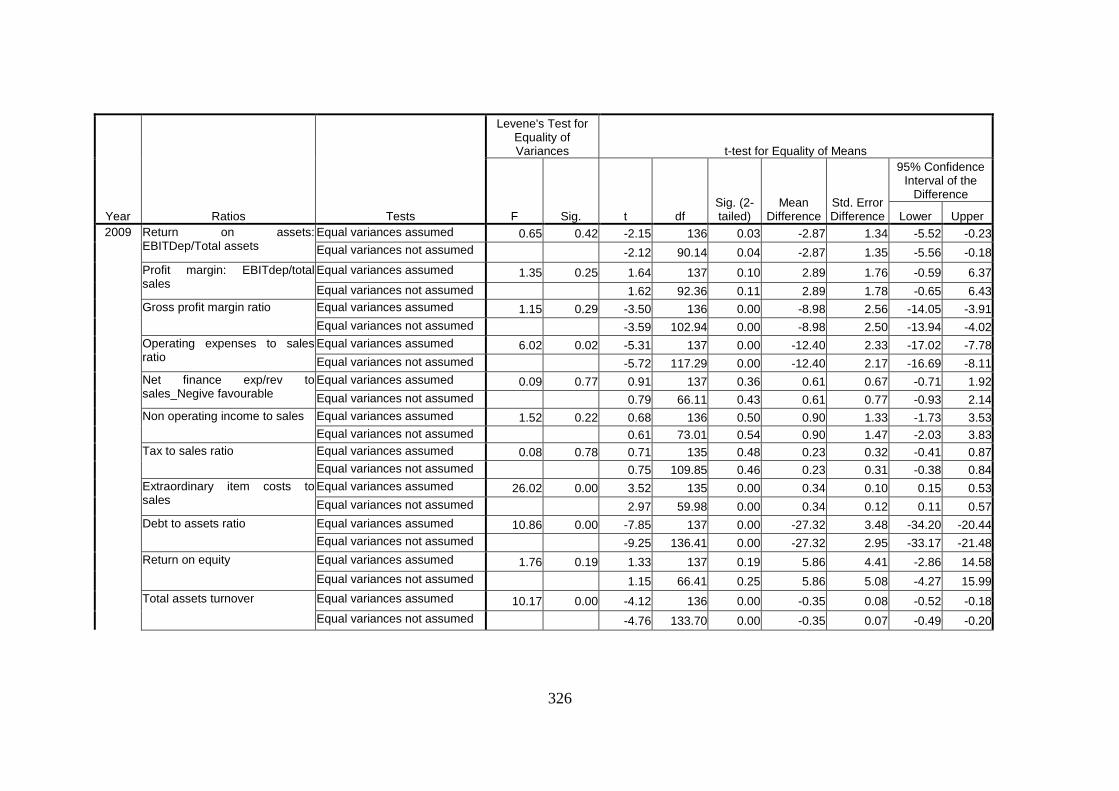
326
Year Ratios Tests
Levene's Test for Equality of Variances t-test for Equality of Means
F Sig. t df Sig. (2-tailed)
Mean Difference
Std. Error Difference
95% Confidence Interval of the
Difference
Lower Upper
2009 Return on assets: EBITDep/Total assets
Equal variances assumed 0.65 0.42 -2.15 136 0.03 -2.87 1.34 -5.52 -0.23
Equal variances not assumed -2.12 90.14 0.04 -2.87 1.35 -5.56 -0.18
Profit margin: EBITdep/total sales
Equal variances assumed 1.35 0.25 1.64 137 0.10 2.89 1.76 -0.59 6.37
Equal variances not assumed 1.62 92.36 0.11 2.89 1.78 -0.65 6.43
Gross profit margin ratio Equal variances assumed 1.15 0.29 -3.50 136 0.00 -8.98 2.56 -14.05 -3.91
Equal variances not assumed -3.59 102.94 0.00 -8.98 2.50 -13.94 -4.02
Operating expenses to sales ratio
Equal variances assumed 6.02 0.02 -5.31 137 0.00 -12.40 2.33 -17.02 -7.78
Equal variances not assumed -5.72 117.29 0.00 -12.40 2.17 -16.69 -8.11
Net finance exp/rev to sales_Negive favourable
Equal variances assumed 0.09 0.77 0.91 137 0.36 0.61 0.67 -0.71 1.92
Equal variances not assumed 0.79 66.11 0.43 0.61 0.77 -0.93 2.14
Non operating income to sales Equal variances assumed 1.52 0.22 0.68 136 0.50 0.90 1.33 -1.73 3.53
Equal variances not assumed 0.61 73.01 0.54 0.90 1.47 -2.03 3.83
Tax to sales ratio Equal variances assumed 0.08 0.78 0.71 135 0.48 0.23 0.32 -0.41 0.87
Equal variances not assumed 0.75 109.85 0.46 0.23 0.31 -0.38 0.84
Extraordinary item costs to sales
Equal variances assumed 26.02 0.00 3.52 135 0.00 0.34 0.10 0.15 0.53
Equal variances not assumed 2.97 59.98 0.00 0.34 0.12 0.11 0.57
Debt to assets ratio Equal variances assumed 10.86 0.00 -7.85 137 0.00 -27.32 3.48 -34.20 -20.44
Equal variances not assumed -9.25 136.41 0.00 -27.32 2.95 -33.17 -21.48
Return on equity Equal variances assumed 1.76 0.19 1.33 137 0.19 5.86 4.41 -2.86 14.58
Equal variances not assumed 1.15 66.41 0.25 5.86 5.08 -4.27 15.99
Total assets turnover Equal variances assumed 10.17 0.00 -4.12 136 0.00 -0.35 0.08 -0.52 -0.18
Equal variances not assumed -4.76 133.70 0.00 -0.35 0.07 -0.49 -0.20

327
Year Ratios Tests
Levene's Test for Equality of Variances t-test for Equality of Means
F Sig. t df Sig. (2-tailed)
Mean Difference
Std. Error Difference
95% Confidence Interval of the
Difference
Lower Upper
2009 Fixed assets turnover Equal variances assumed 2.76 0.10 -1.34 137 0.18 -0.34 0.25 -0.84 0.16
Equal variances not assumed -1.46 120.38 0.15 -0.34 0.23 -0.80 0.12
Accounts receivable turnover Equal variances assumed 12.92 0.00 -2.35 133 0.02 -143.16 60.90 -263.63 -22.70
Equal variances not assumed -3.16 86.85 0.00 -143.16 45.24 -233.09 -53.24
debt collection period Equal variances assumed 0.69 0.41 5.38 137 0.00 53.11 9.88 33.58 72.65
Equal variances not assumed 5.36 95.07 0.00 53.11 9.90 33.46 72.77
stock turnover ratio Equal variances assumed 18.26 0.00 -3.60 134 0.00 -3.49 0.97 -5.40 -1.57
Equal variances not assumed -4.43 131.79 0.00 -3.49 0.79 -5.04 -1.93
days in stocks Equal variances assumed 2.73 0.10 1.87 137 0.06 13.08 7.00 -0.77 26.92
Equal variances not assumed 2.09 127.66 0.04 13.08 6.26 0.70 25.45
current assets ratio Equal variances assumed 4.87 0.03 -3.60 135 0.00 -0.68 0.19 -1.05 -0.30
Equal variances not assumed -4.05 126.04 0.00 -0.68 0.17 -1.01 -0.35
quick ratio Equal variances assumed 0.45 0.50 -2.35 134 0.02 -0.30 0.13 -0.55 -0.05
Equal variances not assumed -2.41 100.43 0.02 -0.30 0.12 -0.54 -0.05
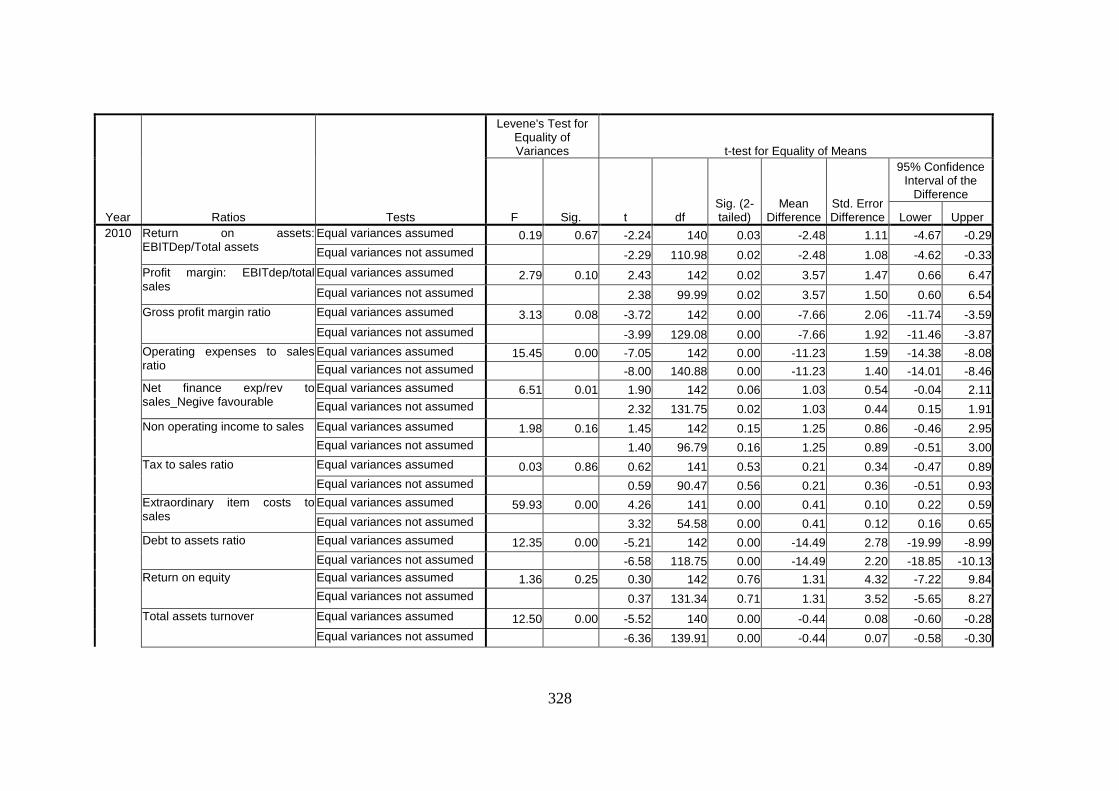
328
Year Ratios Tests
Levene's Test for Equality of Variances t-test for Equality of Means
F Sig. t df Sig. (2-tailed)
Mean Difference
Std. Error Difference
95% Confidence Interval of the
Difference
Lower Upper
2010 Return on assets: EBITDep/Total assets
Equal variances assumed 0.19 0.67 -2.24 140 0.03 -2.48 1.11 -4.67 -0.29
Equal variances not assumed -2.29 110.98 0.02 -2.48 1.08 -4.62 -0.33
Profit margin: EBITdep/total sales
Equal variances assumed 2.79 0.10 2.43 142 0.02 3.57 1.47 0.66 6.47
Equal variances not assumed 2.38 99.99 0.02 3.57 1.50 0.60 6.54
Gross profit margin ratio Equal variances assumed 3.13 0.08 -3.72 142 0.00 -7.66 2.06 -11.74 -3.59
Equal variances not assumed -3.99 129.08 0.00 -7.66 1.92 -11.46 -3.87
Operating expenses to sales ratio
Equal variances assumed 15.45 0.00 -7.05 142 0.00 -11.23 1.59 -14.38 -8.08
Equal variances not assumed -8.00 140.88 0.00 -11.23 1.40 -14.01 -8.46
Net finance exp/rev to sales_Negive favourable
Equal variances assumed 6.51 0.01 1.90 142 0.06 1.03 0.54 -0.04 2.11
Equal variances not assumed 2.32 131.75 0.02 1.03 0.44 0.15 1.91
Non operating income to sales Equal variances assumed 1.98 0.16 1.45 142 0.15 1.25 0.86 -0.46 2.95
Equal variances not assumed 1.40 96.79 0.16 1.25 0.89 -0.51 3.00
Tax to sales ratio Equal variances assumed 0.03 0.86 0.62 141 0.53 0.21 0.34 -0.47 0.89
Equal variances not assumed 0.59 90.47 0.56 0.21 0.36 -0.51 0.93
Extraordinary item costs to sales
Equal variances assumed 59.93 0.00 4.26 141 0.00 0.41 0.10 0.22 0.59
Equal variances not assumed 3.32 54.58 0.00 0.41 0.12 0.16 0.65
Debt to assets ratio Equal variances assumed 12.35 0.00 -5.21 142 0.00 -14.49 2.78 -19.99 -8.99
Equal variances not assumed -6.58 118.75 0.00 -14.49 2.20 -18.85 -10.13
Return on equity Equal variances assumed 1.36 0.25 0.30 142 0.76 1.31 4.32 -7.22 9.84
Equal variances not assumed 0.37 131.34 0.71 1.31 3.52 -5.65 8.27
Total assets turnover Equal variances assumed 12.50 0.00 -5.52 140 0.00 -0.44 0.08 -0.60 -0.28
Equal variances not assumed -6.36 139.91 0.00 -0.44 0.07 -0.58 -0.30

329
Year Ratios Tests
Levene's Test for Equality of Variances t-test for Equality of Means
F Sig. t df Sig. (2-tailed)
Mean Difference
Std. Error Difference
95% Confidence Interval of the
Difference
Lower Upper
2010 Fixed assets turnover Equal variances assumed 7.83 0.01 -1.61 142 0.11 -0.37 0.23 -0.82 0.08
Equal variances not assumed -1.73 129.77 0.09 -0.37 0.21 -0.79 0.05
Accounts receivable turnover Equal variances assumed 27.23 0.00 -3.01 140 0.00 -182.04 60.41 -301.46 -62.61
Equal variances not assumed -3.97 89.62 0.00 -182.04 45.90 -273.23 -90.84
debt collection period Equal variances assumed 0.57 0.45 8.00 142 0.00 39.20 4.90 29.51 48.89
Equal variances not assumed 7.89 101.61 0.00 39.20 4.97 29.34 49.06
stock turnover ratio Equal variances assumed 11.47 0.00 -4.08 140 0.00 -3.49 0.85 -5.17 -1.80
Equal variances not assumed -4.73 139.54 0.00 -3.49 0.74 -4.94 -2.03
days in stocks Equal variances assumed 0.68 0.41 4.06 141 0.00 22.57 5.56 11.58 33.56
Equal variances not assumed 3.90 91.66 0.00 22.57 5.79 11.07 34.07
current assets ratio Equal variances assumed 0.51 0.48 1.99 139 0.05 0.31 0.16 0.00 0.63
Equal variances not assumed 2.00 106.93 0.05 0.31 0.16 0.00 0.63
quick ratio Equal variances assumed 2.25 0.14 2.69 139 0.01 0.34 0.13 0.09 0.58
Equal variances not assumed 2.65 99.41 0.01 0.34 0.13 0.08 0.59
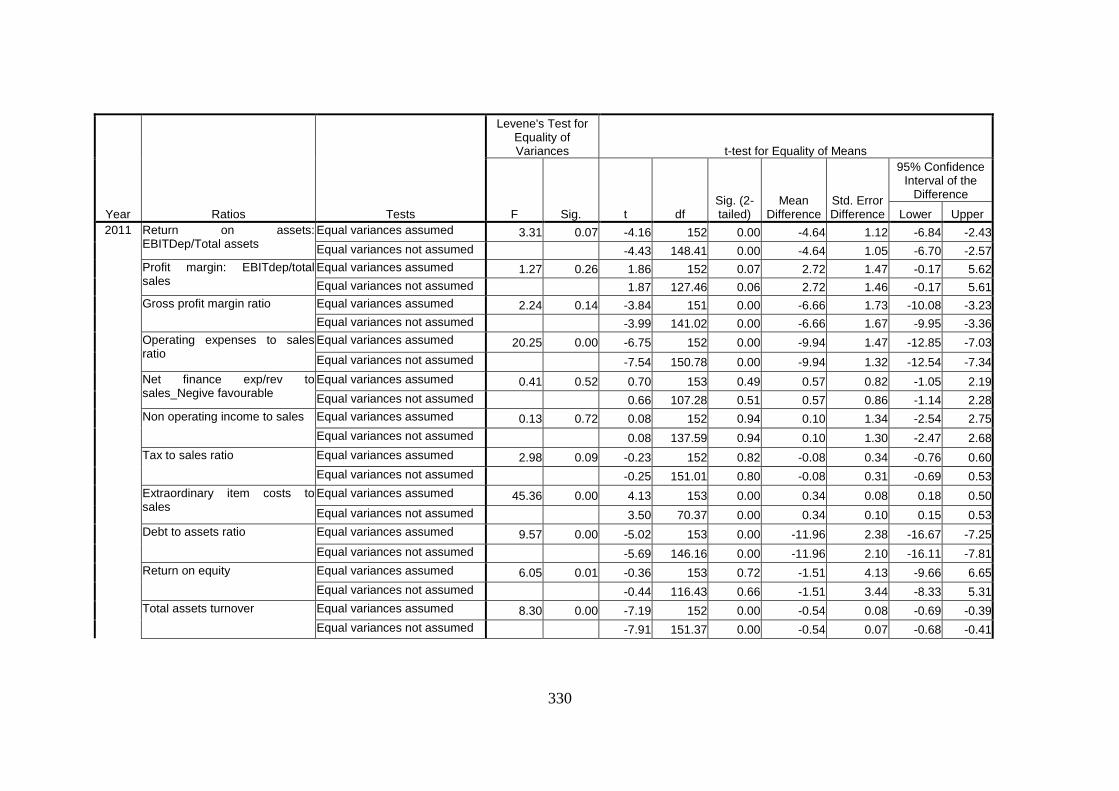
330
Year Ratios Tests
Levene's Test for Equality of Variances t-test for Equality of Means
F Sig. t df Sig. (2-tailed)
Mean Difference
Std. Error Difference
95% Confidence Interval of the
Difference
Lower Upper
2011 Return on assets: EBITDep/Total assets
Equal variances assumed 3.31 0.07 -4.16 152 0.00 -4.64 1.12 -6.84 -2.43
Equal variances not assumed -4.43 148.41 0.00 -4.64 1.05 -6.70 -2.57
Profit margin: EBITdep/total sales
Equal variances assumed 1.27 0.26 1.86 152 0.07 2.72 1.47 -0.17 5.62
Equal variances not assumed 1.87 127.46 0.06 2.72 1.46 -0.17 5.61
Gross profit margin ratio Equal variances assumed 2.24 0.14 -3.84 151 0.00 -6.66 1.73 -10.08 -3.23
Equal variances not assumed -3.99 141.02 0.00 -6.66 1.67 -9.95 -3.36
Operating expenses to sales ratio
Equal variances assumed 20.25 0.00 -6.75 152 0.00 -9.94 1.47 -12.85 -7.03
Equal variances not assumed -7.54 150.78 0.00 -9.94 1.32 -12.54 -7.34
Net finance exp/rev to sales_Negive favourable
Equal variances assumed 0.41 0.52 0.70 153 0.49 0.57 0.82 -1.05 2.19
Equal variances not assumed 0.66 107.28 0.51 0.57 0.86 -1.14 2.28
Non operating income to sales Equal variances assumed 0.13 0.72 0.08 152 0.94 0.10 1.34 -2.54 2.75
Equal variances not assumed 0.08 137.59 0.94 0.10 1.30 -2.47 2.68
Tax to sales ratio Equal variances assumed 2.98 0.09 -0.23 152 0.82 -0.08 0.34 -0.76 0.60
Equal variances not assumed -0.25 151.01 0.80 -0.08 0.31 -0.69 0.53
Extraordinary item costs to sales
Equal variances assumed 45.36 0.00 4.13 153 0.00 0.34 0.08 0.18 0.50
Equal variances not assumed 3.50 70.37 0.00 0.34 0.10 0.15 0.53
Debt to assets ratio Equal variances assumed 9.57 0.00 -5.02 153 0.00 -11.96 2.38 -16.67 -7.25
Equal variances not assumed -5.69 146.16 0.00 -11.96 2.10 -16.11 -7.81
Return on equity Equal variances assumed 6.05 0.01 -0.36 153 0.72 -1.51 4.13 -9.66 6.65
Equal variances not assumed -0.44 116.43 0.66 -1.51 3.44 -8.33 5.31
Total assets turnover Equal variances assumed 8.30 0.00 -7.19 152 0.00 -0.54 0.08 -0.69 -0.39
Equal variances not assumed -7.91 151.37 0.00 -0.54 0.07 -0.68 -0.41
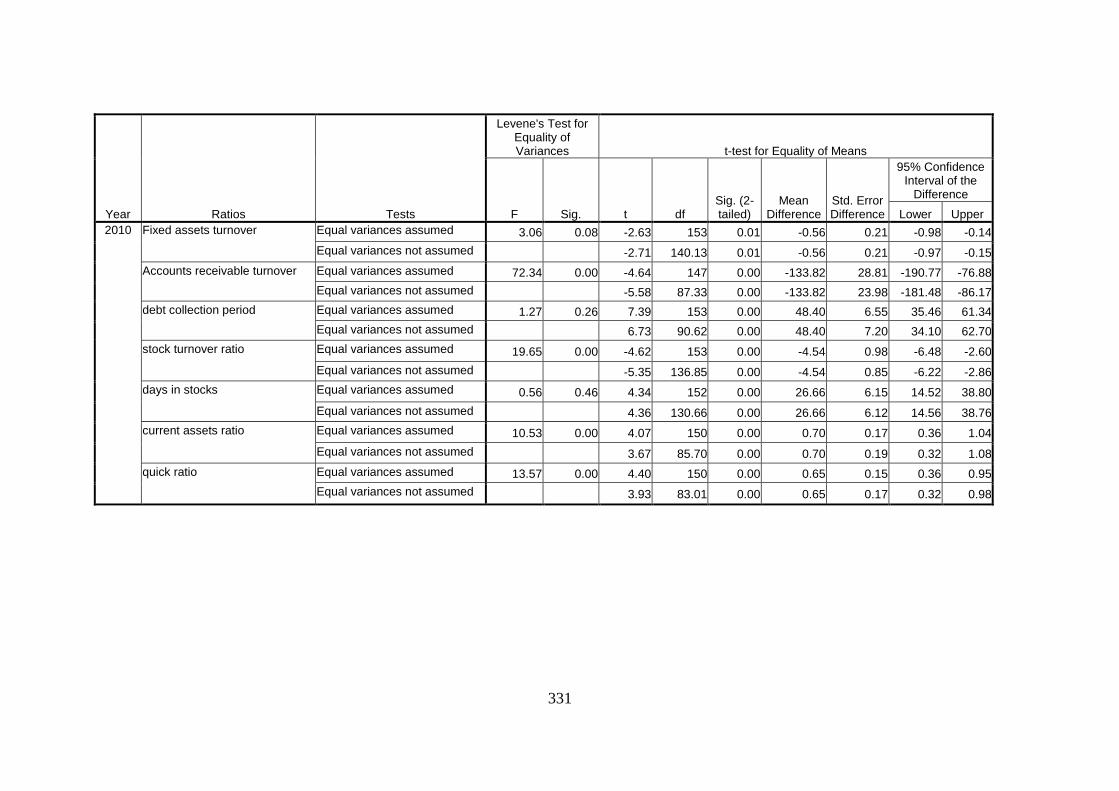
331
Year Ratios Tests
Levene's Test for Equality of Variances t-test for Equality of Means
F Sig. t df Sig. (2-tailed)
Mean Difference
Std. Error Difference
95% Confidence Interval of the
Difference
Lower Upper
2010 Fixed assets turnover Equal variances assumed 3.06 0.08 -2.63 153 0.01 -0.56 0.21 -0.98 -0.14
Equal variances not assumed -2.71 140.13 0.01 -0.56 0.21 -0.97 -0.15
Accounts receivable turnover Equal variances assumed 72.34 0.00 -4.64 147 0.00 -133.82 28.81 -190.77 -76.88
Equal variances not assumed -5.58 87.33 0.00 -133.82 23.98 -181.48 -86.17
debt collection period Equal variances assumed 1.27 0.26 7.39 153 0.00 48.40 6.55 35.46 61.34
Equal variances not assumed 6.73 90.62 0.00 48.40 7.20 34.10 62.70
stock turnover ratio Equal variances assumed 19.65 0.00 -4.62 153 0.00 -4.54 0.98 -6.48 -2.60
Equal variances not assumed -5.35 136.85 0.00 -4.54 0.85 -6.22 -2.86
days in stocks Equal variances assumed 0.56 0.46 4.34 152 0.00 26.66 6.15 14.52 38.80
Equal variances not assumed 4.36 130.66 0.00 26.66 6.12 14.56 38.76
current assets ratio Equal variances assumed 10.53 0.00 4.07 150 0.00 0.70 0.17 0.36 1.04
Equal variances not assumed 3.67 85.70 0.00 0.70 0.19 0.32 1.08
quick ratio Equal variances assumed 13.57 0.00 4.40 150 0.00 0.65 0.15 0.36 0.95
Equal variances not assumed 3.93 83.01 0.00 0.65 0.17 0.32 0.98
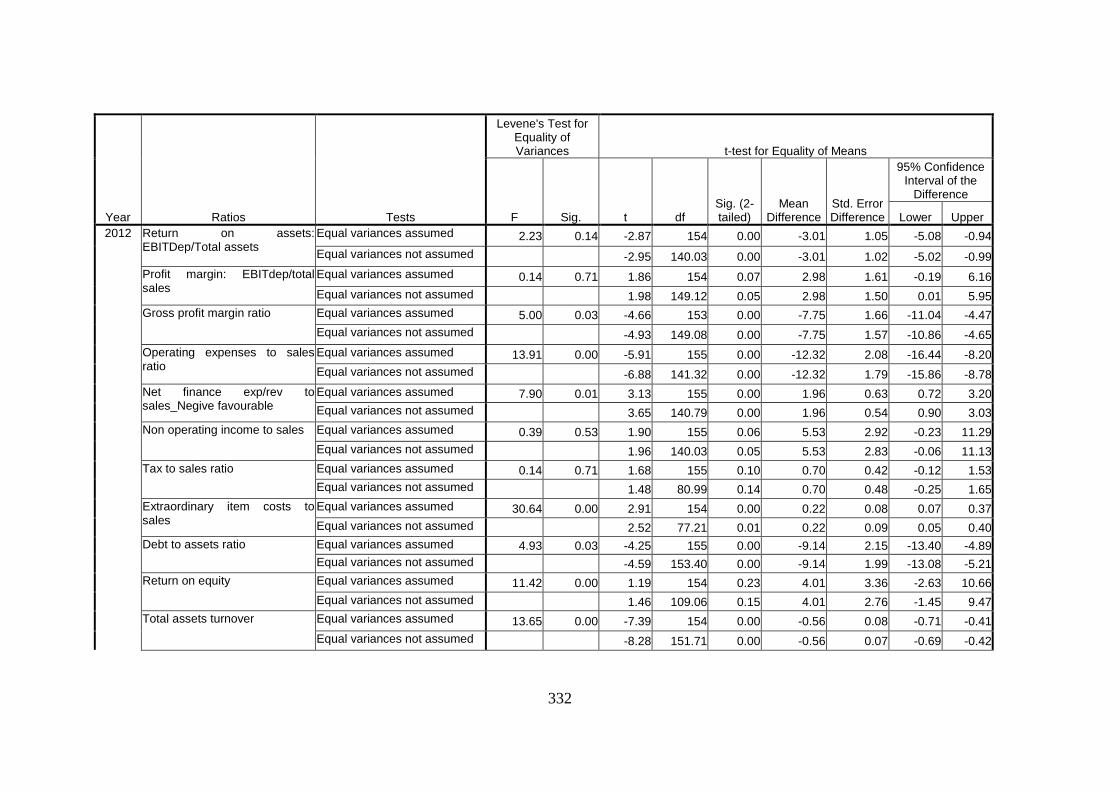
332
Year Ratios Tests
Levene's Test for Equality of Variances t-test for Equality of Means
F Sig. t df Sig. (2-tailed)
Mean Difference
Std. Error Difference
95% Confidence Interval of the
Difference
Lower Upper
2012 Return on assets: EBITDep/Total assets
Equal variances assumed 2.23 0.14 -2.87 154 0.00 -3.01 1.05 -5.08 -0.94
Equal variances not assumed -2.95 140.03 0.00 -3.01 1.02 -5.02 -0.99
Profit margin: EBITdep/total sales
Equal variances assumed 0.14 0.71 1.86 154 0.07 2.98 1.61 -0.19 6.16
Equal variances not assumed 1.98 149.12 0.05 2.98 1.50 0.01 5.95
Gross profit margin ratio Equal variances assumed 5.00 0.03 -4.66 153 0.00 -7.75 1.66 -11.04 -4.47
Equal variances not assumed -4.93 149.08 0.00 -7.75 1.57 -10.86 -4.65
Operating expenses to sales ratio
Equal variances assumed 13.91 0.00 -5.91 155 0.00 -12.32 2.08 -16.44 -8.20
Equal variances not assumed -6.88 141.32 0.00 -12.32 1.79 -15.86 -8.78
Net finance exp/rev to sales_Negive favourable
Equal variances assumed 7.90 0.01 3.13 155 0.00 1.96 0.63 0.72 3.20
Equal variances not assumed 3.65 140.79 0.00 1.96 0.54 0.90 3.03
Non operating income to sales Equal variances assumed 0.39 0.53 1.90 155 0.06 5.53 2.92 -0.23 11.29
Equal variances not assumed 1.96 140.03 0.05 5.53 2.83 -0.06 11.13
Tax to sales ratio Equal variances assumed 0.14 0.71 1.68 155 0.10 0.70 0.42 -0.12 1.53
Equal variances not assumed 1.48 80.99 0.14 0.70 0.48 -0.25 1.65
Extraordinary item costs to sales
Equal variances assumed 30.64 0.00 2.91 154 0.00 0.22 0.08 0.07 0.37
Equal variances not assumed 2.52 77.21 0.01 0.22 0.09 0.05 0.40
Debt to assets ratio Equal variances assumed 4.93 0.03 -4.25 155 0.00 -9.14 2.15 -13.40 -4.89
Equal variances not assumed -4.59 153.40 0.00 -9.14 1.99 -13.08 -5.21
Return on equity Equal variances assumed 11.42 0.00 1.19 154 0.23 4.01 3.36 -2.63 10.66
Equal variances not assumed 1.46 109.06 0.15 4.01 2.76 -1.45 9.47
Total assets turnover Equal variances assumed 13.65 0.00 -7.39 154 0.00 -0.56 0.08 -0.71 -0.41
Equal variances not assumed -8.28 151.71 0.00 -0.56 0.07 -0.69 -0.42

333
Year Ratios Tests
Levene's Test for Equality of Variances t-test for Equality of Means
F Sig. t df Sig. (2-tailed)
Mean Difference
Std. Error Difference
95% Confidence Interval of the
Difference
Lower Upper
2012 Fixed assets turnover Equal variances assumed 3.50 0.06 -3.24 155 0.00 -0.63 0.19 -1.01 -0.24
Equal variances not assumed -3.40 146.62 0.00 -0.63 0.18 -0.99 -0.26
Accounts receivable turnover Equal variances assumed 19.60 0.00 -2.68 150 0.01 -104.13 38.91 -181.02 -27.23
Equal variances not assumed -3.27 90.19 0.00 -104.13 31.84 -167.37 -40.88
debt collection period Equal variances assumed 4.04 0.05 2.92 155 0.00 78.15 26.76 25.28 131.02
Equal variances not assumed 2.34 61.40 0.02 78.15 33.35 11.47 144.84
stock turnover ratio Equal variances assumed 13.68 0.00 -5.17 152 0.00 -4.01 0.77 -5.54 -2.48
Equal variances not assumed -5.89 141.87 0.00 -4.01 0.68 -5.35 -2.66
days in stocks Equal variances assumed 1.42 0.23 3.86 154 0.00 32.74 8.47 16.01 49.48
Equal variances not assumed 3.81 119.84 0.00 32.74 8.59 15.74 49.74
current assets ratio Equal variances assumed 17.97 0.00 5.26 150 0.00 0.84 0.16 0.52 1.15
Equal variances not assumed 4.67 80.71 0.00 0.84 0.18 0.48 1.19
quick ratio Equal variances assumed 27.65 0.00 5.24 153 0.00 1.05 0.20 0.65 1.44
Equal variances not assumed 4.39 68.64 0.00 1.05 0.24 0.57 1.52
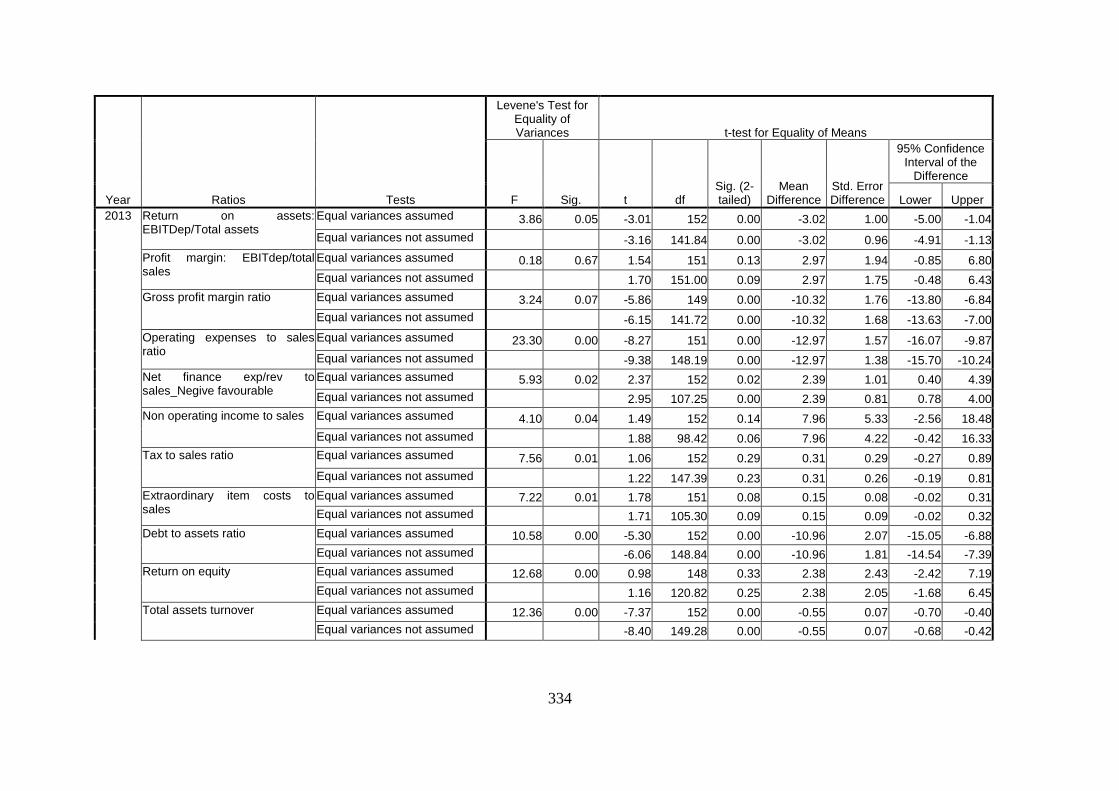
334
Year Ratios Tests
Levene's Test for Equality of Variances t-test for Equality of Means
F Sig. t df Sig. (2-tailed)
Mean Difference
Std. Error Difference
95% Confidence Interval of the
Difference
Lower Upper
2013 Return on assets: EBITDep/Total assets
Equal variances assumed 3.86 0.05 -3.01 152 0.00 -3.02 1.00 -5.00 -1.04
Equal variances not assumed -3.16 141.84 0.00 -3.02 0.96 -4.91 -1.13
Profit margin: EBITdep/total sales
Equal variances assumed 0.18 0.67 1.54 151 0.13 2.97 1.94 -0.85 6.80
Equal variances not assumed 1.70 151.00 0.09 2.97 1.75 -0.48 6.43
Gross profit margin ratio Equal variances assumed 3.24 0.07 -5.86 149 0.00 -10.32 1.76 -13.80 -6.84
Equal variances not assumed -6.15 141.72 0.00 -10.32 1.68 -13.63 -7.00
Operating expenses to sales ratio
Equal variances assumed 23.30 0.00 -8.27 151 0.00 -12.97 1.57 -16.07 -9.87
Equal variances not assumed -9.38 148.19 0.00 -12.97 1.38 -15.70 -10.24
Net finance exp/rev to sales_Negive favourable
Equal variances assumed 5.93 0.02 2.37 152 0.02 2.39 1.01 0.40 4.39
Equal variances not assumed 2.95 107.25 0.00 2.39 0.81 0.78 4.00
Non operating income to sales Equal variances assumed 4.10 0.04 1.49 152 0.14 7.96 5.33 -2.56 18.48
Equal variances not assumed 1.88 98.42 0.06 7.96 4.22 -0.42 16.33
Tax to sales ratio Equal variances assumed 7.56 0.01 1.06 152 0.29 0.31 0.29 -0.27 0.89
Equal variances not assumed 1.22 147.39 0.23 0.31 0.26 -0.19 0.81
Extraordinary item costs to sales
Equal variances assumed 7.22 0.01 1.78 151 0.08 0.15 0.08 -0.02 0.31
Equal variances not assumed 1.71 105.30 0.09 0.15 0.09 -0.02 0.32
Debt to assets ratio Equal variances assumed 10.58 0.00 -5.30 152 0.00 -10.96 2.07 -15.05 -6.88
Equal variances not assumed -6.06 148.84 0.00 -10.96 1.81 -14.54 -7.39
Return on equity Equal variances assumed 12.68 0.00 0.98 148 0.33 2.38 2.43 -2.42 7.19
Equal variances not assumed 1.16 120.82 0.25 2.38 2.05 -1.68 6.45
Total assets turnover Equal variances assumed 12.36 0.00 -7.37 152 0.00 -0.55 0.07 -0.70 -0.40
Equal variances not assumed -8.40 149.28 0.00 -0.55 0.07 -0.68 -0.42
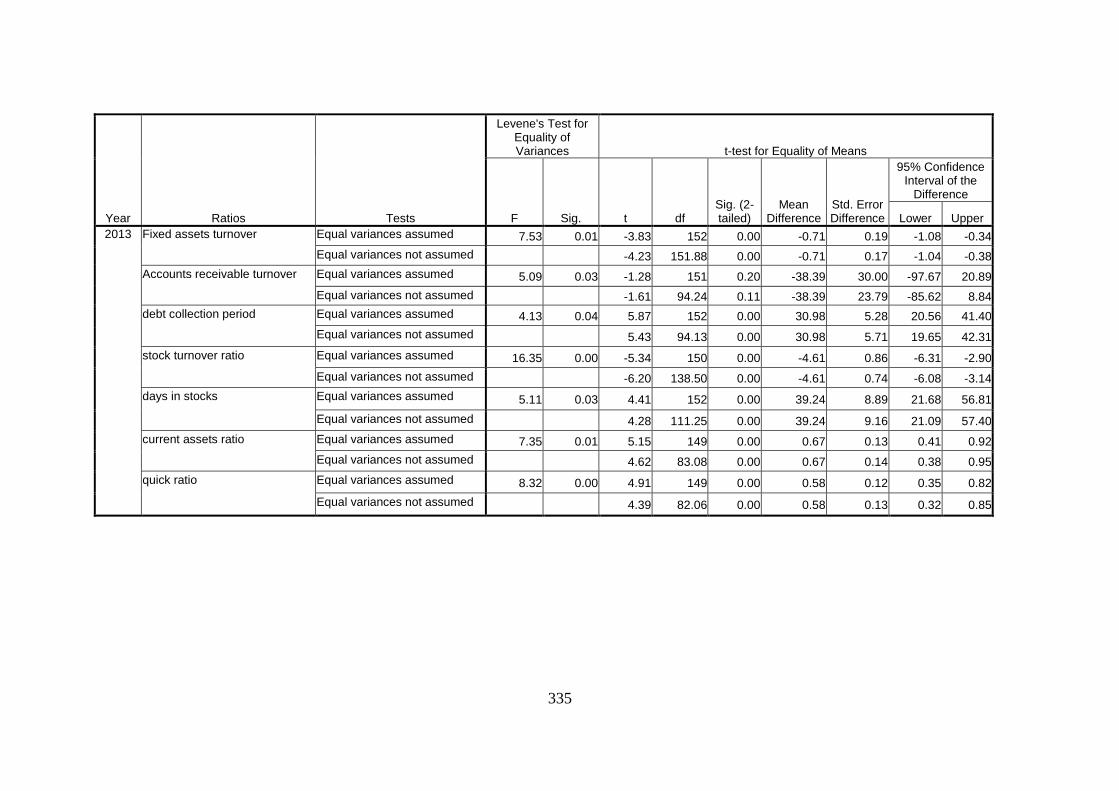
335
Year Ratios Tests
Levene's Test for Equality of Variances t-test for Equality of Means
F Sig. t df Sig. (2-tailed)
Mean Difference
Std. Error Difference
95% Confidence Interval of the
Difference
Lower Upper
2013 Fixed assets turnover Equal variances assumed 7.53 0.01 -3.83 152 0.00 -0.71 0.19 -1.08 -0.34
Equal variances not assumed -4.23 151.88 0.00 -0.71 0.17 -1.04 -0.38
Accounts receivable turnover Equal variances assumed 5.09 0.03 -1.28 151 0.20 -38.39 30.00 -97.67 20.89
Equal variances not assumed -1.61 94.24 0.11 -38.39 23.79 -85.62 8.84
debt collection period Equal variances assumed 4.13 0.04 5.87 152 0.00 30.98 5.28 20.56 41.40
Equal variances not assumed 5.43 94.13 0.00 30.98 5.71 19.65 42.31
stock turnover ratio Equal variances assumed 16.35 0.00 -5.34 150 0.00 -4.61 0.86 -6.31 -2.90
Equal variances not assumed -6.20 138.50 0.00 -4.61 0.74 -6.08 -3.14
days in stocks Equal variances assumed 5.11 0.03 4.41 152 0.00 39.24 8.89 21.68 56.81
Equal variances not assumed 4.28 111.25 0.00 39.24 9.16 21.09 57.40
current assets ratio Equal variances assumed 7.35 0.01 5.15 149 0.00 0.67 0.13 0.41 0.92
Equal variances not assumed 4.62 83.08 0.00 0.67 0.14 0.38 0.95
quick ratio Equal variances assumed 8.32 0.00 4.91 149 0.00 0.58 0.12 0.35 0.82
Equal variances not assumed 4.39 82.06 0.00 0.58 0.13 0.32 0.85
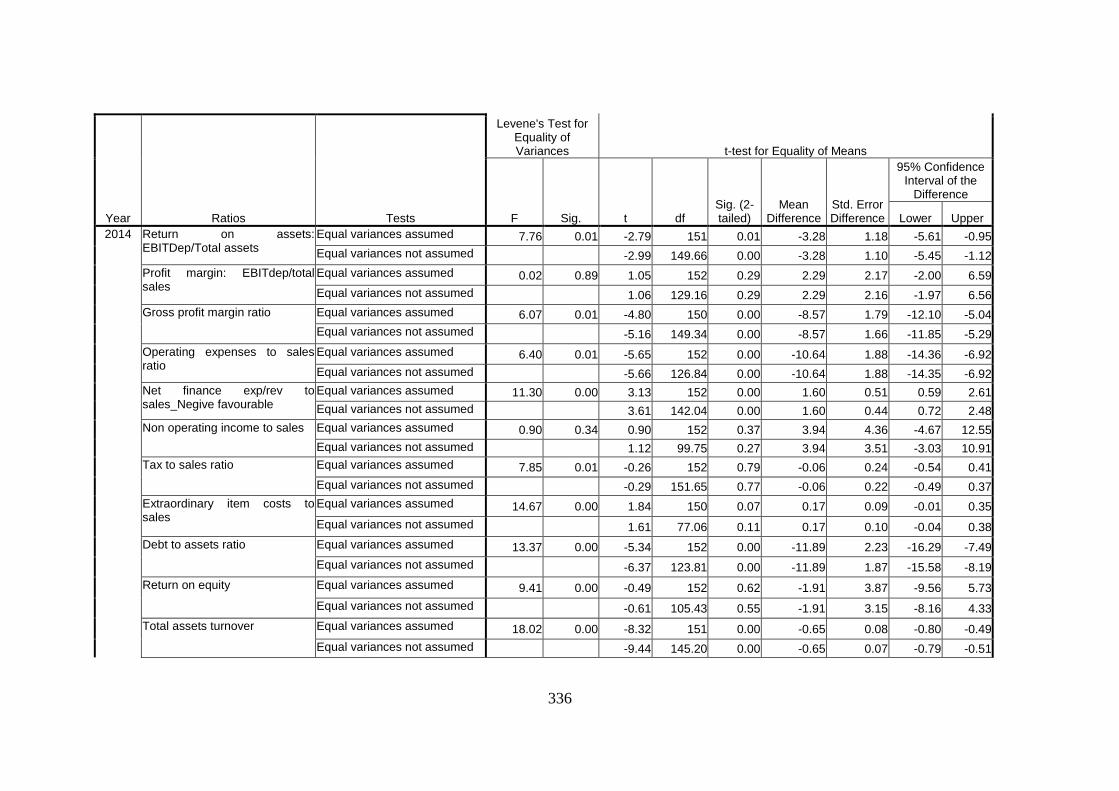
336
Year Ratios Tests
Levene's Test for Equality of Variances t-test for Equality of Means
F Sig. t df Sig. (2-tailed)
Mean Difference
Std. Error Difference
95% Confidence Interval of the
Difference
Lower Upper
2014 Return on assets: EBITDep/Total assets
Equal variances assumed 7.76 0.01 -2.79 151 0.01 -3.28 1.18 -5.61 -0.95
Equal variances not assumed -2.99 149.66 0.00 -3.28 1.10 -5.45 -1.12
Profit margin: EBITdep/total sales
Equal variances assumed 0.02 0.89 1.05 152 0.29 2.29 2.17 -2.00 6.59
Equal variances not assumed 1.06 129.16 0.29 2.29 2.16 -1.97 6.56
Gross profit margin ratio Equal variances assumed 6.07 0.01 -4.80 150 0.00 -8.57 1.79 -12.10 -5.04
Equal variances not assumed -5.16 149.34 0.00 -8.57 1.66 -11.85 -5.29
Operating expenses to sales ratio
Equal variances assumed 6.40 0.01 -5.65 152 0.00 -10.64 1.88 -14.36 -6.92
Equal variances not assumed -5.66 126.84 0.00 -10.64 1.88 -14.35 -6.92
Net finance exp/rev to sales_Negive favourable
Equal variances assumed 11.30 0.00 3.13 152 0.00 1.60 0.51 0.59 2.61
Equal variances not assumed 3.61 142.04 0.00 1.60 0.44 0.72 2.48
Non operating income to sales Equal variances assumed 0.90 0.34 0.90 152 0.37 3.94 4.36 -4.67 12.55
Equal variances not assumed 1.12 99.75 0.27 3.94 3.51 -3.03 10.91
Tax to sales ratio Equal variances assumed 7.85 0.01 -0.26 152 0.79 -0.06 0.24 -0.54 0.41
Equal variances not assumed -0.29 151.65 0.77 -0.06 0.22 -0.49 0.37
Extraordinary item costs to sales
Equal variances assumed 14.67 0.00 1.84 150 0.07 0.17 0.09 -0.01 0.35
Equal variances not assumed 1.61 77.06 0.11 0.17 0.10 -0.04 0.38
Debt to assets ratio Equal variances assumed 13.37 0.00 -5.34 152 0.00 -11.89 2.23 -16.29 -7.49
Equal variances not assumed -6.37 123.81 0.00 -11.89 1.87 -15.58 -8.19
Return on equity Equal variances assumed 9.41 0.00 -0.49 152 0.62 -1.91 3.87 -9.56 5.73
Equal variances not assumed -0.61 105.43 0.55 -1.91 3.15 -8.16 4.33
Total assets turnover Equal variances assumed 18.02 0.00 -8.32 151 0.00 -0.65 0.08 -0.80 -0.49
Equal variances not assumed -9.44 145.20 0.00 -0.65 0.07 -0.79 -0.51
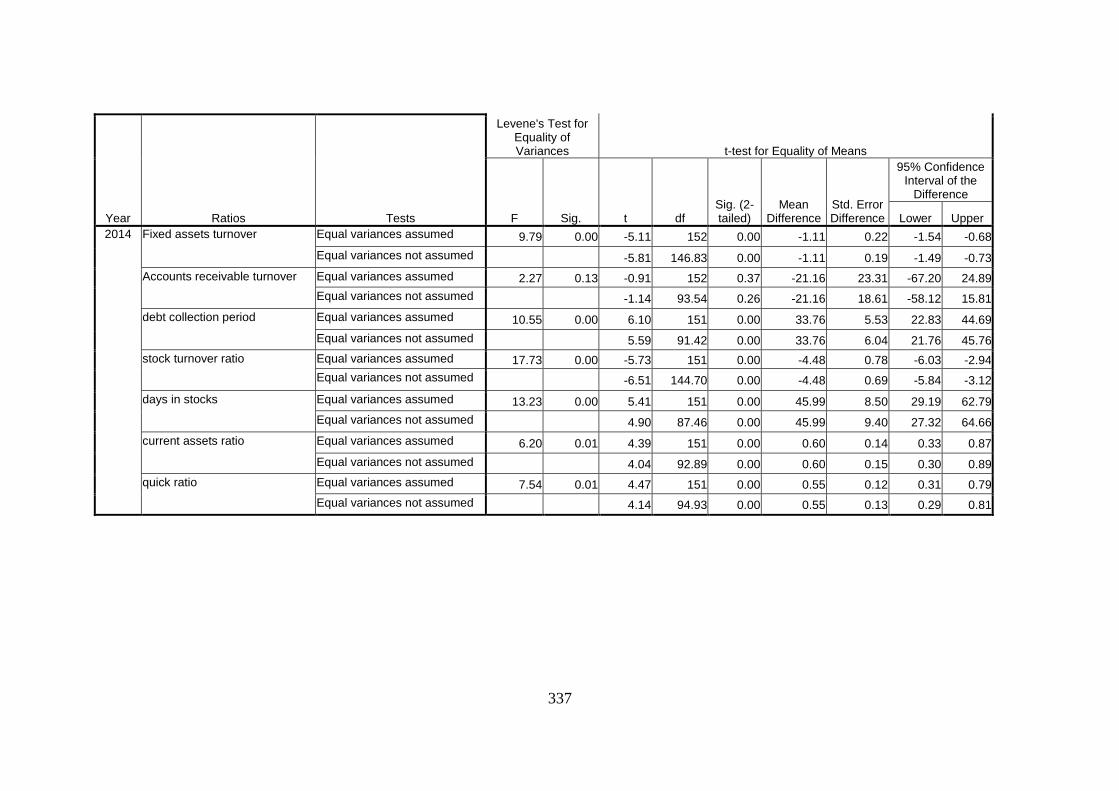
337
Year Ratios Tests
Levene's Test for Equality of Variances t-test for Equality of Means
F Sig. t df Sig. (2-tailed)
Mean Difference
Std. Error Difference
95% Confidence Interval of the
Difference
Lower Upper
2014 Fixed assets turnover Equal variances assumed 9.79 0.00 -5.11 152 0.00 -1.11 0.22 -1.54 -0.68
Equal variances not assumed -5.81 146.83 0.00 -1.11 0.19 -1.49 -0.73
Accounts receivable turnover Equal variances assumed 2.27 0.13 -0.91 152 0.37 -21.16 23.31 -67.20 24.89
Equal variances not assumed -1.14 93.54 0.26 -21.16 18.61 -58.12 15.81
debt collection period Equal variances assumed 10.55 0.00 6.10 151 0.00 33.76 5.53 22.83 44.69
Equal variances not assumed 5.59 91.42 0.00 33.76 6.04 21.76 45.76
stock turnover ratio Equal variances assumed 17.73 0.00 -5.73 151 0.00 -4.48 0.78 -6.03 -2.94
Equal variances not assumed -6.51 144.70 0.00 -4.48 0.69 -5.84 -3.12
days in stocks Equal variances assumed 13.23 0.00 5.41 151 0.00 45.99 8.50 29.19 62.79
Equal variances not assumed 4.90 87.46 0.00 45.99 9.40 27.32 64.66
current assets ratio Equal variances assumed 6.20 0.01 4.39 151 0.00 0.60 0.14 0.33 0.87
Equal variances not assumed 4.04 92.89 0.00 0.60 0.15 0.30 0.89
quick ratio Equal variances assumed 7.54 0.01 4.47 151 0.00 0.55 0.12 0.31 0.79
Equal variances not assumed 4.14 94.93 0.00 0.55 0.13 0.29 0.81
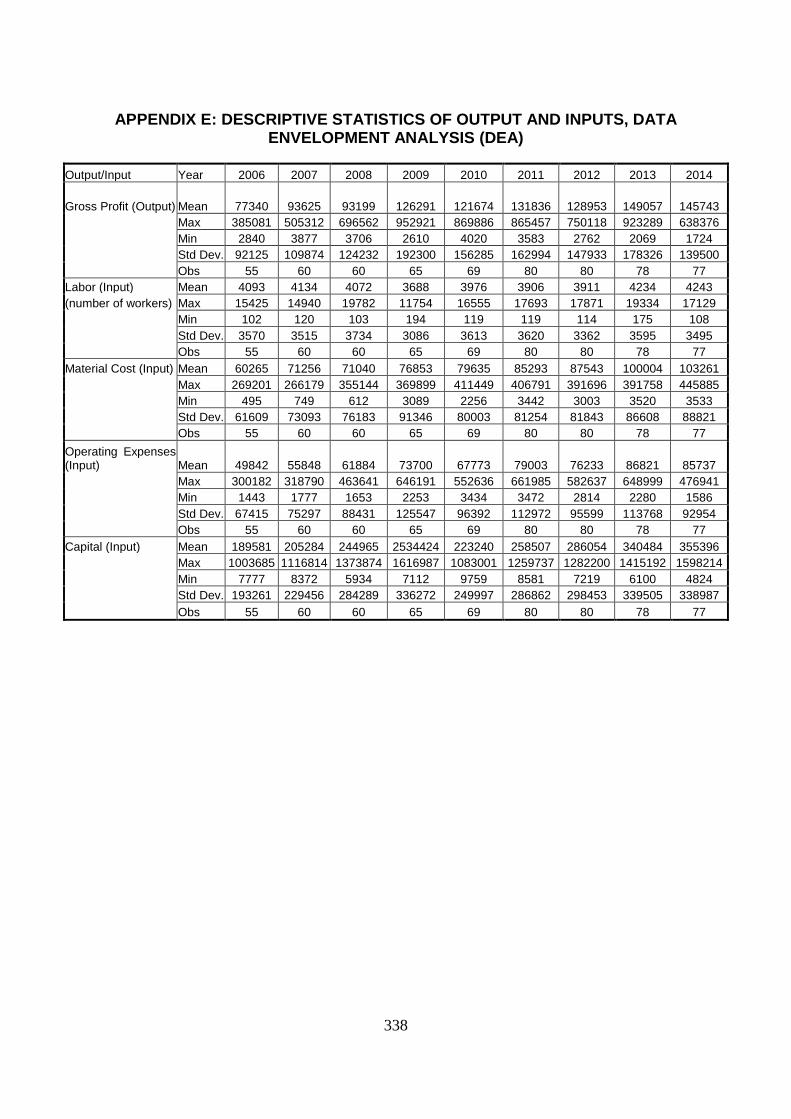
338
APPENDIX E: DESCRIPTIVE STATISTICS OF OUTPUT AND INPUTS, DATA ENVELOPMENT ANALYSIS (DEA)
Output/Input Year 2006 2007 2008 2009 2010 2011 2012 2013 2014
Gross Profit (Output) Mean 77340 93625 93199 126291 121674 131836 128953 149057 145743
Max 385081 505312 696562 952921 869886 865457 750118 923289 638376
Min 2840 3877 3706 2610 4020 3583 2762 2069 1724
Std Dev. 92125 109874 124232 192300 156285 162994 147933 178326 139500
Obs 55 60 60 65 69 80 80 78 77
Labor (Input) Mean 4093 4134 4072 3688 3976 3906 3911 4234 4243
(number of workers) Max 15425 14940 19782 11754 16555 17693 17871 19334 17129
Min 102 120 103 194 119 119 114 175 108
Std Dev. 3570 3515 3734 3086 3613 3620 3362 3595 3495
Obs 55 60 60 65 69 80 80 78 77
Material Cost (Input) Mean 60265 71256 71040 76853 79635 85293 87543 100004 103261
Max 269201 266179 355144 369899 411449 406791 391696 391758 445885
Min 495 749 612 3089 2256 3442 3003 3520 3533
Std Dev. 61609 73093 76183 91346 80003 81254 81843 86608 88821
Obs 55 60 60 65 69 80 80 78 77
Operating Expenses (Input) Mean 49842 55848 61884 73700 67773 79003 76233 86821 85737
Max 300182 318790 463641 646191 552636 661985 582637 648999 476941
Min 1443 1777 1653 2253 3434 3472 2814 2280 1586
Std Dev. 67415 75297 88431 125547 96392 112972 95599 113768 92954
Obs 55 60 60 65 69 80 80 78 77
Capital (Input) Mean 189581 205284 244965 2534424 223240 258507 286054 340484 355396
Max 1003685 1116814 1373874 1616987 1083001 1259737 1282200 1415192 1598214
Min 7777 8372 5934 7112 9759 8581 7219 6100 4824
Std Dev. 193261 229456 284289 336272 249997 286862 298453 339505 338987
Obs 55 60 60 65 69 80 80 78 77
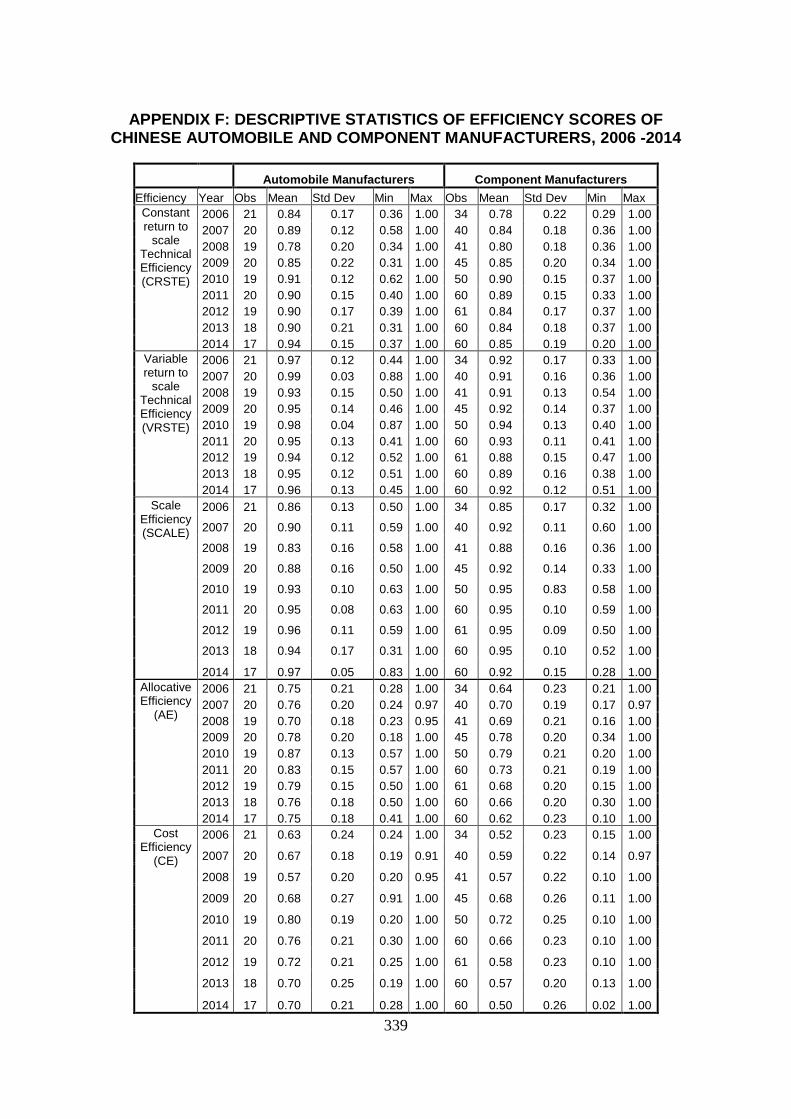
339
APPENDIX F: DESCRIPTIVE STATISTICS OF EFFICIENCY SCORES OF CHINESE AUTOMOBILE AND COMPONENT MANUFACTURERS, 2006 -2014
Automobile Manufacturers Component Manufacturers
Efficiency Year Obs Mean Std Dev Min Max Obs Mean Std Dev Min Max
Constant return to
scale Technical Efficiency (CRSTE)
2006 21 0.84 0.17 0.36 1.00 34 0.78 0.22 0.29 1.00
2007 20 0.89 0.12 0.58 1.00 40 0.84 0.18 0.36 1.00
2008 19 0.78 0.20 0.34 1.00 41 0.80 0.18 0.36 1.00
2009 20 0.85 0.22 0.31 1.00 45 0.85 0.20 0.34 1.00
2010 19 0.91 0.12 0.62 1.00 50 0.90 0.15 0.37 1.00
2011 20 0.90 0.15 0.40 1.00 60 0.89 0.15 0.33 1.00
2012 19 0.90 0.17 0.39 1.00 61 0.84 0.17 0.37 1.00
2013 18 0.90 0.21 0.31 1.00 60 0.84 0.18 0.37 1.00
2014 17 0.94 0.15 0.37 1.00 60 0.85 0.19 0.20 1.00
Variable return to
scale Technical Efficiency (VRSTE)
2006 21 0.97 0.12 0.44 1.00 34 0.92 0.17 0.33 1.00
2007 20 0.99 0.03 0.88 1.00 40 0.91 0.16 0.36 1.00
2008 19 0.93 0.15 0.50 1.00 41 0.91 0.13 0.54 1.00
2009 20 0.95 0.14 0.46 1.00 45 0.92 0.14 0.37 1.00
2010 19 0.98 0.04 0.87 1.00 50 0.94 0.13 0.40 1.00
2011 20 0.95 0.13 0.41 1.00 60 0.93 0.11 0.41 1.00
2012 19 0.94 0.12 0.52 1.00 61 0.88 0.15 0.47 1.00
2013 18 0.95 0.12 0.51 1.00 60 0.89 0.16 0.38 1.00
2014 17 0.96 0.13 0.45 1.00 60 0.92 0.12 0.51 1.00
Scale Efficiency (SCALE)
2006 21 0.86 0.13 0.50 1.00 34 0.85 0.17 0.32 1.00
2007 20 0.90 0.11 0.59 1.00 40 0.92 0.11 0.60 1.00
2008 19 0.83 0.16 0.58 1.00 41 0.88 0.16 0.36 1.00
2009 20 0.88 0.16 0.50 1.00 45 0.92 0.14 0.33 1.00
2010 19 0.93 0.10 0.63 1.00 50 0.95 0.83 0.58 1.00
2011 20 0.95 0.08 0.63 1.00 60 0.95 0.10 0.59 1.00
2012 19 0.96 0.11 0.59 1.00 61 0.95 0.09 0.50 1.00
2013 18 0.94 0.17 0.31 1.00 60 0.95 0.10 0.52 1.00
2014 17 0.97 0.05 0.83 1.00 60 0.92 0.15 0.28 1.00
Allocative Efficiency
(AE)
2006 21 0.75 0.21 0.28 1.00 34 0.64 0.23 0.21 1.00
2007 20 0.76 0.20 0.24 0.97 40 0.70 0.19 0.17 0.97
2008 19 0.70 0.18 0.23 0.95 41 0.69 0.21 0.16 1.00
2009 20 0.78 0.20 0.18 1.00 45 0.78 0.20 0.34 1.00
2010 19 0.87 0.13 0.57 1.00 50 0.79 0.21 0.20 1.00
2011 20 0.83 0.15 0.57 1.00 60 0.73 0.21 0.19 1.00
2012 19 0.79 0.15 0.50 1.00 61 0.68 0.20 0.15 1.00
2013 18 0.76 0.18 0.50 1.00 60 0.66 0.20 0.30 1.00
2014 17 0.75 0.18 0.41 1.00 60 0.62 0.23 0.10 1.00
Cost Efficiency
(CE)
2006 21 0.63 0.24 0.24 1.00 34 0.52 0.23 0.15 1.00
2007 20 0.67 0.18 0.19 0.91 40 0.59 0.22 0.14 0.97
2008 19 0.57 0.20 0.20 0.95 41 0.57 0.22 0.10 1.00
2009 20 0.68 0.27 0.91 1.00 45 0.68 0.26 0.11 1.00
2010 19 0.80 0.19 0.20 1.00 50 0.72 0.25 0.10 1.00
2011 20 0.76 0.21 0.30 1.00 60 0.66 0.23 0.10 1.00
2012 19 0.72 0.21 0.25 1.00 61 0.58 0.23 0.10 1.00
2013 18 0.70 0.25 0.19 1.00 60 0.57 0.20 0.13 1.00
2014 17 0.70 0.21 0.28 1.00 60 0.50 0.26 0.02 1.00
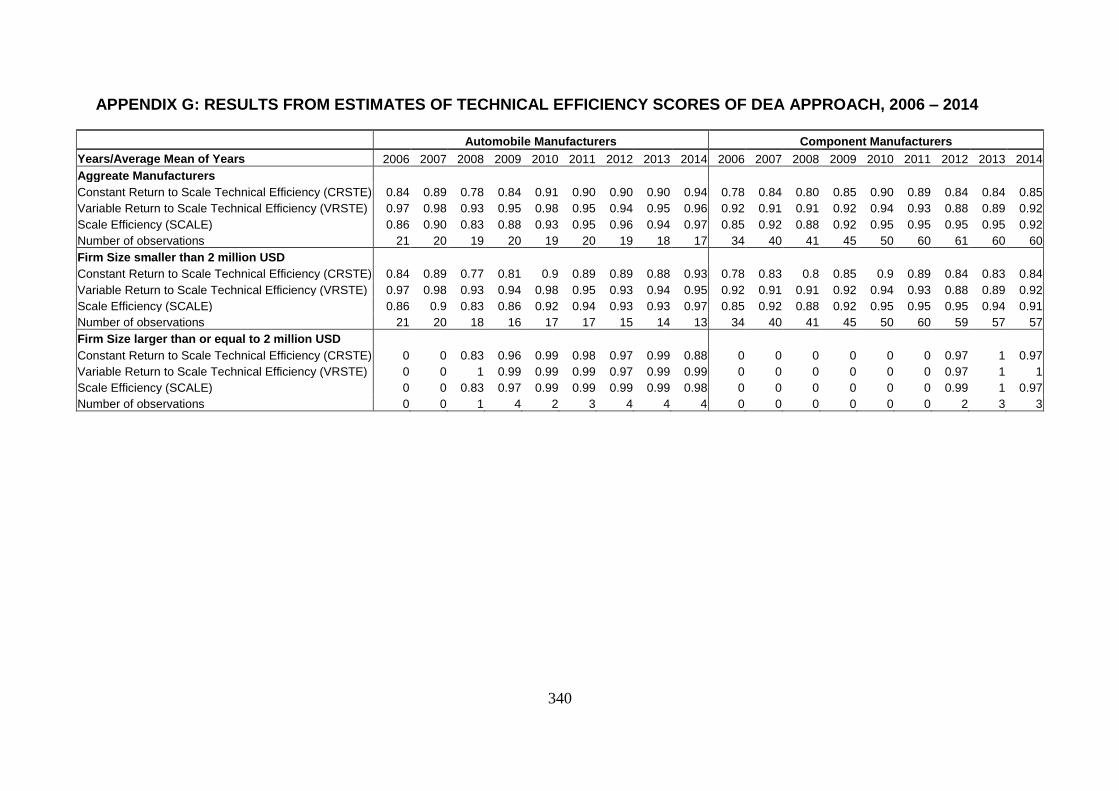
340
APPENDIX G: RESULTS FROM ESTIMATES OF TECHNICAL EFFICIENCY SCORES OF DEA APPROACH, 2006 – 2014
Automobile Manufacturers Component Manufacturers
Years/Average Mean of Years 2006 2007 2008 2009 2010 2011 2012 2013 2014 2006 2007 2008 2009 2010 2011 2012 2013 2014
Aggreate Manufacturers
Constant Return to Scale Technical Efficiency (CRSTE) 0.84 0.89 0.78 0.84 0.91 0.90 0.90 0.90 0.94 0.78 0.84 0.80 0.85 0.90 0.89 0.84 0.84 0.85
Variable Return to Scale Technical Efficiency (VRSTE) 0.97 0.98 0.93 0.95 0.98 0.95 0.94 0.95 0.96 0.92 0.91 0.91 0.92 0.94 0.93 0.88 0.89 0.92
Scale Efficiency (SCALE) 0.86 0.90 0.83 0.88 0.93 0.95 0.96 0.94 0.97 0.85 0.92 0.88 0.92 0.95 0.95 0.95 0.95 0.92
Number of observations 21 20 19 20 19 20 19 18 17 34 40 41 45 50 60 61 60 60
Firm Size smaller than 2 million USD
Constant Return to Scale Technical Efficiency (CRSTE) 0.84 0.89 0.77 0.81 0.9 0.89 0.89 0.88 0.93 0.78 0.83 0.8 0.85 0.9 0.89 0.84 0.83 0.84
Variable Return to Scale Technical Efficiency (VRSTE) 0.97 0.98 0.93 0.94 0.98 0.95 0.93 0.94 0.95 0.92 0.91 0.91 0.92 0.94 0.93 0.88 0.89 0.92
Scale Efficiency (SCALE) 0.86 0.9 0.83 0.86 0.92 0.94 0.93 0.93 0.97 0.85 0.92 0.88 0.92 0.95 0.95 0.95 0.94 0.91
Number of observations 21 20 18 16 17 17 15 14 13 34 40 41 45 50 60 59 57 57
Firm Size larger than or equal to 2 million USD
Constant Return to Scale Technical Efficiency (CRSTE) 0 0 0.83 0.96 0.99 0.98 0.97 0.99 0.88 0 0 0 0 0 0 0.97 1 0.97
Variable Return to Scale Technical Efficiency (VRSTE) 0 0 1 0.99 0.99 0.99 0.97 0.99 0.99 0 0 0 0 0 0 0.97 1 1
Scale Efficiency (SCALE) 0 0 0.83 0.97 0.99 0.99 0.99 0.99 0.98 0 0 0 0 0 0 0.99 1 0.97
Number of observations 0 0 1 4 2 3 4 4 4 0 0 0 0 0 0 2 3 3
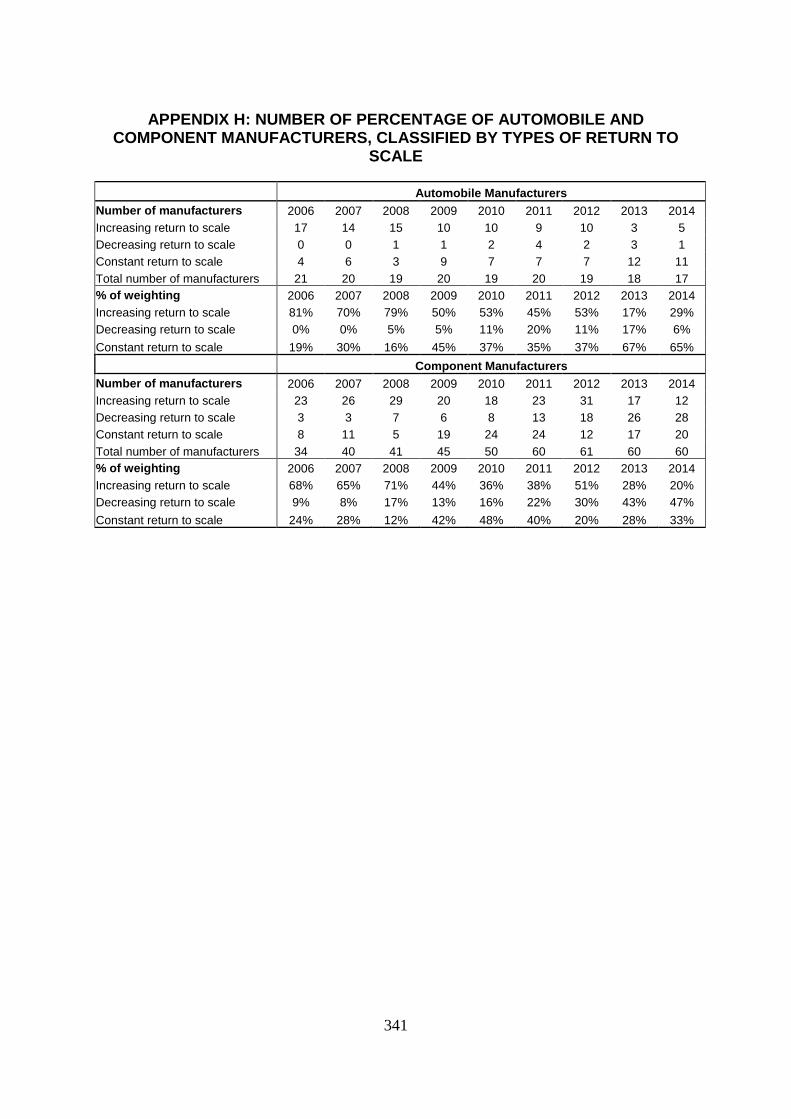
341
APPENDIX H: NUMBER OF PERCENTAGE OF AUTOMOBILE AND COMPONENT MANUFACTURERS, CLASSIFIED BY TYPES OF RETURN TO
SCALE
Automobile Manufacturers
Number of manufacturers 2006 2007 2008 2009 2010 2011 2012 2013 2014
Increasing return to scale 17 14 15 10 10 9 10 3 5
Decreasing return to scale 0 0 1 1 2 4 2 3 1
Constant return to scale 4 6 3 9 7 7 7 12 11
Total number of manufacturers 21 20 19 20 19 20 19 18 17
% of weighting 2006 2007 2008 2009 2010 2011 2012 2013 2014
Increasing return to scale 81% 70% 79% 50% 53% 45% 53% 17% 29%
Decreasing return to scale 0% 0% 5% 5% 11% 20% 11% 17% 6%
Constant return to scale 19% 30% 16% 45% 37% 35% 37% 67% 65%
Component Manufacturers
Number of manufacturers 2006 2007 2008 2009 2010 2011 2012 2013 2014
Increasing return to scale 23 26 29 20 18 23 31 17 12
Decreasing return to scale 3 3 7 6 8 13 18 26 28
Constant return to scale 8 11 5 19 24 24 12 17 20
Total number of manufacturers 34 40 41 45 50 60 61 60 60
% of weighting 2006 2007 2008 2009 2010 2011 2012 2013 2014
Increasing return to scale 68% 65% 71% 44% 36% 38% 51% 28% 20%
Decreasing return to scale 9% 8% 17% 13% 16% 22% 30% 43% 47%
Constant return to scale 24% 28% 12% 42% 48% 40% 20% 28% 33%
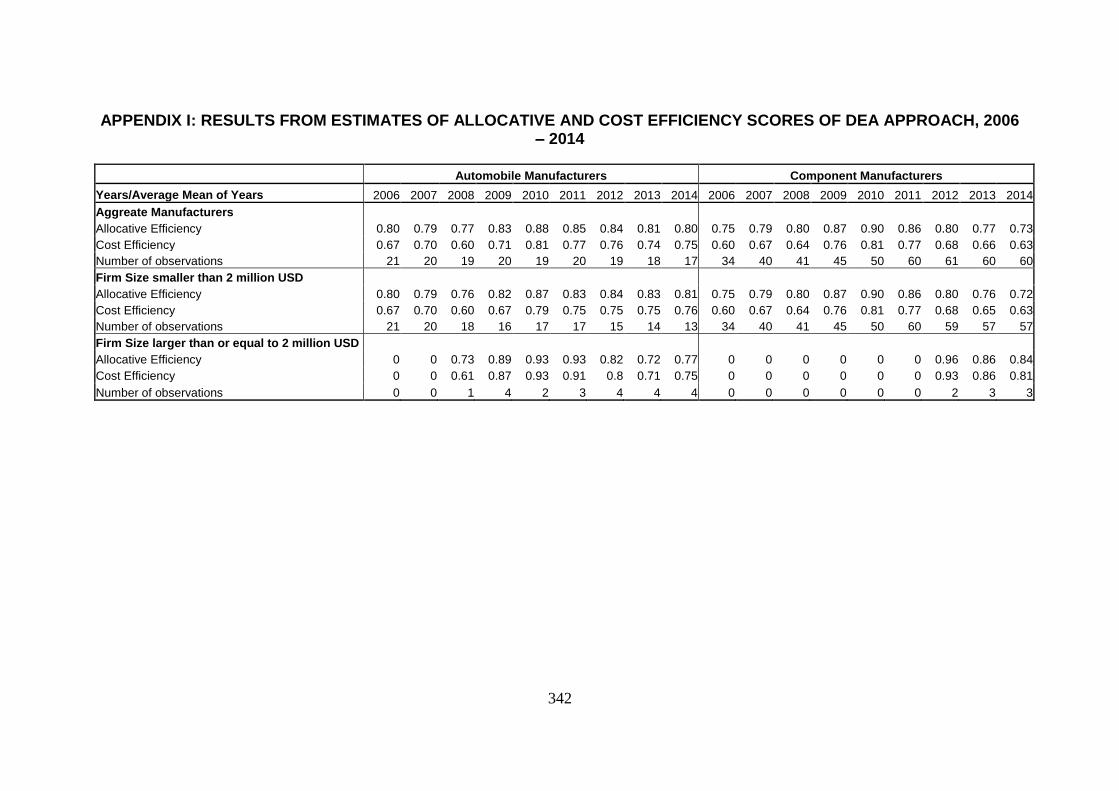
342
APPENDIX I: RESULTS FROM ESTIMATES OF ALLOCATIVE AND COST EFFICIENCY SCORES OF DEA APPROACH, 2006 – 2014
Automobile Manufacturers Component Manufacturers
Years/Average Mean of Years 2006 2007 2008 2009 2010 2011 2012 2013 2014 2006 2007 2008 2009 2010 2011 2012 2013 2014
Aggreate Manufacturers
Allocative Efficiency 0.80 0.79 0.77 0.83 0.88 0.85 0.84 0.81 0.80 0.75 0.79 0.80 0.87 0.90 0.86 0.80 0.77 0.73
Cost Efficiency 0.67 0.70 0.60 0.71 0.81 0.77 0.76 0.74 0.75 0.60 0.67 0.64 0.76 0.81 0.77 0.68 0.66 0.63
Number of observations 21 20 19 20 19 20 19 18 17 34 40 41 45 50 60 61 60 60
Firm Size smaller than 2 million USD
Allocative Efficiency 0.80 0.79 0.76 0.82 0.87 0.83 0.84 0.83 0.81 0.75 0.79 0.80 0.87 0.90 0.86 0.80 0.76 0.72
Cost Efficiency 0.67 0.70 0.60 0.67 0.79 0.75 0.75 0.75 0.76 0.60 0.67 0.64 0.76 0.81 0.77 0.68 0.65 0.63
Number of observations 21 20 18 16 17 17 15 14 13 34 40 41 45 50 60 59 57 57
Firm Size larger than or equal to 2 million USD
Allocative Efficiency 0 0 0.73 0.89 0.93 0.93 0.82 0.72 0.77 0 0 0 0 0 0 0.96 0.86 0.84
Cost Efficiency 0 0 0.61 0.87 0.93 0.91 0.8 0.71 0.75 0 0 0 0 0 0 0.93 0.86 0.81
Number of observations 0 0 1 4 2 3 4 4 4 0 0 0 0 0 0 2 3 3
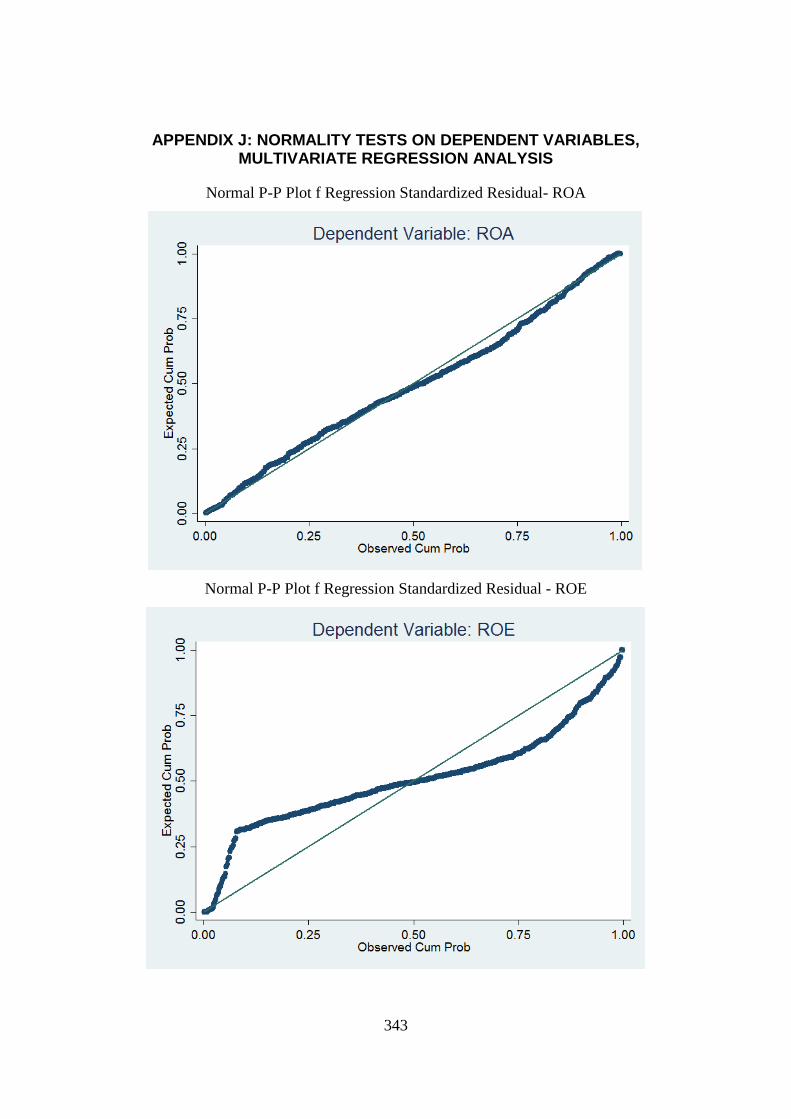
343
APPENDIX J: NORMALITY TESTS ON DEPENDENT VARIABLES, MULTIVARIATE REGRESSION ANALYSIS
Normal P-P Plot f Regression Standardized Residual- ROA
Normal P-P Plot f Regression Standardized Residual - ROE
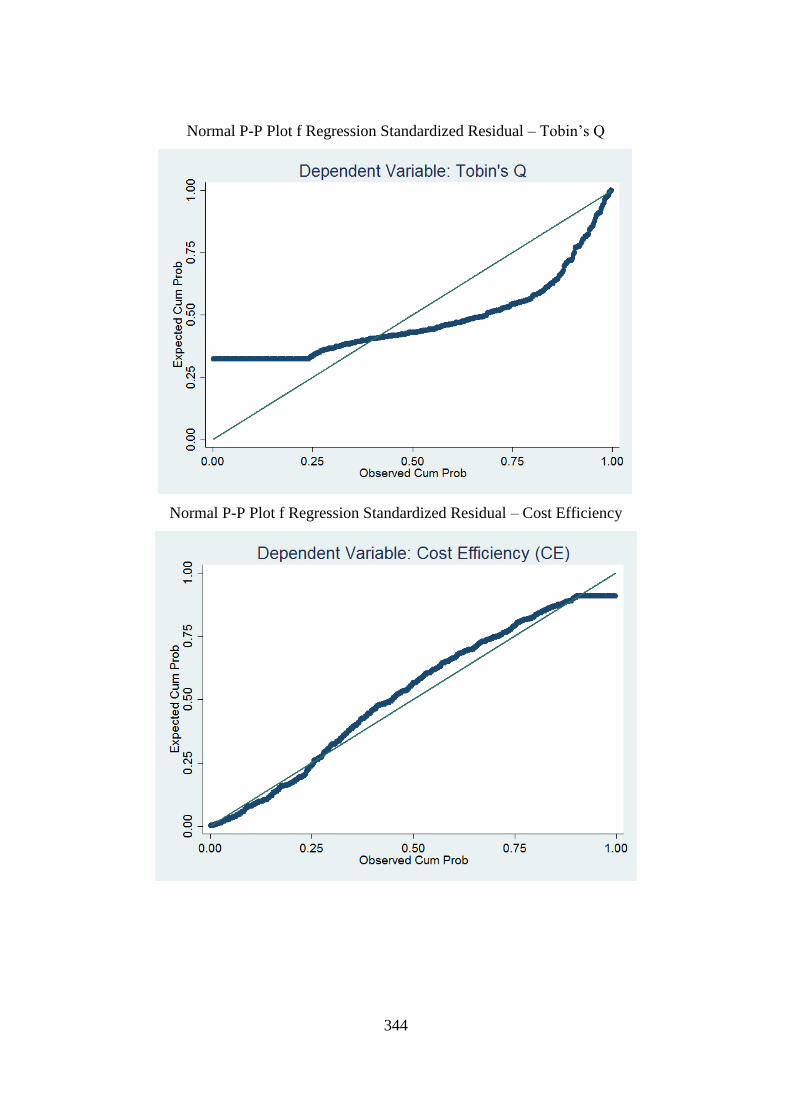
344
Normal P-P Plot f Regression Standardized Residual – Tobin’s Q
Normal P-P Plot f Regression Standardized Residual – Cost Efficiency
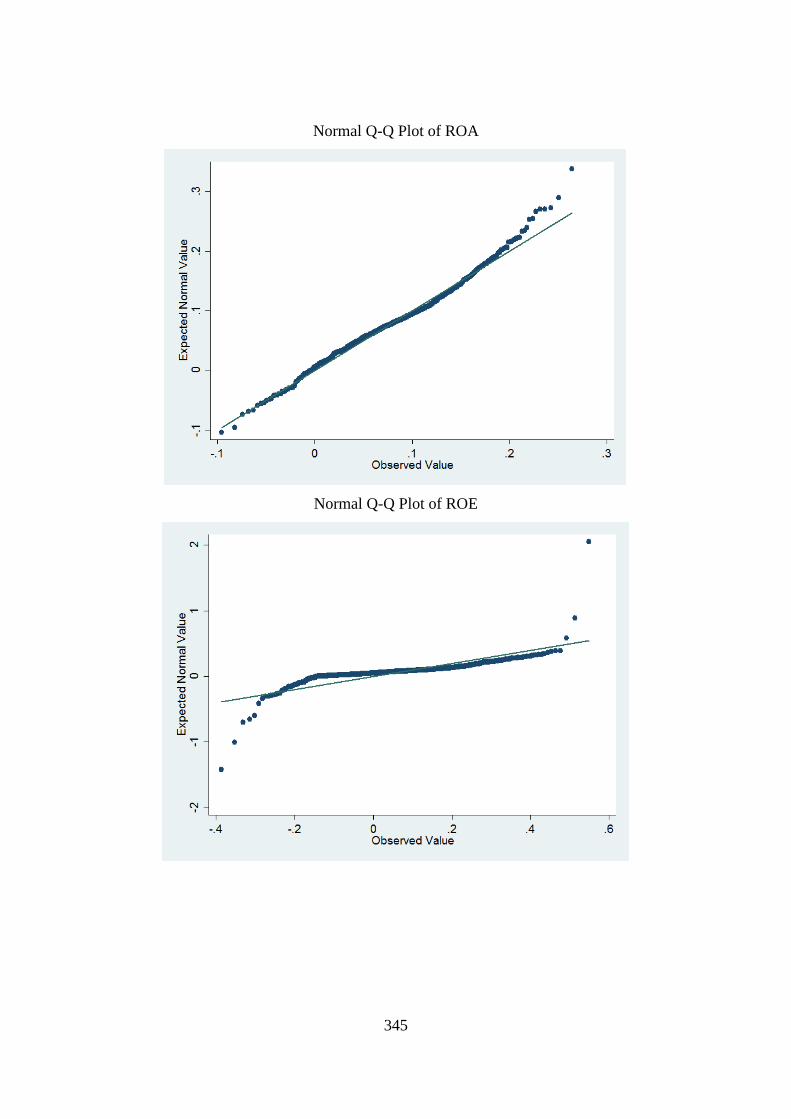
345
Normal Q-Q Plot of ROA
Normal Q-Q Plot of ROE
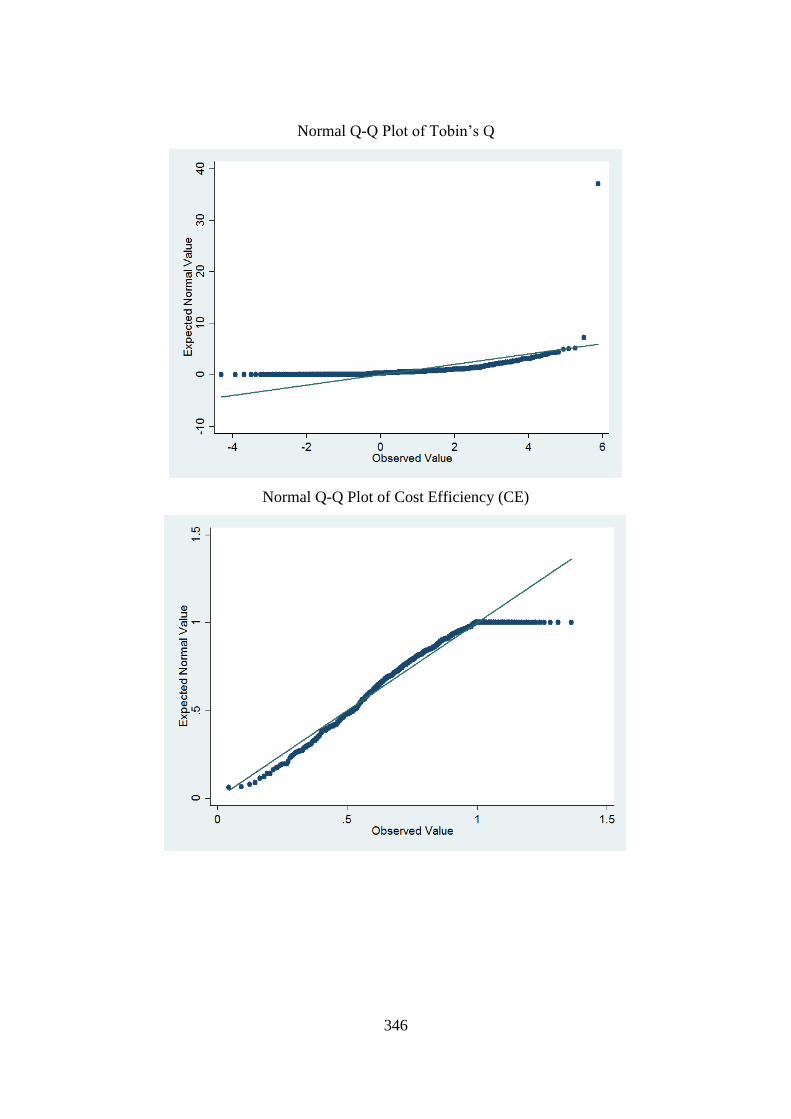
346
Normal Q-Q Plot of Tobin’s Q
Normal Q-Q Plot of Cost Efficiency (CE)
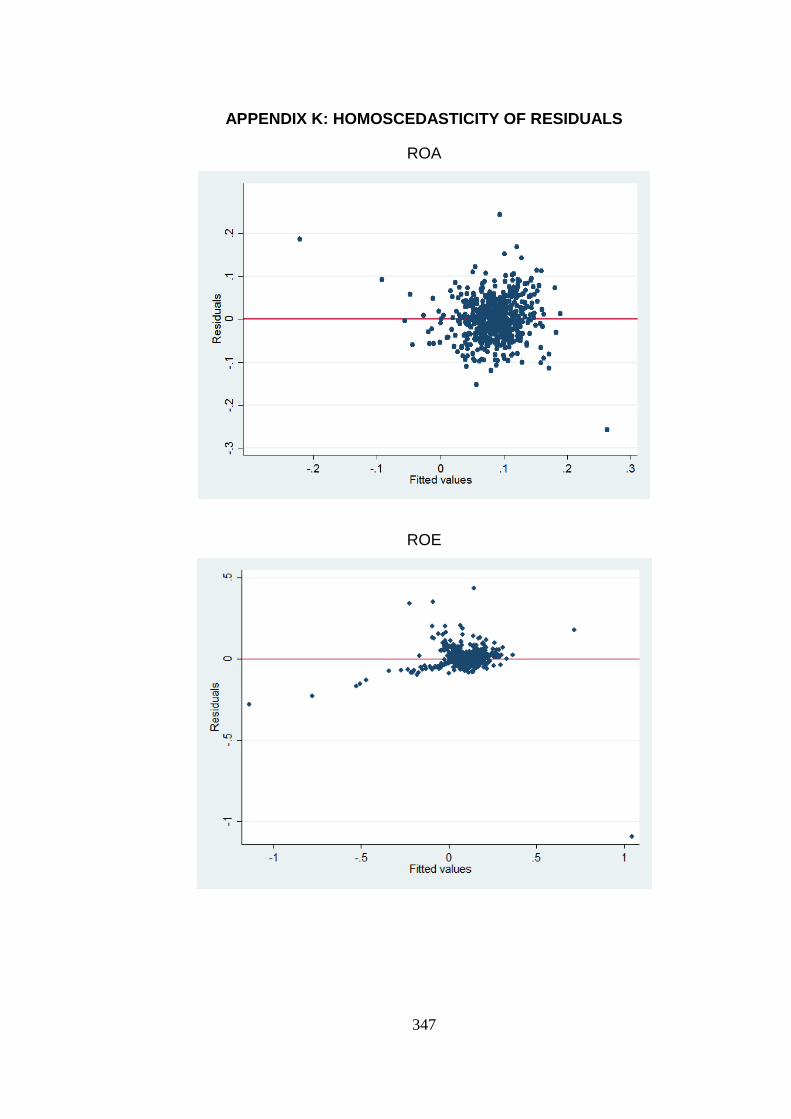
347
APPENDIX K: HOMOSCEDASTICITY OF RESIDUALS
ROA
ROE
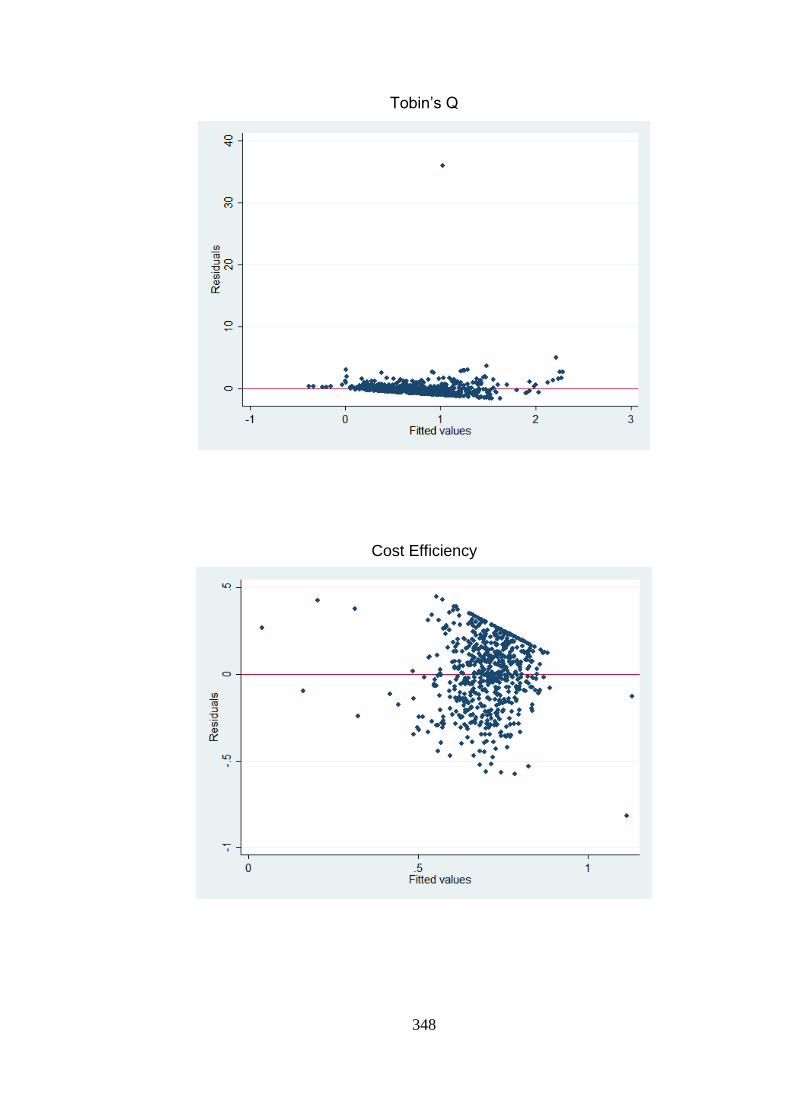
348
Tobin’s Q
Cost Efficiency
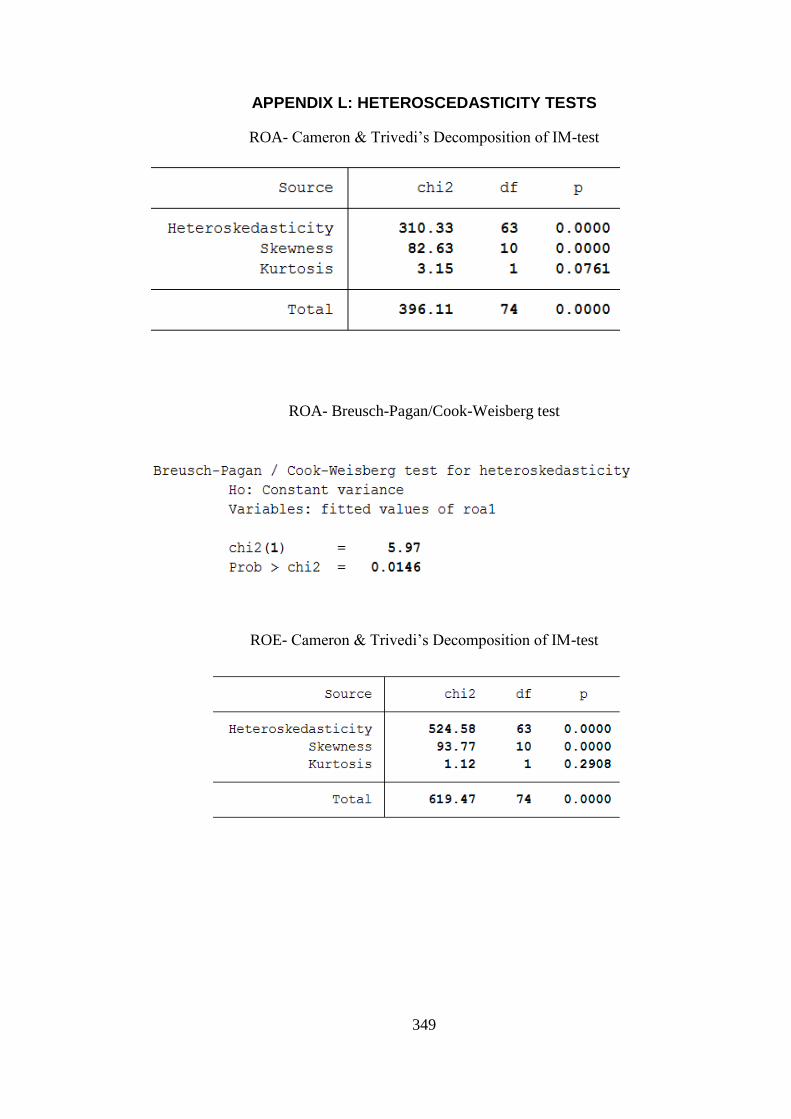
349
APPENDIX L: HETEROSCEDASTICITY TESTS
ROA- Cameron & Trivedi’s Decomposition of IM-test
ROA- Breusch-Pagan/Cook-Weisberg test
ROE- Cameron & Trivedi’s Decomposition of IM-test
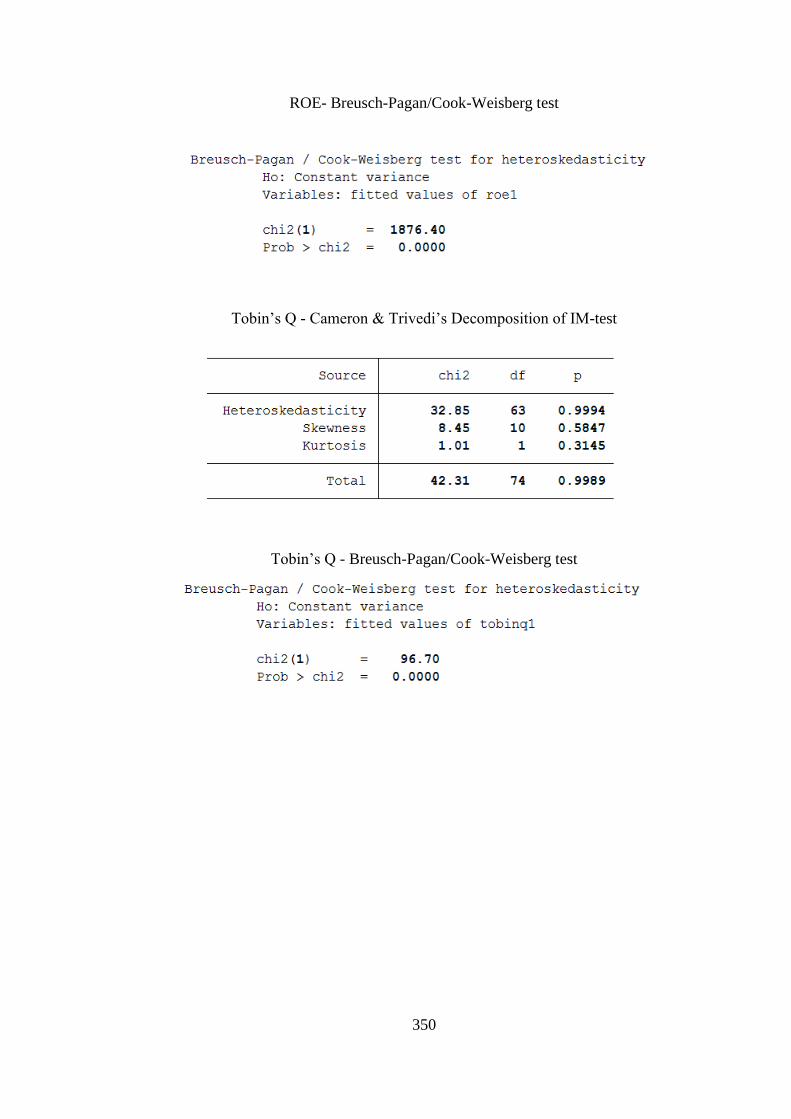
350
ROE- Breusch-Pagan/Cook-Weisberg test
Tobin’s Q - Cameron & Trivedi’s Decomposition of IM-test
Tobin’s Q - Breusch-Pagan/Cook-Weisberg test
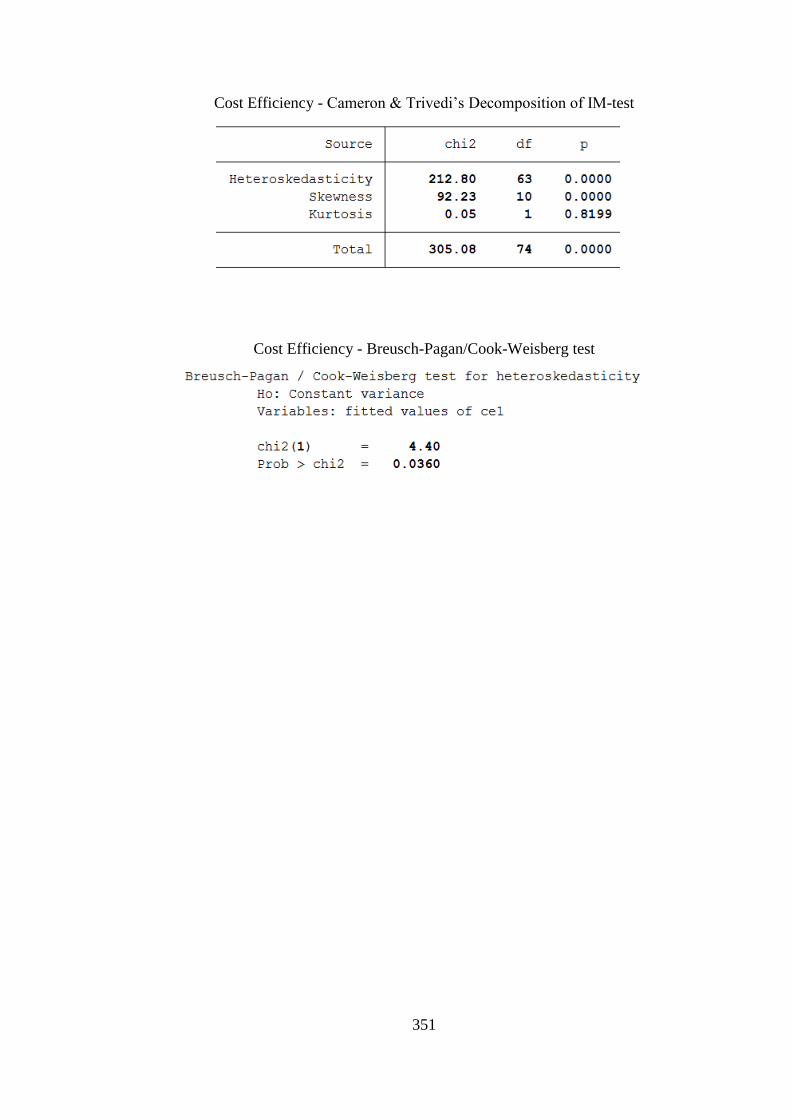
351
Cost Efficiency - Cameron & Trivedi’s Decomposition of IM-test
Cost Efficiency - Breusch-Pagan/Cook-Weisberg test
Related Documents


![How to Improve the Competitiveness of Automobile Maintenance … · 2021. 5. 15. · Automobile Maintenance Quality [J]. Automobile & Driving Maintenance (Repair Edition),2019(04):107-108.](https://static.cupdf.com/doc/110x72/6141e5ca2035ff3bc76252a8/how-to-improve-the-competitiveness-of-automobile-maintenance-2021-5-15-automobile.jpg)
