COST-BENEFIT ANALYSIS OF SMART CITIES TECHNOLOGIES AND APPLICATIONS by Xiangyuan Xiong A thesis submitted to the Faculty of the University of Delaware in partial fulfillment of the requirements for the degree of Master of Civil Engineering Spring 2018 © 2018 Xiangyuan Xiong All Rights Reserved

Welcome message from author
This document is posted to help you gain knowledge. Please leave a comment to let me know what you think about it! Share it to your friends and learn new things together.
Transcript
COST-BENEFIT ANALYSIS OF SMART CITIES
TECHNOLOGIES AND APPLICATIONS
by
Xiangyuan Xiong
A thesis submitted to the Faculty of the University of Delaware in partial fulfillment of the requirements for the degree of Master of Civil Engineering
Spring 2018
© 2018 Xiangyuan Xiong All Rights Reserved
COST-BENEFIT ANALYSIS OF SMART CITIES
TECHNOLOGIES AND APPLICATIONS
by
Xiangyuan Xiong
Approved: __________________________________________________________ Ardeshir Faghri, Ph.D. Professor in charge of thesis on behalf of the Advisory Committee Approved: __________________________________________________________ Sue McNeil, Ph.D. Chair of the Department of Civil and Environmental Engineering Approved: __________________________________________________________ Babatunde Ogunnaike, Ph.D. Dean of the College of Engineering Approved: __________________________________________________________ Ann L. Ardis, Ph.D. Senior Vice Provost for Graduate and Professional Education

iii
ACKNOWLEDGMENTS
I would like to thank my advisor, Professor Ardeshir Faghri, who has assisted
and mentored me during the entire thesis process from September 2017. This thesis
would not have been possible without his insight and guidance. Also, I would like to
thank all my professors at the University of Delaware who have mentored me in my
years at the school. I have learned a lot through the 2-year study at the University of
Delaware.
Finally, I would like to thank my parents and family who have supported me
during my entire academic career. This accomplishment would not have been possible
without them. Their encouragement has enabled me to pursue my education as a
graduate student.

iv
TABLE OF CONTENTS
LIST OF TABLES ....................................................................................................... viiLIST OF FIGURES .................................................................................................... viiiABSTRACT ................................................................................................................... ix
Chapter
1 BACKGROUND AND INTRODUCTION ....................................................... 1
1.1 Problem Statement ..................................................................................... 21.2 Objectives .................................................................................................. 31.3 Scope .......................................................................................................... 31.4 Research Approach and Methodology ....................................................... 31.5 Organization ............................................................................................... 4
2 LITERATURE REVIEW ................................................................................... 5
2.1 Smart and City ........................................................................................... 62.2 What is Smart Cities .................................................................................. 7
2.2.1 Components of Smart Cities .......................................................... 92.2.2 Smart Cities Architecture ............................................................. 12
2.3 History of Smart Cities ............................................................................ 132.4 Successful Smart Cities and their Applications ....................................... 16
2.4.1 Barcelona ..................................................................................... 162.4.2 Smart Nation Program in Singapore ............................................ 192.4.3 San Francisco ............................................................................... 21
2.5 Summary of Chapter 2 ............................................................................. 23
3 COST-BENEFIT ANALYSIS .......................................................................... 25
3.1 Definition of Cost-Benefit Analysis ........................................................ 253.2 Funding Management of Smart Cities ..................................................... 273.3 Cost-Benefit Analysis Process ................................................................. 30

v
3.4 Life-Cycle Assessment ............................................................................ 313.5 Summary of Chapter 3 ............................................................................. 32
4 METHODOLOGY AND DATA ...................................................................... 34
4.1 Variables .................................................................................................. 34
4.1.1 Costs ............................................................................................. 354.1.2 Benefits ........................................................................................ 36
4.2 Discount Rate ........................................................................................... 444.3 Project Lifetime ....................................................................................... 464.4 Types of Measures ................................................................................... 47
4.4.1 Net Present Value ........................................................................ 474.4.2 Benefit-Cost Ratio ....................................................................... 48
4.5 Results ...................................................................................................... 48
5 MODEL EVALUATION AND APPLICATION ............................................ 50
5.1 Background of the Project ....................................................................... 50
5.1.1 City of Newark ............................................................................. 515.1.2 Project’s Description .................................................................... 52
5.2 Monetized Variables ................................................................................ 53
5.2.1 Discount Rate and Project Lifetime ............................................. 535.2.2 Costs ............................................................................................. 535.2.3 Benefits ........................................................................................ 54
5.3 Analysis.................................................................................................... 58
5.3.1 Net Present Value ........................................................................ 595.3.2 Benefit-Cost ratio ......................................................................... 60
5.4 Conclusion ............................................................................................... 60
6 SUMMARY, CONCLUSIONS, AND RECOMMENDATIONS ................... 61
6.1 Summary .................................................................................................. 616.2 Conclusions .............................................................................................. 62
6.2.1 Merits ........................................................................................... 64

vi
6.2.2 De-merits ...................................................................................... 65
6.3 Recommendations .................................................................................... 65
REFERENCES ............................................................................................................. 67
Appendix
CALCULATION OF THE NET PRESENT VALUE ON EACH VARIABLE ...................................................................................................... 75

vii
LIST OF TABLES
Table 2.1: Characteristics and factors of Smart Cities (Idea from Giffinger’s study - 2007) ........................................................................................................ 11
Table 4.1: Characteristics and factors of Smart City .................................................... 38
Table 4.2: Monetary values of air pollution from Federal Highway Administration ... 41
Table 4.3: Monetary values of air pollution from American Economic Association ... 42
Table 4.4: Noise monetary value from study of Delucchi - 1998 ................................. 43
Table 4.5: Interest rate of different lifetimes from U.S Treasury bill ........................... 45
Table 4.6: Project lifetime ............................................................................................. 47
Table 5.1: Annual monetary variables in the city of Newark ....................................... 58
Table 5.2: Net present values of variables .................................................................... 59
Table A.1: Calculation on capital cost, operation cost, maintenance cost, other cost, time and fuel ............................................................................................ 75
Table A.2: Calculation on safety, gas emission, greenhouse gas, noise and economic impact ...................................................................................... 76
Table A.3: Calculation on costs, benefits, net present value and cost-benefit ratio ..... 76

viii
LIST OF FIGURES
Figure 2.1: Smart cities architecture (Idea from Anthopoulos’s study - 2017) ............ 12
Figure 2.2: Evolution timeline of Smart Cities (Idea from Anthopoulos study - 2017) ........................................................................................................ 14
Figure 2.3: Smart bus stop ............................................................................................ 17
Figure 2.4: Bicing ......................................................................................................... 18
Figure 2.5: Smart trash cans .......................................................................................... 19
Figure 2.6: SFpark ........................................................................................................ 22
Figure 3.1 Benefit model .............................................................................................. 26
Figure 3.2: Potential funding options of Smart Cities (Idea from Galati’s study - 2018) ........................................................................................................ 27
Figure 4.1: Life-cycle model ......................................................................................... 46
ix
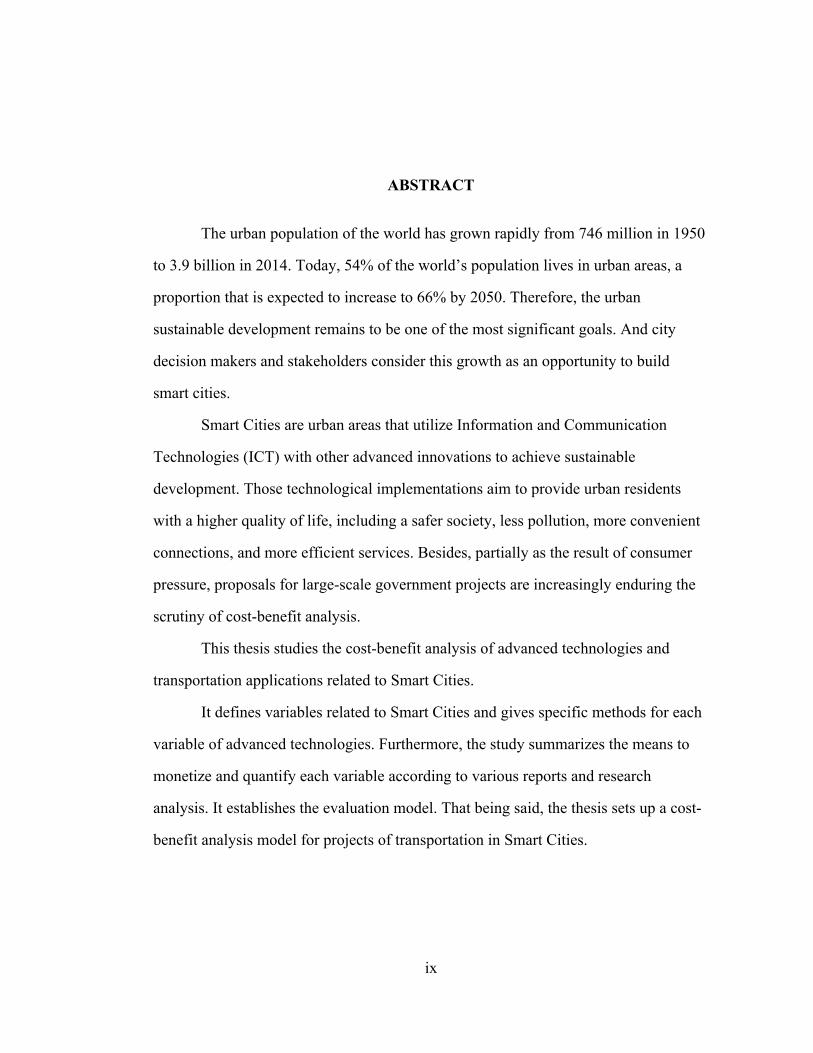
ABSTRACT
The urban population of the world has grown rapidly from 746 million in 1950
to 3.9 billion in 2014. Today, 54% of the world’s population lives in urban areas, a
proportion that is expected to increase to 66% by 2050. Therefore, the urban
sustainable development remains to be one of the most significant goals. And city
decision makers and stakeholders consider this growth as an opportunity to build
smart cities.
Smart Cities are urban areas that utilize Information and Communication
Technologies (ICT) with other advanced innovations to achieve sustainable
development. Those technological implementations aim to provide urban residents
with a higher quality of life, including a safer society, less pollution, more convenient
connections, and more efficient services. Besides, partially as the result of consumer
pressure, proposals for large-scale government projects are increasingly enduring the
scrutiny of cost-benefit analysis.
This thesis studies the cost-benefit analysis of advanced technologies and
transportation applications related to Smart Cities.
It defines variables related to Smart Cities and gives specific methods for each
variable of advanced technologies. Furthermore, the study summarizes the means to
monetize and quantify each variable according to various reports and research
analysis. It establishes the evaluation model. That being said, the thesis sets up a cost-
benefit analysis model for projects of transportation in Smart Cities.

x
Since Smart Cities and their related technologies are constantly advancing, this
study can also be useful for the evaluation, management and decision making in the
future.

1
Chapter 1
BACKGROUND AND INTRODUCTION
The urban population has increased rapidly over the past century. According to
the World Bank Group analysis, the proportion of urban population has increased from
35.7% to 54% from 1966 to 2016, and the growth seems to continue in the next few
decades. Therefore, sustainable development is one of the most significant goals in the
future. With the aim of improving residents’ quality of life through sustainable
development, innovations to bring higher efficiency, less gas emission, and lower
energy consumption have become the most important tasks of the urban society.
Andrea Zanella introduced the concept of Smart City which relies on Information and
Communication Technologies (ICT) and various physical devices connected to the
network (the Internet of things or IoT) (Andrea Zanella, 2014). Based on ICT, Smart
Cities can achieve higher efficiency in resource utilization and enhance the quality of
life through the applications of advanced technologies.
As we know, Uber has used autonomous vehicles as one of the travel options
in Pittsburg’s area, and Lyft utilized the self-driving cars in San Francisco as well.
Their utilization and practices of intelligent technology can revolutionize the
autonomous vehicle. Smart lighting system is also a widely used technique as well as
Smart parking and Smart traffic lights. These smart technologies and applications have
taken up a significant amount of investment. Apparently, these technologies are useful
and can be energy savable in a sustainable way, but how much revenue do these
technologies provide to the city? Is the income balanced with the investment? Would

2
these applications be efficient in the future and save the city's energy consumption and
expenditure for urbanization development? Besides, it is hard to monetize all the
factors in the various aspects of improvement.
In this thesis, we develop a cost-benefit analysis model for technologies and
applications in Smart Cities.
1.1 Problem Statement
The advanced technologies in Smart Cities would make the operation of social
resource more useful, but it is hard to estimate whether it is more efficient, like
investing a million dollar to get a 1% progress on the efficiency. In general, we would
benefit from the technologies and applications adopted in Smart Cities, but is it worth
to invest too much for just a little improvement? To find the relationship between cost
and benefit is always a challenge.
Regarding improvements, how to evaluate the degree of improvements is also
a problem. The principal goal of Smart Cities is to improve the management in cities
and transform the urban area (Kumar, 2015), but how can we measure the
improvements? Then some analyses go to variables that can be improved in Smart
Cities, like the travel time reduction, energy saving in electricity systems, social
security improvement, etc. The goal of these improvements is to increase the quality
of our life. how can we measure every factor that affects the quality of life? In other
words, how can we monetize these factors? Moreover, each factor should be defined
as either the cost or the benefit. In terms of the gas emission, advanced technologies
could reduce it, but the improvement of the transportation may arouse more
greenhouse gas and air pollution. To classify these factors into costs and benefits is
also a challenge.

3
1.2 Objectives
This study develops a cost-benefit analysis model for the projects of
transportation in Smart Cities. The model would list all the elements and factors
related to the cost-benefit analysis of the technologies and give methods to quantify
each factor like reduced travel time, lower gas emission and less fuel and energy
consumption, etc.
The objectives are as follows:
1. List and specify all types of costs;
2. List all the variables in benefit and conclude methods to quantify each factor;
3. By using life-cycle assessment, design a model based on all the variables to
evaluate Smart Cities projects.
1.3 Scope
Because a city is too wide to analyze, this study only focuses on the cost-
benefit analysis of smart transportation. The analyzed factors are analyzed according
to the impacts in transportation. The factors are within the aspects of people, society
and environment. All the improvements would be converted into the monetary
variables, and the study uses the standard evaluation model to quantify the impacts
from smart technologies and innovations.
1.4 Research Approach and Methodology
This thesis uses the life-cycle assessment to conduct the cost-benefit analysis.
The designed model analyzes the life-cycle variables in costs and benefits, gives the
methodologies to quantify all the variables, then uses the net present value and cost-

4
benefit ratio to evaluate whether it is worthy to invest in Smart Cities technologies and
applications.
The variables of costs include capital cost, maintenance cost, operation cost
and other costs. For benefits, they include reduced travel time, less fuel and energy
consumption, lower gas emission and greenhouse gas, less noise and economic
impacts.
1.5 Organization
First, this study goes through the literature review of Smart Cities, including its
history, evolution and various definitions. Then it introduces the cost-benefit analysis
and the method of life-cycle assessment that are used for determining and monetizing
the variables.
After that, the study gives the monetizing methods for each variable in costs
and benefits. These methods are concluded from comprehensive reports and analyses.
With the net present value and benefit-cost ratio, the cost-benefit analysis can be
completed with the quantified variables of improvement.
Lastly, the study gives an example of the Smart Transportation project in the
city of Newark in the state of Delaware in the U.S.A. It analyzes with the information
of Newark and gives the conclusion and recommendation.
5
Chapter 2
LITERATURE REVIEW
Cities are starting to embrace the Smart City concept due in part to
urbanization growth; the increasing demand in energy and resource; the “smart”
population with high-technique needs; and infrastructures desperately in need of repair
and renovation for future city loads. According to the United Nations, urbanization is
growing at an incredible rate. In 1950, only 30% of the world's population lived in
urban areas. By 2014, the urban population was at a sizable 54% of the global
population.
As a new form of sustainable development, the concept of Smart City has
aroused a great deal of attention (Caragliu A. , 2011). A lot of definitions have been
proposed to describe this concept.
Till now, this concept embraces several definitions: Digital City, Virtual
Community, Eco City, Intelligent City, Ubiquitous City, Sustainable City, etc. Many
definitions exist, but no one has been acknowledged universally yet.
This chapter reviews the literature about Smart Cities from 1992 to 2015, and
introduces the evolution of this concept from 1994 to 2014. It defines six essential
components of Smart Cities including Smart People, Smart Environment, Smart
Governance, Smart Connection, Smart Energy, Smart Economy and Smart Living.
After that, there introduces some prosperous examples in the world like Barcelona,
Singapore and San Francisco.

6
2.1 Smart and City
There is no standard definition for what “Smart” really means in the area of
information and communications technology (ICT). Smart, in purely definitional
terms, has many synonyms, including percipient, astute, shrewd, and quick (Gil-
Garcia, 2016). Moreover, smart is synonymous with efficient, when it links to devices
(Meijer, 2016).
Similarly, in terms of the city, it is also hard to define this concept, while most
people define this term based on their personal experience. A city is considered as an
urban area, which according to the United Nations (2005) typically begins with a
population density of 1500 people per square mile but it varies across countries. Cities
range according to their area of land and density. Greenland and Iceland only have
200–1000 inhabitants; Africa communities has 1000–2500 inhabitants on the average;
Canadian towns or places and Albania cantons have more than 400 and less than
10,000 inhabitants; some cities have a population over 10,000 and 1.5 million
inhabitants; megacities have the population exceeding 1.5 million people. Some cities
are also called global or international due to their impacts attracting inhabitants
beyond the country or even from all over the world. Another definition says that “city
is an urban community falling under a specific administrative boundary (International
Standards Organization, 2014)”, which shows that a city needs the guidance of
governance. Moreover, "a city is a system of systems with a unique history and set in a
specific environmental and societal context. In order to flourish, all the key city actors
need to work together, utilizing all of their resources, to overcome the challenges and
grasp the opportunities that the city faces" (International Standards Organization,
2014)
7
2.2 What is Smart Cities
After introducing the definition for them separately, someone would consider
the definition of “smart city” to be the combination of the above words: an urban area
has the population density of 1500 people per square mile that embedded with
efficient and dynamic devices which are equipped with the ICT technologies.
Actually, the most well-known definition for smart city is “an urban area that
uses different types of electronic data collection sensors to supply information and
manage assets and resources efficiently" (Hamblen, 2015), and the Smart City concept
integrates Information and Communication Technology (ICT) and various physical
devices connected to the network (the Internet of things or IoT). ICT can optimize the
efficiency of cities’ operations and services, while IoT can connect residents to the
services (Cohen, 2015). But Smart Cities’ technologies should not be limited to ICT
and IoT. they consist of all advanced technologies and the data within digital systems.
Besides, there is no precise definition for the concept; it is the alternative answers that
generate the complete Smart City concept.
The first concept for Smart City appeared in the 1990s, Phil Harris described:
Tatsuno calls out “the age of technologies and the metamorphosis of traditional cities
and even high-tech parks”. It is the global network city of dispersed, highly interactive
economic nodes linked by massive networks of airports, highways, and
communications. Another metaphor is the “Intelligent city” using ICT, complexes
wired for satellite and fiber optics. These network cities are inhabited by “knowledge
processors” engaged in rapid information exchanges (Gibson, 1992). Then the
definitions of Smart City become multiple and diversiform.
Giffinger said: it integrated regional competitiveness, transport and
Information and Communication Technologies economics, natural resources, human
8
and social capital, quality of life, and participation of citizens in the governance of
cities. (Giffinger R. a.-M., 2007)
Smart Cities Council gave it the one that has digital technology embedded
across all city functions. (smart cities council, 2008)
Caragliu said: a city can be defined as “smart” when investments in human and
social capital and traditional and advanced (ICT) communication infrastructure could
support the sustainable economic development and give a high quality of life, with a
wise management of natural resources, through participatory action and engagement.
(Caragliu A. a., 2009)
Singh defined in 2014: eight key aspects could define a Smart City: smart
governance, smart energy, smart building, smart mobility, smart infrastructure, smart
technology, smart healthcare and smart citizen. (Singh, 2014)
IEEE gave that a smart city can bring together technology, government and
society to enable the following characteristics: smart cities, a smart economy, smart
mobility, a smart environment, smart people, smart living, smart governance. (IEEE,
2014)
Business dictionary defined that: through the strong human capital, social
capital, and ICT infrastructure, a developed urban area can create sustainable
economic development and high quality of life by excelling in multiple key areas:
economy, mobility, environment, people, living, and government. (Business
Dictionary, 2015)
Department of Business, Innovation and Skill in the United Kingdom said the
concept is not static. There is no absolute definition of Smart Cities, no end point. It is
rather a process, or series of steps, by which cities become more “livable” and resilient
9
and, hence, able to respond more quickly to new challenges. (Department of Business,
Innovation and Skills—UK, 2013)
Beyond those definitions, it is important to mention how international
organizations define the concept of Smart City.
The International Telecommunications Union (ITU) considers it a smart
sustainable city as an innovative city that uses ICT and other means to improve quality
of life, efficiency of operation and services, and competitiveness. Meanwhile, it
ensures that it meets the needs of present and future generations with respect to
economic, social and environmental aspects. (Kondepudi, 2014)
The International Standards Organization (ISO) recognizes it as a new concept
and a new model, which applies the new generation of information technologies, such
as the internet of things, cloud computing, big data and space/geographical
information integration, to facilitate the planning, construction, management and smart
services of cities. Moreover, it defines Smart Cities’ objectives to pursue: convenience
of the public services; delicacy of city management, livability of living environment,
smartness of infrastructures, long-term effectiveness of network security. (ISO, 2014)
With the recognition for the techniques and innovations within Smart Cities,
we can summarize that a Smart City is an urban area that utilizes ICT and advanced
innovations to obtain the sustainable development and get the quality of life improved
in six aspects (people, economy, governance, environment, connection, and living).
2.2.1 Components of Smart Cities
After summarizing the definition in 6 aspects, here are each element’s
characteristics and factors. (Giffinger R. a.-M., 2007)
10
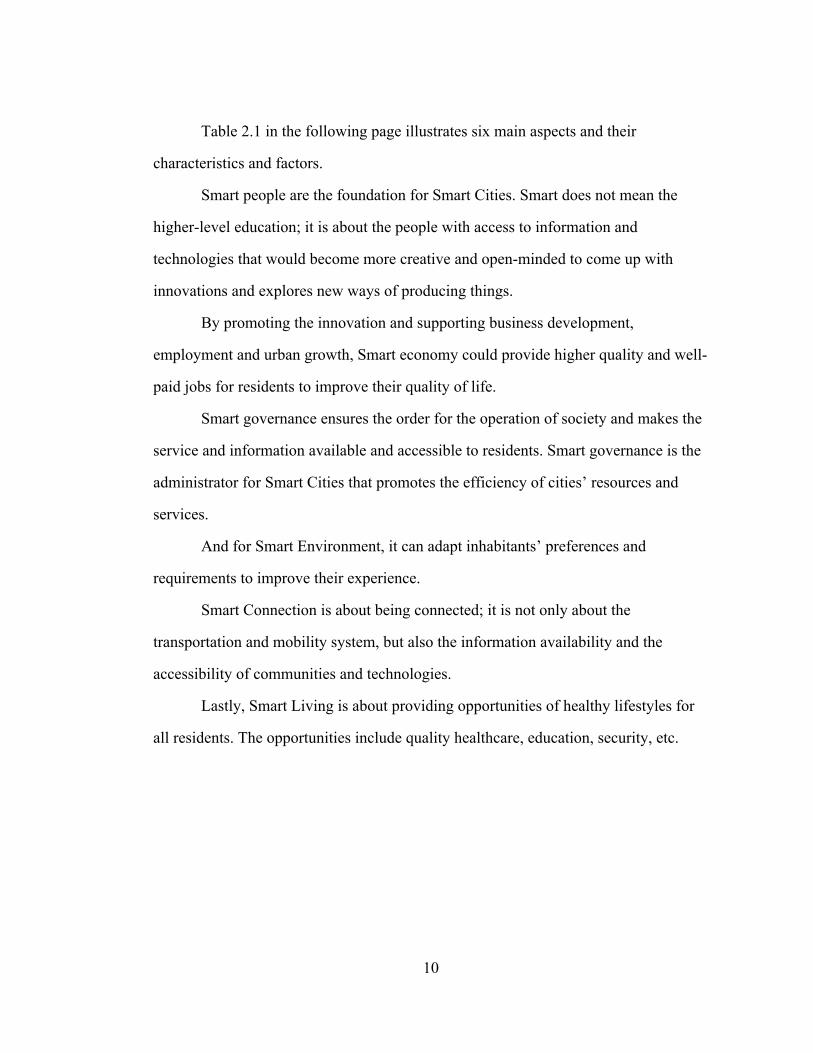
Table 2.1 in the following page illustrates six main aspects and their
characteristics and factors.
Smart people are the foundation for Smart Cities. Smart does not mean the
higher-level education; it is about the people with access to information and
technologies that would become more creative and open-minded to come up with
innovations and explores new ways of producing things.
By promoting the innovation and supporting business development,
employment and urban growth, Smart economy could provide higher quality and well-
paid jobs for residents to improve their quality of life.
Smart governance ensures the order for the operation of society and makes the
service and information available and accessible to residents. Smart governance is the
administrator for Smart Cities that promotes the efficiency of cities’ resources and
services.
And for Smart Environment, it can adapt inhabitants’ preferences and
requirements to improve their experience.
Smart Connection is about being connected; it is not only about the
transportation and mobility system, but also the information availability and the
accessibility of communities and technologies.
Lastly, Smart Living is about providing opportunities of healthy lifestyles for
all residents. The opportunities include quality healthcare, education, security, etc.

11
Table 2.1: Characteristics and factors of Smart Cities (Idea from Giffinger’s study - 2007)
Aspect Characteristics and factors
Smart People (Social and Human
Capital)
• Level of qualification • Affinity to lifelong learning • Social and ethnic plurality • Flexibility • Creativity • Cosmopolitanism/Open-mindedness • Participation in public life
Smart Economy (Competitiveness)
• Innovative spirit • Entrepreneurship • Economic image & trademarks • Productivity • Flexibility of labor market • International embeddedness • Ability to transform
Smart Governance (Participation)
• Participation in decision-making • Public and social services • Transparent governance • Political strategies & perspectives
Smart Environment (Natural resources)
• Attraction of natural conditions • Pollution • Environmental protection • Sustainable resource management
Smart Connection (Transport and ICT)
• Local accessibility • (Inter-)national accessibility • Availability of ICT-infrastructure • Sustainable, innovative and safe transport systems
Smart Living (Quality of life)
• Cultural facilities • Health conditions • Individual safety • Housing quality • Education facilities • Touristic attraction • Social cohesion
12
2.2.2 Smart Cities Architecture
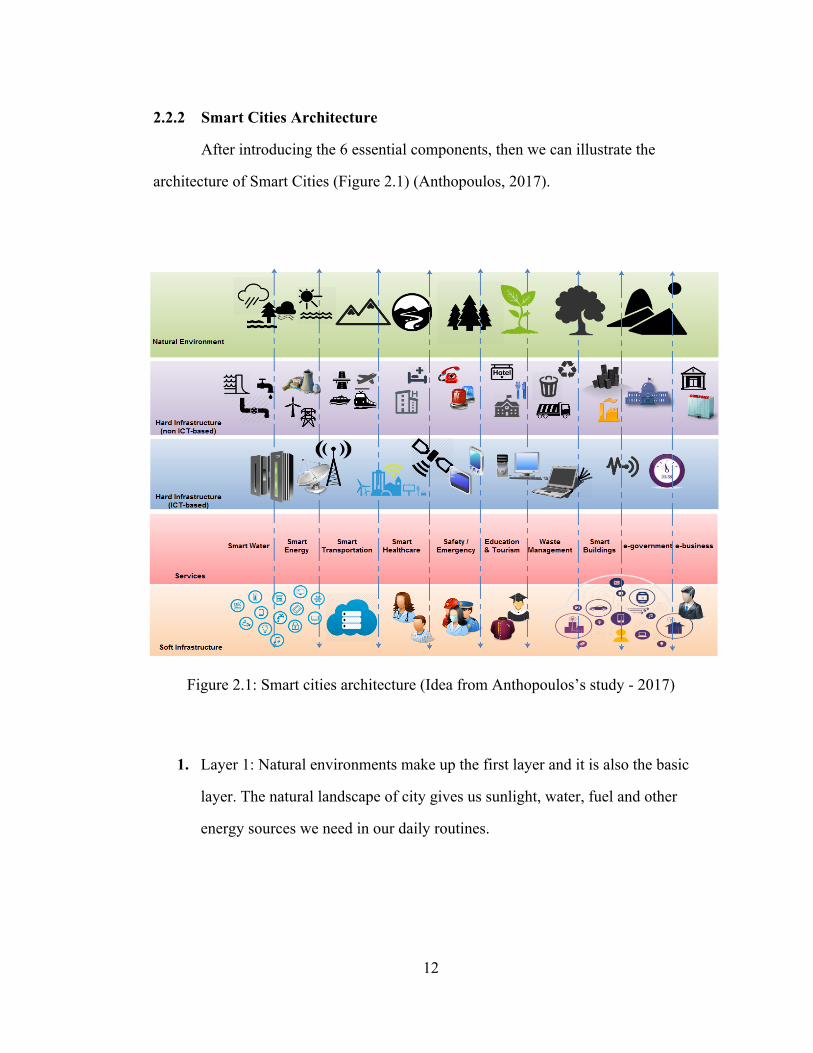
After introducing the 6 essential components, then we can illustrate the
architecture of Smart Cities (Figure 2.1) (Anthopoulos, 2017).
Figure 2.1: Smart cities architecture (Idea from Anthopoulos’s study - 2017)
1. Layer 1: Natural environments make up the first layer and it is also the basic
layer. The natural landscape of city gives us sunlight, water, fuel and other
energy sources we need in our daily routines.

13
2. Layer 2: Hard infrastructures are the equipment and services already existed in
the society. They consist of the facilities that provide services to improve the
quality of life.
3. Layer 3: ICT-based hard infrastructures concern all hardware with
technologies and data, like sensors, monitoring cameras, communication
network, data center etc.
4. Layer 4: Smart services are the technologies and applications we are using and
we can access in daily life, like smart parking system, smart street light, smart
traffic management, smart public space monitoring, smart waste management,
etc.
5. Layer 5: Soft infrastructures are the individuals and communities living in the
urban area. In other words, they are the stakeholders utilizing the applications
and services.
2.3 History of Smart Cities
The concept of Smart City started appearing as a method to describe urban
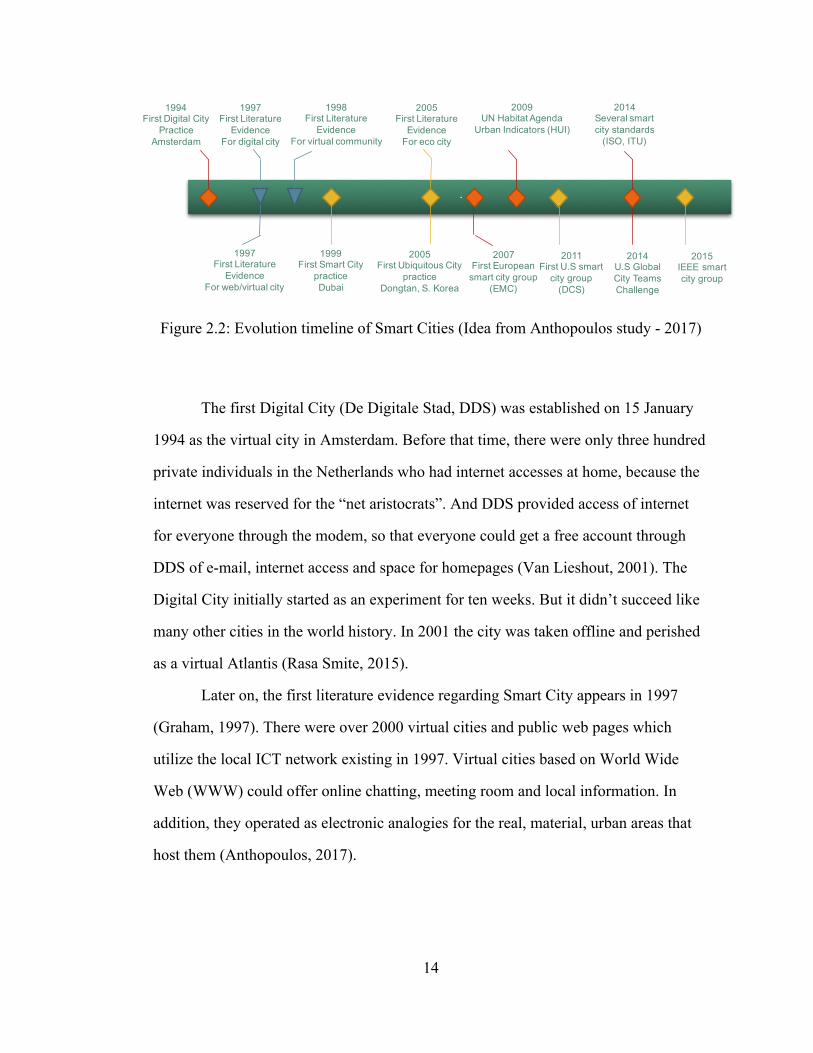
technological evolution. Here illustrates the evolution timeline of Smart Cities in
figure 2.2 (Anthopoulos, 2017)
14
Figure 2.2: Evolution timeline of Smart Cities (Idea from Anthopoulos study - 2017)
The first Digital City (De Digitale Stad, DDS) was established on 15 January
1994 as the virtual city in Amsterdam. Before that time, there were only three hundred
private individuals in the Netherlands who had internet accesses at home, because the
internet was reserved for the “net aristocrats”. And DDS provided access of internet
for everyone through the modem, so that everyone could get a free account through
DDS of e-mail, internet access and space for homepages (Van Lieshout, 2001). The
Digital City initially started as an experiment for ten weeks. But it didn’t succeed like
many other cities in the world history. In 2001 the city was taken offline and perished
as a virtual Atlantis (Rasa Smite, 2015).
Later on, the first literature evidence regarding Smart City appears in 1997
(Graham, 1997). There were over 2000 virtual cities and public web pages which
utilize the local ICT network existing in 1997. Virtual cities based on World Wide
Web (WWW) could offer online chatting, meeting room and local information. In
addition, they operated as electronic analogies for the real, material, urban areas that
host them (Anthopoulos, 2017).
1994First Digital City
Practice
Amsterdam
·
1997First Literature
Evidence
For digital city
1997First Literature
Evidence
For web/virtual city
1998First Literature
Evidence
For virtual community
1999First Smart City
practice
Dubai
2005First Literature
Evidence
For eco city
2005First Ubiquitous City
practice
Dongtan, S. Korea
2007First European
smart city group
(EMC)
2009UN Habitat Agenda
Urban Indicators (HUI)
2014U.S Global
City Teams
Challenge
2011First U.S smart
city group
(DCS)
2015IEEE smart
city group
2014Several smart
city standards
(ISO, ITU)
15
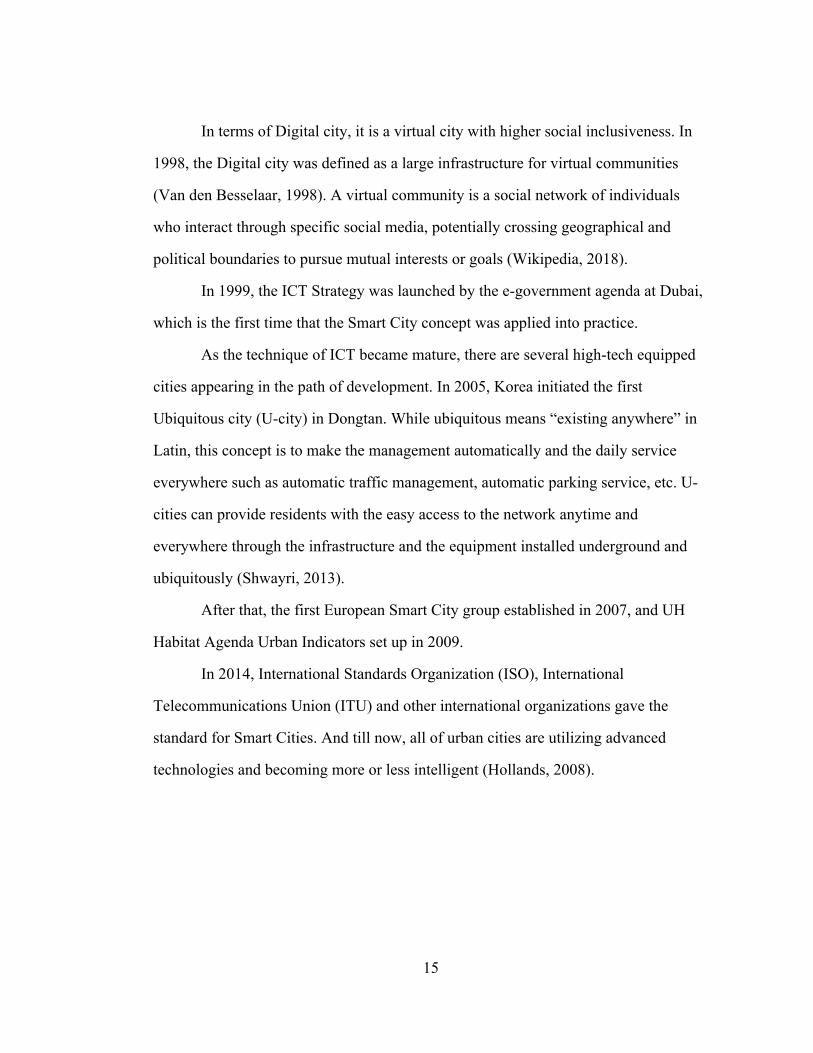
In terms of Digital city, it is a virtual city with higher social inclusiveness. In
1998, the Digital city was defined as a large infrastructure for virtual communities
(Van den Besselaar, 1998). A virtual community is a social network of individuals
who interact through specific social media, potentially crossing geographical and
political boundaries to pursue mutual interests or goals (Wikipedia, 2018).
In 1999, the ICT Strategy was launched by the e-government agenda at Dubai,
which is the first time that the Smart City concept was applied into practice.
As the technique of ICT became mature, there are several high-tech equipped
cities appearing in the path of development. In 2005, Korea initiated the first
Ubiquitous city (U-city) in Dongtan. While ubiquitous means “existing anywhere” in
Latin, this concept is to make the management automatically and the daily service
everywhere such as automatic traffic management, automatic parking service, etc. U-
cities can provide residents with the easy access to the network anytime and
everywhere through the infrastructure and the equipment installed underground and
ubiquitously (Shwayri, 2013).
After that, the first European Smart City group established in 2007, and UH
Habitat Agenda Urban Indicators set up in 2009.
In 2014, International Standards Organization (ISO), International
Telecommunications Union (ITU) and other international organizations gave the
standard for Smart Cities. And till now, all of urban cities are utilizing advanced
technologies and becoming more or less intelligent (Hollands, 2008).
16
2.4 Successful Smart Cities and their Applications
This section introduces three successful Smart Cities in the world: Barcelona,
Singapore and San Francisco. These cities are the prosperous examples, and their
creative innovations are great achievements as well.
2.4.1 Barcelona
From 2012, the capital city of Catalonia region in Spain, Barcelona started
applying interactive techniques across urban systems including parking lots, street
lighting, traffic optimization and waste management. With the 500 kilometers of fiber
optic cable built 30 years ago and the 19500 smart meters that monitor and manage
energy consumption in the city, Barcelona launched the IoT program across the urban
area. (Adler, 2016)
Barcelona’s transport system, Transports Metropolitan de Barcelona (TMB),
recently debuted a new orthogonal bus network (horizontal, vertical and diagonal
lines). It is faster in transition and easier to use.
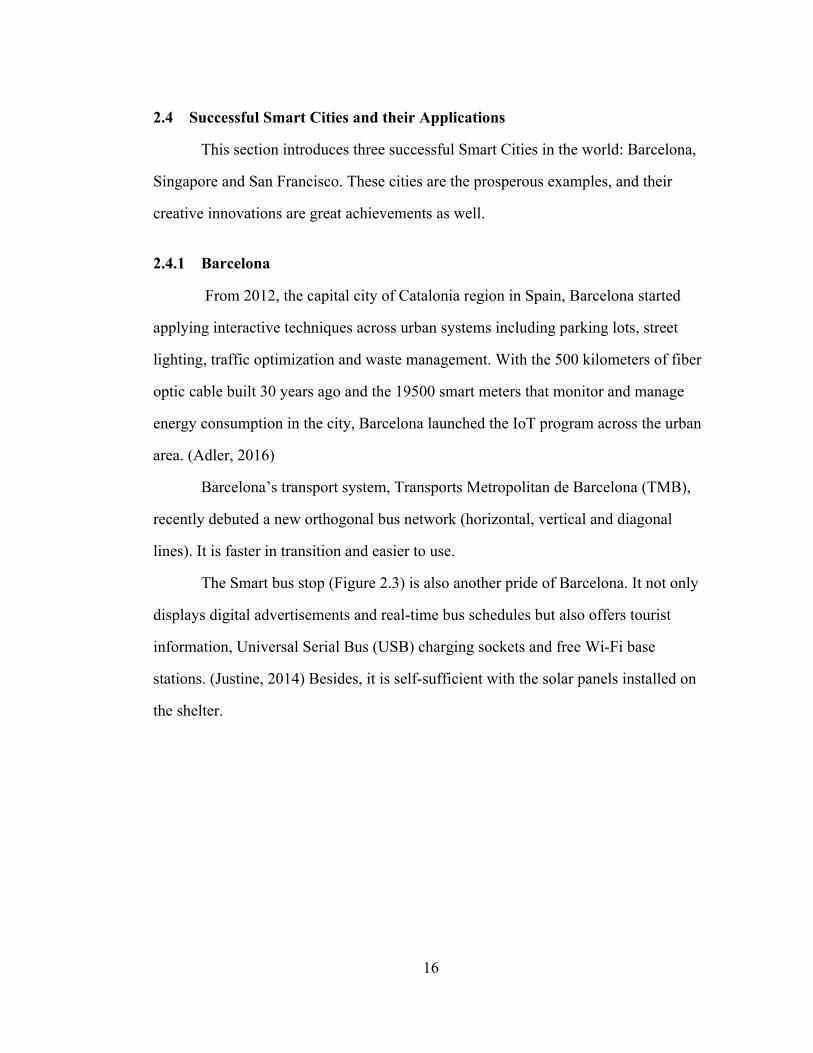
The Smart bus stop (Figure 2.3) is also another pride of Barcelona. It not only
displays digital advertisements and real-time bus schedules but also offers tourist
information, Universal Serial Bus (USB) charging sockets and free Wi-Fi base
stations. (Justine, 2014) Besides, it is self-sufficient with the solar panels installed on
the shelter.
17
Figure 2.3: Smart bus stop
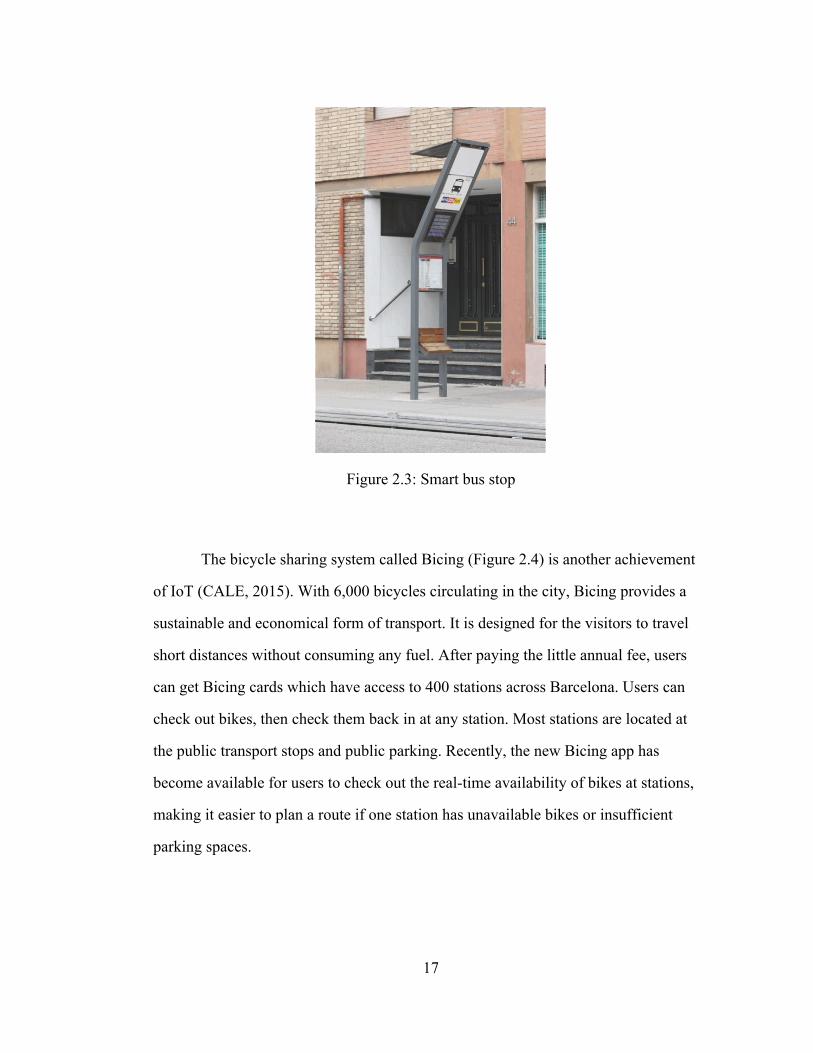
The bicycle sharing system called Bicing (Figure 2.4) is another achievement
of IoT (CALE, 2015). With 6,000 bicycles circulating in the city, Bicing provides a
sustainable and economical form of transport. It is designed for the visitors to travel
short distances without consuming any fuel. After paying the little annual fee, users
can get Bicing cards which have access to 400 stations across Barcelona. Users can
check out bikes, then check them back in at any station. Most stations are located at
the public transport stops and public parking. Recently, the new Bicing app has
become available for users to check out the real-time availability of bikes at stations,
making it easier to plan a route if one station has unavailable bikes or insufficient
parking spaces.
18
Figure 2.4: Bicing
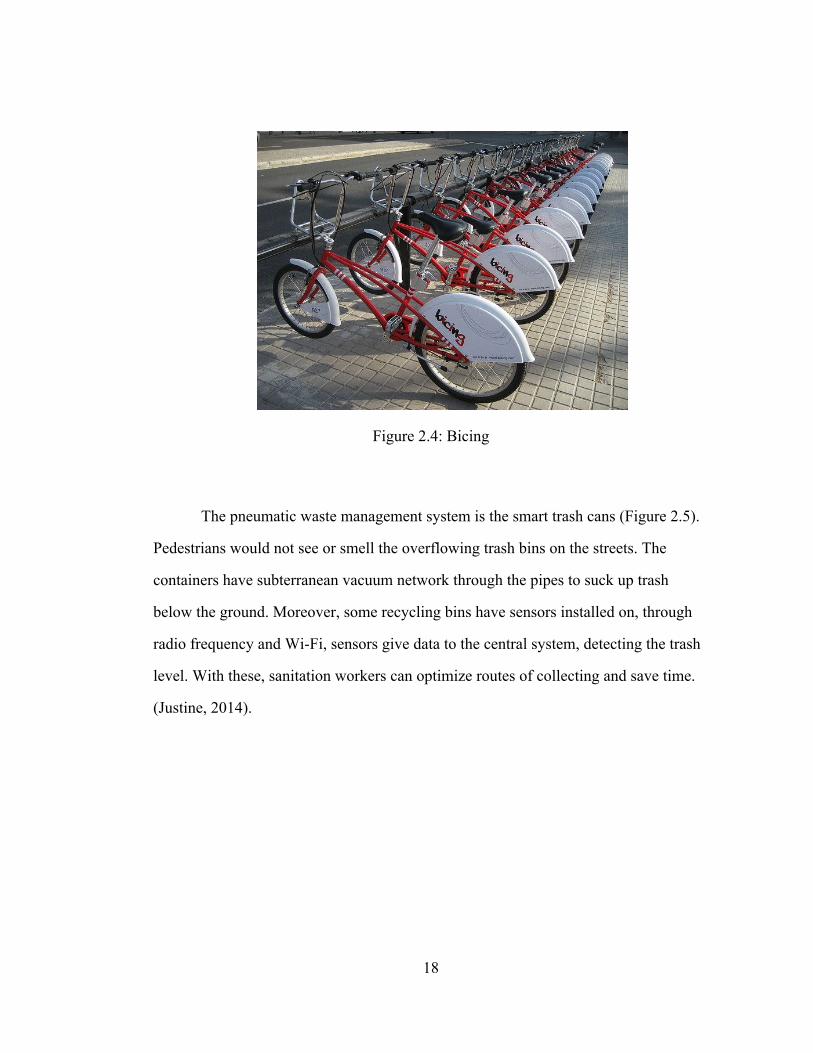
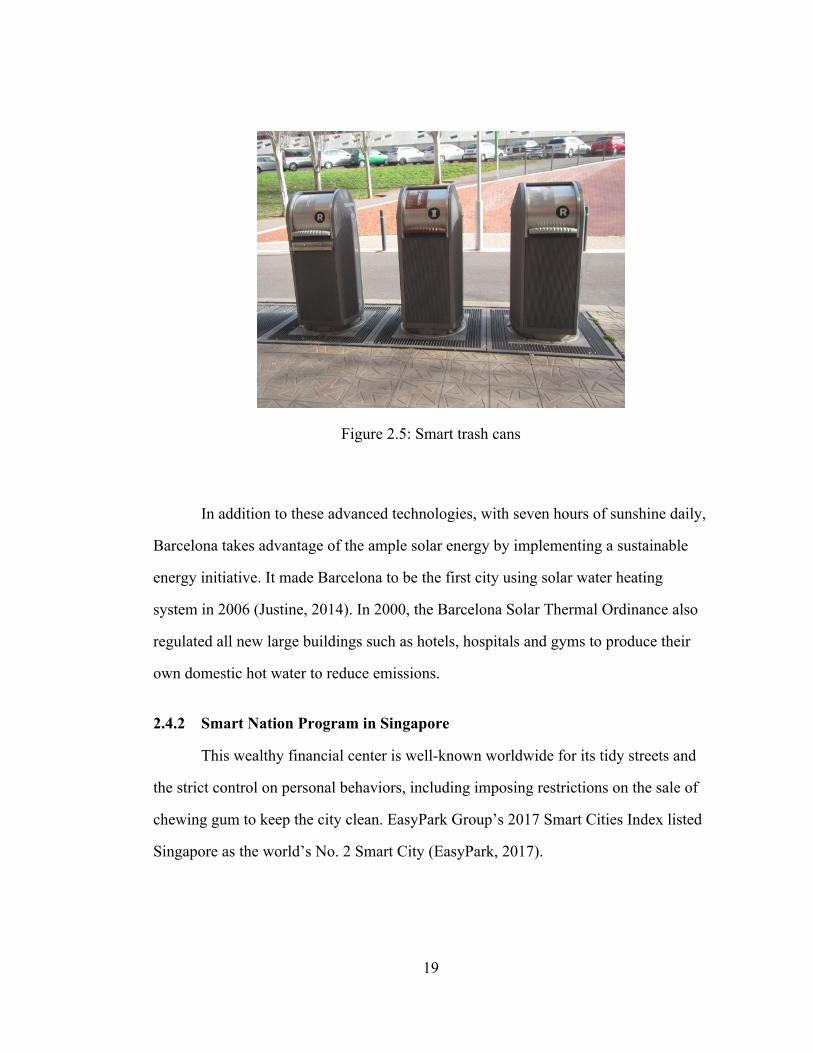
The pneumatic waste management system is the smart trash cans (Figure 2.5).
Pedestrians would not see or smell the overflowing trash bins on the streets. The
containers have subterranean vacuum network through the pipes to suck up trash
below the ground. Moreover, some recycling bins have sensors installed on, through
radio frequency and Wi-Fi, sensors give data to the central system, detecting the trash
level. With these, sanitation workers can optimize routes of collecting and save time.
(Justine, 2014).
19
Figure 2.5: Smart trash cans
In addition to these advanced technologies, with seven hours of sunshine daily,
Barcelona takes advantage of the ample solar energy by implementing a sustainable
energy initiative. It made Barcelona to be the first city using solar water heating
system in 2006 (Justine, 2014). In 2000, the Barcelona Solar Thermal Ordinance also
regulated all new large buildings such as hotels, hospitals and gyms to produce their
own domestic hot water to reduce emissions.
2.4.2 Smart Nation Program in Singapore
This wealthy financial center is well-known worldwide for its tidy streets and
the strict control on personal behaviors, including imposing restrictions on the sale of
chewing gum to keep the city clean. EasyPark Group’s 2017 Smart Cities Index listed
Singapore as the world’s No. 2 Smart City (EasyPark, 2017).
20
Smart Nation, the program with Infocomm technologies, networks, and big
data, is deploying an undetermined number of sensors and cameras across the island
city-state. It will allow the government to monitor everything, including the
cleanliness of public spaces, the precise movement of every locally registered vehicle
and etc. (Watts, 2016)
Singapore has also implemented a system to enhance traffic flow and ensure
security. In transportation, one outstanding innovation called One Monitoring is a
comprehensive service for all drivers and vehicle owners in the country. Through that
portal, residents in Singapore have access to real-time traffic information. It is
collected from surveillance cameras installed on roads and taxi vehicles using GPS.
Besides, the system can provide information on sections where road work is in
progress, and give traffic images of major highways. It can update traffic news, travel
time calculator, road maps and street directions (Tomás, 2017).
Moreover, another intelligent service, Parking Guidance System, initially
implemented in 2008, can provide drivers with real-time information on parking
availability (Tomás, 2017). The system is designed to reduce the amount of circulating
traffic searching for available spaces. And it seeks a more efficient use of existing
parking facilities. Information would display on electronic signs, online at the One
Motoring Portal and on mobile applications.
The Singapore Police Force provides a web-based electronic police center for
people to gather information. With it, they could fill police reports online, and handle
administrative affairs such as applying for a certified copy of police reports and
criminal records.

21
2.4.3 San Francisco
The city by the bay is one of the first cities in North America to use Smart
Cities technologies (Buntz, 2016). In 2015, San Francisco was declared as the cluster
of innovation than cities like Palo Alto, Mountain View and San Jose (Chen, 2015).
The San Francisco Municipal Transportation Agency (SFMTA) is playing a
vital role in implementing smart techniques. And the agency is also working to
improve transit while pursuing environmental goals such as zero carbon (Linda, 2017).
In 2016, the city was funded by the U.S. Department of Transportation (DOT) of $11
million for six innovative projects. The projects aim at smoothing traffic condition and
creating a safer and more efficient transportation system (Bialick, 2016). The
programs are illustrated as follow:
• New connected high-occupancy vehicle (HOV) lanes for public transit and
carpools.
• Dedicated curb space for pick-up and drop-off by carpools and ridesharing
services.
• Smart traffic signals to reduce congestion and improve safety.
• A connected, electronic toll system for the congestion pricing program at
Treasure Island.
• The deployment and testing of electronic, autonomous shuttles serving intra-
island trips on Treasure Island.
SFpark (Figure 2.6), the project launched successfully due to the federal funds
(Linda, 2017), uses sensors in parking spaces to provide real-time parking availability
information to motorists. And it uses the data to adjust parking prices during peak
hours. The system intends to reduce the time and fuel people spend looking for

22
parking, which could delay transit, block bicyclists and lead to more distracted
driving. (Richtel, 2011)
Parking usage is monitored by sensors placed in the asphalt. The availability
and prices can be checked through SFpark.org and apps. (DailyMail, 2011)
Figure 2.6: SFpark
Installed on 8,200 on-street spaces in the pilot areas, the wireless sensors can
detect the real-time parking availability (Rosencrance, 2017). To determine the
reasonable price charging for parking, SFpark uses the detected occupancy of metered
parking-space to meet parking-space availability targets. And according to the
availability, the prices range from a minimum of ¢25 to a maximum of $7 per hour

23
during daytime, with a $18 per hour cap for special events such as baseball games or
street fairs (SFpark, 2017).
And till 2017, SFpark has reduced its annual greenhouse gas emissions by 28
percent below 1990’s level. It decreased 30 percent vehicle traveled miles in
neighborhoods where the program was implemented (SFMTA, 2017).
Besides, the city and county of San Francisco have a long history of improving
the environmental condition into the smart city. Since 2005, the city environmental
management agency has planned to plant 25,000 trees at the bay area in 5 years. After
that, more than 16,000 trees have been planted in the city annually. And the city has
always implemented the proposal for a better environment and less pollution. In 2012,
SFMTA declared that the city taxis have surpassed the 2008 goal of subsiding the
average greenhouse gas emissions (GHG) by 20% as compared to level in 1990. In
1990, city taxis emitted 59 tons of GHG emissions on average every year. But today,
the emissions levels has dropped down to 30 tons per year which is a 49% reduction
(SMARTCITY, 2017).
2.5 Summary of Chapter 2
The Smart City concept has developed over the past 20 years. Starting from the
communication through the network, it becomes a sustainable developing plan. It is
formed with the evolution of Digital City, Virtual City, Ubiquitous City and other
types of practices and experiments.
After reviewing several perspectives, it can be concluded that a Smart City is
an urban area that utilizes techniques of ICT and advanced innovations to achieve the
sustainable development, and it can improve the quality of life improvements in 6
aspects (people, economy, governance, environment, connection, and living). This

24
definition is the unified framework of Smart Cities, it is concluded from the existing
analysis and experiences.
Then it presented how Smart Cities evolved over decades. Their types are
different, but there are always some similarities among Smart Cities. There have been
many successful practices since the initial Digital City practice in Amsterdam. Till
now, Smart Cities are using the innovations and techniques of ICT and IoT as the base.
After that, the study demonstrates the Smart City architecture to explain how
the concept can involve in all the aspects and be useful to them. The architecture
embraces five layers: Natural resources, Hard infrastructure, ICT-based hard
infrastructure, Smart service and Soft infrastructure.
Then it introduced to 3 successful examples in the world: Barcelona, Singapore
and San Francisco. They all have their unique and successful applications utilizing
advanced techniques.
In conclusion, the Smart City concept is an emerging domain of new models
and their evolution. With the 20-year evolution experience, new types of smart cities,
accompanied by new definitions and technologies, are expected to appear in the
future.
25
Chapter 3
COST-BENEFIT ANALYSIS
3.1 Definition of Cost-Benefit Analysis
Cost-Benefit Analysis (CBA) estimates and totals up the equivalent money
value of the benefits and costs to the community of projects, then gives the conclusion
whether they are worthwhile. These projects could be highways, training programs
and health care systems, etc. (Gupta, 2009)
This economic concept was originated by Jules Dupuit for flood management
projects in 1848. And the U.S. Army Corp of Engineers (USACE) started using CBA
for projects in 1902. The practical development of CBA came as a result of the
impetus provided by the Federal Navigation Act in 1936. This act required that the
U.S. Corps of Engineers can carry out projects for the improvement of the waterway
systems, if the total benefits of a project to whomsoever they accrue exceed the costs
of that project. Thus, this systematic method of CBA was established by the Corps of
Engineers.
According to the Federal Government report, CBA is a systematic quantitative
method of assessing the desirability of government projects or policies when it is
important to take a long view of future effects and a broad view of possible side-
effects. (Office of Management and Budget, 1992) Another investor, the United States
DOT defines: CBA is the analysis to measure the financial value of all the anticipated
benefits and costs connected with all members in society. (LaHood, 2012)
26
In general, CBA is a critical step in any project planning process. It can offer
short-term and long-term views of the proposed project including the impacts
surrounding communities from the project. Since Smart Cities around the world could
spend $41 trillion in developing techniques over the next 20 years (Pattani, 2016),
CBA is one of the most critical analysis for stakeholders, because it gives a
comprehensive understanding of why money should be allocated and spent on those
projects.
Some ordinary costs include, but are not limited to:
• Realistic short-term and long-term project Costs;
• Capital Cost from the construction;
• Current and future Maintenance and Operational Costs;
• Costs related to missing infrastructures, facilities, mobility, connectivity,
technologies and project structures;
• Deepening impacts on society (Monetized).
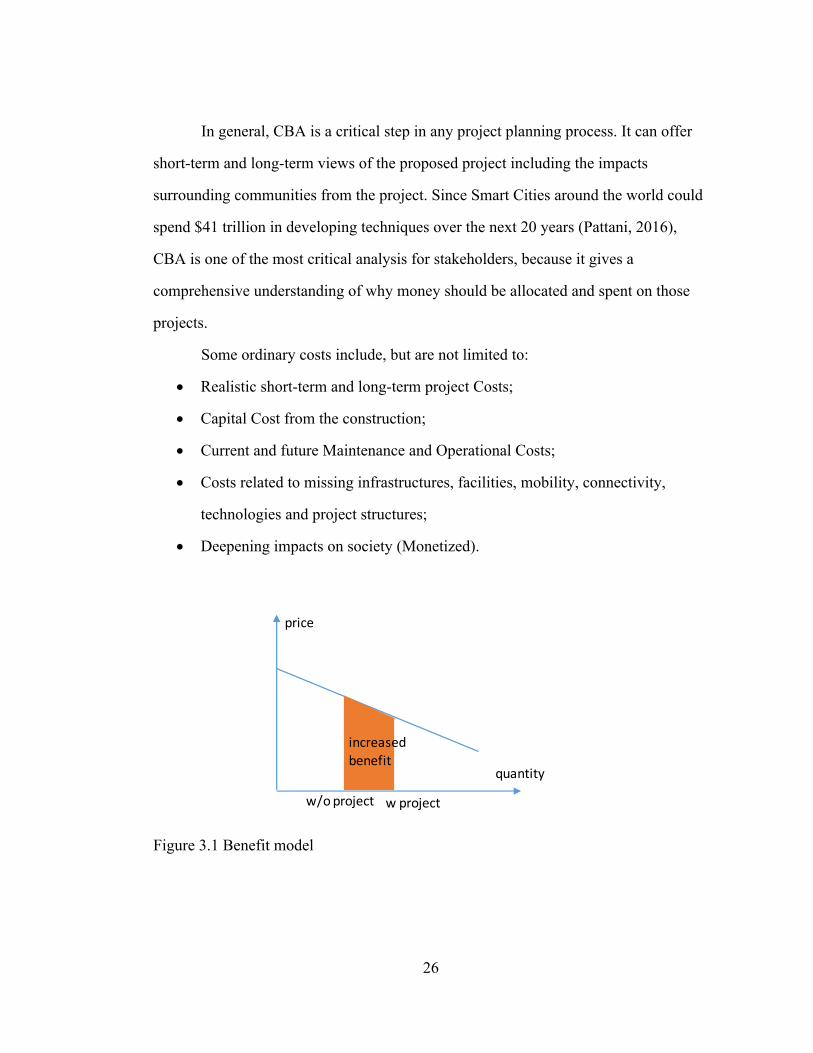
Figure 3.1 Benefit model
price
quantity
w/oproject w project
increasedbenefit
27
Regarding benefits, illustrated in figure 3.1, the general model to monetize the
increased benefits is the sum of the margin benefit times each incremental increase in
consumption. (Watkins, 2006) The increase in benefits results from an increase in
consumption.
And benefits do not only result from consumption, there are several unusual
elements of benefits need to be considered according to specific projects, like human
lives. There are many cases that people voluntarily accept increased risks in safety.
Otherwise, it requires payments, such as health insurance. With insurance, the reduced
risk could be considered as a benefit. There are some similar cases as well, like time
savings in the higher speed of automobile travel.
3.2 Funding Management of Smart Cities
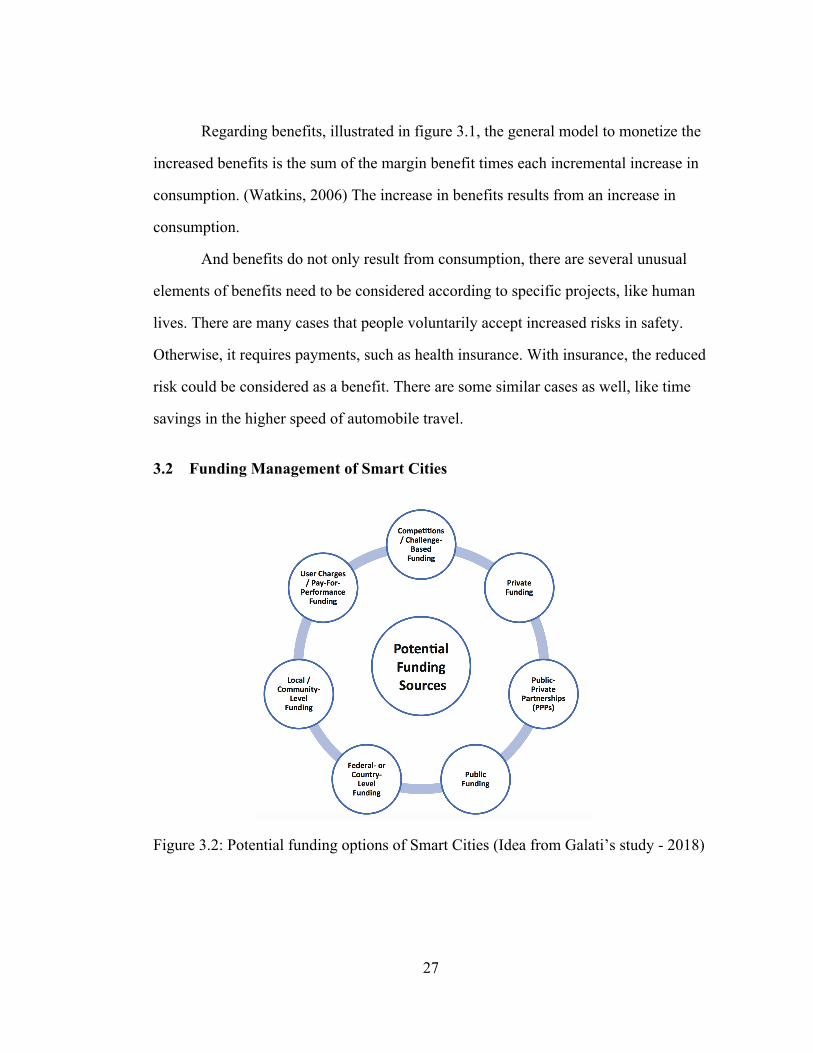
Figure 3.2: Potential funding options of Smart Cities (Idea from Galati’s study - 2018)
28
With the recognition of the high Capital Cost of Smart Cities, the city decision
makers would know it is not easy to start Smart Cities projects without reliable
financing sources. Figure 3.2 portrays the common funding sources for Smart Cities.
(Galati, 2018)
• Government-level funding
For many Smart Cities programs, government-level funding is a critical
component to whether the proposed projects could finish as initially envisioned and
intended. Government funding comes from country-sponsored agencies, and is usually
the first funding option considered by Smart City developers.
• Local-Level Funding
Another funding option comes from local-level sources. They include public
development agencies, local economic development corporations,
city/state/providence sources, and other locally invested organizations, such as
utilities.
• Community-Focused Funding
Community investment is another option of projects funding like grassroots
environmental community groups. And investments include large businesses invested
in a community, local companies looking for area rejuvenation, and targeted project
economic stimulus. And it targets individual communities within the urbanized or
improvement areas.
29
• Public-Private Partnerships (PPPs)
Many projects of smart city have significant benefits for both the private and
public sectors and can generate increased consumer mobility and economic gains. For
these reasons, they can be funded through Public-Private Partnerships. A Public-
Private Partnership, commonly known as a PPP or P3, is an arrangement between
government and private sector entities to provide public infrastructure, community
facilities and related services. (Tahir, 2017)
• Loans and Municipal Bonds
Usually, funding sources are not available and hard to acquire in a reasonable
timeframe that aligns with the project timetable. Sometimes, they are inadequate to
fund an entire smart project. At these times, Developers could turn to more traditional
sources of funding, including loans and municipal bonds, to help supplement other
project funding or keep projects aligned to schedule.
• Private Funding
Private funding is a viable option for both smaller and larger projects with
targeted stakeholders. Rarely will private funding sources be used for entire Smart
City programs or urbanization projects. Private funds often have expenditure limits on
a certain fixed period. They have constraints on project expenditures arranged by the
financiers and agreed upon before releasing funds.
• User Charges and Pay for Performance
This concept is similar to the pay-for-use wireless networking on an airplane,
where users pay a small fee for the ability to stay connected at 30,000 ft.
30
• Smart City Challenges and Competitions
In an effort to promote urbanized area qualities such as integration, mobility
and technological progress, many countries have begun sponsoring Smart City
competitions and conceptual challenges. Design competitions could bring the brightest
futurists and conceptual thinkers together in a competitive situation. Their creativity
could come up with means to reduce cost while increase efficiency, so that they could
realize the Smart City program.
3.3 Cost-Benefit Analysis Process
After introducing funding options of Smart Cities, here introduce the basic
steps of CBA.
1. Set the framework of analysis
The framework for the analysis is the scope for the project, including all the
impacted aspects.
2. Identify costs and benefits
Not only should the monetary and direct factors be considered in the analysis,
but also the indirect, intangible and non-monetary ones as well.
3. Assess variables according to project lifetime
By assessing the costs and benefits during the life of the project, the analysis
would be more accurate. This step is to project variables into their lifetime to identify
their characteristics and frequency. For example, some maintenance costs occur twice
a year, and because of that, they should be analyzed more frequently.
4. Monetized costs and benefits
According to the concluded methods for monetizing, the study could calculate
the numbers of each cost and benefit.
31
5. Calculate the discount costs and benefits to obtain present values:
The discount means converting future costs and benefits into present value,
which is also known as the social discount rate. Sometimes, it includes the impact
from inflation as well. Every agency tends to have a different discount rate. It
generally ranges between 2% to 7%. For a 30-year transportation project, the discount
rate is 2.7% (Systematics, 2009).
6. Compute the net present value and benefit-cost ratio:
This last step is to subtract costs from benefits. By assessed results, we could
make reliable recommendations.
3.4 Life-Cycle Assessment
Life-cycle assessment (LCA, also known as life-cycle analysis) is a technique
to assess environmental impacts, which associated with all stages of a product's life.
The life time is from raw material extraction through materials processing. It includes
manufacturing, distribution, use, repair and maintenance, and disposal or recycling.
(US Environmental Protection Agency, 2010)
The assessment will compile an inventory of relevant energy and material
inputs and environmental releases, so that it can help avoid a narrow outlook on
environmental concerns. Moreover, through evaluating potential impacts, the
assessment can escape from a shortsighted analysis within the entire project lifetime.
In terms of Smart City projects, although the investment is always high, the
revenue from that is continual and impressive in a long term. According to those
prosperous Smart Cities, the capital cost is expensive indeed, but the benefit and
advantages are also considerable.
32
Life-cycle assessment would bring a sustainable overview within the entire
project lifetime. It is the sustainable development that is in demand in the future. So
this study uses life-cycle assessment to conduct the cost-benefit analysis for Smart
Cities applications and technologies.
3.5 Summary of Chapter 3
This chapter mainly introduces cost-benefit analysis (CBA) definition,
purposes and processes of CBA, the evaluation methods of life-cycle assessment and
the Smart Cities’ funding management.
Cost-benefit analysis (CBA) is the mean to estimate and sum up the equivalent
money value of the benefits and costs. It can provide recommendations for
communities to decide whether they are worthwhile. It is the essential step to adopt the
proposal and begin to construct. Moreover, it can offer short-term and long-term views
of proposed projects concerning the impacts and benefits to surrounding communities.
The beginning step of CBA is to determine the framework. Then it defines all
the variables of costs and benefits. After that, the assessment computes the costs and
benefits over the project lifetime. Lastly, result of net present value and its
recommendations could be worked out with the discount rate.
The assessment that used to calculate all the costs and benefits is the life-cycle
assessment. It is the evaluation method to determine all environmental impacts from
every stage of the techniques. It not only includes the project itself, but also contains
the effects of the project, including the improvements and additional disadvantages.
Evaluation of every impact in project lifetime could help us to make a more accurate
and informed decision.

33
Lastly, this chapter introduces potential options of funding management of
Smart Cities. They include Government-level funding, Local-Level Funding,
Community-Focused Funding, Public-Private Partnerships (PPPs), Loans and
Municipal Bonds Private Funding.
34
Chapter 4
METHODOLOGY AND DATA
In this thesis, the most critical step is to identify and monetize costs and
benefits for Smart Cities technologies and applications. Since the scope of Smart
Cities is too broad to define, this study only focuses on cost-benefit analysis of Smart
Transportation applications.
This chapter introduces variables of Smart Transportation projects. Some
variables could be non-monetary, which are hard to compute in CBA. This study
summarizes the existing methods to quantify and monetize the variables. With
numerical variables, study calculates the net present value and benefit-cost ratio.
Using the recommendations from analysis, the city decision makers could decide
whether to accept the proposal.
4.1 Variables
The variables are a fundamental part of CBA. Despite the numerical variables
like costs of equipment, labor and energy consumption, the non-monetary variables
are also a significant part in this study. Here introduce the variables of costs and
benefits in Smart Transportation applications.

35
4.1.1 Costs
• Capital cost
The capital cost can be expressed as initial cost, which is the expense of plan,
design, equipment purchase and construction. In other words, it is the total investment
to bring a project to a commercially operable state (Van Aartsengelm, 2013).
Within Smart Transportation applications, the capital cost is a one-time
expense incurred during design and construction process. They are the engineering
design, land and construction permit acquisition, construction cost, labor cost,
equipment purchase and disposing cost for replaced facilities.
In this study, the Capital cost is expressed as 𝐶"#$%&#', which only incurred at
the beginning of the project.
• Maintenance cost
It occurs to maintain the facilities and techniques in proper working condition.
In this study, it is expressed as 𝐶(#%)*+,-.
• Operation cost
For example, advertising, rent payments, license equivalent fees, these are the
operation costs that occur annually, and it is expressed as 𝐶.$/0#&/.
• Other costs
Despite the capital, maintenance and operation costs, there are some other
costs like the noise impact from the construction, cost for cleaning, etc.
Moreover, according to the character of ICT, it is necessary to take cyber
security seriously. Cyber security is a protection of computer systems from hackers,
whose cyber-attack could damage the software and information. Cyber security

36
includes control on physical access and protection against harm that may come with
network access, data and code injection. (Schatz, 2017) It is considered as the process
to protect data and information by preventing, detecting and responding to
cybersecurity events. And such events, which include intentional attacks and
accidents, are the changes that may have impacts on organizational operations.
This field is becoming important due to the increasing reliance on computer
systems and wireless networks, such as Bluetooth, Wi-Fi and smart devices.
Nowadays, people started to store the personal information online instead of paper.
Without cyber security, hackers could steal personal privacy easily, and it would be
potential troubles as well.
Moreover, the cost for cyber security is not about physical protection, it
includes the up-to-date techniques and online maintenance.
Including cyber security, noise impact and cleansing for construction, these
other costs are expressed as 𝐶.&1/0.
These variables are significant elements of costs, so the total cost can be
referred as:
𝐶 = 𝐶"#$%&#' + 𝐶(#%)*+,- + 𝐶.$/0#&/ + 𝐶.&1/0
where 𝐶"#$%&#' only incurs at the beginning of projects, 𝐶(#%)*+,-, 𝐶.$/0#&/ and
𝐶.&1/0 are the total costs for the rest of the project’s lifetime.
4.1.2 Benefits
If we consider costs as expense, benefits would be the revenue. Most variables
in benefits are non-monetary, this study will summarize methods to quantify each
factors.
37
• Travel time reduction
Willingness-to-pay is the best explanation for the value of travel time.
Travelers would be willing to pay and extra charge at toll lanes for the reduced travel
time. Here introduce some values of travel time according to their transportation
modes and trip purposes.
Trip Purposes
There are two main categories of the trips. One is called On-the-Clock Travel
or Business Travel, it is the business trips that drivers and operators are paid a market
wage. Another is the Personal Travel or Leisure Travel which includes shopping,
personal business, social and recreational. Studies have found that the value of
personal travel time is lower than the hourly payment of business trip, but it does not
imply that the leisure is less desirable than the salary of the job.
In general, the hourly payment of drivers and operators is equal to the marginal
value of time. And for the personal travelers, they could work via laptop, mobile
phone and paper document during travel, so that the time-saving in travel can barely
increases their productivity. And it is also the reason for lower values of time in
personal travel and leisure travel (US DOT, 2015).
According to US DOT's report in 2015, the value of time in Business Travel is
equal to a national median gross compensation. This compensation is defined as the
sum of median hourly wages and the estimate of hourly benefits. It generates a value
of $24.40 per person per hour for travelers over all distances and by every surface
mode. For Personal Travel, the value of time is 50% of hourly median household
income in U.S (US DOT, 2015)
38
Transportation Modes
The transportation modes are separated roughly into two aspects: intercity
travel and local travel. Moreover, they have different factors that could affect the
travel time, like traffic congestion within urban cities and person-miles of intercity
travel.
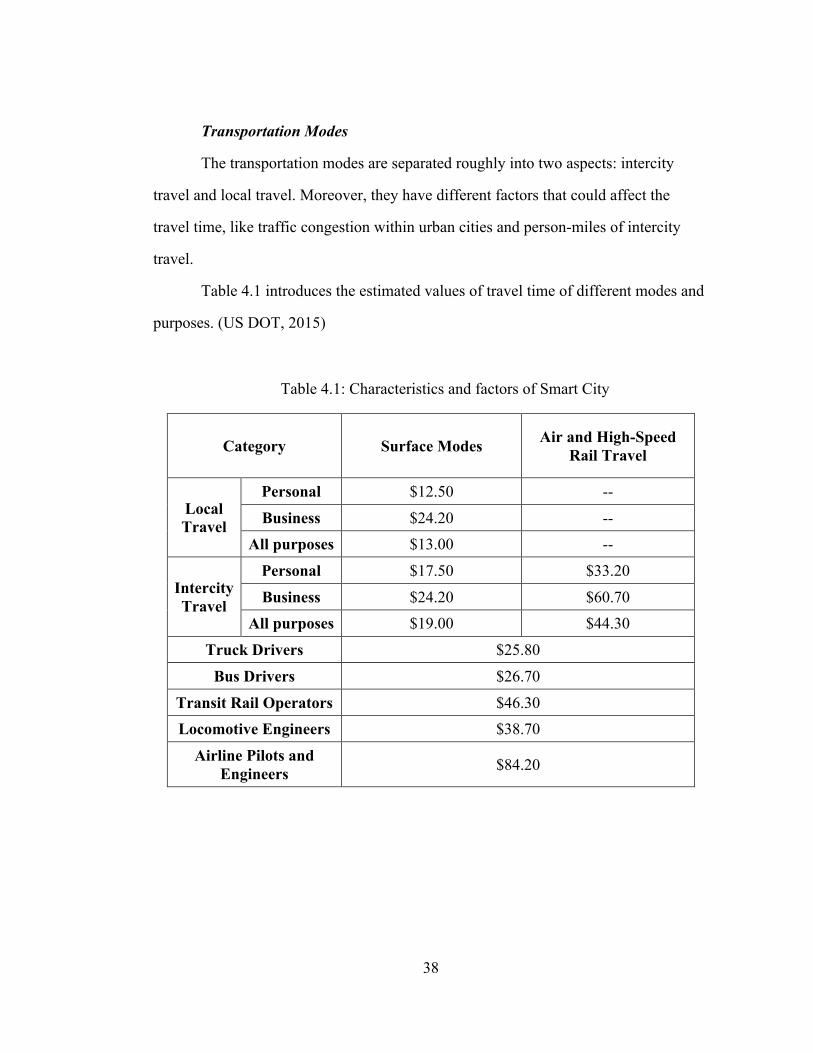
Table 4.1 introduces the estimated values of travel time of different modes and
purposes. (US DOT, 2015)
Table 4.1: Characteristics and factors of Smart City
Category Surface Modes Air and High-Speed Rail Travel
Local Travel
Personal $12.50 --
Business $24.20 -- All purposes $13.00 --
Intercity Travel
Personal $17.50 $33.20
Business $24.20 $60.70 All purposes $19.00 $44.30
Truck Drivers $25.80
Bus Drivers $26.70
Transit Rail Operators $46.30 Locomotive Engineers $38.70
Airline Pilots and Engineers $84.20

39
As we express in the CBA, the monetary value of reduced travel time 𝑉5%(/
with different categories 𝑖 could be given by 𝑉5%(/ = (Δ𝑡%×𝜔&%(/%)
%
where Δt, is the reduced travel time of mode i from the Smart Transportation
applications, 𝜔&%(/% is the monetary value per person per hour from Table 4.1 of the
mode i. And 𝑉5%(/ is the daily value of different trip purposes and traffic modes.
• Fuel and energy consumption
The energy and oil saving is one of the most important goals of the future. The
energy crisis in the 1970s and the oil crisis in 1973 would always remind us of the
importance to save energy and protect environmental.
And for the study in Smart Transportation techniques, the annual cost of the
reduced energy and fuel consumption could be expressed as:
𝑉@A/' = Δ𝐺@A/'×𝜔@A/'
where Δ𝐺@A/' is the reduced amount of used fuel every year, 𝜔@A/' is the average price
of fuel.
• Safety improvement
According to the U.S. DOT’s National Highway Traffic Safety Administration
(NHTSA), motor vehicle crashes have $871 billion in economic loss and social impact
on U.S. citizens in 2014. This value included $277 billion in economic costs and $594
billion in effect from the loss of life and decreased the life quality due to injuries
(NHTSA, 2014). It is crucial to quantify the safety, but every transportation activity
could bring risk while provide benefits for users. What we can do is to minimize the
risk while offering better transportation services.
40
According to advertisement of advanced technologies, everyone said that they
could reduce risk in transportation, but how can we measure the traffic safety and
compare them?
There are two general methods to quantify safety. One is called Human
Capital. It only considers the market cost that includes the property damage, medical
treatment and lost productivity. This approach estimated the human’s safety value is
$1 million. Another method, Comprehensive Method, measures the market costs and
non-market costs. This approach adds the costs of pain, sadness and reduced quality of
life. It estimated the value of preventing a fatality is $3-6 million (Miller, 1991). In
2008 the U.S. Department of Transportation gave that the economic value of statistical
human life is $5.8 million, with a range of $3.2 million to $8.4 million according to
cost-benefit analysis of the projects. (Duvall, 2008)
In this study, the monetary value of safety improvement is expressed as
𝑉C#D/&E = 𝑛G#D/&E×𝜔C#D/&E
where 𝑛G#D/&E is the reduced number of life in the traffic accident with Smart
Transportation's advanced technologies, and 𝜔C#D/&E is the monetary value of human's
life. This study uses the value $5.8 million from U.S DOT.
• Emission
Reduction of gas emission
From the study of ExxonMobil, the energy-related carbon emission annual
rates would be 10% higher in 2040 than they were in 2014. With techniques of hybrid
cars and electric cars, it will reach a peak value and start to decrease around 2030 as
energy efficiency spreads and as more carbon-reduction policies are enacted around
the world (ExxonMobil, 2014).
41
According to the estimation, the benefit of reduced gas emission would be a
significant variable. It is not only the improvement of the air-quality; human health is
also a crucial element.
There are two fundamental ways to quantify these impacts: Damage Costs
which refer to damages and risks, and Control Costs which mean the costs of reducing
emissions. These costs are usually affected by the number of fatality and illness
caused by air pollution.
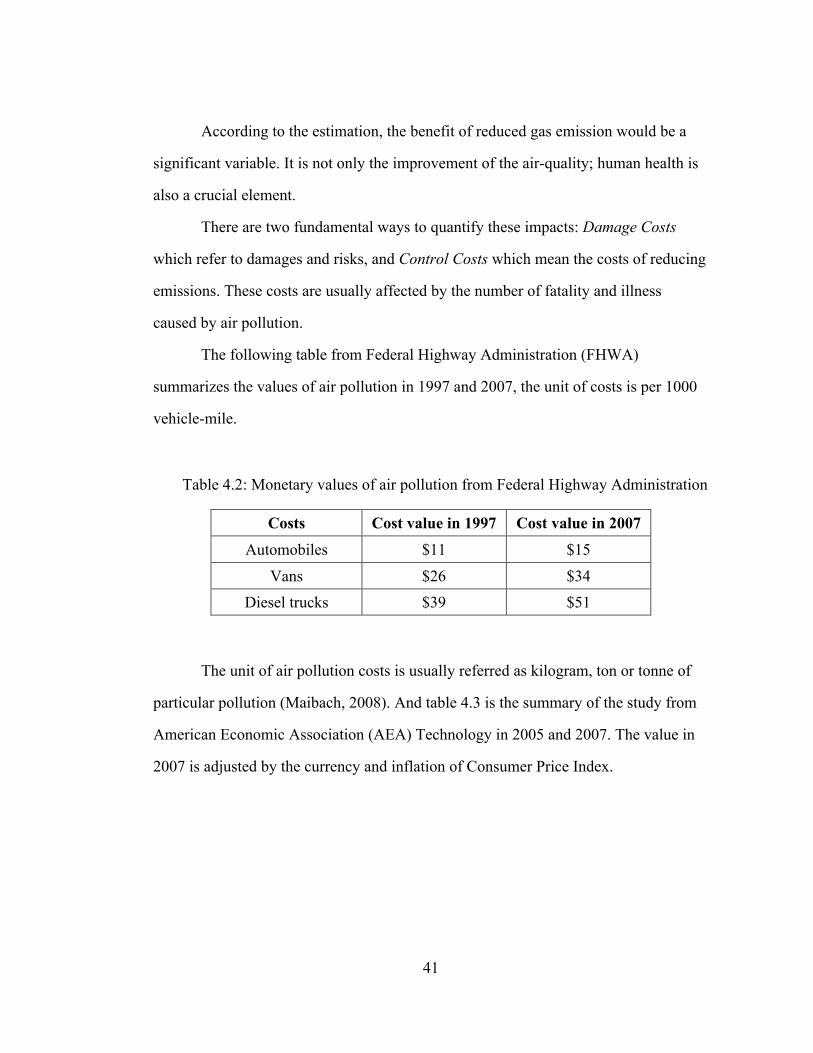
The following table from Federal Highway Administration (FHWA)
summarizes the values of air pollution in 1997 and 2007, the unit of costs is per 1000
vehicle-mile.
Table 4.2: Monetary values of air pollution from Federal Highway Administration
Costs Cost value in 1997 Cost value in 2007
Automobiles $11 $15
Vans $26 $34 Diesel trucks $39 $51
The unit of air pollution costs is usually referred as kilogram, ton or tonne of
particular pollution (Maibach, 2008). And table 4.3 is the summary of the study from
American Economic Association (AEA) Technology in 2005 and 2007. The value in
2007 is adjusted by the currency and inflation of Consumer Price Index.

42
Table 4.3: Monetary values of air pollution from American Economic Association
Costs Value in 2005 (€/Tonne) Value in 2007 ($/Tonne)
NH3 19750 26061
NOx 7800 10293 PM 2.5 48000 63339
SO2 10325 13624
VOCs 1812 2392
The monetary value of gas emission is expressed as 𝑉H(%GG%.) in this study.
Greenhouse gases
A crucial long-term threat posed by vehicle emissions is global climate change.
It threatens to alter many natural systems in unpredictable ways. Carbon dioxide
(CO2), which produces while combusting gasoline, natural gas and other fuels, is one
of the potential dangers to climate change.
Bloomberg News shows that in climate protection, the unit cost for greenhouse
gases per tonne is $29 in 2007. Stern’s study in 2006 indicated the climate change
control cost for CO2 per tonne is from $35 to $72 in 2007.
In this study, the monetary value of greenhouse gas is expressed as
𝑉I0//)1.AG/ in CBA.
• Noise
Motor vehicles cause various types of noise, includes engine acceleration,
tire/road contact, braking, horns and vehicle theft alarms. Heavy vehicles can create
vibration and infrasound (low-frequency noise).
According to the report from Organization for Economic Co-operation and
Development (OECD), “Transport is by far the major source of noise, ahead of

43
building or industry, with road traffic the chief offender.” (Kilby, 1990) Noise is not
only an unpleasant thing but can cause the property loss and endanger our physical
and mental health as well.
Bagby analyzed that the increase in traffic volume from few hundred motor
vehicles per day could reduce the value adjacent residential property by 5-25%
(Bagby, 1980). Transport noise cost in United Kingdom is up to 0.5% of its total GDP
in 1990. In United States, the cost is 0.06% to 0.21% of total GDP in 1991.
Despite numbers of vehicles, several other factors could affect the volume of
noise like traffic speed, engine type, pavement type and barriers, etc. Vehicles with
heavier load tend to produce higher noise level. Lower speeds tend to create less
traffic noise, and higher speed with faster acceleration and harder stopping, like
aggressive driving, could increase noise levels. All these factors make it difficult to
assign an accurate value to noise impacts.
Following table shows the study of monetary noise impact in 1991 and 2007,
the Noise cost value in 2007 is the adjusted value from 1991 with the inflation by
Consumer Price Index. The cost types are divided by the automobile types. The unit is
1000 vehicle-mile. (Delucchi, 1998)
Table 4.4: Noise monetary value from study of Delucchi - 1998
Costs Cost value in 1991 2007 USD
Cars (Urban) $1.18 $2
Medium Trucks $7.02 $11 Heavy Trucks $20.07 $31
Buses $7.18 $11
Motorcycle $8.71 $13

44
Another study estimates that urban traffic noise costs an average of $1.81 for
cars, $1.67 for buses and $1.55 for train travel per 1000 passenger-kilometers. (Evans,
2014)
In this study, the monetary value of noise is expressed as 𝑉J.%G/.
• Economic impact
Transportation projects can have various effects on the community’s economic
development objectives, such as productivity, employment, business activity, property
values, investment and tax revenues.
By improving accessibility and reducing traffic costs, transportation projects
could increase economic productivity and development. And it is important to
consider economic impacts in CBA. For example, an urban highway expansion may
improve the accessibility of drivers and motorists, and it can also reduce their costs per
mile traveled and generate more trips to increase economic activities. Similarly,
offering more accesses to an area can expose its businesses to more competition.
4.2 Discount Rate
A dollar today is worth more than a dollar five years from now, even if there is
no inflation. Because today's dollar can be used productively in the ensuing five years,
yielding a value greater than the original dollar. Future benefits and costs would be
discounted to apply this rule.
The purpose of discounting is to put all present and future costs and benefits in
a common metric, which is their present value.
Sometimes, CBA ignores inflation, because the prediction of future prices
would introduce unnecessary uncertainties into the study. Therefore, discount rates are
45
usually based on interest rates for government borrowing. This rate is typically
calculated by subtracting the rate of inflation (consumer price index) from an interest
rate like a 10-year US Treasury bill. For example, if the interest on a 10-Year Treasury
bill is 5.5 percent and the inflation rate is 3 percent, then the discount rate would be
2.5 percent.
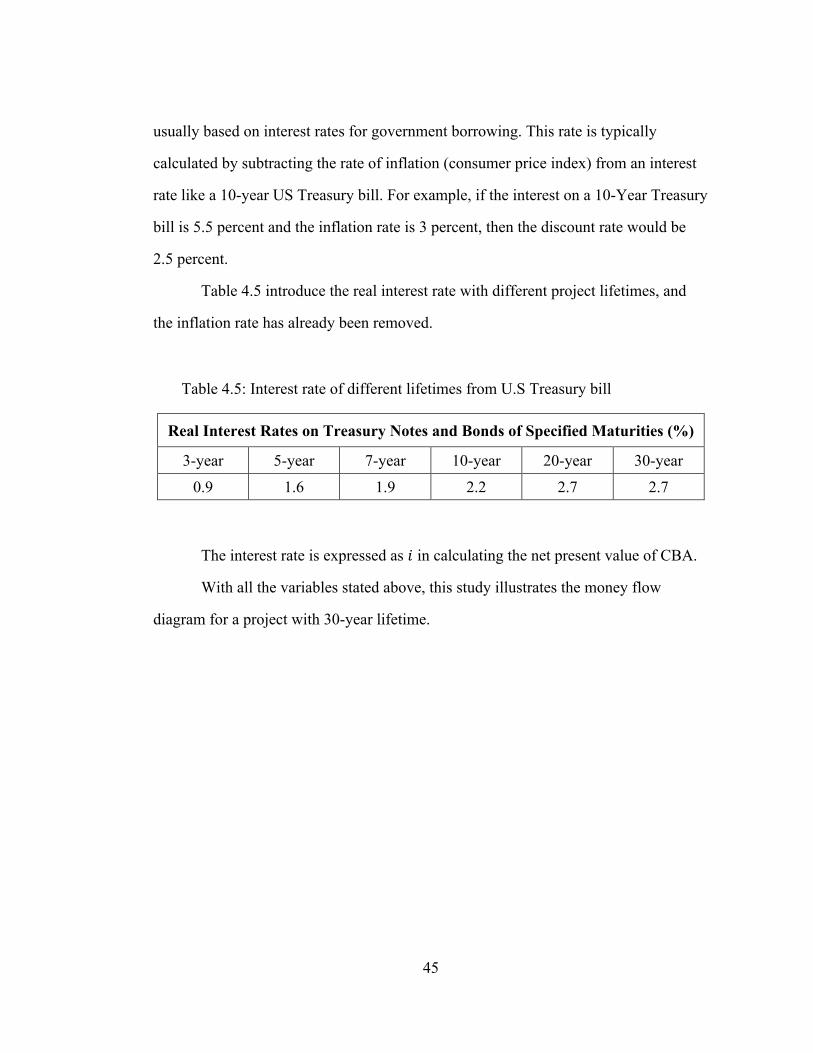
Table 4.5 introduce the real interest rate with different project lifetimes, and
the inflation rate has already been removed.
Table 4.5: Interest rate of different lifetimes from U.S Treasury bill
Real Interest Rates on Treasury Notes and Bonds of Specified Maturities (%)
3-year 5-year 7-year 10-year 20-year 30-year
0.9 1.6 1.9 2.2 2.7 2.7
The interest rate is expressed as 𝑖 in calculating the net present value of CBA.
With all the variables stated above, this study illustrates the money flow
diagram for a project with 30-year lifetime.

46
Figure 4.1: Life-cycle model
4.3 Project Lifetime
The lifetime of a project varies by sectors and individual plan. It begins when a
project becomes operational or is available to the public, and it ends when it is shut
down (Lee Jr, 2002). The time frame ranges from one year to 30 years. If equipment
is usually salvaged or discarded after a single lifetime, Highways will be in a
continually improved condition. Buildings and vehicles are somewhere in between as
they can receive improvements indefinitely, otherwise it can be recovered or torn
down. When CBA is applied to investments in transportation, project scenario
assumptions should be aware that these often have infinite lifetimes (Lee Jr, 2002).
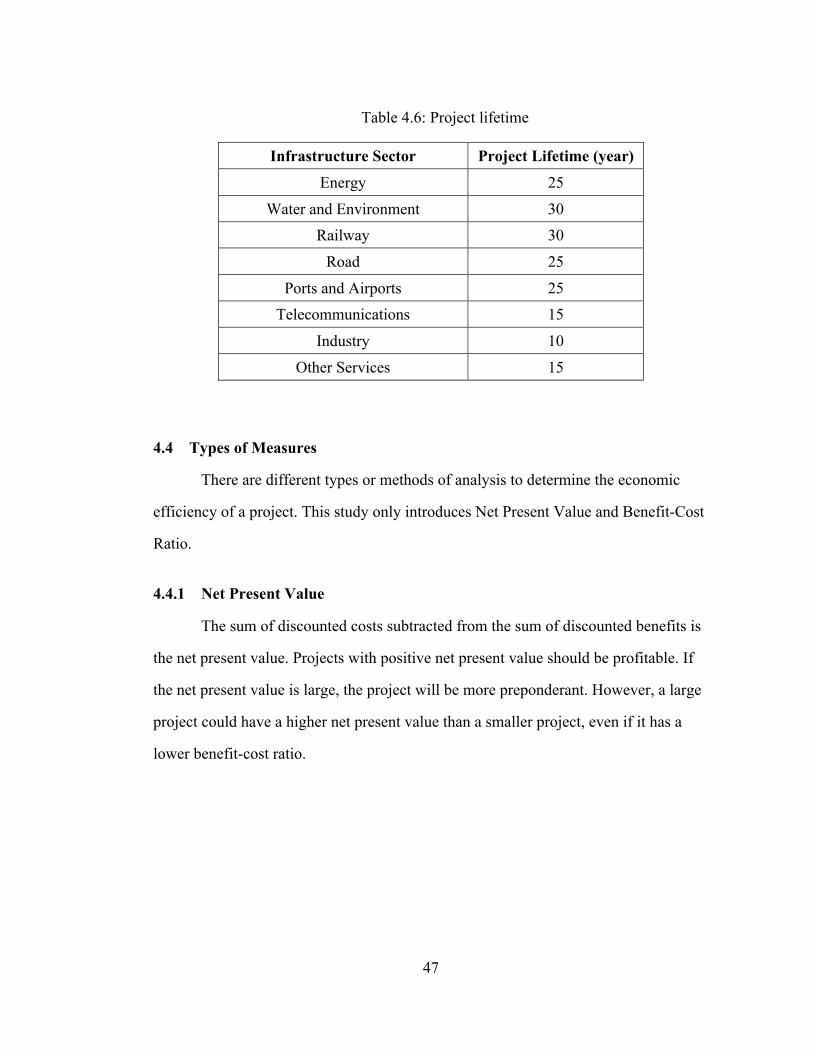
Typical project lifetimes for public projects are in Table 4.6. This variable is expressed
as 𝑁 in the CBA.
47
Table 4.6: Project lifetime
Infrastructure Sector Project Lifetime (year)
Energy 25
Water and Environment 30 Railway 30
Road 25
Ports and Airports 25 Telecommunications 15
Industry 10
Other Services 15
4.4 Types of Measures
There are different types or methods of analysis to determine the economic
efficiency of a project. This study only introduces Net Present Value and Benefit-Cost
Ratio.
4.4.1 Net Present Value
The sum of discounted costs subtracted from the sum of discounted benefits is
the net present value. Projects with positive net present value should be profitable. If
the net present value is large, the project will be more preponderant. However, a large
project could have a higher net present value than a smaller project, even if it has a
lower benefit-cost ratio.
48
𝑁𝑒𝑡𝑝𝑟𝑒𝑠𝑒𝑛𝑡𝑣𝑎𝑙𝑢𝑒 =𝑉)
(1 + 𝑖))UV −𝐶)
(1 + 𝑖))UV))
n = the project lifetime
𝑉) = the monetary value of benefits in the project from year 1 to the lifetime.
𝐶) = the monetary value of all costs in the project from year 1 to the lifetime.
𝑖 = discount rate
This is the net present value with the sum of discounted costs and benefits over
all years.
4.4.2 Benefit-Cost Ratio
The total discounted benefits are divided by the total discounted costs. Projects
with a benefit-cost ratio greater than 1 have a higher value in benefits than costs;
hence they have positive net benefits. If it gets a higher ratio, there will be more
benefits according to the costs. But in terms of the small project, benefit-cost ratio is
insensitive to the magnitude of costs and benefits net present value. Therefore, the
Benefit-Cost ratio results of small costs and benefits may seem similar to those with
higher costs and benefits.
𝐵𝑒𝑛𝑒𝑓𝑖𝑡𝑐𝑜𝑠𝑡𝑟𝑎𝑡𝑖𝑜 = (𝑉)
(1 + 𝑖))UV)) (
𝐶)(1 + 𝑖))UV)
)
n = the project lifetime
𝑉) = the monetary value of benefits in the project from year 1 to the lifetime.
𝐶) = the monetary value of all costs in the project from year 1 to the lifetime.
𝑖 = discount rate
4.5 Results
This cost-benefit analysis model is typically about Smart Cities applications in
transportation.
49
Costs include capital cost, operation cost, maintenance cost and other costs.
Generally, a project would always contain the capital, operation and maintenance cost.
Smart Cities projects have a unique variable, cyber security cost, which is to protect
personal privacy. Personal privacy is even more expensive than some physical objects.
This invisible thing contains the overall value of an individual, and that is why it takes
a lot of expenses.
After introducing the cost variables, benefits are analyzed in 7 aspects: reduced
travel time, less fuel and energy consumption, improved safety, reduced gas emission,
greenhouse gases, less noise and economic impact. Their monetizing methods
concluded from existing literature and reports. These variables are the essential
components of this evaluation model.
Moreover, the study introduces the discount rate from U.S treasury bill and
project lifetime defined by the analyst. With all the components above, the cost-
benefit analysis of Smart Transportation applications is complete.
According to their quantified improvements and monetary disadvantages, it
can be used to assess other types of Smart Cities technologies and applications as well.
50
Chapter 5
MODEL EVALUATION AND APPLICATION
In this chapter, the study would evaluate a hypothetical experiment of Smart
Transportation in Newark, Delaware. The assessment is according to its traffic
condition, population and other public data. All the benefit variables would be
determined based on the census data. Then the study would quantify and monetize
them into numbers to compare from the project costs. With the project lifetime and
discount rate based on inflation, the study could compute the net present value and the
benefit-cost ratio. At last, the evaluation model could give a reasonable decision
5.1 Background of the Project
Recently, city decision makers in Newark, DE have proposed to adopt the
project Smart Transportation to improve the traffic efficiency and start sustainable
development in transportation.
Smart Transportation, an advanced application, aims to provide innovative
services relating to different modes of transport and traffic management. It could bring
a safer, more coordinated and smarter transport networks to residents. But it is
undefined whether it could be cost-efficient and beneficial in the future, because the
project demands a great amount of funding. Here, this study evaluates this project
based on the model described in chapter four, and it would give results, conclusions
and recommendations for this Smart Transportation.

51
5.1.1 City of Newark
With 33,398 people, the city of Newark is the 3rd most populated city in the
state of Delaware out of 77 cities. In 2016, the median household income of Newark
residents was $55,256. Newark households made slightly more than Bowers
households ($54,167) and Frederica households ($54,375). However, 24.8% of
Newark residents live in poverty. The median age of Newark residents is 23.8 years
young (Delaware Demographics by CUBIT, 2016).
From 2012 to 2016, for the residents whose ages are above 16-year old, their
mean travel time to work is 22.7 minutes (U.S census Bureau, 2016). The number of
people who are employed in Newark but live outside is 19,817, which is 89.5% of the
total employees in Newark. And the remaining 10.5% of the employee are living and
working in the Newark. Besides, for the distance from home to work and back, there
are 54.6% of jobs whose working distance is less than 10 miles. 23.7% of the distance
is between 10 to 24 miles. 9.6% of the distance is between 25 to 50 miles. 9.6% of the
distance is greater than 50 miles (OnTheMap, 2015).
From the data, the average number of cars ownership is 2. The average travel
time of employees in Newark is 21.7 minutes, which is shorter than 24.8 minutes of
the average travel time to work in U.S. In 2015, driving alone to work is the most
common way for the workers in Newark and its percentage of total numbers of means
is 66.8%. (DATA USA, 2015)
According to the report of Delaware Information and Analysis Center, there
were 24,066 reportable traffic crashes of which 129 were fatal in 2015. 5,253 crashes
were personal injury, and 18,684 were property damage crashes. In 129 fatal crashes,
133 persons were killed. There were total 8,058 persons injured in 2015 and alcohol
52
was involved in 47% of the fatal crashes. The number of pedestrians killed in traffic
crashes was 36 in 2015, up from 27 in 2014 (Delaware State Police, 2015).
Based on the Daily Vehicle Miles Traveled (DVMT) report from DelDOT, in
New Castle County's urban area, the total DVMT is 12,117,624 miles of state;
493,078 miles of municipal; 1,121,343 miles of state-owned suburban; 15,004 of other
agencies (DelDOT, 2016). With the proportion of Newark area in New Castle County,
the DVMT of Newark is 7% of the total DVMT in New Castle County, which is
848,234 miles.
5.1.2 Project’s Description
The Smart Transportation aims to bring higher efficiency to various aspects.
They include car navigation, traffic signal control systems, container management
systems, variable message signs automatic number plate recognition or speed cameras
to monitor applications, such as security CCTV systems. There are advanced
applications that integrate live data and feedback from a number of other sources, like
parking guidance and information systems, weather information and bridge deicing
systems.
This project determines to install cameras and sensors on every intersection to
monitor traffic condition. And it utilizes autonomous vehicles as public transportation.
The project installs the automatic Smart Transportation application on every resident’s
private car to update and improve the traffic condition. With the upgraded information
pavement, Smart Transportation could connect every vehicle and update the signal and
road condition.
According to the area Newark, the number of intersection, population and
distributed population density, this project demands $0.1 billion capital cost. With
53
numbers of sensors, cameras and the upgraded pavement, these physical devices and
equipment need $0.8 million annual maintenance cost. Based on the area and the
traffic capacity of Newark, it needs $0.2 million yearly operation cost. Moreover,
according to chapter 4, this transportation project has the lifetime of 30 years and the
discount rate of 2.7%. Smart Transportation system is to optimized all the traffic
condition while ensuring the residents quality of life.
5.2 Monetized Variables
With all the statistics and data in the city of Newark, here we illustrate the
monetary value of all the variables in the model:
5.2.1 Discount Rate and Project Lifetime
Based on the information given in previous paragraphs, the project lifetime is
30-year and discount rate is 2.7%. So, they can be expressed as
𝑛 = 30𝑖 = 2.7%
5.2.2 Costs
• Capital cost
The capital cost is the expense of the plan, design, equipment purchase,
construction. For Smart Transportation in Newark, it is estimated as
𝐶"#$%&#' = $100,000,000,000
• Maintenance cost
Maintenance cost incurs to keep the facilities and applications in good working
condition. In this project, the annual maintenance cost is estimated as
𝐶(#%)*+,- = $800,000

54
• Operation cost
Advertising, rental payments and license equivalent fees, these annual
operation costs of Smart Transportation in Newark is estimated as
𝐶.$/0+&%.) = $200,000
• Other costs
According to daily vehicle mile travel and the cyber security cost, other costs
of Smart Transportation in the city of Newark is estimated as
𝐶.&1/0 = $550,000
5.2.3 Benefits
• Travel time reduction
The mean travel time to work of the residents in Newark is 22.7 minutes. And
with Smart Transportation, it can reduce lost time of every intersection’s cycle length
and increase the average travel speed while ensuring safety. According to the number
of intersections and traffic capacity in Newark, the daily travel time can reduce by 3.4
minutes on average. Thus, the mean daily travel time is 19.3 minutes in Newark, and
the reduction is 15%.
From the study of Michael S. Bronzini, the VMT in 2006 of single unit trucks
and combination trucks on urban highways in the U.S is 5.2% of the total VMT on
urban highways in the U.S (Bronzini, 2008). So this study estimates the trucks have
5% of the total VMT in Newark which is the business travel, while the personal shares
95%.

55
Since Newark is not a metropolitan area, most of the travel is the intercity
travel. This study estimates the intercity travel has 75% of the total traffic, while local
travel has the 25%.
According to the table 4.1, the monetary value of annual reduced travel time in
local travel is
𝑉5%(/ =3.460 ℎ× 25%×95%×$12.5 + 25%×5%×$24.2 ×365 = $67.66
the monetary value of annual reduced travel time in intercity travel is
𝑉5%(/ =3.460 ℎ× 75%×95%×$17.5 + 75%×5%×$19 ×365 = $276.67
so the monetary value of annual reduced travel time is
𝑉5%(/ = $67.66 + $276.67 = $344.33
• Less fuel and energy consumption
From the report of the U.S Environmental Protection Agency, the average fuel
economy reaches a record high of 24.7 miles per gallon in the 2016 model year (David
Shepardson, 2018). And the average U.S retail price of regular gasoline in 2016 is
$2.16 per gallon. The total DVMT in Newark area has been analyzed as 848,234 miles.
With hyper-energy vehicle and the traffic optimization from Smart
Transportation, the fuel consumption efficiency can increase to 27.5 mpg averagely
according to Newark’s daily vehicle mile traveled. So according to analysis in chapter
four, the monetary value of daily reduced fuel and energy consumption is
𝑉@A/' =848,234𝑚𝑖𝑙𝑒𝑠
(27.5 − 24.7)𝑚𝑝𝑔×$2.16 = $654,352
The annual value is $238,838,480.
56
• Safety improvement
In 2015, there were 129 fatal crashes in Delaware, 133 persons were killed.
Based on the previous analysis, the DVMT in Newark is 7% of the total DVMT in
New Castle County's urban area. With the distribution of population density, we can
estimate that Newark has 5% of the total DVMT in Delaware. So the number of
fatalities in Newark is 67 in 2015.
In chapter four, the study places a monetary value of human life at $5.8
million.
According to the improvement described in the previous section, it can reduce
27 fatal on average which is 40% of the crashes. So the monetary value of annual
safety improvement is
𝑉C#D/&E = 67×40%×$5.8𝑀 = $116.58𝑀
• Emission
Reduction of gas emission
The total DVMT in Newark area is 848,234 miles, with 95% automobiles and
5% trucks. According to the daily volume, present status of air pollution from traffic,
Smart Transportation can reduce 25% air pollutions by utilizing clean energy and gas
emission treatment. According to table 4.2, the monetary value of daily gas emission
is
𝑉H(%GG%.) = $15×25% × 848,234×95% + $51×25% × 848,234×5%
= $3,541,582.8
So the monetary value of gas emission is $1,292,677,722 annually.
57
Greenhouse gases
Based on clean energy and hyper-energy vehicle technologies and DVMT in
Newark, Smart Transportation program in Newark could avoid releasing 1,183 tons of
greenhouse gas emissions ever year. According to the summary of the monetary value
of greenhouse gas in chapter four, this study places a value of CO2 at $30 per tonne.
So the monetary value of annual reduced greenhouse gas is
𝑉I0//)1.AG/ = 1,183×$30 = $35,490
• Less noise
Smart Transportation could reduce the volume of noise with advance pavement
material. This material could provide a smoother, quieter and safer driving. It could
reduce the monetary value of noise by 25%.
As the analysis in the reduced energy consumption, the total DVMT in Newark
area is 848,234 miles with automobiles of 95% and trucks of 5%. Thus, according to
the table 4.4, the monetary value of reduced daily noise is:
𝑉J.%G/ =848,2341,000 ×95% ×$2 +
848,2341,000 ×5% ×$31 = $2926.41
So the value of annual reduced noise is $1068138.66
• Economic impact
Transportation projects can have various implications on community’s
economic development objectives, such as productivity, employment, business
activity, property values, investment and tax revenues.
In general, transport projects could improve the accessibility and reduce
transportation costs. They tend to increase economic productivity and development.
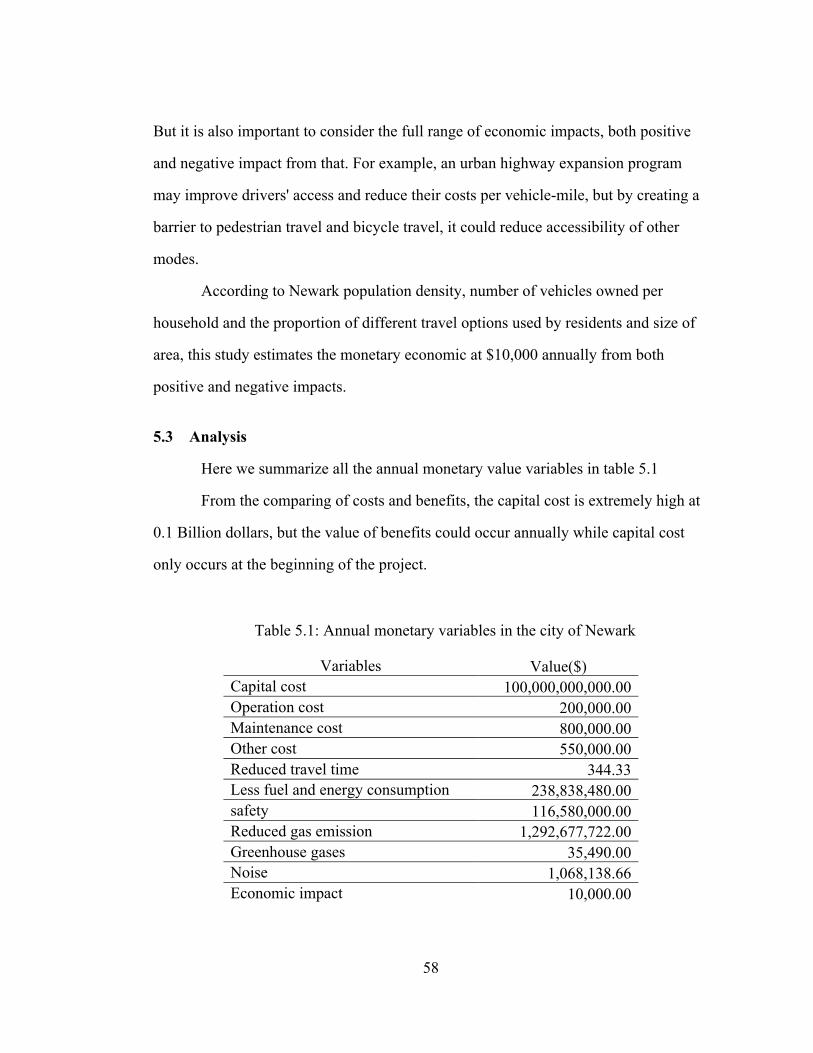
58
But it is also important to consider the full range of economic impacts, both positive
and negative impact from that. For example, an urban highway expansion program
may improve drivers' access and reduce their costs per vehicle-mile, but by creating a
barrier to pedestrian travel and bicycle travel, it could reduce accessibility of other
modes.
According to Newark population density, number of vehicles owned per
household and the proportion of different travel options used by residents and size of
area, this study estimates the monetary economic at $10,000 annually from both
positive and negative impacts.
5.3 Analysis
Here we summarize all the annual monetary value variables in table 5.1
From the comparing of costs and benefits, the capital cost is extremely high at
0.1 Billion dollars, but the value of benefits could occur annually while capital cost
only occurs at the beginning of the project.
Table 5.1: Annual monetary variables in the city of Newark
Variables Value($) Capital cost 100,000,000,000.00 Operation cost 200,000.00 Maintenance cost 800,000.00 Other cost 550,000.00 Reduced travel time 344.33 Less fuel and energy consumption 238,838,480.00 safety 116,580,000.00 Reduced gas emission 1,292,677,722.00 Greenhouse gases 35,490.00 Noise 1,068,138.66 Economic impact 10,000.00

59
5.3.1 Net Present Value
Net present value is the different value between the present cash inflows and
outflows over a specific period. With the equation for the net present value:
𝑁𝑒𝑡𝑝𝑟𝑒𝑠𝑒𝑛𝑡𝑣𝑎𝑙𝑢𝑒 =𝑉𝑎𝑙𝑢𝑒)1 + 𝑖 )UV)
n = the project lifetime
𝑉𝑎𝑙𝑢𝑒) = the monetary annual value of each variable
𝑖 = discount rate
The following table 5.2 presents the net present value of each variable over 30
years with the discount rate of 2.7%.
Table 5.2: Net present values of variables
Variables Value($)
Cost
Capital cost 100,000,000,000.00 Operation cost 4,186,641.41 Maintenance cost 16,746,565.62 Other cost 11513263.87
Benefit
Reduced travel time 7,207.93 Less fuel and energy consumption 4,999,655,348.23 safety 2,440,393,275.39 Reduced gas emission 27,059,890,375.87 Greenhouse gases 742,919.52 Noise 22,359,567.80 Economic impact 209,332.07
So the total net present value of Smart Transportation is 𝑁𝑒𝑡𝑝𝑟𝑒𝑠𝑒𝑛𝑡𝑣𝑎𝑙𝑢𝑒 = 𝐵𝑒𝑛𝑒𝑓𝑖𝑡𝑠 − 𝐶𝑜𝑠𝑡𝑠
= $34,523,258,026.82 − $100,032,446,470.89
= −65,509,188,444.08 = $ − 65.5M
60
5.3.2 Benefit-Cost ratio
With the equation, the benefit-cost ratio of the 30-year Smart Transportation in
Newark is
𝐵𝑒𝑛𝑒𝑓𝑖𝑡𝑐𝑜𝑠𝑡𝑟𝑎𝑡𝑖𝑜 = 𝐵𝑒𝑛𝑒𝑓𝑖𝑡𝑠 𝐶𝑜𝑠𝑡𝑠 =34,523,258,026.82100,032,446,470.89 = 0.35
5.4 Conclusion
Here the study concludes from the net present value and benefit-cost ratio,
Smart Transportation is not cost-efficient in Newark. The net present value is -$65.5
and the benefit-cost ratio is 0.35. The negative net present value means the loss within
project lifetime and benefit-cost ratio shows the correlation of them two. Although it
has a large number of advantages and it could bring higher efficiency in our daily
travel, the project would not be profitable within 30 years.
According to the negative net present value (-$65.5 million), discounted
present outflows exceed inflows, and the investment on Smart Transportation project
is expected to result in a net loss in Newark. With the benefit-cost ratio (0.35), which
is below one, it means the project costs outweigh the benefits in 30 years. So this
proposal should not be taken into account and implemented.
This chapter analyzes a hypothetical proposal of Smart Transportation in
Newark. It evaluates monetary numbers of each variable according to the potential
improvements in Newark. And the decision from this simulation study is to discard
this 30-year period proposal.

61
Chapter 6
SUMMARY, CONCLUSIONS, AND RECOMMENDATIONS
6.1 Summary
The urban population has increased rapidly over the past century. The
proportion of urban population to world population has risen from 35.7% to 54% from
1966 to 2016. This growth will also continue in the next few decades. So the
sustainable development to achieve a higher efficiency of social resources in urban
area is a significant task in the future.
Smart City, this intelligent concept, utilizes the techniques of ICT and other
advanced innovations. It can achieve a higher quality of life in six aspects (people,
economy, governance, environment, connection, and living). In Smart Cities, residents
can make more efficient use of physical infrastructures.
Despite these advantage, from the report of Smart Cities projects, the
investment is relatively high because of their advanced techniques, like the equipment
installed to optimize the daily operations and the network connected through the
whole urban area.
Apparently, through a more effective operation of social resources and
productivity force, the urban area could benefit from the advanced technologies in
Smart City. However, it is ambiguous to define whether it is cost-efficient to invest
that much money for little progress. Moreover, Benefits from technologies are usually
seen as improvements in daily life, so it is also hard to define the cost-efficient by
comparing them to the monetary value of costs.
62
With analyzed variables, the study summarizes methods to monetize and
quantify each variable according to existing reports, studies and research analysis on
Smart City. After that, it analyzes and concludes monetizing methods that would be
used in this model. With the discount rate from the U.S DOT's report and the average
lifetime of a transportation project, the model gives a general modal to evaluate the
cost-efficiency of Smart Cities projects in transportation.
With the model, it conducts a hypothetical analysis of Smart Transportation,
which is a 30-year project in Newark, Delaware. Variables within this study include:
reduced travel time, less fuel and energy consumption, improved safety, reduced gas
emission, greenhouse gases, less noise and economic impact. With the history data
DMVT, travel time to work and gasoline price, this study measures the net present
value and benefit-cost ratio. Their results show that Newark is not a profitable area to
adopt Smart Transportation.
After all, this established model of cost-benefit analysis could be useful for city
decision makers to deal with proposals of intelligent technologies. Through the
monetary data, the model evaluates investments and benefits clearly.
6.2 Conclusions
There are several objectives achieved from this cost-benefit analysis of Smart
Cities. These conclusions are based on the life-cycle assessment of variables,
summarized measurements to quantify every non-monetary variable and methods to
quantify benefits.
63
1. Objective 1: List and specify all costs
The capital cost is the expense on plan, design, equipment purchase, and
construct. It is the total costs needed to bring a project to a commercially operable
status.
Operation cost includes advertising, rent payments and license equivalent fees,
which incur annually.
Maintenance cost is the expense to keep the facilities and applications in good
working conditions and functioning well which also occurs annually.
Other costs include cyber security cost, advertising fee, noise impact from
construction and labor cost within the project lifetime.
2. Objective 2: List all the variables in benefits and give the specific methods to
monetize each factor.
The variables of benefits include reduced travel time, less fuel and energy
consumption, improved safety, reduced gas emission and greenhouse gases, less noise
and economic impact.
Their monetizing methods are specified in section 4.1.2
3. Objective 3: By life-cycle assessment, design a model based on all the
variables to evaluate the cost-benefit balance of the project.
The model uses the measurements of net present value and benefit-cost ratio to
analyze it over the project lifetime. And it would give recommendations based on their
results.

64
𝑁𝑒𝑡𝑝𝑟𝑒𝑠𝑒𝑛𝑡𝑣𝑎𝑙𝑢𝑒 =𝑉)
(1 + 𝑖))UV −𝐶)
(1 + 𝑖))UV))
𝐵𝑒𝑛𝑒𝑓𝑖𝑡𝑐𝑜𝑠𝑡𝑟𝑎𝑡𝑖𝑜 = (𝑉)
(1 + 𝑖))UV)) (
𝐶)(1 + 𝑖))UV)
)
n = the project lifetime
𝑉) = the monetary value of benefits in the project from year 1 to the lifetime.
𝐶) = the monetary value of all costs in the project from year 1 to the lifetime.
𝑖 = discount rate
6.2.1 Merits
This study mainly evaluates the costs and benefits of Smart Cities technologies
and applications in transportation.
It gives a comprehensive introduction to the definition and evolution of Smart
Cities. This concept was formed with the development of Digital City, Virtual City,
Ubiquitous City and other types of practices and experiments. It is an urban area that
utilizes technologies of ICT and advanced innovations, to achieve sustainable
development and improve the quality of life in six aspects.
Regarding the variables in the model, they are determined according to the life-
cycle assessment of Smart Cities projects in transportation. This assessment model
includes both positive and negative impacts from the project in a long term. So the
model introduced in chapter four includes every impacted aspect from Smart Cities.
The study examines this model by a hypothetical proposal of Smart
Transportation in the city of Newark. With the area, population density, daily vehicle
mile traveled and average travel time to work, the analysis calculates the net present
value and the benefit-cost ratio with the monetary variables. Furthermore, it concludes
65
that the proposal is not profitable. Newark did not reach the standard that can adopt
the Smart City strategy indeed, so this analysis seems effective and useful.
The core concept of this thesis is based on the Smart Cities. Since Smart Cities
will be a developing trend in the future, this study could be applicable for the
evaluation and management in the further analysis as well.
6.2.2 De-merits
This thesis did not cover every aspects of Smart Cities that impact our daily
life, such as the uncertainty of Smart City technologies and the development of the
Smart technologies.
According to the development of the ICT and IoT right now, the cost of
equipment, software, maintenance and operation could change accordingly. In next
few decades, it is hard to predict what could happen.
Moreover, the uncertainty leads to the numbers of the variables that are too
hard to monetize, like the trip generation from the improvement of accessibility to
transportation. The scope of this study was only limited to transportation in Smart
Cities.
6.3 Recommendations
Even though Smart Cities technologies could bring higher efficiency and
improvements in various aspects, the high expense should be taken seriously with the
proposal as well. Intelligent technologies and equipment always advertise about their
advantages and benefits, making the public ignore their high expense. But users and
city decision makers should consider the cost-efficient carefully before adopting them.

66
Furthermore, the block chain management has become a popular research field
recently. It has advantages that it would not suffer from cyber-attack, because the
whole chain is the public network and everyone in the system is recorded by all
anticipants in the network. Without the problem of cybersecurity, the technology of
block chain would become the mainstream in the future. But it also has issues like
whether it is cost-efficient. Further study based on this thesis could be useful to it.
67
REFERENCES
A. Caragliu, C. D. (2011). Smart cities in Europe. J. Urban Technol, 65-82.
ADB. (2005). Accident Costng Reports. Asian Decelopemtn Bank.
Adler, L. (2016, Feb 18). How Smart City Barcelona Brought the Internet of Things to Life. Retrieved from Retrieved from Data Smart City Solutions: http://datasmart. ash. harvard. edu/news/article/how-smart-city-barcelona-brought-the-internet-ofthings-to-life-789
Ala Al-Fuqaha, M. G. (2015, 6 15). Internet of Things: A Survey on Enabling Technologies, Protocols, and Applications. IEEE Communications Surveys & Tutorials, 2347 - 2376.
Andrea Zanella, N. B. (2014). Internet of Things for Smart Cities View Document 634 Paper Citations 340698 Full Text Views Open Access . 1(1).
Anthopoulos, L. G. (2017). Understanding Smart Cities: A Tool for Smart Government or an Industrial Trick? Springer.
Aytur, S. A. (2008). Urban containment policies and physical activity: a time--series analysis of metropolitan areas, 1990--2002. American journal of preventive medicine, 34(4), 320-332.
Bagby, D. G. (1980). The effects of traffic flow on residential property values. Journal of the American Planning Association, 48(1), 88-94.
Bialick, A. (2016, Oct 14). SF to Receive $11 Million for Innovative Transportation Solutions From USDOT. Retrieved from SFMTA: https://www.sfmta.com/blog/sf-receive-11-million-innovative-transportation-solutions-usdot
Bronzini, M. a. (2008). Relationships between land use and freight and commercial truck traffic in metropolitan areas. Transportation Research Board, 13, 2.
Buntz, B. (2016, May 18). The World’s 5 Smartest Cities. Retrieved from Internet of Thing Institue: http://www.ioti.com/smart-cities/world-s-5-smartest-cities

68
Business Dictionary. (2015). What is Smart City? Definition and meaning. Retrieved 2018, from Business Dictionary: http://www.businessdictionary.com/definition/smart-city.html
CALE. (2015, Sep 27). Biking in Barcelona: How to use Viu Bicing. Retrieved from VELABAS: http://www.velabas.com/writing/places/biking-in-barcelona-how-to-use-viu-bicing/
Caragliu, A. (2011). Smart Cities in Europe. Journal of Urban Technology , 18(2), 65-82.
Caragliu, A. a. (2009). Smart Cities in Europe (Vrije Universiteit, Faculty of Economics and Business Administration. Cited on, 8.
Chen, J. D. (2015, Feb 18). Move over Silicon Valley, San Francisco is new hippest tech scene. Retrieved from CNN: https://www.cnn.com/2015/02/17/americas/san-francisco-tech-hub/
Cohen, B. (2015, Oct 8). The 3 Generations Of Smart Cities. Retrieved from fastcompany.com: https://www.fastcompany.com/3047795/the-3-generations-of-smart-cities
DailyMail. (2011, May 9). Rage no more! The phone app that tells you where the empty parking spaces are. Retrieved from Daily Mail.com: http://www.dailymail.co.uk/sciencetech/article-1384937/SFpark-The-phone-app-tells-parking-spaces-are.html
DATA USA. (2015). Newark,DE. Retrieved 2018, from Data USA Newark, DE: https://datausa.io/profile/geo/newark-de/#category_transportation
David Shepardson, N. C. (2018, Jun 11). U.S. vehicle fuel economy rises to record 24.7 mpg: EPA. Retrieved from Reuters: https://www.reuters.com/article/us-autos-emissions/u-s-vehicle-fuel-economy-rises-to-record-24-7-mpg-epa-idUSKBN1F02BX
Delaware Demographics by CUBIT. (2016). Newark Demographic. Retrieved Mar 30, 2018, from Delaware Demographic by CUBIT: https://www.delaware-demographics.com/newark-demographics
Delaware State Police. (2015). 2015 Delaware Annual traffic statistic report. Delaware Information and Analysis Center. Delaware State Police.
DelDOT. (2016). Daily Vehicle Miles Traveled (DVMT). Delaware: Delaware.
69
Delucchi, M. a.-L. (1998). The external damage cost of noise emitted from motor vehicles. Journal of transportation and statistics, 1(2), 1-24.
Department of Business, Innovation and Skills—UK. (2013, Oct). Smart Cities Background Paper.
Development, G. o.-M. (2014). Draft Concept Note on Smart City Scheme.
Duvall, T. D. (2008). Treatment of the economic value of a statistical life in Departmental analyses. memorandum for the Office of the Secretary of Transportation.
EasyPark. (2017). 2017 Smart Cities Index. Retrieved from EasyPark Smart Cities Index: Smart Cities Index
EDRG. (2007). Monetary Valuation of Hard-to-Quantify Transportation Impacts: Valuing Environmental, Health/Safety & Economic Development Impacts. National Cooperative Highway Research Program, 8(3), 61.
Evans, C. a. (2014). Updating environmental externalities unit values.
ExxonMobil. (2014). Driving innovation – developing new technologies to reduce greenhouse gas emissions. Retrieved from ExxonMobil: http://corporate.exxonmobil.com/en/current-issues/climate-policy/climate-perspectives/energy-developing-new-technologies-to-reduce-ghg
FHWA. (1997). 1997 Federal Highway Cost Allocation Study. USDOT.
Galati, S. R. (2018). Funding a Smart City: From Concept to Actuality. In S. R. Galati, Smart Cities (pp. 17-39). Springer.
gemalto. (2017, May 30). Singapore - the world's first smart city? Retrieved from gemalto security to be free: https://www.gemalto.com/review/Pages/Singapore---the-world's-first-smart-city.aspx
Gibson, D. V. (1992). The technopolis phenomenon: Smart cities, fast systems, global networks. Rowman & Littlefield.
Giffinger, R. a.-M. (2007). Smart cities: Ranking of European medium-sized cities. Centre of Regional Science, Vienna University of Technology.
70
Giffinger, R. a.-M. (2007). Smart cities: Ranking of European medium-sized cities. Centre of Regional Science, Vienna University of Technology.
Gil-Garcia, J. R.-C. (2016). Conceptualizing smartness in government: An integrative and multi-dimensional view. Government Information Quarterly, 33, 524-534.
Graham, S. a. (1997). Urbanising cyberspace? The nature and potential of the virtual cities movement. City, 2, 18-39.
Gupta, K. (2009). Cost management: Measuring, monitoring& motivating performance. Global India Publications.
Hamblen, M. (2015, Oct 1). Just what IS a smart city? Retrieved Feb 20, 2018, from computerworld.com: https://www.computerworld.com/article/2986403/internet-of-things/just-what-is-a-smart-city.html
Hollands, R. G. (2008). Will the real smart city please stand up? Intelligent, progressive or entrepreneurial? City, 12(3), 303-320.
Honghua Qin, H. L. (2010). Development Status of Domestic and Foreign Smart City,. 50-52.
IEEE. (2014). About. Retrieved from Institute of Electrical and Electronics Engineers: https://smartcities.ieee.org/about.html
International Standards Organization. (2014). Sustainable development of communities — Indicators for city services and quality of life. Retrieved Feburary 2018, from ISO: https://www.iso.org/obp/ui/#iso:std:iso:37120:ed-1:v1:en
ISO. (2014). Smart cities Preliminary Report 2014. Information technology.
Justine. (2014, Feb 23). Ten Reasons Why Barcelona is a Smart City. Retrieved Feb 22, 2018, from Latitude 41: http://latitudefortyone.com/ten-reasons-why-barcelona-is-a-smart-city/
Khan, M. S. (2017). Smart City and Smart Tourism: A Case of Dubai. Sustainability, 9, 6.
Kilby, C. a. (1990). Environmental policies for cities in the 1990s.
Kondepudi, S. a. (2014). Smart sustainable cities: An analysis of definitions. The ITU-T Focus Group for Smart Sustainable Cities.

71
Kumar, P. (2015, July 01). What’s The Real Mean of ‘Smart City’? Retrieved from Smart Cities Projects: http://www.smartcitiesprojects.com/tag/major-goals-of-smart-city/
LaHood, R. (2012, Jan 21). Notice of Funding Availability for the Department of Transportation’s National Infrastructure Investments Under the Full-Year Continuing Appropriations. US Department of Transportation. Federal Register, 77(20), 4863-4880.
Lee Jr, D. (2002). Fundamentals of life-cycle cost analysis. Transportation Research Record: Journal of the Transportation Research Board(1812), 203-210.
Linda, R. (2017, Nov). In San Francisco, smart city parking apps are already paying off, reducing greenhouse gas emissions and improving rider satisfaction. Retrieved from IoT Agenda: http://internetofthingsagenda.techtarget.com/feature/San-Francisco-smart-city-pilots-aim-to-make-streets-safer
Maibach, M. a. (2008). Handbook on estimation of external costs in the transport sector. CE Delft.
Meijer, A. a. (2016). Governing the smart city: a review of the literature on smart urban governance. International Review of Administrative Sciences, 82, 392-408.
Miller, T. a. (1991). The costs of highway crashes. United States. Federal Highway Administration.
NHTSA. (2014, May 28). New NHTSA Study Shows Motor Vehicle Crashes Have $871 Billion Economic and Societal Impact on U.S. Citizens. Retrieved Feb 14, 2018, from National Highway Traffic Safety Administration: https://www.nhtsa.gov/press-releases/new-nhtsa-study-shows-motor-vehicle-crashes-have-871-billion-economic-and-societal
Office of Management and Budget. (1992, Oct 29). Circular No. A-94 revised. Retrieved Feb 24, 2018, from The White House: https://obamawhitehouse.archives.gov/omb/circulars_a094
OnTheMap. (2015). OnTheMap. Retrieved from OnTheMap: https://onthemap.ces.census.gov/
72
Pattani, A. (2016, Oct 27). Spending on smart cities around the world could reach $41 trillion. Retrieved from CNBC: https://www.cnbc.com/2016/10/25/spending-on-smart-cities-around-the-world-could-reach-41-trillion.html
Rasa Smite, . L. (2015). Data Drift. Archiving Media and Data Art in the 21st Century. RIXC, LiepU MPLab.
Richtel, M. (2011). Now, to find a parking spot, drivers look on their phones. The New York Times (Technology), 95.
Rosencrance, L. (2017, Nov). San Francisco smart city pilots aim to make streets safer. Retrieved from IoT Agenda: http://internetofthingsagenda.techtarget.com/feature/San-Francisco-smart-city-pilots-aim-to-make-streets-safer
Schatz, D. a. (2017). Towards a More Representative Definition of Cyber Security. Journal of Digital Forensics, Security and Law, 12(2), 8.
SFMTA. (2017, Nov 01). 2017 San Francisco Transportation System Climate Action Strategy (CAS) . Retrieved from SFMTA: https://www.sfmta.com/sites/default/files/reports-and-documents/2017/12/cap_draft_full_doc-accessible-1.01.pdf
SFpark. (2017, Dec 07). Pricing . Retrieved from SFpark: http://sfpark.org/how-it-works/pricing/
Shwayri, S. T. (2013). A model Korean ubiquitous eco-city? The politics of making Songdo. Journal of Urban Technology, 20(1), 39-55.
Singh, S. (2014, June 19). Smart Cities -- A $1.5 Trillion Market Opportunity. Retrieved Feb 21, 2018, from Fobe: https://www.forbes.com/sites/sarwantsingh/2014/06/19/smart-cities-a-1-5-trillion-market-opportunity/
smart cities council. (2008). definition and overview. Retrieved from smart cities council: https://smartcitiescouncil.com/smart-cities-information-center/definitions-and-overviews
SMARTCITY. (2017, Oct 13). How San Francisco Is Embarking Upon Accepting The Challenge Of Real World. Retrieved from SmartCity press: https://www.smartcity.press/san-francisco-most-innovative-city-in-us/
73
Systematics, C. (2009, Dec). FHWA Operations Benefit/Cost Analysis Desk Reference Project: FDOT D2 TSM\&O Workshop Presentation. Washington, DC: Department of Transportation.
Tahir, M. S. (2017). PUBLIC PRIVATE PARTNERSHIPS (PPPs); INNOVATIONS AND IMPROVEMENTS FOR FUTURE. HEALTH CARE SYSTEMS IN PAKISTAN. Professional Medical Journal, 24(1), 1-9.
Tomás, J. P. (2017, Jan 12). Case study: Smart city technology in Singapore. Retrieved Feb 23, 2018, from Enterprise IoT Insight: https://enterpriseiotinsights.com/20170112/smart-cities/case-study-singapore-smart-city-tag23-tag99
U.S census Bureau. (2016). U.S census Bureau Quickfact: Newark city, Delaware. Retrieved Mar 30, 2018, from U.S census Bureau: https://www.census.gov/quickfacts/fact/table/newarkcitydelaware/PST045216
US DOT. (1997). Retrieved from https://www.transportation.gov/
US DOT. (2015). The Value of Travel Time Savings: Departmental Guidance for Conducting Economic Evaluations Revision 3. US DOT.
US Environmental Protection Agency. (2010, Oct 17). Life Cycle Assessment. Retrieved from US Environmental Protection Agency: http://www.gdrc.org/uem/lca/lca-define.html
Van Aartsengelm, A. a. (2013). Handbook on Continuous Improvement Transformation. Springer.
Van den Besselaar, P. a. (1998). Demographics and sociographics of the digital city. In P. a. Van den Besselaar, Community Computing and Support Systems (Vol. 1519, pp. 108-124). Springer.
Van Lieshout, M. (2001). Configuring the digital city of Amsterdam: Social learning in experimentation. New Media & Society, 3, 131-156.
Watkins, T. a. (2006). An introduction to cost benefit analysis. Economics Department, San Jose State University, Silicon Valley, USA. Available at: http://www2. sjsu. edu/faculty/watkins/cba. htm.[Date Accesssed: 8 March 2005].
Watts, J. M. (2016). Singapore Is Taking the ‘Smart City’to a Whole New Level. The Wall Street J, 24.
74
Whitehouse. (2009, Dec). Real Discount Rates of transportation projects. Retrieved from Whitehouse: http://www.whitehouse.gov/omb/circulars_a094_a94_appx-c/
WHO. (2011). Burden of disease from environmental noise: Quantification of healthy life years lost in Europe.
Wikipedia. (2018, Feb 22). Virtual community. Retrieved from Wikipedia: https://en.wikipedia.org/wiki/Virtual_community
Wikipedia. (n.d.). Smart city. Retrieved 1 11, 2018, from wikipedia: https://en.wikipedia.org/wiki/Smart_city
world bank group. (2017). Urban population (% of total). Retrieved from https://data.worldbank.org/indicator/SP.URB.TOTL.IN.ZS
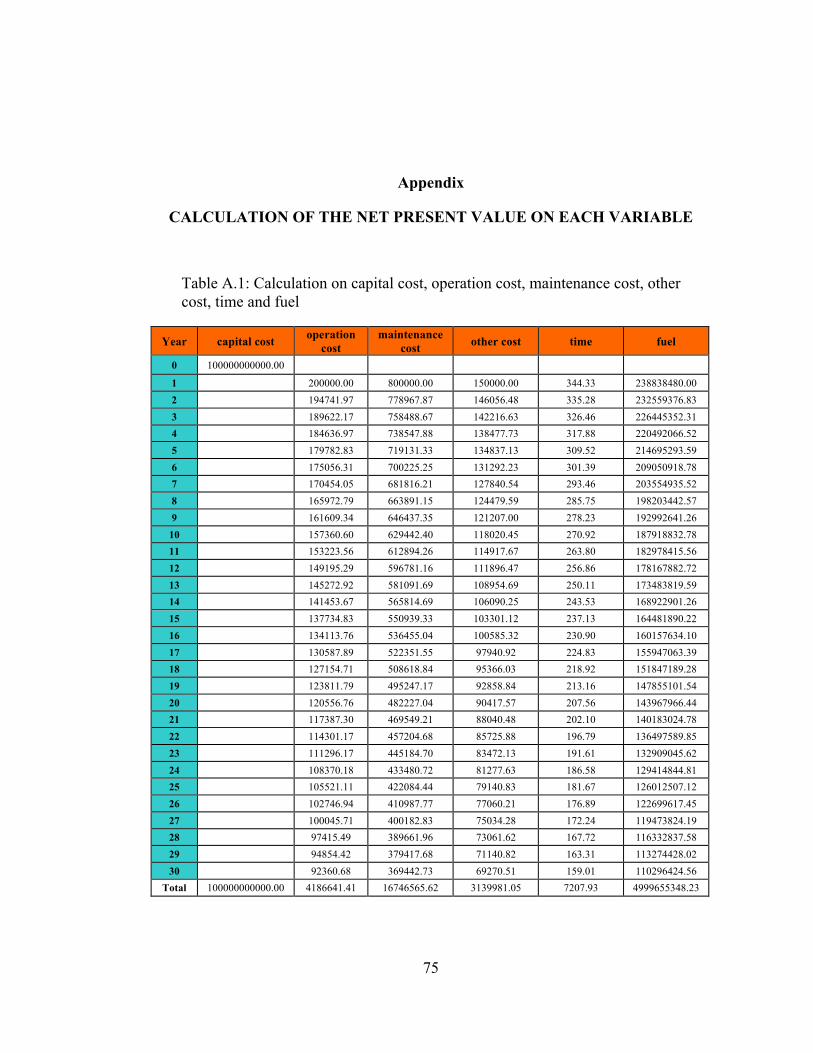
75
Appendix
CALCULATION OF THE NET PRESENT VALUE ON EACH VARIABLE
Table A.1: Calculation on capital cost, operation cost, maintenance cost, other cost, time and fuel
Year capital cost operation cost
maintenance cost other cost time fuel
0 100000000000.00
1 200000.00 800000.00 150000.00 344.33 238838480.00 2 194741.97 778967.87 146056.48 335.28 232559376.83 3 189622.17 758488.67 142216.63 326.46 226445352.31 4 184636.97 738547.88 138477.73 317.88 220492066.52 5 179782.83 719131.33 134837.13 309.52 214695293.59 6 175056.31 700225.25 131292.23 301.39 209050918.78 7 170454.05 681816.21 127840.54 293.46 203554935.52 8 165972.79 663891.15 124479.59 285.75 198203442.57 9 161609.34 646437.35 121207.00 278.23 192992641.26
10 157360.60 629442.40 118020.45 270.92 187918832.78 11 153223.56 612894.26 114917.67 263.80 182978415.56 12 149195.29 596781.16 111896.47 256.86 178167882.72 13 145272.92 581091.69 108954.69 250.11 173483819.59 14 141453.67 565814.69 106090.25 243.53 168922901.26 15 137734.83 550939.33 103301.12 237.13 164481890.22 16 134113.76 536455.04 100585.32 230.90 160157634.10 17 130587.89 522351.55 97940.92 224.83 155947063.39 18 127154.71 508618.84 95366.03 218.92 151847189.28 19 123811.79 495247.17 92858.84 213.16 147855101.54 20 120556.76 482227.04 90417.57 207.56 143967966.44 21 117387.30 469549.21 88040.48 202.10 140183024.78 22 114301.17 457204.68 85725.88 196.79 136497589.85 23 111296.17 445184.70 83472.13 191.61 132909045.62 24 108370.18 433480.72 81277.63 186.58 129414844.81 25 105521.11 422084.44 79140.83 181.67 126012507.12 26 102746.94 410987.77 77060.21 176.89 122699617.45 27 100045.71 400182.83 75034.28 172.24 119473824.19 28 97415.49 389661.96 73061.62 167.72 116332837.58 29 94854.42 379417.68 71140.82 163.31 113274428.02 30 92360.68 369442.73 69270.51 159.01 110296424.56
Total 100000000000.00 4186641.41 16746565.62 3139981.05 7207.93 4999655348.23

76
Table A.2: Calculation on safety, gas emission, greenhouse gas, noise and economic impact
Year safety gas emission greenhouse gas noise economic
impact 0 1 116580000.00 1292677722.00 35490.00 1068138.66 10000.00 2 113515092.50 1258693010.71 34556.96 1040057.12 9737.10 3 110530761.93 1225601763.11 33648.45 1012713.85 9481.11 4 107624889.90 1193380489.88 32763.83 986089.43 9231.85 5 104795413.73 1162006319.26 31902.46 960164.98 8989.14 6 102040324.96 1131456980.78 31063.74 934922.08 8752.82 7 99357667.92 1101710789.46 30247.07 910342.83 8522.70 8 96745538.39 1072746630.44 29451.87 886409.76 8298.64 9 94202082.17 1044543943.95 28677.58 863105.90 8080.47
10 91725493.84 1017082710.76 27923.64 840414.71 7868.03 11 89314015.42 990343437.94 27189.52 818320.06 7661.18 12 86965935.17 964307145.02 26474.70 796806.29 7459.76 13 84679586.34 938955350.56 25778.68 775858.13 7263.65 14 82453346.00 914270058.97 25100.95 755460.69 7072.68 15 80285633.88 890233747.78 24441.05 735599.50 6886.74 16 78174911.28 866829355.19 23798.49 716260.47 6705.69 17 76119679.92 844040267.95 23172.82 697429.86 6529.39 18 74118480.93 821850309.59 22563.60 679094.31 6357.74 19 72169893.80 800243728.91 21970.40 661240.81 6190.59 20 70272535.35 779205188.81 21392.80 643856.68 6027.84 21 68425058.76 758719755.42 20830.38 626929.58 5869.37 22 66626152.64 738772887.46 20282.74 610447.50 5715.06 23 64874540.06 719350425.96 19749.51 594398.74 5564.81 24 63168977.66 700438584.18 19230.29 578771.89 5418.51 25 61508254.78 682023937.86 18724.72 563555.89 5276.06 26 59891192.58 664093415.64 18232.44 548739.91 5137.35 27 58316643.22 646634289.81 17753.11 534313.44 5002.29 28 56783489.01 629634167.30 17286.38 520266.26 4870.77 29 55290641.69 613080980.81 16831.92 506588.37 4742.72 30 53837041.56 596962980.35 16389.40 493270.08 4618.03
Total 2440393275.39 27059890375.87 742919.52 22359567.80 209332.07
Table A.3: Calculation on costs, benefits, net present value and cost-benefit ratio
Costs 100024073188.08 Net present value -65500815161.26 Benefits 34523258026.82 Cost-benefit ratio 0.345149492
Related Documents