SIDDIQI & COMPANY Cost & Management Accountants Suit # 147, First Floor, Haroon Shopping Emporium, Sector 15-A/1, North Karachi-75850 (Pakistan). Tel: (92-21) 36971814 - 36931527, Fax (92-21) 36931527, E-mail <[email protected]> Cost Auditors’ Report For the year ended June 30, 2011 PIONEER CEMENT LTD.

Welcome message from author
This document is posted to help you gain knowledge. Please leave a comment to let me know what you think about it! Share it to your friends and learn new things together.
Transcript

SIDDIQI & COMPANYCost & Management Accountants
Suit # 147, First Floor, Haroon Shopping Emporium, Sector 15-A/1, North Karachi-75850 (Pakistan).
Tel: (92-21) 36971814 - 36931527, Fax (92-21) 36931527, E-mail <[email protected]>
Cost Auditors’ ReportFor the year ended June 30, 2011
PIONEER
CEMENT LTD.

Pioneer Cement Limited Cost Audit Report, 2011
COST AUDITORS’ REPORT, 2010-2011 PIONEER CEMENT LIMITED
INDEX
Section – 1 Page # 1. Corporate Information 2. The Company & Its Manufacturing Process
Section – 2
Cost auditors’ Report 1. Capacity 2 2. Costing Accounting System 2 3. Production 2 4. Raw Material 3 5. Wages & Salaries 4 6. Stores & Spare Parts 6 7. Depreciation 6 8. Overheads 7 9. Royalty / Technical Aid Payment 9 10. Abnormal Non-Recurring Features 9 11. Cost of Production 10 12. Sales 10 13. Profitability 11 14 Cost Auditors’ Observation and Conclusions 11 15. Reconciliations with Financial Statements 13 16. Cost Statements 13 17. Miscellaneous 13 Schedules (1 to 3) Statement of Capacity of Production Statement of Stock in Trade
Section – 3 Departmental Cost Statements Annexures 1. Quarry (Limestone & Clay/Shale) I 2. Transportation (Limestone & Clay/Shale) II 3. Crushing (Limestone & Clay/Shale) III 4. Stock Hall Storage IV 5. Raw Mill V 6. Kiln VI 7. Grinding (Cement) VII 8. Packing & Storage VIII 9. Air Compressing IX 10. Power Generated / Purchased and Consumed X 11. Factory General XI 12. Summary of Cost Report XII

Pioneer Cement Limited Cost Audit Report, 2011
01. CORPORATE INFORMATION BOARD OF DIRECTORS
Asif H. Bukhari Aly Khan
Cevdet DAL Etrat Hussain Rizvi
Omer Adil Jaffar Saleem Shahzada
William Gordon Rodgers Javed Haider (NBP)
Rafique Dawood (FDIB) Syed Mazher Iqbal (MD&CEO)
AUDIT COMMITTEE Chairman
Rafique Dawood (FDIB)
Members Aly Khan
William Gordon Rodgers Saleem Shahzada
Javed Haider (NBP)
CHIEF FINANCIAL OFFICER Amjad Waqar
COMPANY SECRETARY Syed Anwar Ali
CHIEF INTERNAL AUDITOR Jamal-ud-Din
SENIOR MANAGEMENT Shaikh Javed Elahi
Executive Director Operations Rizwan Butt
GM Marketing & Sales M. Saleem Waheed
GM M.I.S
STATUTORY AUDITORS Ernst & Young Ford Rhodes Sidat Hyder
Chartered Accountants
COST AUDITORS SIDDIQI & COMPANY
Cost & Management Accountants
Continue……
Pioneer Cement Limited Cost Audit Report, 2011
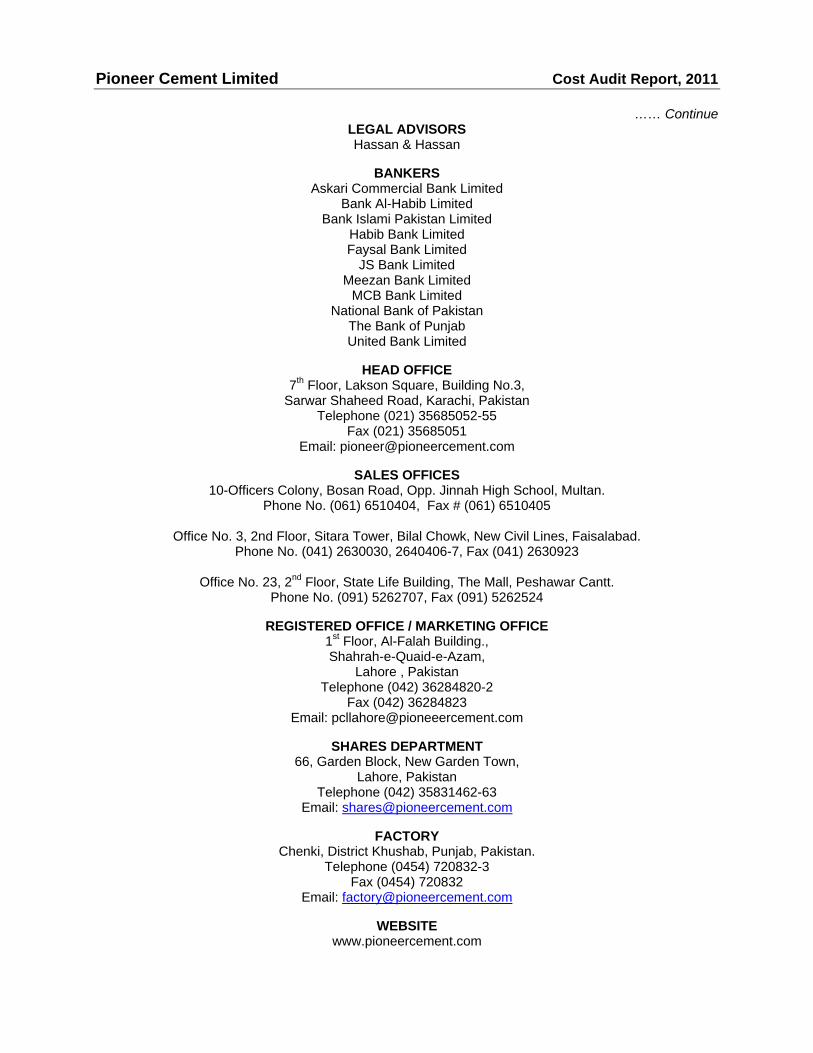
…… Continue LEGAL ADVISORS Hassan & Hassan
BANKERS Askari Commercial Bank Limited
Bank Al-Habib Limited Bank Islami Pakistan Limited
Habib Bank Limited Faysal Bank Limited
JS Bank Limited Meezan Bank Limited
MCB Bank Limited National Bank of Pakistan
The Bank of Punjab United Bank Limited
HEAD OFFICE 7th Floor, Lakson Square, Building No.3,
Sarwar Shaheed Road, Karachi, Pakistan Telephone (021) 35685052-55
Fax (021) 35685051 Email: [email protected]
SALES OFFICES 10-Officers Colony, Bosan Road, Opp. Jinnah High School, Multan.
Phone No. (061) 6510404, Fax # (061) 6510405
Office No. 3, 2nd Floor, Sitara Tower, Bilal Chowk, New Civil Lines, Faisalabad. Phone No. (041) 2630030, 2640406-7, Fax (041) 2630923
Office No. 23, 2nd Floor, State Life Building, The Mall, Peshawar Cantt.
Phone No. (091) 5262707, Fax (091) 5262524
REGISTERED OFFICE / MARKETING OFFICE 1st Floor, Al-Falah Building., Shahrah-e-Quaid-e-Azam,
Lahore , Pakistan Telephone (042) 36284820-2
Fax (042) 36284823 Email: [email protected]
SHARES DEPARTMENT 66, Garden Block, New Garden Town,
Lahore, Pakistan Telephone (042) 35831462-63
Email: [email protected]
FACTORY Chenki, District Khushab, Punjab, Pakistan.
Telephone (0454) 720832-3 Fax (0454) 720832
Email: [email protected]
WEBSITE www.pioneercement.com

Pioneer Cement Limited Cost Audit Report, 2011
02. THE COMPANY
& MANUFACTURING PROCESS
1. THE COMPANY
The company was incorporated in Pakistan on February 09, 1986 as a public limited company and is quoted on all stock exchanges in Pakistan. Its main business activity is manufacturing and sale of cement.
The company commenced its operation with an installed capacity of 2,000 tons per day clinker. During 2005, the capacity was optimized to 2,350 tons per day. During the year ended June 30, 2006, another production line of 4,300 tons per day clinker capacity was added which started commercial operations from April 2006. This brought up capacity at 6,650 tons per day.
2. OPERATIONS
Basically the main objective of the company is to manufacture and sell Portland Cement.
3. MANUFACTURING PROCESS
The company is using the Dry Process Technology for manufacturing of cement. It owns leased lime stone quarries. The process consists of the following departments:-
(i) Lime Stone / Clay / Shale Quarries and Transportation
(ii) Crushing
(iii) Raw Mill (Raw Meal)
(iv) Kiln
(v) Grinding (Cement Mill)
(vi) Packing & Storage
The major raw materials include:
(i) Lime Stone
(ii) Clay / Shale
(iii) Gypsum
Packing – Paper / Polyproplyene bags are used in packing.
4. FACTORY LOCATION
The company’s cement manufacturing plant is located in Chenki, District Khushab, Punjab.
Pioneer Cement Limited Cost Audit Report, 2011
COST AUDITORS’ REPORT
We, SIDDIQI & COMPANY, Cost & Management Accountants having been appointed to conduct an audit of cost accounts of PIONEER CEMENT LIMITED, have examined the books of account and the statement prescribed under clause (e) of sub-section 230 of the Companies Ordinance, 1984 and the other relevant records for the year ended June 30, 2011, and report that:-
1. We have obtained all the information and explanations which to the best of our knowledge and belief were necessary for the purpose of this audit.
2. In our opinion:
(a) proper cost accounting records as required by clause (e) of sub-section (1) of section 230 of the Companies Ordinance, 1984 (XLVII of 1984), and as required by these rules, have been kept by the company;
(b) proper returns, statements and schedules for the purpose of audit of cost accounts have been received from offices of the company situated in Pakistan;
(c) the said books and records give the information required by the rules in the manner so required; and
3. In our opinion and, subject to best of our information:-
(a) the annexed statement of capacity utilization and stock-in-trade are in agreement with the books of account of the company and exhibit true and fair view of the company’s affairs; and
(b) cost accounting records have been properly kept so as to give a true and fair view of the cost of production, processing, manufacturing and marketing of the under mentioned products of the company, namely,
– Ordinary Portland Cement
The matters contained in the ANNEXED Forms are part of this report.
SIDDIQI & COMPANY Cost & Management Accountants
Karachi:

Pioneer Cement Limited Cost Audit Report, 2011
1. CAPACITY (Tonne)
(a) Annual Utilized % of Rated
Clinker: Capacity Operational Capacity
– Line-I (300 days x 2,350 T/D) 419,679 60%– Line-II (300 days x 4,300 T/D) 769,619 60%Total 1,189,298 60%
–
(b) The company is engaged in the manufacturing and sale of cement.
2. COST ACCOUNTING SYSTEM
–
i)ii)iii)iv)v)vi)
3. PRODUCTIONQty. in Tonne
(a)
– Clinker 2011 2010 Tonne %– Line-I
Ordinary Portland 419,679 469,240 (49,561) (11%)
– Line-IIOrdinary Portland 769,619 693,990 75,629 11%
1,189,298 1,163,230 26,068 2%
– CementOrdinary Portland 1,284,927 1,266,968 17,959 1%
(b)
(c) There was no addition in production capacity in the last two years.
The company has not utilized its full production capacity due to certain plant modifications and low demanddue to recessionary condition.
1,995,000
ProductionY e a r s
Increase / Decrease
Lime stone / Clay / Shale Quarries and TransportationCrushingRaw MillKilnGrinding (Cement Mill)
Annual Licensed / Installed
Capacity
705,0001,290,000
Manufacturing of cement is a continuous process, therefore, the company uses process cost accountingsystem as prescribed by SECP as per Cement Industry (Cost Accounting Records) Order, 1994.
The company has classified whole manufacturing process into six major stages / departments for thepurpose of maintaining cost accounting records shown as under:
The company is operating EXCEL based in house software, which generates cost statements relating to sixstages / departments and allocates cost thereon.
The plant design facilitates production of the various types of cement as per production requirements withinthe installed capacity limits.
Packing & Storage
[ 2 ]

Pioneer Cement Limited Cost Audit Report, 2011
4. RAW MATERIAL
(a) Major Raw Materials Consumed
Quantity Value Rate per Quantity Value Rate per Quantity Value Rate per(Tonne) Rs. in '000 Tonne (Tonne) Rs. in '000 Tonne (Tonne) Rs. in '000 Tonne
Limestone 1,535,994 175,452 114 1,506,361 160,803 107 1,501,810 139,133 93
Shale / Clay 188,684 13,899 74 182,731 11,539 63 190,062 11,133 59
Laterite 70,533 46,529 660 52,694 36,072 685 66,207 35,879 542
Bauxite 24,078 14,369 597 20,405 12,370 606 11,472 6,670 581
Gypsum 55,742 29,093 522 62,255 29,213 469 42,657 15,573 365
Fly Ash - - - - - - 809 307 379
Salica Sand - - - 774 500 646 - - -
Additives 34,393 3,929 114 40,061 4,276 107 15,639 1,375 88
Direct raw material cost 283,271 254,773 210,070
Add / (less):Material handling & other cost 13,098 11,658 11,669
Duty draw back on exports (9,409) (3,059) (1,530)
Total cost of raw material consumed 286,960 263,372 220,209
2011 2010 2009
[ 3 ]

Pioneer Cement Limited Cost Audit Report, 2011
(b) Major Raw Materials consumption per unit of production compared with standard requirements.
BudgetStandard 2011 2010 2009
Tonne Tonne Tonne Tonne 2011 2010 2009
Limestone – Clinker 1.31 1.29 1.29 1.30 (1.53) (1.53) (0.76) Clay / Shale – Clinker 0.16 0.16 0.16 0.17 (0.00) - 6.25 Laterite/Iron Ore – Clinker 0.04 0.06 0.05 0.06 50.00 25.00 50.00 Bauxite – Clinker 0.02 0.02 0.02 0.01 (0.00) - (50.00)
TOTAL – Clinker 1.53 1.53 1.52 1.54 0.00 (0.65) 0.65
Gypsum – Cement 0.05 0.04 0.05 0.04 (20.00) - (20.00)
Additives – Cement 0.04 0.03 0.03 0.02 (25.00) (25.00) (50.00)
(c) Explanation of Variances
– The variances from budget / standards are attributed to chemical contents of raw materials.
(d) Method of Accounting
–
–
–
5. WAGES AND SALARIES
(a) Total wages and salaries paid for all categories of employees
2011 2010 2009Rs. in '000 Rs. in '000 Rs. in '000 Base 2010 Base 2009
– Direct labour cost on production 136,123 137,915 137,841 (1.30) (1.25)
– Indirect labour cost on production 64,173 66,528 57,219 (3.54) 12.15
– Total Direct & Indirect Labour Cost 200,296 204,443 195,060 (2.03) 2.68
– Employees' cost on administration 32,709 52,048 69,126 (37.16) (52.68)
– Employees' cost on selling and distribution 24,701 22,730 31,425 8.67 (21.40)
Total employees cost 257,706 279,221 295,611 (7.71) (12.82)
– Employees cost substantially decreased during the year under review.
Description% Increase / (Decrease)
as compared to Budget Standard
% Increase / (Decrease)
ACTUAL
The company is maintaining raw material records using weighted average cost.
Limestone and shale / clay are extracted from leased mines.
Laterite / Iron ore, Bauxite and Gypsum are purchased from open market. The quantities and values arerecorded in the stores ledgers and general ledgers from receiving reports.
[ 4 ]

Pioneer Cement Limited Cost Audit Report, 2011
(b) Salaries and perquisites of chief executive, directors and executivesRs. in '000
. 2011 2010 2011 2010Total number 1 1 17 17
Basic salary 3,372 3,563 16,661 20,845 Contirbution to provident fund and gratutiy 337 84 1,327 1,393 Allowances & benefits 3,151 5,244 16,925 21,111
6,860 8,891 34,913 43,349
–
– No remuneration is paid / payable to the directors of the company.
(c) Total man-days of direct labour Worked Available % Worked
Available: 300 days x 461 workers = 138,300 days 99,115 138,300 72
Worked: 215 days x 461 workers = 99,115 days
(d) Average number of production workers employed 2011 2010
461 488
(e) Direct labour cost per tonne2011 2010 2009 Base 2010 Base 2009
Direct Labour Cost (Rs. in '000) 136,123 137,915 137,841 (1) (1)
Production in Tonne - Cement 1,284,927 1,266,968 1,033,587 1 24
Cost per Tonne (Rs. / tonne) 106 109 133 (3) (21)
(f)
(g) Comments on Incentives Scheme– Defined Benefit Plan
The company operates under mentioned gratuity schemes:
– Contractual WorkersThe company operates unfunded gratuity scheme for its contractual workers.
– Defined Contribution Plan
– Compensated Absences
There is insignificant variance in labour cost.
Accrual for compensated absences is made to the extent of the value of accrued absences of the employees at thebalance sheet date using their current salary levels.
The company also operates an approved contributory provident fund for all its permanent employees and equalmonthly contributions are made both by the company and the employees of at the rate of 10 percent of basicsalary.
Chief Executive Executives
% of Increase/(Decrease)
% of Increase/(Decrease)
(6)
(Rupees in '000')
In addition, the chief executive and all the executives of the company have been provided with free use ofcompany owned and maintained cars with other benefits in accordance with their entitlements as per rules of thecompany.
[ 5 ]

Pioneer Cement Limited Cost Audit Report, 2011
6. STORES AND SPARE PARTSIncrease /
(a) Expenditure per unit of output 2011 2010 (Decrease) %
Stores & Spares (Rs. in '000) 141,171 163,565 (14)Production (Qty. in tonne) 1,284,927 1,266,968 1Cost per tonne (Rs. / tonne) 110 129 (15)
–
(b) System of stores
–
–
(c) Proportion of closing inventory of stores representing items which have not moved for over twenty four months.
–
7. DEPRECIATION
(a) Method of depreciation
–
–
–
(b) Basis of allocation of depreciation on common assets to the different departments.
Depreciation on common assets is allocated as under:Rs. in '000 % age Rs. in '000 % age
(i) Cost of Sales 365,976 99 387,256 99 (ii) Admin. & General 2,267 1 2,202 1 (iii) Selling & Distribution 2,422 1 2,385 1
370,665 100 391,843 100
(c) Basis of charging depreciation to cost of products
– The depreciation is allocated to cost of production on the value of assets employed.
Maintenance and normal repairs are charged to profit and loss account as and when incurred. Major renewals andimprovements are capitilized. Gains and losses on disposals of assets, if any, are included in the profit and lossaccount.
2011
These are valued at lower of weighted average cost and net realizable value. Cost comprises invoice value andother direct costs. Items in transit are valued at cost comprising invoice value plus other charges incurred thereon.
Net realizable value is the estimated selling price in the ordinary course of business less estimated costs necessaryto make a sale.
As stated by the management fixed assets register is maintained but its physical verification was not carried out.
Depreciation is calculated on straight line method except plant and machinery and coal firing system on whichdepreciation is charged on the basis of units of production method. Depreciation on additions is charged from themonth in which the asset is available for use and on disposals upto the month of disposal.
There are no slow moving items as such except necessary long term use items of stores / spares to meetemergency requirements compatible with size of cement production of the company.
Per tonne cost of stores and spares has decreased during the year under review.
2010
[ 6 ]

Pioneer Cement Limited Cost Audit Report, 2011
8. OVERHEADS
(a) Total amounts of the overheads2011 2010 2009
Rs. in '000 Rs. in '000 Rs. in '000
(i) Factory 446,449 467,329 449,846
(ii) Administration 52,321 78,835 97,654
(iii) Selling & distribution 150,576 158,842 359,975
(iv) Financial charges 357,916 392,658 451,465
1,007,262 1,097,664 1,358,940
(i) Factory OverheadsBased on Based on
Rs. in '000 Rs. in '000 Rs. in '000 2010 2009Travelling and conveyance 25,558 26,114 27,318 (2) (6) Insurance 8,592 10,120 10,236 (15) (16) Repairs & maintenance 32,807 42,318 37,935 (22) (14) Communication 640 1,815 2,324 (65) (72) Depreciation 365,976 376,054 362,299 (3) 1 Other manufacturing expenses 12,876 10,908 9,734 18 32
446,449 467,329 449,846 (4) (1)
– Factory overheads decreased mainly due to decrease in repair & maintenance and depreciation.
(ii) Administration OverheadsBased on Based on
Rs. in '000 Rs. in '000 Rs. in '000 2010 2009Salaries, wages and benefits 32,709 52,048 69,126 (37) (53) Travelling and conveyance 1,022 1,807 2,095 (43) (51) Vehicle running expenses 3,087 3,551 4,150 (13) (26) Communication 985 1,696 2,232 (42) (56) Printing and stationery 838 1,352 1,528 (38) (45) Utilities 1,538 3,574 3,809 (57) (60) Repair & maintenance 1,217 1,737 1,667 (30) (27) Rent, rates and taxes 246 959 1,846 (74) (87) Legal and professional charges 4,216 3,081 1,835 37 130 Insurance 309 428 799 (28) (61) Auditors' remuneration 1,785 2,695 3,381 (34) (47) Fee and subscription 1,664 3,081 548 (46) 204 Entertainment 301 539 707 (44) (57) Depreciation 2,267 2,202 3,106 3 (27) Amortization 109 - - 100 - Others 28 85 825 (67) (97)
52,321 78,835 97,654 (34) (46)
– The overall admin. overheads decreased except increase in legal & professional charges as compared to lastyear.
2011 2010 2009
% Increase / (Decrease)200920102011
% Increase / (Decrease)
[ 7 ]

Pioneer Cement Limited Cost Audit Report, 2011
(iii) Selling and Distribution Overheads
Based on Based onRs. in '000 Rs. in '000 Rs. in '000 2010 2009
Salaries, wages and benefits 24,701 22,730 31,425 9 (21) Travelling and conveyance 388 378 722 3 (46) Vehicle running expenses 2,427 2,101 3,474 16 (30) Communication 1,179 1,513 2,335 (22) (50) Printing and stationery 565 586 1,454 (4) (61) Rent, rates and taxes 1,478 1,803 1,789 (18) (17) Utilities 1,009 1,272 1,457 (21) (31) Repairs & maintenance 1,275 792 1,597 61 (20) Legal and professional charges 6,926 5,921 5,038 17 37 Insurance 296 490 830 (40) (64) Fee & subscription 407 433 1,661 (6) (75) Advertisements / sales promotion 3,071 1,727 2,137 78 44 Frieght & handling Charges 103,946 116,138 301,599 (10) (66) Entertainment 486 573 738 (15) (34) Depreciation 2,422 2,385 3,719 2 (35)
150,576 158,842 359,975 (5) (58)
–
(iv) Financial Charges
Based on Based onRs. in '000 Rs. in '000 Rs. in '000 2010 2009
– Mark-up on long term financing / loans / lease / profit on murhaba financing 202,389 270,590 361,790 (25) (44)
– Interest on long / short term finances 142,584 106,804 74,974 34 90 – Fee, charges and commission 12,943 15,264 14,701 (15) (12)
357,916 392,658 451,465 (9) (21)
–
(b) Reasons for any significant variances
– Reasons are already stated against each para shown above.
(c) Basis of allocation of overheads
– The allocation was made on activity based on %age basis.
% Increase / (Decrease)20092011 2010
The financial charges decreased due to decrease in markup on long term finances / loans.
Selling and distribution overheads decreased mainly due to decrease in frieght and handling charges whichrelates directly to exports. However, advertisement / sales promotion expenses increased as compared toprevious years.
% Increase / (Decrease)2011 2010 2009
[ 8 ]
Pioneer Cement Limited Cost Audit Report, 2011
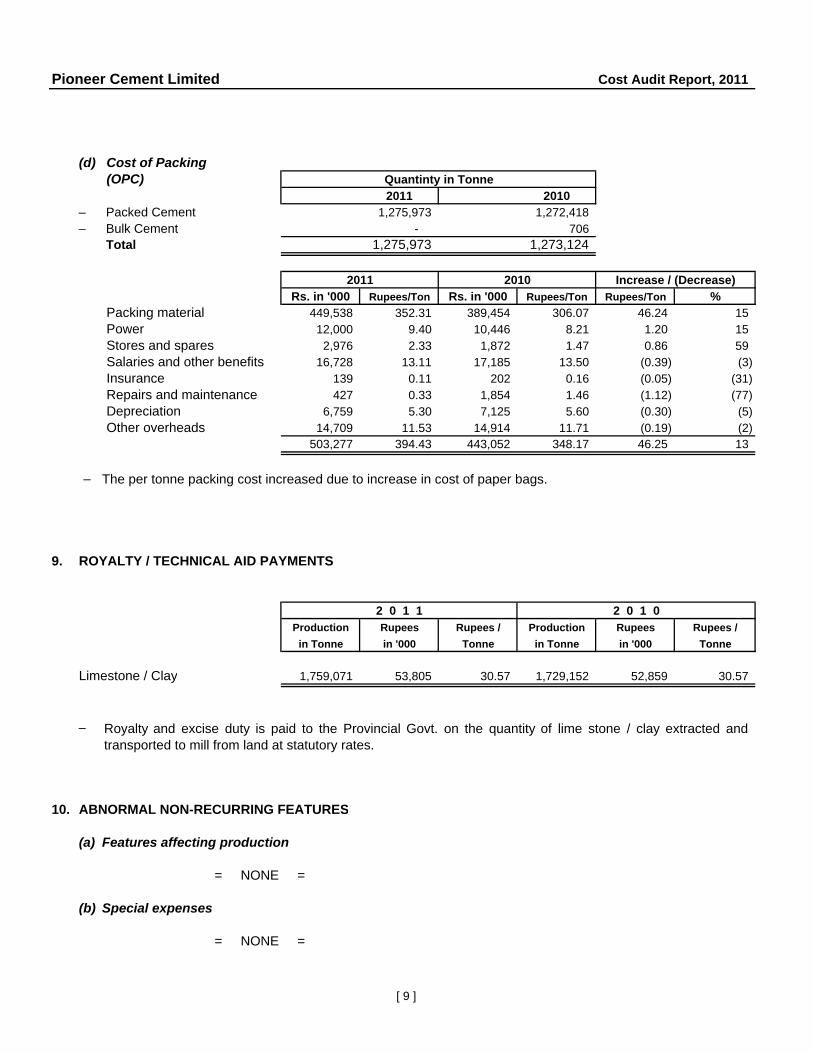
(d) Cost of Packing(OPC)
2011 2010– Packed Cement 1,275,973 1,272,418 – Bulk Cement - 706
Total 1,275,973 1,273,124
Rs. in '000 Rupees/Ton Rs. in '000 Rupees/Ton Rupees/Ton %Packing material 449,538 352.31 389,454 306.07 46.24 15 Power 12,000 9.40 10,446 8.21 1.20 15 Stores and spares 2,976 2.33 1,872 1.47 0.86 59 Salaries and other benefits 16,728 13.11 17,185 13.50 (0.39) (3) Insurance 139 0.11 202 0.16 (0.05) (31) Repairs and maintenance 427 0.33 1,854 1.46 (1.12) (77) Depreciation 6,759 5.30 7,125 5.60 (0.30) (5) Other overheads 14,709 11.53 14,914 11.71 (0.19) (2)
503,277 394.43 443,052 348.17 46.25 13
–
9. ROYALTY / TECHNICAL AID PAYMENTS
Production Rupees Rupees / Production Rupees Rupees /in Tonne in '000 Tonne in Tonne in '000 Tonne
Limestone / Clay 1,759,071 53,805 30.57 1,729,152 52,859 30.57
–
10. ABNORMAL NON-RECURRING FEATURES
(a) Features affecting production
= NONE =
(b) Special expenses
= NONE =
Increase / (Decrease)2011 2010
2 0 1 1 2 0 1 0
The per tonne packing cost increased due to increase in cost of paper bags.
Quantinty in Tonne
Royalty and excise duty is paid to the Provincial Govt. on the quantity of lime stone / clay extracted andtransported to mill from land at statutory rates.
[ 9 ]

Pioneer Cement Limited Cost Audit Report, 2011
11. COST OF PRODUCTION(As per Schedule-1 attached)
Increase /Qty. in Rs. in Rs. Qty. in Rs. in Rs. (Decrease)Tonne 000 Per Ton Tonne 000 Per Ton % Rs. P/Ton
Cement
OPC 1,284,927 4,554,606 3,545 1,266,968 3,934,572 3,106 14
Clinker consumed for sale
OPC 2,490 7,146 2,870 440 1,106 2,514 14
4,561,752 3,935,678
– The per ton cost of production increased mainly on account of increase in coal and electricity prices.
12. SALES (As per Schedule-2 attached)
Increase /Qty. in Rs. in Rs. Qty. in Rs. in Rs. (Decrease)Tonne 000 Per Ton Tonne 000 Per Ton % Rs. P/Ton
Local– OPC 1,003,048 4,315,511 4,302 1,081,500 3,196,103 2,955 46 – Clinker - - - 200 579 - -
1,003,048 4,315,511 4,302 1,081,700 3,196,682 2,955 46
Export– OPC 272,925 950,764 3,484 191,624 675,279 3,524 (1) – Clinker 2,490 6,613 2,656 240 873 3,638 (27)
275,415 957,377 3,476 191,864 676,152 3,524 (1)
Total 1,278,463 5,272,888 4,124 1,273,564 3,872,834 3,041 36
– Average selling price per ton of cement increased as compared to previous year.
– Cement was exported to Aghanistan, India and Madagascar.
– Clinker was exported to India.
2 0 1 1 2 0 1 0
2 0 1 1 2 0 1 0
[ 10 ]

Pioneer Cement Limited Cost Audit Report, 2011
13. PROFITABILITY (As per Schedule-3 attached)
Increase /Qty. in Rs. in Rs. Qty. in Rs. in Rs. (Decrease)
Profit / (Loss) Tonne 000 Per Ton Tonne 000 Per Ton % Rs. P/TonLocal– OPC 1,003,048 318,600 318 1,081,500 (726,729) (672) (147)
– Clinker - - - 200 (298) (1,490) -
1,003,048 318,600 318 1,081,700 (727,027) (672) (147)
Export– OPC 272,925 (246,243) (902) 191,624 (132,562) (692) 30
– Clinker 2,490 (533) (214) 240 270 1,125 -
275,415 (246,776) (896) 191,864 (132,292) (690) 30
Total 1,278,463 71,824 56 1,273,564 (859,319) (675) (108)
–
14. COST AUDITORS' OBSERVATIONS AND CONCLUSIONS
(a) Matters which appear to him to be clearly wrong in principle or apparently unjustifiable.
–
(b) Cases where the company funds have been used in a negligent or inefficient manner.
= N O N E =
(c) Factors which could have been controlled but have not been done resulting in increase in the costof production.
= N O N E =
The company earned profit of Rs. 71.824 million as against loss of Rs. 859.319 million last year due to betterselling prices in the domestic market.
No such matters have so far come to our notice except that current liabilities of Rs. 4,404,220 million againstcurrent assets Rs. 1,184,191 million which shows that current liabilties increased by Rs. 3,220,029 (OR 272%)over the current assets. The current ratio is negative which speaks of weak liquidity position of the company.
2 0 1 1 2 0 1 0
[ 11 ]
Pioneer Cement Limited Cost Audit Report, 2011
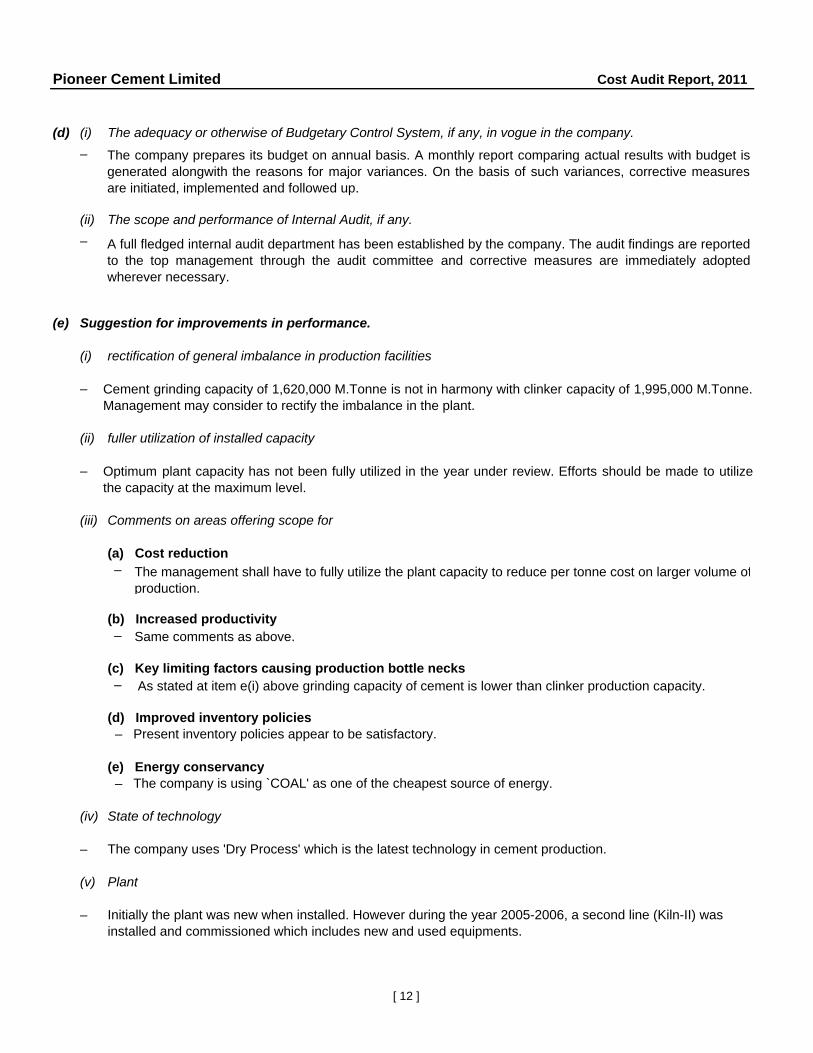
(d) (i) The adequacy or otherwise of Budgetary Control System, if any, in vogue in the company.–
(ii) The scope and performance of Internal Audit, if any.–
(e) Suggestion for improvements in performance.
(i) rectification of general imbalance in production facilities
–
(ii) fuller utilization of installed capacity
–
(iii) Comments on areas offering scope for
(a) Cost reduction–
(b) Increased productivity–
(c) Key limiting factors causing production bottle necks–
(d) Improved inventory policies – Present inventory policies appear to be satisfactory.
(e) Energy conservancy – The company is using `COAL' as one of the cheapest source of energy.
(iv) State of technology
– The company uses 'Dry Process' which is the latest technology in cement production.
(v) Plant
– Initially the plant was new when installed. However during the year 2005-2006, a second line (Kiln-II) wasinstalled and commissioned which includes new and used equipments.
Cement grinding capacity of 1,620,000 M.Tonne is not in harmony with clinker capacity of 1,995,000 M.Tonne.Management may consider to rectify the imbalance in the plant.
Optimum plant capacity has not been fully utilized in the year under review. Efforts should be made to utilizethe capacity at the maximum level.
The company prepares its budget on annual basis. A monthly report comparing actual results with budget isgenerated alongwith the reasons for major variances. On the basis of such variances, corrective measuresare initiated, implemented and followed up.
A full fledged internal audit department has been established by the company. The audit findings are reportedto the top management through the audit committee and corrective measures are immediately adoptedwherever necessary.
The management shall have to fully utilize the plant capacity to reduce per tonne cost on larger volume ofproduction.
Same comments as above.
As stated at item e(i) above grinding capacity of cement is lower than clinker production capacity.
[ 12 ]

Pioneer Cement Limited Cost Audit Report, 2011
15. RECONCILIATIONS WITH FINANCIAL STATEMENTS
–
16. COST STATEMENTS
–
17. MISCELLANEOUS
–
–
SIDDIQI & COMPANYCost & Management Accountants
Karachi :
The cost accounts are reconciled with audited financial accounts for the year ended June 30, 2011 as perreconciliation statement annexed herewith.
Copies of all cost statements on the formats prescribed by Securities and Exchange Commission of Pakistanunder clause (e) of sub-section (1) of section 230 of the Companies Ordinance, 1984, duly authenticated by theChief Executive and Chief Financial Officer of the company, and verified by us are appended to the report.
Figures have been rounded off to the nearest thousand.
Previous year's figures have been re-arranged and regrouped where necessary to facilitate comparison.
[ 13 ]

Pioneer Cement Limited Cost Audit Report, 2011
Schedule-1
a) Quantitative Data CEMENT CLINKEROPC OPC
Production (Tonne) 1,284,927 2,490 1,287,417
b) Cost Elements CEMENT CLINKEROPC OPC
Cost of sales 4,524,016 7,146 4,531,162
Inventory adjustments (finished goods) 30,590 - 30,590
Cost of goods manufactured 4,554,606 7,146 4,561,752
a) Quantitative Data CEMENT CLINKEROPC OPC
Production (Tonne) 1,266,968 440 1,267,408
b) Cost Elements CEMENT CLINKEROPC OPC
Cost of sales 3,952,708 1,106 3,953,814
Inventory adjustments (finished goods) (18,136) - (18,136)
Cost of goods manufactured 3,934,572 1,106 3,935,678
Rupees in '000
TOTAL
TOTAL
Rupees in '000
COST OF PRODUCTION
TOTAL
Y E A R : 2 0 1 1
Y E A R : 2 0 1 0
TOTAL
Quantity in Tonne
Quantity in Tonne
[ 14 ]

Pioneer Cement Limited Cost Audit Report, 2011
Schedule-2
a) Quantitative DataOPC Clinker OPC Clinker
Packed Cement / Clinker 1,003,048 - 272,925 2,490 1,278,463 Bulk Cement - - - - -
Total quantity sold 1,003,048 - 272,925 2,490 1,278,463
b) Net Sales ValueOPC Clinker OPC Clinker
Gross Sales 5,974,308 - 960,701 6,613 6,941,622 Less:
Federal excise duty 702,134 - - - 702,134 Sales tax 858,383 - - - 858,383 Special excise duty 67,023 - - - 67,023 Discount / Commission 31,257 - 9,937 - 41,194
1,658,797 - 9,937 - 1,668,734 Net sales realization 4,315,511 - 950,764 6,613 5,272,888
a) Quantitative DataOPC Clinker OPC Clinker
Packed Cement / Clinker 1,080,794 200 191,624 240 1,272,858 Bulk Cement 706 - - - 706
Total quantity sold 1,081,500 200 191,624 240 1,273,564
b) Net Sales ValueOPC Clinker OPC Clinker
Gross Sales 4,648,434 840 679,076 873 5,329,223 Less:
Federal excise duty 757,050 140 - - 757,190 Sales tax 636,719 115 - - 636,834 Special excise duty 32,224 6 - - 32,230 Discount / Commission 26,338 - 3,797 - 30,135
1,452,331 261 3,797 - 1,456,389 Net sales realization 3,196,103 579 675,279 873 3,872,834
NET SALES REALIZATION
Y E A R : 2 0 1 1
Y E A R : 2 0 1 0
LOCAL SALES
LOCAL SALES EXPORT SALES TOTAL
Quantity in Tonne
Rupees in '000
LOCAL SALES EXPORT SALES TOTAL
EXPORT SALES TOTAL
LOCAL SALES EXPORT SALES TOTAL
Quantity in Tonne
Rupees in '000
[ 15 ]

Pioneer Cement Limited Cost Audit Report, 2011
Schedule-3
a) Quantitative DataOPC Clinker OPC Clinker
Packed Cement 1,003,048 - 272,925 2,490 1,278,463 Bulk Cement - - - - -
Total quantity sold 1,003,048 - 272,925 2,490 1,278,463
b) Product wise ProfitabilityOPC Clinker OPC Clinker
Net sales 4,315,511 - 950,764 6,613 5,272,888 Less: Cost of goods manufactured 3,580,396 - 974,210 7,146 4,561,752
Inventory adjustment (finished) (30,590) - - - (30,590) Cost of goods sold 3,549,806 - 974,210 7,146 4,531,162
Gross profit / (loss) 765,705 - (23,446) (533) 741,726 Less:
Selling & distribution 36,838 - 9,792 - 46,630 Export expenses - - 103,946 - 103,946 Admin. Expenses 41,334 - 10,987 - 52,321 Financial charges 282,754 - 75,162 - 357,916 Other operating income (15,956) - (4,241) - (20,197) Other operating charges 102,136 - 27,150 - 129,286
447,105 - 222,797 - 669,902 Profit / (loss) before taxation 318,600 - (246,243) (533) 71,824
a) Quantitative DataOPC Clinker OPC Clinker
Packed Cement 1,080,794 200 191,624 240 1,272,858 Bulk Cement 706 - - - 706
Total quantity sold 1,081,500 200 191,624 240 1,273,564
b) Product wise ProfitabilityOPC Clinker OPC Clinker
Net sales 3,196,103 579 675,279 873 3,872,834 Less: Cost of goods manufactured 3,342,361 503 592,211 603 3,935,678
Inventory adjustment (finished) 18,136 - - - 18,136 Cost of goods sold 3,360,497 503 592,211 603 3,953,814
Gross profit (164,394) 76 83,068 270 (80,980) Less:
Selling & distribution 36,264 15 6,425 - 42,704 Export expenses - 145 115,993 - 116,138 Admin. Expenses 66,946 27 11,862 - 78,835 Financial charges 333,442 136 59,080 - 392,657 Other operating income (17,226) (7) (3,052) - (20,285) Other operating charges 142,910 58 25,321 - 168,289
562,335 374 215,629 - 778,339 Profit / (loss) before taxation (726,729) (298) (132,562) 270 (859,319)
Rupees in '000LOCAL EXPORT TOTAL
LOCAL EXPORT TOTAL
Rupees in '000
Quantity in Tonne
PROFITABILITY
Y E A R : 2 0 1 1
Y E A R : 2 0 1 0
LOCAL
LOCAL EXPORT TOTAL
Quantity in TonneEXPORT TOTAL
[ 16 ]

Pioneer Cement Limited Cost Audit Report, 2011
2011Rs. in '000
Cost of sales(as per cost accounts) 4,531,162
Cost of sales(as per financial accounts) 4,531,162
Reconciliation of Cost of Accounts with Audited Financial AccountsFor the year ended June 30, 2011
Cost accounts are in agreement with audited financial accounts of the company for the year ended June 30, 2011 as shown below:
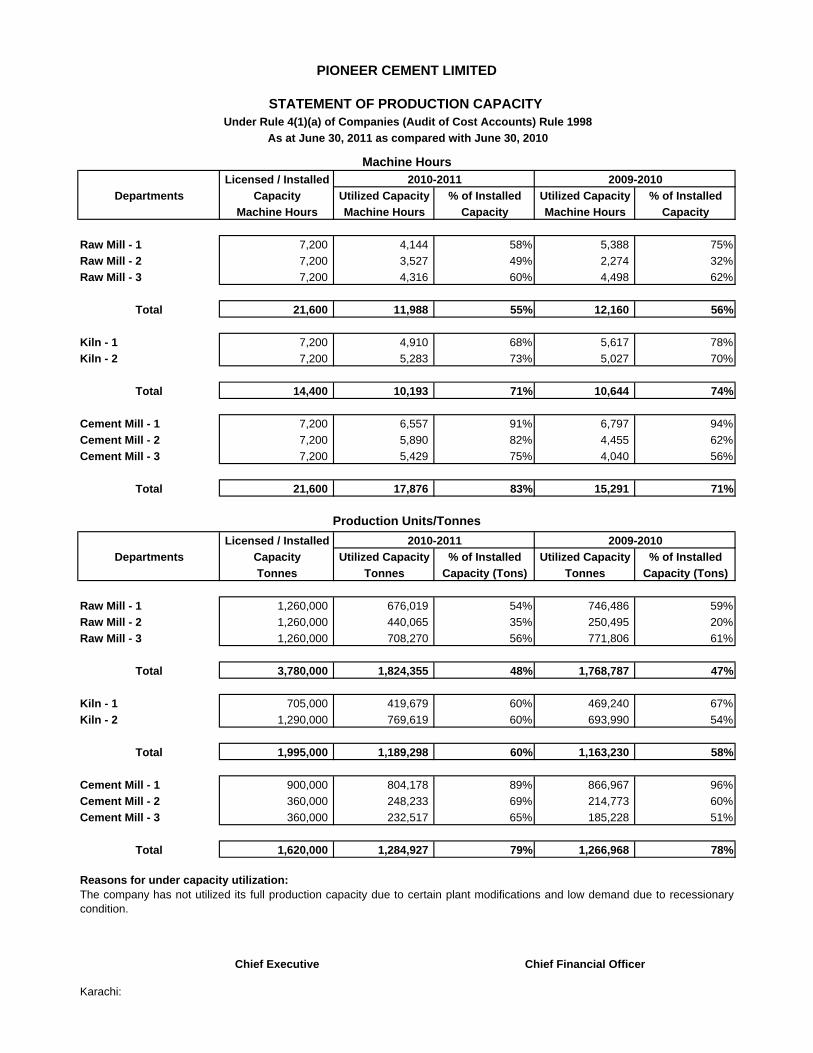
PIONEER CEMENT LIMITED
STATEMENT OF PRODUCTION CAPACITY Under Rule 4(1)(a) of Companies (Audit of Cost Accounts) Rule 1998
As at June 30, 2011 as compared with June 30, 2010
Machine HoursLicensed / Installed 2010-2011 2009-2010
Departments Capacity Utilized Capacity % of Installed Utilized Capacity % of InstalledMachine Hours Machine Hours Capacity Machine Hours Capacity
Raw Mill - 1 7,200 4,144 58% 5,388 75%Raw Mill - 2 7,200 3,527 49% 2,274 32%Raw Mill - 3 7,200 4,316 60% 4,498 62%
Total 21,600 11,988 55% 12,160 56%
Kiln - 1 7,200 4,910 68% 5,617 78%Kiln - 2 7,200 5,283 73% 5,027 70%
Total 14,400 10,193 71% 10,644 74%
Cement Mill - 1 7,200 6,557 91% 6,797 94%Cement Mill - 2 7,200 5,890 82% 4,455 62%Cement Mill - 3 7,200 5,429 75% 4,040 56%
Total 21,600 17,876 83% 15,291 71%
Production Units/TonnesLicensed / Installed 2010-2011 2009-2010
Departments Capacity Utilized Capacity % of Installed Utilized Capacity % of InstalledTonnes Tonnes Capacity (Tons) Tonnes Capacity (Tons)
Raw Mill - 1 1,260,000 676,019 54% 746,486 59%Raw Mill - 2 1,260,000 440,065 35% 250,495 20%Raw Mill - 3 1,260,000 708,270 56% 771,806 61%
Total 3,780,000 1,824,355 48% 1,768,787 47%
Kiln - 1 705,000 419,679 60% 469,240 67%Kiln - 2 1,290,000 769,619 60% 693,990 54%
Total 1,995,000 1,189,298 60% 1,163,230 58%
Cement Mill - 1 900,000 804,178 89% 866,967 96%Cement Mill - 2 360,000 248,233 69% 214,773 60%Cement Mill - 3 360,000 232,517 65% 185,228 51%
Total 1,620,000 1,284,927 79% 1,266,968 78%
Reasons for under capacity utilization:
Chief Executive Chief Financial Officer
Karachi:
The company has not utilized its full production capacity due to certain plant modifications and low demand due to recessionarycondition.
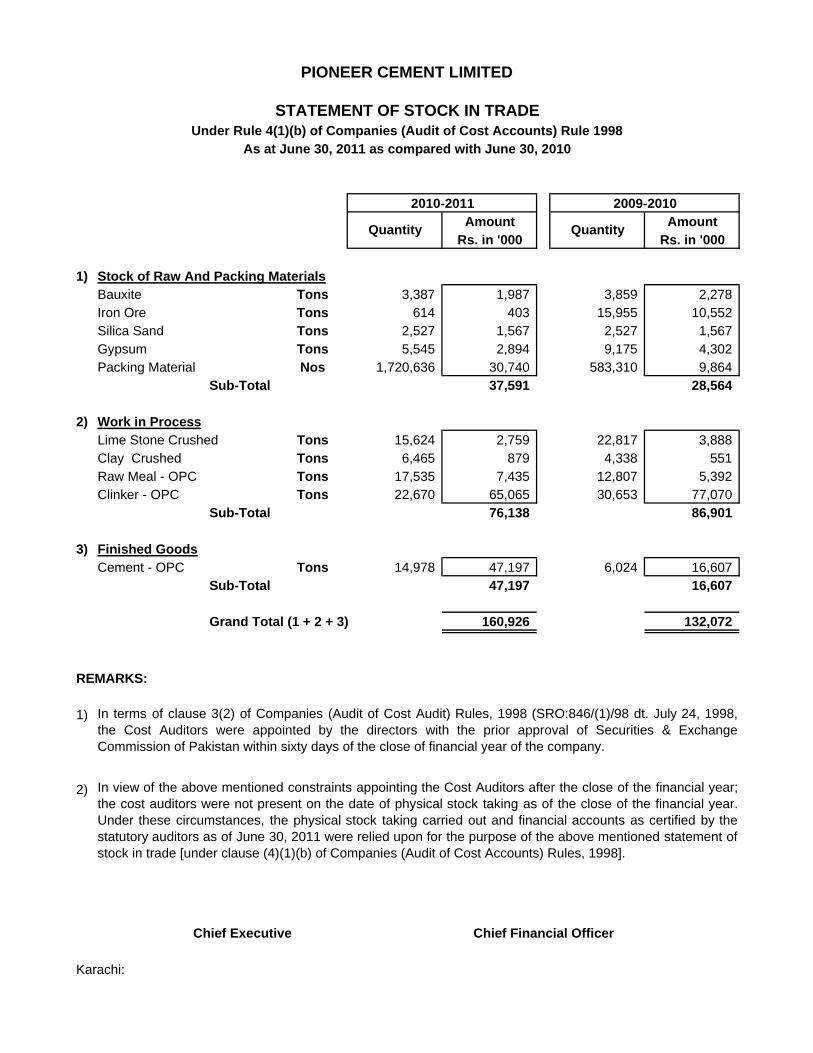
2010-2011 2009-2010Amount Amount
Rs. in '000 Rs. in '000
1) Stock of Raw And Packing MaterialsBauxite Tons 3,387 1,987 3,859 2,278Iron Ore Tons 614 403 15,955 10,552Silica Sand Tons 2,527 1,567 2,527 1,567Gypsum Tons 5,545 2,894 9,175 4,302Packing Material Nos 1,720,636 30,740 583,310 9,864
Sub-Total 37,591 28,564
2) Work in ProcessLime Stone Crushed Tons 15,624 2,759 22,817 3,888Clay Crushed Tons 6,465 879 4,338 551Raw Meal - OPC Tons 17,535 7,435 12,807 5,392Clinker - OPC Tons 22,670 65,065 30,653 77,070
Sub-Total 76,138 86,901
3) Finished GoodsCement - OPC Tons 14,978 47,197 6,024 16,607
Sub-Total 47,197 16,607
Grand Total (1 + 2 + 3) 160,926 132,072
REMARKS:
1)
2)
Chief Executive Chief Financial Officer
Karachi:
Quantity Quantity
In terms of clause 3(2) of Companies (Audit of Cost Audit) Rules, 1998 (SRO:846/(1)/98 dt. July 24, 1998,the Cost Auditors were appointed by the directors with the prior approval of Securities & ExchangeCommission of Pakistan within sixty days of the close of financial year of the company.
In view of the above mentioned constraints appointing the Cost Auditors after the close of the financial year;the cost auditors were not present on the date of physical stock taking as of the close of the financial year.Under these circumstances, the physical stock taking carried out and financial accounts as certified by thestatutory auditors as of June 30, 2011 were relied upon for the purpose of the above mentioned statement ofstock in trade [under clause (4)(1)(b) of Companies (Audit of Cost Accounts) Rules, 1998].
PIONEER CEMENT LIMITED
As at June 30, 2011 as compared with June 30, 2010
STATEMENT OF STOCK IN TRADEUnder Rule 4(1)(b) of Companies (Audit of Cost Accounts) Rule 1998

Annex I (a)PIONEER CEMENT LIMITEDDEPARTMENTAL COST STATEMENT LIMESTONE - QUARRYFOR THE YEAR ENDED : 30-06-2011
A. Quantitative Data Year: 2010-11 Year: 2009-10Tones Tones
Opening Stock at Quarry - - Quantity Quarried 1,570,387 1,546,421 Total Available: 1,570,387 1,546,421 Quantity Transported To Crusher 1,570,387 1,546,421 Closing Stock At Quarry - -
B. Cost Statement Rs./000 Rs./Ton Rs./000 Rs./TonDirect Departmental Cost : Explosive ( if any ). - - - - Quarrying Cost 24,121 15.36 23,753 15.36 Royalty and duties 51,913 33.06 51,032 33.00 Labour cost:
Salaries 3,242 2.06 3,183 2.06 Employees' Other Benefits 844 0.54 458 0.30 Stores & Spares 105 0.07 98 0.06 insurance 18 0.01 12 0.01 Repairs and maintenance 112 0.07 124 0.08 Quarry Development Charges 7,500 4.78 10,018 6.48 Deprecation - - - - Other Overheads 923 0.59 835 0.54 Sub-Total : 88,778 56.53 89,513 57.88
indirect Departmental Cost : Other Factory Expenses (Annexure XI) - - - - Sub-Total : - - - - Total Cost Added For The Period 88,778 56.53 89,513 57.88 Add: Cost of Opening Stock - - - - Total Cost of Available Stock : 88,778 56.53 89,513 57.88
C. Cost Distribution: Cost Transferred to transportation 88,778 56.53 89,513 57.88 Cost of Closing Stock - - Total Cost Accounted For: 88,778 56.53 89,513 57.88
Chief Executive Chief Financial Officer
For The Year: 2010-11 For The Year: 2009-10
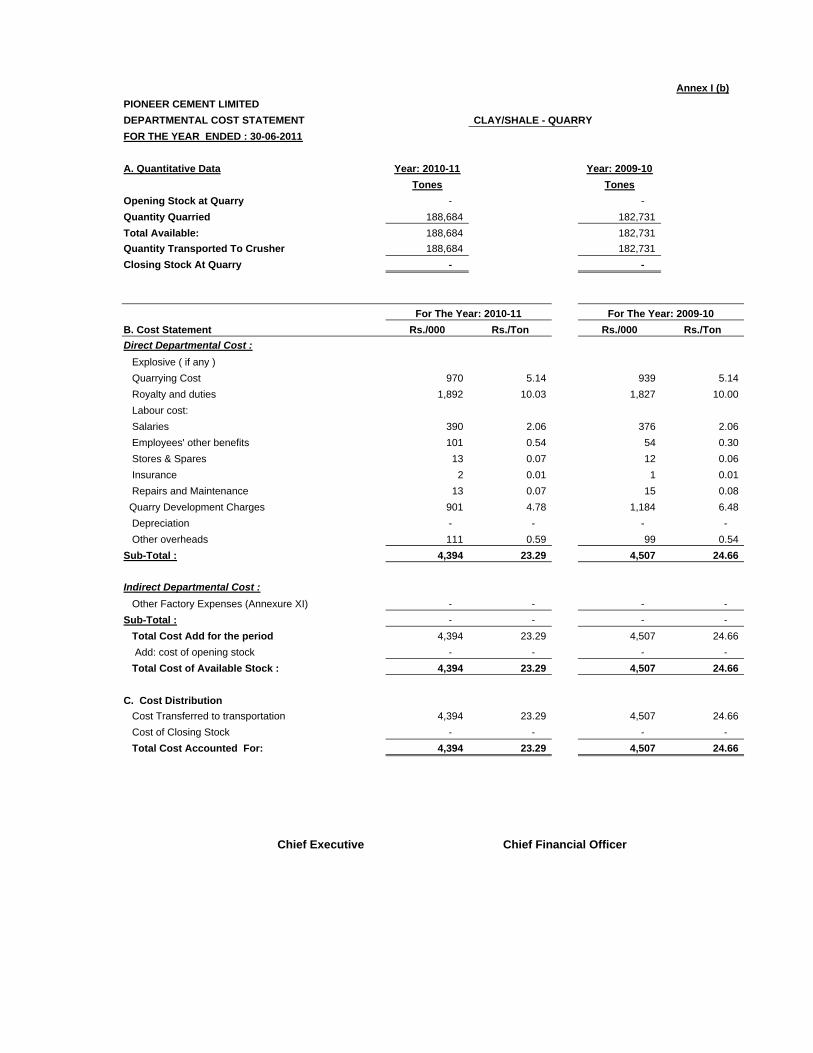
Annex I (b)PIONEER CEMENT LIMITEDDEPARTMENTAL COST STATEMENT CLAY/SHALE - QUARRYFOR THE YEAR ENDED : 30-06-2011
A. Quantitative Data Year: 2010-11 Year: 2009-10Tones Tones
Opening Stock at Quarry - - Quantity Quarried 188,684 182,731 Total Available: 188,684 182,731 Quantity Transported To Crusher 188,684 182,731 Closing Stock At Quarry - -
B. Cost Statement Rs./000 Rs./Ton Rs./000 Rs./TonDirect Departmental Cost : Explosive ( if any ) Quarrying Cost 970 5.14 939 5.14 Royalty and duties 1,892 10.03 1,827 10.00 Labour cost: Salaries 390 2.06 376 2.06 Employees' other benefits 101 0.54 54 0.30 Stores & Spares 13 0.07 12 0.06 Insurance 2 0.01 1 0.01 Repairs and Maintenance 13 0.07 15 0.08 Quarry Development Charges 901 4.78 1,184 6.48 Depreciation - - - - Other overheads 111 0.59 99 0.54 Sub-Total : 4,394 23.29 4,507 24.66
Indirect Departmental Cost : Other Factory Expenses (Annexure XI) - - - - Sub-Total : - - - - Total Cost Add for the period 4,394 23.29 4,507 24.66 Add: cost of opening stock - - - - Total Cost of Available Stock : 4,394 23.29 4,507 24.66
C. Cost Distribution Cost Transferred to transportation 4,394 23.29 4,507 24.66 Cost of Closing Stock - - - - Total Cost Accounted For: 4,394 23.29 4,507 24.66
Chief Executive Chief Financial Officer
For The Year: 2010-11 For The Year: 2009-10

PIONEER CEMENT LIMITED Annex II (a)DEPARTMENTAL COST STATEMENT LIMESTONE - TRANSPORTATIONFOR THE YEAR ENDED : 30-06-2011
A. Quantitative Data Year: 2010-11 Year: 2009-10Tones Tones
Quantity Transported From Quarry 1,570,387 1,546,421
B. Cost Statement Rs./000 Rs./Ton Rs./000 Rs./TonDirect Departmental Cost :
a. Outside Contract CostsTransportation Costs 90,602 57.69 75,566 48.86
b. Own Transportation Cost Duties - - - - Labour cost: Salaries - - - - Employees' Other Benefits - - - - Stores & Spares - - - - Insurance - - - - Repairs and maintenance - - - - Depreciation - - - - Other Overheads - - - - Sub-Total : - - - -
Indirect Departmental Cost : Other Factory Expenses (Annexure XI) - - - - Sub-Total : 90,602 57.69 75,566 48.86 Total Cost Added For The Period 90,602 57.69 75,566 48.86 Cost received (during the year) 88,778 56.53 89,513 57.88 Add: Cost of Opening Stock - - - - Total Cost of Available Stock : 179,380 114.23 165,079 106.75
C. Cost Distribution: Cost Transferred to Crusher 179,380 114.23 165,079 106.75 Cost of Closing Stock. - - - - Total Cost Accounted For: 179,380 114.23 165,079 106.75
Chief Executive Chief Financial Officer
For The Year: 2010-11 For The Year: 2009-10
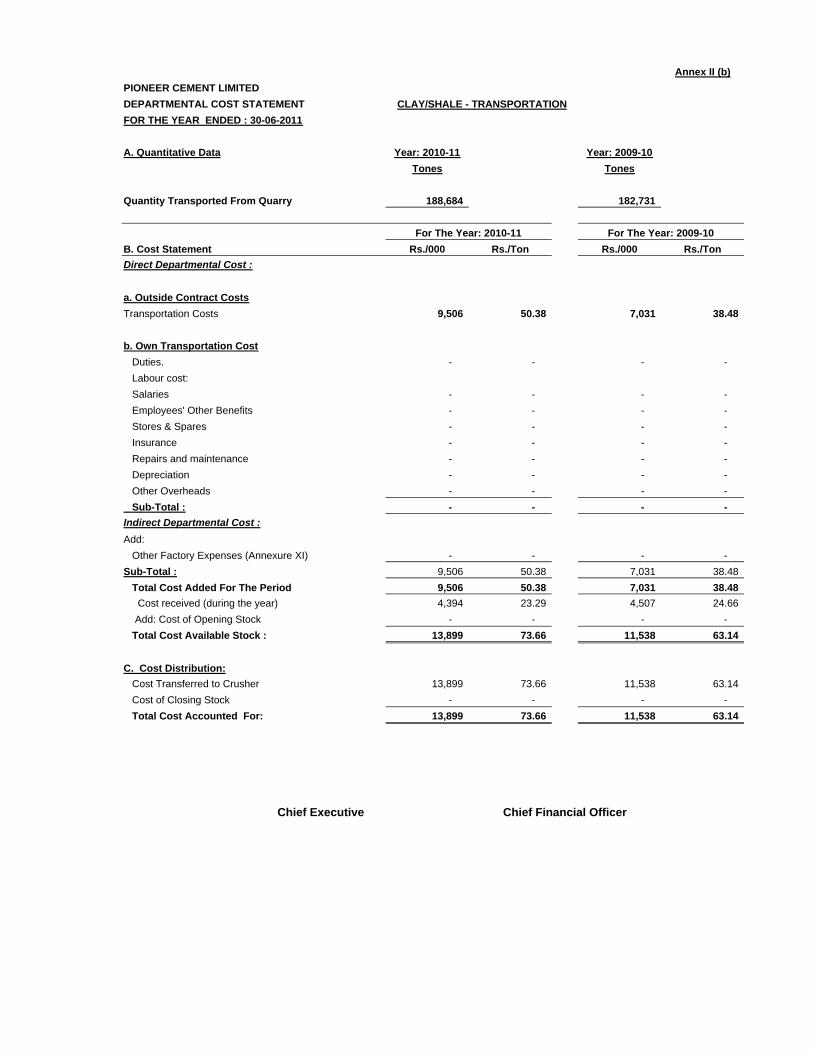
Annex II (b)PIONEER CEMENT LIMITEDDEPARTMENTAL COST STATEMENT CLAY/SHALE - TRANSPORTATIONFOR THE YEAR ENDED : 30-06-2011
A. Quantitative Data Year: 2010-11 Year: 2009-10Tones Tones
Quantity Transported From Quarry 188,684 182,731
B. Cost Statement Rs./000 Rs./Ton Rs./000 Rs./TonDirect Departmental Cost :
a. Outside Contract CostsTransportation Costs 9,506 50.38 7,031 38.48
b. Own Transportation Cost Duties. - - - - Labour cost: Salaries - - - - Employees' Other Benefits - - - - Stores & Spares - - - - Insurance - - - - Repairs and maintenance - - - - Depreciation - - - - Other Overheads - - - - Sub-Total : - - - - Indirect Departmental Cost :Add: Other Factory Expenses (Annexure XI) - - - - Sub-Total : 9,506 50.38 7,031 38.48 Total Cost Added For The Period 9,506 50.38 7,031 38.48 Cost received (during the year) 4,394 23.29 4,507 24.66 Add: Cost of Opening Stock - - - - Total Cost Available Stock : 13,899 73.66 11,538 63.14
C. Cost Distribution: Cost Transferred to Crusher 13,899 73.66 11,538 63.14 Cost of Closing Stock - - - - Total Cost Accounted For: 13,899 73.66 11,538 63.14
Chief Executive Chief Financial Officer
For The Year: 2010-11 For The Year: 2009-10

Annex III (a)PIONEER CEMENT LIMITEDDEPARTMENTAL COST STATEMENT LIMESTONE - CRUSHERFOR THE YEAR ENDED : 30-06-2011
A. Quantitative Data Year: 2010-11 Year: 2009-10Tones Tones
Opening Stock (Crushed material) 22,817 30,227 Quantity Crushed During The Period 1,570,387 1,546,421
- - Total Crushed Material Available: 1,593,204 1,576,648 Less: Transferred to Cement Mill 34,393 40,061 Less: Closing Stock (Crushed material) 15,624 22,817 Transferred To Raw Mill 1,543,187 1,513,770
B. Cost Statement Rs./000 Rs./Ton Rs./000 Rs./TonDirect Departmental Cost : Direct material ( if any ) - - - - Salaries 12,321 7.85 12,789 8.27 Employee's other benefits 2,415 1.54 2,233 1.44 Stores & Spares 10,264 6.54 10,934 7.07 Repairs and Maintenance 4,710 3.00 4,677 3.02 Insurance 746 0.47 905 0.59 Depreciation 29,397 18.72 31,241 20.20 Other Overheads 835 0.53 851 0.55 Sub-Total : 60,687 38.64 63,630 41.15
Indirect Departmental Cost : Power (Annexure X) 14,606 9.30 12,546 8.11 Other Factory Expenses (Annexure XI) 22,762 14.49 22,787 14.74 Sub-Total : 37,369 23.80 35,333 22.85
Total Cost Crushing Process: 98,056 62.44 98,962 63.99 Add: Cost received (during the year) 179,380 114.23 165,079 106.75 Total Cost Added For The Period 277,436 176.67 264,041 170.74 Cost Of Opening stock 3,888 - 4,627 - Total Cost of Available Stock: 281,324 176.58 268,668 170.40
C. Cost Distribution Cost transferred to Raw Mill 272,493 176.58 257,954 170.40 Cost transferred to Cement Mill 6,073 176.58 6,827 170.40 Cost of closing stock 2,759 - 3,888 - Total Cost Accounted For: 281,324 176.58 268,668 170.40
Chief Executive Chief Financial Officer
For The Year: 2010-11 For The Year: 2009-10

Annex III (b)PIONEER CEMENT LIMITEDDEPARTMENTAL COST STATEMENT SHALE/CLAY - CRUSHERFOR THE YEAR ENDED : 30-06-2011
A. Quantitative Data Year: 2010-11 Year: 2009-10Tones Tones
Opening Stock (Crushed material) 4,338 2,750 Quantity Crushed During The Period 188,684 182,731 Add Trial Production - - - Total Crushed Material Available: 193,022 185,481 Less: Closing Stock (Crushed material) 6,465 4,338 Transferred To Raw Mill 186,557 181,143
B. Cost Statement Rs./000 Rs./Ton Rs./000 Rs./TonDirect Departmental Cost : Direct material ( if any ) - - - - Labour cost - - - - Salaries 1,480 7.85 1,511 8.27 Employee's other benefits 290 1.54 264 1.44 Stores & Spares 1,233 6.54 1,292 7.07 Repairs and Maintenance 566 3.00 553 3.02 Insurance 90 0.47 107 0.59 Depreciation 3,532 18.72 3,692 20.20 Other Overheads 100 0.53 101 0.55 Sub-Total: 7,292 38.64 7,519 41.15 Indirect Departmental Cost : Power (Annexure X) 1,755 9.30 1,482 8.11 Other Factory Expenses (Annexure XI) 2,735 14.49 2,693 14.74 Sub-Total: 4,490 23.80 4,175 22.85 Total Cost: : 11,782 62.44 11,694 63.99 Add: Cost Received (during the year) 13,899 73.66 11,538 63.14 Total Cost Added For The Period 25,681 136.11 23,232 127.14 Cost Of Opening stock 551 - 327 - Total Cost of Available Cost: 26,232 135.90 23,559 127.02
C. Cost Distribution Cost Transferred To Raw Mill 25,353 135.90 23,009 127.02 Cost of Closing Stock 879 135.90 551 127.02 Total Cost Accounted For: 26,232 135.90 23,560 127.02
Chief Executive Chief Financial Officer
For The Year: 2010-11 For The Year: 2009-10

Annexure- IV
PIONEER CEMENT LIMITEDDEPARTMENTAL COST STATEMENT Stock Hall StorageFOR THE YEAR ENDED : 30-06-2011
A. Quantitative Data
For the year Last year For the year Last year For the year Last yeartonnes tonnes tonnes tonnes tonnes tonnes
Opening Stock
Received from crusher
Total
Issued to Mix/SlurryClosing Stock
B. Cost Statement
Rs. 000 per tonne Rs. 000 per tonneLabour Costs :Salaries.Employees' other benefits.Indirect materials.Repairs and maintenanceInsuranceFuel-OilGasDepreciationOther OverheadsSub-Total (a) :Indirect Departmental Costs :Compressed Air (Annexure IX).Power (Annexure X)Other Expenses (Annexure XI).Sub-Total (b) :Total Cost (a+b) :
C: Cost Distribution Cost of Stock Hall Cost of Applicable toApplicable to issues Closing Stock
Rupees Rs. / Tonne Rupees Rs. / TonneShale
Lime Stone.
Gypsum.
Total.
D. Cost Summary (Upto Stock Hall Stage)
Cost Transferred and Cost of closing Stock:
Rs. Rs. / Tonne Rupees Rs. / Tonne Rupees Rs. / TonneOpening Stock.Add : Received from Crusher/ purchase Stock HallTotalLess: Cost of closing stock. Cost applicable to quantities issued to Raw Mill
Chief Executive Chief Financial Officer
Gypsum
TotalShale Lime Stone
Shale/ Overburden Lime Stone
For the year Last year
Quantity issued toRaw Mill (Tonnes)

Annex V PIONEER CEMENT LIMITEDDEPARTMENTAL COST STATEMENT RAW MILL - OPCFOR THE YEAR ENDED : 30-06-2011
Year: 2010-11 Year: 2009-10A. Quantitative Data Tones Tones
Opening Stock 12,805 15,882 Lime Stone 1,543,187 1,513,770 Shale 186,557 181,143 Laterite 70,533 52,694 Bauxite 24,078 20,405 Salica Sand - 774 Raw Meal Production 1,824,355 1,768,786 Total Raw Meal 1,837,160 1,784,668 Less : Raw Meal Transferred To Kiln 1,819,625 1,771,862 Closing Stock 17,535 12,806
B. Cost Statement Rs./000 Rs./Ton Rs./000 Rs./TonCost Transferred InLime Stone 272,493 149.36 257,954 145.84 Shale 25,353 13.90 23,008 13.01 Direct Material ConsumedLaterite 46,529 25.50 36,072 20.39 Bauxite 14,369 7.88 12,370 6.99 Salican Sand - - 500 0.28 Direct Departmental Cost :Salaries 24,561 13.46 25,440 14.38 Employees' Other Benefits 4,822 2.64 4,457 2.52 Grinding Material - - 1,361 0.77 Lining Plates 309 0.17 477 0.27 Stores & Spares 11,833 6.49 16,192 9.15 Repairs and Maintenance 4,721 2.59 7,536 4.26 Insurance 1,531 0.84 1,822 1.03 Depreciation 59,921 32.85 64,430 36.43 Other overheads 1,715 0.94 1,740 0.98
468,157 256.62 453,356 256.31 Sales Tax Input on Export Sales (9,409) (5.16) (3,059) (1.73) Sub-Total: 458,749 251.46 450,297 254.58 Indirect Departmental Cost :Power (Annexure X) 247,309 135.56 228,604 129.24 Other Factory Expenses (Annexure XI) 67,571 37.04 66,408 37.54 Sub-Total: 314,879 172.60 295,011 166.79 Total Cost Added For The Period: 773,628 424.06 745,309 421.37 Add:Cost of Opening Stock 5,392 - 6,073 - Total Cost Available 779,020 424.04 751,382 421.02
Cost DistributionCost Transferred to Kiln 771,585 424.04 745,990 421.02 Closing Stock of Raw Meal 7,435 424.03 5,392 421.07 Total Cost Accounted For: 779,020 424.04 751,382 421.02
Chief Executive Chief Financial Officer
For The Year: 2010-11 For The Year: 2009-10
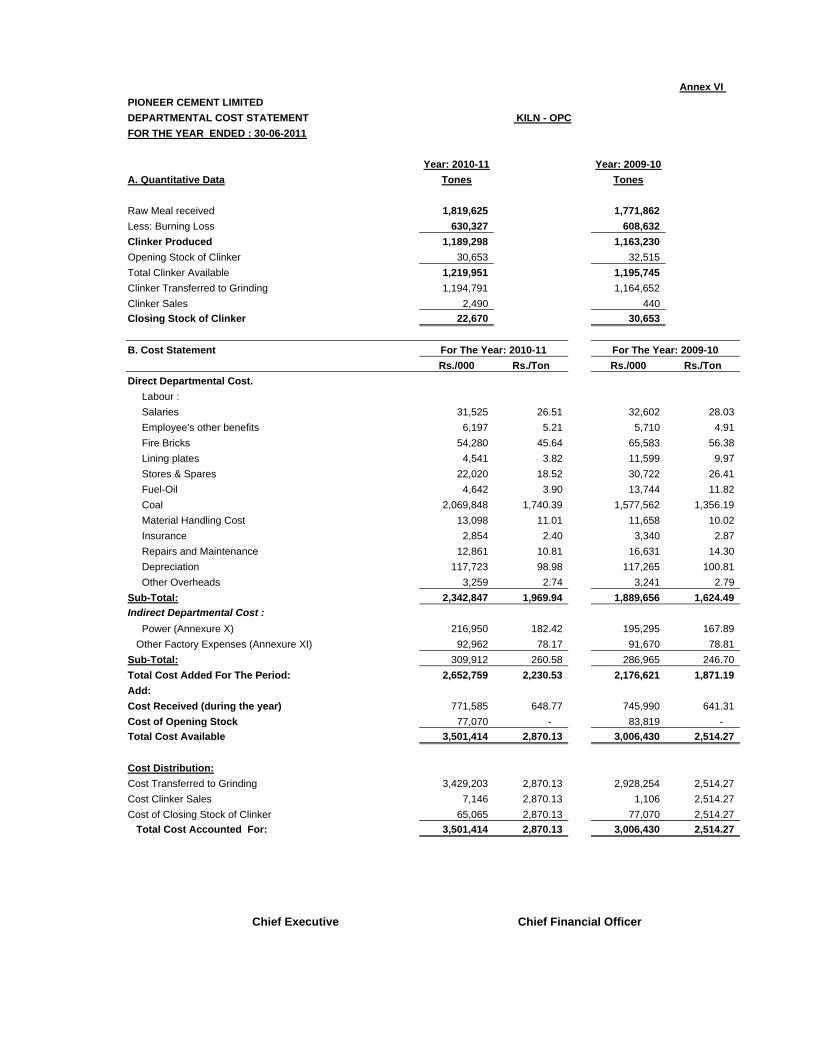
Annex VI PIONEER CEMENT LIMITEDDEPARTMENTAL COST STATEMENT KILN - OPCFOR THE YEAR ENDED : 30-06-2011
Year: 2010-11 Year: 2009-10A. Quantitative Data Tones Tones
Raw Meal received 1,819,625 1,771,862 Less: Burning Loss 630,327 608,632 Clinker Produced 1,189,298 1,163,230 Opening Stock of Clinker 30,653 32,515 Total Clinker Available 1,219,951 1,195,745 Clinker Transferred to Grinding 1,194,791 1,164,652 Clinker Sales 2,490 440 Closing Stock of Clinker 22,670 30,653
B. Cost StatementRs./000 Rs./Ton Rs./000 Rs./Ton
Direct Departmental Cost. Labour : Salaries 31,525 26.51 32,602 28.03 Employee's other benefits 6,197 5.21 5,710 4.91 Fire Bricks 54,280 45.64 65,583 56.38 Lining plates 4,541 3.82 11,599 9.97 Stores & Spares 22,020 18.52 30,722 26.41 Fuel-Oil 4,642 3.90 13,744 11.82 Coal 2,069,848 1,740.39 1,577,562 1,356.19 Material Handling Cost 13,098 11.01 11,658 10.02 Insurance 2,854 2.40 3,340 2.87 Repairs and Maintenance 12,861 10.81 16,631 14.30 Depreciation 117,723 98.98 117,265 100.81 Other Overheads 3,259 2.74 3,241 2.79 Sub-Total: 2,342,847 1,969.94 1,889,656 1,624.49 Indirect Departmental Cost : Power (Annexure X) 216,950 182.42 195,295 167.89 Other Factory Expenses (Annexure XI) 92,962 78.17 91,670 78.81 Sub-Total: 309,912 260.58 286,965 246.70 Total Cost Added For The Period: 2,652,759 2,230.53 2,176,621 1,871.19 Add:Cost Received (during the year) 771,585 648.77 745,990 641.31 Cost of Opening Stock 77,070 - 83,819 - Total Cost Available 3,501,414 2,870.13 3,006,430 2,514.27
Cost Distribution:Cost Transferred to Grinding 3,429,203 2,870.13 2,928,254 2,514.27 Cost Clinker Sales 7,146 2,870.13 1,106 2,514.27 Cost of Closing Stock of Clinker 65,065 2,870.13 77,070 2,514.27 Total Cost Accounted For: 3,501,414 2,870.13 3,006,430 2,514.27
Chief Executive Chief Financial Officer
For The Year: 2010-11 For The Year: 2009-10

Annex VII PIONEER CEMENT LIMITEDDEPARTMENTAL COST STATEMENT CEMENT MILL- OPCFOR THE YEAR ENDED : 30-06-2011
Year: 2010-11 Year: 2009-10A. Quantitative Data Tones Tones
Opening Stock of Cement 6,025 12,180 Clinker Consumed 1,194,791 1,164,652 Gypsum added 55,742 62,255 Other Additives 34,393 40,061 Cement produced 1,284,926 1,266,968 Adjustment from SRC - - Total Available 1,290,951 1,279,148 Less: Cement Despatches 1,275,973 1,273,124 Closing Stock of Cement 14,978 6,024
B. Cost Statement Rs./000 Rs./Ton Rs./000 Rs./Ton
Direct Departmental Cost Gypsum 29,093 22.64 29,213 23.06 Fly Ash - - - - Additives 6,073 4.73 6,827 5.39 Salaries 26,070 20.29 26,858 21.20 Employee's other benefits 5,137 4.00 4,795 3.78 Stores & Spares 20,949 16.30 20,261 15.99 Repairs and Maintenance 6,571 5.11 8,278 6.53 Grinding material 6,313 4.91 - - Lining plates 5,133 3.99 1,496 1.18 Insurance 1,601 1.25 1,822 1.44 Depreciation 59,363 46.20 62,801 49.57 Other Overheads 1,795 1.40 1,824 1.44 Sub-Total: 168,097 130.82 164,174 129.58 Indirect Departmental Cost : Power (Annexure X) 373,578 290.74 322,826 254.80 Other Factory Expenses (Annexure XI) 80,452 62.61 76,266 60.20 Sub-Total: 454,029 353.35 399,092 315.00 Total Cost Added For The Period : 622,126 484.17 563,267 444.58 Add:Cost Received (during the year) 3,429,203 2,668.79 2,928,254 2,311.23 Cost of Opening Stock 16,607 - 34,743 - Total Cost Available 4,067,937 3,151.12 3,526,263 2,756.73
Cost DistributionCost transferred to silos 4,020,739 3,151.12 3,509,656 2,756.73 Cost of Closing Stock of Cement 47,197 3,151.13 16,607 2,756.73 Total Cost Accounted For: 4,067,937 3,151.12 3,526,263 2,756.73
Chief Executive Chief Financial Officer
For The Year: 2010-11 For The Year: 2009-10

Annex VIII PIONEER CEMENT LIMITEDDEPARTMENTAL COST STATEMENT - PACKING & STORAGE - OPCFOR THE YEAR ENDED : 30-06-2011
A. Quantitative Data Year: 2010-11 Year: 2009-10
Cement packed during the period (Tones) 1,275,973 1,272,418 Cement Despatch during the period-Bulk " - 706 Total Despatches " 1,275,973 1,273,124
Cement packed during the period (Nos/Bags) 25,519,460 25,448,360
B. Cost Statement Rs./000 Rs./Ton Rs./000 Rs./Ton
Direct Departmental Costs Packing Materials. 449,538 352.31 389,454 306.07
Salaries 13,959 10.94 14,607 11.47 Employees' Other Benefits 2,769 2.17 2,578 2.02 Stores & Spares 2,976 2.33 1,872 1.47 Repairs and Maintenance 427 0.33 1,854 1.46 Insurance 139 0.11 202 0.16 Depreciation 6,759 5.30 7,125 5.60 Other Overheads 2,346 1.84 2,503 1.97 Sub-Total: 478,914 375.33 420,194 330.22 Indirect Departmental Cost : Power (Annex X) 12,000 9.40 10,446 8.21 Other Factory Expenses (Annexure XI) 12,363 9.69 12,411 9.75 Sub-Total: 24,363 19.09 22,857 17.96 Total Cost Added For The Period : 503,277 394.42 443,052 348.18
Add: Cost Received/Transferred in 4,020,739 3,151.12 3,509,656 2,756.73 (During the year)Total Cost of Cement Packed 4,524,016 3,545.54 3,952,708 3,104.73
C. Cost of Cement Sold: Cost of Cement Packed 4,524,016 3,545.54 3,950,733 3,104.90 Cost of Bulk Cement - - 1,975 2,798.66
4,524,016 3,545.54 3,952,708 3,104.73
Chief Executive Chief Financial Officer
For The Year: 2010-11 For The Year: 2009-10

Annexure-IX
PIONEER CEMENT LIMITED DEPARTMENTAL COST STATEMENT – AIR COMPRESSINGFOR THE YEAR ENDED : 30-06-2011
A . QUANTITATIVE DATAFor the Year Last Year
Compressed Air Produced
B. Cost StatementFor the Year Last Year
Rupees Rupees
Direct Departmental CostsPacking materialOther materialSalariesInsuranceRepair and maintenanceDepreciation Other Overhead
Indirect Material CostsPower ( Annex-X )Other Expenses ( Annex-XI )
Sub-Total ( b ) :
Total Cost ( a+b)
C. Cost Distribution
Quantity Cost Quantity CostDepartments Using Compressed air : Compressed Air Rupees ompressed A Rupees
Raw Mill KilnCementPack HouseTOTAL
Chief Executive Chief Financial Officer
For the Year Last Year
Sub-Total ( a ):
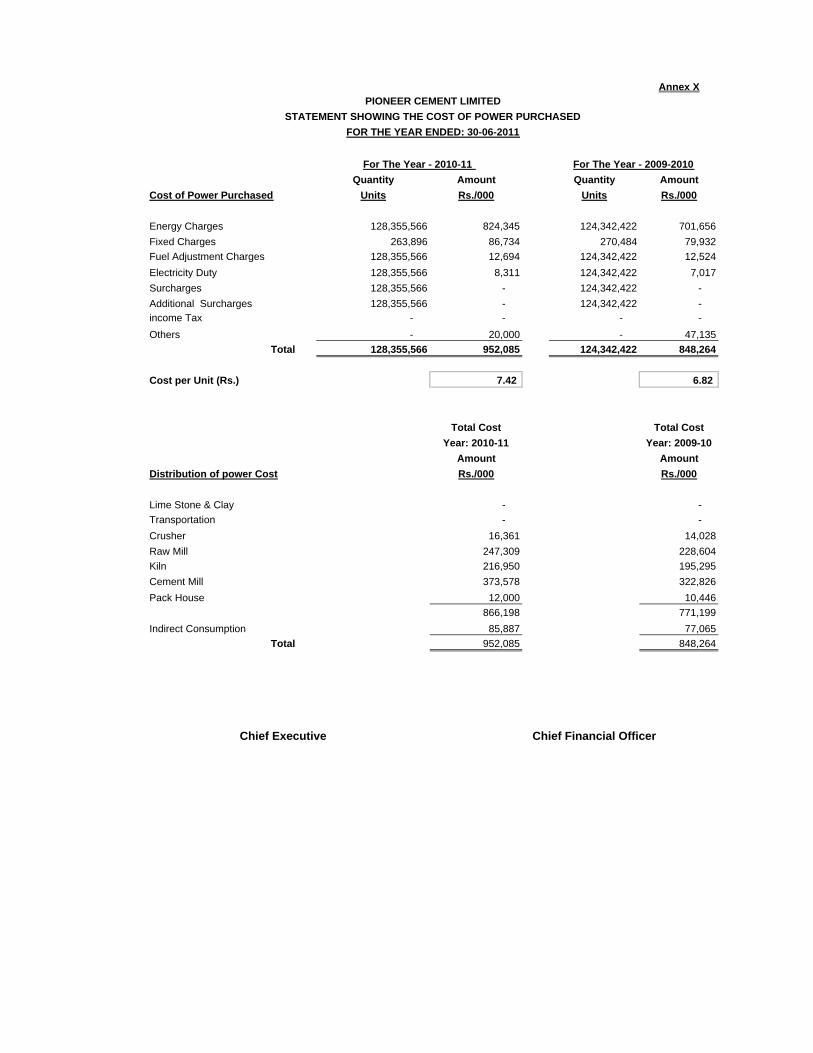
Annex XPIONEER CEMENT LIMITED
STATEMENT SHOWING THE COST OF POWER PURCHASEDFOR THE YEAR ENDED: 30-06-2011
For The Year - 2010-11 For The Year - 2009-2010Quantity Amount Quantity Amount
Cost of Power Purchased Units Rs./000 Units Rs./000
Energy Charges 128,355,566 824,345 124,342,422 701,656Fixed Charges 263,896 86,734 270,484 79,932Fuel Adjustment Charges 128,355,566 12,694 124,342,422 12,524Electricity Duty 128,355,566 8,311 124,342,422 7,017Surcharges 128,355,566 - 124,342,422 - Additional Surcharges 128,355,566 - 124,342,422 - income Tax - - - - Others - 20,000 - 47,135
Total 128,355,566 952,085 124,342,422 848,264
Cost per Unit (Rs.) 7.42 6.82
Total Cost Total CostYear: 2010-11 Year: 2009-10
Amount AmountDistribution of power Cost Rs./000 Rs./000
Lime Stone & Clay - - Transportation - - Crusher 16,361 14,028Raw Mill 247,309 228,604Kiln 216,950 195,295Cement Mill 373,578 322,826Pack House 12,000 10,446
866,198 771,199Indirect Consumption 85,887 77,065
Total 952,085 848,264
Chief Executive Chief Financial Officer
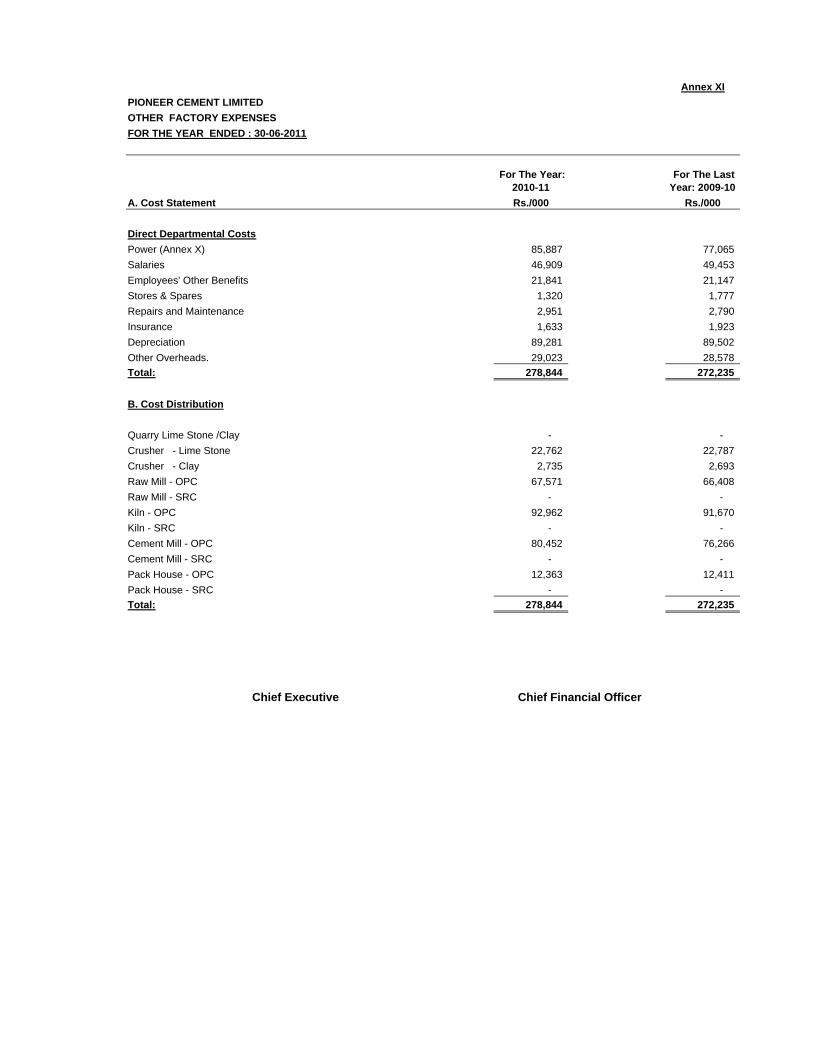
Annex XIPIONEER CEMENT LIMITEDOTHER FACTORY EXPENSESFOR THE YEAR ENDED : 30-06-2011
For The Year: 2010-11
For The Last Year: 2009-10
A. Cost Statement Rs./000 Rs./000
Direct Departmental CostsPower (Annex X) 85,887 77,065 Salaries 46,909 49,453 Employees' Other Benefits 21,841 21,147 Stores & Spares 1,320 1,777 Repairs and Maintenance 2,951 2,790 Insurance 1,633 1,923 Depreciation 89,281 89,502 Other Overheads. 29,023 28,578 Total: 278,844 272,235
B. Cost Distribution
Quarry Lime Stone /Clay - - Crusher - Lime Stone 22,762 22,787 Crusher - Clay 2,735 2,693 Raw Mill - OPC 67,571 66,408 Raw Mill - SRC - - Kiln - OPC 92,962 91,670 Kiln - SRC - - Cement Mill - OPC 80,452 76,266 Cement Mill - SRC - - Pack House - OPC 12,363 12,411 Pack House - SRC - - Total: 278,844 272,235
Chief Executive Chief Financial Officer

Annexure-XII
General
Power Factory Lime Clay Lime Clay Lime Clay
Stone Stone Stone OPC OPC OPC OPC TOTAL
Opening Balance - - - - - - 3,888 551 5,392 77,070 16,607 - 103,508
Direct Cost Added By :
Departments During the Period - - 88,778 4,394 90,602 9,506 60,687 7,292 160,903 2,342,847 162,024 478,914 3,405,947
Add: Cost Allocation (Power & FOH) (866,198) - - - - - 14,606 1,755 247,309 216,950 373,578 12,000 866,198
General Factory (278,845) 22,762 2,735 67,571 92,962 80,452 12,363 278,845
Total - - 88,778 4,394 90,602 9,506 101,943 12,333 481,175 2,729,829 632,661 503,277 4,654,498
Add Cost Transferred In: -
From Quarry (88,778) (4,394)
From Transportation (90,602) (9,506) - -
From Crusher (Lime Stone) 179,380 272,493
From Crusher (Shale/Clay) 13,899 25,353
From Raw Mill 771,585
From Kiln 3,429,203
From Cement Mill 6,073 4,020,739
- - - - - 281,323 26,232 779,021 3,501,414 4,067,937 4,524,016
Less: Cost Transferred Out: (27,639)
To Transportation - -
To Crusher (Lime Stone) -
To Crusher (Shale/Clay) -
To Raw Mill (272,493) (25,353)
To Kiln (771,585)
To Cement Mill (6,073) (3,429,203)
To Pack House (4,020,739)
Cost of Goods Sold - Cement 2,758 879 7,436 72,211 47,198 4,524,016
Cost of Goods Sold - Clinker (7,146) 7,146
Closing Balances - - - - 2,758 879 7,436 65,065 47,198 123,336
4,531,162
QUANTITATIVE DATA Qty in Tonne
Opening Stock (Tonnes) 22,817 4,338 12,805 30,653 6,025
Quantity Produced (Tonnes) 1,570,387 188,684 1,824,355 1,189,298 1,284,927 -
Quantity Transfer out (Tonnes) (1,543,187) (186,557) (1,819,625) (1,194,791) (1,275,973) -
Transfer to Cement Mill (34,393)
Clinker Sales (Tonnes) (2,490)
Closing Stock (Tonnes) 15,624 6,465 17,535 22,670 14,978 -
Chief Executive Chief Financial Officer
PIONEER CEMENT LIMITEDSUMMARY COST REPORT
FOR THE YEAR ENDED 30TH JUNE,2011
GRAND Q U A R R Y TRANSPORTATION C R U S H E R RAW MILL KILN CEMENT MILL
PACK HOUSE
Rs. in '000
Related Documents
![Untitled-2 [pioneercement.com]pioneercement.com/cp_content/uploads/2016/03/1st-Quarter-Financial... · 1/3/2016 · Mr. Cevdet Dal Shaikh Javed Elahi Mr. Rafique Dawood Mr. Zubair](https://static.cupdf.com/doc/110x72/606413812169234fa3353760/untitled-2-132016-mr-cevdet-dal-shaikh-javed-elahi-mr-rafique-dawood.jpg)