Cost assessment of hydrogen production from PV and electrolysis Jim Hinkley, Jenny Hayward, Robbie McNaughton, Rob Gillespie (CSIRO) Ayako Matsumoto (Mitsui Global Strategic Studies Institute) Muriel Watt, Keith Lovegrove (IT Power) 21 March 2016 Report to ARENA as part of Solar Fuels Roadmap, Project A-3018 CSIRO ENERGY

Welcome message from author
This document is posted to help you gain knowledge. Please leave a comment to let me know what you think about it! Share it to your friends and learn new things together.
Transcript

Cost assessment of hydrogen production from PV and electrolysis Jim Hinkley, Jenny Hayward, Robbie McNaughton, Rob Gillespie (CSIRO)
Ayako Matsumoto (Mitsui Global Strategic Studies Institute)
Muriel Watt, Keith Lovegrove (IT Power)
21 March 2016
Report to ARENA as part of Solar Fuels Roadmap, Project A-3018
CSIRO ENERGY
CSIRO Energy
Citation
Hinkley et al. (2016) Cost assessment of hydrogen production from PV and electrolysis. CSIRO,
Australia.
Copyright
© Commonwealth Scientific and Industrial Research Organisation 2016. To the extent permitted
by law, all rights are reserved and no part of this publication covered by copyright may be
reproduced or copied in any form or by any means except with the written permission of CSIRO.
Important disclaimer
CSIRO advises that the information contained in this publication comprises general statements
based on scientific research. The reader is advised and needs to be aware that such information
may be incomplete or unable to be used in any specific situation. No reliance or actions must
therefore be made on that information without seeking prior expert professional, scientific and
technical advice. To the extent permitted by law, CSIRO (including its employees and consultants)
excludes all liability to any person for any consequences, including but not limited to all losses,
damages, costs, expenses and any other compensation, arising directly or indirectly from using this
publication (in part or in whole) and any information or material contained in it.
CSIRO is committed to providing web accessible content wherever possible. If you are having
difficulties with accessing this document please contact [email protected].

Cost assessment of hydrogen production from PV and electrolysis | i
Contents
Contents i
Figures ...............................................................................................................................iii
Tables ............................................................................................................................... iv
Acknowledgments v
Executive summary vi
1 Introduction 2
1.1 System overview ................................................................................................................. 3
2 The Market for Hydrogen 5
2.1 Applications and potential market growth......................................................................... 5
2.2 Hydrogen transport ............................................................................................................ 6
3 System components 8
3.1 Photovoltaics ...................................................................................................................... 8
3.2 Electrolysis – state of the art ............................................................................................ 12
3.2.1 Tolerance of variations in power input ............................................................... 14
3.2.2 Cost and performance data for PEM electrolysers ............................................. 15
3.2.3 Lifetime of electrolyser and stack replacement considerations ......................... 17
3.3 Batteries ............................................................................................................................ 18
3.4 Integration of PV and electrolysis ..................................................................................... 19
4 Levelised cost of hydrogen model 21
4.1 Basic financial assumptions .............................................................................................. 21
4.2 Data for levelised cost analysis ......................................................................................... 21
4.3 Scenario analysis ............................................................................................................... 22
4.3.1 Scenario 1: no battery storage, current costs ..................................................... 22
4.3.2 Scenario 2: battery storage, current costs .......................................................... 24
4.3.3 Future cost of hydrogen – no battery storage .................................................... 26
4.3.4 Future cost of hydrogen – system with battery storage ..................................... 27
4.3.5 Sensitivity analysis: parameters with greatest leverage – no storage ................ 28

ii | Cost assessment of hydrogen production from PV and electrolysis
4.3.6 Sensitivity analysis: parameters with greatest leverage – battery storage ........ 29
5 Conclusions 31
References 32

Cost assessment of hydrogen production from PV and electrolysis | iii
Figures
Figure 1: System configuration used in United States Department of Energy analysis. ................ 3
Figure 2: Concept diagram for large-scale production of hydrogen from photovoltaics and
electrolysis. ..................................................................................................................................... 8
Figure 3: Average photovoltaic module price, and total and non-International Energy Agency
(IEA) country module production capacity from 1997–2009. ........................................................ 9
Figure 4: Contribution of each photovoltaic system component to the overall capital cost of
grid-connected residential PV systems in Australia, 2014............................................................ 10
Figure 5: Projected large-scale photovoltaic system price in Australia. ....................................... 11
Figure 6: Typical current-voltage characteristics and operating ranges for alkaline electrolysis
and proton exchange membrane (PEM) electrolysis. .................................................................. 12
Figure 7: Pressure considerations of typical applications for hydrogen. ..................................... 13
Figure 8: Stack current and solar radiation data for a proton exchange membrane electrolyser 15
Figure 9: Indicative system and stack cost breakdowns for proton exchange membrane (PEM)
electrolysis .................................................................................................................................... 17
Figure 10: Power output from a photovoltaic (PV) plant at the Desert Knowledge Australia Solar
Centre (DKASC) over one day. ...................................................................................................... 20
Figure 11: Impact of increasing battery storage on the levelised cost of hydrogen for a 1 MW PV
system. .......................................................................................................................................... 25
Figure 12: Contribution of subsystem costs to LCOH2 (no battery storage) for 2015 and 2030. . 27
Figure 13: Contribution of subsystem costs on LCOH2 with battery storage for 2015 and 2030. 28
Figure 14: Tornado chart of LCOH2 with no storage. The base LCOH2 for this scenario is
$18.67. .......................................................................................................................................... 29
Figure 15: Tornado chart of LCOH2 with incorporated battery storage. The base LCOH2 for this
scenario is $28.43.......................................................................................................................... 30
iv | Cost assessment of hydrogen production from PV and electrolysis
Tables
Table 1: Hydrogen carriers for large quantity and long distance transport. .................................. 6
Table 2: Comparison of key parameters for three prominent electrolysis technologies: alkaline,
proton exchange membrane (PEM) and solid oxide electrolysis (SOE). ...................................... 14
Table 3: Comparison of key parameters for proton exchange membrane electrolysis in recent
publications. .................................................................................................................................. 16
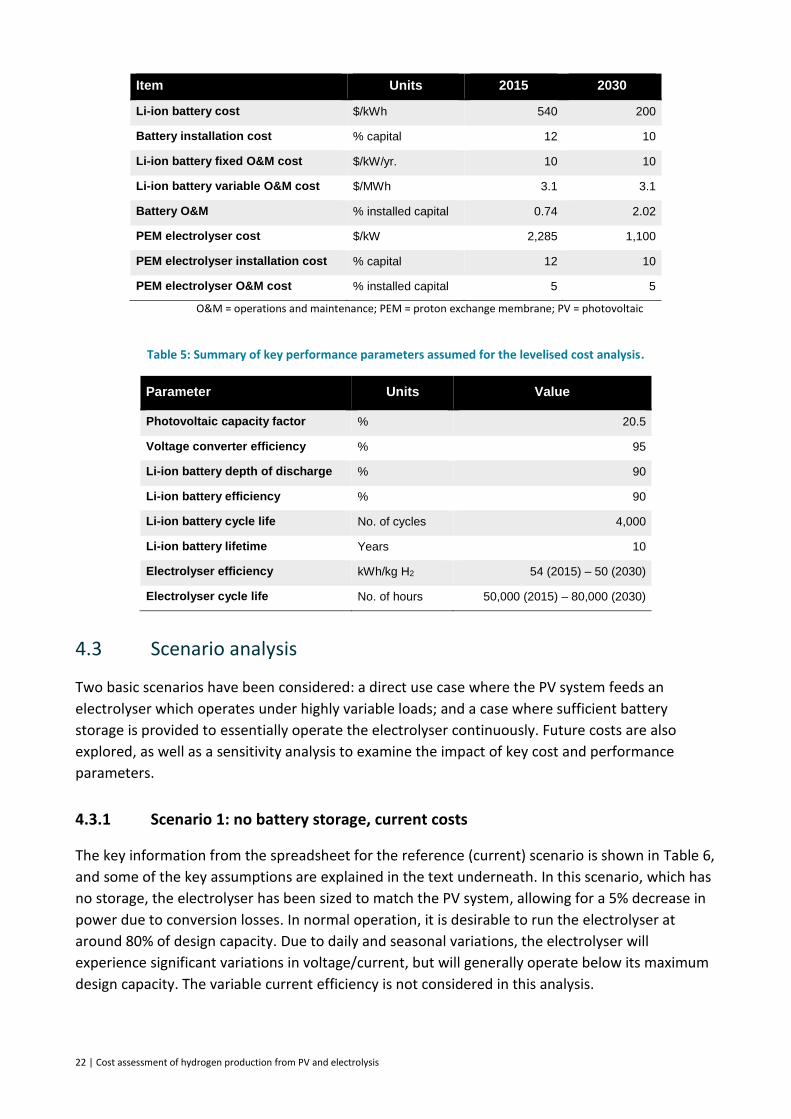
Table 4: Summary of cost data for the years 2015 and 2030 assumed in the levelised cost
analysis. ......................................................................................................................................... 21
Table 5: Summary of key performance parameters assumed for the levelised cost analysis. .... 22
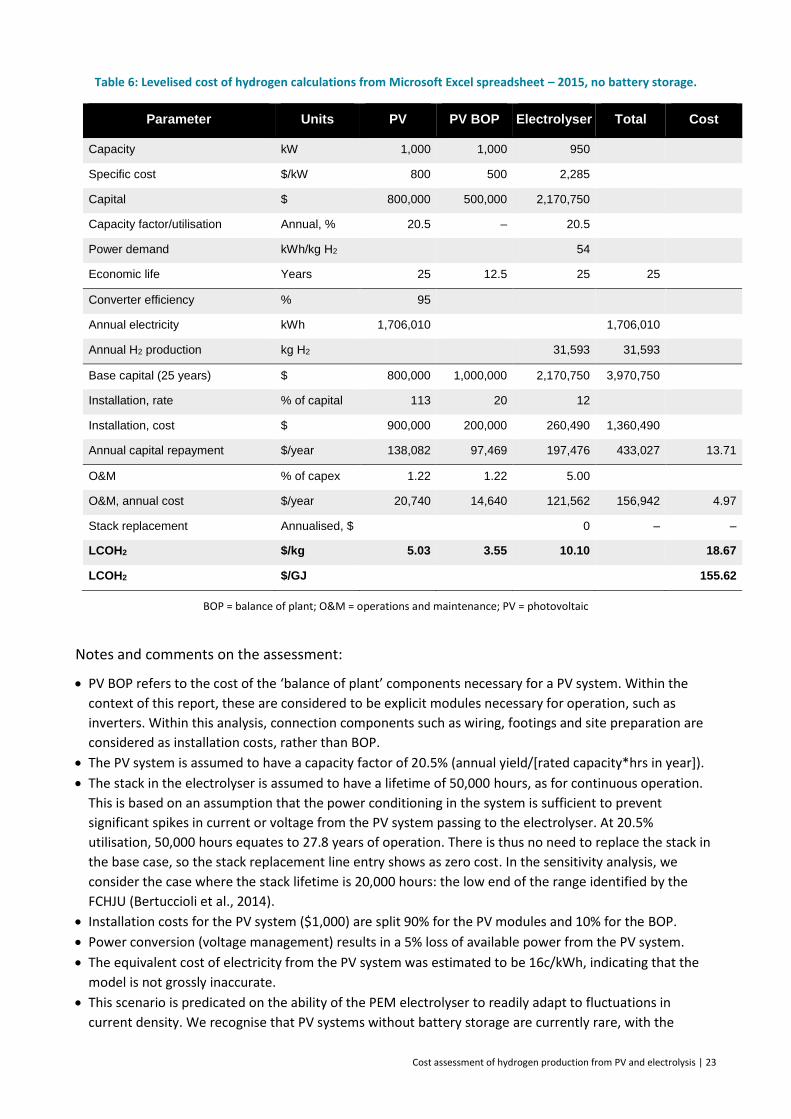
Table 6: Levelised cost of hydrogen calculations from Microsoft Excel spreadsheet – 2015, no
battery storage. ............................................................................................................................. 23
Table 7: Levelised cost of hydrogen calculations from Microsoft Excel spreadsheet – 2015, with
battery storage. ............................................................................................................................. 24
Table 8: Levelised cost of hydrogen calculations from Microsoft Excel spreadsheet – 2030 no
storage. ......................................................................................................................................... 26
Table 9: Levelised cost of hydrogen calculations from Microsoft Excel spreadsheet – 2030 with
battery storage. ............................................................................................................................. 27
Table 10: Upper and lower (+/-30%) values for scenario 1 – 2015, no battery storage. ............. 28
Table 11: Upper and lower (+/-30%) values for scenario 2 (2015) – incorporated battery
storage. ......................................................................................................................................... 29

Cost assessment of hydrogen production from PV and electrolysis | v
Acknowledgments
This project is supported by the Australian Government through the Australian Renewable Energy
Agency.
The authors would like to acknowledge the valuable contributions made by the electrolysis team
at Clayton, including Dr Sukhvinder Badwal and Dr Chris Munnings, who reviewed this report.
The authors would also like to express their thanks to Dr Benjamin Klahr and Dr Eric Miller at the
Fuel Cell Technologies Office of the United States Department of Energy for their review of and
inputs into this report.

vi | Cost assessment of hydrogen production from PV and electrolysis
Executive summary
CSIRO has been leading the development of a roadmap for the Australian solar fuels industry. The
roadmap aims to define the research, development and demonstration priorities to establish and
foster an industry using solar thermal technologies. During the three-year project, the cost of
photovoltaic (PV) technologies has significantly reduced, while interest has grown in the
production of hydrogen from electrolysis. This report, commissioned by ARENA, assesses
hydrogen production from PV and electrolysis. It is intended as both a standalone document and a
useful reference point for comparison with solar thermal technologies. It considers the likely
current cost as well as a ‘realistic, optimistic’ view of future possibilities, as presented in the solar
thermal fuels roadmap.
Our evaluation of the current and future (2030) cost of hydrogen from PV and electrolysis shows
that the potential cost using currently available technology is approximately $18.70/kg H2. The
base case system consists of a PV module with power electronics connected to a proton exchange
membrane electrolysis plant, which produces hydrogen only when the PV system is producing
power. The assessment is based on an estimated system cost of $2300/kW for a large scale, non-
tracking PV system with a mid-range capacity factor of 20.5% and a weighted average cost of
capital of 6.4%, as recently published by the CO2CRC (2015). It is assumed that the uninstalled cost
of the electrolyser and associated components is $2,285/kW, in line with recent estimates from
the European Fuel Cell and Hydrogen Joint Undertaking (Bertuccioli et al., 2014). Significant cost
reductions are predicted for both these technologies, cutting the estimated cost of hydrogen to
$9.10/kg by 2030.
The study also examined the potential of battery storage to reduce the cost of hydrogen
production. In this scenario, the battery system was used to condition the power supply from the
PV system, with sufficient storage capacity provided to enable continuous operation of the
electrolyser. Lithium-ion battery technology was selected as the most appropriate. In both current
and future scenarios, battery storage increased the cost of hydrogen relative to the base case, due
to its relatively high cost compared with energy production from PV. Based on current and future
battery costs of $540 and $200/kWh, the estimated cost of hydrogen was $28.40 and $11.30/kg in
2015 and 2030 respectively. While the current cost with battery storage is much higher than the
case without storage, the gap is expected to be close if projected battery cost targets are met. It
was also interesting to note that the addition of any amount of Li-ion battery storage to the
system increased the hydrogen production cost relative to the base case.
The estimates of hydrogen production costs are significantly higher than the current cost of its
production from steam methane reforming, which is typically in the range of $1.50-2.50/kg H2.
Naturally, however, fossil fuels such as methane produce significant greenhouse gas emissions,
while PV-electrolysis systems are instead based on renewable solar resources and produce zero-
emission fuel.


2 | Cost assessment of hydrogen production from PV and electrolysis
1 Introduction
Solar energy can be converted directly to hydrogen by coupling a photovoltaic (PV) device with
water-splitting technology, such as an electrolyser. This electrolysis pathway uses renewable
resources, resulting in a zero-emission fuel.
Paets van Troostwijk and Deiman first demonstrated the use of electricity to split water in 1797,
and by the early 1900s, industrial-scale hydrogen production using electrolysis was common
(Ostwald, 1980). Because the energy needed to drive the water electrolysis reaction is derived
from electricity, it can be obtained from a wide range of sources: from traditional fossil-fuelled
generation to renewable supplies such as hydropower, wind and solar. Renewable electricity-
based electrolysis emits virtually no greenhouse gases or other pollutants, and is therefore an
attractive future option for production of hydrogen.
As renewable electricity generation technologies have been deployed at increasing rates
throughout the world, the production price for electricity has significantly reduced. Many of these
technologies are now cost competitive with existing generation methods. Coupling renewable
technologies with electrolysis-based hydrogen production also enables the inherent variability of
renewables to be managed, by allowing flexibility to shift production to best match resource
availability with system operational needs and market factors. Additionally, in times of excess
electricity production, instead of curtailing electricity production – as is often the case – the excess
electricity can be used to produce hydrogen through electrolysis.
Several international programs are seeking to evaluate and demonstrate the large-scale
production of hydrogen from electrolysis. The United States Department of Energy (DOE), through
the Hydrogen and Fuel Cell program1, allocates more than US$100 million annually to support the
development of hydrogen production through fuel cell development, as well as addressing system
and regulatory barriers through research and development. Focus areas include:
innovative technologies to increase fuel cell durability
reducing fuel cell costs
reducing the costs of producing, delivering and storing hydrogen, particularly with respect to renewable
hydrogen.
The DOE program also includes technology implementation activities to demonstrate hydrogen
and fuel cell systems under real-world conditions to validate the technology status, as well as to
gather and analyse performance data on existing systems to provide feedback for future research
and development (R&D) efforts. A further goal is to address market barriers by developing
information resources to address safety issues, providing critical information needed for the
development of technically sound codes and standards, and providing financial and technical
assistance to catalyse early market applications. This work is primarily motivated by transport
1 http://www.hydrogen.energy.gov

Cost assessment of hydrogen production from PV and electrolysis | 3
applications, with the electrolyser fed from the power grid and assumed to operate continuously,
as shown in Figure 1.
Figure 1: System configuration used in United States Department of Energy analysis. Source: (Ainscough et al., 2014)
In Europe, improvement of hydrogen production technologies is promoted by the Fuel Cells and
Hydrogen Joint Undertaking (FCHJU)2. This public private partnership supports research,
technological development and demonstration activities in fuel cell and hydrogen energy
technologies. The FCHJU aims to accelerate the market introduction of these technologies,
realising their potential in a future carbon-lean energy system. The primary motivation of this
activity is grid stabilisation and energy storage: assisting in the stabilisation of output from
renewable sources (predominately wind) by providing load in the form of hydrogen generation
where it would otherwise be curtailed. As does the DOE program, the FCHJU recognises that both
automotive applications and hydrogen production for industry may play a significant role in the
future.
More recently, Japan has made some positive announcements in energy policy that aim to support
a transition towards a hydrogen-based energy supply chain (Government of Japan, 2014). To
support this policy, the Japanese government has committed to collaborating with academia,
government and industry in developing large-scale systems for using hydrogen. Their three-phase
process is outlined as:
Phase 1: Dramatic expansion of hydrogen use
Phase 2: Full-fledged introduction of hydrogen power generation/establishment of a large-scale system
for supplying hydrogen
Phase 3: Establishment of a zero-carbon emission hydrogen supply system throughout the manufacturing
process.
1.1 System overview
The basic components of a PV-based electrolysis system include:
a PV array, made of several units
a water purification and preparation system
2 http://www.fch.europa.eu

4 | Cost assessment of hydrogen production from PV and electrolysis
power electronics, such as a DC–DC converter, used to operate the system at the maximum power of the
PV system at all times and to supply the necessary DC current to the electrolyser
an optional DC energy storage system (e.g. battery)
an industrial electrolyser system, including the electrolyser and any gas conditioning components that
are required to produce a pure hydrogen gas stream (e.g. gas dryer)
a compression and storage system for hydrogen.
Each of these subsystems is approaching maturity on an individual basis. However, work is
continuing on system integration and optimisation from both the technical and economic
perspectives. These are being addressed separately from the component development areas of
the European and DOE programs.
Cost assessment of hydrogen production from PV and electrolysis | 5
2 The Market for Hydrogen
2.1 Applications and potential market growth
Historically, hydrogen has been used for several industrial applications. The largest current
consumers are ammonia production plants, oil refineries and methanol production plants. These
applications require such large quantities of hydrogen that it is typically produced at the place of
consumption, most commonly through the steam reforming of natural gas.
In Australia, about 1.3 million tonnes of ammonia is produced annually, partly for the export
market. However, Australia imports a large portion of its nitrogen-based fertilisers, mainly as urea
from the Middle East, and demand is expected to increase. ‘Green ammonia’, generated by
electrolysis from renewable electricity, has the potential to support CO2-free farming through both
domestic and international fertiliser markets.
Hydrogen demand may also grow substantially as a source of clean energy and as a zero-emissions
fuel for vehicles. In 2014, Toyota released the first commercial passenger fuel cell vehicle (FCV)
driven by hydrogen, leading development towards a hydrogen economy in Japan. In 2015,
Hyundai opened the first hydrogen refuelling station in Australia. Other international auto
manufacturers, such as Honda, General Motors, Volkswagen, BMW and Nissan, have plans to
follow.
While the fuel consumption of FCVs may provide an incremental increase to the existing hydrogen
demand, the market could be drastically changed if hydrogen is substituted for natural gas at
thermal power plants. For example, if natural gas was completely replaced by hydrogen at one
100-MW power plant, 31,150 tonnes hydrogen each year would be consumed: equivalent to the
annual demand of 330,000 FCVs3. Such a plan is one element of the new energy strategy of the
Japanese government (METI, 2014; Government of Japan, 2014), due for introduction in the 2020s
– or even earlier, in time for the Tokyo Olympics and Paralympics in 2020.
If hydrogen thermal power plants are commercialised, hydrogen will become a tradable
commodity as an energy carrier, with densely populated countries such as Japan likely to remain
net importers of energy. At the same time, hydrogen production, which currently relies mostly on
fossil fuels, should be switched to a cleaner energy source, such as electrolysis. Alternatively,
hydrogen could be produced in conjunction with carbon capture and storage (CCS), and in the
future with renewables.
Australia is blessed with one of the world’s best solar energy resources, vast resources of fossil
fuels (including brown coal, black coal and natural gas) and areas that may be suitable for CCS.
Together, these mean that the country is well placed to be a market leader in an international
hydrogen trade.
3 Based on calculations using data in the following METI presentation:
http://www.meti.go.jp/committee/kenkyukai/energy/suiso_nenryodenchi/suiso_nenryodenchi_wg/pdf/004_02_00.pdf
6 | Cost assessment of hydrogen production from PV and electrolysis
2.2 Hydrogen transport
One of the biggest challenges in the hydrogen supply chain is its transport. Hydrogen gas is the
lightest molecule and has a very low volumetric density at ambient temperature, making its
transport more expensive than other fuels.
For the transport of large quantities of hydrogen over long distances, pipelines are likely to be the
most sensible solution on land. Efficient and economical systems of marine transport to overseas
countries, such as Japan, will require an increase in energy density. From the point of handling and
stability, storage in a liquid form is potentially more attractive than as gas under high pressure.
Having recognised this issue as a key barrier to transitioning to a hydrogen economy, Japan has
invested significantly, both privately and publicly. Their Energy Carrier Project, supported by the
Cross-Ministerial Strategic Innovation Promotion Program of the Cabinet Office, Government of
Japan, coordinates and supports the necessary R&D for establishing a hydrogen economy. Its goal
is to reduce the cost of hydrogen production and delivery within the supply chain, focusing on
liquid hydrogen carriers, ammonia, methylcyclohexane (MCH), and liquefied hydrogen. The key
parameters of these carriers, which are regarded as the most promising vectors to commercialise
hydrogen import from overseas, are summarised in Table 1 and briefly described below.
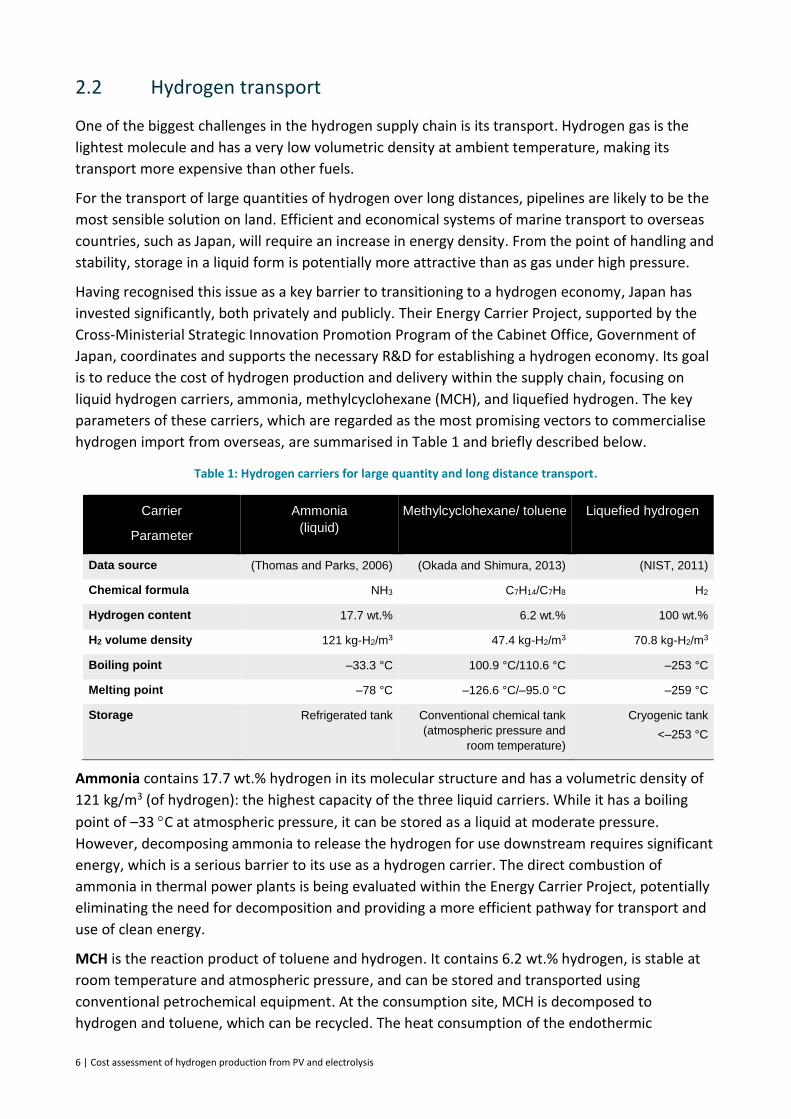
Table 1: Hydrogen carriers for large quantity and long distance transport.
Carrier
Parameter
Ammonia
(liquid)
Methylcyclohexane/ toluene Liquefied hydrogen
Data source (Thomas and Parks, 2006) (Okada and Shimura, 2013) (NIST, 2011)
Chemical formula NH3 C7H14/C7H8 H2
Hydrogen content 17.7 wt.% 6.2 wt.% 100 wt.%
H2 volume density 121 kg-H2/m3 47.4 kg-H2/m3 70.8 kg-H2/m3
Boiling point –33.3 °C 100.9 °C/110.6 °C –253 °C
Melting point –78 °C –126.6 °C/–95.0 °C –259 °C
Storage Refrigerated tank Conventional chemical tank
(atmospheric pressure and
room temperature)
Cryogenic tank
<–253 °C
Ammonia contains 17.7 wt.% hydrogen in its molecular structure and has a volumetric density of
121 kg/m3 (of hydrogen): the highest capacity of the three liquid carriers. While it has a boiling
point of –33 C at atmospheric pressure, it can be stored as a liquid at moderate pressure.
However, decomposing ammonia to release the hydrogen for use downstream requires significant
energy, which is a serious barrier to its use as a hydrogen carrier. The direct combustion of
ammonia in thermal power plants is being evaluated within the Energy Carrier Project, potentially
eliminating the need for decomposition and providing a more efficient pathway for transport and
use of clean energy.
MCH is the reaction product of toluene and hydrogen. It contains 6.2 wt.% hydrogen, is stable at
room temperature and atmospheric pressure, and can be stored and transported using
conventional petrochemical equipment. At the consumption site, MCH is decomposed to
hydrogen and toluene, which can be recycled. The heat consumption of the endothermic

Cost assessment of hydrogen production from PV and electrolysis | 7
dehydrogenation reaction is much less than that of ammonia, but still needs to be considered. The
Chiyoda Corporation has developed an innovative and durable catalyst for dehydrogenation and is
working on a techno-economic evaluation of MCH as a hydrogen carrier, supported by Ministry of
Economy, Trade and Industry of Japan (METI).
Liquefied hydrogen is recognised as an established commodity in industry. However, some
technology development is still necessary to scale up production and handling materials, as well as
large-volume vessels for marine transportation. Additionally, liquefaction is very energy intensive,
and must be considered in the overall efficiency and operation cost. Kawasaki Heavy Industries,
Ltd. (KHI), which is leading the concept of large-scale liquefied hydrogen transport, plans to use
brown coal from the Latrobe Valley in Victoria as a hydrogen resource for their first supply chain.
After gasification of the coal, hydrogen will be liquefied for transport, while the CO2 produced will
be separated and compressed for undersea storage with CCS technology. KHI estimates the cost,
insurance and freight (CIF)4 of hydrogen will be 29.8 JPY/Nm3 ($3.73/kg) at commercialisation,
which can generate electricity at 16 JPY/kWh (18 c/kWh), competitive with conventional gas-fired
power plants in Japan (Yoshimura, 2012). A further feasibility study is ongoing, with the key
technology in the supply chain – a cryogenic vessel for marine transport – being funded by METI
and KHI and expected to be demonstrated by 2020.
4 CIF is a trade term requiring the seller to arrange for the carriage of goods by sea to a port of destination, and provide the buyer with the documents necessary to obtain the goods from the carrier.
8 | Cost assessment of hydrogen production from PV and electrolysis
3 System components
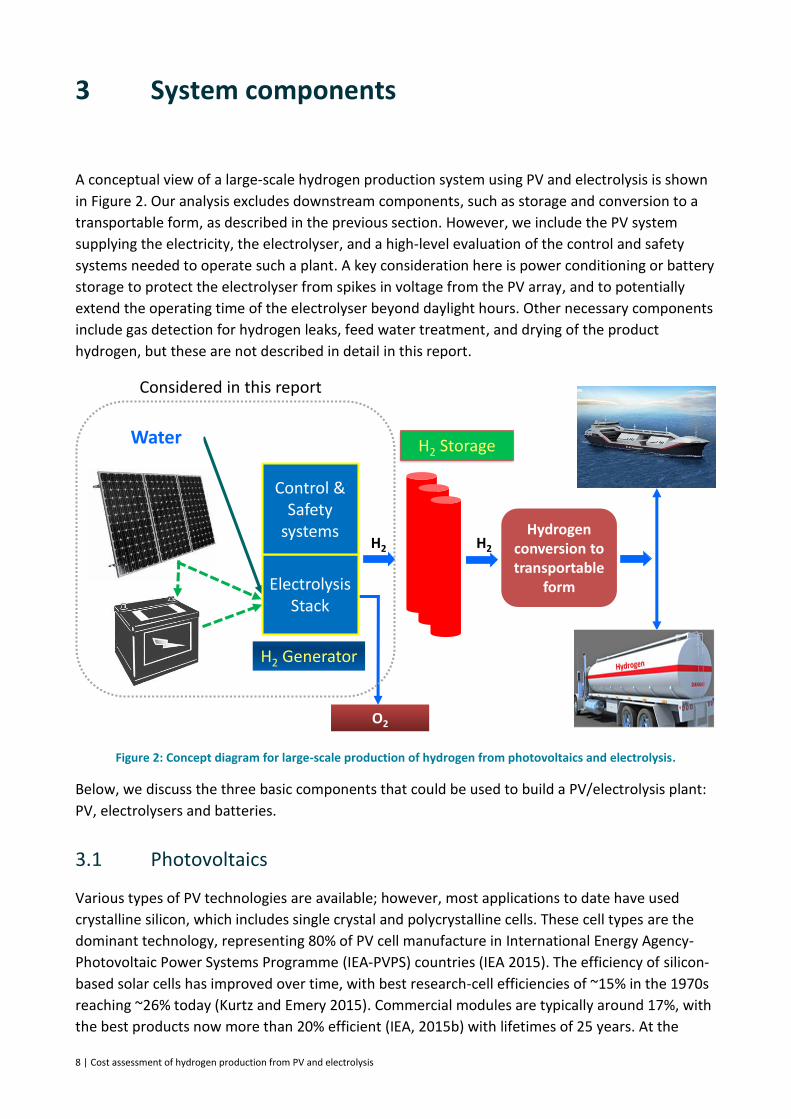
A conceptual view of a large-scale hydrogen production system using PV and electrolysis is shown
in Figure 2. Our analysis excludes downstream components, such as storage and conversion to a
transportable form, as described in the previous section. However, we include the PV system
supplying the electricity, the electrolyser, and a high-level evaluation of the control and safety
systems needed to operate such a plant. A key consideration here is power conditioning or battery
storage to protect the electrolyser from spikes in voltage from the PV array, and to potentially
extend the operating time of the electrolyser beyond daylight hours. Other necessary components
include gas detection for hydrogen leaks, feed water treatment, and drying of the product
hydrogen, but these are not described in detail in this report.
Figure 2: Concept diagram for large-scale production of hydrogen from photovoltaics and electrolysis.
Below, we discuss the three basic components that could be used to build a PV/electrolysis plant:
PV, electrolysers and batteries.
3.1 Photovoltaics
Various types of PV technologies are available; however, most applications to date have used
crystalline silicon, which includes single crystal and polycrystalline cells. These cell types are the
dominant technology, representing 80% of PV cell manufacture in International Energy Agency-
Photovoltaic Power Systems Programme (IEA-PVPS) countries (IEA 2015). The efficiency of silicon-
based solar cells has improved over time, with best research-cell efficiencies of ~15% in the 1970s
reaching ~26% today (Kurtz and Emery 2015). Commercial modules are typically around 17%, with
the best products now more than 20% efficient (IEA, 2015b) with lifetimes of 25 years. At the
Hydrogen conversion to transportable
form
H2 Generator
H2 Storage
H2 H2
O2
Water
Electrolysis Stack
Control & Safety
systems
Considered in this report
Cost assessment of hydrogen production from PV and electrolysis | 9
same time, the cost of cell production has decreased by ~20% for every doubling in cumulative
output (Gambhir, Gross et al. 2014), which equates to a decrease in cost from US$50/W in 1979 to
<US$0.50/W today. The lowest cost available in Australia in 2014 was A$0.60/W (US$0.40/W)
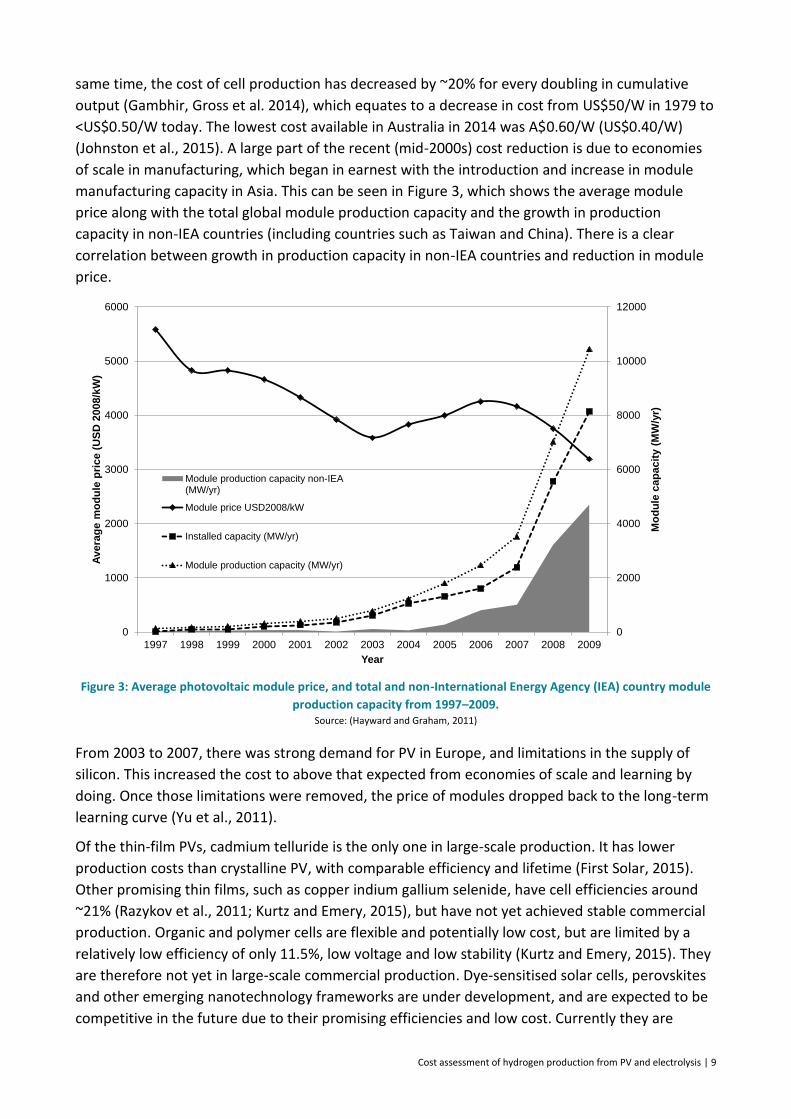
(Johnston et al., 2015). A large part of the recent (mid-2000s) cost reduction is due to economies
of scale in manufacturing, which began in earnest with the introduction and increase in module
manufacturing capacity in Asia. This can be seen in Figure 3, which shows the average module
price along with the total global module production capacity and the growth in production
capacity in non-IEA countries (including countries such as Taiwan and China). There is a clear
correlation between growth in production capacity in non-IEA countries and reduction in module
price.
Figure 3: Average photovoltaic module price, and total and non-International Energy Agency (IEA) country module
production capacity from 1997–2009. Source: (Hayward and Graham, 2011)
From 2003 to 2007, there was strong demand for PV in Europe, and limitations in the supply of
silicon. This increased the cost to above that expected from economies of scale and learning by
doing. Once those limitations were removed, the price of modules dropped back to the long-term
learning curve (Yu et al., 2011).
Of the thin-film PVs, cadmium telluride is the only one in large-scale production. It has lower
production costs than crystalline PV, with comparable efficiency and lifetime (First Solar, 2015).
Other promising thin films, such as copper indium gallium selenide, have cell efficiencies around
~21% (Razykov et al., 2011; Kurtz and Emery, 2015), but have not yet achieved stable commercial
production. Organic and polymer cells are flexible and potentially low cost, but are limited by a
relatively low efficiency of only 11.5%, low voltage and low stability (Kurtz and Emery, 2015). They
are therefore not yet in large-scale commercial production. Dye-sensitised solar cells, perovskites
and other emerging nanotechnology frameworks are under development, and are expected to be
competitive in the future due to their promising efficiencies and low cost. Currently they are
0
2000
4000
6000
8000
10000
12000
0
1000
2000
3000
4000
5000
6000
1997 1998 1999 2000 2001 2002 2003 2004 2005 2006 2007 2008 2009M
od
ule
ca
pa
cit
y (
MW
/yr)
Ave
rag
e m
od
ule
pri
ce
(U
SD
20
08
/kW
)
Year
Module production capacity non-IEA(MW/yr)
Module price USD2008/kW
Installed capacity (MW/yr)
Module production capacity (MW/yr)

10 | Cost assessment of hydrogen production from PV and electrolysis
limited by poor stability, which could be solved with further R&D (Tyagi et al., 2013). Multi-
junction cells have the highest recorded efficiencies of up to 46% for a four-junction concentrated
PV system (Kurtz and Emery, 2015; Fraunhofer ISE, 2014). These cells are typically used for
concentrating solar power systems, as they are too expensive for non-concentrating applications.
PV modules make up only a part of the system cost, and due to their falling prices, are typically no
longer the most expensive component. The remaining system cost includes inverters, frames,
wiring, installation, batteries and chargers (where required) and other soft costs. Figure 5 shows
that PV modules only account for 35% of the overall system cost for a typical grid-connected
residential system in Australia, based on Australian Photovoltaic Institute data (Johnston et al.,
2015). Installation and balance-of-system costs vary between regions and scales of installation
(e.g. rooftop to utility-scale). For example, the installation and balance-of-system costs for rooftop
PV are much lower in Australia than in the United States. This difference was found to be due to
greater regulatory requirements in the United States, and less efficient and thus longer installation
times. Australia has rapid installation times due to effectively standardised system sizes and racks
for installation. Typical Australian residential system sizes have increased from 1 kW to more than
4 kW over the past decade (APVI Solar Map, 2015)5. Competition in the sector, as well as early
standardisation of utility connection agreements, led to these price reductions (Calhoun et al.,
2014).
Figure 4: Contribution of each photovoltaic system component to the overall capital cost of grid-connected
residential PV systems in Australia, 2014.
Note: BOS = balance of system
The 2014 standard PV module cost in Australia was $800/kW, and the best price was $620/kW
(Johnston et al., 2015). As stated above, installation costs depend heavily on the application. For
this paper, we assume that the PV will be installed on a large commercial scale (i.e. greater than
1 MW). The estimated current average residential and small-scale commercial scale system price is
5 http://pv-map.apvi.org.au/analyses
35%
15%
50%
Module
Inverter
Installation and BOS andother
Cost assessment of hydrogen production from PV and electrolysis | 11
$1800/kW (Johnston et al., 2015). However, few large-scale systems have been installed in
Australia to date, and prices are currently estimated to be $2,300/kW (CO2CRC, 2015). While
somewhat counterintuitive and contradictory to economies of scale, this elevated price is
attributed to additional ancillary costs of large-scale installations, such as land acquisition, civil
footings and site preparation, and necessary support frames. Residential installations avoid most
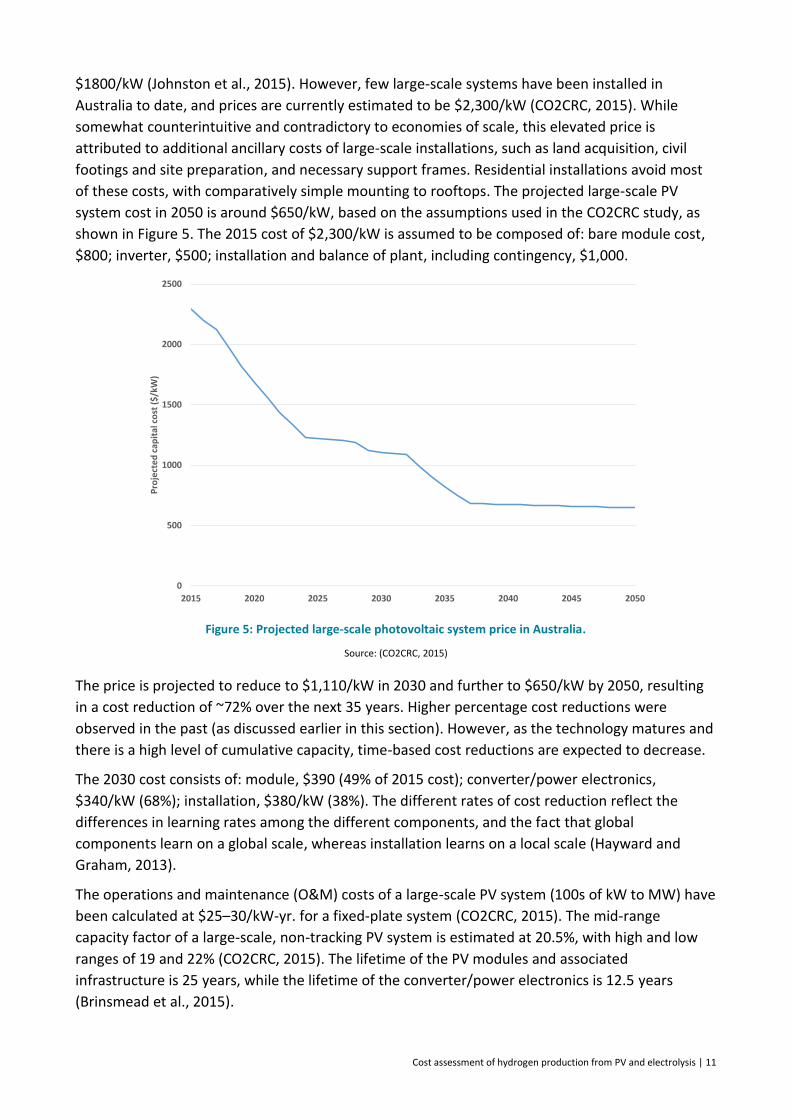
of these costs, with comparatively simple mounting to rooftops. The projected large-scale PV
system cost in 2050 is around $650/kW, based on the assumptions used in the CO2CRC study, as
shown in Figure 5. The 2015 cost of $2,300/kW is assumed to be composed of: bare module cost,
$800; inverter, $500; installation and balance of plant, including contingency, $1,000.
Figure 5: Projected large-scale photovoltaic system price in Australia.
Source: (CO2CRC, 2015)
The price is projected to reduce to $1,110/kW in 2030 and further to $650/kW by 2050, resulting
in a cost reduction of ~72% over the next 35 years. Higher percentage cost reductions were
observed in the past (as discussed earlier in this section). However, as the technology matures and
there is a high level of cumulative capacity, time-based cost reductions are expected to decrease.
The 2030 cost consists of: module, $390 (49% of 2015 cost); converter/power electronics,
$340/kW (68%); installation, $380/kW (38%). The different rates of cost reduction reflect the
differences in learning rates among the different components, and the fact that global
components learn on a global scale, whereas installation learns on a local scale (Hayward and
Graham, 2013).
The operations and maintenance (O&M) costs of a large-scale PV system (100s of kW to MW) have
been calculated at $25–30/kW-yr. for a fixed-plate system (CO2CRC, 2015). The mid-range
capacity factor of a large-scale, non-tracking PV system is estimated at 20.5%, with high and low
ranges of 19 and 22% (CO2CRC, 2015). The lifetime of the PV modules and associated
infrastructure is 25 years, while the lifetime of the converter/power electronics is 12.5 years
(Brinsmead et al., 2015).
0
500
1000
1500
2000
2500
2015 2020 2025 2030 2035 2040 2045 2050
Pro
ject
ed
cap
ital
co
st (
$/k
W)
12 | Cost assessment of hydrogen production from PV and electrolysis
3.2 Electrolysis – state of the art
Three main types of electrolysis technologies are recognised as current or potential products on
the market, each named after the electrolyte type: alkaline electrolysis (AE) (liquid electrolyte),
proton exchange membrane (PEM) electrolysis and solid oxide electrolysis cell (SOE). Each of these
is described below.
AE is a well-established technology, with some relatively large historical installations for
converting hydropower to hydrogen. The electrolyte is typically 30% KOH, which requires no noble
metal catalysts. These units are typically configured with a diaphragm that separates the product
gases, reducing downstream separation and removing safety concerns from mixing. The plants
operate for decades, requiring maintenance only every 7–8 years.
Large AE plants of 95–160 MW have operated in several countries (e.g. India, Zimbabwe, Norway,
Egypt) producing about 20,000–30,000 Nm3/h of hydrogen, generally from hydropower (Smolinka
et al., 2012). While some of these plants have been decommissioned and replaced by low-cost
natural gas reforming, this form of electrolysis today accounts for 4% of global hydrogen
production. The typical system is a few to tens of MW in size, installed in industries such as
metallurgical processing and chemical manufacturing.
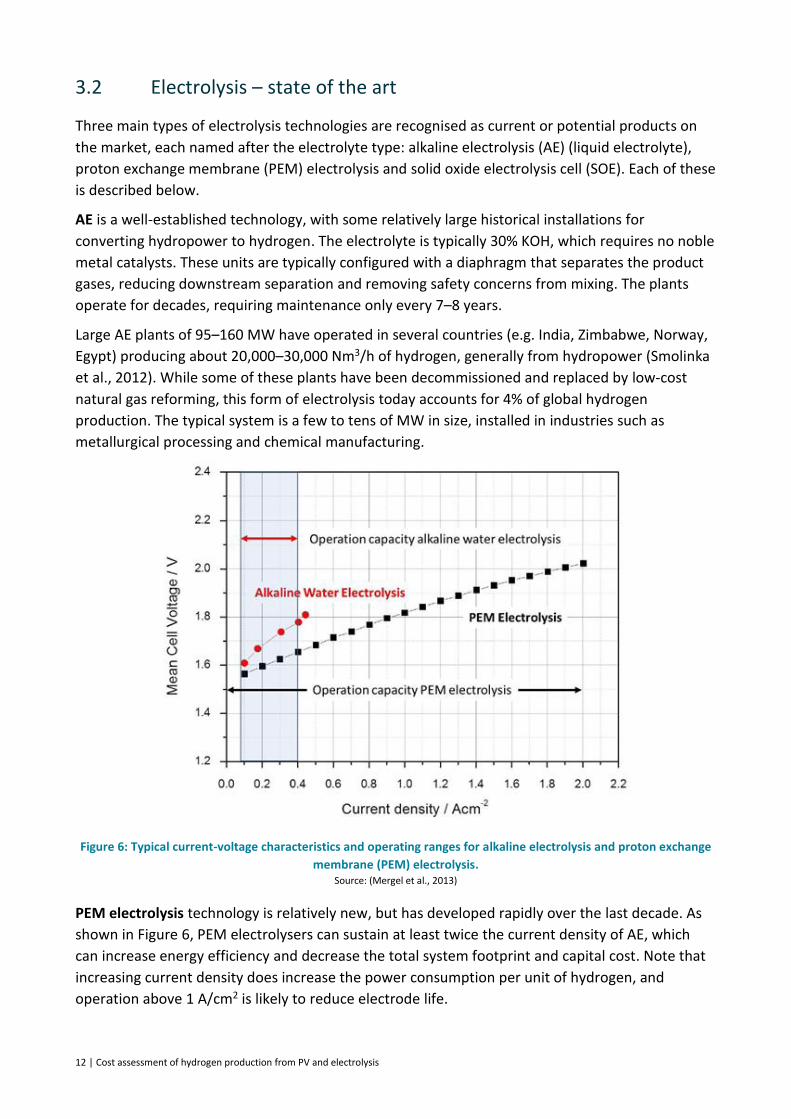
Figure 6: Typical current-voltage characteristics and operating ranges for alkaline electrolysis and proton exchange
membrane (PEM) electrolysis. Source: (Mergel et al., 2013)
PEM electrolysis technology is relatively new, but has developed rapidly over the last decade. As
shown in Figure 6, PEM electrolysers can sustain at least twice the current density of AE, which
can increase energy efficiency and decrease the total system footprint and capital cost. Note that
increasing current density does increase the power consumption per unit of hydrogen, and
operation above 1 A/cm2 is likely to reduce electrode life.
Cost assessment of hydrogen production from PV and electrolysis | 13
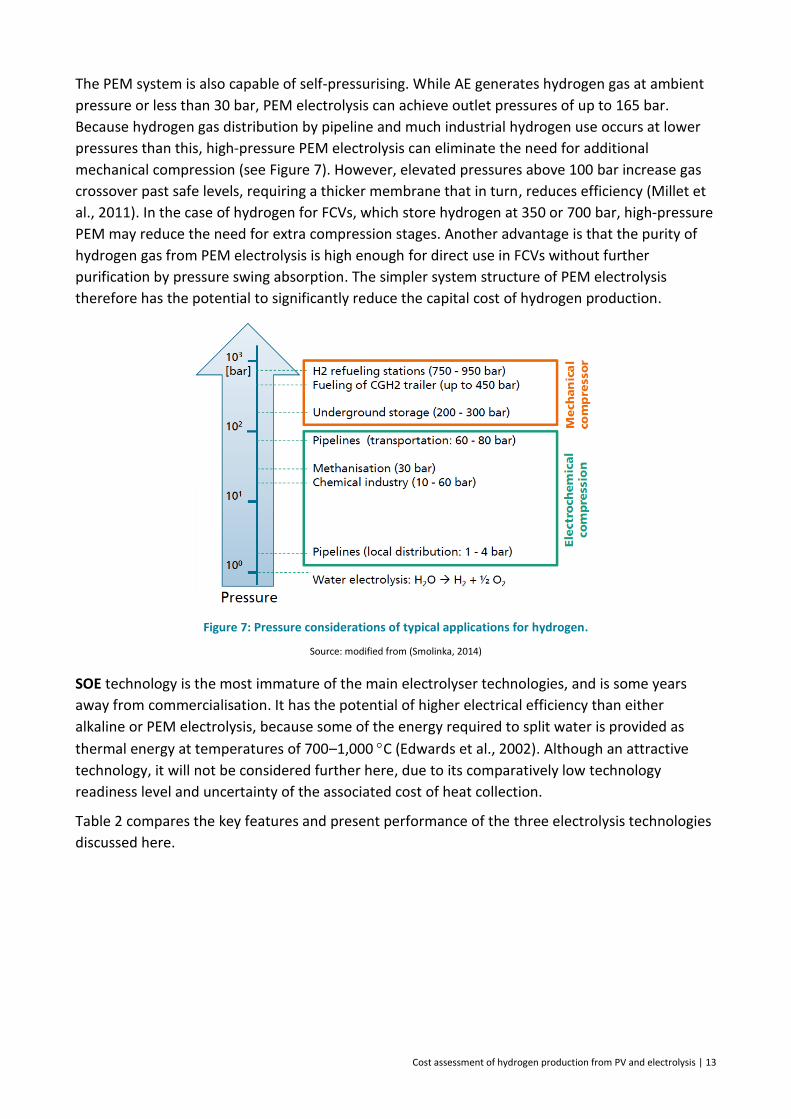
The PEM system is also capable of self-pressurising. While AE generates hydrogen gas at ambient
pressure or less than 30 bar, PEM electrolysis can achieve outlet pressures of up to 165 bar.
Because hydrogen gas distribution by pipeline and much industrial hydrogen use occurs at lower
pressures than this, high-pressure PEM electrolysis can eliminate the need for additional
mechanical compression (see Figure 7). However, elevated pressures above 100 bar increase gas
crossover past safe levels, requiring a thicker membrane that in turn, reduces efficiency (Millet et
al., 2011). In the case of hydrogen for FCVs, which store hydrogen at 350 or 700 bar, high-pressure
PEM may reduce the need for extra compression stages. Another advantage is that the purity of
hydrogen gas from PEM electrolysis is high enough for direct use in FCVs without further
purification by pressure swing absorption. The simpler system structure of PEM electrolysis
therefore has the potential to significantly reduce the capital cost of hydrogen production.
Figure 7: Pressure considerations of typical applications for hydrogen.
Source: modified from (Smolinka, 2014)
SOE technology is the most immature of the main electrolyser technologies, and is some years
away from commercialisation. It has the potential of higher electrical efficiency than either
alkaline or PEM electrolysis, because some of the energy required to split water is provided as
thermal energy at temperatures of 700–1,000 C (Edwards et al., 2002). Although an attractive
technology, it will not be considered further here, due to its comparatively low technology
readiness level and uncertainty of the associated cost of heat collection.
Table 2 compares the key features and present performance of the three electrolysis technologies
discussed here.

14 | Cost assessment of hydrogen production from PV and electrolysis
Table 2: Comparison of key parameters for three prominent electrolysis technologies: alkaline, proton exchange
membrane (PEM) and solid oxide electrolysis (SOE).
Parameter Alkaline PEM SOE
Electrolyte Liquid alkaline KOH Proton exchange
membrane
Ceramic metal compound
Electrode Ni/Fe electrode Noble metals (e.g. Pt, Ir) Ni-doped ceramic
Temperature 50–80 °C RT–90 °C 700–1,000 °C
Pressure <30 bar <165 bar Atmosphere
Unit size (commercial) 3.2 MWe 1.5 MWe kW range
Hydrogen production 760 Nm3/h 285 Nm3/h ~1 Nm3/h
Size (current operation) 10s to 100s of MW <10 MW N/A
Current densities 0.2~0.6 A/cm2 1.0~2.0 A/cm2 N/A
Energy consumption 50–78 kWh/kg 50–83 kWh/kg Energy 35.1 kWh/kg +
Heat 11.5 kWh/kg
Lower partial load range 20–40% 0–20% N/A
Gas purity 99.5–99.9998% 99.9–99.9999% N/A
Lifetime of system 20 years or more <20 years (?) N/A
Lifetime stack <90,000 hours <80,000 hours N/A
Capital investment cost US$850–1,500 per kW US$1,500–3,800 per kW N/A
Compiled from: (Ainscough et al., 2014; Bertuccioli et al., 2014; IEA, 2015a)
3.2.1 Tolerance of variations in power input
Historically, industrial electrolysers have been designed and operated at constant load supplied by
stable grid power. In contrast, coupling electrolysers to renewable power sources requires flexible
and dynamic operation with fluctuating power input. This is not possible with older AE technology,
as a result of cross-diffusion of product gases across the diaphragm under low system loads
(Carmo et al., 2013). The response of an electrolyser stack to changes in power is defined by a
function of both the electrochemistry of the stack and the power electronics. For example, state-
of-the-art PEM electrolysis systems can start up within 1 min from stand-by mode, and follow a
ramp-up or down of power within seconds. This quick response time is a result of tolerance for
lower operational temperatures (20 C) and the lack of delay from inertia within liquid electrolyte
systems (Carmo et al., 2013).
The large load range of renewable power must also be considered. PEM systems tolerate a load as
low as 10% or less of capacity, whereas conventional alkaline electrolysers require a consistent,
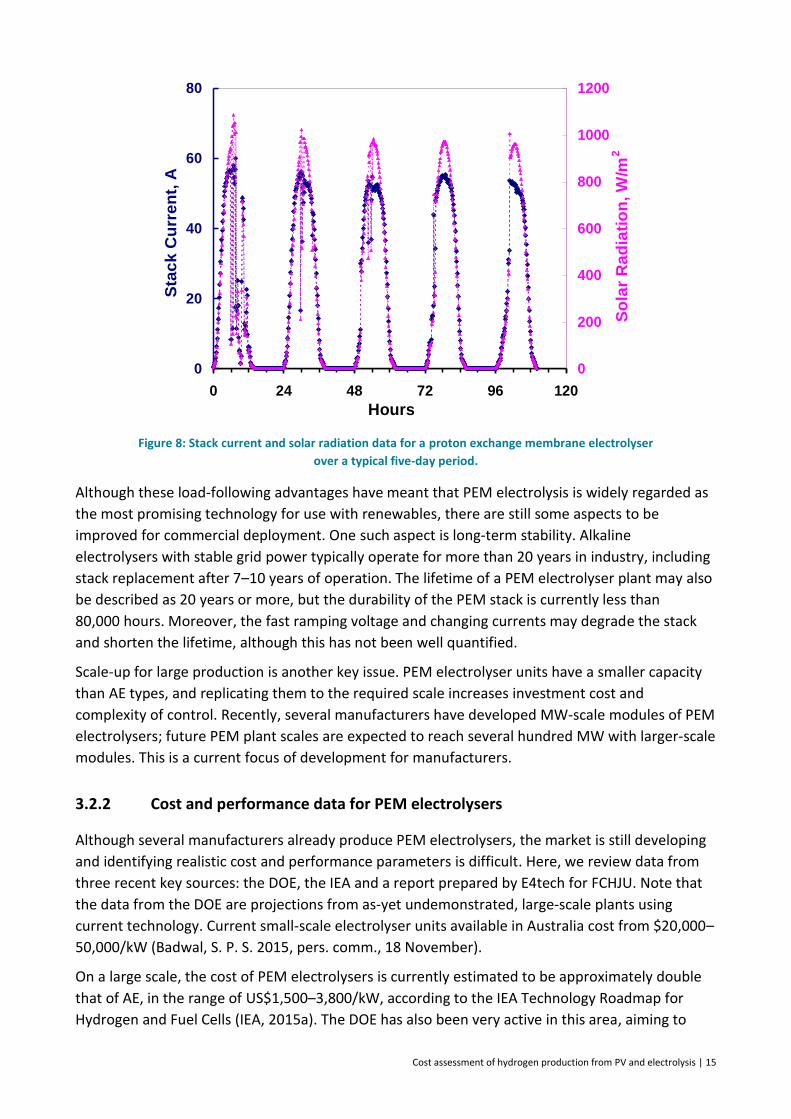
substantial load. Figure 8 shows stack current and solar radiation data over a representative
period of five days for a CSIRO 2-kW PEM electrolyser directly coupled to a 2.4-kW PV array at the
Royal Melbourne Institute of Technology (RMIT University) (Clarke et al., 2009).
Cost assessment of hydrogen production from PV and electrolysis | 15
Figure 8: Stack current and solar radiation data for a proton exchange membrane electrolyser
over a typical five-day period.
Although these load-following advantages have meant that PEM electrolysis is widely regarded as
the most promising technology for use with renewables, there are still some aspects to be
improved for commercial deployment. One such aspect is long-term stability. Alkaline
electrolysers with stable grid power typically operate for more than 20 years in industry, including
stack replacement after 7–10 years of operation. The lifetime of a PEM electrolyser plant may also
be described as 20 years or more, but the durability of the PEM stack is currently less than
80,000 hours. Moreover, the fast ramping voltage and changing currents may degrade the stack
and shorten the lifetime, although this has not been well quantified.
Scale-up for large production is another key issue. PEM electrolyser units have a smaller capacity
than AE types, and replicating them to the required scale increases investment cost and
complexity of control. Recently, several manufacturers have developed MW-scale modules of PEM
electrolysers; future PEM plant scales are expected to reach several hundred MW with larger-scale
modules. This is a current focus of development for manufacturers.
3.2.2 Cost and performance data for PEM electrolysers
Although several manufacturers already produce PEM electrolysers, the market is still developing
and identifying realistic cost and performance parameters is difficult. Here, we review data from
three recent key sources: the DOE, the IEA and a report prepared by E4tech for FCHJU. Note that
the data from the DOE are projections from as-yet undemonstrated, large-scale plants using
current technology. Current small-scale electrolyser units available in Australia cost from $20,000–
50,000/kW (Badwal, S. P. S. 2015, pers. comm., 18 November).
On a large scale, the cost of PEM electrolysers is currently estimated to be approximately double
that of AE, in the range of US$1,500–3,800/kW, according to the IEA Technology Roadmap for
Hydrogen and Fuel Cells (IEA, 2015a). The DOE has also been very active in this area, aiming to
0
20
40
60
80
0 24 48 72 96 120
Hours
Sta
ck
Cu
rre
nt,
A
0
200
400
600
800
1000
1200
So
lar
Ra
dia
tio
n, W
/m2
Stack current and solar radiation data
over a representative period of 5 days

16 | Cost assessment of hydrogen production from PV and electrolysis
understand the potential for hydrogen as a replacement for oil-derived fuels in transport. The cost
target for production and delivery is US$4/gallon of gasoline equivalent (dispensed, untaxed) by
20206, while they estimate the uninstalled cost of large-scale (50,000 kg/day), state-of-the-art
PEM electrolyser plants at US$900/kW (2012 prices) (Ainscough et al., 2014). The FCHJU report
has higher capital costs, projected to decrease from the 2012) price of 1,860 to 2,320 €/kW to a
range of 1,200 to 1,940 €/kW in 2015, including power supply, system control and gas drying
(Bertuccioli et al., 2014).
Table 3 drills down more deeply into the key performance parameters from various reports to
provide realistic values for use in our subsequent levelised cost calculations.
Table 3: Comparison of key parameters for proton exchange membrane electrolysis in recent publications.
Parameter IEA Hydrogen and
Fuel Cell Roadmap
DOE Hydrogen and
Fuel Cell Program
FCHJU Electrolysis in
the European Union
(2015)
Selected value
Reference (IEA, 2015a) (Ainscough et al.,
2014; James et al.,
2013) a
(Bertuccioli et al., 2014)
Capital cost/kW
(current)
US$1,500–3,800
(2014)
US$900 (2012) €1,200–1,940 (by 2015)
Central: €1,570
€1,570
(A$2,285)
Capital cost / kW
(2030)
US$800 (2014) US$400 (2012) €250–1,270 (2014)
Central: €760
US$800
(A$1,100)
Energy consumption
(stack and BOP) –
current
51–61 kWh/kg H2
(65–78% efficient,
HHV)
54.3 kWh/kg H2 47–73 kWh/kg H2
Central: 52 kWh/kg H2
54 kWh/kg H2
Energy consumption
(stack and BOP) –
future (2030)
48 kWh/kg H2
(82% efficient, HHV)
50.3 kWh/kg H2 44–53 kWh/kg H2
Central: 47 kWh/kg H2
50 kWh/kg H2
Stack lifetime –
current
20,000–60,000 hrs
Central: 40,000 hrs
53,000 hrs (7 years,
86% capacity factor)
20,000–90,000 hrs
Central: 62,000 hrs
50,000 hrs
Stack lifetime – future 75,000 hrs 85,000 hrs (10 years,
97% capacity factor)
60,000–90,000 hrs
Central: 78,000 hrs
80,000 hrs
Installation cost –
current
Not mentioned 12% (current)
10% (future)
Specifically excluded 12% current
10% future
Fixed O&M cost 5% 5% 5% at 1 MW, 1.6% at
100 MW, 1.5% at 1 GW
5%
Stack replacement
cost, % of total
installed capital
Not mentioned 40%
(see Section 3.2.3)
Not mentioned 40%
a Based on large-scale centralised production, using current technology but assuming large production volumes
BOP = balance of plant; DOE = United States Department of Energy; FCHJU = Fuel Cells and Hydrogen Joint Undertaking; HHV = higher heating value; IEA = International Energy Agency; O&M = operations and maintenance
6 One kg of H2 is the equivalent of 1.019 gallons of gasoline according to the EPAct transportation Regulatory Activities fuel conversion factors, see http://www1.eere.energy.gov/vehiclesandfuels/epact/fuel_conversion_factors.html

Cost assessment of hydrogen production from PV and electrolysis | 17
3.2.3 Lifetime of electrolyser and stack replacement considerations
Due to the limited commercial development of PEM electrolysis, there is considerable uncertainty
regarding the lifetime and replacement costs for the electrolyser stack. The stack cost is expected
to account for 40–60% of the system cost, due to noble metals and cost-intensive components,
such as the bipolar plates shown in Figure 9. With current technology, noble metals are required
to withstand the corrosive environment (pH ≈ 2) and high overvoltage within PEM electrolysers
(Carmo et al., 2013).
While the bulk of the electrolyser is anticipated to have a lifetime of more than 20 years, the stack
requires periodic replacement. We have not been able to identify any studies that explicitly
mention this cost. The DOE study indicates that the uninstalled stack cost is US$423, or 47% of the
total electrolyser cost of US$900/kW. As the replacement will take place some years after the
original installation, the stack replacement cost is assumed to be 40% of the original installed
capital cost. This equates to a future uninstalled stack cost of US$360/kW: a reduction of 15%.
(a) Indicative system cost
breakdowns for PEM
electrolyser systems
(b) Stack cost break down for
PEM electrolysers
Figure 9: Indicative system and stack cost breakdowns for proton exchange membrane (PEM) electrolysis
(Fuel Cells and Hydrogen Joint Undertaking).
MEA is an acronym for the membrane electrode assembly, which both separates the anode and cathode compartments and contains the active electrodes where the electrochemical reactions take place.

18 | Cost assessment of hydrogen production from PV and electrolysis
3.3 Batteries
While many different types of energy storage technologies are available in a range of scales,
batteries are a suitable storage type to couple with PV systems. They both use DC current, while
batteries are modular and require little or no maintenance (apart from replacement).
Key performance parameters for batteries are the depth of discharge (DoD) which refers to the
useable energy in a battery. A battery can be discharged beyond its DoD, but this will cause
significant degradation and reduce cycle life. Cycle life is the number of cycles of complete
discharge to the DoD a battery can undergo before replacement is needed. A battery can be used
beyond its cycle life, but its performance will be severely compromised. The lifetime in years is
another representation of cycle life, but in time rather than cycles. Most batteries come with a
time-based warranty (10 years), during which they can be repaired or replaced if they fail. The
round-trip efficiency is the percentage of energy a battery provides relative to the amount sent
and stored in the battery. A range of values is typically associated with these performance metrics.
However, because of the modelling required for this study, a single representative value of each
performance parameter has been chosen.
Common battery classes include lead-acid, Li-ion, flow batteries and molten salt, each of which is
described further below. Each class contains subclasses of different chemistries, which can affect
the cost (depending on the materials used) and performance characteristics, and thus the
commercial application.
LiFePO4 batteries (a subclass of Li-ion batteries) are commonly used in power tools, transport
and consumer electronics. While the battery is mature in these applications, it has not been
used to any great extent for residential or utility-scale energy storage, due to cost. A newer Li-
ion subclass, nickel manganese cobalt oxide batteries, has better energy and power density
than LiFePO4. Energy storage systems such as those commercialised by Tesla and Panasonic
use this battery chemistry. Li-ion batteries have the further advantage of a high cell voltage,
which may make them more suitable for coupling with an electrolyser. Disadvantages of these
batteries include safety risks and poor recycling options. The DoD is 90%, the round trip
efficiency is 90% and the batteries last for 4000 cycles or 10 years (Brinsmead et al., 2015).
Lead-acid batteries have been used in transport for many years. Various subclasses of lead-
acid batteries, such as lead-acid gel, have been used in off-grid and remote power applications
for telecommunications and household power. While these batteries are a mature technology
and are low cost, they have shorter lifetimes than Li-ion batteries, and lower energy and
power density. As with Li-ion batteries, disposal and recycling is complex, predominantly as a
result of the lead plates. Advanced lead-acid batteries combine a supercapacitor with a lead-
acid battery to improve performance. These batteries have been used in hybrid vehicles and
for smoothing electrical output from variable renewable generation. However, they are a less
mature technology than conventional lead-acid batteries and are currently higher in cost. The
DoD is 40%, the round trip efficiency is 90% and the batteries last for 10 years or 4000 cycles
(Brinsmead et al., 2015).
Flow and molten salt batteries are even less technically mature than Li-ion or lead-acid
batteries. They have been deployed in remote power applications, but not on a large scale.
Molten salt batteries require a high temperature (~300 C) to operate. As such, these will not
Cost assessment of hydrogen production from PV and electrolysis | 19
be considered for system analysis within this report. The DoD of flow batteries is 100%, the
round trip efficiency is 75% and the lifetime is 10 years or 1500 cycles (Brinsmead et al., 2015).
The type of battery chemistry that is most suited to coupling with PV and an electrolyser is an
energy battery, which could be any of the batteries described above. However, due to the higher
parasitic loads of the flow battery, and the higher cost and the high temperature required for the
molten salt battery, only advanced lead-acid and Li-ion batteries are considered to be suitable for
this application.
Various studies are projecting that the cost of batteries will fall quite significantly in the future,
due to learning-by-doing effects, including economies of scale in manufacturing (Brinsmead et al.,
2015; Bronski et al., 2014). The cost reductions are expected to be similar to those seen for PV. Li-
ion batteries are projected to be lower in cost than advanced lead-acid batteries, reaching
A$180/kWh by 2035 (Brinsmead et al., 2015).
Discarded hybrid electric vehicle batteries can also be used for a PV/electrolysis application. The
performance of these batteries is considered to be reasonable, and they are low in cost. Reusing
something that would otherwise go to waste also makes sense from a sustainability perspective
(James and Hayward, 2012). However, if the batteries’ cycle life is extremely low, the labour costs
of replacement may be too costly. This will depend on the location, since labour rates are higher in
remote than in urban locations. The batteries may also be in more limited supply than newly
manufactured batteries, which could be a potential problem if they are in high demand.
Energy storage systems also have O&M costs, which are 3.1 A$/MWh (variable) and 10 A$/kW-
year (fixed) for Li-ion batteries and 0.5 A$/MWh (variable) and 5 A$/kW-year (fixed) for advanced
lead acid batteries (Zakeri and Syri, 2015).
This study assumes that Li-ion batteries will be used, due to their lower capital cost and higher
DoD than advanced lead-acid batteries.
3.4 Integration of PV and electrolysis
Section 3.2 indicates that PEM electrolysers are well suited for operation under a greater range of
conditions than alkaline electrolysers. Nevertheless, it is inadvisable to directly connect the PV
system and electrolyser, because the yield from a PV system has significant short-term variability
and potentially high ramp rates in terms of the current and voltage that would be seen by the
electrolyser. The typical daily output from a 135-kW PV plant is shown in Figure 10 (Sayeef et al.,
2012). The variability would not be as high for a larger system, which would be more
geographically dispersed. Nevertheless, such spikes can degrade the electrolyser – notably the
catalyst-loaded electrodes – and reduce the lifetime of the electrolyser stack. Therefore, it is
advisable to have some power conditioning between the two systems to manage these load
variations. This could include a supercapacitor, a small battery system or a current-limiting device.

20 | Cost assessment of hydrogen production from PV and electrolysis
Figure 10: Power output from a photovoltaic (PV) plant at the Desert Knowledge Australia Solar Centre (DKASC)
over one day.
Source: (Sayeef et al., 2012)Sayeef et al., 2012)
Direct coupling of PV and electrolysis has been examined experimentally, at least from the point of
view of optimising the yield of hydrogen (Clarke et al., 2009). The authors concluded that it was
possible to avoid the cost of a maximum power point tracker for a loss of only a few per cent in
yield. However, they noted that: ‘Long-term performance degradation of PEM electrolyser, in a
direct coupled solar-hydrogen system over an extended period of operation, is a concern, and
requires further testing to determine the extent to which the degradation is directly attributable
to the variability of the power input as opposed to usage over time at constant power’.
As well as providing some power conditioning, batteries have the potential to enable operation
outside daylight hours. In the next section, we examine the impact of different levels of battery
storage on the levelised cost of hydrogen (LCOH2). We assume that the ‘power electronics’
included as part of the electrolyser system cost in Figure 9 will provide sufficient power
conditioning, and that the inverter and power point tracking in a normal PV control system is not
required.
Cost assessment of hydrogen production from PV and electrolysis | 21
4 Levelised cost of hydrogen model
This study employed a spreadsheet model in Microsoft Excel to evaluate the LCOH2 under several
different system configurations. The model can easily assess changes in any of the key input
parameters, and thus explore future prospects for cost reduction.
4.1 Basic financial assumptions
The LCOH2 is calculated in 2015 Australian dollars. It is a gate price that includes drying but not
additional compression, and does not consider shipping costs. The model is based on a
straightforward calculation in which the various system costs are evaluated and the sum divided
by the amount of hydrogen produced. The initial installed capital cost is amortised over the
assumed economic life of the system (25 years) to determine an annual repayment (using the
‘PMT’ function in Microsoft Excel). The PMT function uses a real weighted average cost of capital
(WACC), assumed to be 6.4%. This value was used in a recent Australian power generation
technology report and is the real WACC before tax (CO2CRC, 2015).
𝐿𝐶𝑂𝐻2 = 𝐴𝑛𝑛𝑢𝑎𝑙 𝑐𝑎𝑝𝑖𝑡𝑎𝑙 𝑟𝑒𝑝𝑎𝑦𝑚𝑒𝑛𝑡 + 𝑂&𝑀 𝐶𝑜𝑠𝑡𝑠
𝐴𝑛𝑛𝑢𝑎𝑙 𝑝𝑟𝑜𝑑𝑢𝑐𝑡𝑖𝑜𝑛 𝑜𝑓 𝐻2
𝐴𝑛𝑛𝑢𝑎𝑙 𝑐𝑎𝑝𝑖𝑡𝑎𝑙 𝑟𝑒𝑝𝑎𝑦𝑚𝑒𝑛𝑡 = −𝑃𝑀𝑇(𝑊𝐴𝐶𝐶, 𝐸𝑐𝑜𝑛𝑜𝑚𝑖𝑐 𝑙𝑖𝑓𝑒, 𝐶𝑎𝑝𝑒𝑥)
Where:
O&M Costs = annual operating and maintenance costs
WACC = weighted average cost of capital (6.4%)
Economic life = 25 years
Capex = installed capital price, including contingencies
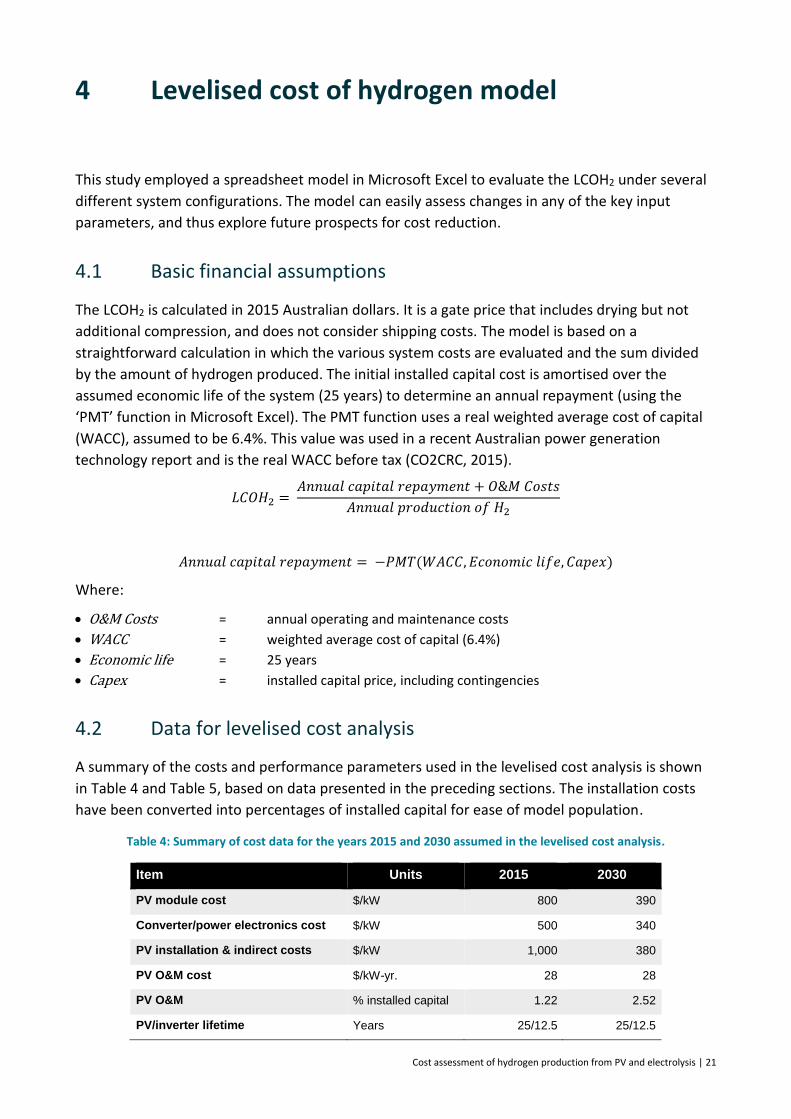
4.2 Data for levelised cost analysis
A summary of the costs and performance parameters used in the levelised cost analysis is shown
in Table 4 and Table 5, based on data presented in the preceding sections. The installation costs
have been converted into percentages of installed capital for ease of model population.
Table 4: Summary of cost data for the years 2015 and 2030 assumed in the levelised cost analysis.
Item Units 2015 2030
PV module cost $/kW 800 390
Converter/power electronics cost $/kW 500 340
PV installation & indirect costs $/kW 1,000 380
PV O&M cost $/kW-yr. 28 28
PV O&M % installed capital 1.22 2.52
PV/inverter lifetime Years 25/12.5 25/12.5
22 | Cost assessment of hydrogen production from PV and electrolysis
Item Units 2015 2030
Li-ion battery cost $/kWh 540 200
Battery installation cost % capital 12 10
Li-ion battery fixed O&M cost $/kW/yr. 10 10
Li-ion battery variable O&M cost $/MWh 3.1 3.1
Battery O&M % installed capital 0.74 2.02
PEM electrolyser cost $/kW 2,285 1,100
PEM electrolyser installation cost % capital 12 10
PEM electrolyser O&M cost % installed capital 5 5
O&M = operations and maintenance; PEM = proton exchange membrane; PV = photovoltaic
Table 5: Summary of key performance parameters assumed for the levelised cost analysis.
Parameter Units Value
Photovoltaic capacity factor % 20.5
Voltage converter efficiency % 95
Li-ion battery depth of discharge % 90
Li-ion battery efficiency % 90
Li-ion battery cycle life No. of cycles 4,000
Li-ion battery lifetime Years 10
Electrolyser efficiency kWh/kg H2 54 (2015) – 50 (2030)
Electrolyser cycle life No. of hours 50,000 (2015) – 80,000 (2030)
4.3 Scenario analysis
Two basic scenarios have been considered: a direct use case where the PV system feeds an
electrolyser which operates under highly variable loads; and a case where sufficient battery
storage is provided to essentially operate the electrolyser continuously. Future costs are also
explored, as well as a sensitivity analysis to examine the impact of key cost and performance
parameters.
4.3.1 Scenario 1: no battery storage, current costs
The key information from the spreadsheet for the reference (current) scenario is shown in Table 6,
and some of the key assumptions are explained in the text underneath. In this scenario, which has
no storage, the electrolyser has been sized to match the PV system, allowing for a 5% decrease in
power due to conversion losses. In normal operation, it is desirable to run the electrolyser at
around 80% of design capacity. Due to daily and seasonal variations, the electrolyser will
experience significant variations in voltage/current, but will generally operate below its maximum
design capacity. The variable current efficiency is not considered in this analysis.
Cost assessment of hydrogen production from PV and electrolysis | 23
Table 6: Levelised cost of hydrogen calculations from Microsoft Excel spreadsheet – 2015, no battery storage.
Parameter Units PV PV BOP Electrolyser Total Cost
Capacity kW 1,000 1,000 950
Specific cost $/kW 800 500 2,285
Capital $ 800,000 500,000 2,170,750
Capacity factor/utilisation Annual, % 20.5 – 20.5
Power demand kWh/kg H2 54
Economic life Years 25 12.5 25 25
Converter efficiency % 95
Annual electricity kWh 1,706,010 1,706,010
Annual H2 production kg H2 31,593 31,593
Base capital (25 years) $ 800,000 1,000,000 2,170,750 3,970,750
Installation, rate % of capital 113 20 12
Installation, cost $ 900,000 200,000 260,490 1,360,490
Annual capital repayment $/year 138,082 97,469 197,476 433,027 13.71
O&M % of capex 1.22 1.22 5.00
O&M, annual cost $/year 20,740 14,640 121,562 156,942 4.97
Stack replacement Annualised, $ 0 – –
LCOH2 $/kg 5.03 3.55 10.10 18.67
LCOH2 $/GJ 155.62
BOP = balance of plant; O&M = operations and maintenance; PV = photovoltaic
Notes and comments on the assessment:
PV BOP refers to the cost of the ‘balance of plant’ components necessary for a PV system. Within the
context of this report, these are considered to be explicit modules necessary for operation, such as
inverters. Within this analysis, connection components such as wiring, footings and site preparation are
considered as installation costs, rather than BOP.
The PV system is assumed to have a capacity factor of 20.5% (annual yield/[rated capacity*hrs in year]).
The stack in the electrolyser is assumed to have a lifetime of 50,000 hours, as for continuous operation.
This is based on an assumption that the power conditioning in the system is sufficient to prevent
significant spikes in current or voltage from the PV system passing to the electrolyser. At 20.5%
utilisation, 50,000 hours equates to 27.8 years of operation. There is thus no need to replace the stack in
the base case, so the stack replacement line entry shows as zero cost. In the sensitivity analysis, we
consider the case where the stack lifetime is 20,000 hours: the low end of the range identified by the
FCHJU (Bertuccioli et al., 2014).
Installation costs for the PV system ($1,000) are split 90% for the PV modules and 10% for the BOP.
Power conversion (voltage management) results in a 5% loss of available power from the PV system.
The equivalent cost of electricity from the PV system was estimated to be 16c/kWh, indicating that the
model is not grossly inaccurate.
This scenario is predicated on the ability of the PEM electrolyser to readily adapt to fluctuations in
current density. We recognise that PV systems without battery storage are currently rare, with the

24 | Cost assessment of hydrogen production from PV and electrolysis
exception of variable input applications such as water pumping, where a variable speed pump may be
appropriate.
4.3.2 Scenario 2: battery storage, current costs
In this scenario, sufficient battery storage is nominally provided to run the electrolyser
continuously. Again, the key details from the spreadsheet are shown in Table 7, while notes and
comments on the assessment are shown underneath. The cost of hydrogen has significantly
increased, from $18.67 to $28.43 per kg, with the battery system contributing $19.95. It should
also be noted that this system is significantly more capital intensive, with an installed cost of
$8.9 M compared to Scenario 1 at $5.3M. This is reflected in the higher contribution of the capital
repayment compared to the ongoing O&M and stack replacement costs (85% compared to 73% in
Scenario 1).
Table 7: Levelised cost of hydrogen calculations from Microsoft Excel spreadsheet – 2015, with battery storage.
Parameter Units PV PV BOP Battery Electrolyser Total Cost
Capacity kW 1,000 1,000 4,458 185
Specific cost $/kW(h) 800 – 540 2,285
Capital $ 800,000 – 2,407,356 421,583
Capacity factor/utilisation Annual, % 20.5% 100%
Power demand kWh/kg H2 54
Economic life Years 25 25 10 25 25
Battery efficiency % 90%
Annual electricity kWh 1,616,220 1,616,220
Annual H2 production kg H2 29,930 29,930
Base capital (25 years) $ 800,000 – 6,018,390 421,583 7,239,973
Installation, rate % of capital 113% 77% 12% 12%
Installation, cost $ 900,000 – 722,207 50,590 1,672,797
Annual capital repayment $ 138,082 0 547,502 38,352 723,935 24.19
O&M % of capex 1.22% 1.22% 0.74% 5.00%
O&M, annual cost $ 20,740 0 49,591 23,609 93,940 3.14
Stack replacement Annualised, $ 33,090 33,090 1.11
LCOH2 $/kg 5.31 – 19.95 3.18 28.43
LCOH2 $/GJ 236.93
BOP = balance of plant; O&M = operations and maintenance; PV = photovoltaic

Cost assessment of hydrogen production from PV and electrolysis | 25
Notes and comments on the assessment:
The sizing of the battery is based on the annual average yield, rather than the likely day-to-day variations,
with higher yields in summer than winter. In practice, this would mean that some of the electricity
generated could not be used, although this is not considered in our analysis. The PV system yields
4,920 kWh per day, but up to 910 kWh can be supplied directly to the electrolyser, meaning that a
storage capacity of 4,010 kWh is required. The battery is assumed to have a DoD of 90%, leading to the
sizing of 4,458 kWh.
The PV BOP has been removed from this scenario, since an inverter is no longer required. We assume
that sufficient current and voltage management is provided in the battery control system. Wiring and
mounting is assumed to be allowed for within the installation cost. This may be an underestimate of the
actual costs.
The battery is assumed to have 90% round-trip efficiency, which is reflected in the reduced annual
hydrogen production compared with Scenario 1.
The other main difference between the two scenarios is in the stack lifetime, in terms of years of
operation. The electrolyser in this scenario is considerably smaller, and operates continuously at constant
load. We assume, as before, that the stack has a lifetime of 50,000 hours. However, as it operates
continuously instead of only six hours a day, periodic stack replacement is required in this scenario. The
bulk of the electrolyser system is assumed to last 25 years, with just some of the stack requiring
replacement; this is assumed to be 40% of the installed cost of the electrolyser.
The model is capable of providing a continuous solution from 25 to 100% utilisation of the
electrolyser. The cost of the battery is high enough that incorporating any storage in the system
increases the LCOH2, as shown in Figure 11. The chart shows the contribution of each system to
the LCOH2, and illustrates that the cost of providing electricity storage is greater than the savings
from a smaller electrolyser system.
Figure 11: Impact of increasing battery storage on the levelised cost of hydrogen for a 1 MW PV system.
PV = photovoltaic
$-
$5
$10
$15
$20
$25
$30
0 20 40 60 80 100
LCO
H2
($A
)
ELECTROLYSER CAPACITY FACTOR (%)
Total
Battery
Electrolyser
PV

26 | Cost assessment of hydrogen production from PV and electrolysis
4.3.3 Future cost of hydrogen – no battery storage
The LCOH2 in 2030 was estimated using the input parameters from Table 4 and Table 5 (Table 8).
The estimated LCOH2 is expected to decrease significantly from $18.67 today to $9.14 in 2030.
Table 8: Levelised cost of hydrogen calculations from Microsoft Excel spreadsheet – 2030 no storage.
Parameter Units PV PV BOP Electrolyser Total Cost
Capacity kW 1,000 1,000 950
Specific cost $/kW 390 340 1,100
Capital $ 390,000 340,000 1,045,000
Capacity factor/utilisation Annual, % 20.5 20.5
Power demand kWh/kg H2 50
Economic life Years 25 12.5 25 25
Converter efficiency % 95
Annual electricity kWh 1,706,010 1,706,010
Annual H2 production kg H2 34,120 34,120
Base capital (25 years) $ 390,000 680,000 1,045,000 2,115,000
Installation, rate % of capital 88 11 12
Installation, cost $ 342,000 76,000 125,400 543,400
Annual capital repayment $ 59,456 61,406 95,065 215,927 6.33
O&M % of capex 2.52 2.52 5.00
O&M, annual cost $ 18,446 19,051 58,520 96,018 2.81
Stack replacement Annualised, $ 0 – –
LCOH2 $/kg 2.28 2.36 4.50 9.14
LCOH2 $/GJ 76.19
BOP = balance of plant; PV = photovoltaic
Notes: the electrolyser stack lifetime is assumed to be 80,000 hours.
As shown in Figure 12, the split between the PV system (module, BOP and installation) and
electrolyser system costs remains around 50%, due to similar cost reductions for each. While the
overall contribution of the PV system remains similar in percentage terms, the BOP costs are
expected to contribute a greater share due to slower learning rates than anticipated for the
modules.

Cost assessment of hydrogen production from PV and electrolysis | 27
Figure 12: Contribution of subsystem costs to LCOH2 (no battery storage) for 2015 and 2030.
4.3.4 Future cost of hydrogen – system with battery storage
The LCOH2 for 2030 with Li-ion battery storage was also calculated. The key data from the
spreadsheet calculation are presented in Table 9. It is apparent from this data that the forecast
cost savings for the battery technology has closed the gap between systems with and without
battery storage. The LCOH2 for the system with battery storage is $11.31, only $2.17 (24%) more
than the system without storage. This is a dramatic change from the situation in 2015, where the
system with battery storage is more than twice as expensive in terms of LCOH2. This is also
reflected in a closing of the gap between respective installed capital costs, which is $3.4M for a
system with battery storage compared to $2.7M without storage.
Table 9: Levelised cost of hydrogen calculations from Microsoft Excel spreadsheet – 2030 with battery storage.
Parameter Units PV Battery Electrolyser Total Cost/kg
Annual capital
repayment
$/year 59,456 199,157 18,133 276,747 8.56
O&M % of capex 2.52 2.02 5.00
O&M, annual cost $/year 18,446 49,591 11,162 79,200 2.45
Stack replacement Annualised, $ 9,778 9,778 0.30
LCOH2 $/kg 2.41 7.70 1.21 11.31
$/GJ 94.28
Notes: battery cost $200/kWh; stack life 80,000 hours.
Battery system costs remain the dominant contributor (around 70%) to the LCOH2, as shown in
Figure 13. The plot also shows that the battery and electrolyser systems are anticipated to show
more significant cost reduction than the PV system, as the latter contributes a greater share of the
future cost than is the case in 2015.
27%
19%
54%
25%
26%
49%
PV system
PV BOP
Electrolyser system
Outer ring: 2030, $9.14/kgInner ring: 2015, $18.67/kg

28 | Cost assessment of hydrogen production from PV and electrolysis
Figure 13: Contribution of subsystem costs on LCOH2 with battery storage for 2015 and 2030.
4.3.5 Sensitivity analysis: parameters with greatest leverage – no storage
In order to investigate the influence of individual factors on the LCOH2 assessments, a sensitivity
analysis was undertaken on the 2015 scenarios. Selected parameters were varied by +/-30%
around the assumed values used in the analysis, to identify the parameters with the greatest
leverage. The calculated upper and lower values for the selected input parameters are shown in
Table 10. In general the ranges are consistent with the upper and lower values identified in the
literature, with the exception of capacity factor and stack lifetime. The expected range of capacity
factor is narrower than shown in Table 10, while the current stack lifetime is thought to be across
a slightly wider range.
Table 10: Upper and lower (+/-30%) values for scenario 1 – 2015, no battery storage.
Parameter Lower Base Upper
PV Module Cost (A$) 560 800 1,040
Inverter/BOP (A$) 350 500 650
PV Installation Cost (A$) 630 900 1,170
Electrolyser Cost (A$) 1,600 2,285 2,970
Capacity Factor (%) 14.35 20.50 26.65
Weighted Average Cost of Capital (%) 4.48 6.40 8.32
Stack Lifetime (hrs) 35,000 50,000 65,000
Through the substitution of these values into the scenario calculations, ranges for the LCOH2 were
evaluated, as plotted in Figure 14.
18.7%
70.2%
11.2%21.3%
68.0%
10.7%
PV system
Battery
Electrolyser system
Outer ring: 2030, $11.31/kgInner ring: 2015, $28.43/kg

Cost assessment of hydrogen production from PV and electrolysis | 29
Figure 14: Tornado chart of LCOH2 with no storage. The base LCOH2 for this scenario is $18.67.
Figure 14 indicates that capacity factor has the greatest influence on the LCOH2, reinforcing the
importance of locating solar plants in areas with a very good solar resource. The electrolyser cost
is the next most influential, which is unsurprising given it dominates both the capital and O&M
costs (partly as consequence of its comparatively high O&M as a percentage of installed capital).
The figure also highlights the importance – or perhaps irrelevance – of increasing stack lifetimes.
Because of the intermittent operation, the stack is already expected to last for the economic life of
the overall system, and future improvements in stack life do not have any impact on LCOH2.
4.3.6 Sensitivity analysis: parameters with greatest leverage – battery storage
A sensitivity analysis was also conducted for scenario 2 (2015) with Li-ion battery storage. The
calculated upper and lower values LCOH2 are presented below in Table 11.
Table 11: Upper and lower (+/-30%) values for scenario 2 (2015) – incorporated battery storage.
Parameter Lower Base Upper
PV Module Cost (A$) 560 800 1,040
PV Installation Cost (A$) 700 1,000 1,300
Battery Cost (A$) 380 540 700
Electrolyser Cost (A$) 1,600 2,285 2,970
Capacity Factor (%) 14.35 20.50 26.65
Weighted Average Cost of Capital (%) 4.48 6.40 8.32
Stack Lifetime (hrs) 35,000 50,000 65,000
Through the substitution of these bounds into the levelised costing model, new values of LCOH2
were calculated, and are illustrated in Figure 15.
$15.00 $17.00 $19.00 $21.00 $23.00 $25.00 $27.00
PV Module Cost
Inverter/BOP
PV Installation Cost
Electrolyser Cost
Capacity Factor (%)
WACC (%)
Stack Lifetime (hrs)
2015 LCOH2 with no storage
Lower Upper
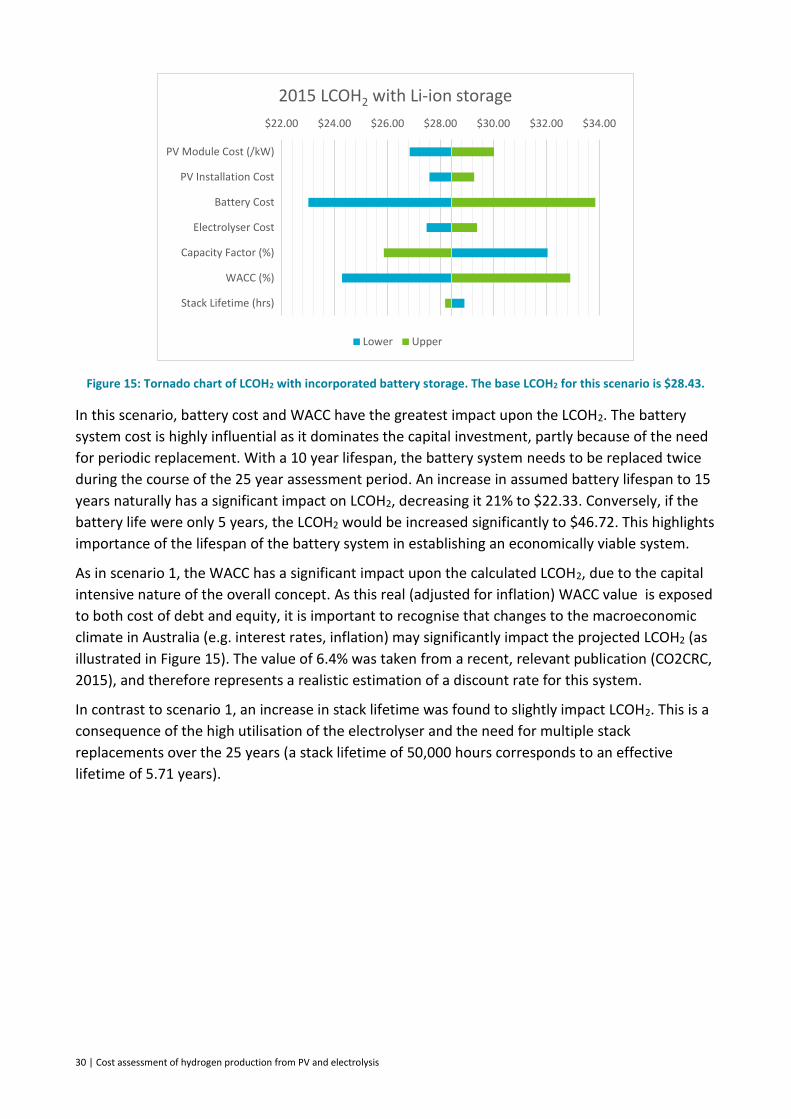
30 | Cost assessment of hydrogen production from PV and electrolysis
Figure 15: Tornado chart of LCOH2 with incorporated battery storage. The base LCOH2 for this scenario is $28.43.
In this scenario, battery cost and WACC have the greatest impact upon the LCOH2. The battery
system cost is highly influential as it dominates the capital investment, partly because of the need
for periodic replacement. With a 10 year lifespan, the battery system needs to be replaced twice
during the course of the 25 year assessment period. An increase in assumed battery lifespan to 15
years naturally has a significant impact on LCOH2, decreasing it 21% to $22.33. Conversely, if the
battery life were only 5 years, the LCOH2 would be increased significantly to $46.72. This highlights
importance of the lifespan of the battery system in establishing an economically viable system.
As in scenario 1, the WACC has a significant impact upon the calculated LCOH2, due to the capital
intensive nature of the overall concept. As this real (adjusted for inflation) WACC value is exposed
to both cost of debt and equity, it is important to recognise that changes to the macroeconomic
climate in Australia (e.g. interest rates, inflation) may significantly impact the projected LCOH2 (as
illustrated in Figure 15). The value of 6.4% was taken from a recent, relevant publication (CO2CRC,
2015), and therefore represents a realistic estimation of a discount rate for this system.
In contrast to scenario 1, an increase in stack lifetime was found to slightly impact LCOH2. This is a
consequence of the high utilisation of the electrolyser and the need for multiple stack
replacements over the 25 years (a stack lifetime of 50,000 hours corresponds to an effective
lifetime of 5.71 years).
$22.00 $24.00 $26.00 $28.00 $30.00 $32.00 $34.00
PV Module Cost (/kW)
PV Installation Cost
Battery Cost
Electrolyser Cost
Capacity Factor (%)
WACC (%)
Stack Lifetime (hrs)
2015 LCOH2 with Li-ion storage
Lower Upper
Cost assessment of hydrogen production from PV and electrolysis | 31
5 Conclusions
Our evaluation of the current and future (2030) cost of hydrogen from PV and electrolysis shows
that the potential cost using currently available technology is approximately $18.70/kg H2. The
base case system consists of a PV module with power electronics connected to a proton exchange
membrane electrolysis plant, which produces hydrogen only when the PV system is producing
power. The assessment is based on an estimated system cost of $2,300/kW for a large scale, non-
tracking PV system with a mid-range capacity factor of 20.5%, as recently published by the
CO2CRC (2015). It is assumed that the uninstalled cost of the electrolyser and associated
components is $2,285/kW, in line with recent estimates from the European Fuel Cell and
Hydrogen Joint Undertaking (Bertuccioli et al., 2014). Significant cost reductions are predicted for
both these technologies, cutting the estimated cost of hydrogen to $9.10/kg by 2030.
The study also examined the potential of battery storage to reduce the cost of hydrogen
production. In this scenario, the battery system was used to condition the power supply from the
PV system, with sufficient storage capacity provided to enable continuous operation of the
electrolyser. Lithium-ion battery technology was selected as the most appropriate. In both current
and future scenarios, battery storage increased the cost of hydrogen relative to the base case, due
to its relatively high cost compared with energy production from PV. Based on current and future
battery costs of $540 and $200/kWh, the estimated cost of hydrogen was $28.40 and $11.30/kg,
respectively. While the current cost with battery storage is much higher than the case without
storage, the gap is expected to be closed if projected battery cost targets are met. It was also
interesting to note that the addition of any amount of Li-ion battery storage to the system
increased the hydrogen production cost relative to the base case.
The estimates of hydrogen production costs are significantly higher than the current cost of its
production from steam methane reforming, which are around $1.50-2.50/kg H2. Naturally,
however, fossil fuels such as methane produce significant greenhouse gas emissions, while PV-
electrolysis systems are instead based on renewable solar resources and produce zero-emission
fuel.

32 | Cost assessment of hydrogen production from PV and electrolysis
References
Ainscough, C., Peterson, D. & Miller, E. 2014. Hydrogen production cost from PEM electrolysis, Washington, USA.
Bertuccioli, L., Chan, A., Hart, D., Lehner, F., Madden, B. & Standen, E. 2014. Study on
development of water electrolysis in the EU, E4tech Sàrl with Element Energy Ltd for the Fuel Cells and Hydrogen Joint Undertaking.
Brinsmead, T. S., Graham, P., Hayward, J., Ratnam, E. L. & Reedman, L. 2015. Future energy
storage trends: an assessment of the economic viability, potential uptake and impacts of electrical energy storage on the NEM 2015-2035, CSIRO, Australia. Report Number: EP155039.
Bronski, P., Creyts, J., Guccione, L., Madrazo, M., Mandel, J., Rader, B., Seif, D., Lilientha, P.,
Glassmire, J., Abromowitz, J., Crowdis, M., Richardson, J., Schmitt, E. & Tocco, H. 2014. The economics of grid defection, Rocky Mountain Institute, Boulder, CO. Available online at: http://www.rmi.org/electricity_grid_defection#economics_of_grid_defection, [Accessed November 2015].
Calhoun, K., Crofton, K., Goodman, J. & McIntosh, R. 2014. Lessons from Australia: reducing solar
PV costs through installation labor efficiency, Rocky Mountain Institute, Boulder, CO. Available online at: http://www.rmi.org/Knowledge-Center/Library/2014-11_RMI-AustraliaSIMPLEBoSFinal, [Accessed May 2015].
Carmo, M., Fritz, D. L., Mergel, J. & Stolten, D. 2013. A comprehensive review on PEM water
electrolysis. International Journal of Hydrogen Energy, 38 (12): pp 4901-4934.
Clarke, R. E., Giddey, S., Ciacchi, F. T., Badwal, S. P. S., Paul, B. & Andrews, J. 2009. Direct coupling
of an electrolyser to a solar PV system for generating hydrogen. International Journal of Hydrogen Energy, 34 (6): pp 2531-2542.
CO2CRC. 2015. Australian Power Generation Technology Report, CO2CRC, Melbourne, Australia.
Available online at: http://www.co2crc.com.au/dls/Reports/LCOE_Report_final_web.pdf, [Accessed: November 2015].
Edwards, J. H., Badwal, S. P. S., Duffy, G. J., Lasich, J. & Ganakas, G. 2002. The application of solid
state ionic technology for novel methods of energy generation and supply. Solid State Ionics, 152–153: pp 843-852.
Cost assessment of hydrogen production from PV and electrolysis | 33
Fraunhofer ISE. 2014. New world record for solar cell efficiency 46%. French-German cooperation confirms competitive advantage of European photovoltaic industry. Available online at: https://www.ise.fraunhofer.de/en/press-and-media/press-releases/press-releases-2014/new-world-record-for-solar-cell-efficiency-at-46-percent. [Accessed November 2015]
Government of Japan. 2014. Strategic Energy Plan [Online]. Japan: Ministry of Economy, Trade and
Industry. Available online at: http://www.enecho.meti.go.jp/en/category/others/basic_plan/pdf/4th_strategic_energy_plan.pdf [Accessed November 2015].
Hayward, J. & Graham, P. 2011. Developments in technology cost drivers - dynamics of
technological change and market forces, Available online at: http://www.garnautreview.org.au/update-2011/commissioned-work/developments-technology-cost-drivers-dynamics-technological-change-market-forces.pdf. [Accessed November 2015]
Hayward, J. & Graham, P. 2013. A global and local endogenous experience curve model for
projecting future uptake and cost of electricity generation technologies. Energy Economics, 40: pp 537-548.
IEA. 2015a. Technology Roadmap for Hydrogen and Fuel Cells, OECD/IEA, Paris, France. Available
online at: https://www.iea.org/publications/freepublications/publication/TechnologyRoadmapHydrogenandFuelCells.pdf. [Accessed November 2015]
IEA. 2015b. Trends 2015: in Photovoltaic Applications, Available online at: http://www.iea-
pvps.org/fileadmin/dam/public/report/national/IEA-PVPS_-_Trends_2015_-_MedRes.pdf. [Accessed November 2015]
James, B., Colella, W., Moton, J., Saur, G. & Ramsden, T. 2013. PEM electrolysis H2A production
case study documentation, Strategic Analysis Inc., Arlington, VA, USA.
James, G. & Hayward, J. 2012. AEMO 100% Renewable Energy Study: Energy Storage, Available
online at: http://www.climatechange.gov.au/reducing-carbon/aemo-report-100-renewable-electricity-scenarios. EP126455. [Accessed November 2015]
Johnston, W., Taeni, C. & Egan, R. 2015. National survey report of PV power applications in
Australia 2014, Australian PV Institute (APVI), Available online at: http://apvi.org.au/wp-content/uploads/2015/09/PV-in-Australia-2014.pdf, [Accessed May 2015].
Kurtz, S. & Emery, K. 2015. Reported timeline of solar cell energy conversion efficiencies since 1976
Available online at: http://www.nrel.gov/ncpv/images/efficiency_chart.jpg: National Renewable Energy Laboratory. [Accessed 25 November 2015].
34 | Cost assessment of hydrogen production from PV and electrolysis
Mergel, J., Carmo, M. & Fritz, D. 2013. Status on technologies for hydrogen production by water electrolysis. In: Stolten, D. & Scherer, V. (eds.) Transition to Renewable Energy Systems. Weinheim: Wiley-VCH.
METI. 2014. Summary of the strategic road map for hydrogen and fuel cells [Online]. Japan:
Japanese Ministry of Economy, Trade and Industry. Available online at: http://www.meti.go.jp/english/press/2014/pdf/0624_04a.pdf [Accessed December 2014].
Millet, P., Nhameni, R., Grigoriev, S. A. & Fateev, V. N. 2011. Scientific and engineering issues
related to PEM technology: Water electrolysers, fuel cells and unitized regenerative systems. International Journal of Hydrogen Energy, 36 (6): pp 4156-4163.
NIST. 2011. Saturation properties for hydrogen — pressure increments [Online]. National Institute
of Standards and Technology. Available online at: http://webbook.nist.gov/cgi/fluid.cgi?Action=Load&ID=C1333740&Type=SatT&Digits=5&PLow=.5&PHigh=1.5&PInc=.1&RefState=DEF&TUnit=K&PUnit=atm&DUnit=kg/m3&HUnit=kJ/mol&WUnit=m/s&VisUnit=uPa*s&STUnit=N/m#Liquid [Accessed October 2015].
Okada, Y. & Shimura, M. 2013. Development of large-scale H2 storage and transportation
technology with Liquid Organic Hydrogen Carrier (LOHC). The 21st Joint GCC-Japan Environment Symposium. Doha, Qatar.
Ostwald, W. 1980. Electrochemistry, History and Theory (1896). translated by N. P. Date, Vol. 1,
Amerind Pub. Co, New Delhi (1980), p. 284.
Razykov, T. M., Ferekides, C. S., Morel, D., Stefanakos, E., Ullal, H. S. & Upadhyaya, H. M. 2011.
Solar photovoltaic electricity: Current status and future prospects. Solar Energy, 85 (8): pp 1580-1608.
Sayeef, S., Heslop, S., Cornforth, D., Moore, T., Percy, S., Ward, J. K., Berry, A. & Rowe, D. 2012.
Solar intermittency: Australia's Clean Energy Challenge, Australia.
Smolinka, T. 2014. Water electrolysis: status and potential for development. Joint NOW GmbH –
FCH JU water electrolysis day. Brussels, Belgium.
Smolinka, T., Garche, J., Hebling, C. & Ehret, O. 2012. Overview on water electrolysis for hydrogen
production and storage - results of the NOW study. Water electrolysis and hydrogen as part of the future renewable energy system. Copenhagen, Denmark.
Thomas, G. & Parks, G. 2006. Potential roles of ammonia in a hydrogen economy: a study of issues
related to the use ammonia for on-board vehicular hydrogen storage, United States Department of Energy, Washington, USA. Available online at: http://www.hydrogen.energy.gov/pdfs/nh3_paper.pdf. [Accessed November 2015]
Cost assessment of hydrogen production from PV and electrolysis | 35
Tyagi, V. V., Rahim, N. A. A., Rahim, N. A. & Selvaraj, J. A. L. 2013. Progress in solar PV technology:
Research and achievement. Renewable and Sustainable Energy Reviews, 20: pp 443-461.
Yoshimura, K. 2012. Feasibility study of CO2 free hydrogen chain. IPHE Workshop: Hydrogen – A
competitive energy storage medium for large scale integration of renewable electricity. Seville, Spain: IPHE.
Yu, C. F., van Sark, W. G. J. H. M. & Alsema, E. A. 2011. Unraveling the photovoltaic technology
learning curve by incorporation of input price changes and scale effects. Renewable and Sustainable Energy Reviews, 15 (1): pp 324-337.
Zakeri, B. & Syri, S. 2015. Electrical energy storage systems: a comparitive life cycle cost analysis.
Renewable & Sustainable Energy Reviews, 42: pp 569-596.

36 | Cost assessment of hydrogen production from PV and electrolysis
CONTACT US
t 1300 363 400 +61 3 9545 2176 e [email protected] w www.csiro.au
AT CSIRO WE SHAPE THE FUTURE
We do this by using science to solve real issues. Our research makes a difference to industry, people and the planet.
As Australia’s national science agency we’ve been pushing the edge of what’s possible for over 85 years. Today we have more than 5,000 talented people working out of 50-plus centres in Australia and internationally. Our people work closely with industry and communities to leave a lasting legacy. Collectively, our innovation and excellence places us in the top ten applied research agencies in the world.
WE ASK, WE SEEK AND WE SOLVE
FOR FURTHER INFORMATION
CSIRO Energy – Solar Thermal Dr Jim Hinkley t +61 2 4960 6128 e [email protected] w www.csiro.au/energy CSIRO Energy – Solar Thermal Robbie McNaughton t +61 2 4960 6047 e [email protected] w www.csiro.au/energy CSIRO Energy – Grids and Energy Efficiency Systems Dr Jenny Hayward t +61 2 4960 6198 e [email protected] w www.csiro.au/energy
Related Documents