Cost and Performance Baseline for Fossil Energy Plants – Volume 2 Coal to Synthetic Natural Gas and Ammonia U.S. Department of Energy National Energy Technology Laboratory July 2011

Cost and Performance Baseline for Fossil Energy Plants – Volume 2 Coal to Synthetic Natural Gas and Ammonia
Feb 25, 2016
Cost and Performance Baseline for Fossil Energy Plants – Volume 2 Coal to Synthetic Natural Gas and Ammonia. U.S. Department of Energy National Energy Technology Laboratory July 2011. Disclaimer - PowerPoint PPT Presentation
Welcome message from author
This document is posted to help you gain knowledge. Please leave a comment to let me know what you think about it! Share it to your friends and learn new things together.
Transcript

Cost and Performance Baseline for Fossil Energy Plants – Volume 2
Coal to Synthetic Natural Gas and AmmoniaU.S. Department of Energy
National Energy Technology LaboratoryJuly 2011
2
Coal to SNG Study, July 2011
Disclaimer
This presentation was prepared as an account of work sponsored by an agency of the United States Government. Neither the United States Government nor any agency thereof, nor any of their employees, makes any warranty, express or implied, or assumes any legal liability or responsibility for the accuracy, completeness, or usefulness of any information, apparatus, product, or process disclosed, or represents that its use would not infringe privately owned rights. Reference therein to any specific commercial product, process, or service by trade name, trademark, manufacturer, or otherwise does not necessarily constitute or imply its endorsement, recommendation, or favoring by the United States Government or any agency thereof. The views and opinions of authors expressed therein do not necessarily state or reflect those of the United States Government or any agency thereof.
3
Coal to SNG Study, July 2011
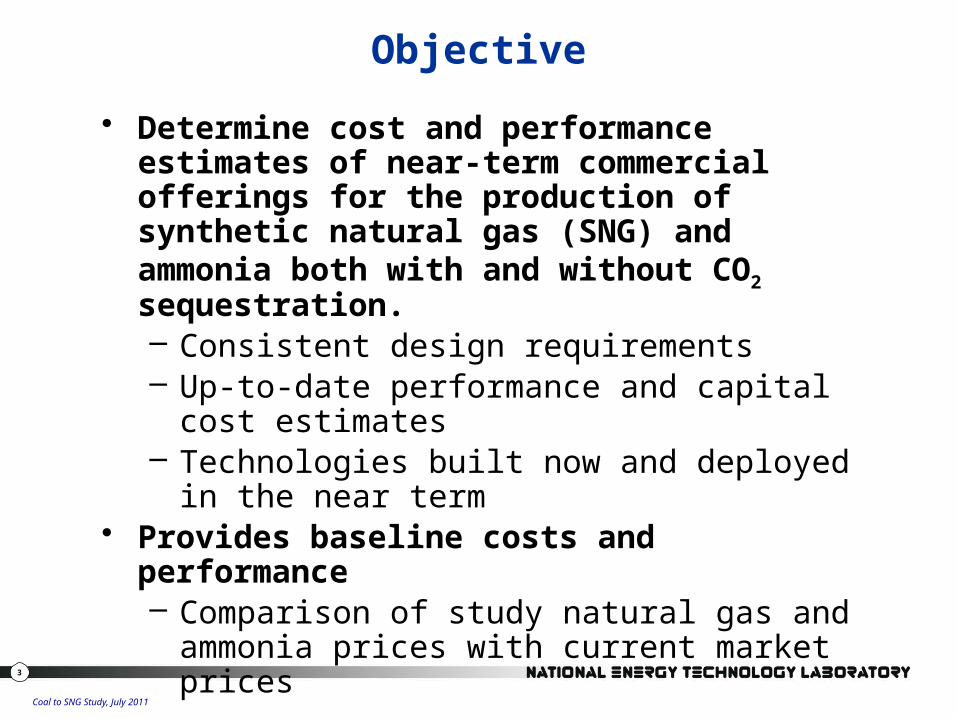
Objective
• Determine cost and performance estimates of near-term commercial offerings for the production of synthetic natural gas (SNG) and ammonia both with and without CO2 sequestration.– Consistent design requirements– Up-to-date performance and capital cost
estimates– Technologies built now and deployed in the near
term• Provides baseline costs and performance
– Comparison of study natural gas and ammonia prices with current market prices
4
Coal to SNG Study, July 2011
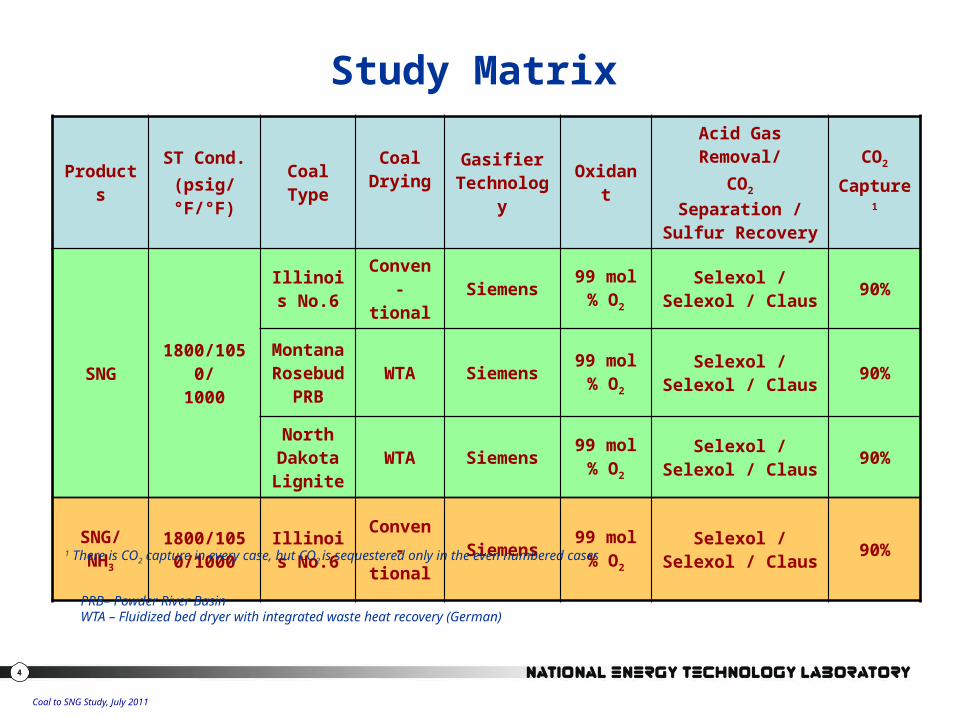
Study Matrix
Products ST Cond.(psig/°F/°F)
Coal Type
Coal Drying Gasifier
Technology OxidantAcid Gas Removal/
CO2 Separation / Sulfur Recovery
CO2
Capture1
SNG 1800/1050/1000
Illinois No.6
Conven-tional Siemens 99 mol%
O2
Selexol / Selexol / Claus 90%
Montana Rosebud
PRBWTA Siemens 99 mol%
O2
Selexol / Selexol / Claus 90%
North Dakota Lignite
WTA Siemens 99 mol% O2
Selexol / Selexol / Claus 90%
SNG/ NH3
1800/1050/1000
Illinois No.6
Conven-tional Siemens 99 mol%
O2
Selexol / Selexol / Claus 90%
PRB– Powder River BasinWTA – Fluidized bed dryer with integrated waste heat recovery (German)
1 There is CO2 capture in every case, but CO2 is sequestered only in the even numbered cases
5
Coal to SNG Study, July 2011
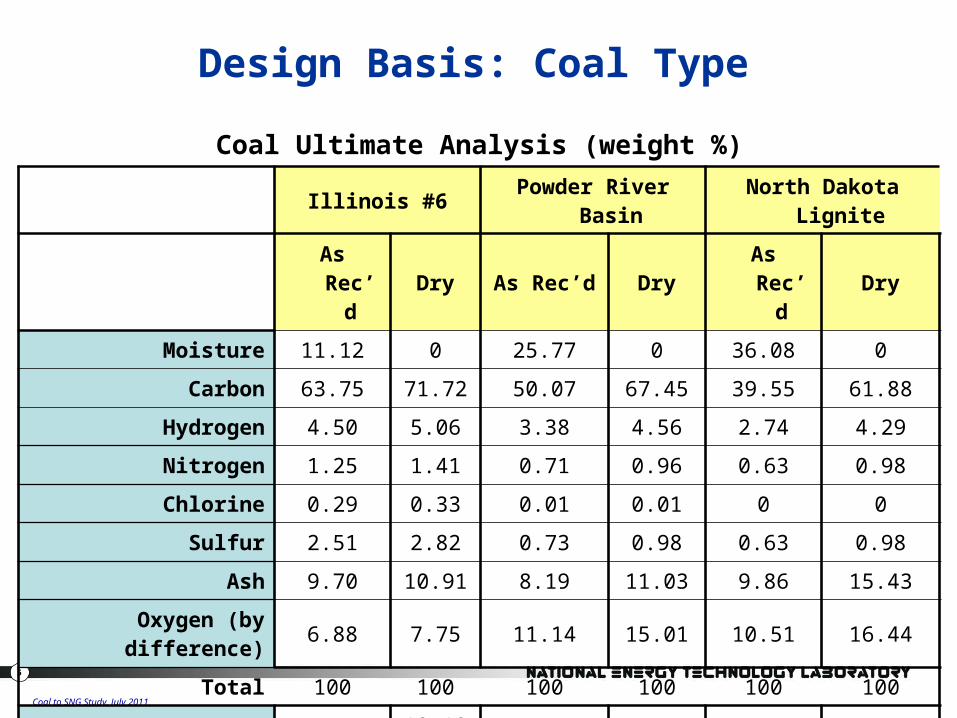
Design Basis: Coal Type
Coal Ultimate Analysis (weight %)Illinois #6 Powder River Basin North Dakota Lignite
As Rec’d Dry As Rec’d Dry As Rec’d Dry
Moisture 11.12 0 25.77 0 36.08 0
Carbon 63.75 71.72 50.07 67.45 39.55 61.88
Hydrogen 4.50 5.06 3.38 4.56 2.74 4.29
Nitrogen 1.25 1.41 0.71 0.96 0.63 0.98
Chlorine 0.29 0.33 0.01 0.01 0 0
Sulfur 2.51 2.82 0.73 0.98 0.63 0.98
Ash 9.70 10.91 8.19 11.03 9.86 15.43
Oxygen (by difference) 6.88 7.75 11.14 15.01 10.51 16.44
Total 100 100 100 100 100 100
HHV (Btu/lb) 11,666 13,126 8,564 11,516 6,617 10,427
6
Coal to SNG Study, July 2011
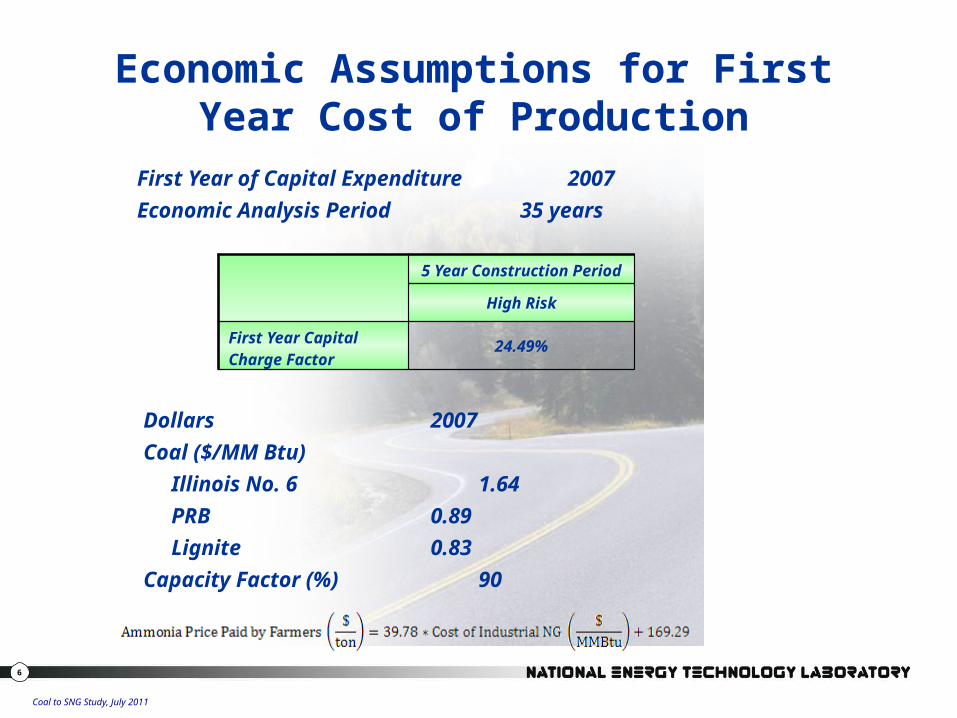
Economic Assumptions for First Year Cost of Production
First Year of Capital Expenditure 2007Economic Analysis Period 35 years
Dollars 2007Coal ($/MM Btu) Illinois No. 6 1.64 PRB 0.89 Lignite 0.83Capacity Factor (%) 90
5 Year Construction Period
High Risk
First Year Capital Charge Factor 24.49%
7
Coal to SNG Study, July 2011
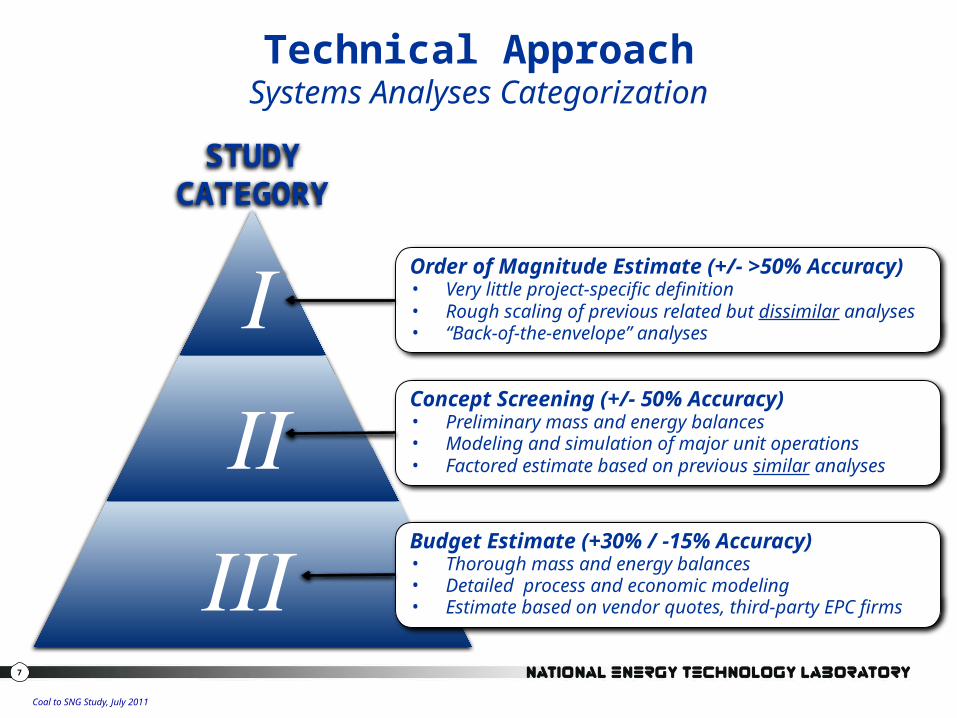
I
II
III
STUDY CATEGORY
Order of Magnitude Estimate (+/- >50% Accuracy)• Very little project-specific definition• Rough scaling of previous related but dissimilar analyses• “Back-of-the-envelope” analyses
Concept Screening (+/- 50% Accuracy)• Preliminary mass and energy balances • Modeling and simulation of major unit operations• Factored estimate based on previous similar analyses
Budget Estimate (+30% / -15% Accuracy)• Thorough mass and energy balances • Detailed process and economic modeling• Estimate based on vendor quotes, third-party EPC firms
Technical ApproachSystems Analyses Categorization
8
Coal to SNG Study, July 2011
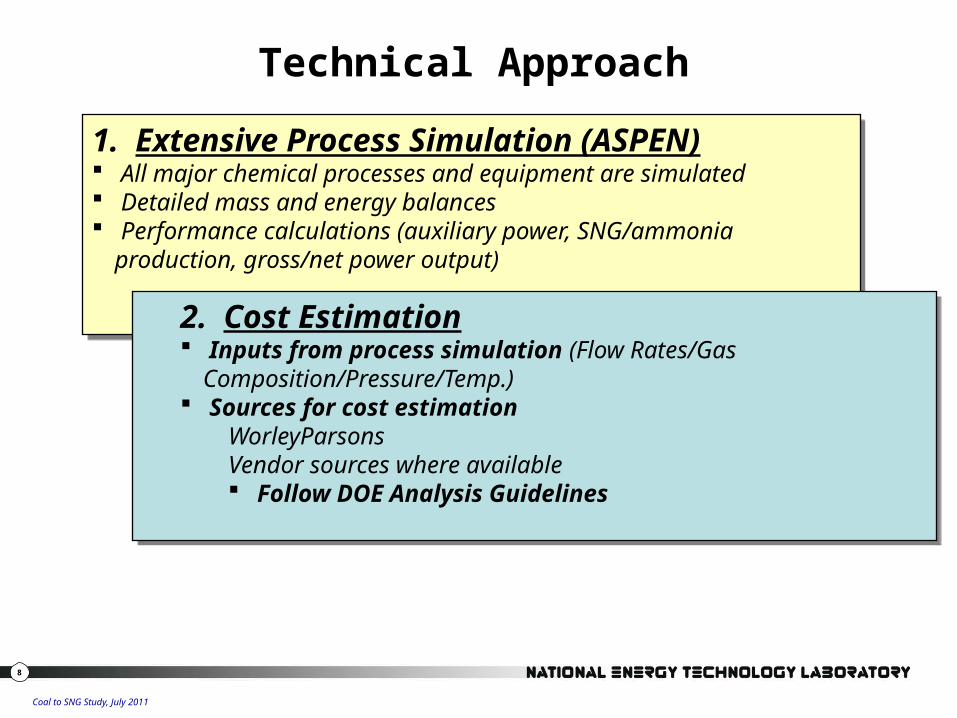
Technical Approach
1. Extensive Process Simulation (ASPEN) All major chemical processes and equipment are simulated Detailed mass and energy balances Performance calculations (auxiliary power, SNG/ammonia
production, gross/net power output)
2. Cost Estimation Inputs from process simulation (Flow Rates/Gas
Composition/Pressure/Temp.) Sources for cost estimation
WorleyParsons Vendor sources where available Follow DOE Analysis Guidelines

9
Coal to SNG Study, July 2011
Study Assumptions
• Capacity Factor assumed to equal Availability at 90%– The addition of CO2 capture, compression, and sequestration
and an ammonia co-production facility was assumed not to impact the availability factor
• Methanation system was modeled using Haldor Topsoe’s high temperature TREMP™ process
• Ammonia reaction was modeled at 2,030 psia based on the Haldor Topsoe S-300 Ammonia Synthesis Loop
• In CO2 sequestration cases, CO2 was compressed to 2,200 psig, transported 50 miles, sequestered in a saline formation at a depth of 4,065 feet and monitored for 80 years
• CO2 transport, storage and monitoring (TS&M) costs were included in the first year cost of production (COP) for sequestration cases
10
Coal to SNG Study, July 2011
SNG and SNG/Ammonia Plants

11
Coal to SNG Study, July 2011
Siemens Gasifier
• SNG production is based on nominal thermal input of 500 megawatt-thermal (MWth) to the gasifier.
• Actual gasifier thermal input varies according to the type of coal feed and ranges from 506 to 550 MWth.
• Heat Recovery includes a partial quench followed by a syngas cooler (This configuration is not currently a commercial offering by Siemens, but is planned for future coal-to-SNG projects)
Source: Siemens
12
Coal to SNG Study, July 2011
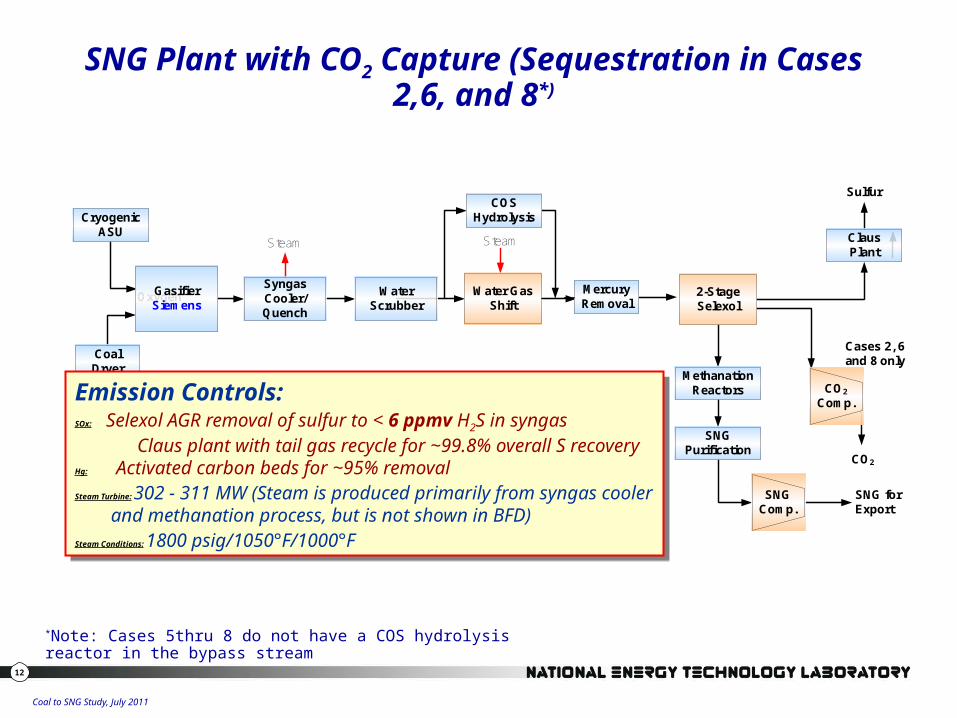
Coal
OxygenGasifierSiemens
Water Gas Shift
Cryogenic ASU
Steam
2-Stage Selexol
ClausPlant
Sulfur
CO2 Comp.
CO2
Steam
Methanation Reactors
Syngas Cooler/Quench
Water Scrubber
COSHydrolysis
Mercury Removal
SNG Purification
SNG Comp.
SNG for Export
Cases 2, 6 and 8 onlyCoal
Dryer
SNG Plant with CO2 Capture (Sequestration in Cases 2,6, and 8*)
Emission Controls:SOx: Selexol AGR removal of sulfur to < 6 ppmv H2S in syngas
Claus plant with tail gas recycle for ~99.8% overall S recoveryHg: Activated carbon beds for ~95% removalSteam Turbine: 302 - 311 MW (Steam is produced primarily from syngas
cooler and methanation process, but is not shown in BFD)Steam Conditions: 1800 psig/1050°F/1000°F
*Note: Cases 5thru 8 do not have a COS hydrolysis reactor in the bypass stream
13
Coal to SNG Study, July 2011
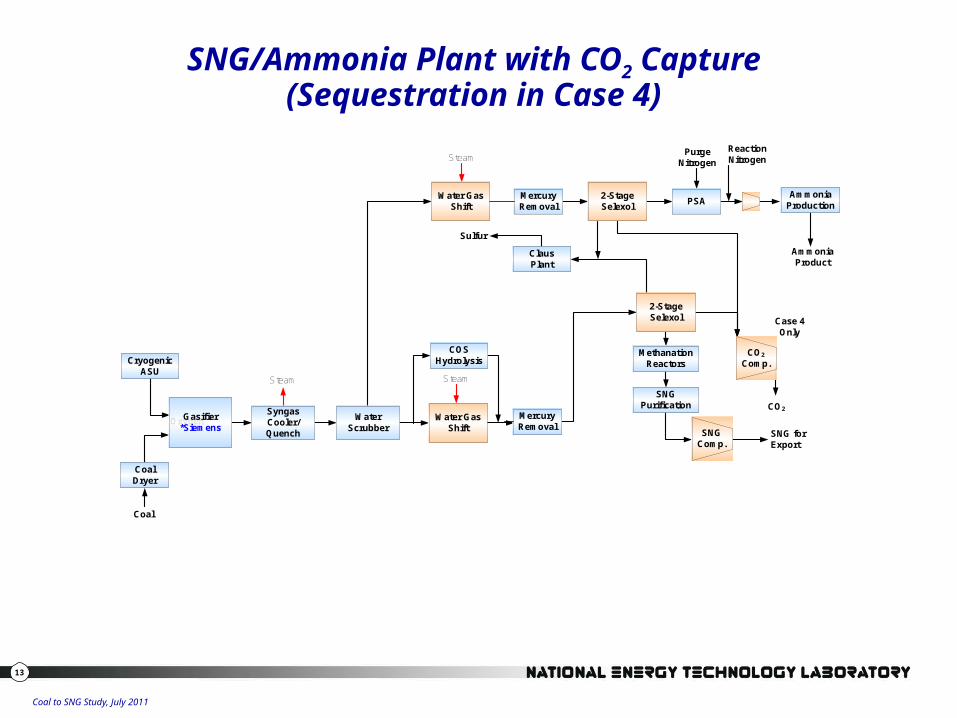
Steam
Coal
OxygenGasifier*Siemens
Water Gas Shift
Cryogenic ASU
Steam
2-Stage Selexol
ClausPlant
Sulfur
CO2 Comp.
CO2
Steam
Methanation Reactors
Syngas Cooler/Quench
Water Scrubber
COSHydrolysis
Mercury Removal
SNG Purification
SNG Comp.
SNG for Export
Water Gas Shift
Mercury Removal
2-Stage Selexol PSA
Purge Nitrogen
Ammonia Production
Ammonia Product
Coal Dryer
Case 4 Only
Reaction Nitrogen
SNG/Ammonia Plant with CO2 Capture (Sequestration in Case 4)
14
Coal to SNG Study, July 2011
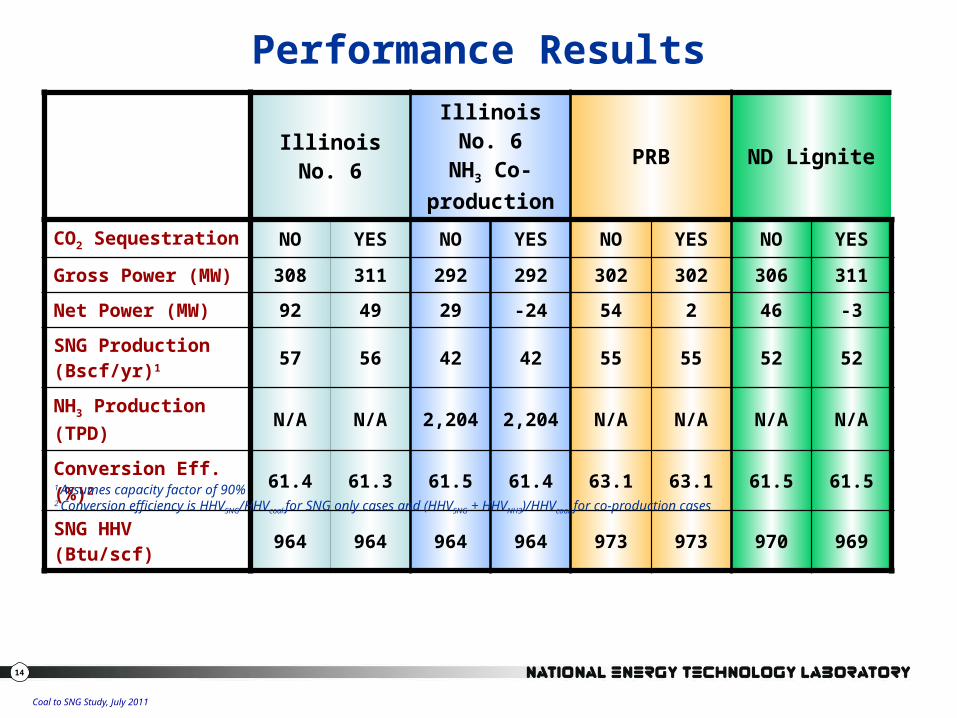
Performance Results
Illinois No. 6Illinois No. 6
NH3 Co-production
PRB ND Lignite
CO2 Sequestration NO YES NO YES NO YES NO YES
Gross Power (MW) 308 311 292 292 302 302 306 311
Net Power (MW) 92 49 29 -24 54 2 46 -3SNG Production (Bscf/yr)1 57 56 42 42 55 55 52 52
NH3 Production (TPD) N/A N/A 2,204 2,204 N/A N/A N/A N/A
Conversion Eff. (%)2 61.4 61.3 61.5 61.4 63.1 63.1 61.5 61.5
SNG HHV (Btu/scf) 964 964 964 964 973 973 970 969
1 Assumes capacity factor of 90%2 Conversion efficiency is HHVSNG/HHVcoal for SNG only cases and (HHVSNG + HHVNH3)/HHVcoal for co-production cases
15
Coal to SNG Study, July 2011
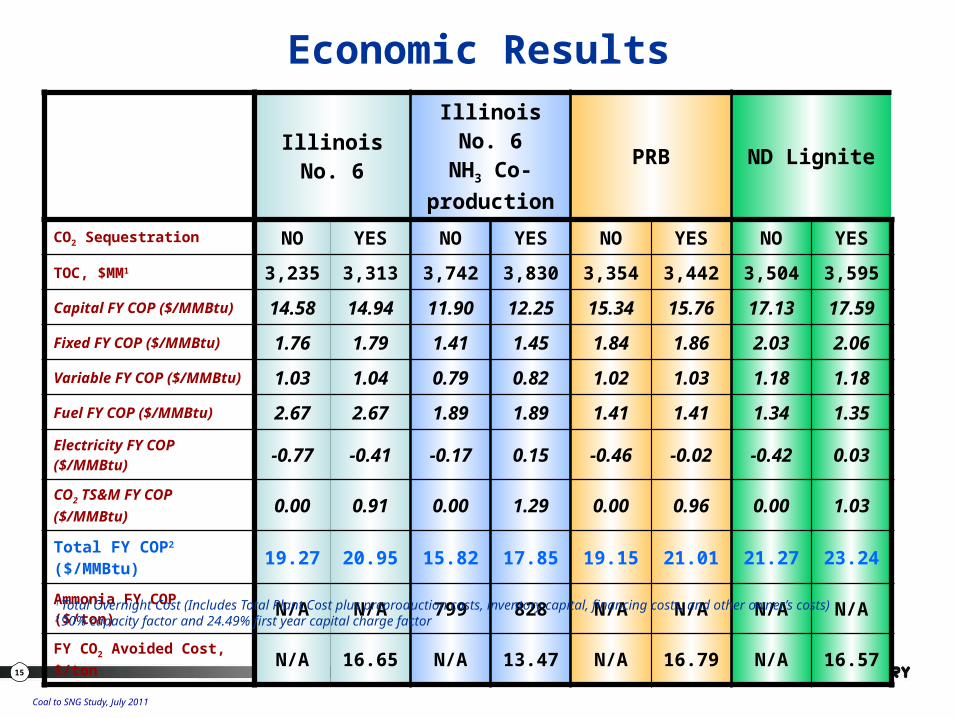
Economic Results
Illinois No. 6Illinois No. 6
NH3 Co-production
PRB ND Lignite
CO2 Sequestration NO YES NO YES NO YES NO YES
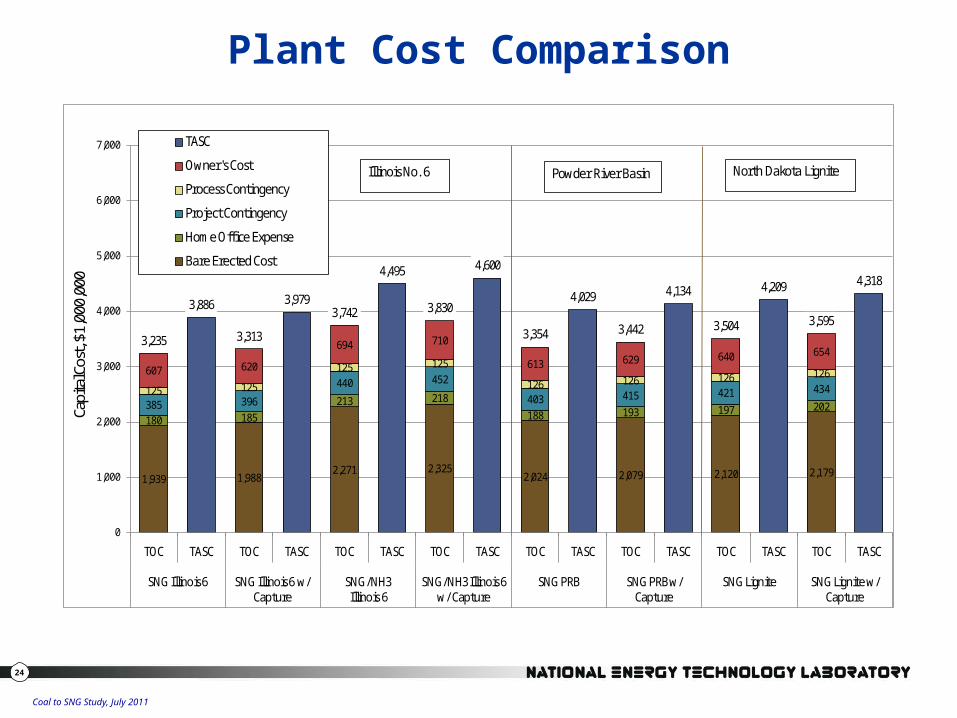
TOC, $MM1 3,235 3,313 3,742 3,830 3,354 3,442 3,504 3,595
Capital FY COP ($/MMBtu) 14.58 14.94 11.90 12.25 15.34 15.76 17.13 17.59
Fixed FY COP ($/MMBtu) 1.76 1.79 1.41 1.45 1.84 1.86 2.03 2.06
Variable FY COP ($/MMBtu) 1.03 1.04 0.79 0.82 1.02 1.03 1.18 1.18
Fuel FY COP ($/MMBtu) 2.67 2.67 1.89 1.89 1.41 1.41 1.34 1.35Electricity FY COP ($/MMBtu) -0.77 -0.41 -0.17 0.15 -0.46 -0.02 -0.42 0.03
CO2 TS&M FY COP ($/MMBtu) 0.00 0.91 0.00 1.29 0.00 0.96 0.00 1.03
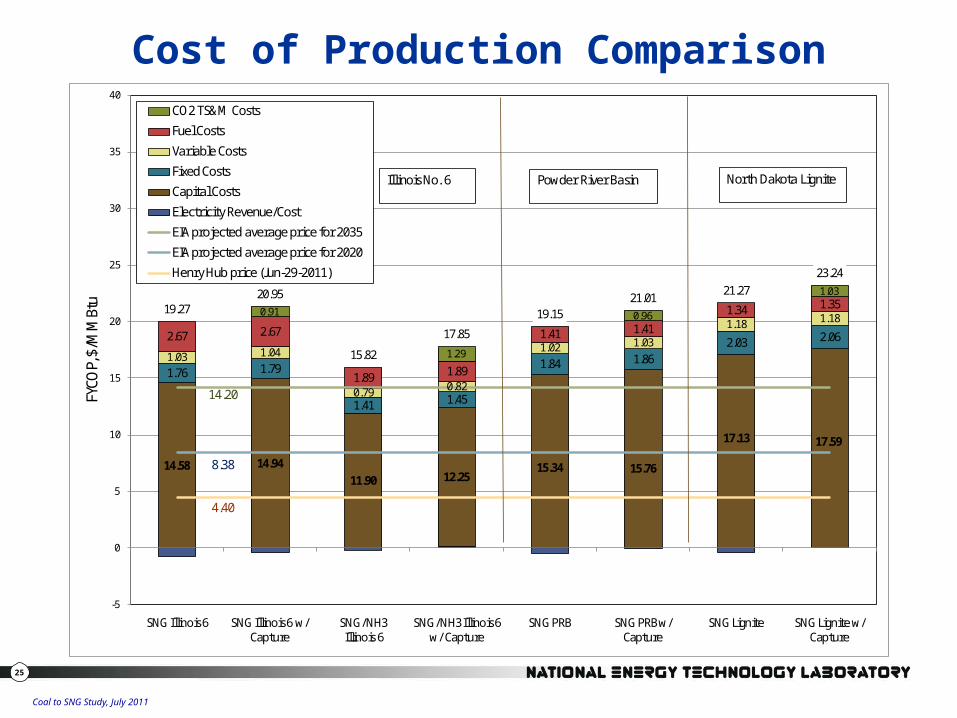
Total FY COP2 ($/MMBtu) 19.27 20.95 15.82 17.85 19.15 21.01 21.27 23.24
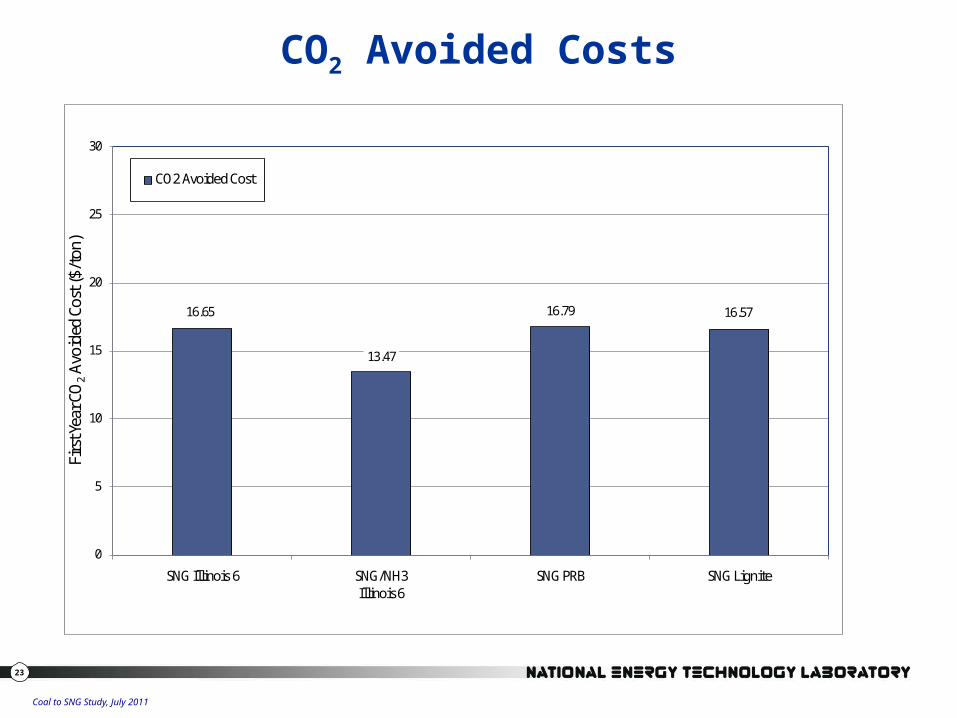
Ammonia FY COP ($/ton) N/A N/A 799 828 N/A N/A N/A N/AFY CO2 Avoided Cost, $/ton N/A 16.65 N/A 13.47 N/A 16.79 N/A 16.57
1 Total Overnight Cost (Includes Total Plant Cost plus preproduction costs, inventory capital, financing costs, and other owner’s costs)2 90% capacity factor and 24.49% first year capital charge factor

16
Coal to SNG Study, July 2011
Environmental Performance Comparison
17
Coal to SNG Study, July 2011
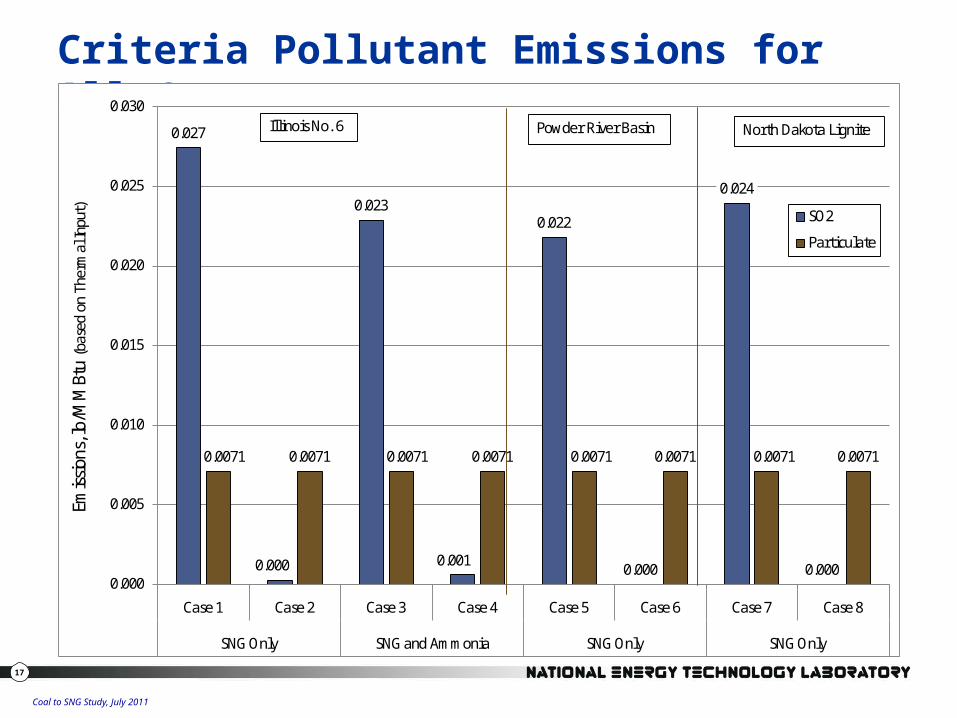
Criteria Pollutant Emissions for All Cases
0.027
0.000
0.023
0.001
0.022
0.000
0.024
0.000
0.0071 0.0071 0.0071 0.0071 0.0071 0.0071 0.0071 0.0071
0.000
0.005
0.010
0.015
0.020
0.025
0.030
Case 1 Case 2 Case 3 Case 4 Case 5 Case 6 Case 7 Case 8
SNG Only SNG and Ammonia SNG Only SNG Only
Emiss
ions
, lb/
MM
Btu
(bas
ed o
n Th
erm
al In
put) SO2
Particulate
Illinois No. 6 Powder River Basin North Dakota Lignite
18
Coal to SNG Study, July 2011
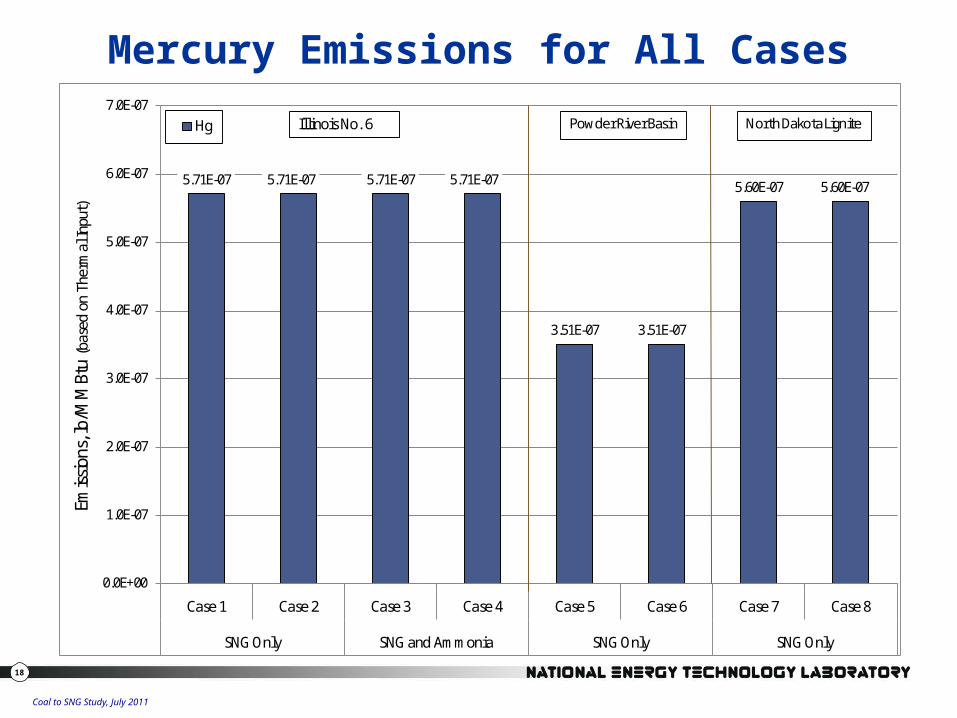
Mercury Emissions for All Cases
5.71E-07 5.71E-07 5.71E-07 5.71E-07
3.51E-07 3.51E-07
5.60E-07 5.60E-07
0.0E+00
1.0E-07
2.0E-07
3.0E-07
4.0E-07
5.0E-07
6.0E-07
7.0E-07
Case 1 Case 2 Case 3 Case 4 Case 5 Case 6 Case 7 Case 8
SNG Only SNG and Ammonia SNG Only SNG Only
Emiss
ions
, lb/
MM
Btu
(bas
ed o
n Th
erm
al In
put)
Hg Illinois No. 6 Powder River Basin North Dakota Lignite
19
Coal to SNG Study, July 2011
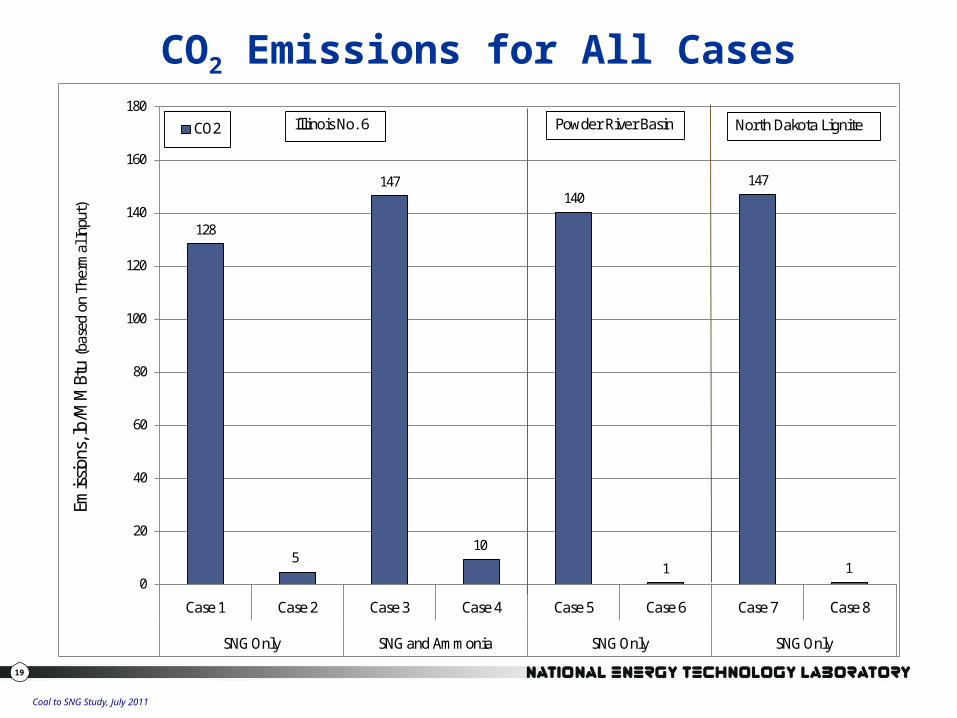
CO2 Emissions for All Cases
128
5
147
10
140
1
147
10
20
40
60
80
100
120
140
160
180
Case 1 Case 2 Case 3 Case 4 Case 5 Case 6 Case 7 Case 8
SNG Only SNG and Ammonia SNG Only SNG Only
Emiss
ions
, lb/
MM
Btu
(bas
ed o
n Th
erm
al In
put)
CO2 Illinois No. 6 Powder River Basin North Dakota Lignite
20
Coal to SNG Study, July 2011
Raw Water Withdrawal and Consumption Comparison
21
Coal to SNG Study, July 2011
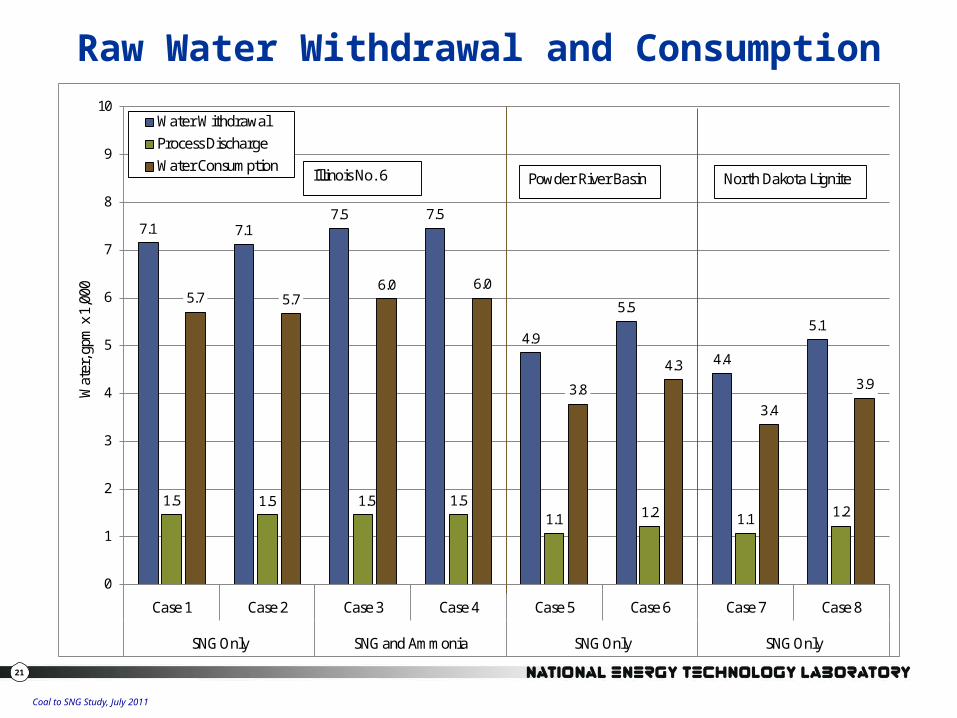
Raw Water Withdrawal and Consumption
7.1 7.17.5 7.5
4.9
5.5
4.4
5.1
1.5 1.5 1.5 1.51.1 1.2 1.1 1.2
5.7 5.76.0 6.0
3.8
4.3
3.4
3.9
0
1
2
3
4
5
6
7
8
9
10
Case 1 Case 2 Case 3 Case 4 Case 5 Case 6 Case 7 Case 8
SNG Only SNG and Ammonia SNG Only SNG Only
Wat
er, g
pm x
1,00
0
Water WithdrawalProcess DischargeWater Consumption
Illinois No. 6 Powder River Basin North Dakota Lignite

22
Coal to SNG Study, July 2011
Economic Results for All Cases
23
Coal to SNG Study, July 2011
CO2 Avoided Costs
16.65
13.47
16.79 16.57
0
5
10
15
20
25
30
SNG Illinois 6 SNG/NH3Illinois 6
SNG PRB SNG Lignite
Firs
t Yea
r CO
2Av
oide
d Co
st ($
/ton
)
CO2 Avoided Cost
24
Coal to SNG Study, July 2011
Plant Cost Comparison
1,939 1,9882,271 2,325
2,024 2,079 2,120 2,179
180 185213 218
188 193 197 202385 396
440 452
403 415 421 434125 125
125 125
126 126 126 126607 620
694 710
613 629 640 6543,235 3,313
3,742 3,830
3,354 3,442 3,504 3,5953,886 3,979
4,495 4,600
4,029 4,134 4,209 4,318
0
1,000
2,000
3,000
4,000
5,000
6,000
7,000
TOC TASC TOC TASC TOC TASC TOC TASC TOC TASC TOC TASC TOC TASC TOC TASC
SNG Illinois 6 SNG Illinois 6 w/ Capture
SNG/NH3Illinois 6
SNG/NH3 Illinois 6 w/ Capture
SNG PRB SNG PRB w/ Capture
SNG Lignite SNG Lignite w/ Capture
Capi
tal C
ost,
$1,0
00,0
00
TASC
Owner's Cost
Process Contingency
Project Contingency
Home Office Expense
Bare Erected Cost
Powder River Basin North Dakota LigniteIllinois No. 6
25
Coal to SNG Study, July 2011
Cost of Production Comparison
14.58 14.9411.90 12.25
15.34 15.76
17.13 17.59
1.76 1.79
1.41 1.45
1.84 1.862.03 2.06
1.03 1.04
0.79 0.82
1.02 1.03
1.18 1.18
2.67 2.67
1.89 1.89
1.41 1.411.34 1.35
0.91
1.29
0.96
1.03
19.2720.95
15.82
17.85
19.1521.01 21.27
23.24
14.20
8.38
4.40
-5
0
5
10
15
20
25
30
35
40
SNG Illinois 6 SNG Illinois 6 w/ Capture
SNG/NH3Illinois 6
SNG/NH3 Illinois 6 w/ Capture
SNG PRB SNG PRB w/ Capture
SNG Lignite SNG Lignite w/ Capture
FYCO
P, $
/MM
Btu
CO2 TS&M CostsFuel CostsVariable CostsFixed CostsCapital CostsElectricity Revenue/CostEIA projected average price for 2035EIA projected average price for 2020Henry Hub price (Jun-29-2011)
Illinois No. 6 Powder River Basin North Dakota Lignite

26
Coal to SNG Study, July 2011
Highlights
27
Coal to SNG Study, July 2011
NETL Viewpoint
• Most up-to-date performance and costs currently available in public literature
• Establishes baseline performance and cost estimates for current state of technology
• Reduced costs are required to improve competitiveness of coal-to-SNG processes– In today’s market and regulatory environment – Also in a carbon constrained scenario
• Ammonia co-production provides the most attractive SNG prices

28
Coal to SNG Study, July 2011
Result Highlights: Efficiency & Capital Cost• HHV Conversion Efficiencies
– Illinois No. 6: 61.3% to 61.5%– Powder River Basin: 63.1%*– North Dakota Lignite: 61.5%
• Total Overnight Cost without Sequestration (MM$):– Illinois No. 6 SNG: $3,235– Illinois No. 6 SNG/NH3: $3,742– Powder River Basin SNG: $3,354– North Dakota Lignite SNG: $3,504
• Total Overnight Cost with Sequestration (MM$):– Illinois No. 6 SNG: $3,313– Illinois No. 6 SNG/NH3: $3,830– Powder River Basin SNG: $3,442– North Dakota Lignite SNG: $3,595
*PRB has the highest conversion efficiency of 63.1% primarily due to the low nitrogen and high oxygen content in the design fuel, which enables the SNG product to have a relatively lower concentration of inerts.

29
Coal to SNG Study, July 2011
Results Highlights: FY COP
• FY COP ($/MMBtu) without Capture:– Illinois No. 6 SNG: 19.27– Illinois No. 6 SNG and NH3: 15.82 (NH3 = $799/ton)– Powder River Basin SNG: 19.15– North Dakota Lignite SNG: 21.27
• FY COP ($/MMBtu) with Capture:– Illinois No. 6 SNG: 20.95– Illinois No. 6 SNG and NH3: 17.85 (NH3 = $828/ton)– Powder River Basin SNG: 21.01– North Dakota Lignite SNG: 23.24

30
Coal to SNG Study, July 2011
Summary Table for All Cases

31
Coal to SNG Study, July 2011
Summary TablePERFORMANCE Case 1 Case 2 Case 3 Case 4 Case 5 Case 6 Case 7 Case 8CO2 Sequestration No Yes No Yes No Yes No Yes
SNG Production (Bscf/year)1 57 56 42 42 55 55 52 52Ammonia Production (TPD)1 N/A N/A 2,204 2,204 N/A N/A N/A N/AHHV Conversion Efficiency, % 61.4% 61.3% 61.5% 61.4% 63.1% 63.1% 61.5% 61.5%Gross Power Output (kWe) 308,000 310,600 292,300 292,300 302,000 302,000 305,800 310,500Auxiliary Power Requirement (kWe) 216,350 262,090 263,600 316,030 247,570 300,190 259,740 313,930Net Power Output (kWe) 91,650 48,510 28,700 -23,730 54,430 1,810 46,060 -3,430Coal Flowrate (lb/hr) 964,752 964,752 964,000 964,000 1,259,331 1,259,331 1,564,932 1,564,932HHV Thermal Input (kW th) 3,298,455 3,298,455 3,295,885 3,295,885 3,160,745 3,160,745 3,034,796 3,034,796Raw Water Withdrawal (gpm) 7,169 7,123 7,434 7,458 4,853 5,509 4,421 5,131Process Water Discharge (gpm) 1,462 1,451 1,455 1,461 1,071 1,218 1,071 1,230Raw Water Consumption (gpm) 5,708 5,672 5,979 5,997 3,783 4,291 3,350 3,901CO2 Emissions (lb/MMBtu)2 128 5 147 10 140 0.7 147 0.9
SO2 Emissions (lb/MMBtu)2 0.0274 0.0003 0.0229 0.0006 0.0218 0.0000 0.0239 0.0000
NOx Emissions (lb/MMBtu)2 Negligible Negligible Negligible Negligible Negligible Negligible Negligible NegligiblePM Emissions (lb/MMBtu)2 0.007 0.007 0.007 0.007 0.007 0.007 0.007 0.007Hg Emissions (lb/MMBtu)2 5.71E-07 5.71E-07 5.71E-07 5.71E-07 3.51E-07 3.51E-07 5.60E-07 5.60E-07COSTTotal Plant Cost ($ x 1,000) 2,628,754 2,692,997 3,048,463 3,119,611 2,741,044 2,813,258 2,864,478 2,941,335Total Overnight Cost ($ x 1,000) 3,235,262 3,312,740 3,742,411 3,829,817 3,354,442 3,442,310 3,504,262 3,595,468 Bare Erected Cost ($ x 1,000) 1,938,987 1,987,745 2,270,675 2,324,594 2,023,833 2,078,723 2,120,358 2,178,744 Home Office Expense ($ x 1,000) 180,084 184,716 213,101 218,235 187,854 193,059 196,659 202,203 Process Contingency ($ x 1,000) 125,003 124,952 124,890 124,877 126,177 126,063 126,234 126,189 Project Contingency ($ x 1,000) 384,680 395,583 439,797 451,906 403,179 415,413 421,228 434,199 Owner's Costs ($ x 1,000) 606,508 619,743 693,948 710,206 613,398 629,053 639,784 654,134Total As-spent Capital ($ x 1,000) 3,885,549 3,978,601 4,494,636 4,599,610 4,028,684 4,134,215 4,208,619 4,318,158SNG FYCOP ($/MMBtu)1 19.27 20.95 15.82 17.85 19.15 21.01 21.27 23.24 CO 2 TS&M Costs 0.00 0.91 0.00 1.29 0.00 0.96 0.00 1.03 Fuel Costs 2.67 2.67 1.89 1.89 1.41 1.41 1.34 1.35 Variable Costs 1.03 1.04 0.79 0.82 1.02 1.03 1.18 1.18 Fixed Costs 1.76 1.79 1.41 1.45 1.84 1.86 2.03 2.06 Electricity Costs -0.77 -0.41 -0.17 0.15 -0.46 -0.02 -0.42 0.03 Capital Costs 14.58 14.94 11.90 12.25 15.34 15.76 17.13 17.59Ammonia FYCOP3 ($/ton) - - 799 828 - - - -1 Based on a capacity factor of 90 percent for all cases2 Based on coal thermal input3 Ammonia price is correlated to historic natural gas costs
SNG OnlyRosebud PRB North Dakota LigniteIllinois No. 6 Coal
SNG Only SNG and Ammonia SNG Only
32
Coal to SNG Study, July 2011
Fuel Quality
33
Coal to SNG Study, July 2011
• The SNG produced in this study is at the low end of the acceptable quality range.– HHVs - 965-975 Btu/scf– Wobbe Indices -1,265-1,275– Inert concentrations - 3-4.5 %
• The primary reason for the lower quality product is the absence of higher hydrocarbons.
• The quality of the SNG produced in this study could be enhanced with minor impact on overall cost by the following…– Increase the oxygen purity from 99% to 99.5%.– Upgrade the PSA by increasing the bed depth or adding beds in
series.– Blend other gases into the pipeline to achieve a desired Wobbe
Index value.• Purity requirements will be dictated by location and fuel end
use.
SNG Fuel Quality

34
Coal to SNG Study, July 2011
Sensitivity to Financing Scenario
35
Coal to SNG Study, July 2011
Sensitivity to ROE
0
200
400
600
800
1000
1200
1400
0
5
10
15
20
25
30
35
40
45
50
5% 10% 15% 20% 25%
Amm
onia
LCO
P ($
/ton
)
SNG
FYCO
P ($
/MM
Btu)
Return on Equity
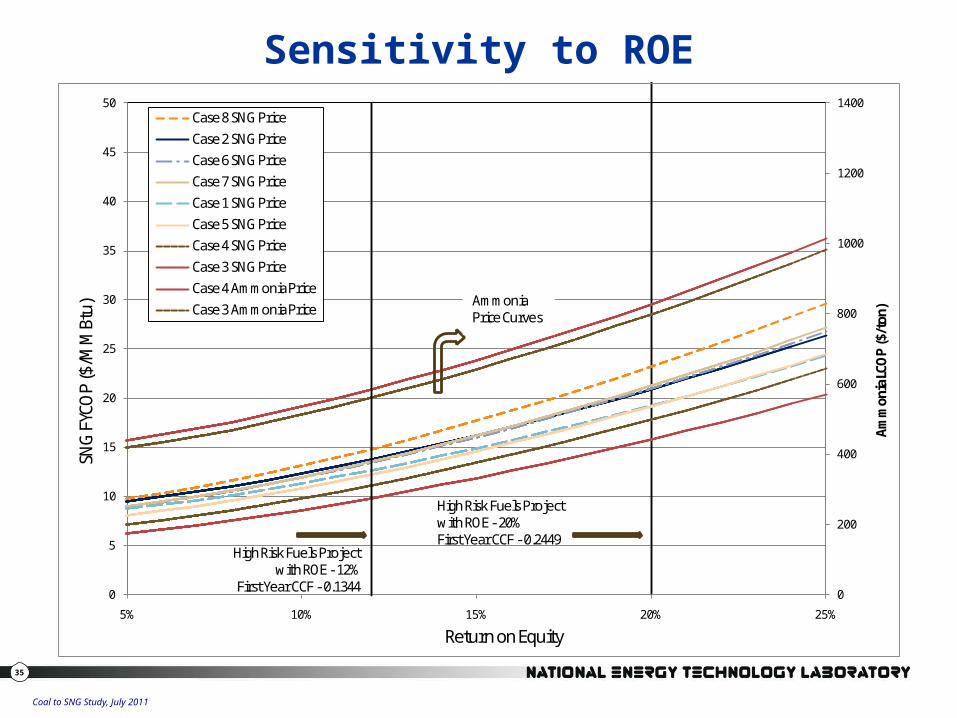
Case 8 SNG PriceCase 2 SNG PriceCase 6 SNG PriceCase 7 SNG PriceCase 1 SNG PriceCase 5 SNG PriceCase 4 SNG PriceCase 3 SNG PriceCase 4 Ammonia PriceCase 3 Ammonia Price
High Risk Fuels Projectwith ROE - 12%
First Year CCF - 0.1344
High Risk Fuels Project with ROE - 20%First Year CCF - 0.2449
Ammonia Price Curves
36
Coal to SNG Study, July 2011
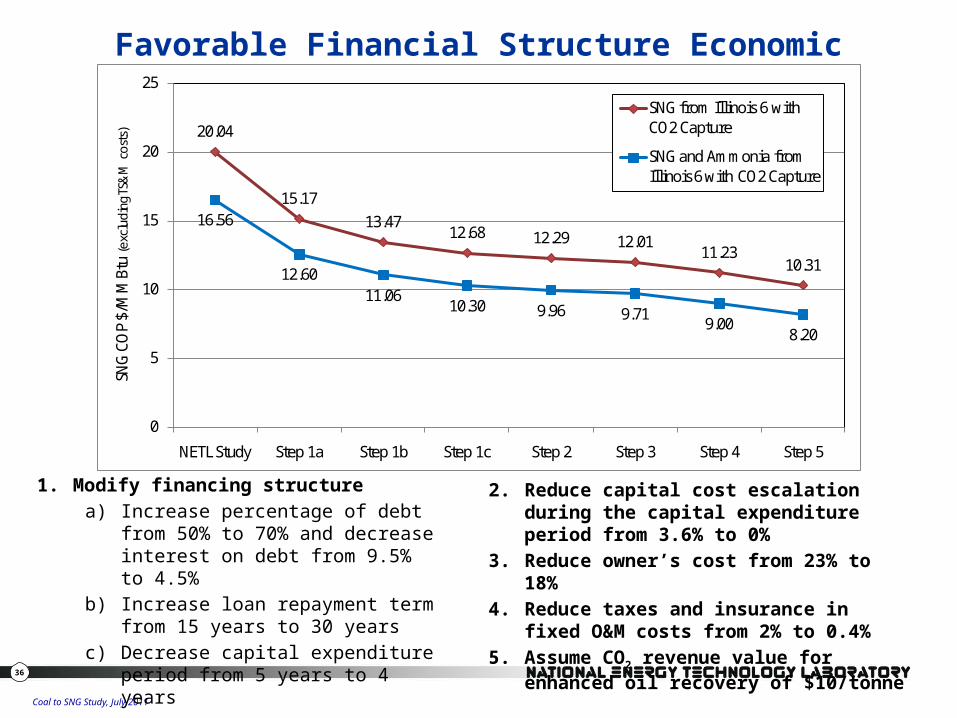
Favorable Financial Structure Economic Pathway
1. Modify financing structurea) Increase percentage of debt from 50%
to 70% and decrease interest on debt from 9.5% to 4.5%
b) Increase loan repayment term from 15 years to 30 years
c) Decrease capital expenditure period from 5 years to 4 years
2. Reduce capital cost escalation during the capital expenditure period from 3.6% to 0%
3. Reduce owner’s cost from 23% to 18%4. Reduce taxes and insurance in fixed O&M
costs from 2% to 0.4%5. Assume CO2 revenue value for enhanced
oil recovery of $10/tonne
20.04
15.1713.47
12.68 12.29 12.0111.23
10.31
16.56
12.6011.06
10.30 9.96 9.71 9.008.20
0
5
10
15
20
25
NETL Study Step 1a Step 1b Step 1c Step 2 Step 3 Step 4 Step 5
SNG
COP
$/M
MBt
u (e
xclu
ding
TS&
M c
osts
)SNG from Illinois 6 with CO2 Capture
SNG and Ammonia from Illinois 6 with CO2 Capture
37
Coal to SNG Study, July 2011
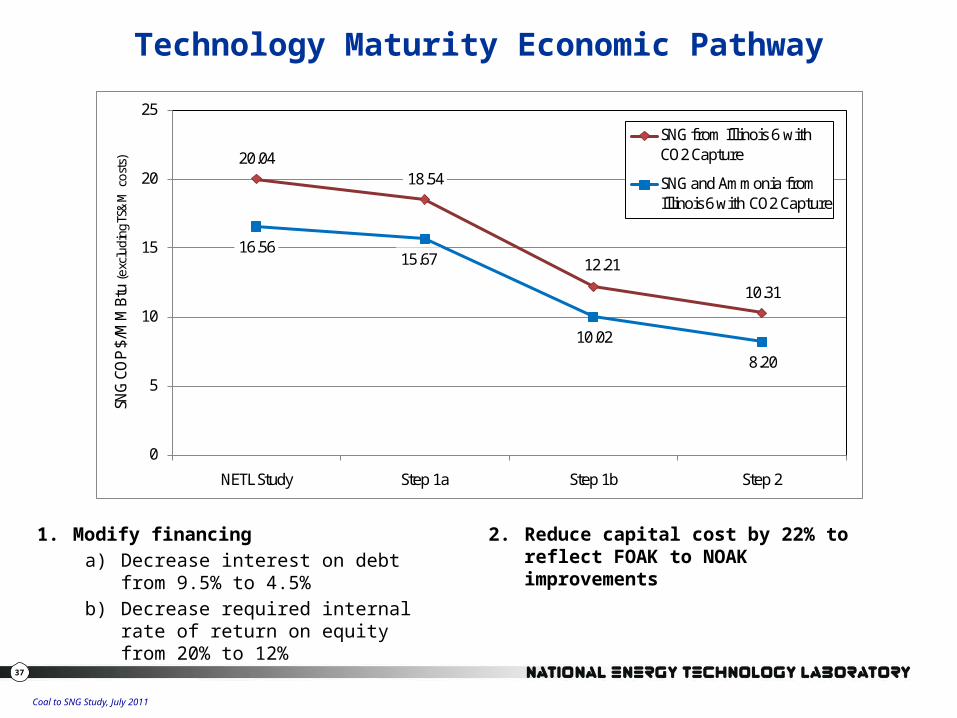
Technology Maturity Economic Pathway
1. Modify financinga) Decrease interest on debt from 9.5%
to 4.5%b) Decrease required internal rate of
return on equity from 20% to 12%
2. Reduce capital cost by 22% to reflect FOAK to NOAK improvements
20.0418.54
12.21
10.31
16.5615.67
10.028.20
0
5
10
15
20
25
NETL Study Step 1a Step 1b Step 2
SNG
COP
$/M
MBt
u (e
xclu
ding
TS&
M c
osts
)SNG from Illinois 6 with CO2 Capture
SNG and Ammonia from Illinois 6 with CO2 Capture
Related Documents