_____________________________ Cost Analysis of Maryland’s Electronic Voting System _____________________________ Prepared February 2008 by www.saveourvotes.org Contact: Rebecca Wilson, Co-Director [email protected]

Welcome message from author
This document is posted to help you gain knowledge. Please leave a comment to let me know what you think about it! Share it to your friends and learn new things together.
Transcript
_____________________________
Cost Analysis of Maryland’s Electronic
Voting System _____________________________
Prepared February 2008 by
www.saveourvotes.org
Contact: Rebecca Wilson, Co-Director [email protected]
2 Cost Analysis of Maryland’s Electronic Voting System, 2008 www.saveourvotes.org
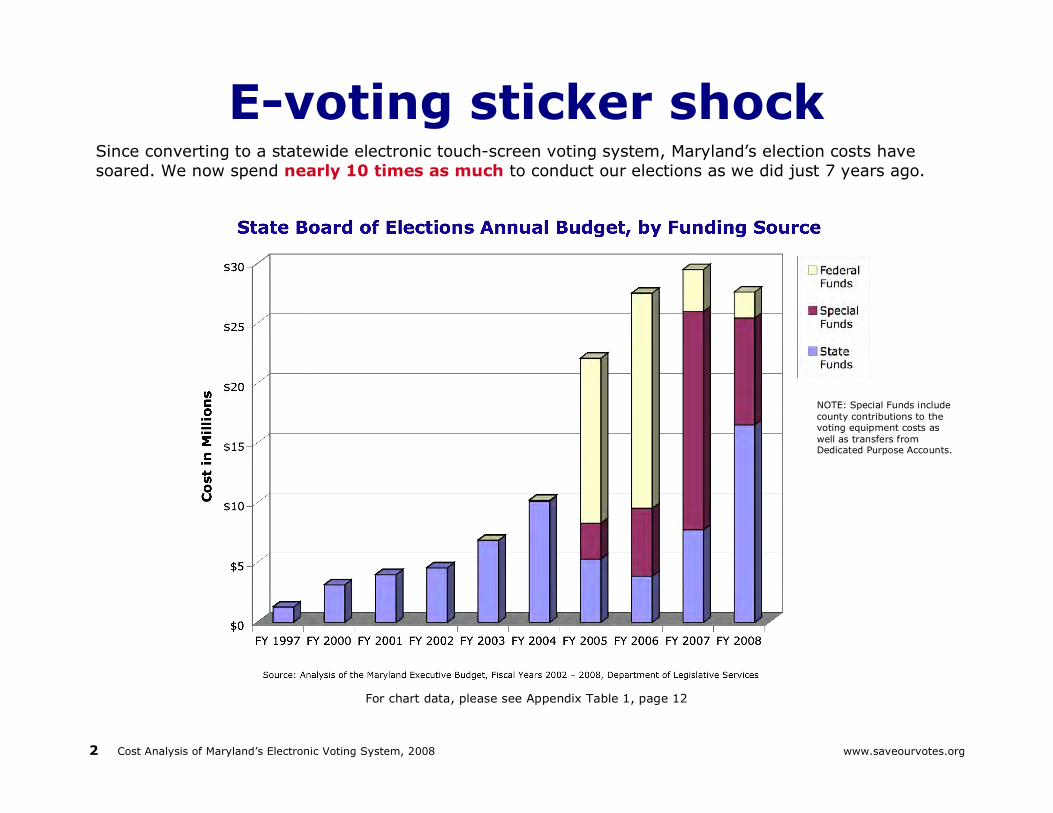
E-voting sticker shock Since converting to a statewide electronic touch-screen voting system, Maryland’s election costs have soared. We now spend nearly 10 times as much to conduct our elections as we did just 7 years ago.
For chart data, please see Appendix Table 1, page 12
NOTE: Special Funds include county contributions to the voting equipment costs as well as transfers from Dedicated Purpose Accounts.
3 Cost Analysis of Maryland’s Electronic Voting System, 2008 www.saveourvotes.org
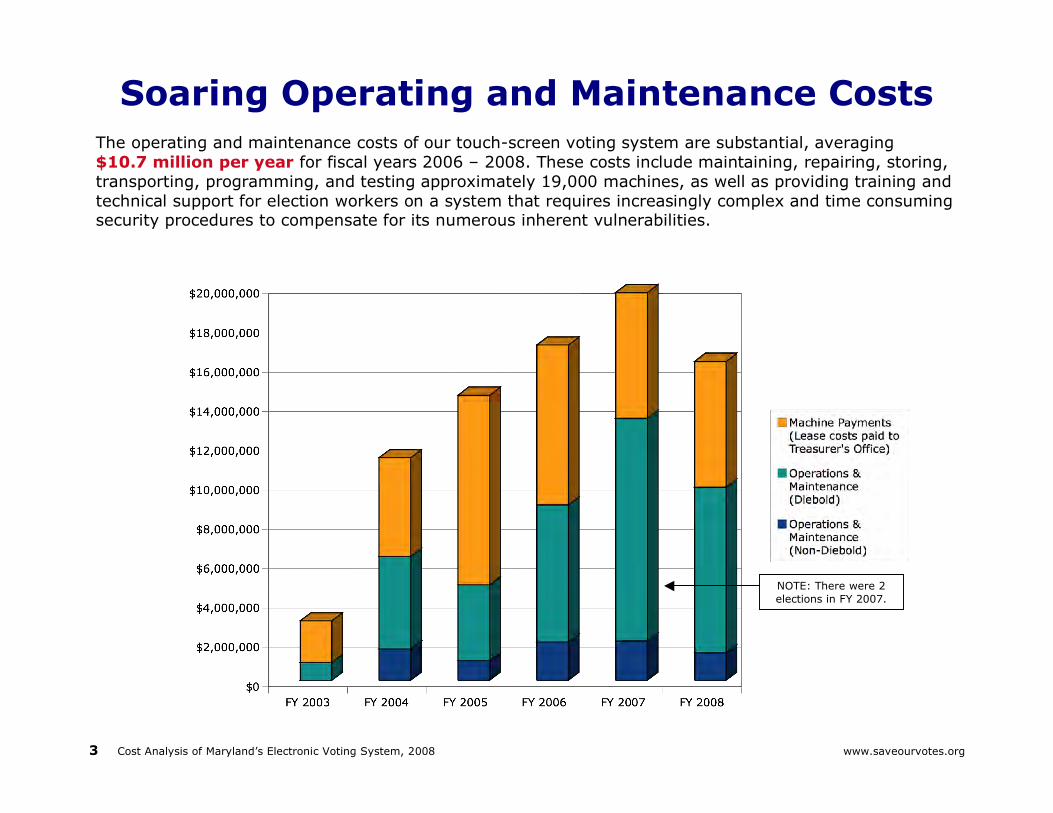
Soaring Operating and Maintenance Costs The operating and maintenance costs of our touch-screen voting system are substantial, averaging $10.7 million per year for fiscal years 2006 – 2008. These costs include maintaining, repairing, storing, transporting, programming, and testing approximately 19,000 machines, as well as providing training and technical support for election workers on a system that requires increasingly complex and time consuming security procedures to compensate for its numerous inherent vulnerabilities.
NOTE: There were 2 elections in FY 2007.

4 Cost Analysis of Maryland’s Electronic Voting System, 2008 www.saveourvotes.org
The Cost of Keeping Our Touch-screen Machines
By the time the 2008 elections are complete, we will have spent over $97.5 million to purchase and operate our equipment—and that does not include the $23.3 million we still owe in capital lease costs. We can’t project our operating costs into the future because our maintenance contract on the touch-screen machines expires soon after the 2008 General Election. If we retain the equipment, the contract would have to be rebid at that time. The maintenance contract would likely be more expensive as the equipment ages and needs more frequent repairs or replacement. But even if the costs remain the same as our current average, we would spend another $78.5 million in Fiscal Years 2010 – 2014.
FY 2003 FY 2004 FY 2005 FY 2006 FY 2007 FY 2008 FY 2009 TOTAL
FY 2010 –
2014
Machine
Payments (Lease costs paid to
Treasurer's Office)
$2,131,933 $5,034,100 $9,654,582 $8,142,292 $6,412,403 $6,411,015 $6,409,343 $44,195,668
$23,267,623
still owed on
machines
Operations &
Maintenance (Diebold/Premier)
$914,704 $4,713,220 $3,869,564 $6,979,464 $11,325,479 $8,420,759
(Diebold
contract ends
mid-year)
$7,697.720
$43,920,910At least
$45.753,684
Operations &
Maintenance (Non-Diebold)
$0 $1,605,088 $1,008,188 $1,963,830 $2,025,000 $1,425,000 $1,325,000 $9,352,106At least
$9,502,660
TOTAL $3,046,637 $11,352,408 $14,532,334 $17,085,586 $19,762,882 $16,256,774 $15,432,063 $97,468,684 At least
$78,523,967
Machine payments for Baltimore City machines estimated at $1.9 million per year for 5 years beginning in fiscal 2006.
Diebold/Premier contract runs through the middle of fiscal 2009. Services would need to be rebid at that time if we retain the current voting system.
Statewide Voting System Costs, by Expenditure Category
Data compiled by Maryland Department of Legislative Services, 2006. FY2009 estimates updated February 2008 with DLS data.
Source: State Board of Elections
Notes: Assumes no change to current voting system.
5 Cost Analysis of Maryland’s Electronic Voting System, 2008 www.saveourvotes.org
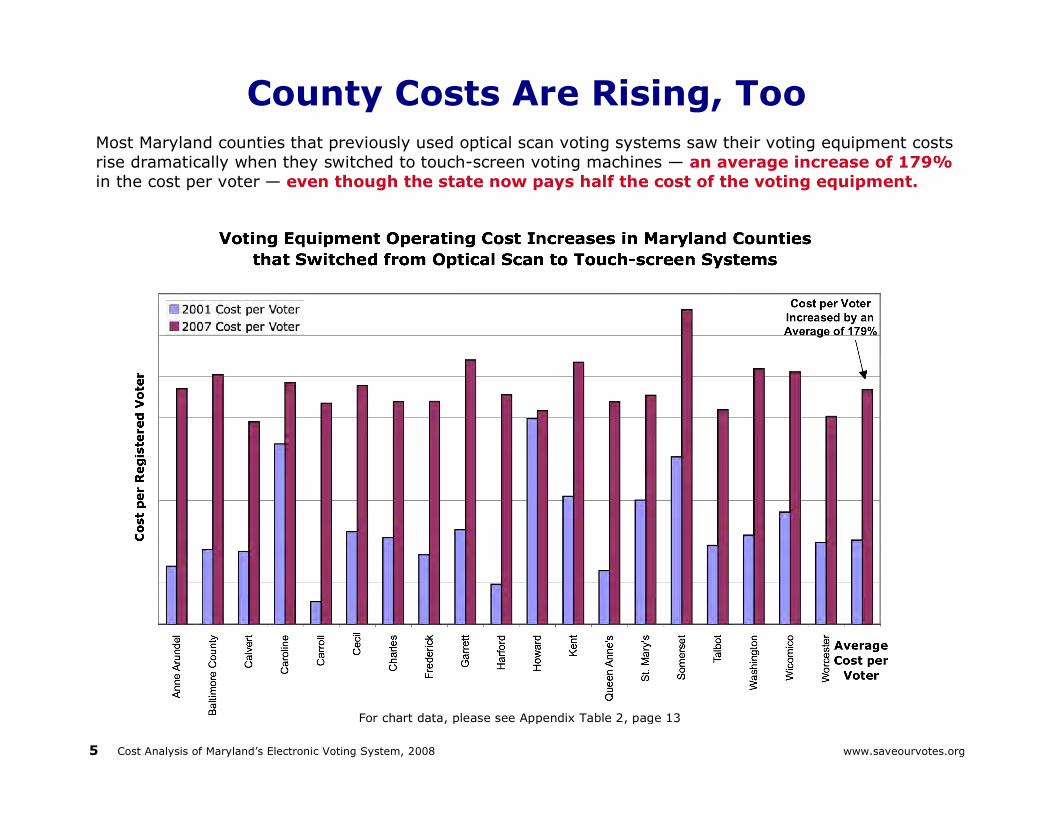
County Costs Are Rising, Too Most Maryland counties that previously used optical scan voting systems saw their voting equipment costs rise dramatically when they switched to touch-screen voting machines — an average increase of 179% in the cost per voter — even though the state now pays half the cost of the voting equipment.
For chart data, please see Appendix Table 2, page 13

6 Cost Analysis of Maryland’s Electronic Voting System, 2008 www.saveourvotes.org
Less equipment means lower costs The reason for the higher expense of touch-screen systems is that they require so much more equipment. An optical scan system uses only one optical scanner per precinct plus a ballot-marking station that enables voters with physical disabilities or language barriers — or those who simply prefer a touch-screen interface — to mark and verify a paper ballot. With an average of 10 touch-screen machines currently deployed in each precinct in Maryland, this is an equipment reduction of 80%.
All of the touch-screen machines in a precinct (an average of 10 machines)
Can be replaced by just 2 machines: 1 optical scanner and 1 ballot-marking station
to assist voters with disabilities or language barriers in marking and verifying their paper ballots

7 Cost Analysis of Maryland’s Electronic Voting System, 2008 www.saveourvotes.org
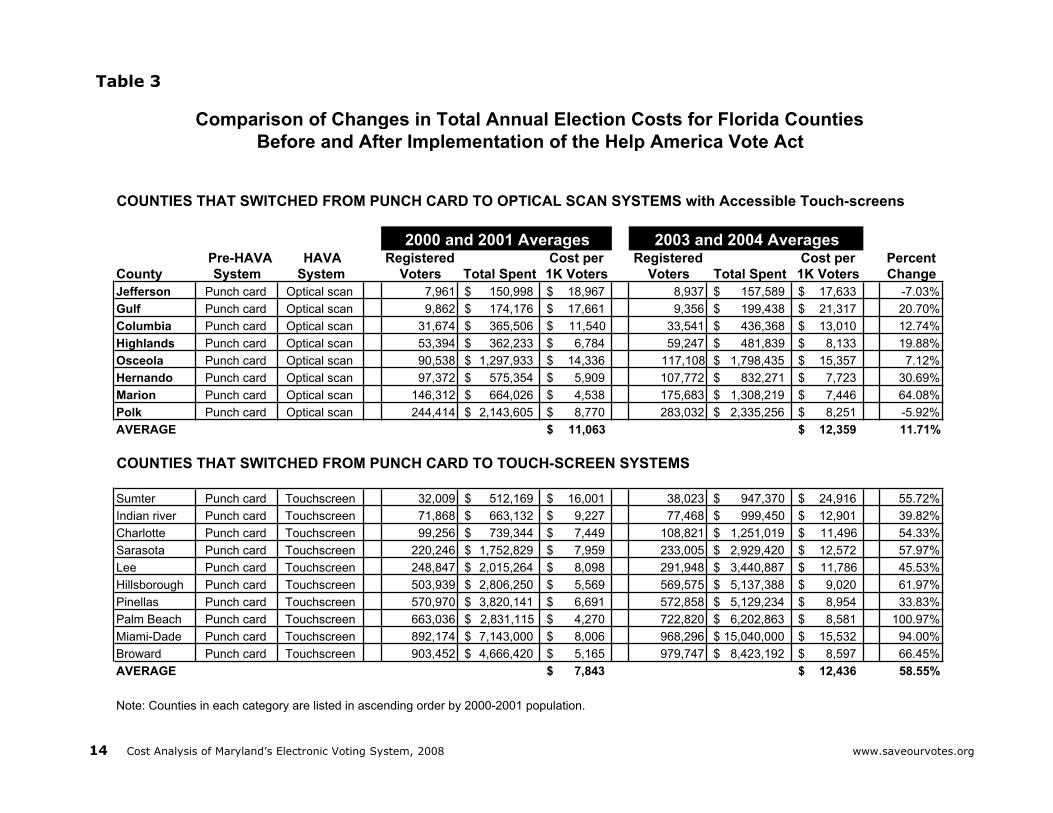
A 2005 study of Florida’s election costs after implementing the Help America Vote Act showed that counties that had switched to touch-screen voting systems had average cost increases 3 to 5 times higher than those that kept or switched to optical scan voting systems.
NOTE: For chart data, please see Appendix Table 3, pages 14-15. DATA SOURCE: Myerson, Rosemarie and Richard Myerson, Report on a Survey of Changes in Total Annual Expenditures for Florida Counties Before and After Purchase o f Touch Screens and A Comparison o f Total Annual Expenditures for Touch Screens and Optical Scanners, December 2005. http://www.votersunite.org/info/FloridaElectionCostStudy12-01-05.pd f

8 Cost Analysis of Maryland’s Electronic Voting System, 2008 www.saveourvotes.org
SOURCE: "A Study of Vote Verification Technologies, Part I: Technical Study," UMBC National Center for the Study of Elections, Feb.2006, page 7, Table 1.
Current Costs of Maryland’s Touch-Screen Voting System
9 Cost Analysis of Maryland’s Electronic Voting System, 2008 www.saveourvotes.org
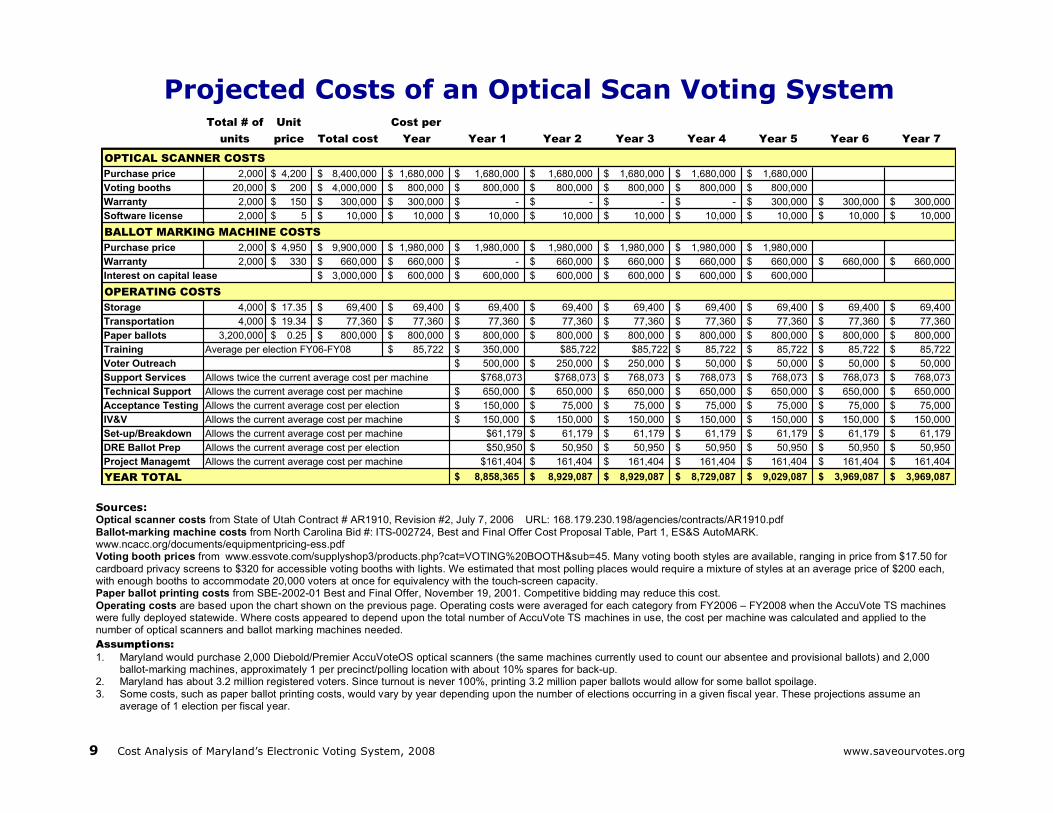
Sources: Optical scanner costs from State of Utah Contract # AR1910, Revision #2, July 7, 2006 URL: 168.179.230.198/agencies/contracts/AR1910.pdf Ballot-marking machine costs from North Carolina Bid #: ITS-002724, Best and Final Offer Cost Proposal Table, Part 1, ES&S AutoMARK. www.ncacc.org/documents/equipmentpricing-ess.pdf Voting booth prices from www.essvote.com/supplyshop3/products.php?cat=VOTING%20BOOTH&sub=45. Many voting booth styles are available, ranging in price from $17.50 for cardboard privacy screens to $320 for accessible voting booths with lights. We estimated that most polling places would require a mixture of styles at an average price of $200 each, with enough booths to accommodate 20,000 voters at once for equivalency with the touch-screen capacity. Paper ballot printing costs from SBE-2002-01 Best and Final Offer, November 19, 2001. Competitive bidding may reduce this cost. Operating costs are based upon the chart shown on the previous page. Operating costs were averaged for each category from FY2006 – FY2008 when the AccuVote TS machines were fully deployed statewide. Where costs appeared to depend upon the total number of AccuVote TS machines in use, the cost per machine was calculated and applied to the number of optical scanners and ballot marking machines needed. Assumptions: 1. Maryland would purchase 2,000 Diebold/Premier AccuVoteOS optical scanners (the same machines currently used to count our absentee and provisional ballots) and 2,000
ballot-marking machines, approximately 1 per precinct/polling location with about 10% spares for back-up. 2. Maryland has about 3.2 million registered voters. Since turnout is never 100%, printing 3.2 million paper ballots would allow for some ballot spoilage. 3. Some costs, such as paper ballot printing costs, would vary by year depending upon the number of elections occurring in a given fiscal year. These projections assume an
average of 1 election per fiscal year.
Total # of
units
Unit
price Total cost
Cost per
Year Year 1 Year 2 Year 3 Year 4 Year 5 Year 6 Year 7
Purchase price 2,000 4,200$ 8,400,000$ 1,680,000$ 1,680,000$ 1,680,000$ 1,680,000$ 1,680,000$ 1,680,000$
Voting booths 20,000 200$ 4,000,000$ 800,000$ 800,000$ 800,000$ 800,000$ 800,000$ 800,000$
Warranty 2,000 150$ 300,000$ 300,000$ -$ -$ -$ -$ 300,000$ 300,000$ 300,000$
Software license 2,000 5$ 10,000$ 10,000$ 10,000$ 10,000$ 10,000$ 10,000$ 10,000$ 10,000$ 10,000$
Purchase price 2,000 4,950$ 9,900,000$ 1,980,000$ 1,980,000$ 1,980,000$ 1,980,000$ 1,980,000$ 1,980,000$
Warranty 2,000 330$ 660,000$ 660,000$ -$ 660,000$ 660,000$ 660,000$ 660,000$ 660,000$ 660,000$
3,000,000$ 600,000$ 600,000$ 600,000$ 600,000$ 600,000$ 600,000$
Storage 4,000 17.35$ 69,400$ 69,400$ 69,400$ 69,400$ 69,400$ 69,400$ 69,400$ 69,400$ 69,400$
Transportation 4,000 19.34$ 77,360$ 77,360$ 77,360$ 77,360$ 77,360$ 77,360$ 77,360$ 77,360$ 77,360$
Paper ballots 3,200,000 0.25$ 800,000$ 800,000$ 800,000$ 800,000$ 800,000$ 800,000$ 800,000$ 800,000$ 800,000$
Training 85,722$ 350,000$ $85,722 $85,722 85,722$ 85,722$ 85,722$ 85,722$
Voter Outreach 500,000$ 250,000$ 250,000$ 50,000$ 50,000$ 50,000$ 50,000$
Support Services $768,073 $768,073 768,073$ 768,073$ 768,073$ 768,073$ 768,073$
Technical Support 650,000$ 650,000$ 650,000$ 650,000$ 650,000$ 650,000$ 650,000$
Acceptance Testing 150,000$ 75,000$ 75,000$ 75,000$ 75,000$ 75,000$ 75,000$
IV&V 150,000$ 150,000$ 150,000$ 150,000$ 150,000$ 150,000$ 150,000$
Set-up/Breakdown $61,179 61,179$ 61,179$ 61,179$ 61,179$ 61,179$ 61,179$
DRE Ballot Prep $50,950 50,950$ 50,950$ 50,950$ 50,950$ 50,950$ 50,950$
Project Managemt $161,404 161,404$ 161,404$ 161,404$ 161,404$ 161,404$ 161,404$
8,858,365$ 8,929,087$ 8,929,087$ 8,729,087$ 9,029,087$ 3,969,087$ 3,969,087$ YEAR TOTAL
Average per election FY06-FY08
Allows twice the current average cost per machine
Allows the current average cost per machine
Projected Costs of an Optical Scan Voting System
BALLOT MARKING MACHINE COSTS
OPERATING COSTS
OPTICAL SCANNER COSTS
Allows the current average cost per machine
Interest on capital lease
Allows the current average cost per election
Allows the current average cost per machine
Allows the current average cost per machine
Allows the current average cost per election
10 Cost Analysis of Maryland’s Electronic Voting System, 2008 www.saveourvotes.org
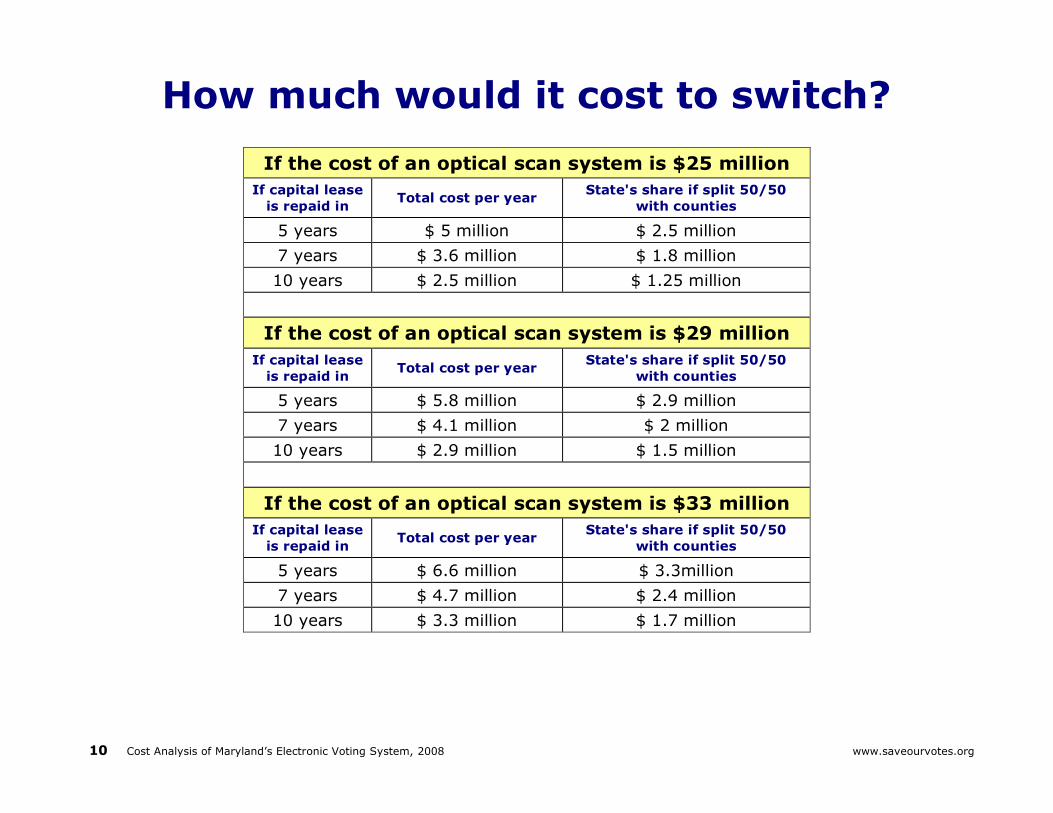
How much would it cost to switch?
If the cost of an optical scan system is $25 million If capital lease
is repaid in Total cost per year State's share if split 50/50 with counties
5 years $ 5 million $ 2.5 million 7 years $ 3.6 million $ 1.8 million 10 years $ 2.5 million $ 1.25 million
If the cost of an optical scan system is $29 million If capital lease
is repaid in Total cost per year State's share if split 50/50 with counties
5 years $ 5.8 million $ 2.9 million 7 years $ 4.1 million $ 2 million 10 years $ 2.9 million $ 1.5 million
If the cost of an optical scan system is $33 million If capital lease
is repaid in Total cost per year State's share if split 50/50 with counties
5 years $ 6.6 million $ 3.3million 7 years $ 4.7 million $ 2.4 million 10 years $ 3.3 million $ 1.7 million
11 Cost Analysis of Maryland’s Electronic Voting System, 2008 www.saveourvotes.org
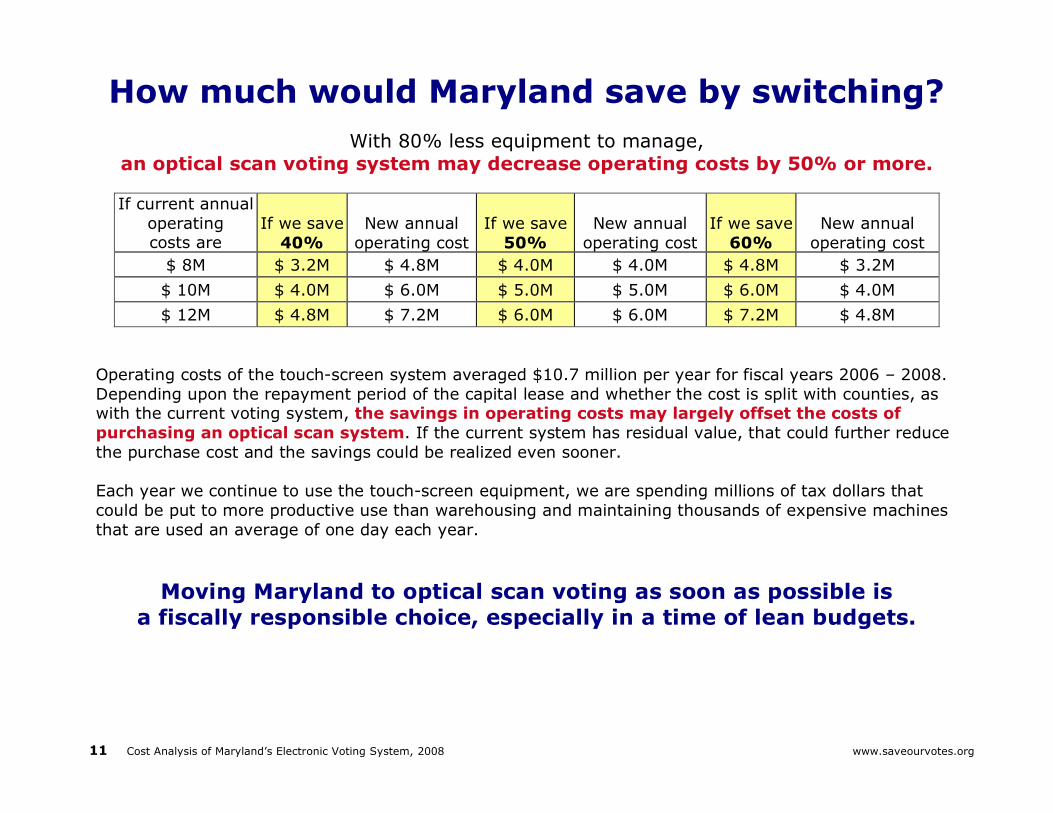
How much would Maryland save by switching?
With 80% less equipment to manage, an optical scan voting system may decrease operating costs by 50% or more.
If current annual
operating costs are
If we save 40%
New annual operating cost
If we save 50%
New annual operating cost
If we save 60%
New annual operating cost
$ 8M $ 3.2M $ 4.8M $ 4.0M $ 4.0M $ 4.8M $ 3.2M $ 10M $ 4.0M $ 6.0M $ 5.0M $ 5.0M $ 6.0M $ 4.0M $ 12M $ 4.8M $ 7.2M $ 6.0M $ 6.0M $ 7.2M $ 4.8M
Operating costs of the touch-screen system averaged $10.7 million per year for fiscal years 2006 – 2008. Depending upon the repayment period of the capital lease and whether the cost is split with counties, as with the current voting system, the savings in operating costs may largely offset the costs of purchasing an optical scan system. If the current system has residual value, that could further reduce the purchase cost and the savings could be realized even sooner.
Each year we continue to use the touch-screen equipment, we are spending millions of tax dollars that could be put to more productive use than warehousing and maintaining thousands of expensive machines that are used an average of one day each year.
Moving Maryland to optical scan voting as soon as possible is a fiscally responsible choice, especially in a time of lean budgets.
12 Cost Analysis of Maryland’s Electronic Voting System, 2008 www.saveourvotes.org
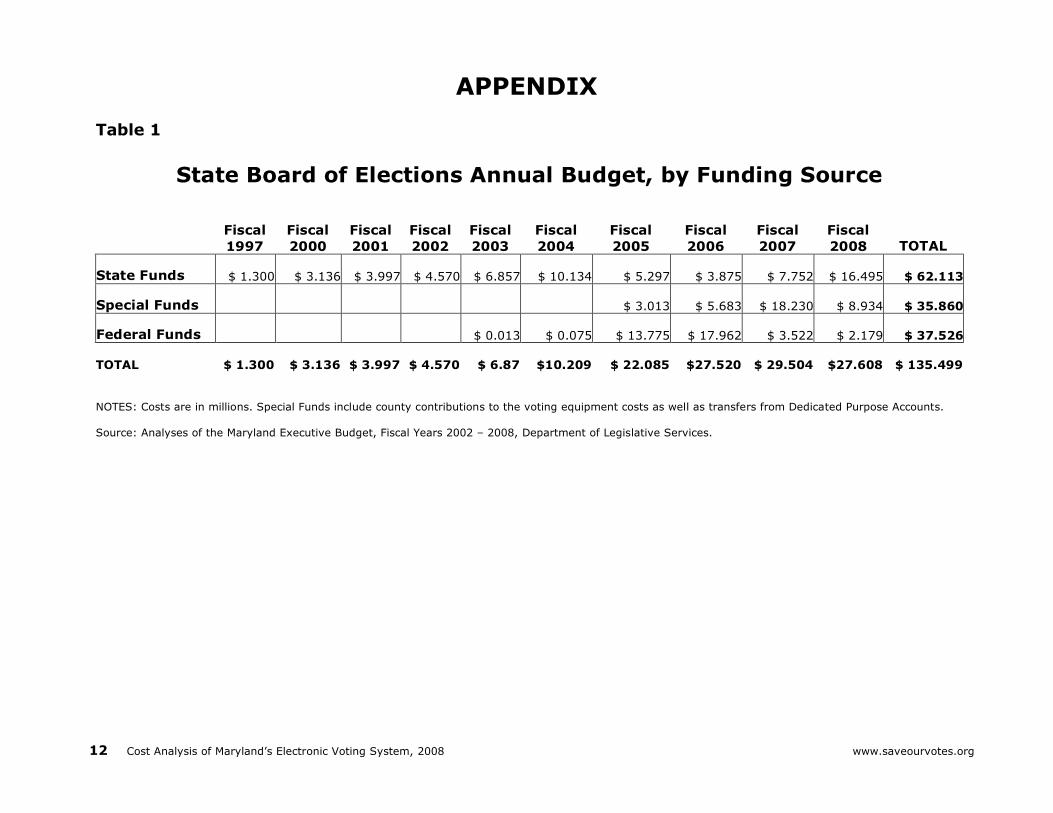
APPENDIX Table 1
State Board of Elections Annual Budget, by Funding Source
Fiscal 1997
Fiscal 2000
Fiscal 2001
Fiscal 2002
Fiscal 2003
Fiscal 2004
Fiscal 2005
Fiscal 2006
Fiscal 2007
Fiscal 2008 TOTAL
State Funds $ 1.300 $ 3.136 $ 3.997 $ 4.570 $ 6.857 $ 10.134 $ 5.297 $ 3.875 $ 7.752 $ 16.495 $ 62.113
Special Funds $ 3.013 $ 5.683 $ 18.230 $ 8.934 $ 35.860
Federal Funds $ 0.013 $ 0.075 $ 13.775 $ 17.962 $ 3.522 $ 2.179 $ 37.526
TOTAL $ 1.300 $ 3.136 $ 3.997 $ 4.570 $ 6.87 $10.209 $ 22.085 $27.520 $ 29.504 $27.608 $ 135.499
NOTES: Costs are in millions. Special Funds include county contributions to the voting equipment costs as well as transfers from Dedicated Purpose Accounts. Source: Analyses of the Maryland Executive Budget, Fiscal Years 2002 – 2008, Department of Legislative Services.

13 Cost Analysis of Maryland’s Electronic Voting System, 2008 www.saveourvotes.org
Table 2
COUNTYRegistered
Voters, 2000FY 2001 Election
CostsCost per
VoterRegistered
Voters, 2006FY 2007 Voting System Costs*
Cost per Voter
Percent Increase
Anne Arundel 265,005 $186,190 $0.70 309,069 $882,218 $2.85 306%
Baltimore County 405,819 $366,620 $0.90 458,161 $1,384,987 $3.02 235%
Calvert 39,494 $34,759 $0.88 50,360 $123,321 $2.45 178%
Caroline 13,758 $30,000 $2.18 16,192 $47,431 $2.93 34%
Carroll 81,260 $22,500 $0.28 99,316 $265,614 $2.67 866%
Cecil 40,660 $45,710 $1.12 52,499 $151,779 $2.89 157%
Charles 59,448 $62,400 $1.05 77,389 $208,697 $2.70 157%
Frederick 106,907 $90,068 $0.84 126,473 $341,504 $2.70 221%
Garrett 15,430 $17,662 $1.14 17,790 $56,917 $3.20 180%
Harford 118,118 $57,000 $0.48 136,554 $379,449 $2.78 476%
Howard 140,526 $350,000 $2.49 165,019 $426,880 $2.59 4%
Kent 9,888 $15,312 $1.55 11,961 $37,945 $3.17 105%
Queen Anne's 21,672 $14,055 $0.65 28,173 $75,890 $2.69 315%
St. Mary's 45,158 $67,914 $1.50 54,755 $151,779 $2.77 84%
Somerset 11,392 $23,102 $2.03 12,451 $47,431 $3.81 88%
Talbot 20,937 $20,000 $0.96 25,563 $66,403 $2.60 172%
Washington 69,422 $74,891 $1.08 79,776 $246,642 $3.09 187%
Wicomico 42,528 $57,744 $1.36 49,671 $151,779 $3.06 125%
Worcester 30,431 $30,200 $0.99 33,903 $85,376 $2.52 154%
TOTAL or AVERAGE 1,537,853 $1,566,127 $1.02 1,805,075 $5,132,042 $2.84 179%
* Does not include the counties' FY 2007 costs for implementing the statewide voter registration data base or the e-poll books.
Voting Equipment Operating Cost Increases in Maryland Countiesthat Switched from Optical Scan to Touch-screen Systems
SOURCES: 2001 data from "Review of Election Administration in Maryland," Department of Legislative Services, November 2001, p. 14-15.
2007 data from the State Board of Elections.
14 Cost Analysis of Maryland’s Electronic Voting System, 2008 www.saveourvotes.org
Table 3
County Pre-HAVA
SystemHAVA
SystemRegistered
Voters Total SpentCost per
1K VotersRegistered
Voters Total SpentCost per
1K VotersPercent Change
Jefferson Punch card Optical scan 7,961 150,998$ 18,967$ 8,937 157,589$ 17,633$ -7.03%
Gulf Punch card Optical scan 9,862 174,176$ 17,661$ 9,356 199,438$ 21,317$ 20.70%
Columbia Punch card Optical scan 31,674 365,506$ 11,540$ 33,541 436,368$ 13,010$ 12.74%
Highlands Punch card Optical scan 53,394 362,233$ 6,784$ 59,247 481,839$ 8,133$ 19.88%
Osceola Punch card Optical scan 90,538 1,297,933$ 14,336$ 117,108 1,798,435$ 15,357$ 7.12%
Hernando Punch card Optical scan 97,372 575,354$ 5,909$ 107,772 832,271$ 7,723$ 30.69%
Marion Punch card Optical scan 146,312 664,026$ 4,538$ 175,683 1,308,219$ 7,446$ 64.08%
Polk Punch card Optical scan 244,414 2,143,605$ 8,770$ 283,032 2,335,256$ 8,251$ -5.92%
AVERAGE 11,063$ 12,359$ 11.71%
Sumter Punch card Touchscreen 32,009 512,169$ 16,001$ 38,023 947,370$ 24,916$ 55.72%
Indian river Punch card Touchscreen 71,868 663,132$ 9,227$ 77,468 999,450$ 12,901$ 39.82%
Charlotte Punch card Touchscreen 99,256 739,344$ 7,449$ 108,821 1,251,019$ 11,496$ 54.33%
Sarasota Punch card Touchscreen 220,246 1,752,829$ 7,959$ 233,005 2,929,420$ 12,572$ 57.97%
Lee Punch card Touchscreen 248,847 2,015,264$ 8,098$ 291,948 3,440,887$ 11,786$ 45.53%
Hillsborough Punch card Touchscreen 503,939 2,806,250$ 5,569$ 569,575 5,137,388$ 9,020$ 61.97%
Pinellas Punch card Touchscreen 570,970 3,820,141$ 6,691$ 572,858 5,129,234$ 8,954$ 33.83%
Palm Beach Punch card Touchscreen 663,036 2,831,115$ 4,270$ 722,820 6,202,863$ 8,581$ 100.97%
Miami-Dade Punch card Touchscreen 892,174 7,143,000$ 8,006$ 968,296 15,040,000$ 15,532$ 94.00%
Broward Punch card Touchscreen 903,452 4,666,420$ 5,165$ 979,747 8,423,192$ 8,597$ 66.45%
AVERAGE 7,843$ 12,436$ 58.55%
Note: Counties in each category are listed in ascending order by 2000-2001 population.
COUNTIES THAT SWITCHED FROM PUNCH CARD TO TOUCH-SCREEN SYSTEMS
Before and After Implementation of the Help America Vote ActComparison of Changes in Total Annual Election Costs for Florida Counties
COUNTIES THAT SWITCHED FROM PUNCH CARD TO OPTICAL SCAN SYSTEMS with Accessible Touch-screens
2000 and 2001 Averages 2003 and 2004 Averages

15 Cost Analysis of Maryland’s Electronic Voting System, 2008 www.saveourvotes.org
County Pre-HAVA
SystemHAVA
SystemRegistered
Voters Total SpentCost per
1K VotersRegistered
Voters Total SpentCost per
1K VotersPercent Change
Okeechobee Optical Scan Optical Scan 17,128 271,892$ 15,874$ 17,591 311,783$ 17,724$ 11.65%
Flagler Optical scan Optical scan 34,240 352,836$ 10,305$ 43,118 436,713$ 10,128$ -1.71%
Citrus Optical scan Optical scan 80,592 613,974$ 7,618$ 86,409 794,123$ 9,190$ 20.63%
Clay Optical scan Optical scan 84,361 794,214$ 9,414$ 96,408 1,152,973$ 11,959$ 27.03%
St John Optical scan Optical scan 88,258 770,522$ 8,730$ 101,816 1,041,702$ 10,231$ 17.19%
Bay Optical scan Optical scan 95,846 703,542$ 7,340$ 93,799 817,695$ 8,718$ 18.76%
Okaloosa Optical scan Optical scan 113,616 904,208$ 7,958$ 120,674 1,121,262$ 9,292$ 16.75%
Alachua Optical scan Optical scan 120,005 925,039$ 7,708$ 129,170 1,178,672$ 9,125$ 18.38%
Leon Optical scan Optical scan 147,451 1,109,945$ 7,528$ 151,506 1,796,887$ 11,860$ 57.56%
Manatee Optical scan Optical scan 159,408 1,141,420$ 7,160$ 185,033 1,455,652$ 7,867$ 9.87%
Escambia Optical scan Optical scan 173,129 1,503,043$ 8,682$ 176,817 1,740,157$ 9,842$ 13.36%
Volusia Optical scan Optical scan 254,065 1,769,823$ 6,966$ 288,805 2,525,418$ 8,744$ 25.53%
Orange Optical scan Optical scan 382,138 4,218,509$ 11,039$ 432,945 5,692,856$ 13,149$ 19.11%
AVERAGE 8,948$ 10,602$ 18.49%
Before and After Implementation of the Help America Vote ActComparison of Changes in Total Annual Election Costs for Florida Counties
2000 and 2001 Averages 2003 and 2004 Averages
DATA SOURCE: Myerson, Rosemarie and Richard Myerson, Report on a Survey of Changes in Total Annual Expenditures for Florida Counties Before and After Purchase of Touch Screens and A Comparison of Total Annual Expenditures for Touch Screens and Optical Sca
Note: Counties in each category are listed in ascending order by 2000-2001 population.
COUNTIES THAT KEPT THEIR EXISTING OPTICAL SCAN SYSTEMS, Adding Touch-screens for Accessibility
(continued from previous page)
Related Documents