C O S T A c t i o n G 8 : N O N - D E S T R U C T I V E T E S T I N G A N D A N A L Y S I S O F M U S E U M O B J E C T S Edited by Andrea Denker, Annemie Adriaens, Mark Dowsett and Alessandra Giumlia-Mair

Welcome message from author
This document is posted to help you gain knowledge. Please leave a comment to let me know what you think about it! Share it to your friends and learn new things together.
Transcript
COST Action G8:NON-DESTRUCTIVE TESTING AND ANALYSIS OF MUSEUM OBJECTS
Edited by Andrea Denker, Annemie Adriaens, Mark Dowsett and Alessandra Giumlia-Mair
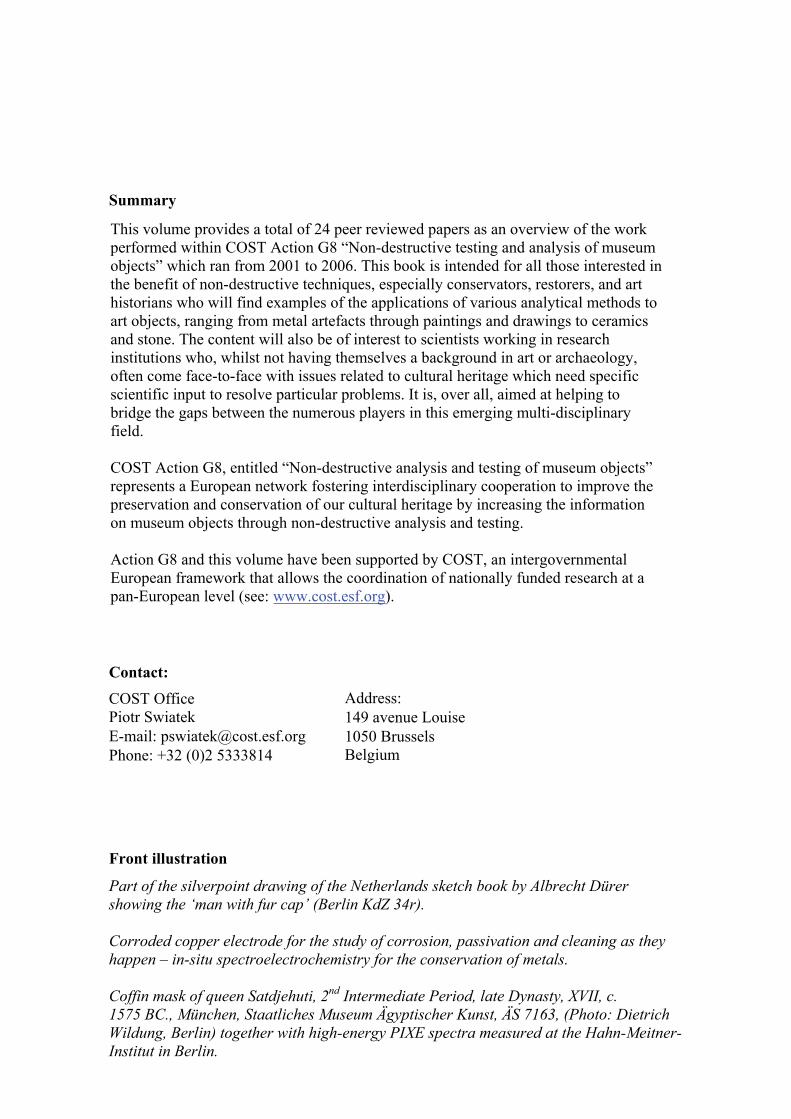
Front illustration
Part of the silverpoint drawing of the Netherlands sketch book by Albrecht Dürer showing the ‘man with fur cap’ (Berlin KdZ 34r).
Corroded copper electrode for the study of corrosion, passivation and cleaning as they happen – in-situ spectroelectrochemistry for the conservation of metals.
Coffin mask of queen Satdjehuti, 2nd Intermediate Period, late Dynasty, XVII, c. 1575 BC., München, Staatliches Museum Ägyptischer Kunst, ÄS 7163, (Photo: Dietrich Wildung, Berlin) together with high-energy PIXE spectra measured at the Hahn-Meitner-Institut in Berlin.
Contact:COST Office Piotr SwiatekE-mail: [email protected]: +32 (0)2 5333814
Address: 149 avenue Louise 1050 Brussels Belgium
This volume provides a total of 24 peer reviewed papers as an overview of the work performed within COST Action G8 “Non-destructive testing and analysis of museum objects” which ran from 2001 to 2006. This book is intended for all those interested in the benefit of non-destructive techniques, especially conservators, restorers, and art historians who will find examples of the applications of various analytical methods to art objects, ranging from metal artefacts through paintings and drawings to ceramics and stone. The content will also be of interest to scientists working in research institutions who, whilst not having themselves a background in art or archaeology, often come face-to-face with issues related to cultural heritage which need specific scientific input to resolve particular problems. It is, over all, aimed at helping to bridge the gaps between the numerous players in this emerging multi-disciplinary field.
COST Action G8, entitled “Non-destructive analysis and testing of museum objects” represents a European network fostering interdisciplinary cooperation to improve the preservation and conservation of our cultural heritage by increasing the information on museum objects through non-destructive analysis and testing.
Action G8 and this volume have been supported by COST, an intergovernmental European framework that allows the coordination of nationally funded research at a pan-European level (see: www.cost.esf.org).
Summary
COSTEuropean Cooperation in the field of
scientific and technical research
COST Action G8
Non-destructive testing and analysisof museum objects
Edited by Andrea Denker, Annemie Adriaens, Mark Dowsett and
Alessandra Giumlia-Mair
2006

Contents 1. Foreword 2. Metals 2.1. A novel ‘in-situ’ approach for the examination of the microstructure of
metal artefacts. Principles and application to iron based armour elements A. Williams, D. Vella, A. Giumlia-Mair, C. Degrigny, M. Grech
2.2. Possible links between Hungarian and Spanish beaker metallurgy L. Reményi, A. Endrödi, E. Baradács, Á. Z. Kiss, I. Uzonyi, I. Montero, S. Rovira
2.3. Synchrotron radiation and neutron study of a 7th-century BC Corinthian-type bronze helmet at The Manchester Museum E. Pantos, W. Kockelmann, L.C. Chapon, L. Lutterotti, S.L. Bennet, M.J. Tobin, J.F.W. Mosselmans, T. Pradell, N. Salvado, S. Butí, R. Garner, A.J.N.W. Prag
2.4. Observing corrosion, passivation and cleaning as they happen – in-situ spectroelectrochemistry for the conservation of metals A. Adriaens, M.G. Dowsett
2.5. Catalogue of Roman Bronze Sculptures from East, Central and South Switzerland E. Deschler-Erb, E. Lehmann, P. Vontobel, E. Hildbrand, K. Hunger, M. Soares
2.6. Non-destructive analysis of Medieval Silver Coins A. Denker, J. Opitz-Coutureau, M. Griesser, R. Denk, H. Winter
2.7. Photon, electron and proton induced- X-rays: powerful tools for the identification and the characterisation of Medieval silver coins. R. Linke, M. Schreiner, G. Demortier
2.8. Micro-PIXE studies on Visigothic ‘Pietroasa’gold hoard B. Constantinescu, R. Bugoi, V. Cojocaru, D. Voiculescu, D. Grambole, F. Herrmann, D. Ceccato, T. Calligaro, J. Salomon, L. Pichon, S. Röhrs
3. Paintings, Graphics, Pigments 3.1. Neutron Autoradiography of Paintings, “The Hermit” by an Unknown
Artist, and “Armida abducts the sleeping Rinaldo” (c. ~ 1637) by Nicolas Poussin B. Schröder-Smeibidl, C. Laurenze-Landsberg, C. Schmidt, L.A. Mertens
3.2. Synchrotron radiation and protons on the traces of famous artists: Non-destructive analyses of silverpoint drawings by Albrecht Dürer I. Reiche, A. Berger, A. Duval, W. Görner, H. Guicharnaud, S. Merchel, M. Radtke, J. Riederer, H. Riesemeier, M. Roth
3.3. Bronze Age Painted Plaster in Mycenaean Greece: An Application of Micro-Raman Spectroscopy within the context of collaborative research A. Brysbaert, P. Vandenabeele
5
9
17
25
31
47
55
64
73
85
91
102
3
4. Ceramics and Stones 4.1. Provenancing Merovingian Garnets by PIXE and µ-Raman spectrometry
P. Périn, F. Vallet, T. Calligaro, D. Bagault, J.-P. Poirot 4.2. The mineralogy of Böttger stoneware
W. Kockelmann, A. Kirfel, C. Neelmeijer, H.-M. Walcha 4.3. Non-destructive Evaluation of Museum Objects Physic-Mechanical
Properties V. Vladimirov
4.4. Cobalt blue pigments in ceramics during the Italian Renaissance A. Zucchiatti, A. D’Alessandro, F. Mazzei
5. Glass 5.1. Phase contrast microtomography for archaeological glasses
S. Gerlach, H. Römich, E. Lopéz, F. Zanini, L. Mancin, L. Rigon 5.2. What can bring the PIXE –PIGE method to the study of stained glass
window? G. Weber , D. Strivay, Y. Vanden Bemden, M. Pirotte
5.3. Production of glass in the Venetian manner Ž. Šmit, K. Janssens, M. Kos
6. Paper 6.1. Micro-destructive method for pH determination of paper documents and
books J. Hanus, J. Mináriková, Z. Szabóová, E. Hanusová, K. Lamens
6.2. Analysis of contamination and pigments on historical paper documents by means of LIPS spectroscopy K. Komar, M. Martin, J. Bredal-Jorgensen, G. Sliwinski
7. Miscellaneous Materials 7.1. A multi-interdisciplinary handshake between Humanities and Science at
Qumran J. Gunneweg, M. Balla, J. Wouters, C. Greenblatt, M. Mueller, E. Pantos, H. van der Plicht, A. Adriaens, K. L. Rasmussen, C. Riekel, M. Burghammer, B. Murphy
8. Training Schools 8.1. The training school on archaeometry and ceramics held in Bordighera,
A. Zucchiatti, C. Varaldo 8.2. COST G8 Training School in Malta: Innovative tools for exhibition
purposes: environmental and damage assessment C. Degrigny, C. von Waldthausen
8.3. SOLEIL and COST organised the first training school on the synchrotron analysis of ancient materials L. Bertrand
9. Appendix 9.1. Members of COST G8 9.2. Dissemination of Results 9.3. Glossary
111
120
128
134
147
152
161
171
176
185
197
200
212
219225235
4
Foreword The conservation and preservation of our cultural heritage is one of the main concerns within Europe today. Its physical part is deteriorating faster than it can be conserved, restored or studied. Assets are being lost, or are at risk, through natural processes of decay (sometimes accelerated by poor environmental control), environmental disasters (sometimes exacerbated by human activity), the direct effects of enhanced public access (without commensurate conservation measures), conservation/preservation procedures whose long-term effects were and are not understood, simple negligence, looting and war.
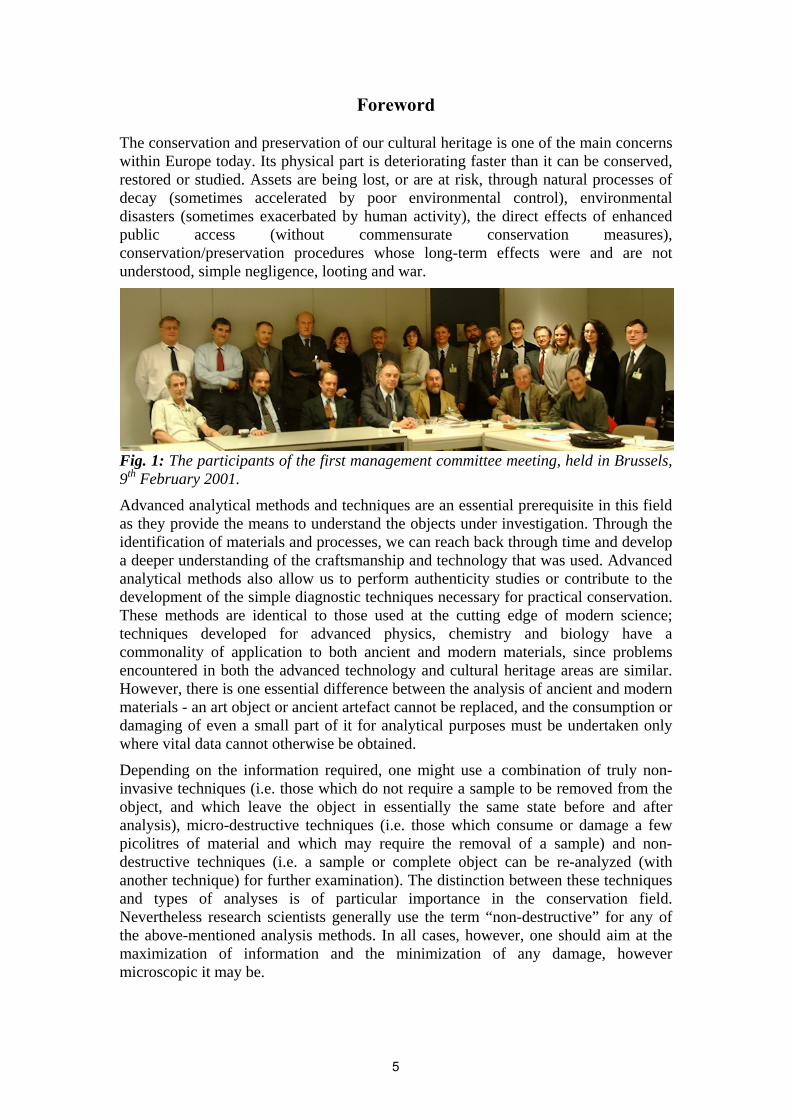
Fig. 1: The participants of the first management committee meeting, held in Brussels, 9th February 2001.
Advanced analytical methods and techniques are an essential prerequisite in this field as they provide the means to understand the objects under investigation. Through the identification of materials and processes, we can reach back through time and develop a deeper understanding of the craftsmanship and technology that was used. Advanced analytical methods also allow us to perform authenticity studies or contribute to the development of the simple diagnostic techniques necessary for practical conservation. These methods are identical to those used at the cutting edge of modern science; techniques developed for advanced physics, chemistry and biology have a commonality of application to both ancient and modern materials, since problems encountered in both the advanced technology and cultural heritage areas are similar. However, there is one essential difference between the analysis of ancient and modern materials - an art object or ancient artefact cannot be replaced, and the consumption or damaging of even a small part of it for analytical purposes must be undertaken only where vital data cannot otherwise be obtained.
Depending on the information required, one might use a combination of truly non-invasive techniques (i.e. those which do not require a sample to be removed from the object, and which leave the object in essentially the same state before and after analysis), micro-destructive techniques (i.e. those which consume or damage a few picolitres of material and which may require the removal of a sample) and non-destructive techniques (i.e. a sample or complete object can be re-analyzed (with another technique) for further examination). The distinction between these techniques and types of analyses is of particular importance in the conservation field. Nevertheless research scientists generally use the term “non-destructive” for any of the above-mentioned analysis methods. In all cases, however, one should aim at the maximization of information and the minimization of any damage, however microscopic it may be.
5
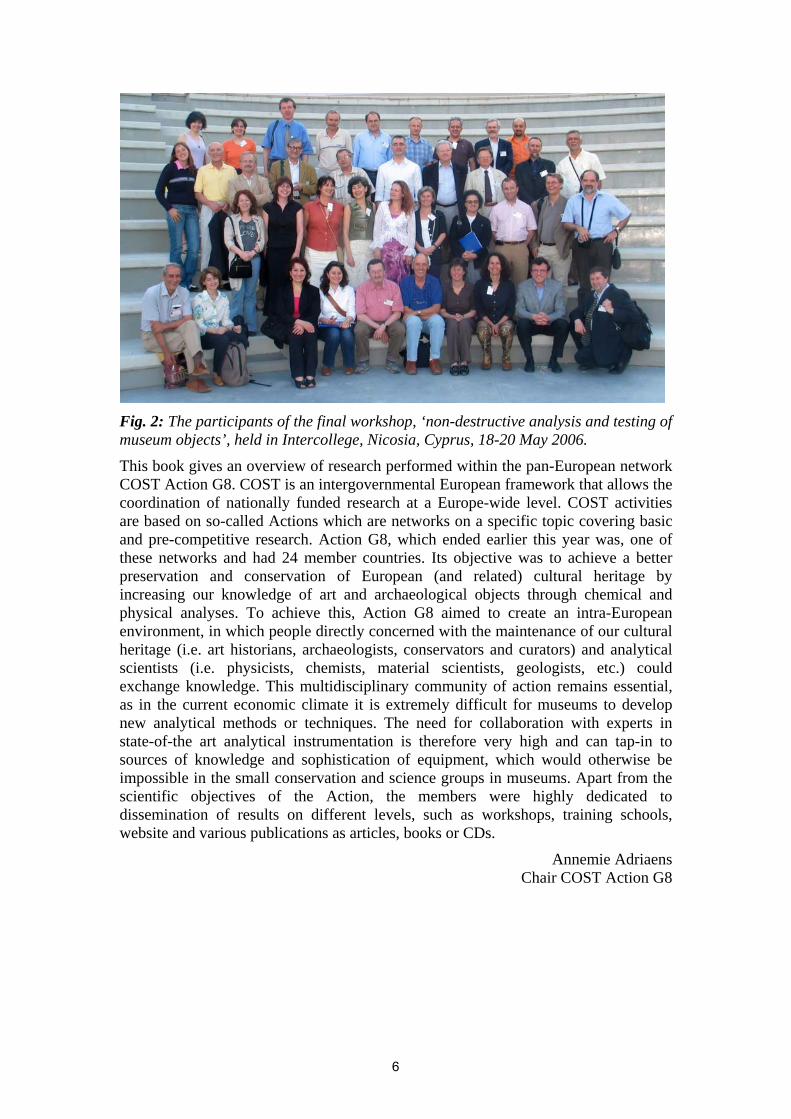
Fig. 2: The participants of the final workshop, ‘non-destructive analysis and testing of museum objects’, held in Intercollege, Nicosia, Cyprus, 18-20 May 2006.
This book gives an overview of research performed within the pan-European network COST Action G8. COST is an intergovernmental European framework that allows the coordination of nationally funded research at a Europe-wide level. COST activities are based on so-called Actions which are networks on a specific topic covering basic and pre-competitive research. Action G8, which ended earlier this year was, one of these networks and had 24 member countries. Its objective was to achieve a better preservation and conservation of European (and related) cultural heritage by increasing our knowledge of art and archaeological objects through chemical and physical analyses. To achieve this, Action G8 aimed to create an intra-European environment, in which people directly concerned with the maintenance of our cultural heritage (i.e. art historians, archaeologists, conservators and curators) and analytical scientists (i.e. physicists, chemists, material scientists, geologists, etc.) could exchange knowledge. This multidisciplinary community of action remains essential, as in the current economic climate it is extremely difficult for museums to develop new analytical methods or techniques. The need for collaboration with experts in state-of-the art analytical instrumentation is therefore very high and can tap-in to sources of knowledge and sophistication of equipment, which would otherwise be impossible in the small conservation and science groups in museums. Apart from the scientific objectives of the Action, the members were highly dedicated to dissemination of results on different levels, such as workshops, training schools, website and various publications as articles, books or CDs.
Annemie Adriaens Chair COST Action G8
6

Metals

A novel ‘in-situ’ approach for the examination of the microstructure of metal artefacts. Principles and application to iron based armour
elements
Alan Williams1, Daniel Vella2, Alessandra Giumlia-Mair3, Christian Degrigny1, Maurice Grech4
1The Wallace Collection, London, WIU 3 BN, Great Britain, 2Heritage Malta Bighi, Kalkara CSP12, Malta
3AGM Archeoanalisi, Merano, Italy 4Faculty of Engineering, Department of Metallurgy and Materials Engineering,
University of Malta, Msida, MSD 06, Malta (corresponding author: [email protected])
Abstract The examination of the microstructure of metal artefacts allows a great deal of information to be obtained about the quality of the material used for manufacturing as well as information related to the technology of fabrication. Unfortunately accessing this information normally requires an invasive intervention on the artefact: a small fragment needs to be detached from the artefact, and mounted as a cross-section by an embedding procedure followed by observation under a metallographic microscope. This method is not always acceptable: museum curators are often reluctant to allow extraction of fragments from their artefacts, making a metallurgical study of these objects an impossible feat. In attempt to circumvent this difficulty, the authors are proposing to turn to a more benign method, that of ‘in-situ’ metallographic examination.
Keywords: Steel armour, ‘in-situ’ metallographic examination, inverted metallographic microscope, Palace Armoury, Basilica of Santa Maria delle Grazie.
Introduction Among the many analytical techniques available to study historical artefacts, metallography is one of the oldest, and still one of the most useful for metal objects. Metallography, or the microscopic examination of a prepared surface by means of a reflected-light microscope, dates back to the early years of the 20th century. It requires only a very small sample (as little as 1 mm in extent) or even, with some modifi-cation, can be employed without detaching a sample from the artefact at all. It can provide a great deal of information about the fabrication of metal objects, the joining of their components, the casting and annealing of non-ferrous alloys, as well as giving an estimate for the carbon content of steels, and their subsequent heat-treatment. The earliest example of metallography applied to museum objects is perhaps the examination of tools and weapons from Ancient Egypt by Carpenter and Robinson (1930). Numerous studies have been undertaken since then. Those by Cyril Stanley Smith (1960) on museum objects as diverse as Merovingian as well as Japanese swords, Greek as well as Chinese bronzes, Malay kris and Turkish gunbarrels are exemplars of what the application of science to our cultural heritage should be. It is particularly useful for groups of objects produced from a single workshop, or groups of workshops within a single production area, when a similar raw material might be used over a considerable period of time, so that observed changes in the microstructure of the artefacts of similar form and function would probably be due to changes in production techniques. What microscopic study is less capable of is providing details of the smelting process, but in many cases, especially for ferrous objects when iron ores are so widespread, such details may be of less interest than the manufacturing technology. In the case of charcoal-reduced iron, the incidence of significant impurities is likely to be so low that little useful information would be gained by chemical microanalysis.
9
In pre-modern cultures, iron was extracted from its abundant ores by heating with charcoal (carbon) in a small furnace, perhaps 1 m high. While the reduction of iron ores to iron is straightforward, the high melting point of iron (1550oC) makes its liquefaction very difficult. The non-metallic part of the ore, however, forms “slag” a glassy material, which liquefies around 1200oC and enables the particles of iron to coalesce as a heterogeneous lump or ‘bloom’. If this bloom is allowed to remain in contact with carbon for some hours, or even days, then an alloy of iron and carbon, steel, is formed. If the steel is allowed to cool in air after being worked hot, then its hardness is comparable to bronze, but of course, steel is far cheaper than bronze! Under air-cooling, equilibrium conditions will prevail. The carbon that was dissolved in the iron above 900oC comes out of solution as a lamellar arrangement of iron carbide and ferrite with a distinctive microscopic appearance and called pearlite. On the other hand, if steels are quenched, their hardness increases enormously. Its resistance to indentation can measure the hardness of a metal by a given load. This can be reported using the Vickers Pyramid Hardness (VPH) scale, whose units are kg/mm2. Hardness values between 300 VPH and 700 VPH are easily obtained, even with medieval alloys, compared with perhaps 120 VPH for a modern mild (low-carbon) steel. This is because, when steel is quenched, then “martensite”, a material of lath-like microscopical appearance and great hardness, may form. The appearance of martensite as a microconstituent does not, of course, prove the deliberate employment of steel on the part of the smith. He may well have quenched everything he made on the grounds that it might improve the tool or weapon, and was unlikely to do much harm, at the low carbon contents likely to be found. In the conventional method of fragment detachment the researcher is often faced with a serious shortcoming: whether the fragment under investigation is representative of the material constituting the whole armour plate. This is a major concern when one considers the technology available at the time for producing the initial raw material. As described above, the smelting process resulted in a heterogeneous ‘bloom’ consisting of a spongy matrix of metal and slag. In the production of steel, the diffusion of carbon from charcoal was likely to produce a bloom with a carbon content that varied considerably from one area to another of the bloom. It was up to the smith to forge out a homogenous plate of metal relatively free from slag impurities (slag is released from the bloom during forging). The quality of the final product was therefore highly dependant on the skills of the smith [Williams 2003]. Conclusions on the technology of manufacture based on a microstructural study of a single fragment cross-section should be addressed with caution. Confidence is achieved by examining the microstructural evidence of several fragments extracted from different areas on the same artefact. This however is not normally feasible for obvious reasons. A clear advantage of the “in-situ” method is the fact that it can be carried out at several places along an edge, or alternatively on different edges on the same artefact. The method allows several areas on the artefact to be investigated without the need to detach samples. Principle of the technique: the different steps Selecting a site for embedding Armour artefacts tend to be very complicated geometrical objects. Nonetheless close examination of most pieces usually allows an edge to be identified for embedding. The armour might have to be opened up in order to expose a hidden edge. This is the case of the gorget illustrated here, an armour piece comprising two overlapping plates that protect the neck area. The edge of the lower plate is generally hidden from view.
10
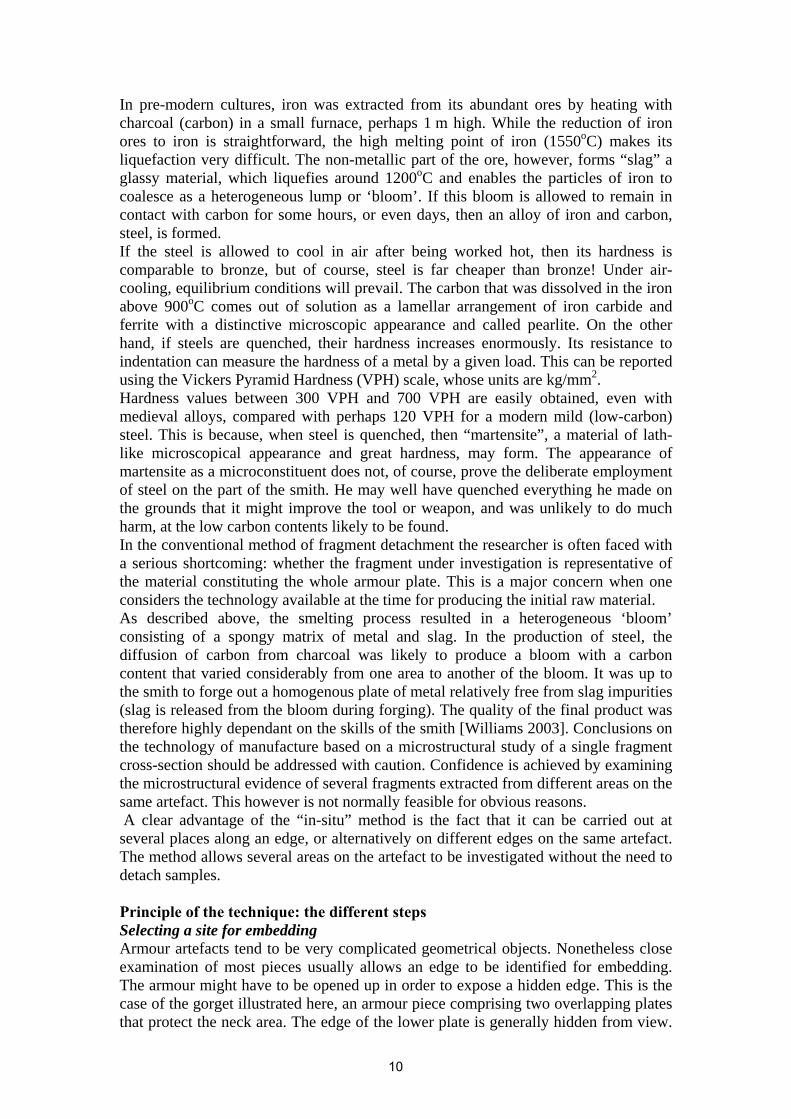
Complications arise when dealing with an edge worked into a decorative motif such as a turned or roped edge. Such edges cannot be used and a flat edge must be sought elsewhere on the artefact. Embedding Once the site of examination is selected, one proceeds to embed the edge in resin. A silicone mould prepared in the form of a crucible is used for this purpose. The mould is cast to suit the shape of the armour under investigation. A slit is cut through the mould and the armour edge is inserted in place as shown in Figure 1. PlasticineTM or Blu-tacTM is used to support the area between the metal plate and mould; in this way liquid resin is prevented from leaking out of the mould during the resin curing stage (1-5 hours depending on the resin). The resin used for embedding should be polyester based. Once cured, polyester can be easily detached from the armour without leaving any residue. It has been shown that armour decoration (e.g. gilding or etching) that is embedded in polyester resin is not altered during removal of the resin cast. This is not the case for epoxy-based resins. These resins bond strongly to the metallic surface, making their removal very difficult.
Fig. 1: Polyester resin curing around the edge of a 15th century helmet (barbuta) from the Wallace Collection (Inventory No. A75).
Once the resin sets, the embedded edge is checked to ensure that the cast is firmly attached to the metal and is free from voids (air bubbles entrapped between metal and resin). More importantly, one must make sure that the surface of the cross-section is flat. In the absence of the latter, fresh resin should be applied to achieve a final flat surface. Ignoring this step might lead to the physical alteration of the edge during grinding. Finally a layer of wax is applied over the surrounding metal surfaces. The hydrophobic layer will protect exposed metallic parts during handling and rinsing with water (see below). Grinding, polishing and etching Manual grinding of the cross-sectional surface follows. Grinding of the polymer surface and the embedded metal is carried out using successively 100, 200, 300, 400 and 600-grade silicon carbide grinding paper. Grinding paper is cut into square sheets and wrapped around a piece of wood for easy handling. Medicinal paraffin is used as a lubricant. Grinding should proceed uni-directionally. Grinding marks are checked
11
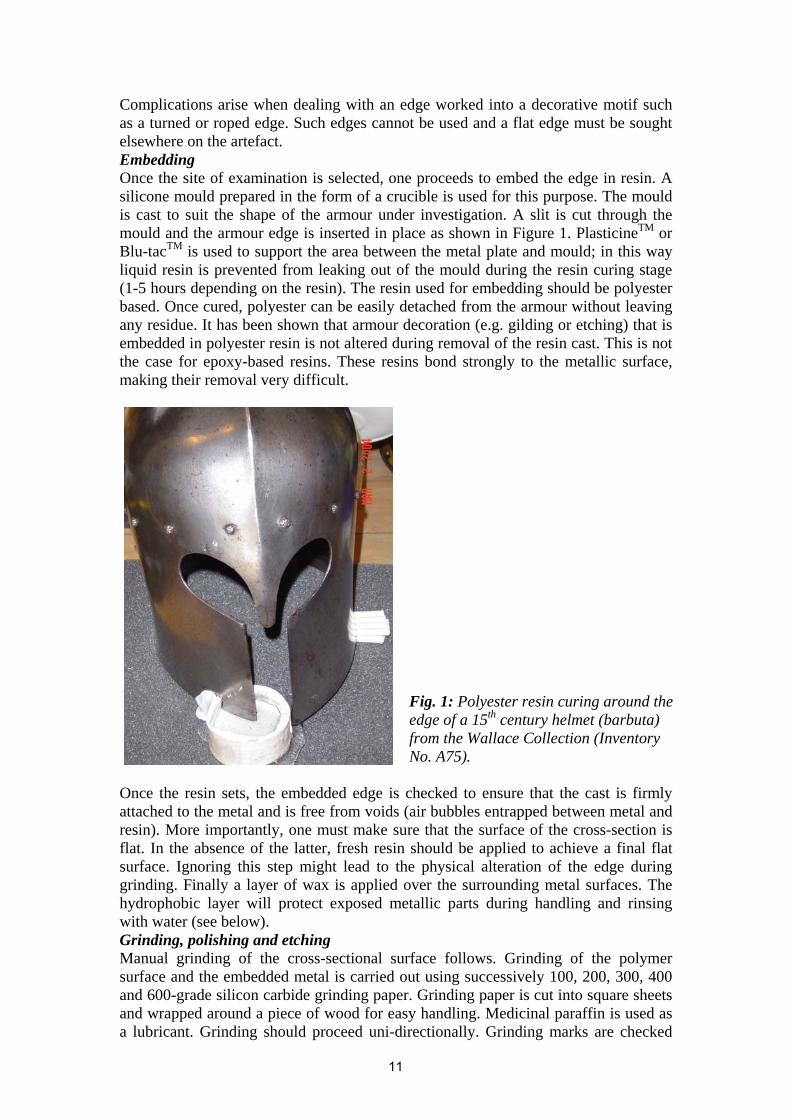
for consistency and directionality under an illuminated magnifying lens before proceeding to finer grades of paper. With every change in grinding paper, the abraded surface is cleaned from grinding debris (hot water and soap followed by methylated spirit and drying with a heat gun) and the direction of grinding rotated through 60°. This is carried out to eliminate the likelihood of contamination from coarser carbide particles. Polishing is carried out using 6 micron followed by 1 micron diamond paste. MetadiTM or similar is used as a lubricant. Then polishing is carried out either on a conventional polishing turntable (if the size and shape of the armour object allows it), or using a hand held electrically driven polishing wheel adapted for the purpose. During polishing the exposed metal section is counter-rotated against the direction of rotation of the turntable/polishing wheel. This guarantees a homogenous polish throughout. Figure 2 shows a polished embedded edge prior to etching.
Fig. 2: Polished surface just before etching. Gorget, late 16th Century.
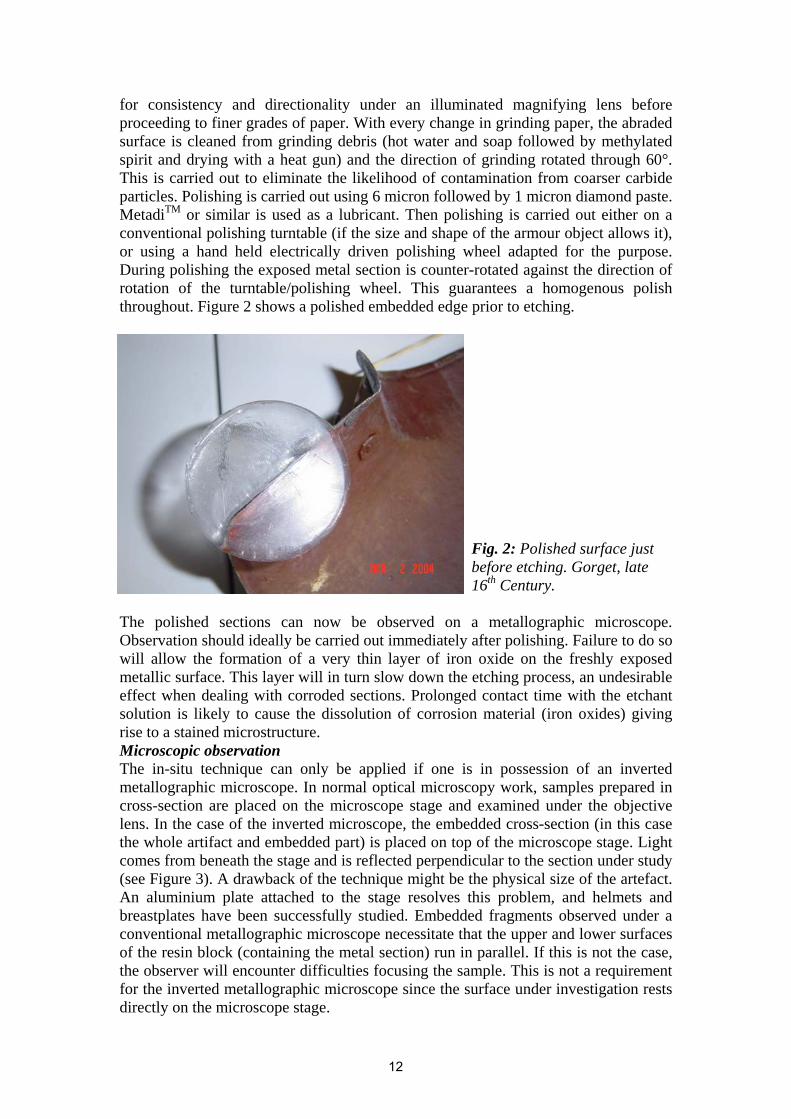
The polished sections can now be observed on a metallographic microscope. Observation should ideally be carried out immediately after polishing. Failure to do so will allow the formation of a very thin layer of iron oxide on the freshly exposed metallic surface. This layer will in turn slow down the etching process, an undesirable effect when dealing with corroded sections. Prolonged contact time with the etchant solution is likely to cause the dissolution of corrosion material (iron oxides) giving rise to a stained microstructure. Microscopic observation The in-situ technique can only be applied if one is in possession of an inverted metallographic microscope. In normal optical microscopy work, samples prepared in cross-section are placed on the microscope stage and examined under the objective lens. In the case of the inverted microscope, the embedded cross-section (in this case the whole artifact and embedded part) is placed on top of the microscope stage. Light comes from beneath the stage and is reflected perpendicular to the section under study (see Figure 3). A drawback of the technique might be the physical size of the artefact. An aluminium plate attached to the stage resolves this problem, and helmets and breastplates have been successfully studied. Embedded fragments observed under a conventional metallographic microscope necessitate that the upper and lower surfaces of the resin block (containing the metal section) run in parallel. If this is not the case, the observer will encounter difficulties focusing the sample. This is not a requirement for the inverted metallographic microscope since the surface under investigation rests directly on the microscope stage.
12
Fig. 3: Inverted microscope set-up. Examining the microstructure of the 15th century barbuta.
Microscopic observation is carried out in two steps: a preliminary observation is performed prior to etching. Features such as slag inclusions, corrosion layers and corrosion pits are easily observed at this stage. The presence of the microstructure would otherwise interfere with this examination, making these features difficult to discern. In a second step, the polished metal is etched chemically in 2 % nital-picral solution (2 % nitric acid in ethanol, containing a trace amounts of picric acid). This etchant solution is ideal for iron and steel. Picric acid is added to enhance the effect of the nital. Etching (~ 10 seconds) is followed by a washing step with ample amount of alcohol and rapid drying using a heat gun. The etched samples can then be re-examined on the metallographic microscope. Removal of polyester, final finishing When microscopic observation work is concluded, the exposed metal is over-etched by allowing the exposed metal to remain in contact with the nital solution for a couple of minutes. In this manner, the bright metallic lustre of the polished metal is dulled and darkened. The embedded section is washed and dried as described above and the polyester cast is broken off the armour. This is carried out manually or with the help of pliers. The amour plate is restored to its original state and re-waxed. Applications Palace Armoury, Valletta The Palace Armoury, situated on the first floor of the Grand Masters’ Palace in Valletta housed a functional armoury for the Knights of Saint John (in Malta from 1530 to 1798); the arsenal was replenished several times over the decades with arms and armour for use on the battlefield [Spiteri 2002]. What survives today is a residual armoury, a collection of artefacts spanning the period early 16th to the mid-17th century. Armour exhibited at the Palace originated from production sites all over Europe (France, Spain, Germany etc.) although there seems to be a predominance of Northern Italian amour [Spiteri 2002]. There is as yet no clear-cut evidence that any armour surviving at the Palace was produced in Malta (although maintenance work would certainly have been carried out).
13
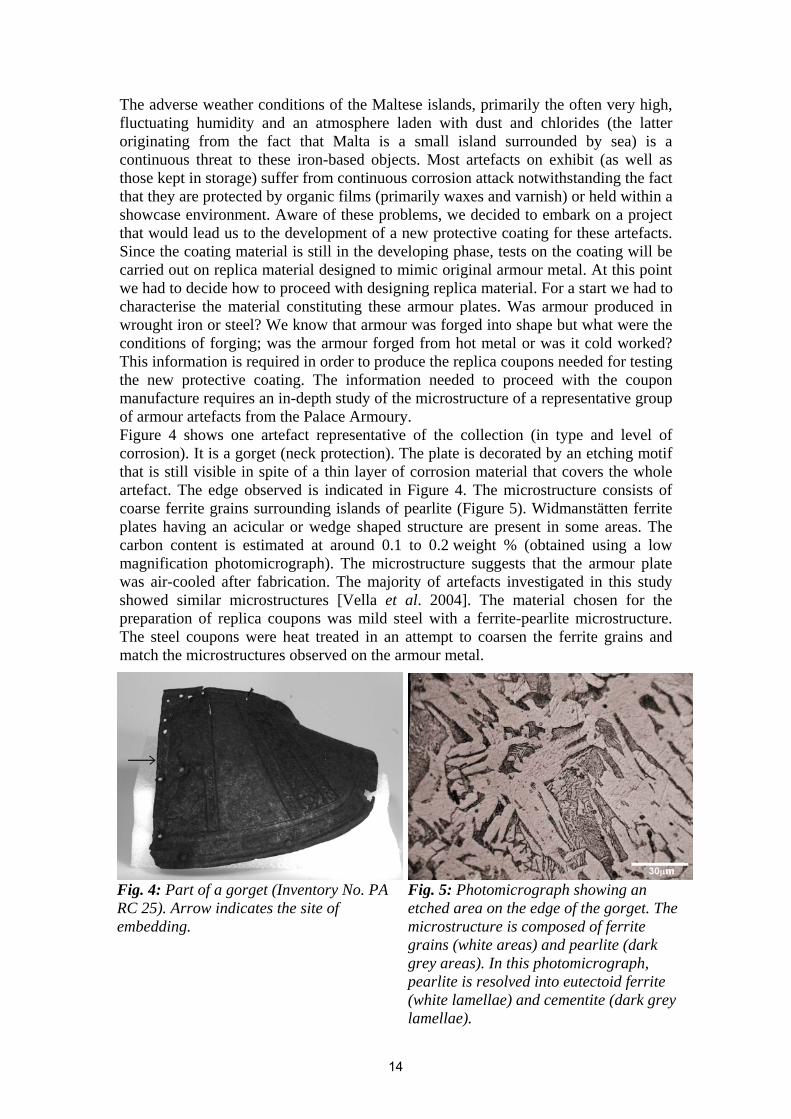
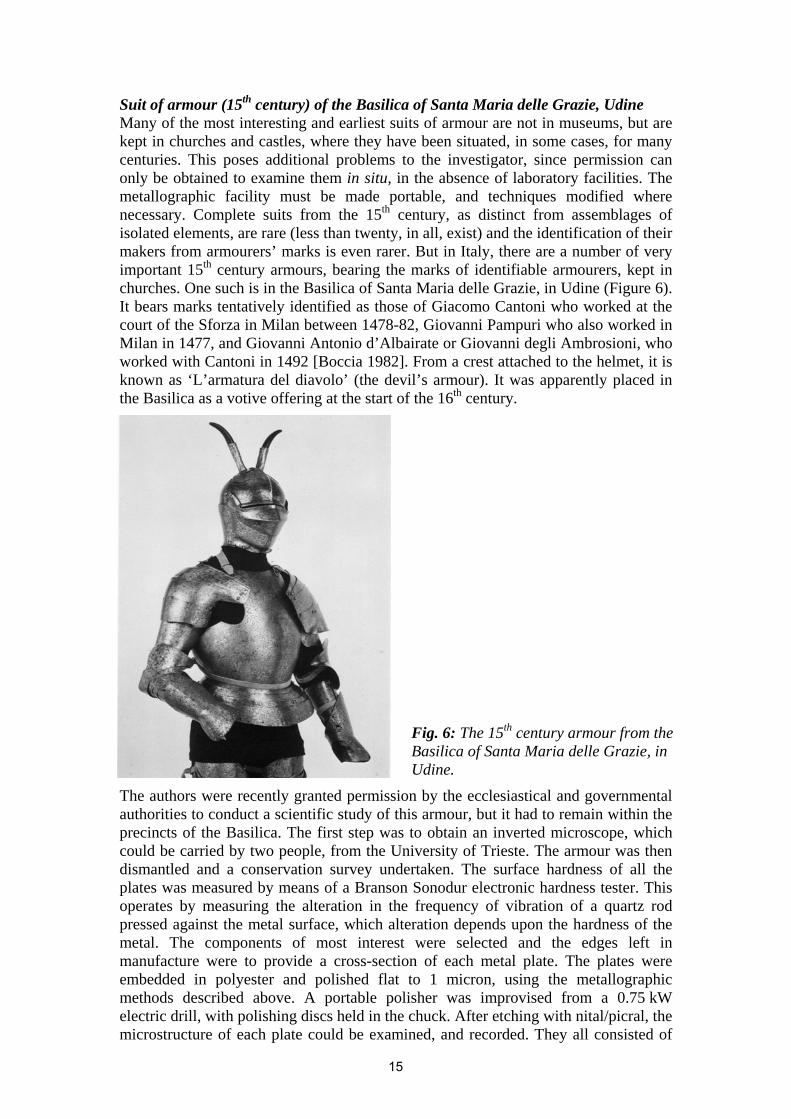
The adverse weather conditions of the Maltese islands, primarily the often very high, fluctuating humidity and an atmosphere laden with dust and chlorides (the latter originating from the fact that Malta is a small island surrounded by sea) is a continuous threat to these iron-based objects. Most artefacts on exhibit (as well as those kept in storage) suffer from continuous corrosion attack notwithstanding the fact that they are protected by organic films (primarily waxes and varnish) or held within a showcase environment. Aware of these problems, we decided to embark on a project that would lead us to the development of a new protective coating for these artefacts. Since the coating material is still in the developing phase, tests on the coating will be carried out on replica material designed to mimic original armour metal. At this point we had to decide how to proceed with designing replica material. For a start we had to characterise the material constituting these armour plates. Was armour produced in wrought iron or steel? We know that armour was forged into shape but what were the conditions of forging; was the armour forged from hot metal or was it cold worked? This information is required in order to produce the replica coupons needed for testing the new protective coating. The information needed to proceed with the coupon manufacture requires an in-depth study of the microstructure of a representative group of armour artefacts from the Palace Armoury. Figure 4 shows one artefact representative of the collection (in type and level of corrosion). It is a gorget (neck protection). The plate is decorated by an etching motif that is still visible in spite of a thin layer of corrosion material that covers the whole artefact. The edge observed is indicated in Figure 4. The microstructure consists of coarse ferrite grains surrounding islands of pearlite (Figure 5). Widmanstätten ferrite plates having an acicular or wedge shaped structure are present in some areas. The carbon content is estimated at around 0.1 to 0.2 weight % (obtained using a low magnification photomicrograph). The microstructure suggests that the armour plate was air-cooled after fabrication. The majority of artefacts investigated in this study showed similar microstructures [Vella et al. 2004]. The material chosen for the preparation of replica coupons was mild steel with a ferrite-pearlite microstructure. The steel coupons were heat treated in an attempt to coarsen the ferrite grains and match the microstructures observed on the armour metal.
Fig. 4: Part of a gorget (Inventory No. PA RC 25). Arrow indicates the site of embedding.
Fig. 5: Photomicrograph showing an etched area on the edge of the gorget. The microstructure is composed of ferrite grains (white areas) and pearlite (dark grey areas). In this photomicrograph, pearlite is resolved into eutectoid ferrite (white lamellae) and cementite (dark grey lamellae).
14
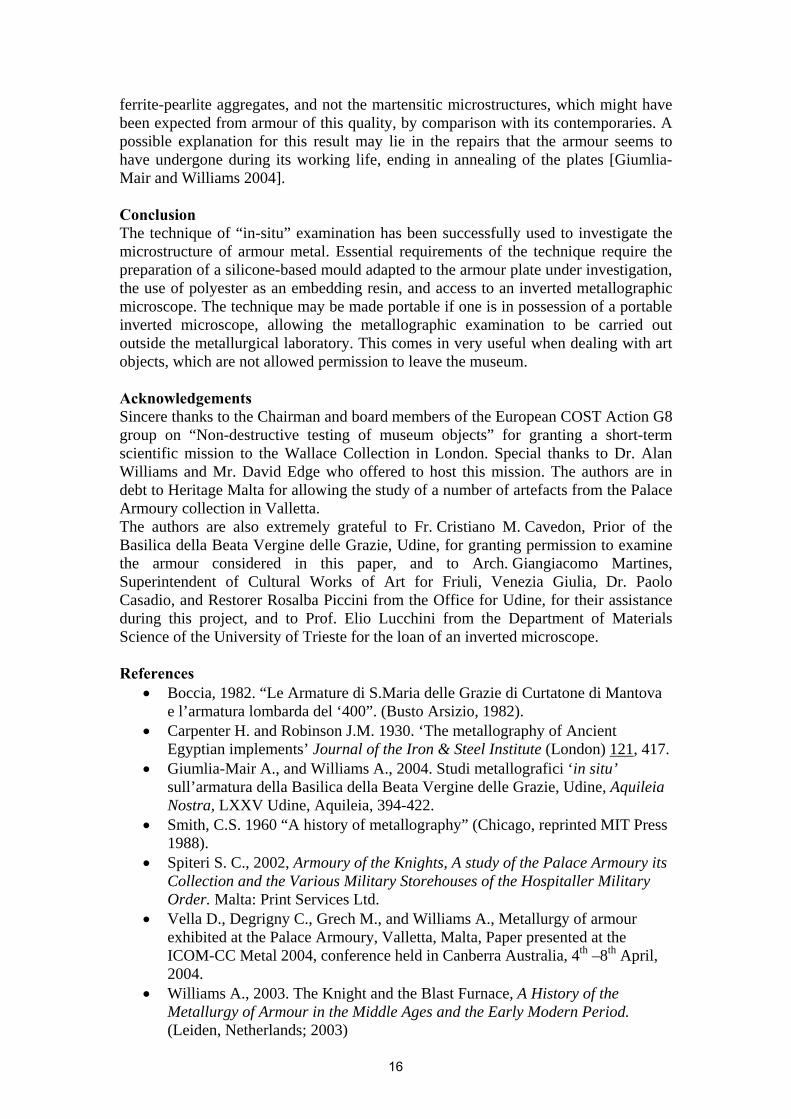
Suit of armour (15th century) of the Basilica of Santa Maria delle Grazie, Udine Many of the most interesting and earliest suits of armour are not in museums, but are kept in churches and castles, where they have been situated, in some cases, for many centuries. This poses additional problems to the investigator, since permission can only be obtained to examine them in situ, in the absence of laboratory facilities. The metallographic facility must be made portable, and techniques modified where necessary. Complete suits from the 15th century, as distinct from assemblages of isolated elements, are rare (less than twenty, in all, exist) and the identification of their makers from armourers’ marks is even rarer. But in Italy, there are a number of very important 15th century armours, bearing the marks of identifiable armourers, kept in churches. One such is in the Basilica of Santa Maria delle Grazie, in Udine (Figure 6). It bears marks tentatively identified as those of Giacomo Cantoni who worked at the court of the Sforza in Milan between 1478-82, Giovanni Pampuri who also worked in Milan in 1477, and Giovanni Antonio d’Albairate or Giovanni degli Ambrosioni, who worked with Cantoni in 1492 [Boccia 1982]. From a crest attached to the helmet, it is known as ‘L’armatura del diavolo’ (the devil’s armour). It was apparently placed in the Basilica as a votive offering at the start of the 16th century.
Fig. 6: The 15th century armour from the Basilica of Santa Maria delle Grazie, in Udine.
The authors were recently granted permission by the ecclesiastical and governmental authorities to conduct a scientific study of this armour, but it had to remain within the precincts of the Basilica. The first step was to obtain an inverted microscope, which could be carried by two people, from the University of Trieste. The armour was then dismantled and a conservation survey undertaken. The surface hardness of all the plates was measured by means of a Branson Sonodur electronic hardness tester. This operates by measuring the alteration in the frequency of vibration of a quartz rod pressed against the metal surface, which alteration depends upon the hardness of the metal. The components of most interest were selected and the edges left in manufacture were to provide a cross-section of each metal plate. The plates were embedded in polyester and polished flat to 1 micron, using the metallographic methods described above. A portable polisher was improvised from a 0.75 kW electric drill, with polishing discs held in the chuck. After etching with nital/picral, the microstructure of each plate could be examined, and recorded. They all consisted of
15
ferrite-pearlite aggregates, and not the martensitic microstructures, which might have been expected from armour of this quality, by comparison with its contemporaries. A possible explanation for this result may lie in the repairs that the armour seems to have undergone during its working life, ending in annealing of the plates [Giumlia-Mair and Williams 2004]. Conclusion The technique of “in-situ” examination has been successfully used to investigate the microstructure of armour metal. Essential requirements of the technique require the preparation of a silicone-based mould adapted to the armour plate under investigation, the use of polyester as an embedding resin, and access to an inverted metallographic microscope. The technique may be made portable if one is in possession of a portable inverted microscope, allowing the metallographic examination to be carried out outside the metallurgical laboratory. This comes in very useful when dealing with art objects, which are not allowed permission to leave the museum. Acknowledgements Sincere thanks to the Chairman and board members of the European COST Action G8 group on “Non-destructive testing of museum objects” for granting a short-term scientific mission to the Wallace Collection in London. Special thanks to Dr. Alan Williams and Mr. David Edge who offered to host this mission. The authors are in debt to Heritage Malta for allowing the study of a number of artefacts from the Palace Armoury collection in Valletta. The authors are also extremely grateful to Fr. Cristiano M. Cavedon, Prior of the Basilica della Beata Vergine delle Grazie, Udine, for granting permission to examine the armour considered in this paper, and to Arch. Giangiacomo Martines, Superintendent of Cultural Works of Art for Friuli, Venezia Giulia, Dr. Paolo Casadio, and Restorer Rosalba Piccini from the Office for Udine, for their assistance during this project, and to Prof. Elio Lucchini from the Department of Materials Science of the University of Trieste for the loan of an inverted microscope. References
• Boccia, 1982. “Le Armature di S.Maria delle Grazie di Curtatone di Mantova e l’armatura lombarda del ‘400”. (Busto Arsizio, 1982).
• Carpenter H. and Robinson J.M. 1930. ‘The metallography of Ancient Egyptian implements’ Journal of the Iron & Steel Institute (London) 121, 417.
• Giumlia-Mair A., and Williams A., 2004. Studi metallografici ‘in situ’ sull’armatura della Basilica della Beata Vergine delle Grazie, Udine, Aquileia Nostra, LXXV Udine, Aquileia, 394-422.
• Smith, C.S. 1960 “A history of metallography” (Chicago, reprinted MIT Press 1988).
• Spiteri S. C., 2002, Armoury of the Knights, A study of the Palace Armoury its Collection and the Various Military Storehouses of the Hospitaller Military Order. Malta: Print Services Ltd.
• Vella D., Degrigny C., Grech M., and Williams A., Metallurgy of armour exhibited at the Palace Armoury, Valletta, Malta, Paper presented at the ICOM-CC Metal 2004, conference held in Canberra Australia, 4th –8th April, 2004.
• Williams A., 2003. The Knight and the Blast Furnace, A History of the Metallurgy of Armour in the Middle Ages and the Early Modern Period. (Leiden, Netherlands; 2003)
16
Possible links between Hungarian and Spanish Beaker Metallurgy
László Reményi1, Anna Endrődi1, Eszter Baradács2, Árpád Z. Kiss2,3, Imre Uzonyi3, Ignacio Montero4,
Salvador Rovira 5
1Budapest History Museum, H-1031 Budapest, Záhony u.4. Hungary 2Department of Environmental Physics, University of Debrecen, POBox 51, H-4001
Debrecen, Hungary 3Institute of Nuclear Research of the Hungarian Academy of Sciences, POB.51, H-4001, Debrecen,
Hungary 4Department of Prehistory, Institute of History (CSIC). Serrano, 13 / 28001-Madrid, Spain
5National Archaeological Museum. Serrano, 13 / 28001-Madrid, Spain (corresponding author: [email protected])
Abstract The Bell Beaker culture started from the Iberian Peninsula spread into Europe and reached its easternmost region, the surroundings of present day Budapest, in the first half of the 3rd millennium BC. In the area around Budapest a large number of settlements belonging to this culture were unearthed during the last decades. A collaboration initiated by the COST Action G8 made it possible to perform archaeometallurgical examinations of some metal objects from the Budapest History Museum. Elemental analysis (by ED-XRF), SEM and optical metallography were performed in order to get an insight into the Beaker metal technology in this area. A comparison has been made between the Beaker metallurgical techniques applied in the Carpathian Basin and on the Iberian Peninsula.
Keywords: Bell Beakers, copper, tin, optical metallography, ED-XRF, SEM.
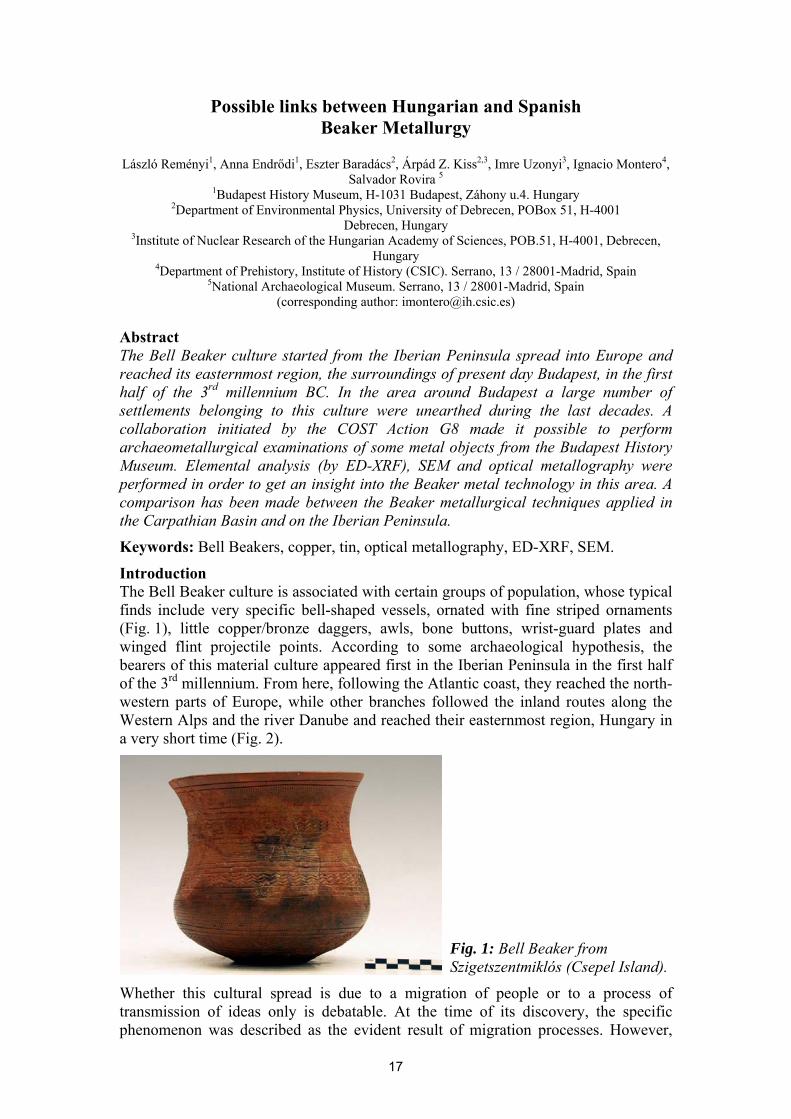
Introduction The Bell Beaker culture is associated with certain groups of population, whose typical finds include very specific bell-shaped vessels, ornated with fine striped ornaments (Fig. 1), little copper/bronze daggers, awls, bone buttons, wrist-guard plates and winged flint projectile points. According to some archaeological hypothesis, the bearers of this material culture appeared first in the Iberian Peninsula in the first half of the 3rd millennium. From here, following the Atlantic coast, they reached the north-western parts of Europe, while other branches followed the inland routes along the Western Alps and the river Danube and reached their easternmost region, Hungary in a very short time (Fig. 2).
Fig. 1: Bell Beaker from Szigetszentmiklós (Csepel Island).
Whether this cultural spread is due to a migration of people or to a process of transmission of ideas only is debatable. At the time of its discovery, the specific phenomenon was described as the evident result of migration processes. However,
17
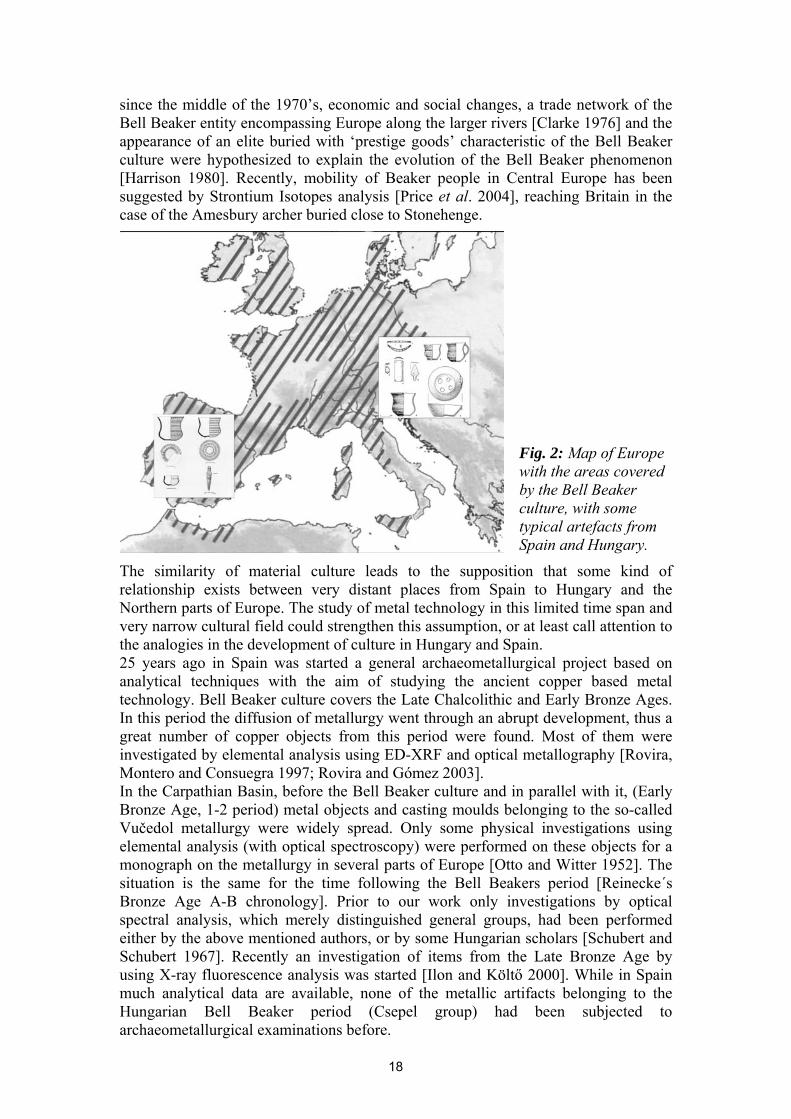
since the middle of the 1970’s, economic and social changes, a trade network of the Bell Beaker entity encompassing Europe along the larger rivers [Clarke 1976] and the appearance of an elite buried with ‘prestige goods’ characteristic of the Bell Beaker culture were hypothesized to explain the evolution of the Bell Beaker phenomenon [Harrison 1980]. Recently, mobility of Beaker people in Central Europe has been suggested by Strontium Isotopes analysis [Price et al. 2004], reaching Britain in the case of the Amesbury archer buried close to Stonehenge.
Fig. 2: Map of Europe with the areas covered by the Bell Beaker culture, with some typical artefacts from Spain and Hungary.
The similarity of material culture leads to the supposition that some kind of relationship exists between very distant places from Spain to Hungary and the Northern parts of Europe. The study of metal technology in this limited time span and very narrow cultural field could strengthen this assumption, or at least call attention to the analogies in the development of culture in Hungary and Spain. 25 years ago in Spain was started a general archaeometallurgical project based on analytical techniques with the aim of studying the ancient copper based metal technology. Bell Beaker culture covers the Late Chalcolithic and Early Bronze Ages. In this period the diffusion of metallurgy went through an abrupt development, thus a great number of copper objects from this period were found. Most of them were investigated by elemental analysis using ED-XRF and optical metallography [Rovira, Montero and Consuegra 1997; Rovira and Gómez 2003]. In the Carpathian Basin, before the Bell Beaker culture and in parallel with it, (Early Bronze Age, 1-2 period) metal objects and casting moulds belonging to the so-called Vučedol metallurgy were widely spread. Only some physical investigations using elemental analysis (with optical spectroscopy) were performed on these objects for a monograph on the metallurgy in several parts of Europe [Otto and Witter 1952]. The situation is the same for the time following the Bell Beakers period [Reinecke´s Bronze Age A-B chronology]. Prior to our work only investigations by optical spectral analysis, which merely distinguished general groups, had been performed either by the above mentioned authors, or by some Hungarian scholars [Schubert and Schubert 1967]. Recently an investigation of items from the Late Bronze Age by using X-ray fluorescence analysis was started [Ilon and Költő 2000]. While in Spain much analytical data are available, none of the metallic artifacts belonging to the Hungarian Bell Beaker period (Csepel group) had been subjected to archaeometallurgical examinations before.
18
The COST Action G8 made it possible for the first time to start a Spanish - Hungarian cooperation with the aim of investigating the metallurgy of Bell Beaker culture.
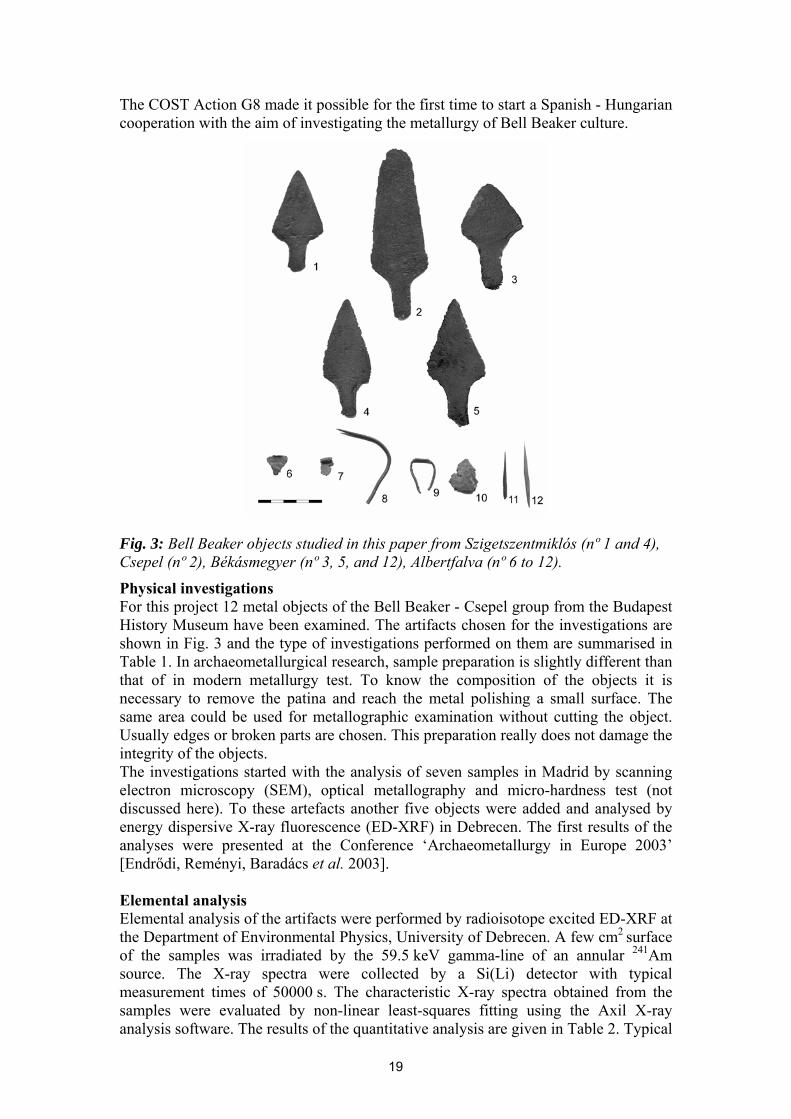
Fig. 3: Bell Beaker objects studied in this paper from Szigetszentmiklós (nº 1 and 4), Csepel (nº 2), Békásmegyer (nº 3, 5, and 12), Albertfalva (nº 6 to 12).
Physical investigations For this project 12 metal objects of the Bell Beaker - Csepel group from the Budapest History Museum have been examined. The artifacts chosen for the investigations are shown in Fig. 3 and the type of investigations performed on them are summarised in Table 1. In archaeometallurgical research, sample preparation is slightly different than that of in modern metallurgy test. To know the composition of the objects it is necessary to remove the patina and reach the metal polishing a small surface. The same area could be used for metallographic examination without cutting the object. Usually edges or broken parts are chosen. This preparation really does not damage the integrity of the objects. The investigations started with the analysis of seven samples in Madrid by scanning electron microscopy (SEM), optical metallography and micro-hardness test (not discussed here). To these artefacts another five objects were added and analysed by energy dispersive X-ray fluorescence (ED-XRF) in Debrecen. The first results of the analyses were presented at the Conference ‘Archaeometallurgy in Europe 2003’ [Endrődi, Reményi, Baradács et al. 2003]. Elemental analysis Elemental analysis of the artifacts were performed by radioisotope excited ED-XRF at the Department of Environmental Physics, University of Debrecen. A few cm2 surface of the samples was irradiated by the 59.5 keV gamma-line of an annular 241Am source. The X-ray spectra were collected by a Si(Li) detector with typical measurement times of 50000 s. The characteristic X-ray spectra obtained from the samples were evaluated by non-linear least-squares fitting using the Axil X-ray analysis software. The results of the quantitative analysis are given in Table 2. Typical
19
errors of the measurements were less than 5 relative percentages for the major and minor constituents and about 10 percentages for the trace elements.
No Object Site Identity SEM ED-XRF
Met.
1 Dagger Szigetsztmiklós Grave 80 SV 80 X 2 Dagger Csepel, Rákóczi str. Grave
1 CR 311 X X X
3 Dagger Békásmegyer Grave 235 BM 68115 X 4 Dagger Szigetszmiklós Grave 7 SV 7 X X X 5 Dagger Békásmegyer Grave
432/A. BM 145 X
6 Pinhead Albertfalva AL 343 X X X 7 Roll-headed pin (head) Albertfalva AL 36 X 8 Pin Albertfalva AL 330 X X X 9 Ring Albertfalva AL 420 X X X 10 Fragment Albertfalva AL 784 X X X 11 Awl Albertfalva AL 68 X X X 12 Awl Békásmegyer Grave 235 BM68113 X
Tab. 1: Summary of the objects investigated and the type of investigations performed.
Nº Identity Object Site Cu Ag Sn Sb Pb As
7 AL36 Roll-headed pin Albertfalva 85.31 1.923 6.783 1.264 0.348 4.37
11 AL68 Awl Albertfalva 95.92 0.192 3.015 0.021 0.544 0.31
6 AL343 Pinhead Albertfalva 99.81 0.050 0.034 0.004 0.107 nd
8 AL330 Pin Albertfalva 99.92 0.005 0.010 0.002 0.062 nd
9 AL420 Ring Albertfalva 99.96 0.004 0.024 nd 0.013 nd
10 AL784 Fragment Albertfalva 99.84 0.003 0.038 0.002 0.118 nd
5 BM145 Dagger Békásmegyer 98.17 0.290 0.837 0.470 0.236 nd
3 BM68115 Dagger Békásmegyer 99.41 0.260 0.032 0.061 0.240 nd
12 BM68113 Awl Békásmegyer 99.38 0.188 0.082 0.021 0.327 nd
2 CR331 Dagger Csepel 97.19 2.260 0.037 0.319 0.192 nd
4 SV7 Dagger Szigetszentmiklós 99.72 0.112 0.043 0.015 0.113 nd
1 SV80 Dagger Szigetszentmiklós 98.58 0.933 0.066 0.178 0.246 nd
Tab. 2: Elemental concentrations given by the ED-XRF analysis (% of weight).
According to our earlier results [Endrődi, Reményi, Baradács et al. 2003] the Csepel group seems to show a relative uniformity in material composition within each site, apart from the bronze exceptions in Albertfalva. It was found that absence of arsenic was a common feature in the copper objects and that some of them have a very high amount of silver, including the bronzes, but not the coppers, from Albertfalva. The difference between the metallurgy of the Bell Beaker period and the subsequent Reinecke’s Bronze Age phase A is excellently illustrated by the high Pb-Ag-Sb-As content of the pin with rolled up head from feature 36 (crouched inhumation burial) of Albertfalva, dated between the end of the Hungarian Early Bronze Age and the beginning of the Middle Bronze Age [Reményi 2004]. It is obvious that the composition of this object is significantly different from that of the other objects. The silver, arsenic and antimony content of the pin with rolled up head evidences a change
20
in the copper ore resources, which in this case are probably to be connected with the ores from the Alpine region, but only by lead isotopes analysis this hypothesis could be confirmed in the future [Höppner et al. 2005]. Scanning electron microscopy and optical metallography Seven samples were prepared for microanalysis on the Philips XL30 scanning electron microscope (SEM) at the University Autónoma of Madrid. All SEM bulk microanalyses have been done by scanning an area at 100x magnification and photographs are in back-scattering mode. Ferric chloride and hydrochloric acid in aqueous solution were used as etching reagent for metallography. By describing the manufacture we use the following symbols: C= casting; CW= cold working; A= annealing.
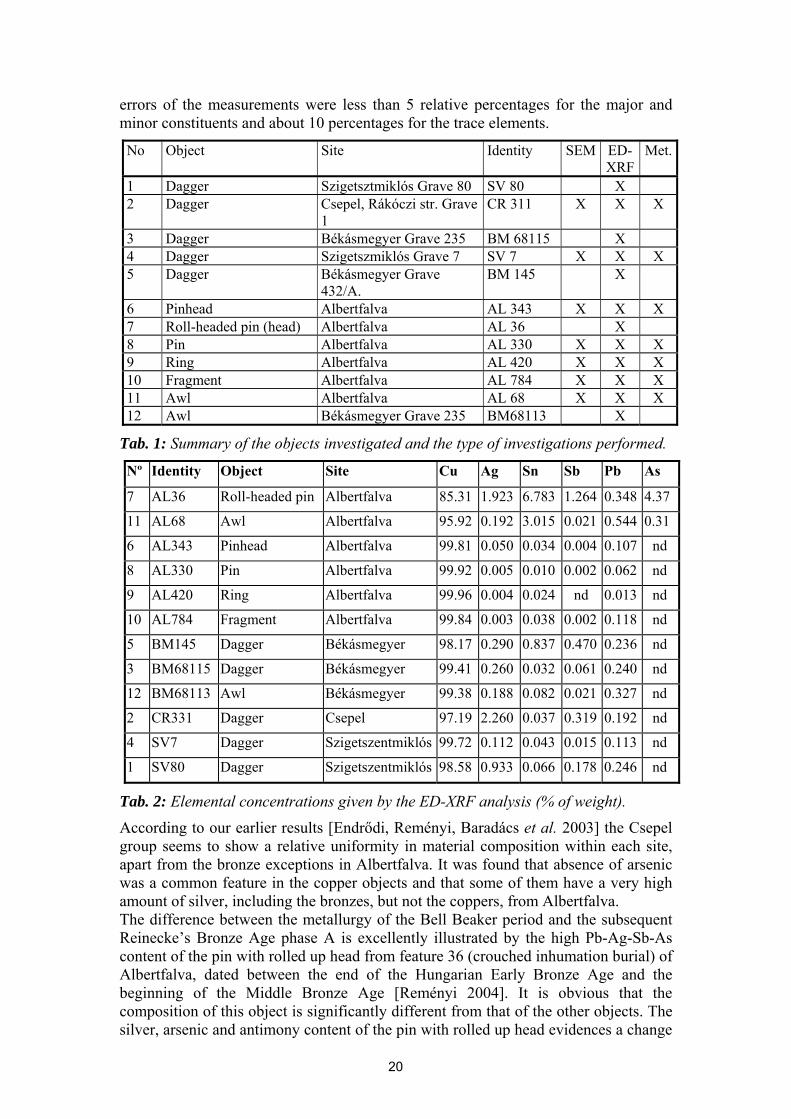
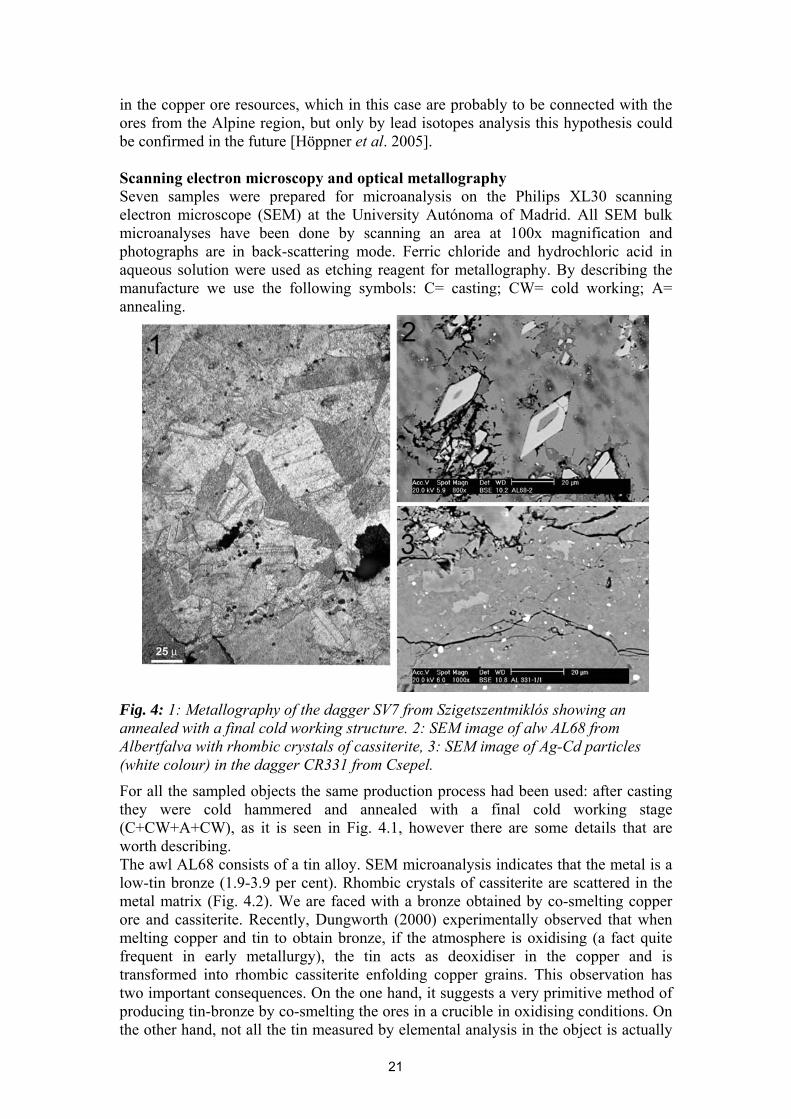
Fig. 4: 1: Metallography of the dagger SV7 from Szigetszentmiklós showing an annealed with a final cold working structure. 2: SEM image of alw AL68 from Albertfalva with rhombic crystals of cassiterite, 3: SEM image of Ag-Cd particles (white colour) in the dagger CR331 from Csepel.
For all the sampled objects the same production process had been used: after casting they were cold hammered and annealed with a final cold working stage (C+CW+A+CW), as it is seen in Fig. 4.1, however there are some details that are worth describing. The awl AL68 consists of a tin alloy. SEM microanalysis indicates that the metal is a low-tin bronze (1.9-3.9 per cent). Rhombic crystals of cassiterite are scattered in the metal matrix (Fig. 4.2). We are faced with a bronze obtained by co-smelting copper ore and cassiterite. Recently, Dungworth (2000) experimentally observed that when melting copper and tin to obtain bronze, if the atmosphere is oxidising (a fact quite frequent in early metallurgy), the tin acts as deoxidiser in the copper and is transformed into rhombic cassiterite enfolding copper grains. This observation has two important consequences. On the one hand, it suggests a very primitive method of producing tin-bronze by co-smelting the ores in a crucible in oxidising conditions. On the other hand, not all the tin measured by elemental analysis in the object is actually
21
alloyed with the copper: a noticeable amount remains segregated as cassiterite crystals. Thus, the real tin content in the alloy of this awl is only 1.9 per cent, measured in the SEM microanalyser by scanning parts of the sample where no cassiterite is seen. A curious alloy of copper containing large amounts of silver and cadmium was used for the tanged dagger CS331-1. Many white particles of insoluble Ag-Cd are scattered in the copper, as shows Figure 4.3. In this case the grain boundaries are mildly deformed by mechanical force. All these objects were produced by using the so called ‘long chaîne opératoire’. The annealing process was usually too short in time or too low in temperature, as the grain size within each sample is heterogeneous and the crystal shapes are irregular. The last cold hammering step tends to be very slight. This is in contrast to what occurred in Spain in the Chalcolithic and Early Bronze Age, where the ‘chaîne opératoire’ consisting of casting followed by cold working (C+CW) seems to be predominant and when annealing was better applied, resulting in more homogeneous microstructures. Discussion of the results In the frame of the project supported by the COST Action G8 metal objects belonging to the most eastern group (Bell Beaker - Csepel Group) of the so called Bell Beaker culture spread out in large areas in Europe during the 3rd millennium BC were investigated by different techniques. The data themselves were long-needed and the results are especially interesting as they illustrate the history of early metallurgy in the Carpathian Basin. In the Carpathian Basin the first copper objects (mostly jewels) appeared sporadically at the end of the Middle Neolithic and the Late Neolithic. These were followed by the metallurgical boom in the Early and Middle Copper Age (4500-3600 BC) [Kalicz 1992], in which period the Carpathian Basin became the production centre of the non-arsenical, so-called heavy copper objects. From the second half of the Middle Copper Age the heavy copper objects disappeared. In their place smaller copper objects of the West-Carpathian metallurgical group appeared sporadically [Patay 1995]. It was not only a change in the frequency of metal objects, but also in technology, with the widely spread use of arsenical copper alloys. In the period of the Copper Age Baden-Culture (3600/3500-2800BC) this technology continues, attached to the Eastern-Alpine metallurgy, which was rising up at that period [Virág 1999]. Similarly, the metallurgy of the Vučedol culture, which appeared at the end of the Late Copper Age, was based on the use of arsenical copper [Durman 1983]. At the beginning of the Early Bronze Age (2800-2000/1900BC), the majority of the cultures developed in the territory of the Carpathian Basin, followed the traditions of the Vučedol metallurgy with the use of arsenical alloys. However, as the result of our elemental analysis proves, metal objects from the Bell Beaker - Csepel group show a different composition: the artefacts (with the exception of the two tin-bronzes) did not contain arsenic above the detection limit. This means that the Bell Beaker - Csepel group had a metallurgical tradition different from that of the neighbouring cultures in the Carpathian Basin, and used different ore resources or had different exchange networks. Finally, contrary to other groups in the Carpathian Basin, it was not influenced by the Vučedol metallurgy. Bell Beaker metal objects in Spain have a non-homogeneous elemental composition. There are differences depending on the region they come from, and most of them contain less than 1 % of arsenic [Rovira, Montero and Consuegra 1997, Rovira and Delibes 2005].
22
In early metallurgy the composition is strongly linked to the characteristics of ore used, so it is difficult to compare analysis data of material from two very distant areas like Spain and Hungary. However information on metallurgical technology provided by metallography can be easily compared. In the analysed metal pieces from Spain the sort ‘chaîne opératoire’ (C + CW) is the most frequent manufacturing technique for all types of objects [Rovira and Delibes 2005]. In the few samples from Hungary studied up to now we find only the long ‘chaîne opératoire’ (C+ CW+A+CW). Although both share a common typology, they show noticeable difference in the technology applied in the production of metal objects. Conclusion A direct connection between the groups of the Bell Beaker culture in Spain and around Budapest can not be proved, because of the difference in the metallurgical techniques applied. However from the typology of metal objects it can be supposed that they have a common root. To understand the diffusion of Bell Beaker traits over a long territory it would be necessary to study materials from intermediate areas and compare the local previous and later technologies. A proper research on transmission of technology, necessarily on much larger groups of observations, might help to find the answer to the question, if the typological similarities are due to movement of people, of ideas, of objects or all of them at the same time, but at different regional scale. This project can be considered as a preliminary test on a small scale of samples and perhaps a starting point for deeper and wider archaeometallurgical investigations in the Carpathian Basin and in other parts of Europe. Optical metallography and micro-hardness tests were never used before in Hungary to study this early stage of metallurgy. The cooperation work which was part of the more general Spanish - Hungarian project ‘Characterisation of Metal finds by Different Non-destructive Analytical Methods’ in the frame of COST Action G8, initiated a close cooperation and interaction between archaeologists and analytical scientists, museums and research institutes/universities between the two countries. Moreover, it has established a mutual acquaintanceship (including the access to up to date techniques) between archaeologists and natural scientists, also within Hungary, which could be the base of further longstanding cooperation. Acknowledgement One of the authors (L.R.) thanks to the COST Action G8 for supporting his short term scientific mission that initiated this co-operation between Hungarian and Spanish researchers. References
• Clarke, D.L. 1976. ’The Beaker Network – social and economic models’. In: Glockenbechersymposion Oberried 1974, Lanting, J.N. and van der Waals, J.D. (Hrsg.) 459-477. Bussum/Haarlem.
• Dungworth, D. 2000. ’Serendipity in the foundry? Tin oxide inclusions in copper and copper alloys as an indicator of production process’. Bulletin of the Metals Museum, 32: 1-5.
• Durman, A. 1983. ’Metallurgy of the Vučedol culture complex’. Opuscula Archaeologica, 8: 1-87.
• Endrõdi, A., Reményi, L., Baradács, E., Uzonyi, I., Kiss, Á. Z., Montero, I., Rovira, S. 2003. ’Technological study of Beaker Metallurgy in Hungary. In:
23
Archaeometallurgy in Europe, proceedings Vol. 2: 29-38. Milan: Associazione Italiana di Metalurgia.
• Harrison, R.J. 1980. The Beaker Folk. Copper Age Archaeology in Western Europe. London: Thames and Hudson.
• Höppner, B., Bartelheim, M., Huijsmans, M., Krauss, R., Martinek, K.-P., Pernicka, E. and Schwab, R. 2005. ‘Prehistoric Copper Production in The Inn Valley (Austria), and the Earliest Copper in Central Europe’. Archaeometry, 47(2): 293-315.
• Ilon, G. and Költő, L. 2000. ‘Középső bronzori emlékek a Velemi Szent Vidről Egy tolnanémedi típusú (VII. Velemi) kincslelet? (Middle Bronze age artifacts from Szent Vid of Velem.)’. Komárom-Esztergom Megyei Múzeumok Közleményei, 7: 69-95.
• Kalicz, R. 1992. ’Legkorábbi fémleletek Délkelet-Európában és a Kárpát-medencében az i.e. 6-5. évezredben. (The oldest metal finds in Southern Europe and the Carpathian Basin in the 6th to 5th millenia BC)’. Archaeológiai Értesítő, 119:3-14.
• Otto, H. and Witter, W. 1952. Handbuch der ältesten vorgeschichtlichen Metallurgie in Mitteleuropa. Leipzig.
• Patay, P. 1995. ‘Die kupferzeitliche Siedlung Tiszalúc-Sarkad und die Hunyadi-halom-Kultur.’ In Neuere Daten zur Siedlungsgeschichte und Chronologie der Kupferzeit des Karpatenbeckens, Kovács, T. (Hrsg.) 107-115. Budapest.
• Price, T.D., Knipper, C., Grupe, G. and Smrcka, V. 2004. ‘Strontium Isotopes and Prehistoric Human Migration: The Bell Beaker Period in Central Europe’. European Journal of Archaeology, 7(1): 9-40.
• Reményi, L. 2004. ’Középső bronzkori temetkezések Budapest térségéből. (Middle Bronze Age burials from Budapest area)’. Mómosz, 3: 323-347.
• Rovira, S., Montero, I. and Consuegra, S. 1997. Las primeras etapas metalúrgicas en la Península Ibérica. I Análisis de Materiales. Madrid: Instituto Ortega y Gassset
• Rovira, S. and Gómez, P. 2003. Las primeras etapas metalúrgicas en la Península Ibérica. III. Estudios Metalograficos. Madrid.
• Rovira, S. and Delibes, G. 2005. ‘Tecnología Metalúrgica Campaniforme en la Península Ibérica: coladas moldeado y tratamientos post-fundición. (Beaker Metallurgical Technology in the Iberian Peninsula: Pouring moulding and post-smelting treatments)’. In El Campaniforme en la Península Ibérica y su contexto Europeo. (Bell Beakers in the Iberian Peninsula and their European context.)’, Rojo-Guerra, M. A., Garrido-Pena, R. and Garcia-Martinez de Lagrán, I. (Coords.) 495-521. Valladolid.
• Schubert, F. and Schubert, E. 1967. ‘Spektralanalytischen Untersuchungen von Hort- und Einzelfunden du Periode B. III. In Mozsolics, A. Bronzefunde des Karpatenbeckens. Depotfundhorizonte von Hajdúsámson und Kosziderpadlás. 185-203. Budapest.
• Virág, ZS. M. 1999. ’A badeni kultúra rézleletei Sármellék-Égenföldről. (Die Kupferfunde der Badener Kultur in Sármellék-Égenföld)’. Zalai Múzeum, 9: 33-54.
24
Synchrotron radiation and neutron study of a 7th-century BC Corinthian-type bronze helmet at The Manchester Museum
E. Pantos 1, W. Kockelmann 2 , L.C. Chapon 2, L. Lutterotti 3, S.L. Bennet 1, M.J. Tobin 1,
J.F.W. Mosselmans 1, T. Pradell 4, N. Salvado 4, S. Butí 5, R.Garner 6, A.J.N.W. Prag 6 1 Daresbury Laboratory, Keckwick Lane, Warrington WA4 4AD, UK
2 Rutherford Appleton Laboratory, ISIS Facility, Chilton OX11 0QX, UK 3 Dipartimento di Ingegneria dei Materiali, Univ. di Trento, 38050 Trento, Italy
4 Dept. de Física i Enginyeria Nuclear, Universitat Politècnica de Catalunya, 08036 Barcelona, Spain 5 Dept. d’Enginyeria Quimica, Univ. Politècnica de Catalunya, 08800 Vilanova i la Geltrú, Spain
6 The Manchester Museum, University of Manchester, Manchester, M13 9PL, UK (corresponding author: [email protected])
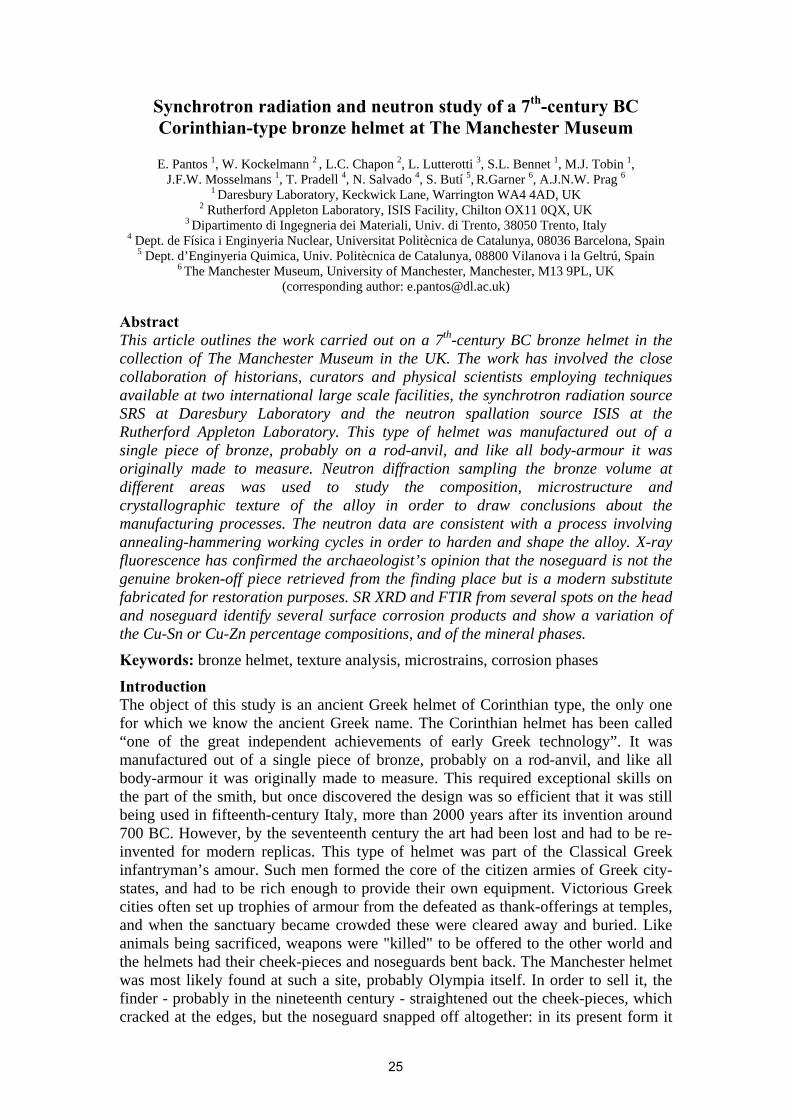
Abstract This article outlines the work carried out on a 7th-century BC bronze helmet in the collection of The Manchester Museum in the UK. The work has involved the close collaboration of historians, curators and physical scientists employing techniques available at two international large scale facilities, the synchrotron radiation source SRS at Daresbury Laboratory and the neutron spallation source ISIS at the Rutherford Appleton Laboratory. This type of helmet was manufactured out of a single piece of bronze, probably on a rod-anvil, and like all body-armour it was originally made to measure. Neutron diffraction sampling the bronze volume at different areas was used to study the composition, microstructure and crystallographic texture of the alloy in order to draw conclusions about the manufacturing processes. The neutron data are consistent with a process involving annealing-hammering working cycles in order to harden and shape the alloy. X-ray fluorescence has confirmed the archaeologist’s opinion that the noseguard is not the genuine broken-off piece retrieved from the finding place but is a modern substitute fabricated for restoration purposes. SR XRD and FTIR from several spots on the head and noseguard identify several surface corrosion products and show a variation of the Cu-Sn or Cu-Zn percentage compositions, and of the mineral phases.
Keywords: bronze helmet, texture analysis, microstrains, corrosion phases
Introduction The object of this study is an ancient Greek helmet of Corinthian type, the only one for which we know the ancient Greek name. The Corinthian helmet has been called “one of the great independent achievements of early Greek technology”. It was manufactured out of a single piece of bronze, probably on a rod-anvil, and like all body-armour it was originally made to measure. This required exceptional skills on the part of the smith, but once discovered the design was so efficient that it was still being used in fifteenth-century Italy, more than 2000 years after its invention around 700 BC. However, by the seventeenth century the art had been lost and had to be re-invented for modern replicas. This type of helmet was part of the Classical Greek infantryman’s amour. Such men formed the core of the citizen armies of Greek city-states, and had to be rich enough to provide their own equipment. Victorious Greek cities often set up trophies of armour from the defeated as thank-offerings at temples, and when the sanctuary became crowded these were cleared away and buried. Like animals being sacrificed, weapons were "killed" to be offered to the other world and the helmets had their cheek-pieces and noseguards bent back. The Manchester helmet was most likely found at such a site, probably Olympia itself. In order to sell it, the finder - probably in the nineteenth century - straightened out the cheek-pieces, which cracked at the edges, but the noseguard snapped off altogether: in its present form it
25
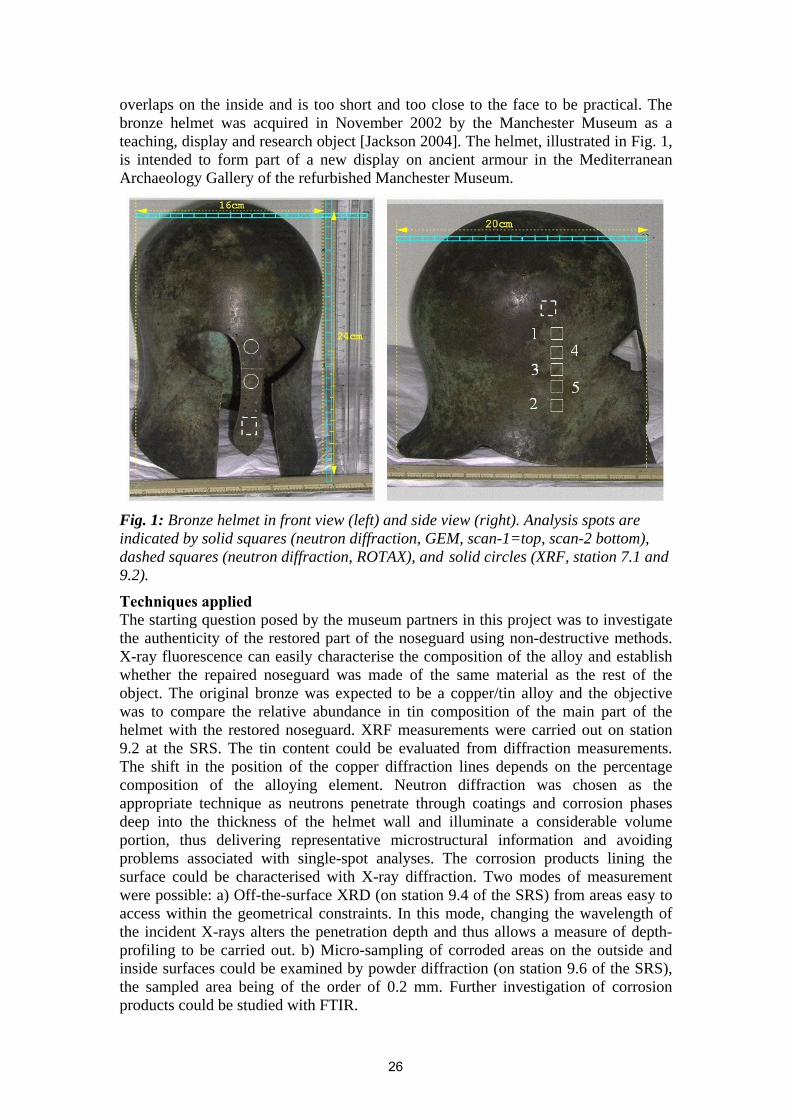
overlaps on the inside and is too short and too close to the face to be practical. The bronze helmet was acquired in November 2002 by the Manchester Museum as a teaching, display and research object [Jackson 2004]. The helmet, illustrated in Fig. 1, is intended to form part of a new display on ancient armour in the Mediterranean Archaeology Gallery of the refurbished Manchester Museum.
Fig. 1: Bronze helmet in front view (left) and side view (right). Analysis spots are indicated by solid squares (neutron diffraction, GEM, scan-1=top, scan-2 bottom), dashed squares (neutron diffraction, ROTAX), and solid circles (XRF, station 7.1 and 9.2).
Techniques applied The starting question posed by the museum partners in this project was to investigate the authenticity of the restored part of the noseguard using non-destructive methods. X-ray fluorescence can easily characterise the composition of the alloy and establish whether the repaired noseguard was made of the same material as the rest of the object. The original bronze was expected to be a copper/tin alloy and the objective was to compare the relative abundance in tin composition of the main part of the helmet with the restored noseguard. XRF measurements were carried out on station 9.2 at the SRS. The tin content could be evaluated from diffraction measurements. The shift in the position of the copper diffraction lines depends on the percentage composition of the alloying element. Neutron diffraction was chosen as the appropriate technique as neutrons penetrate through coatings and corrosion phases deep into the thickness of the helmet wall and illuminate a considerable volume portion, thus delivering representative microstructural information and avoiding problems associated with single-spot analyses. The corrosion products lining the surface could be characterised with X-ray diffraction. Two modes of measurement were possible: a) Off-the-surface XRD (on station 9.4 of the SRS) from areas easy to access within the geometrical constraints. In this mode, changing the wavelength of the incident X-rays alters the penetration depth and thus allows a measure of depth-profiling to be carried out. b) Micro-sampling of corroded areas on the outside and inside surfaces could be examined by powder diffraction (on station 9.6 of the SRS), the sampled area being of the order of 0.2 mm. Further investigation of corrosion products could be studied with FTIR.
26
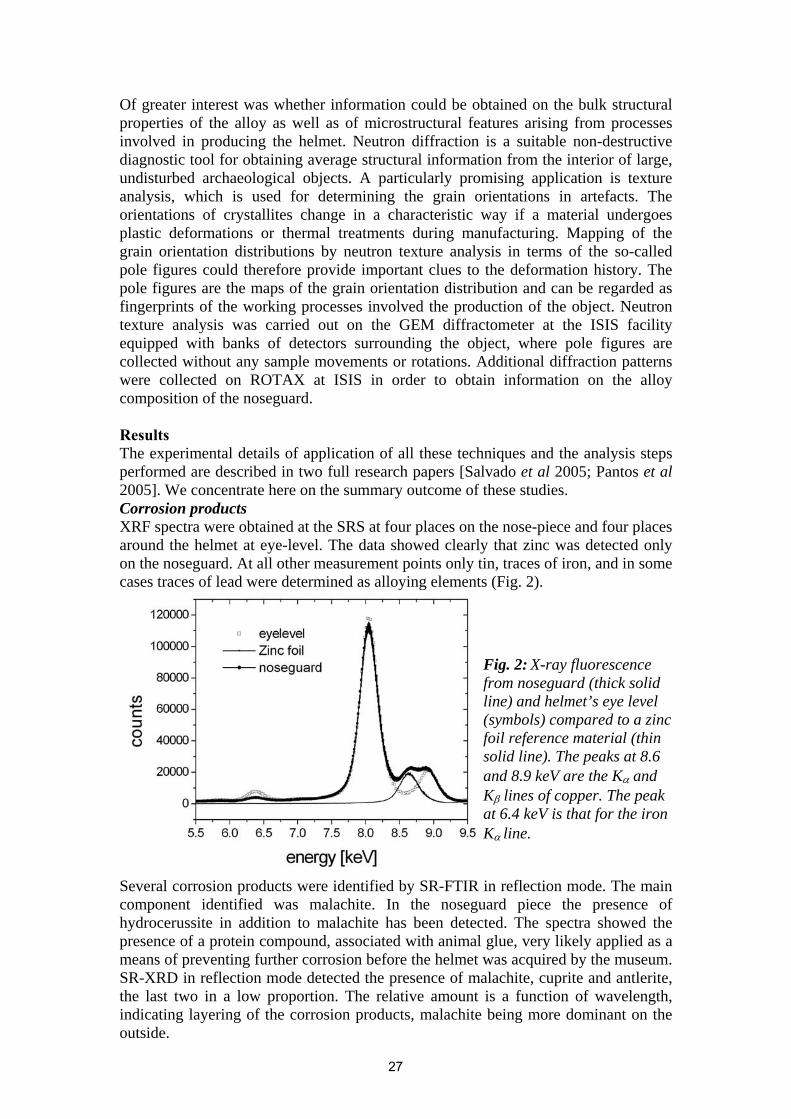
Of greater interest was whether information could be obtained on the bulk structural properties of the alloy as well as of microstructural features arising from processes involved in producing the helmet. Neutron diffraction is a suitable non-destructive diagnostic tool for obtaining average structural information from the interior of large, undisturbed archaeological objects. A particularly promising application is texture analysis, which is used for determining the grain orientations in artefacts. The orientations of crystallites change in a characteristic way if a material undergoes plastic deformations or thermal treatments during manufacturing. Mapping of the grain orientation distributions by neutron texture analysis in terms of the so-called pole figures could therefore provide important clues to the deformation history. The pole figures are the maps of the grain orientation distribution and can be regarded as fingerprints of the working processes involved the production of the object. Neutron texture analysis was carried out on the GEM diffractometer at the ISIS facility equipped with banks of detectors surrounding the object, where pole figures are collected without any sample movements or rotations. Additional diffraction patterns were collected on ROTAX at ISIS in order to obtain information on the alloy composition of the noseguard. Results The experimental details of application of all these techniques and the analysis steps performed are described in two full research papers [Salvado et al 2005; Pantos et al 2005]. We concentrate here on the summary outcome of these studies. Corrosion products XRF spectra were obtained at the SRS at four places on the nose-piece and four places around the helmet at eye-level. The data showed clearly that zinc was detected only on the noseguard. At all other measurement points only tin, traces of iron, and in some cases traces of lead were determined as alloying elements (Fig. 2).
Fig. 2: X-ray fluorescence from noseguard (thick solid line) and helmet’s eye level (symbols) compared to a zinc foil reference material (thin solid line). The peaks at 8.6 and 8.9 keV are the Kα and Kβ lines of copper. The peak at 6.4 keV is that for the iron Kα line.
Several corrosion products were identified by SR-FTIR in reflection mode. The main component identified was malachite. In the noseguard piece the presence of hydrocerussite in addition to malachite has been detected. The spectra showed the presence of a protein compound, associated with animal glue, very likely applied as a means of preventing further corrosion before the helmet was acquired by the museum. SR-XRD in reflection mode detected the presence of malachite, cuprite and antlerite, the last two in a low proportion. The relative amount is a function of wavelength, indicating layering of the corrosion products, malachite being more dominant on the outside.
27
The powder X-ray patterns from the surface samples extracted from the helmet yielded a richer mixture of corrosion phases. The corrosion products are malachite, brochantite, antlerite, romarchite, chalcocite and digenite. On the noseguard, we determined malachite, anglesite and cuprite as well as hydroxided nitrate of copper, zinc Zn3(OH)4(NO3)2 and gerhardite. In addition secondary minerals such as quartz, calcite, hematite, clay minerals and feldspars deposited from the soil during burial were identified. It is important to emphasise the presence of nitrates which are not products to be expected amongst those created by natural corrosion phenomena. The presence of these nitrates can be related to the use of materials employed for artificial ageing of the piece. The neutron diffraction patterns are dominated by the bronze peaks belonging to a copper-type face-centred cubic structure. The peak positions, hence the lattice parameter, of the bronze are increased compared to pure copper because of the replacement of copper by bigger atoms. The measurements of the lattice parameter shift allows one to estimate the amount of the alloying element, e.g. tin, in the bronze. The refined lattice parameters are translated into copper and tin fractions using a Vegard-type calibration curve. It should be emphasised that whilst diffraction methods are good at determining changes of lattice spacings, the ‘chemical analysis’ through Vegard’s law is based on an assumption about which alloying elements are present. Bragg reflections of much smaller intensities can be attributed to the surface minerals malachite, copper oxide, quartz and calcite (the last two presumably from burial soil trapped under the varnish layer), which were included in the refinement procedure. The tin contents of the bronze vary slightly between 11-12 wt% for the analysis spots. The average lattice parameters of the alloy of 3.6822 Å corresponds to a tin content of 11.7 wt% on the side of the helmet. The noseguard, however, exhibits a distinctly different lattice parameter of 3.6378(2) Å indicating that it is made of a different type of alloy. The expansion of the copper lattice for the noseguard can be interpreted in terms of different alloying elements. Assuming a binary copper/tin alloy, we obtain a tin content of 4.2 wt%. Using a Vegard-type relation for a copper/zinc alloy, the neutron patterns yield a zinc content of about 11 wt%. Considering that the XRF data clearly show a large presence of zinc and negligible amount of tin on the noseguard, we conclude that the noseguard was made of a copper/zinc bronze with 11 wt% zinc. This implies that the noseguard is not part of the original helmet but rather is a later replacement. Microstrain broadening Peak broadening is observed for all bronze peaks of all 5 neutron measurements taken on GEM on the side of the helmet. Generally, the peak broadening may have different causes such as (i) very small particle/grain sizes, (ii) microstrain broadening due to cold-working or thermal treatment, or (iii) distributions of lattice parameters of the alloy due to a strong variation of the Sn content. Microstrains may be induced by working processes such as cold-working, or thermal treatments such as quenching, introducing lattice defects and distributions of lattice plane distances around an average value, thus becoming visible as broadening of Bragg peaks. The analysis detailed in [Salvado et al 2005] clearly concluded that the diffraction peak broadening indicates the presence of residual microstrains. It is to be noted that the alloy peaks display smooth distributions of lattice planes, i.e. smooth Bragg profiles in contrast to typical structured Bragg peak shapes of as-cast materials. It is therefore reasonable to assume that the helmet alloy was subjected to both annealing and working processes such as hammering for hardening. Hammering may have been used to shape the helmet and to harden the alloy. Since thorough annealing would wipe out microstrains the helmet was probably produced by repetitive annealing-
28
hammering cycles. The presence and the magnitude of the microstrains indicate that the final working step involved hammering of the alloy.
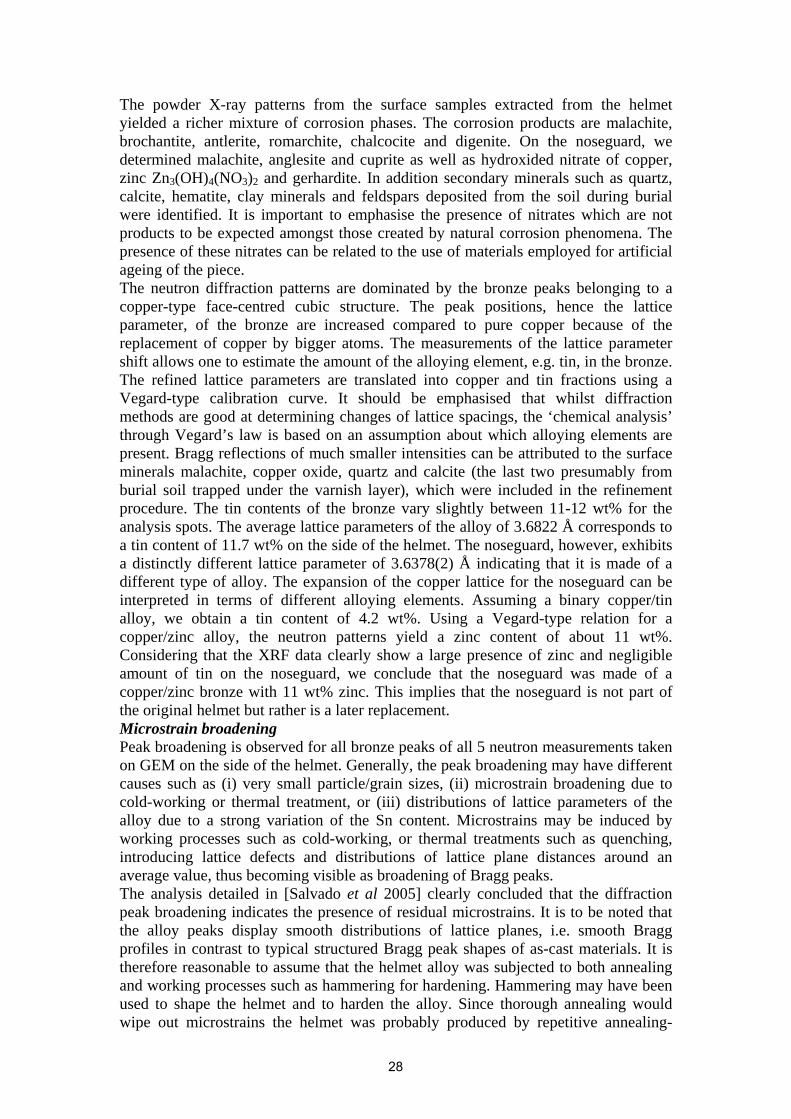
Fig. 3: (111), (200), and (220) pole figures from neutron diffraction of scan 1 (top) and scan 2 (bottom). The pole figures indicate a non-statistical distribution of copper/tin grains due to plastic deformation of the alloy with characteristic pole density maxima in the centre of (220). mrd stands for ‘multiples of a random distribution’. mrd=1 marks the average pole density for a random distribution of grains.
Texture analysis The neutron diffraction data contain information on the volume texture of the alloy, i.e. the orientations of grains. Well-defined textures are produced by specific conditions during primary crystallisation from a melt, and by thermal and mechanical treatments of the cast such as annealing, drawing, rolling or hammering. Any preferred orientation manifests itself in Bragg intensity changes when the sample is rotated, or equivalently, when the scattered neutrons are collected at different detector angles. In terms of the GEM multi-detector arrangement this means that intensity ratios do not vary from bank to bank for a texture-free sample. The texture evaluation of GEM data from 160 detector groups, representing 160 different sample orientations, was performed on 5 analysis spots. The texture is displayed in terms of pole figures of representative lattice planes (111), (200), and (220). Fig. 3 shows the pole figures reconstructed for the highest (scan 1) and the lowest (scan 2) analysis points on the helmet. Maximum pole densities are between 1.6 and 1.8, indicating a rather weak texture for the bronze. There is no systematic variation of the texture strengths detectable on the 5 spots. The (220) pole figures are characterised by elevated pole density in the centres, demonstrating preferential alignment of (220) lattice planes parallel to the wall of the helmet. Asymmetries of pole densities along the vertical for some of the analysis spots may indicate a working direction from top to bottom of the helmet, or vice versa. The texture is likely to be the result of the hardening processes which, through plastic deformation, preferentially aligned the copper/tin (220) planes perpendicular to the working direction. This finding is in agreement with the detection of microstrains discussed in the previous paragraph.
29
Conclusions Neutron and synchrotron X-ray analytical techniques were used to characterise a Corinthian-type bronze helmet in the Manchester Museum. The alloy of the helmet consists predominantly of copper with a varying tin content between 11 and 12 wt%. The neutron data contain clear indications of the working processes involved in the production of the helmet. The observed degree of microstrain broadening hints to repetitive annealing-hammering working cycles in order to harden the alloy. The last step was most likely a hardening step. The preferred orientation of grains, as displayed in the texture maps, agrees with hammering in one direction. The object was more than likely cast as a ‘skull-cap’, then beaten and heated in an interactive cycle and dressed down to its final thickness and shape to fit the customer’s head. Considerable effort was undertaken by the makers of the helmet to harden the alloy. Hence, the object was surely produced for battle rather than just cast for ceremonial purposes. The noseguard of the helmet is made of a different alloy, namely copper/zinc. One can assume that the noseguard, being made of a different material, is most likely not part of the original helmet but is a later replacement, maybe by the 19th-century finder of the object. This confirms earlier suggestions [Jackson 2004] that the shape of the noseguard is unusual and that the present angle at which it is set is not functional and therefore not authentic, and that the edges of the noseguard itself and of the holes for fixing the lining are much sharper than on the rest of the helmet. Our results are in agreement with the existing knowledge in the field of ancient bronze working. With the exception of the XRF data that could, in principle, have been obtained with conventional equipment, we have determined material properties of the alloy that cannot be simply obtained by other methods or with a portable system. This is certainly the case for the crystallographic texture of the alloy and for the microstrain broadening. Quantitative information on material properties such as the texture type, the texture strength and the degree of microstrain broadening is important, even more so if results on other helmets and objects become available in the near future. Quite apart from the scientific objectives achieved by this study, in the context of the objectives of COST-G8 highlighted in this volume it is worth commenting perhaps on the interest this project attracted. Two research proposals submitted to CCLRC, one for the synchrotron work and the other for neutrons, were received very positively by the review committees, which we interpret as a highly optimistic sign for the acceptance of cultural heritage projects in the portfolio of large scale facilities. National newspapers (The Guardian, Die Welt and three Greek newspapers) reported on the findings and the story was the centrepiece of the SR department’s annual report. The public visiting the labs were much attracted by the highlights of the work presented to them, a tangible example of the impact cultural heritage studies can have on public appreciation of science. References
• Jackson, A. H., An early Corinthian helmet. Annual of the British School at Athens, 99 (2004) 273-282.
• Salvadó, N., Butí, S., Tobin, M. J., Pantos, E., Prag, J. N. W., Pradell, A. and T., Advantages of the use of SR-FTIR microspectroscopy: applications to Cultural Heritage. Anal. Chem., 2005; 77(11) pp 3444 - 3451.
• Pantos, E., et al. 2005. Neutron and X-ray characterisation of the metallurgical properties of a 7th-century BC Corinthian-type bronze helmet, Nuclear Instruments and Methods B 239 (2005) 16-26.
30
Observing corrosion, passivation and cleaning as they happen – in-situ spectroelectrochemistry for the conservation of metals
A. Adriaens1 and M. G. Dowsett2
1 Department of Analytical Chemistry, Ghent University, Belgium 2 Department of Physics, Warwick University, UK
(corresponding author: [email protected]) Abstract In this article we describe new methods and instrumentation for observing corrosion and its reversal, cleaning, and passivation of cultural heritage metals in real time. The instrumentation is based on a novel electrochemical cell designed so that both electrochemical data and the structural chemistry from the surface of a realistic metal simulant can be measured in parallel by using an appropriate combination of electrochemical process and spectroscopic technique. By way of example, we describe the use of synchrotron X-ray techniques in the study and control of the corrosion of copper artefacts as aggressive chloride corrosion is reduced to passive cuprite in sodium sesquicarbonate. In the first part of the article, the overall philosophy of the approach is introduced, and a basic but detailed description of the X-ray methods is given. The second half describes experiments designed to show whether corrosion potential can reliably be used as the basis of a simple sensor for passivation during the storage of artefacts recovered from a marine environment.
Keywords: Spectroelectrochemistry, instrumental development, time resolved data, corrosion, copper, conservation
Introduction Electrochemistry provides powerful methods for the conservation of metals. It can be used to stabilise corroded metal structures from jewellery to sunken wreaks [MacLeod et al 2004], to clean delicate artefacts such as silver-wrapped silken threads in a garment [Stemann-Petersen and Taarnskov 2001], and it provides a vehicle for the basic study of corrosion processes. One of its most attractive features in a cultural heritage context is that all of the potential applications can be thoroughly studied and evaluated before use. In this article, we describe new equipment which enables electrochemical reactions occurring in the near surface of a metal (or any conducting material) to be studied in-situ and in real time using powerful and (in this context) non-destructive X-ray methods including X-ray diffraction (XRD) [Heiney], X-ray absorption spectroscopies (XAS) [Arcon], and X-ray fluorescence (XRF) [Amptek]. (Other light-based techniques such as Raman spectroscopy may also be used.) Once the electrochemical process has been perfected for a particular combination of, for example, a simulant metal and its corrosion layer(s), it can be tested or deployed on real objects. A typical electrochemical process used in conservation involves immersing the artefact in an electrolyte which is a fluid containing ions in solution (a simple example of an electrolyte is NaCl (common salt) dissolved in water). In the case of a sunken wreak, the electrolyte is already present since the wreak is under the sea. The chemical reactions which take place are due to the transport of ions in solution to and from the surface. We will describe the control and measurement of the reactions in more detail later on. Electrochemical techniques may be used to change the chemical nature of a corrosion product on the surface or in the bulk in order to stabilise it or convert it to a protective layer, to deposit new protective layers, to convert a corroded surface back to metal
31
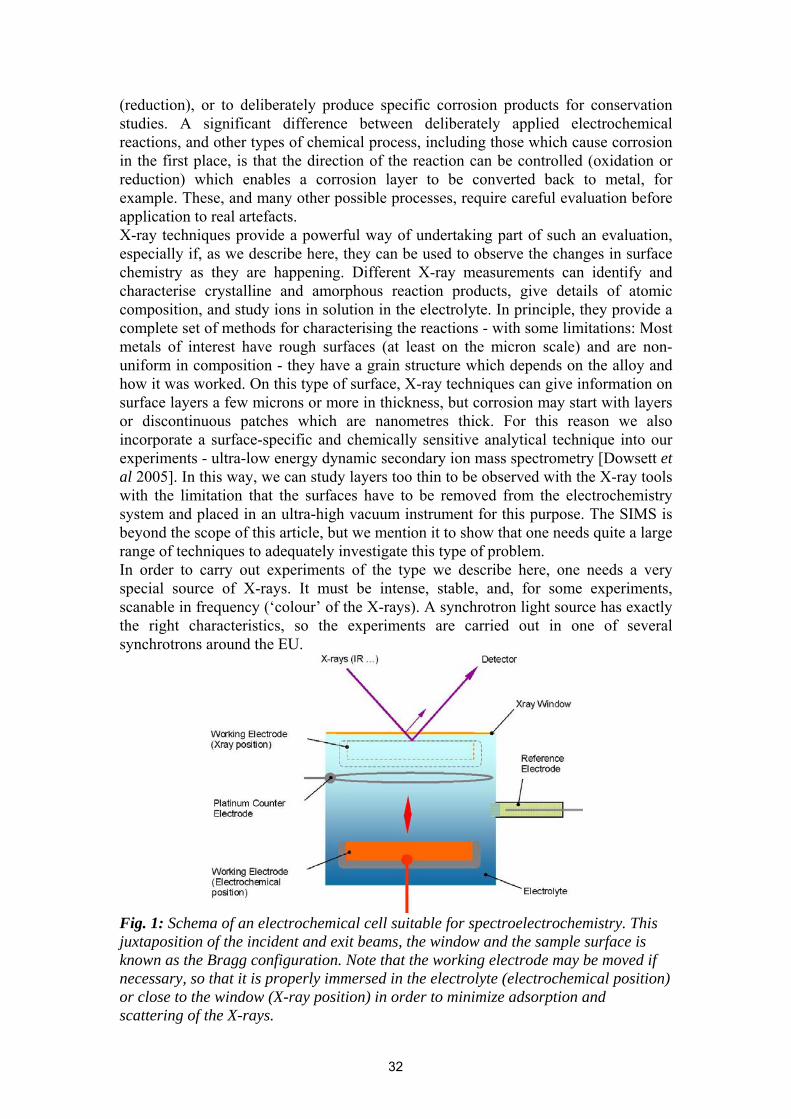
(reduction), or to deliberately produce specific corrosion products for conservation studies. A significant difference between deliberately applied electrochemical reactions, and other types of chemical process, including those which cause corrosion in the first place, is that the direction of the reaction can be controlled (oxidation or reduction) which enables a corrosion layer to be converted back to metal, for example. These, and many other possible processes, require careful evaluation before application to real artefacts. X-ray techniques provide a powerful way of undertaking part of such an evaluation, especially if, as we describe here, they can be used to observe the changes in surface chemistry as they are happening. Different X-ray measurements can identify and characterise crystalline and amorphous reaction products, give details of atomic composition, and study ions in solution in the electrolyte. In principle, they provide a complete set of methods for characterising the reactions - with some limitations: Most metals of interest have rough surfaces (at least on the micron scale) and are non-uniform in composition - they have a grain structure which depends on the alloy and how it was worked. On this type of surface, X-ray techniques can give information on surface layers a few microns or more in thickness, but corrosion may start with layers or discontinuous patches which are nanometres thick. For this reason we also incorporate a surface-specific and chemically sensitive analytical technique into our experiments - ultra-low energy dynamic secondary ion mass spectrometry [Dowsett et al 2005]. In this way, we can study layers too thin to be observed with the X-ray tools with the limitation that the surfaces have to be removed from the electrochemistry system and placed in an ultra-high vacuum instrument for this purpose. The SIMS is beyond the scope of this article, but we mention it to show that one needs quite a large range of techniques to adequately investigate this type of problem. In order to carry out experiments of the type we describe here, one needs a very special source of X-rays. It must be intense, stable, and, for some experiments, scanable in frequency (‘colour’ of the X-rays). A synchrotron light source has exactly the right characteristics, so the experiments are carried out in one of several synchrotrons around the EU.
Fig. 1: Schema of an electrochemical cell suitable for spectroelectrochemistry. This juxtaposition of the incident and exit beams, the window and the sample surface is known as the Bragg configuration. Note that the working electrode may be moved if necessary, so that it is properly immersed in the electrolyte (electrochemical position) or close to the window (X-ray position) in order to minimize adsorption and scattering of the X-rays.
32
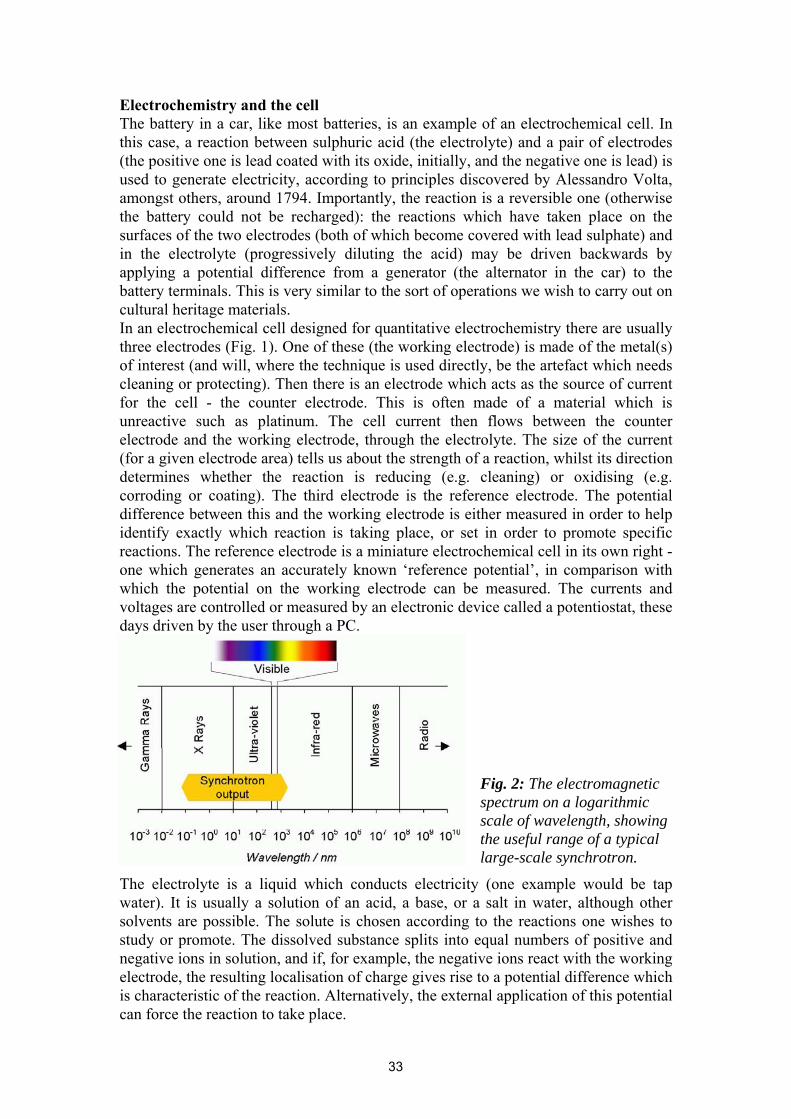
Electrochemistry and the cell The battery in a car, like most batteries, is an example of an electrochemical cell. In this case, a reaction between sulphuric acid (the electrolyte) and a pair of electrodes (the positive one is lead coated with its oxide, initially, and the negative one is lead) is used to generate electricity, according to principles discovered by Alessandro Volta, amongst others, around 1794. Importantly, the reaction is a reversible one (otherwise the battery could not be recharged): the reactions which have taken place on the surfaces of the two electrodes (both of which become covered with lead sulphate) and in the electrolyte (progressively diluting the acid) may be driven backwards by applying a potential difference from a generator (the alternator in the car) to the battery terminals. This is very similar to the sort of operations we wish to carry out on cultural heritage materials. In an electrochemical cell designed for quantitative electrochemistry there are usually three electrodes (Fig. 1). One of these (the working electrode) is made of the metal(s) of interest (and will, where the technique is used directly, be the artefact which needs cleaning or protecting). Then there is an electrode which acts as the source of current for the cell - the counter electrode. This is often made of a material which is unreactive such as platinum. The cell current then flows between the counter electrode and the working electrode, through the electrolyte. The size of the current (for a given electrode area) tells us about the strength of a reaction, whilst its direction determines whether the reaction is reducing (e.g. cleaning) or oxidising (e.g. corroding or coating). The third electrode is the reference electrode. The potential difference between this and the working electrode is either measured in order to help identify exactly which reaction is taking place, or set in order to promote specific reactions. The reference electrode is a miniature electrochemical cell in its own right - one which generates an accurately known ‘reference potential’, in comparison with which the potential on the working electrode can be measured. The currents and voltages are controlled or measured by an electronic device called a potentiostat, these days driven by the user through a PC.
Fig. 2: The electromagnetic spectrum on a logarithmic scale of wavelength, showing the useful range of a typical large-scale synchrotron.
The electrolyte is a liquid which conducts electricity (one example would be tap water). It is usually a solution of an acid, a base, or a salt in water, although other solvents are possible. The solute is chosen according to the reactions one wishes to study or promote. The dissolved substance splits into equal numbers of positive and negative ions in solution, and if, for example, the negative ions react with the working electrode, the resulting localisation of charge gives rise to a potential difference which is characteristic of the reaction. Alternatively, the external application of this potential can force the reaction to take place.
33
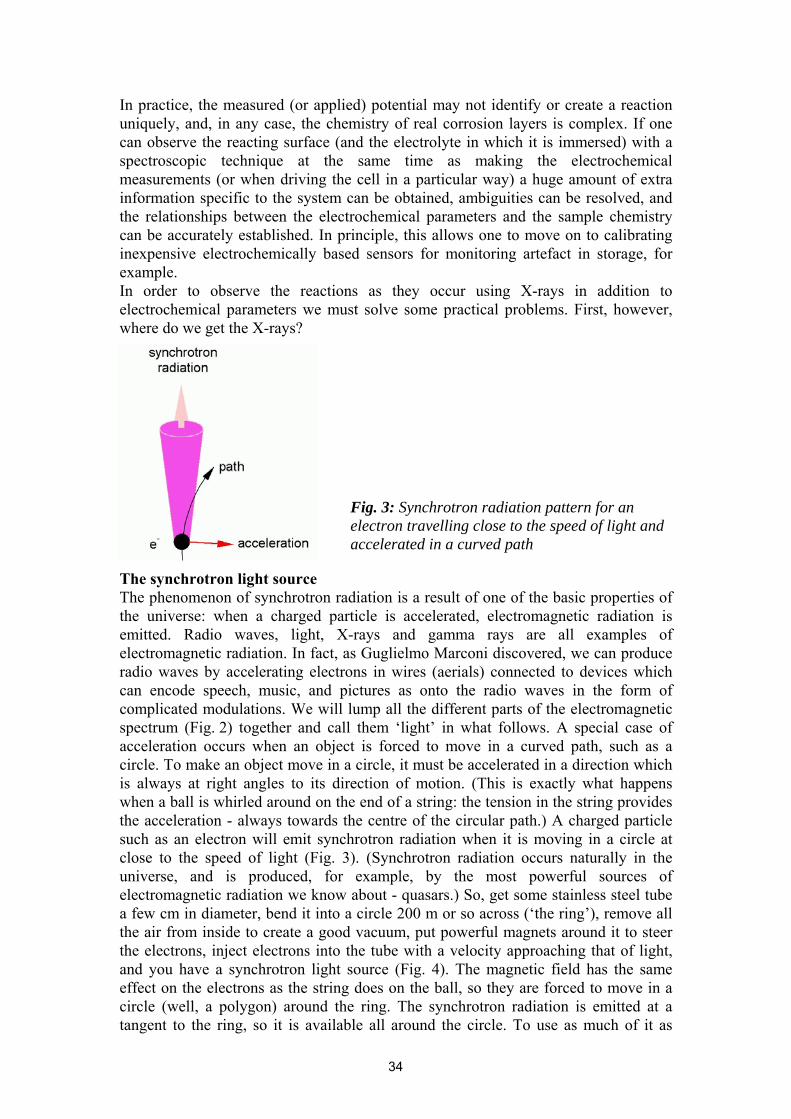
In practice, the measured (or applied) potential may not identify or create a reaction uniquely, and, in any case, the chemistry of real corrosion layers is complex. If one can observe the reacting surface (and the electrolyte in which it is immersed) with a spectroscopic technique at the same time as making the electrochemical measurements (or when driving the cell in a particular way) a huge amount of extra information specific to the system can be obtained, ambiguities can be resolved, and the relationships between the electrochemical parameters and the sample chemistry can be accurately established. In principle, this allows one to move on to calibrating inexpensive electrochemically based sensors for monitoring artefact in storage, for example. In order to observe the reactions as they occur using X-rays in addition to electrochemical parameters we must solve some practical problems. First, however, where do we get the X-rays?
Fig. 3: Synchrotron radiation pattern for an electron travelling close to the speed of light and accelerated in a curved path
The synchrotron light source The phenomenon of synchrotron radiation is a result of one of the basic properties of the universe: when a charged particle is accelerated, electromagnetic radiation is emitted. Radio waves, light, X-rays and gamma rays are all examples of electromagnetic radiation. In fact, as Guglielmo Marconi discovered, we can produce radio waves by accelerating electrons in wires (aerials) connected to devices which can encode speech, music, and pictures as onto the radio waves in the form of complicated modulations. We will lump all the different parts of the electromagnetic spectrum (Fig. 2) together and call them ‘light’ in what follows. A special case of acceleration occurs when an object is forced to move in a curved path, such as a circle. To make an object move in a circle, it must be accelerated in a direction which is always at right angles to its direction of motion. (This is exactly what happens when a ball is whirled around on the end of a string: the tension in the string provides the acceleration - always towards the centre of the circular path.) A charged particle such as an electron will emit synchrotron radiation when it is moving in a circle at close to the speed of light (Fig. 3). (Synchrotron radiation occurs naturally in the universe, and is produced, for example, by the most powerful sources of electromagnetic radiation we know about - quasars.) So, get some stainless steel tube a few cm in diameter, bend it into a circle 200 m or so across (‘the ring’), remove all the air from inside to create a good vacuum, put powerful magnets around it to steer the electrons, inject electrons into the tube with a velocity approaching that of light, and you have a synchrotron light source (Fig. 4). The magnetic field has the same effect on the electrons as the string does on the ball, so they are forced to move in a circle (well, a polygon) around the ring. The synchrotron radiation is emitted at a tangent to the ring, so it is available all around the circle. To use as much of it as
34
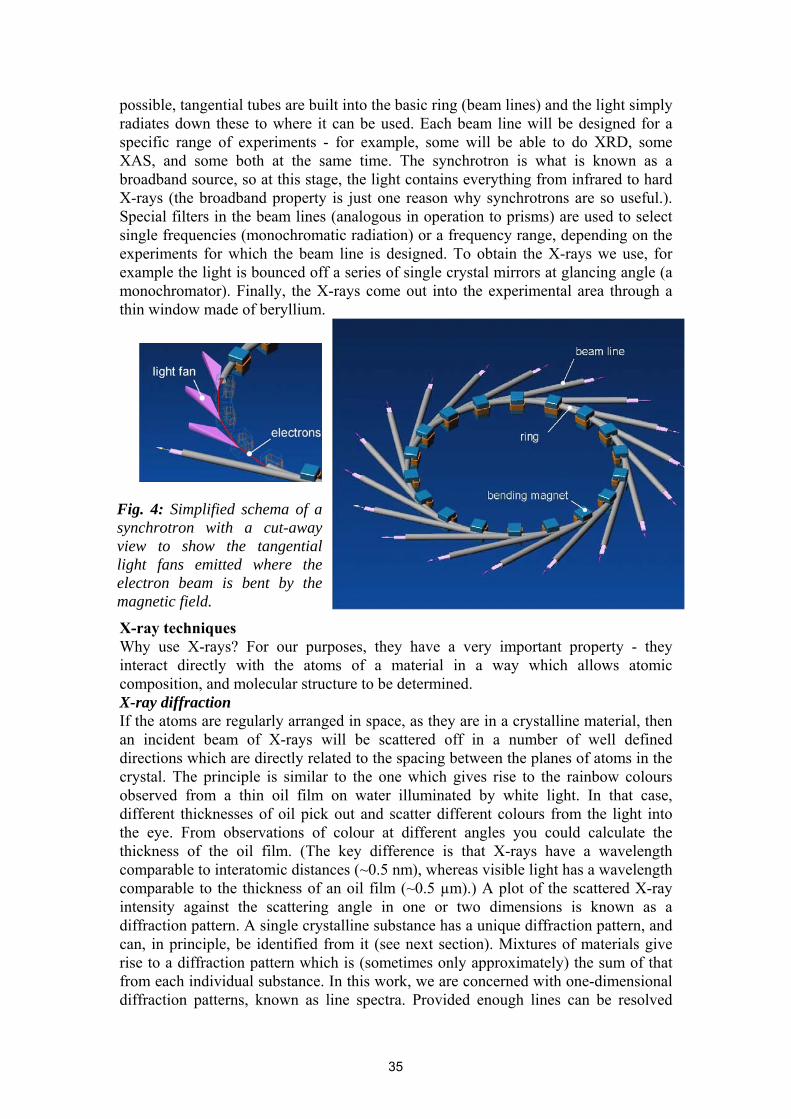
possible, tangential tubes are built into the basic ring (beam lines) and the light simply radiates down these to where it can be used. Each beam line will be designed for a specific range of experiments - for example, some will be able to do XRD, some XAS, and some both at the same time. The synchrotron is what is known as a broadband source, so at this stage, the light contains everything from infrared to hard X-rays (the broadband property is just one reason why synchrotrons are so useful.). Special filters in the beam lines (analogous in operation to prisms) are used to select single frequencies (monochromatic radiation) or a frequency range, depending on the experiments for which the beam line is designed. To obtain the X-rays we use, for example the light is bounced off a series of single crystal mirrors at glancing angle (a monochromator). Finally, the X-rays come out into the experimental area through a thin window made of beryllium.
Fig. 4: Simplified schema of a synchrotron with a cut-away view to show the tangential light fans emitted where the electron beam is bent by the magnetic field.
X-ray techniques Why use X-rays? For our purposes, they have a very important property - they interact directly with the atoms of a material in a way which allows atomic composition, and molecular structure to be determined. X-ray diffraction If the atoms are regularly arranged in space, as they are in a crystalline material, then an incident beam of X-rays will be scattered off in a number of well defined directions which are directly related to the spacing between the planes of atoms in the crystal. The principle is similar to the one which gives rise to the rainbow colours observed from a thin oil film on water illuminated by white light. In that case, different thicknesses of oil pick out and scatter different colours from the light into the eye. From observations of colour at different angles you could calculate the thickness of the oil film. (The key difference is that X-rays have a wavelength comparable to interatomic distances (~0.5 nm), whereas visible light has a wavelength comparable to the thickness of an oil film (~0.5 µm).) A plot of the scattered X-ray intensity against the scattering angle in one or two dimensions is known as a diffraction pattern. A single crystalline substance has a unique diffraction pattern, and can, in principle, be identified from it (see next section). Mixtures of materials give rise to a diffraction pattern which is (sometimes only approximately) the sum of that from each individual substance. In this work, we are concerned with one-dimensional diffraction patterns, known as line spectra. Provided enough lines can be resolved
35
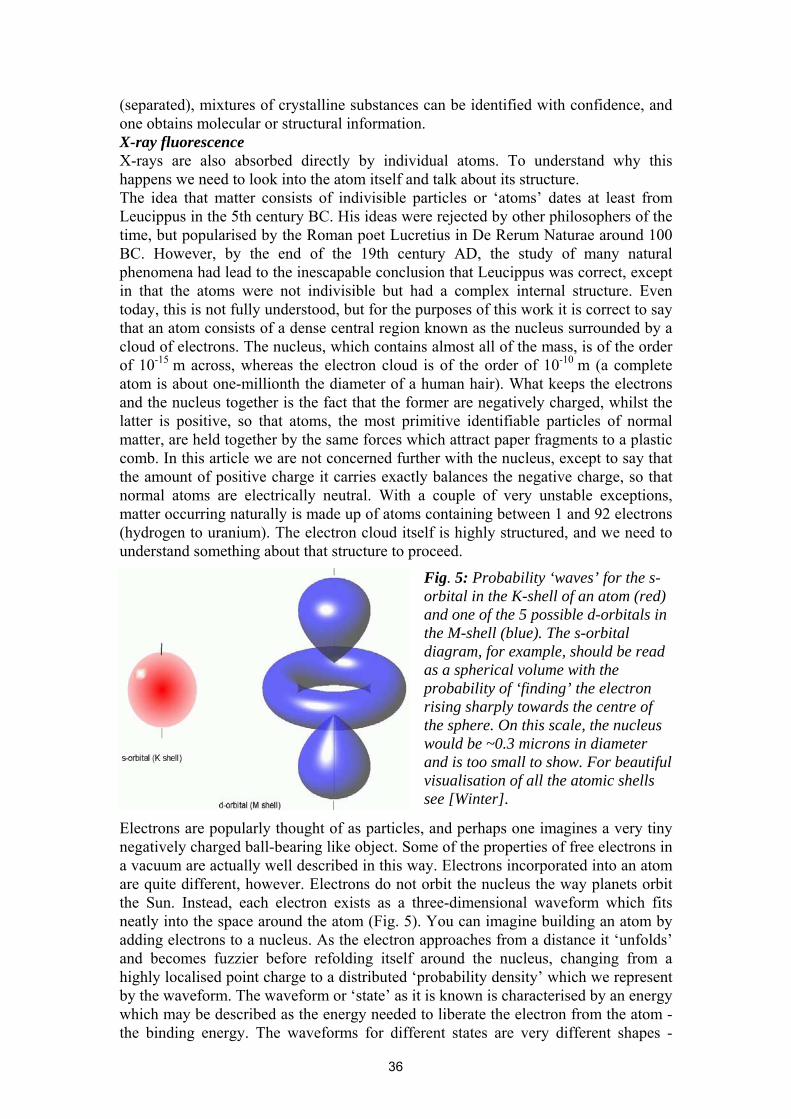
(separated), mixtures of crystalline substances can be identified with confidence, and one obtains molecular or structural information. X-ray fluorescence X-rays are also absorbed directly by individual atoms. To understand why this happens we need to look into the atom itself and talk about its structure. The idea that matter consists of indivisible particles or ‘atoms’ dates at least from Leucippus in the 5th century BC. His ideas were rejected by other philosophers of the time, but popularised by the Roman poet Lucretius in De Rerum Naturae around 100 BC. However, by the end of the 19th century AD, the study of many natural phenomena had lead to the inescapable conclusion that Leucippus was correct, except in that the atoms were not indivisible but had a complex internal structure. Even today, this is not fully understood, but for the purposes of this work it is correct to say that an atom consists of a dense central region known as the nucleus surrounded by a cloud of electrons. The nucleus, which contains almost all of the mass, is of the order of 10-15 m across, whereas the electron cloud is of the order of 10-10 m (a complete atom is about one-millionth the diameter of a human hair). What keeps the electrons and the nucleus together is the fact that the former are negatively charged, whilst the latter is positive, so that atoms, the most primitive identifiable particles of normal matter, are held together by the same forces which attract paper fragments to a plastic comb. In this article we are not concerned further with the nucleus, except to say that the amount of positive charge it carries exactly balances the negative charge, so that normal atoms are electrically neutral. With a couple of very unstable exceptions, matter occurring naturally is made up of atoms containing between 1 and 92 electrons (hydrogen to uranium). The electron cloud itself is highly structured, and we need to understand something about that structure to proceed.
Fig. 5: Probability ‘waves’ for the s-orbital in the K-shell of an atom (red) and one of the 5 possible d-orbitals in the M-shell (blue). The s-orbital diagram, for example, should be read as a spherical volume with the probability of ‘finding’ the electron rising sharply towards the centre of the sphere. On this scale, the nucleus would be ~0.3 microns in diameter and is too small to show. For beautiful visualisation of all the atomic shells see [Winter].
Electrons are popularly thought of as particles, and perhaps one imagines a very tiny negatively charged ball-bearing like object. Some of the properties of free electrons in a vacuum are actually well described in this way. Electrons incorporated into an atom are quite different, however. Electrons do not orbit the nucleus the way planets orbit the Sun. Instead, each electron exists as a three-dimensional waveform which fits neatly into the space around the atom (Fig. 5). You can imagine building an atom by adding electrons to a nucleus. As the electron approaches from a distance it ‘unfolds’ and becomes fuzzier before refolding itself around the nucleus, changing from a highly localised point charge to a distributed ‘probability density’ which we represent by the waveform. The waveform or ‘state’ as it is known is characterised by an energy which may be described as the energy needed to liberate the electron from the atom - the binding energy. The waveforms for different states are very different shapes -
36
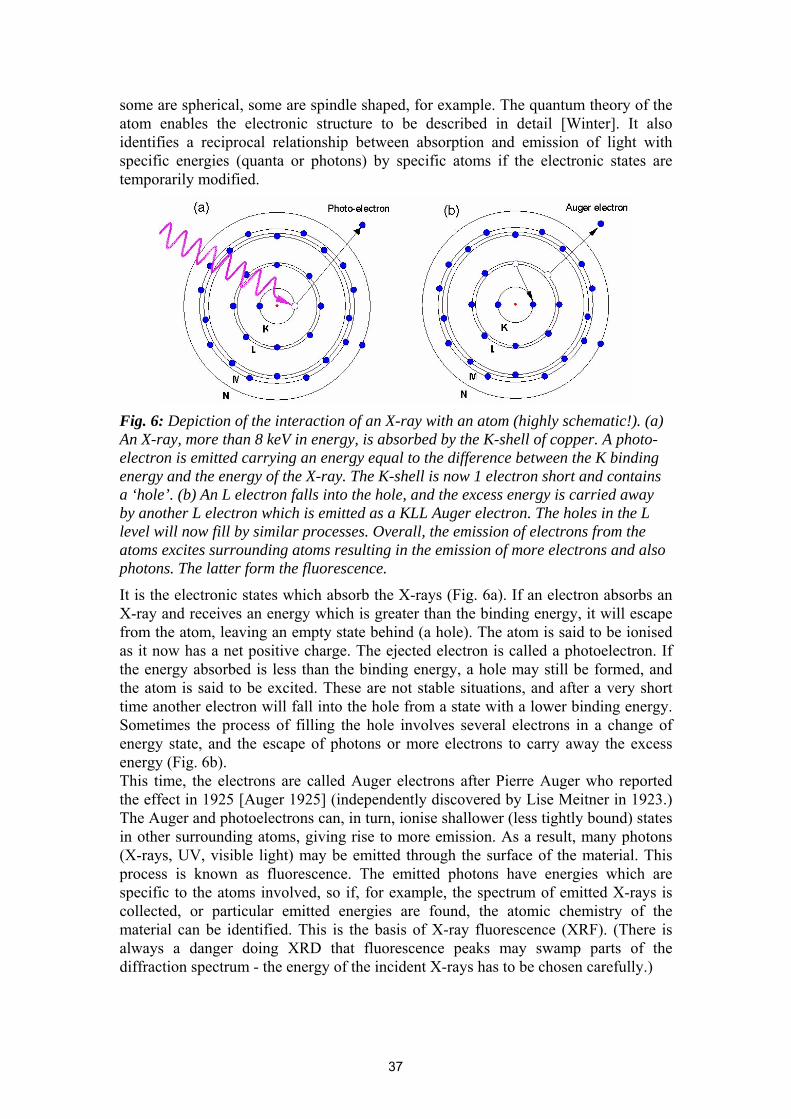
some are spherical, some are spindle shaped, for example. The quantum theory of the atom enables the electronic structure to be described in detail [Winter]. It also identifies a reciprocal relationship between absorption and emission of light with specific energies (quanta or photons) by specific atoms if the electronic states are temporarily modified.
Fig. 6: Depiction of the interaction of an X-ray with an atom (highly schematic!). (a) An X-ray, more than 8 keV in energy, is absorbed by the K-shell of copper. A photo-electron is emitted carrying an energy equal to the difference between the K binding energy and the energy of the X-ray. The K-shell is now 1 electron short and contains a ‘hole’. (b) An L electron falls into the hole, and the excess energy is carried away by another L electron which is emitted as a KLL Auger electron. The holes in the L level will now fill by similar processes. Overall, the emission of electrons from the atoms excites surrounding atoms resulting in the emission of more electrons and also photons. The latter form the fluorescence.
It is the electronic states which absorb the X-rays (Fig. 6a). If an electron absorbs an X-ray and receives an energy which is greater than the binding energy, it will escape from the atom, leaving an empty state behind (a hole). The atom is said to be ionised as it now has a net positive charge. The ejected electron is called a photoelectron. If the energy absorbed is less than the binding energy, a hole may still be formed, and the atom is said to be excited. These are not stable situations, and after a very short time another electron will fall into the hole from a state with a lower binding energy. Sometimes the process of filling the hole involves several electrons in a change of energy state, and the escape of photons or more electrons to carry away the excess energy (Fig. 6b). This time, the electrons are called Auger electrons after Pierre Auger who reported the effect in 1925 [Auger 1925] (independently discovered by Lise Meitner in 1923.) The Auger and photoelectrons can, in turn, ionise shallower (less tightly bound) states in other surrounding atoms, giving rise to more emission. As a result, many photons (X-rays, UV, visible light) may be emitted through the surface of the material. This process is known as fluorescence. The emitted photons have energies which are specific to the atoms involved, so if, for example, the spectrum of emitted X-rays is collected, or particular emitted energies are found, the atomic chemistry of the material can be identified. This is the basis of X-ray fluorescence (XRF). (There is always a danger doing XRD that fluorescence peaks may swamp parts of the diffraction spectrum - the energy of the incident X-rays has to be chosen carefully.)
37
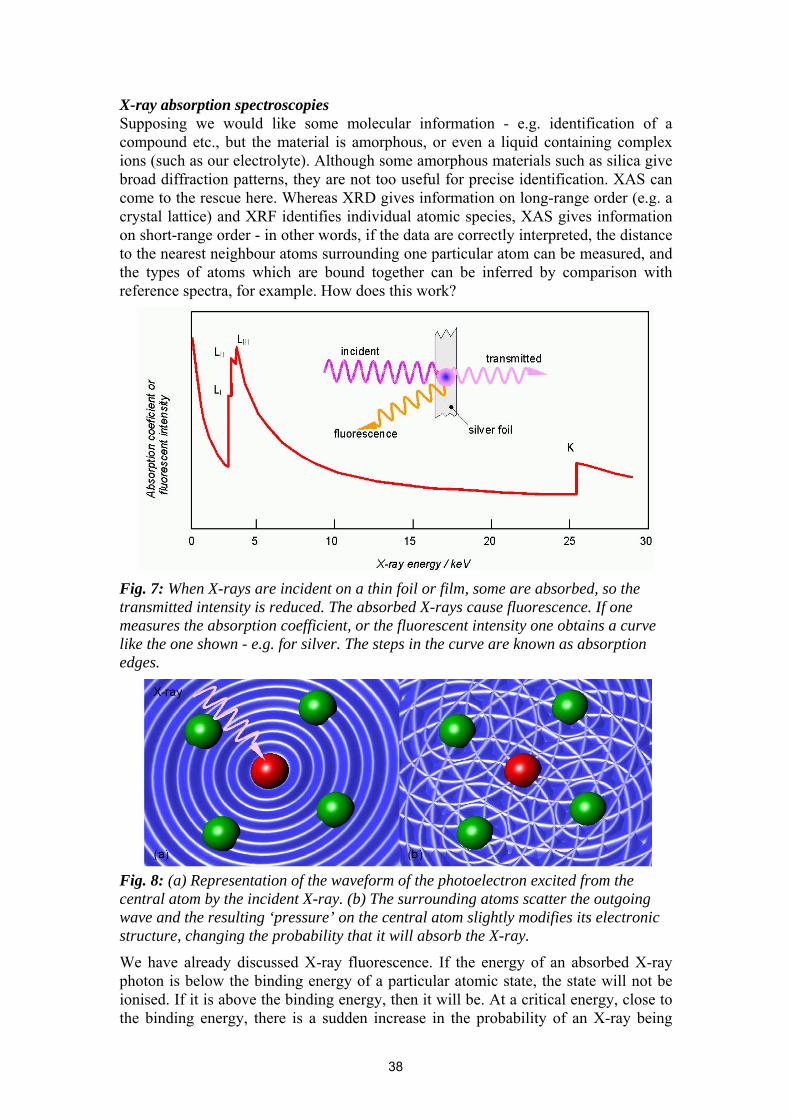
X-ray absorption spectroscopies Supposing we would like some molecular information - e.g. identification of a compound etc., but the material is amorphous, or even a liquid containing complex ions (such as our electrolyte). Although some amorphous materials such as silica give broad diffraction patterns, they are not too useful for precise identification. XAS can come to the rescue here. Whereas XRD gives information on long-range order (e.g. a crystal lattice) and XRF identifies individual atomic species, XAS gives information on short-range order - in other words, if the data are correctly interpreted, the distance to the nearest neighbour atoms surrounding one particular atom can be measured, and the types of atoms which are bound together can be inferred by comparison with reference spectra, for example. How does this work?
Fig. 7: When X-rays are incident on a thin foil or film, some are absorbed, so the transmitted intensity is reduced. The absorbed X-rays cause fluorescence. If one measures the absorption coefficient, or the fluorescent intensity one obtains a curve like the one shown - e.g. for silver. The steps in the curve are known as absorption edges.
Fig. 8: (a) Representation of the waveform of the photoelectron excited from the central atom by the incident X-ray. (b) The surrounding atoms scatter the outgoing wave and the resulting ‘pressure’ on the central atom slightly modifies its electronic structure, changing the probability that it will absorb the X-ray.
We have already discussed X-ray fluorescence. If the energy of an absorbed X-ray photon is below the binding energy of a particular atomic state, the state will not be ionised. If it is above the binding energy, then it will be. At a critical energy, close to the binding energy, there is a sudden increase in the probability of an X-ray being
38
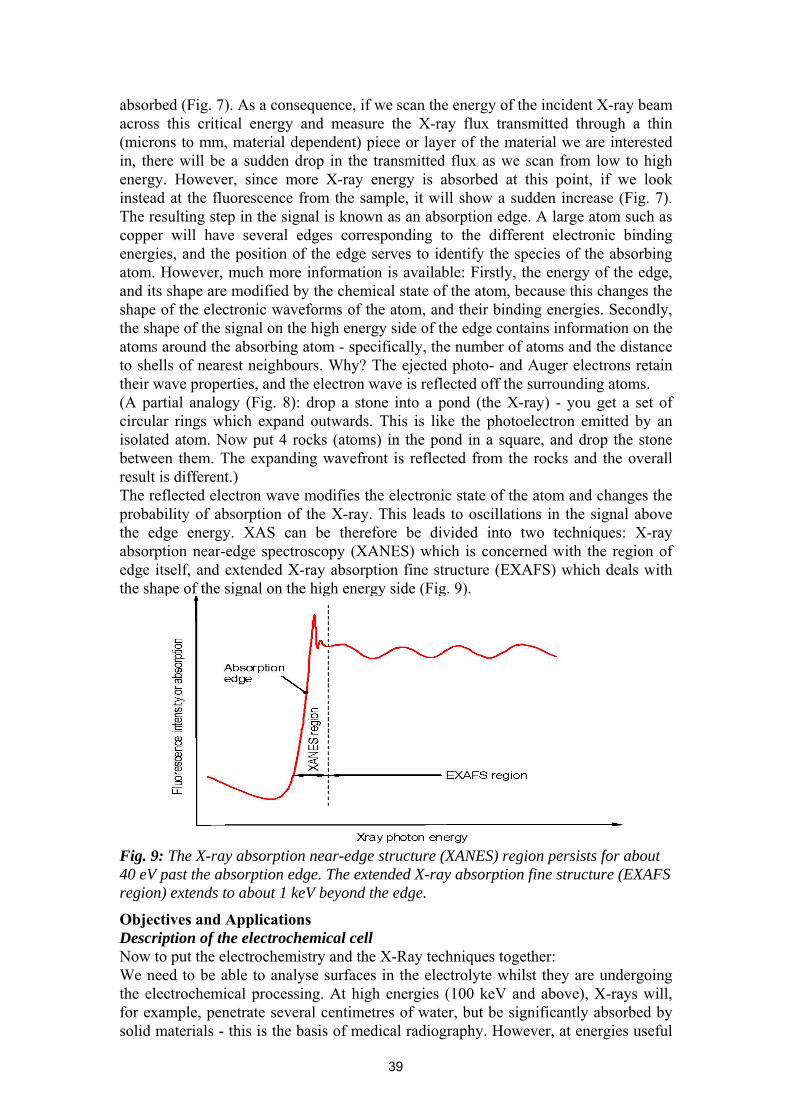
absorbed (Fig. 7). As a consequence, if we scan the energy of the incident X-ray beam across this critical energy and measure the X-ray flux transmitted through a thin (microns to mm, material dependent) piece or layer of the material we are interested in, there will be a sudden drop in the transmitted flux as we scan from low to high energy. However, since more X-ray energy is absorbed at this point, if we look instead at the fluorescence from the sample, it will show a sudden increase (Fig. 7). The resulting step in the signal is known as an absorption edge. A large atom such as copper will have several edges corresponding to the different electronic binding energies, and the position of the edge serves to identify the species of the absorbing atom. However, much more information is available: Firstly, the energy of the edge, and its shape are modified by the chemical state of the atom, because this changes the shape of the electronic waveforms of the atom, and their binding energies. Secondly, the shape of the signal on the high energy side of the edge contains information on the atoms around the absorbing atom - specifically, the number of atoms and the distance to shells of nearest neighbours. Why? The ejected photo- and Auger electrons retain their wave properties, and the electron wave is reflected off the surrounding atoms. (A partial analogy (Fig. 8): drop a stone into a pond (the X-ray) - you get a set of circular rings which expand outwards. This is like the photoelectron emitted by an isolated atom. Now put 4 rocks (atoms) in the pond in a square, and drop the stone between them. The expanding wavefront is reflected from the rocks and the overall result is different.) The reflected electron wave modifies the electronic state of the atom and changes the probability of absorption of the X-ray. This leads to oscillations in the signal above the edge energy. XAS can be therefore be divided into two techniques: X-ray absorption near-edge spectroscopy (XANES) which is concerned with the region of edge itself, and extended X-ray absorption fine structure (EXAFS) which deals with the shape of the signal on the high energy side (Fig. 9).
Fig. 9: The X-ray absorption near-edge structure (XANES) region persists for about 40 eV past the absorption edge. The extended X-ray absorption fine structure (EXAFS region) extends to about 1 keV beyond the edge.
Objectives and Applications Description of the electrochemical cell Now to put the electrochemistry and the X-Ray techniques together: We need to be able to analyse surfaces in the electrolyte whilst they are undergoing the electrochemical processing. At high energies (100 keV and above), X-rays will, for example, penetrate several centimetres of water, but be significantly absorbed by solid materials - this is the basis of medical radiography. However, at energies useful
39
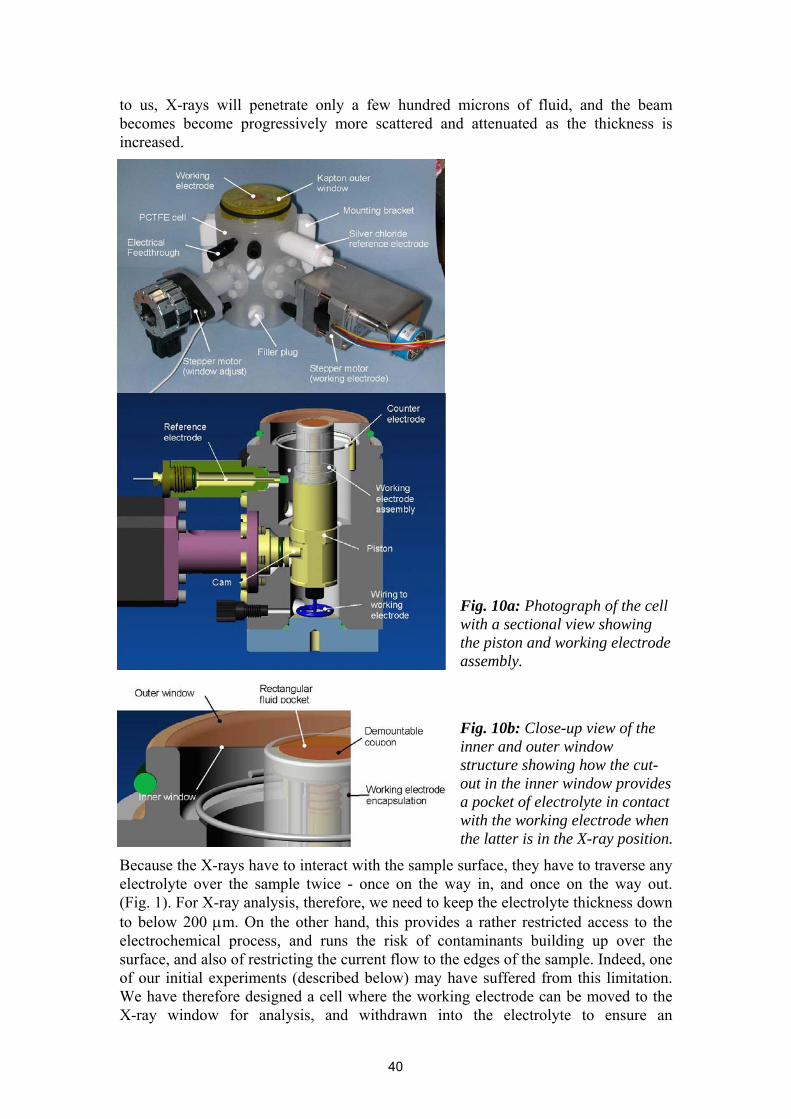
to us, X-rays will penetrate only a few hundred microns of fluid, and the beam becomes become progressively more scattered and attenuated as the thickness is increased.
Fig. 10a: Photograph of the cell with a sectional view showing the piston and working electrode assembly.
Fig. 10b: Close-up view of the inner and outer window structure showing how the cut-out in the inner window provides a pocket of electrolyte in contact with the working electrode when the latter is in the X-ray position.
Because the X-rays have to interact with the sample surface, they have to traverse any electrolyte over the sample twice - once on the way in, and once on the way out. (Fig. 1). For X-ray analysis, therefore, we need to keep the electrolyte thickness down to below 200 µm. On the other hand, this provides a rather restricted access to the electrochemical process, and runs the risk of contaminants building up over the surface, and also of restricting the current flow to the edges of the sample. Indeed, one of our initial experiments (described below) may have suffered from this limitation. We have therefore designed a cell where the working electrode can be moved to the X-ray window for analysis, and withdrawn into the electrolyte to ensure an
40
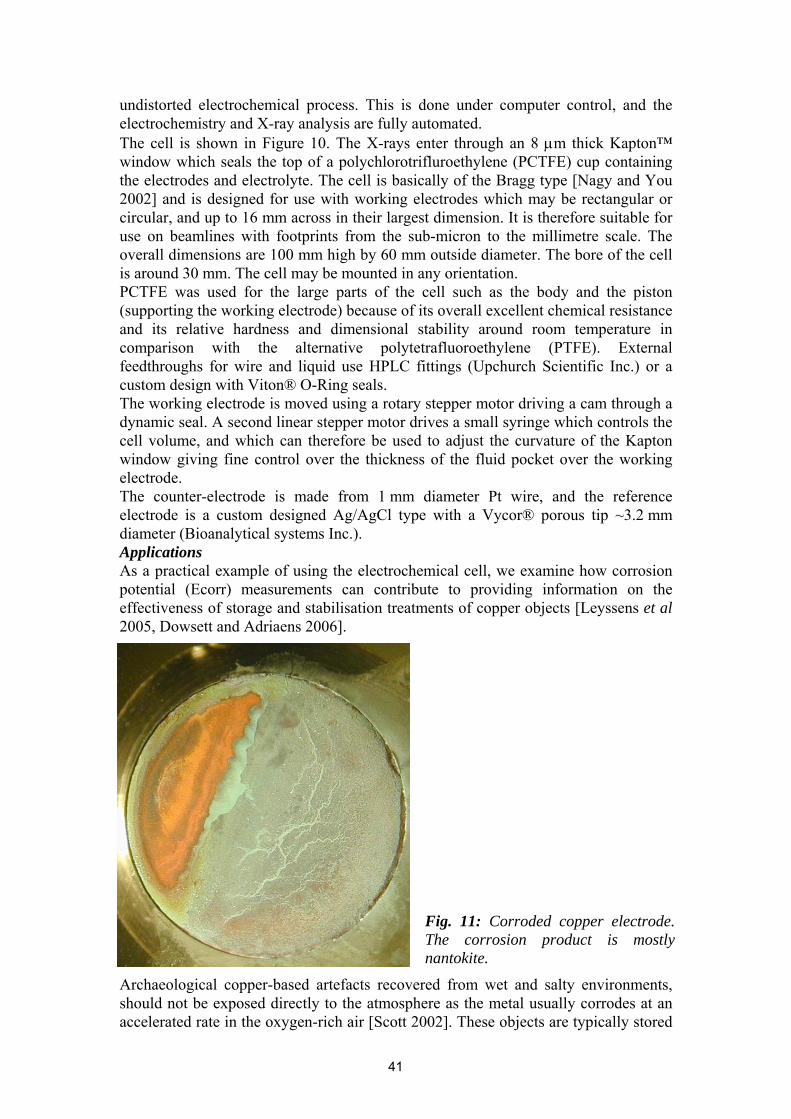
undistorted electrochemical process. This is done under computer control, and the electrochemistry and X-ray analysis are fully automated. The cell is shown in Figure 10. The X-rays enter through an 8 µm thick Kapton™ window which seals the top of a polychlorotrifluroethylene (PCTFE) cup containing the electrodes and electrolyte. The cell is basically of the Bragg type [Nagy and You 2002] and is designed for use with working electrodes which may be rectangular or circular, and up to 16 mm across in their largest dimension. It is therefore suitable for use on beamlines with footprints from the sub-micron to the millimetre scale. The overall dimensions are 100 mm high by 60 mm outside diameter. The bore of the cell is around 30 mm. The cell may be mounted in any orientation. PCTFE was used for the large parts of the cell such as the body and the piston (supporting the working electrode) because of its overall excellent chemical resistance and its relative hardness and dimensional stability around room temperature in comparison with the alternative polytetrafluoroethylene (PTFE). External feedthroughs for wire and liquid use HPLC fittings (Upchurch Scientific Inc.) or a custom design with Viton® O-Ring seals. The working electrode is moved using a rotary stepper motor driving a cam through a dynamic seal. A second linear stepper motor drives a small syringe which controls the cell volume, and which can therefore be used to adjust the curvature of the Kapton window giving fine control over the thickness of the fluid pocket over the working electrode. The counter-electrode is made from 1 mm diameter Pt wire, and the reference electrode is a custom designed Ag/AgCl type with a Vycor® porous tip ~3.2 mm diameter (Bioanalytical systems Inc.). Applications As a practical example of using the electrochemical cell, we examine how corrosion potential (Ecorr) measurements can contribute to providing information on the effectiveness of storage and stabilisation treatments of copper objects [Leyssens et al 2005, Dowsett and Adriaens 2006].
Fig. 11: Corroded copper electrode. The corrosion product is mostly nantokite.
Archaeological copper-based artefacts recovered from wet and salty environments, should not be exposed directly to the atmosphere as the metal usually corrodes at an accelerated rate in the oxygen-rich air [Scott 2002]. These objects are typically stored
41
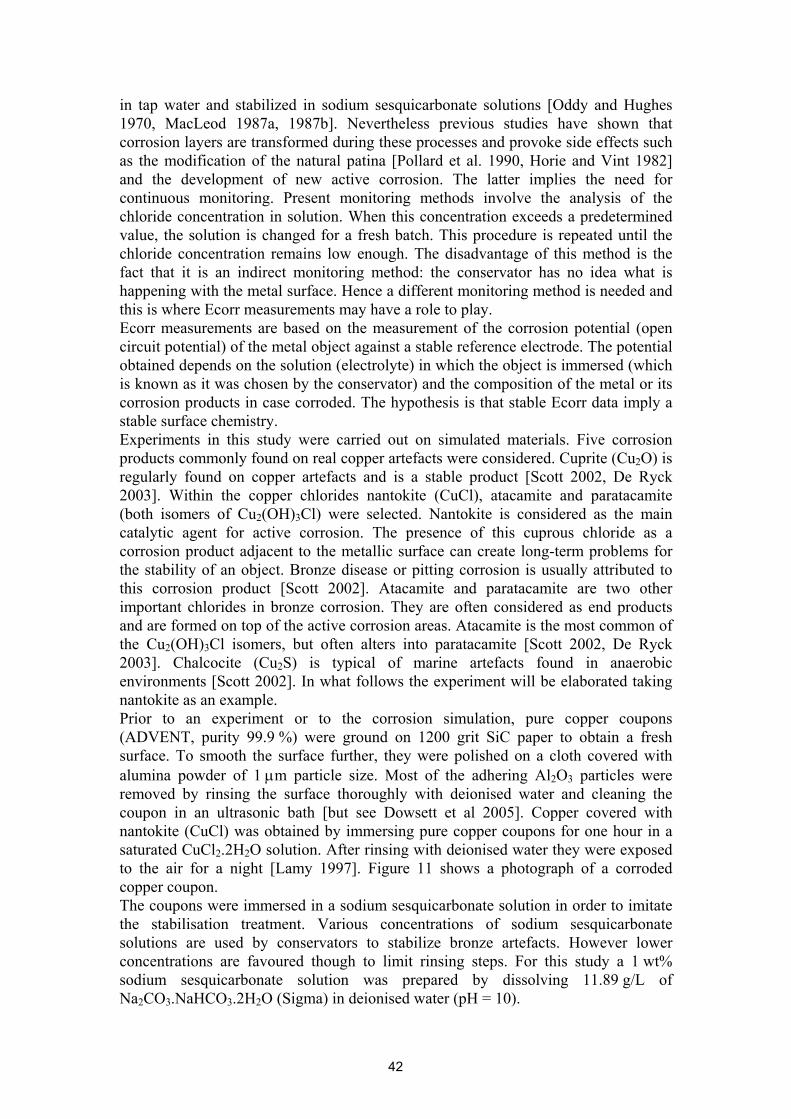
in tap water and stabilized in sodium sesquicarbonate solutions [Oddy and Hughes 1970, MacLeod 1987a, 1987b]. Nevertheless previous studies have shown that corrosion layers are transformed during these processes and provoke side effects such as the modification of the natural patina [Pollard et al. 1990, Horie and Vint 1982] and the development of new active corrosion. The latter implies the need for continuous monitoring. Present monitoring methods involve the analysis of the chloride concentration in solution. When this concentration exceeds a predetermined value, the solution is changed for a fresh batch. This procedure is repeated until the chloride concentration remains low enough. The disadvantage of this method is the fact that it is an indirect monitoring method: the conservator has no idea what is happening with the metal surface. Hence a different monitoring method is needed and this is where Ecorr measurements may have a role to play. Ecorr measurements are based on the measurement of the corrosion potential (open circuit potential) of the metal object against a stable reference electrode. The potential obtained depends on the solution (electrolyte) in which the object is immersed (which is known as it was chosen by the conservator) and the composition of the metal or its corrosion products in case corroded. The hypothesis is that stable Ecorr data imply a stable surface chemistry. Experiments in this study were carried out on simulated materials. Five corrosion products commonly found on real copper artefacts were considered. Cuprite (Cu2O) is regularly found on copper artefacts and is a stable product [Scott 2002, De Ryck 2003]. Within the copper chlorides nantokite (CuCl), atacamite and paratacamite (both isomers of Cu2(OH)3Cl) were selected. Nantokite is considered as the main catalytic agent for active corrosion. The presence of this cuprous chloride as a corrosion product adjacent to the metallic surface can create long-term problems for the stability of an object. Bronze disease or pitting corrosion is usually attributed to this corrosion product [Scott 2002]. Atacamite and paratacamite are two other important chlorides in bronze corrosion. They are often considered as end products and are formed on top of the active corrosion areas. Atacamite is the most common of the Cu2(OH)3Cl isomers, but often alters into paratacamite [Scott 2002, De Ryck 2003]. Chalcocite (Cu2S) is typical of marine artefacts found in anaerobic environments [Scott 2002]. In what follows the experiment will be elaborated taking nantokite as an example. Prior to an experiment or to the corrosion simulation, pure copper coupons (ADVENT, purity 99.9 %) were ground on 1200 grit SiC paper to obtain a fresh surface. To smooth the surface further, they were polished on a cloth covered with alumina powder of 1 µm particle size. Most of the adhering Al2O3 particles were removed by rinsing the surface thoroughly with deionised water and cleaning the coupon in an ultrasonic bath [but see Dowsett et al 2005]. Copper covered with nantokite (CuCl) was obtained by immersing pure copper coupons for one hour in a saturated CuCl2.2H2O solution. After rinsing with deionised water they were exposed to the air for a night [Lamy 1997]. Figure 11 shows a photograph of a corroded copper coupon. The coupons were immersed in a sodium sesquicarbonate solution in order to imitate the stabilisation treatment. Various concentrations of sodium sesquicarbonate solutions are used by conservators to stabilize bronze artefacts. However lower concentrations are favoured though to limit rinsing steps. For this study a 1 wt% sodium sesquicarbonate solution was prepared by dissolving 11.89 g/L of Na2CO3.NaHCO3.2H2O (Sigma) in deionised water (pH = 10).
42
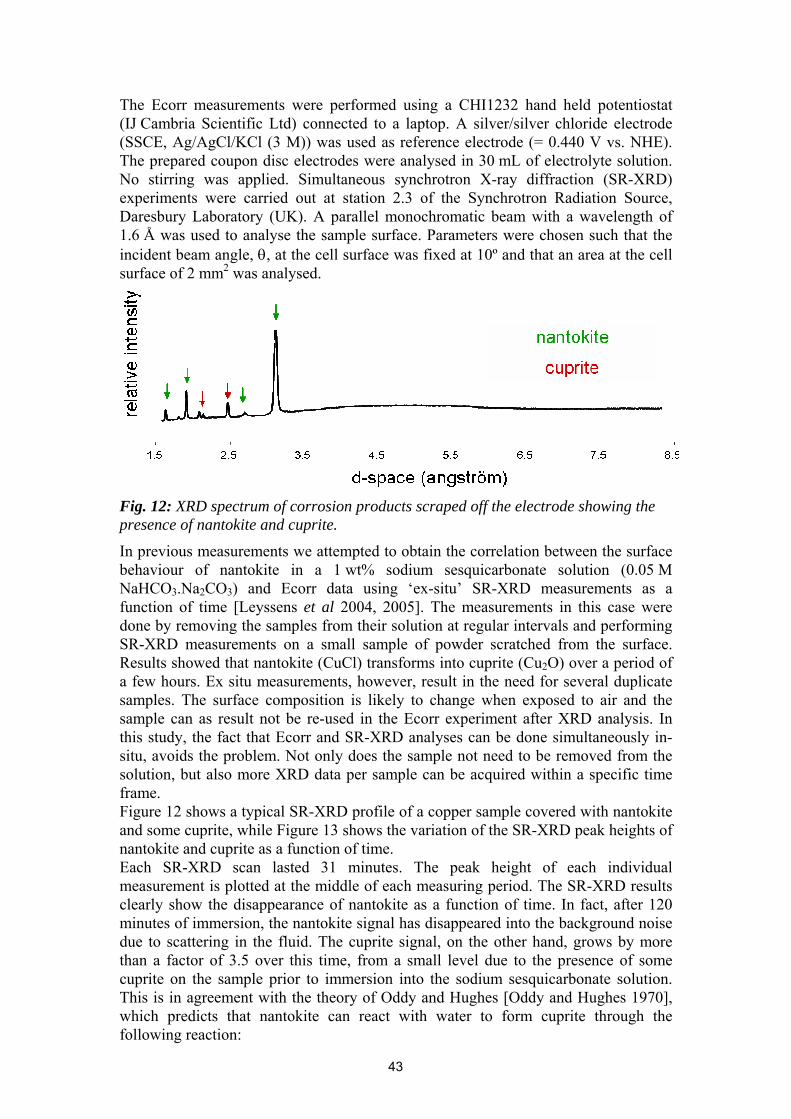
The Ecorr measurements were performed using a CHI1232 hand held potentiostat (IJ Cambria Scientific Ltd) connected to a laptop. A silver/silver chloride electrode (SSCE, Ag/AgCl/KCl (3 M)) was used as reference electrode (= 0.440 V vs. NHE). The prepared coupon disc electrodes were analysed in 30 mL of electrolyte solution. No stirring was applied. Simultaneous synchrotron X-ray diffraction (SR-XRD) experiments were carried out at station 2.3 of the Synchrotron Radiation Source, Daresbury Laboratory (UK). A parallel monochromatic beam with a wavelength of 1.6 Å was used to analyse the sample surface. Parameters were chosen such that the incident beam angle, θ, at the cell surface was fixed at 10º and that an area at the cell surface of 2 mm2 was analysed.
Fig. 12: XRD spectrum of corrosion products scraped off the electrode showing the presence of nantokite and cuprite.
In previous measurements we attempted to obtain the correlation between the surface behaviour of nantokite in a 1 wt% sodium sesquicarbonate solution (0.05 M NaHCO3.Na2CO3) and Ecorr data using ‘ex-situ’ SR-XRD measurements as a function of time [Leyssens et al 2004, 2005]. The measurements in this case were done by removing the samples from their solution at regular intervals and performing SR-XRD measurements on a small sample of powder scratched from the surface. Results showed that nantokite (CuCl) transforms into cuprite (Cu2O) over a period of a few hours. Ex situ measurements, however, result in the need for several duplicate samples. The surface composition is likely to change when exposed to air and the sample can as result not be re-used in the Ecorr experiment after XRD analysis. In this study, the fact that Ecorr and SR-XRD analyses can be done simultaneously in-situ, avoids the problem. Not only does the sample not need to be removed from the solution, but also more XRD data per sample can be acquired within a specific time frame. Figure 12 shows a typical SR-XRD profile of a copper sample covered with nantokite and some cuprite, while Figure 13 shows the variation of the SR-XRD peak heights of nantokite and cuprite as a function of time. Each SR-XRD scan lasted 31 minutes. The peak height of each individual measurement is plotted at the middle of each measuring period. The SR-XRD results clearly show the disappearance of nantokite as a function of time. In fact, after 120 minutes of immersion, the nantokite signal has disappeared into the background noise due to scattering in the fluid. The cuprite signal, on the other hand, grows by more than a factor of 3.5 over this time, from a small level due to the presence of some cuprite on the sample prior to immersion into the sodium sesquicarbonate solution. This is in agreement with the theory of Oddy and Hughes [Oddy and Hughes 1970], which predicts that nantokite can react with water to form cuprite through the following reaction:
43
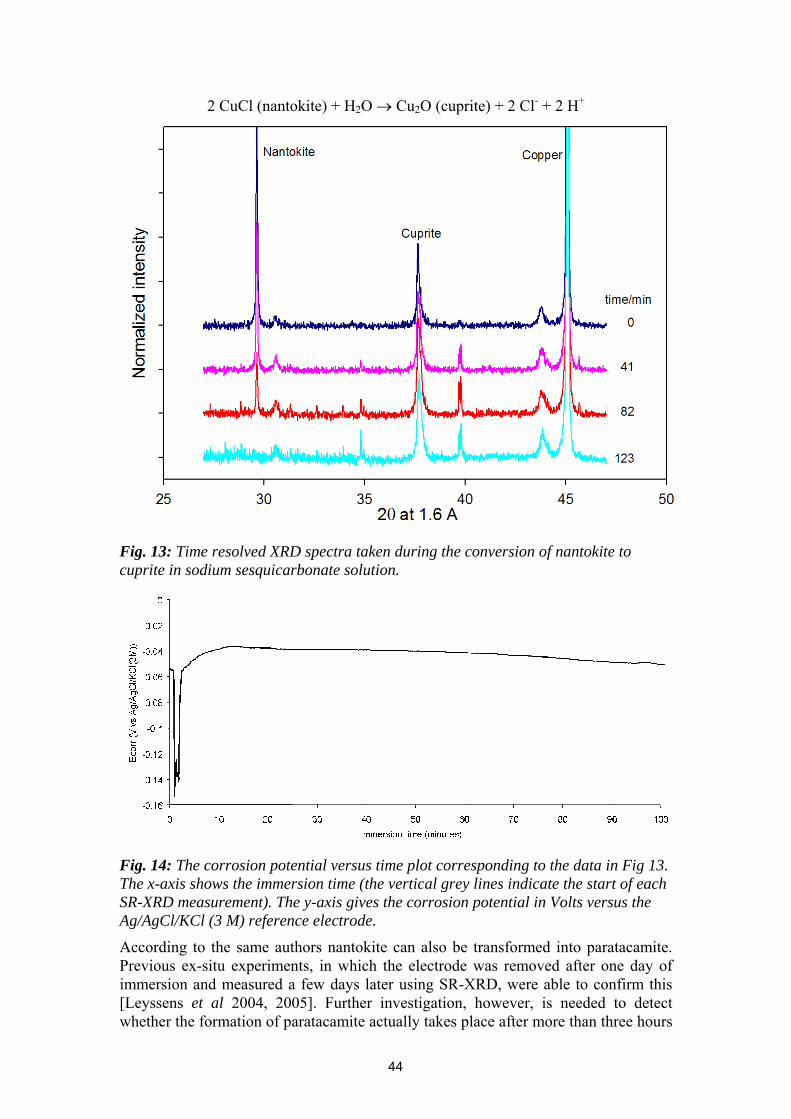
2 CuCl (nantokite) + H2O → Cu2O (cuprite) + 2 Cl- + 2 H+
Fig. 13: Time resolved XRD spectra taken during the conversion of nantokite to cuprite in sodium sesquicarbonate solution.
Fig. 14: The corrosion potential versus time plot corresponding to the data in Fig 13. The x-axis shows the immersion time (the vertical grey lines indicate the start of each SR-XRD measurement). The y-axis gives the corrosion potential in Volts versus the Ag/AgCl/KCl (3 M) reference electrode.
According to the same authors nantokite can also be transformed into paratacamite. Previous ex-situ experiments, in which the electrode was removed after one day of immersion and measured a few days later using SR-XRD, were able to confirm this [Leyssens et al 2004, 2005]. Further investigation, however, is needed to detect whether the formation of paratacamite actually takes place after more than three hours
44
of immersion or whether it is formed due to contact with the atmosphere when the sample is taken out of its solution. Figure 14 shows the corrosion potential versus time plot corresponding to the data in Figure 13. The x-axis shows the immersion time (the vertical grey lines indicate the start of each SR-XRD measurement). The y-axis gives the corrosion potential in Volts versus the Ag/AgCl/KCl (3 M) reference electrode. The variation of the corrosion potential with time recorded in the in-situ cell looks very similar to results obtained using a standard electrochemical cell. The limited thickness of the fluid layer (175 µm) seems to have no significant effect on the transformation of nantokite in sodium sesquicarbonate. Nevertheless, when comparing the SR-XRD results with the Ecorr data, the hypothesis that a stable Ecorr means a stable surface is not supported. A significant decrease in the amount of nantokite might be expected during the first 30 minutes since the corrosion potential shows a large alteration. In between 30 and 120 minutes of immersion the corrosion potential is more or less stable, implying, according to the hypothesis, no change in the surface composition. The SR-XRD data, however, tell a different story in that nantokite continues to decrease for at least 120 minutes. A possible explanation could be the inhomogeneity of the surface composition. Different areas on the surface can have more (or less) nantokite in their corrosion layer than the surrounding material. The time taken for the nantokite to disappear will then vary from place to place. Whereas the corrosion potentials measured give an average value over the whole surface, the SR-XRD measurements are performed on a smaller area. If it is the case that the corrosion potential stabilises too early, whilst there are still pockets of corrosion on the artefact, then its use in a sensor would be problematic. Further experiments are required to clarify this. Summary and conclusions Synchrotron-based X-ray techniques can be used to observe and characterise electrochemical corrosion and cleaning processes as they are happening inside the electrochemical cell. They therefore allow conservation and storage measures to be evaluated on simulated or real materials, either for the calibration of inexpensive sensing systems, or to evaluate the processes themselves. We have developed an electrochemical cell which is engineered so as to permit X-rays from a synchrotron beamline to be scattered or absorbed by the surface of a sample whilst electrochemical reactions are taking place. X-rays emitted from the surface then carry time-resolved information on the specific reactions as they occur. During the analysis, the surface can remain immersed in electrolyte or exposed to air so as to study the process in the most relevant way, and electrochemical data can be measured coincidentally. Although similar in-situ cells for the study of idealised (e.g. atomically flat, single crystal) surfaces have been described, this is, so far as we are aware, the first time such experiments have been done on rough (at least on the micron scale), polycrystalline, impure metals typical of real artefacts.
45
References • http://www.amptek.com/xrf.html. • Arčon I. et al, http://www.p-ng.si/~arcon/xas/xas/xas.htm. • Auger, P. 1925. J. Physique Radium, 6, 205. • De Ryck, I., 2003. ‘Chemical characterization of ancient artifacts: Application
of microbeam methods’, PhD dissertation. University of Antwerp, Belgium. • Dowsett, M.G., Adriaens, A., 2006. Anal. Chem., in press. • Dowsett, M. G., Adriaens, A., Soares, M., Wouters, H., Palitsin, V. V. N.,
Gibbons, R., and Morris, R. J. H. 2005. Nucl. Instrum. Meth. B, 239, 51. • Heiney, P. A.,
http://dept.physics.upenn.edu/~heiney/talks/hires/hires.html#intro • Horie, C.V., Vint J.A., 1982 Studies in Conservation 27, 185 • Lamy, C., ‘Stabilisation d’objets archéologiques chlorurés en alliage cuivreux
– Définition des conditions d’une polarisation cathodique à potentiel constant en solution de sesquicarbonate de sodium 1%’, unpublished Rapport de Stage, Université de Nantes ISITEM (1997)
• Leyssens, K., Adriaens, A., Pantos E., Degrigny C., 2004. ‘Study of Corrosion Potential Measurements as a Means to Monitor the Storage and Stabilization Processes of Archaeological Copper Artefacts’ In Metal 04, Ashton J., Hallam, D. (Eds.) 332. Canberra: National Museum of Australia.
• Leyssens K., Adriaens A., Degrigny C. 2005 In Proceedings of ICOM-CC 14th Triennial meeting 301. London: James & James.
• Leyssens, K., Adriaens, A., Dowsett, M.G., Schotte, B., Oloff, I., Pantos, E., Bell, A.M.T., Thompson, S.P. 2005. Electrochem. Communications, 7, 1256.
• MacLeod, I.D.,1987a. In Proceedings of the 8th triennial ICOM-CC meeting, Sydney, 1079.
• MacLeod, I.D., 1987b. Studies in Conservation, 32, 25. • MacLeod, I., Morrison, P., Richards, V, West, N. 2004 ‘Corrosion Monitoring
and the Environmental Impact of Decommissioned Naval Vesselsas Artifact Reefs’ In Metal 04, Ashton J., Hallam, D. (Eds.) 53. Canberra: National Museum of Australia.
• Nagy, Z., You, H. 2002. Electrochim. Acta, 47, 3037. • Oddy, W.A., Hughes M.J., 1970. Studies in Conservation, 15, 183. • Pollard, A.M., Thomas R.G.,Williams P.A., 1990. Studies in Conservation, 35,
148. • Scott, D.A., 2002. Copper and Bronze in Art: Corrosion, Colorants,
Conservation Los Angeles: The Getty Conservation Institute. • Stemann-Petersen, K., Taarnskov, B. 2001 ‘Electrolytic cleaning of silver and
gilt silver threads in silk textiles’. Paper presented at the Exposure 2001 conference, Hildesheim 2001.
• Winter, M., http://winter.group.shef.ac.uk/orbitron/
46
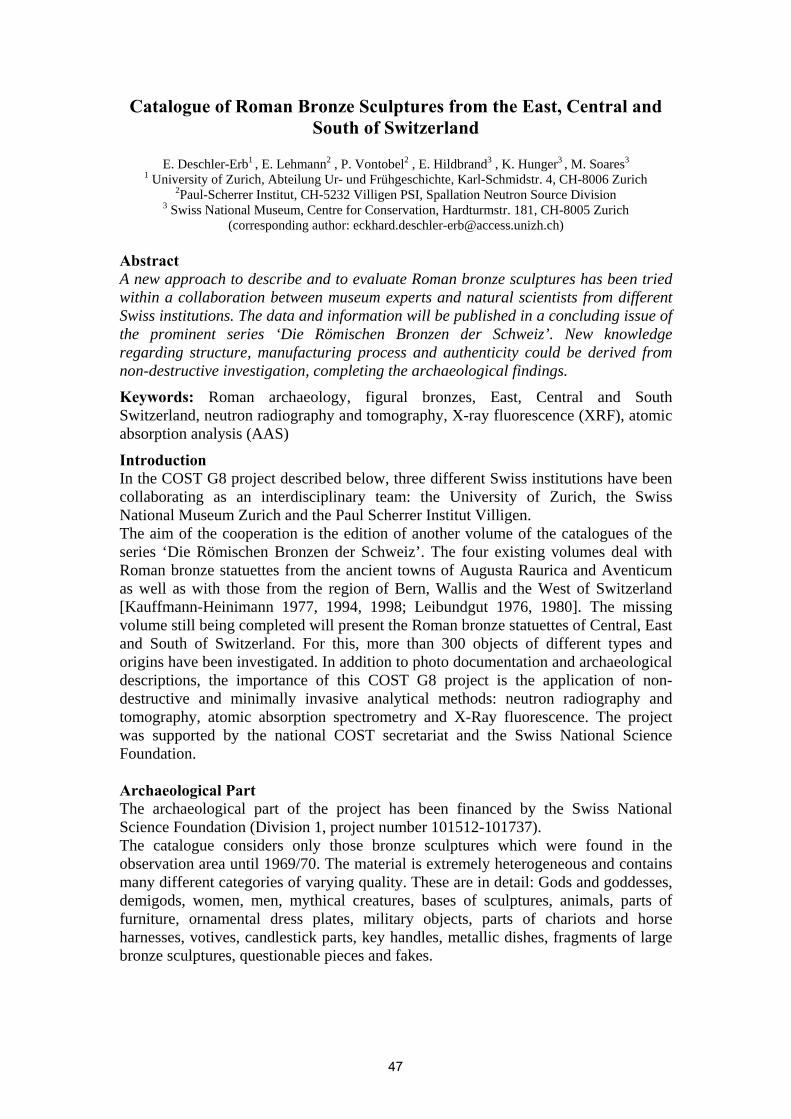
Catalogue of Roman Bronze Sculptures from the East, Central and South of Switzerland
E. Deschler-Erb1 , E. Lehmann2 , P. Vontobel2 , E. Hildbrand3 , K. Hunger3 , M. Soares3
1 University of Zurich, Abteilung Ur- und Frühgeschichte, Karl-Schmidstr. 4, CH-8006 Zurich 2Paul-Scherrer Institut, CH-5232 Villigen PSI, Spallation Neutron Source Division
3 Swiss National Museum, Centre for Conservation, Hardturmstr. 181, CH-8005 Zurich (corresponding author: [email protected])
Abstract A new approach to describe and to evaluate Roman bronze sculptures has been tried within a collaboration between museum experts and natural scientists from different Swiss institutions. The data and information will be published in a concluding issue of the prominent series ‘Die Römischen Bronzen der Schweiz’. New knowledge regarding structure, manufacturing process and authenticity could be derived from non-destructive investigation, completing the archaeological findings.
Keywords: Roman archaeology, figural bronzes, East, Central and South Switzerland, neutron radiography and tomography, X-ray fluorescence (XRF), atomic absorption analysis (AAS)
Introduction In the COST G8 project described below, three different Swiss institutions have been collaborating as an interdisciplinary team: the University of Zurich, the Swiss National Museum Zurich and the Paul Scherrer Institut Villigen. The aim of the cooperation is the edition of another volume of the catalogues of the series ‘Die Römischen Bronzen der Schweiz’. The four existing volumes deal with Roman bronze statuettes from the ancient towns of Augusta Raurica and Aventicum as well as with those from the region of Bern, Wallis and the West of Switzerland [Kauffmann-Heinimann 1977, 1994, 1998; Leibundgut 1976, 1980]. The missing volume still being completed will present the Roman bronze statuettes of Central, East and South of Switzerland. For this, more than 300 objects of different types and origins have been investigated. In addition to photo documentation and archaeological descriptions, the importance of this COST G8 project is the application of non-destructive and minimally invasive analytical methods: neutron radiography and tomography, atomic absorption spectrometry and X-Ray fluorescence. The project was supported by the national COST secretariat and the Swiss National Science Foundation. Archaeological Part The archaeological part of the project has been financed by the Swiss National Science Foundation (Division 1, project number 101512-101737). The catalogue considers only those bronze sculptures which were found in the observation area until 1969/70. The material is extremely heterogeneous and contains many different categories of varying quality. These are in detail: Gods and goddesses, demigods, women, men, mythical creatures, bases of sculptures, animals, parts of furniture, ornamental dress plates, military objects, parts of chariots and horse harnesses, votives, candlestick parts, key handles, metallic dishes, fragments of large bronze sculptures, questionable pieces and fakes.
47
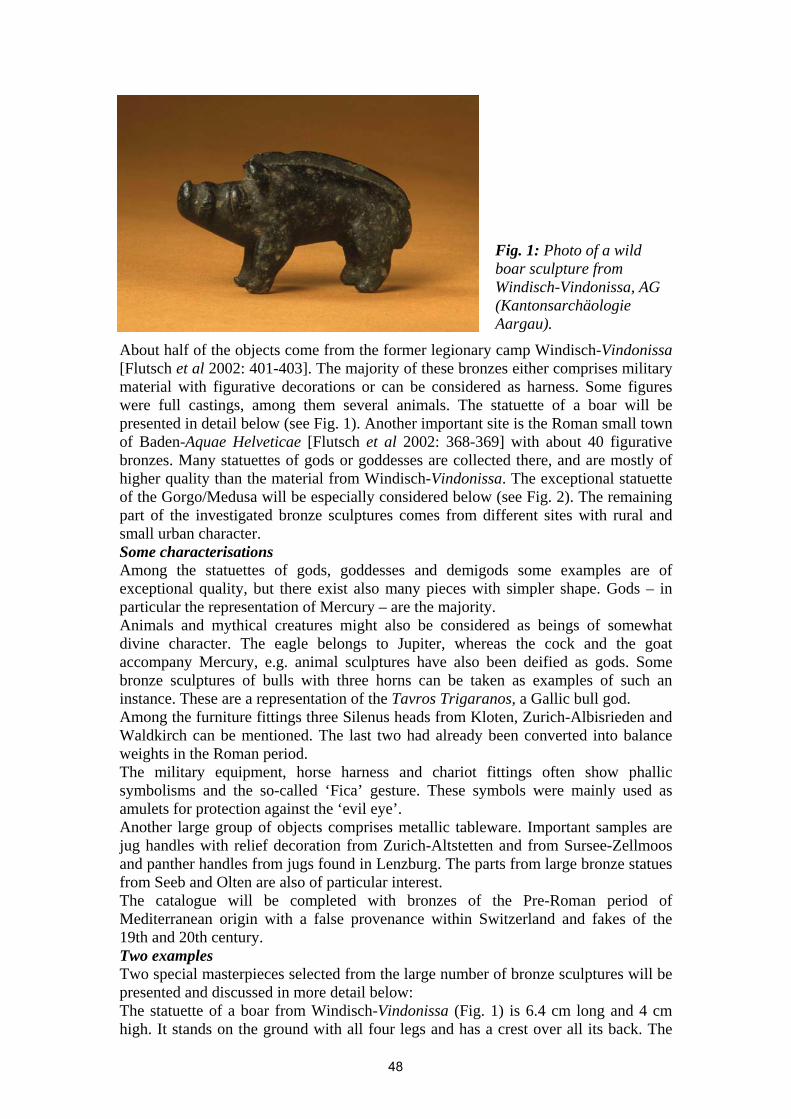
Fig. 1: Photo of a wild boar sculpture from Windisch-Vindonissa, AG (Kantonsarchäologie Aargau).
About half of the objects come from the former legionary camp Windisch-Vindonissa [Flutsch et al 2002: 401-403]. The majority of these bronzes either comprises military material with figurative decorations or can be considered as harness. Some figures were full castings, among them several animals. The statuette of a boar will be presented in detail below (see Fig. 1). Another important site is the Roman small town of Baden-Aquae Helveticae [Flutsch et al 2002: 368-369] with about 40 figurative bronzes. Many statuettes of gods or goddesses are collected there, and are mostly of higher quality than the material from Windisch-Vindonissa. The exceptional statuette of the Gorgo/Medusa will be especially considered below (see Fig. 2). The remaining part of the investigated bronze sculptures comes from different sites with rural and small urban character. Some characterisations Among the statuettes of gods, goddesses and demigods some examples are of exceptional quality, but there exist also many pieces with simpler shape. Gods – in particular the representation of Mercury – are the majority. Animals and mythical creatures might also be considered as beings of somewhat divine character. The eagle belongs to Jupiter, whereas the cock and the goat accompany Mercury, e.g. animal sculptures have also been deified as gods. Some bronze sculptures of bulls with three horns can be taken as examples of such an instance. These are a representation of the Tavros Trigaranos, a Gallic bull god. Among the furniture fittings three Silenus heads from Kloten, Zurich-Albisrieden and Waldkirch can be mentioned. The last two had already been converted into balance weights in the Roman period. The military equipment, horse harness and chariot fittings often show phallic symbolisms and the so-called ‘Fica’ gesture. These symbols were mainly used as amulets for protection against the ‘evil eye’. Another large group of objects comprises metallic tableware. Important samples are jug handles with relief decoration from Zurich-Altstetten and from Sursee-Zellmoos and panther handles from jugs found in Lenzburg. The parts from large bronze statues from Seeb and Olten are also of particular interest. The catalogue will be completed with bronzes of the Pre-Roman period of Mediterranean origin with a false provenance within Switzerland and fakes of the 19th and 20th century. Two examples Two special masterpieces selected from the large number of bronze sculptures will be presented and discussed in more detail below: The statuette of a boar from Windisch-Vindonissa (Fig. 1) is 6.4 cm long and 4 cm high. It stands on the ground with all four legs and has a crest over all its back. The
48
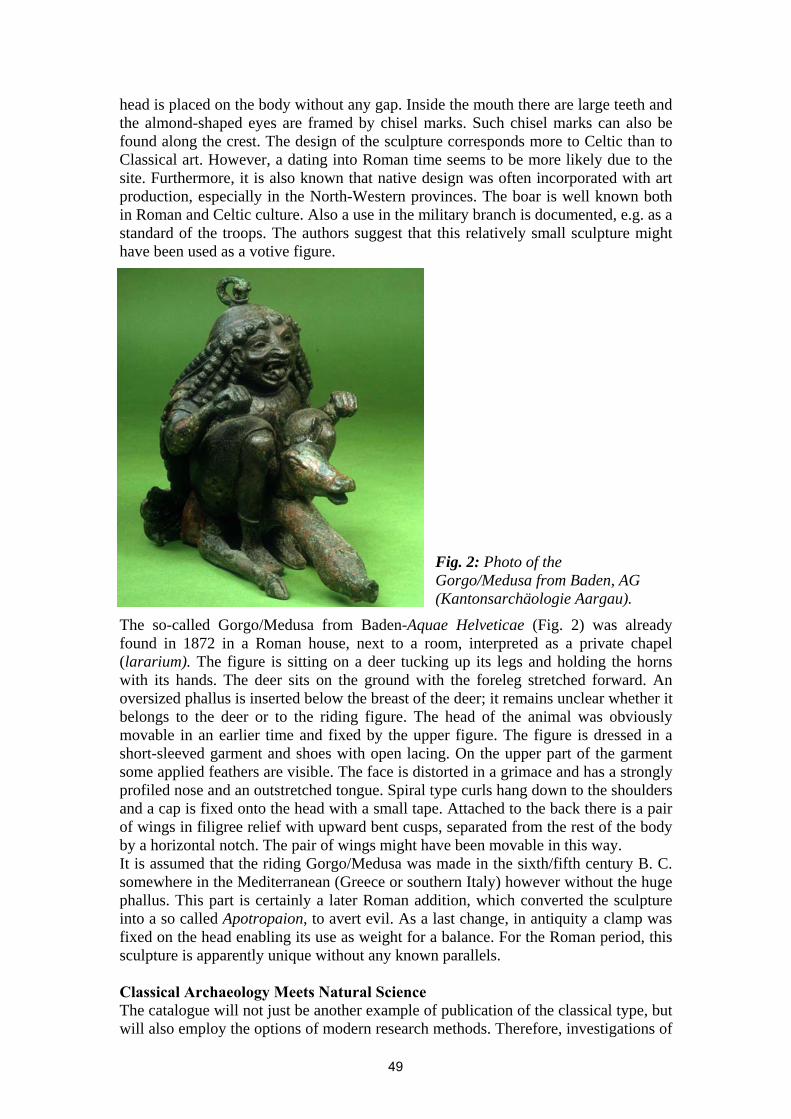
head is placed on the body without any gap. Inside the mouth there are large teeth and the almond-shaped eyes are framed by chisel marks. Such chisel marks can also be found along the crest. The design of the sculpture corresponds more to Celtic than to Classical art. However, a dating into Roman time seems to be more likely due to the site. Furthermore, it is also known that native design was often incorporated with art production, especially in the North-Western provinces. The boar is well known both in Roman and Celtic culture. Also a use in the military branch is documented, e.g. as a standard of the troops. The authors suggest that this relatively small sculpture might have been used as a votive figure.
Fig. 2: Photo of the Gorgo/Medusa from Baden, AG (Kantonsarchäologie Aargau).
The so-called Gorgo/Medusa from Baden-Aquae Helveticae (Fig. 2) was already found in 1872 in a Roman house, next to a room, interpreted as a private chapel (lararium). The figure is sitting on a deer tucking up its legs and holding the horns with its hands. The deer sits on the ground with the foreleg stretched forward. An oversized phallus is inserted below the breast of the deer; it remains unclear whether it belongs to the deer or to the riding figure. The head of the animal was obviously movable in an earlier time and fixed by the upper figure. The figure is dressed in a short-sleeved garment and shoes with open lacing. On the upper part of the garment some applied feathers are visible. The face is distorted in a grimace and has a strongly profiled nose and an outstretched tongue. Spiral type curls hang down to the shoulders and a cap is fixed onto the head with a small tape. Attached to the back there is a pair of wings in filigree relief with upward bent cusps, separated from the rest of the body by a horizontal notch. The pair of wings might have been movable in this way. It is assumed that the riding Gorgo/Medusa was made in the sixth/fifth century B. C. somewhere in the Mediterranean (Greece or southern Italy) however without the huge phallus. This part is certainly a later Roman addition, which converted the sculpture into a so called Apotropaion, to avert evil. As a last change, in antiquity a clamp was fixed on the head enabling its use as weight for a balance. For the Roman period, this sculpture is apparently unique without any known parallels. Classical Archaeology Meets Natural Science The catalogue will not just be another example of publication of the classical type, but will also employ the options of modern research methods. Therefore, investigations of
49
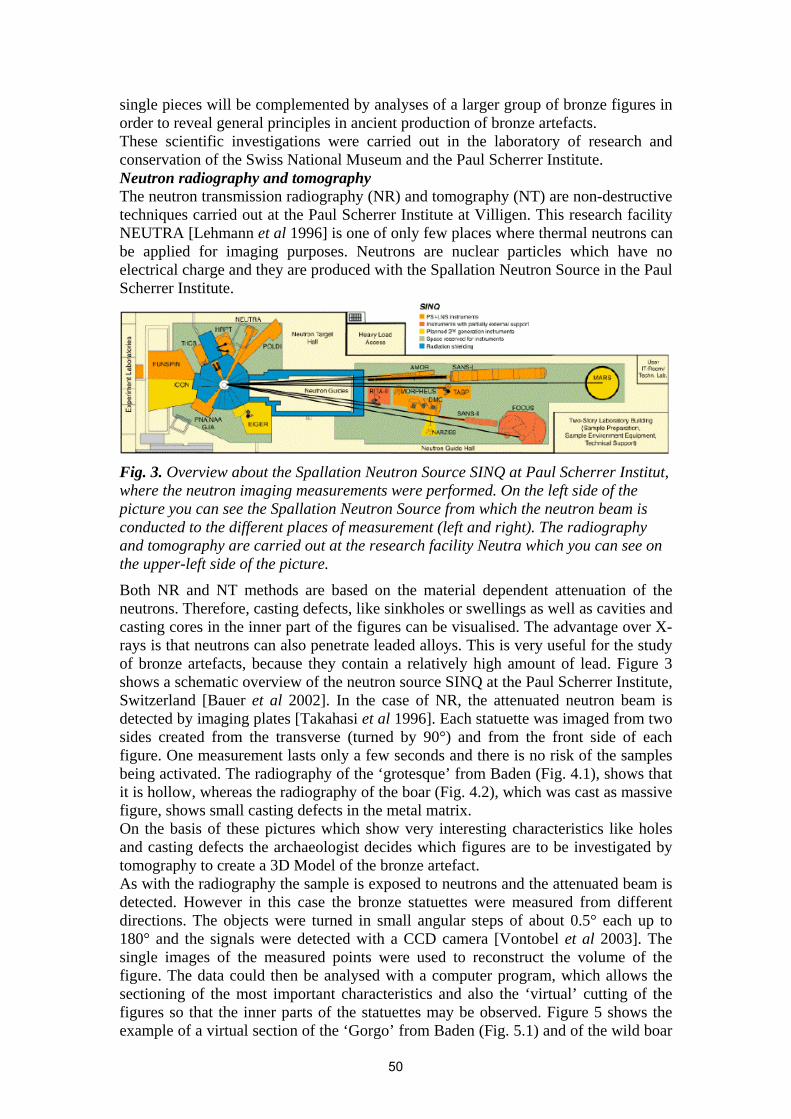
single pieces will be complemented by analyses of a larger group of bronze figures in order to reveal general principles in ancient production of bronze artefacts. These scientific investigations were carried out in the laboratory of research and conservation of the Swiss National Museum and the Paul Scherrer Institute. Neutron radiography and tomography The neutron transmission radiography (NR) and tomography (NT) are non-destructive techniques carried out at the Paul Scherrer Institute at Villigen. This research facility NEUTRA [Lehmann et al 1996] is one of only few places where thermal neutrons can be applied for imaging purposes. Neutrons are nuclear particles which have no electrical charge and they are produced with the Spallation Neutron Source in the Paul Scherrer Institute.
Fig. 3. Overview about the Spallation Neutron Source SINQ at Paul Scherrer Institut, where the neutron imaging measurements were performed. On the left side of the picture you can see the Spallation Neutron Source from which the neutron beam is conducted to the different places of measurement (left and right). The radiography and tomography are carried out at the research facility Neutra which you can see on the upper-left side of the picture.
Both NR and NT methods are based on the material dependent attenuation of the neutrons. Therefore, casting defects, like sinkholes or swellings as well as cavities and casting cores in the inner part of the figures can be visualised. The advantage over X-rays is that neutrons can also penetrate leaded alloys. This is very useful for the study of bronze artefacts, because they contain a relatively high amount of lead. Figure 3 shows a schematic overview of the neutron source SINQ at the Paul Scherrer Institute, Switzerland [Bauer et al 2002]. In the case of NR, the attenuated neutron beam is detected by imaging plates [Takahasi et al 1996]. Each statuette was imaged from two sides created from the transverse (turned by 90°) and from the front side of each figure. One measurement lasts only a few seconds and there is no risk of the samples being activated. The radiography of the ‘grotesque’ from Baden (Fig. 4.1), shows that it is hollow, whereas the radiography of the boar (Fig. 4.2), which was cast as massive figure, shows small casting defects in the metal matrix. On the basis of these pictures which show very interesting characteristics like holes and casting defects the archaeologist decides which figures are to be investigated by tomography to create a 3D Model of the bronze artefact. As with the radiography the sample is exposed to neutrons and the attenuated beam is detected. However in this case the bronze statuettes were measured from different directions. The objects were turned in small angular steps of about 0.5° each up to 180° and the signals were detected with a CCD camera [Vontobel et al 2003]. The single images of the measured points were used to reconstruct the volume of the figure. The data could then be analysed with a computer program, which allows the sectioning of the most important characteristics and also the ‘virtual’ cutting of the figures so that the inner parts of the statuettes may be observed. Figure 5 shows the example of a virtual section of the ‘Gorgo’ from Baden (Fig. 5.1) and of the wild boar
50
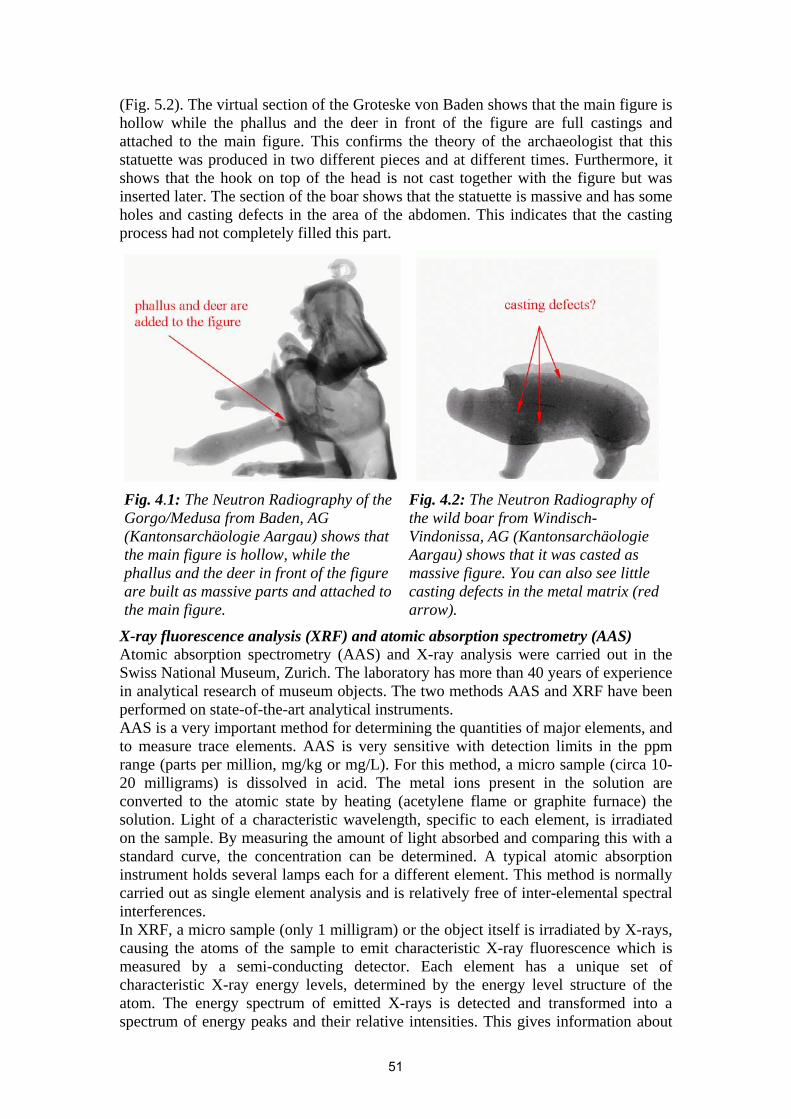
(Fig. 5.2). The virtual section of the Groteske von Baden shows that the main figure is hollow while the phallus and the deer in front of the figure are full castings and attached to the main figure. This confirms the theory of the archaeologist that this statuette was produced in two different pieces and at different times. Furthermore, it shows that the hook on top of the head is not cast together with the figure but was inserted later. The section of the boar shows that the statuette is massive and has some holes and casting defects in the area of the abdomen. This indicates that the casting process had not completely filled this part.
Fig. 4.1: The Neutron Radiography of the Gorgo/Medusa from Baden, AG (Kantonsarchäologie Aargau) shows that the main figure is hollow, while the phallus and the deer in front of the figure are built as massive parts and attached to the main figure.
Fig. 4.2: The Neutron Radiography of the wild boar from Windisch-Vindonissa, AG (Kantonsarchäologie Aargau) shows that it was casted as massive figure. You can also see little casting defects in the metal matrix (red arrow).
X-ray fluorescence analysis (XRF) and atomic absorption spectrometry (AAS) Atomic absorption spectrometry (AAS) and X-ray analysis were carried out in the Swiss National Museum, Zurich. The laboratory has more than 40 years of experience in analytical research of museum objects. The two methods AAS and XRF have been performed on state-of-the-art analytical instruments. AAS is a very important method for determining the quantities of major elements, and to measure trace elements. AAS is very sensitive with detection limits in the ppm range (parts per million, mg/kg or mg/L). For this method, a micro sample (circa 10-20 milligrams) is dissolved in acid. The metal ions present in the solution are converted to the atomic state by heating (acetylene flame or graphite furnace) the solution. Light of a characteristic wavelength, specific to each element, is irradiated on the sample. By measuring the amount of light absorbed and comparing this with a standard curve, the concentration can be determined. A typical atomic absorption instrument holds several lamps each for a different element. This method is normally carried out as single element analysis and is relatively free of inter-elemental spectral interferences. In XRF, a micro sample (only 1 milligram) or the object itself is irradiated by X-rays, causing the atoms of the sample to emit characteristic X-ray fluorescence which is measured by a semi-conducting detector. Each element has a unique set of characteristic X-ray energy levels, determined by the energy level structure of the atom. The energy spectrum of emitted X-rays is detected and transformed into a spectrum of energy peaks and their relative intensities. This gives information about
51
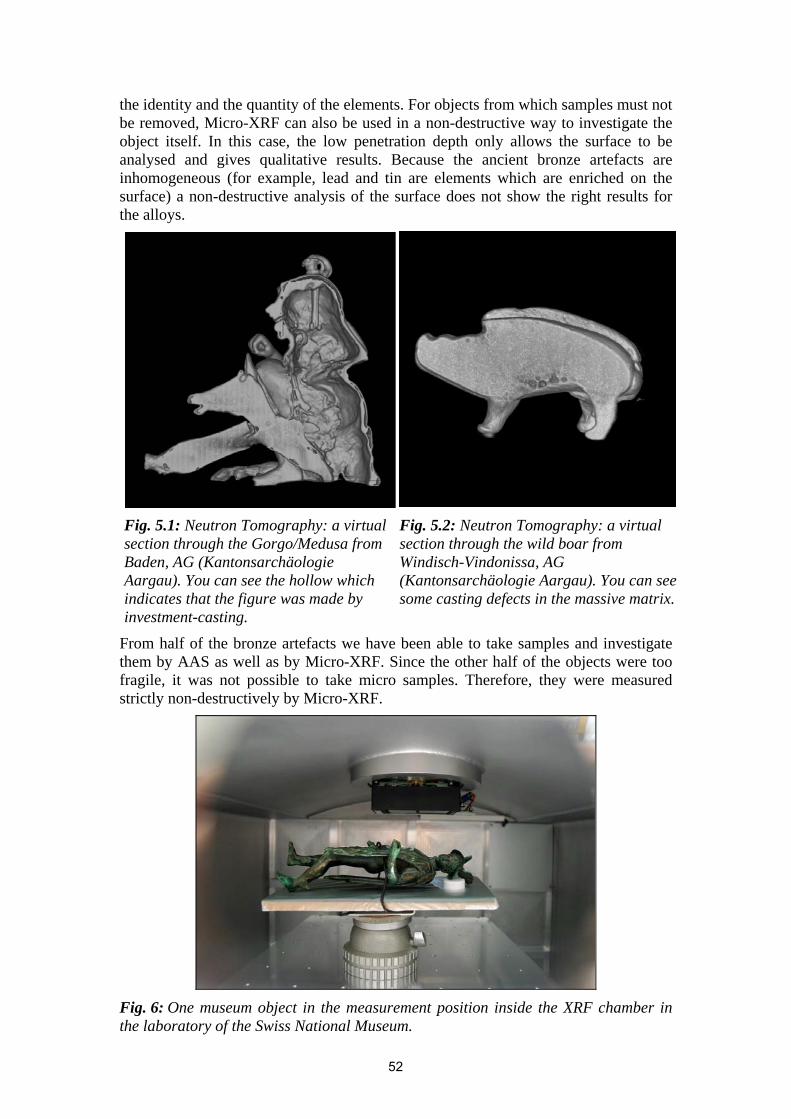
the identity and the quantity of the elements. For objects from which samples must not be removed, Micro-XRF can also be used in a non-destructive way to investigate the object itself. In this case, the low penetration depth only allows the surface to be analysed and gives qualitative results. Because the ancient bronze artefacts are inhomogeneous (for example, lead and tin are elements which are enriched on the surface) a non-destructive analysis of the surface does not show the right results for the alloys.
Fig. 5.1: Neutron Tomography: a virtual section through the Gorgo/Medusa from Baden, AG (Kantonsarchäologie Aargau). You can see the hollow which indicates that the figure was made by investment-casting.
Fig. 5.2: Neutron Tomography: a virtual section through the wild boar from Windisch-Vindonissa, AG (Kantonsarchäologie Aargau). You can see some casting defects in the massive matrix.
From half of the bronze artefacts we have been able to take samples and investigate them by AAS as well as by Micro-XRF. Since the other half of the objects were too fragile, it was not possible to take micro samples. Therefore, they were measured strictly non-destructively by Micro-XRF.
Fig. 6: One museum object in the measurement position inside the XRF chamber in the laboratory of the Swiss National Museum.
52
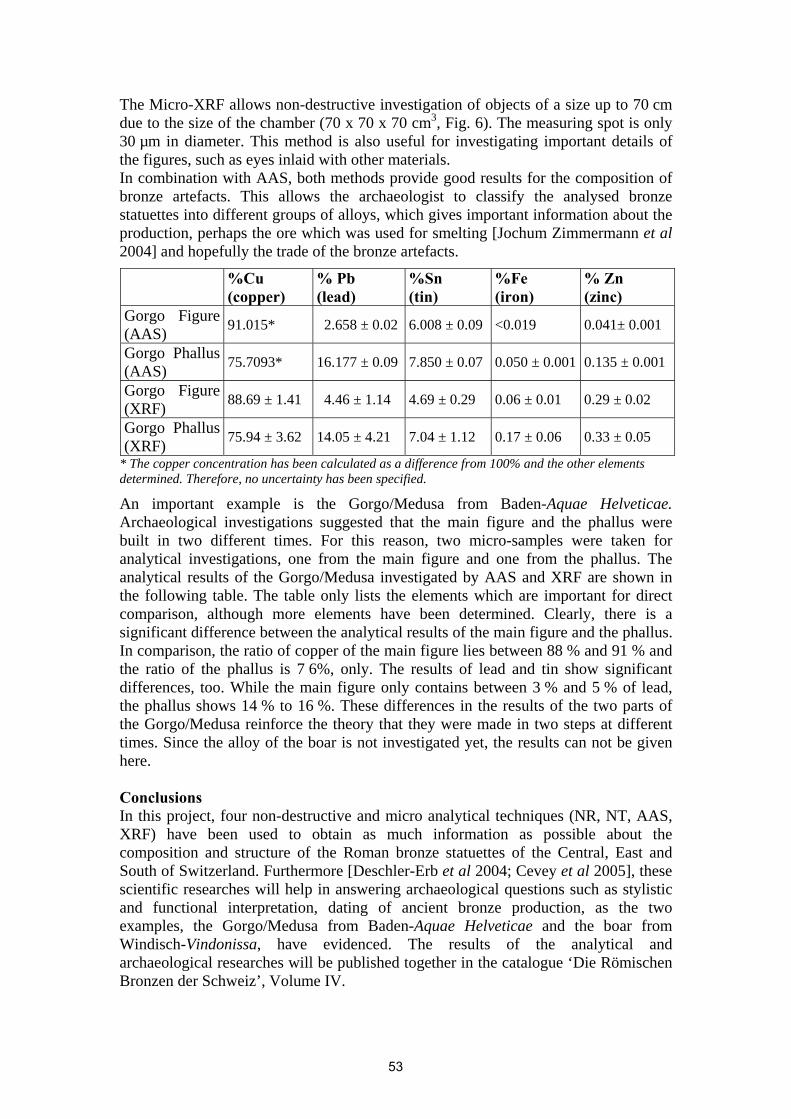
The Micro-XRF allows non-destructive investigation of objects of a size up to 70 cm due to the size of the chamber (70 x 70 x 70 cm3, Fig. 6). The measuring spot is only 30 µm in diameter. This method is also useful for investigating important details of the figures, such as eyes inlaid with other materials. In combination with AAS, both methods provide good results for the composition of bronze artefacts. This allows the archaeologist to classify the analysed bronze statuettes into different groups of alloys, which gives important information about the production, perhaps the ore which was used for smelting [Jochum Zimmermann et al 2004] and hopefully the trade of the bronze artefacts.
%Cu (copper)
% Pb (lead)
%Sn (tin)
%Fe (iron)
% Zn (zinc)
Gorgo Figure (AAS) 91.015* 2.658 ± 0.02 6.008 ± 0.09 <0.019 0.041± 0.001
Gorgo Phallus (AAS) 75.7093* 16.177 ± 0.09 7.850 ± 0.07 0.050 ± 0.001 0.135 ± 0.001
Gorgo Figure (XRF) 88.69 ± 1.41 4.46 ± 1.14 4.69 ± 0.29 0.06 ± 0.01 0.29 ± 0.02
Gorgo Phallus (XRF) 75.94 ± 3.62 14.05 ± 4.21 7.04 ± 1.12 0.17 ± 0.06 0.33 ± 0.05
* The copper concentration has been calculated as a difference from 100% and the other elements determined. Therefore, no uncertainty has been specified.
An important example is the Gorgo/Medusa from Baden-Aquae Helveticae. Archaeological investigations suggested that the main figure and the phallus were built in two different times. For this reason, two micro-samples were taken for analytical investigations, one from the main figure and one from the phallus. The analytical results of the Gorgo/Medusa investigated by AAS and XRF are shown in the following table. The table only lists the elements which are important for direct comparison, although more elements have been determined. Clearly, there is a significant difference between the analytical results of the main figure and the phallus. In comparison, the ratio of copper of the main figure lies between 88 % and 91 % and the ratio of the phallus is 7 6%, only. The results of lead and tin show significant differences, too. While the main figure only contains between 3 % and 5 % of lead, the phallus shows 14 % to 16 %. These differences in the results of the two parts of the Gorgo/Medusa reinforce the theory that they were made in two steps at different times. Since the alloy of the boar is not investigated yet, the results can not be given here. Conclusions In this project, four non-destructive and micro analytical techniques (NR, NT, AAS, XRF) have been used to obtain as much information as possible about the composition and structure of the Roman bronze statuettes of the Central, East and South of Switzerland. Furthermore [Deschler-Erb et al 2004; Cevey et al 2005], these scientific researches will help in answering archaeological questions such as stylistic and functional interpretation, dating of ancient bronze production, as the two examples, the Gorgo/Medusa from Baden-Aquae Helveticae and the boar from Windisch-Vindonissa, have evidenced. The results of the analytical and archaeological researches will be published together in the catalogue ‘Die Römischen Bronzen der Schweiz’, Volume IV.
53
Acknowledgements: We would like to thank the following institutions for their valuable contributions: Historical Museum Baden, Kantonsarchäologie Aargau and Vindonissa-Museum Brugg, Paul-Scherrer Institute Villigen, Swiss National Museum Zurich, University of Zurich. We also want to thank especially Cost G8, Switzerland for financing the analytical researches and the Swiss National Fond for financing the archaeological researches. References
• Bauer, G. S. Dai, Y. Wagner, W. Phys, J. 2002. IV France 12: Pr8-3. • Cevey, C. Hildbrand, E. Hunger, K. Soares, M. Deschler-Erb, E. Lehmann, E.
Vontobel, P. 2005. ‘Non-destructive and Micro Analytical Investigation Techniques and Archaeological description of Roman Bronze Statuettes from the Central, East and South of Switzerland’ Proceedings Conference ART’05, Lecce.
• Deschler-Erb, E. Lehmann, E. Soares, M. 2004. ‘Alt heydnisch Bildlein von ertz’ Archäologie der Schweiz 27/3, 14-22.
• Flutsch, L. Niffeler, U. Rossi, F. (ed.) 2002. Windisch, Brugg, Hausen, Gebenstorf AG Die Schweiz vom Paläolithikum bis zum frühen Mittelalter vol. 5. Basel: Verlag Schweizerische Gesellschaft für Ur- und Frühgeschichte.
• Jochum Zimmermann, E. Senn, M. Wichser, A. 2004. ‘Zum Verhalten von Spurenelementen und Legierungsbestandteilen in Kupfer bei der Weiterverarbeitung des Metalls.’ Experimentelle Archäologie in Europa, Bilanz 2004, vol. 3: 127-136.
• Kaufmann-Heinimann, A. 1977. ‘Augst und das Gebiet der Colonia Augusta Raurica’. Die römischen Bronzen der Schweiz vol. 1. Mainz: Zabern Verlag.
• Kaufmann-Heinimann, A. 1994. ‘Neufunde und Nachträge’. Die römischen Bronzen der Schweiz, Vol. 5. Mainz: Zabern Verlag.
• Kaufmann-Heinimann, A. 1998. ‘Götter und Lararien aus Augusta Raurica’. Forschungen in Augst, Vol. 26. Augst.
• Lehmann, E. Vontobel, P. Wiezel, L. 1996. ‘Properties of the radiography facility NEUTRA at SINQ and its use as European reference facility.’ Non destructive Testing Evaluations, Vol. 16: 191-202.
• Leibundgut, A. 1976. ‘Avenches’. Die römischen Bronzen der Schweiz, Vol. 2. Mainz: Zabern Verlag.
• Leibundgut, A. 1980: ‘Westschweiz, Bern und Wallis’. Die römischen Bronzen der Schweiz, Vol. 3 Mainz: Zabern Verlag.
• Takahasi, K. et al. 1996. ‘Imaging performance of imaging plate neutron detectors.’ Nuclear Instruments and Methods in Physics Research, vol. A 377: 119-122.
• Vontobel, P. Lehmann, E. Frei, G. 2003. ‘Performance characteristics of the tomography setup at the PSI NEUTRA thermal neutron radiography facility’. Proceedings of Computed Tomography and Image Processing for Industrial Radiology, June 23-25, 2003, Berlin.
54
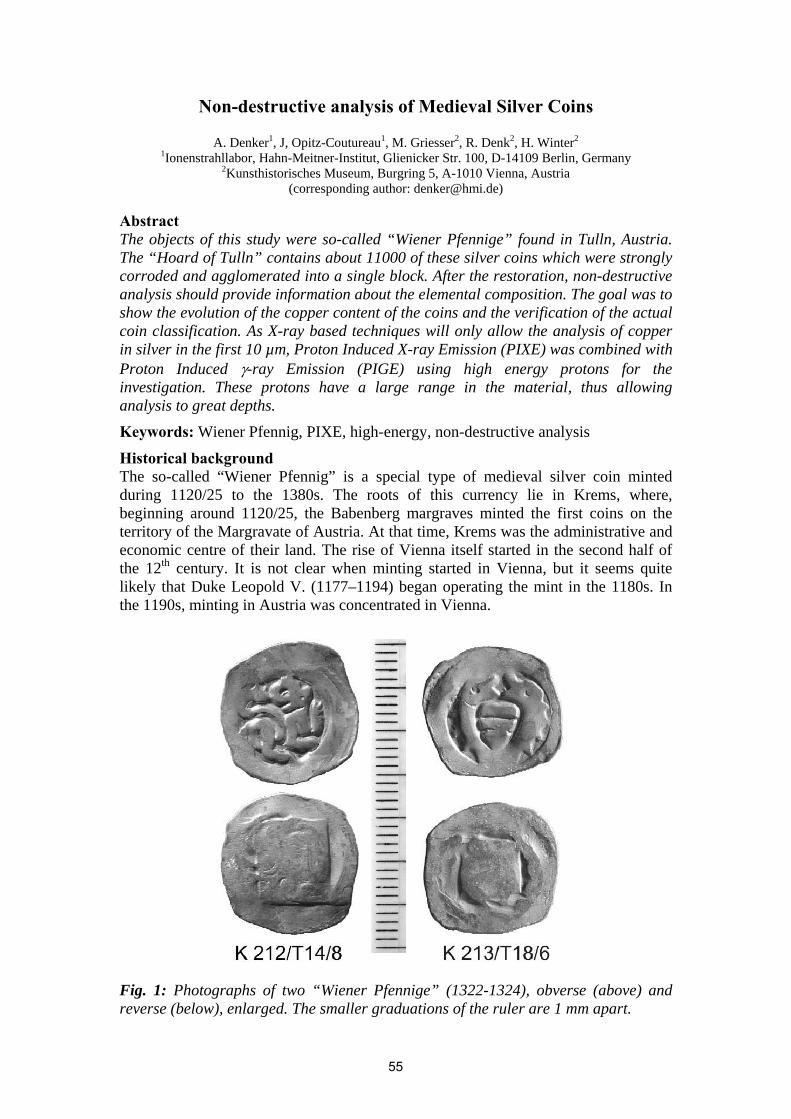
Non-destructive analysis of Medieval Silver Coins
A. Denker1, J, Opitz-Coutureau1, M. Griesser2, R. Denk2, H. Winter2 1Ionenstrahllabor, Hahn-Meitner-Institut, Glienicker Str. 100, D-14109 Berlin, Germany
2Kunsthistorisches Museum, Burgring 5, A-1010 Vienna, Austria (corresponding author: [email protected])
Abstract The objects of this study were so-called “Wiener Pfennige” found in Tulln, Austria. The “Hoard of Tulln” contains about 11000 of these silver coins which were strongly corroded and agglomerated into a single block. After the restoration, non-destructive analysis should provide information about the elemental composition. The goal was to show the evolution of the copper content of the coins and the verification of the actual coin classification. As X-ray based techniques will only allow the analysis of copper in silver in the first 10 µm, Proton Induced X-ray Emission (PIXE) was combined with Proton Induced γ-ray Emission (PIGE) using high energy protons for the investigation. These protons have a large range in the material, thus allowing analysis to great depths.
Keywords: Wiener Pfennig, PIXE, high-energy, non-destructive analysis
Historical background The so-called “Wiener Pfennig” is a special type of medieval silver coin minted during 1120/25 to the 1380s. The roots of this currency lie in Krems, where, beginning around 1120/25, the Babenberg margraves minted the first coins on the territory of the Margravate of Austria. At that time, Krems was the administrative and economic centre of their land. The rise of Vienna itself started in the second half of the 12th century. It is not clear when minting started in Vienna, but it seems quite likely that Duke Leopold V. (1177–1194) began operating the mint in the 1180s. In the 1190s, minting in Austria was concentrated in Vienna.
Fig. 1: Photographs of two “Wiener Pfennige” (1322-1324), obverse (above) and reverse (below), enlarged. The smaller graduations of the ruler are 1 mm apart.
55
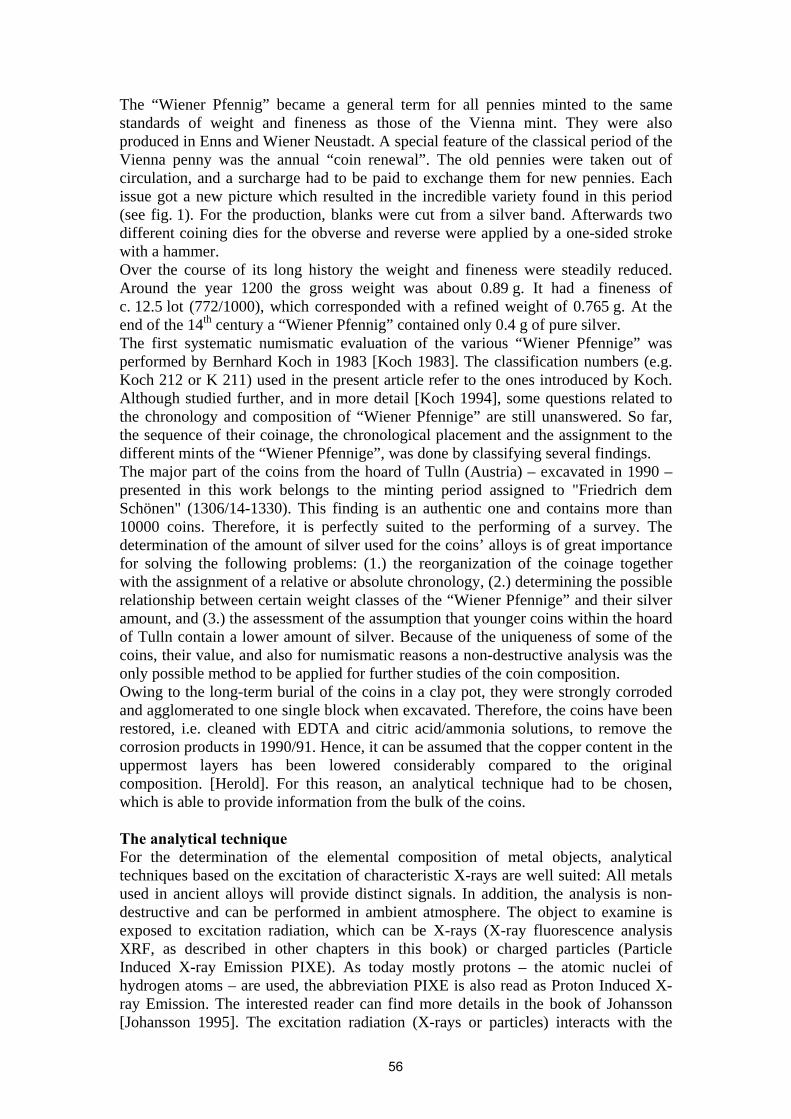
The “Wiener Pfennig” became a general term for all pennies minted to the same standards of weight and fineness as those of the Vienna mint. They were also produced in Enns and Wiener Neustadt. A special feature of the classical period of the Vienna penny was the annual “coin renewal”. The old pennies were taken out of circulation, and a surcharge had to be paid to exchange them for new pennies. Each issue got a new picture which resulted in the incredible variety found in this period (see fig. 1). For the production, blanks were cut from a silver band. Afterwards two different coining dies for the obverse and reverse were applied by a one-sided stroke with a hammer. Over the course of its long history the weight and fineness were steadily reduced. Around the year 1200 the gross weight was about 0.89 g. It had a fineness of c. 12.5 lot (772/1000), which corresponded with a refined weight of 0.765 g. At the end of the 14th century a “Wiener Pfennig” contained only 0.4 g of pure silver. The first systematic numismatic evaluation of the various “Wiener Pfennige” was performed by Bernhard Koch in 1983 [Koch 1983]. The classification numbers (e.g. Koch 212 or K 211) used in the present article refer to the ones introduced by Koch. Although studied further, and in more detail [Koch 1994], some questions related to the chronology and composition of “Wiener Pfennige” are still unanswered. So far, the sequence of their coinage, the chronological placement and the assignment to the different mints of the “Wiener Pfennige”, was done by classifying several findings. The major part of the coins from the hoard of Tulln (Austria) – excavated in 1990 – presented in this work belongs to the minting period assigned to "Friedrich dem Schönen" (1306/14-1330). This finding is an authentic one and contains more than 10000 coins. Therefore, it is perfectly suited to the performing of a survey. The determination of the amount of silver used for the coins’ alloys is of great importance for solving the following problems: (1.) the reorganization of the coinage together with the assignment of a relative or absolute chronology, (2.) determining the possible relationship between certain weight classes of the “Wiener Pfennige” and their silver amount, and (3.) the assessment of the assumption that younger coins within the hoard of Tulln contain a lower amount of silver. Because of the uniqueness of some of the coins, their value, and also for numismatic reasons a non-destructive analysis was the only possible method to be applied for further studies of the coin composition. Owing to the long-term burial of the coins in a clay pot, they were strongly corroded and agglomerated to one single block when excavated. Therefore, the coins have been restored, i.e. cleaned with EDTA and citric acid/ammonia solutions, to remove the corrosion products in 1990/91. Hence, it can be assumed that the copper content in the uppermost layers has been lowered considerably compared to the original composition. [Herold]. For this reason, an analytical technique had to be chosen, which is able to provide information from the bulk of the coins. The analytical technique For the determination of the elemental composition of metal objects, analytical techniques based on the excitation of characteristic X-rays are well suited: All metals used in ancient alloys will provide distinct signals. In addition, the analysis is non-destructive and can be performed in ambient atmosphere. The object to examine is exposed to excitation radiation, which can be X-rays (X-ray fluorescence analysis XRF, as described in other chapters in this book) or charged particles (Particle Induced X-ray Emission PIXE). As today mostly protons – the atomic nuclei of hydrogen atoms – are used, the abbreviation PIXE is also read as Proton Induced X-ray Emission. The interested reader can find more details in the book of Johansson [Johansson 1995]. The excitation radiation (X-rays or particles) interacts with the
56
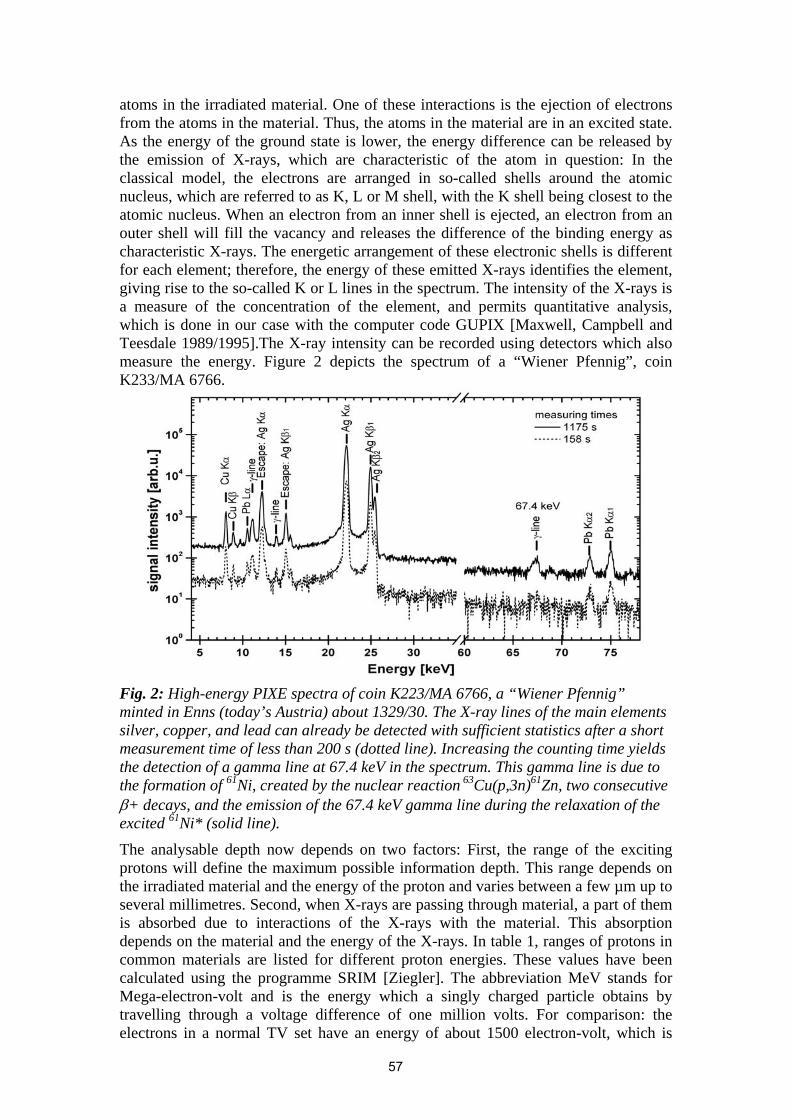
atoms in the irradiated material. One of these interactions is the ejection of electrons from the atoms in the material. Thus, the atoms in the material are in an excited state. As the energy of the ground state is lower, the energy difference can be released by the emission of X-rays, which are characteristic of the atom in question: In the classical model, the electrons are arranged in so-called shells around the atomic nucleus, which are referred to as K, L or M shell, with the K shell being closest to the atomic nucleus. When an electron from an inner shell is ejected, an electron from an outer shell will fill the vacancy and releases the difference of the binding energy as characteristic X-rays. The energetic arrangement of these electronic shells is different for each element; therefore, the energy of these emitted X-rays identifies the element, giving rise to the so-called K or L lines in the spectrum. The intensity of the X-rays is a measure of the concentration of the element, and permits quantitative analysis, which is done in our case with the computer code GUPIX [Maxwell, Campbell and Teesdale 1989/1995].The X-ray intensity can be recorded using detectors which also measure the energy. Figure 2 depicts the spectrum of a “Wiener Pfennig”, coin K233/MA 6766.
Fig. 2: High-energy PIXE spectra of coin K223/MA 6766, a “Wiener Pfennig” minted in Enns (today’s Austria) about 1329/30. The X-ray lines of the main elements silver, copper, and lead can already be detected with sufficient statistics after a short measurement time of less than 200 s (dotted line). Increasing the counting time yields the detection of a gamma line at 67.4 keV in the spectrum. This gamma line is due to the formation of 61Ni, created by the nuclear reaction 63Cu(p,3n)61Zn, two consecutive β+ decays, and the emission of the 67.4 keV gamma line during the relaxation of the excited 61Ni* (solid line).
The analysable depth now depends on two factors: First, the range of the exciting protons will define the maximum possible information depth. This range depends on the irradiated material and the energy of the proton and varies between a few µm up to several millimetres. Second, when X-rays are passing through material, a part of them is absorbed due to interactions of the X-rays with the material. This absorption depends on the material and the energy of the X-rays. In table 1, ranges of protons in common materials are listed for different proton energies. These values have been calculated using the programme SRIM [Ziegler]. The abbreviation MeV stands for Mega-electron-volt and is the energy which a singly charged particle obtains by travelling through a voltage difference of one million volts. For comparison: the electrons in a normal TV set have an energy of about 1500 electron-volt, which is
57
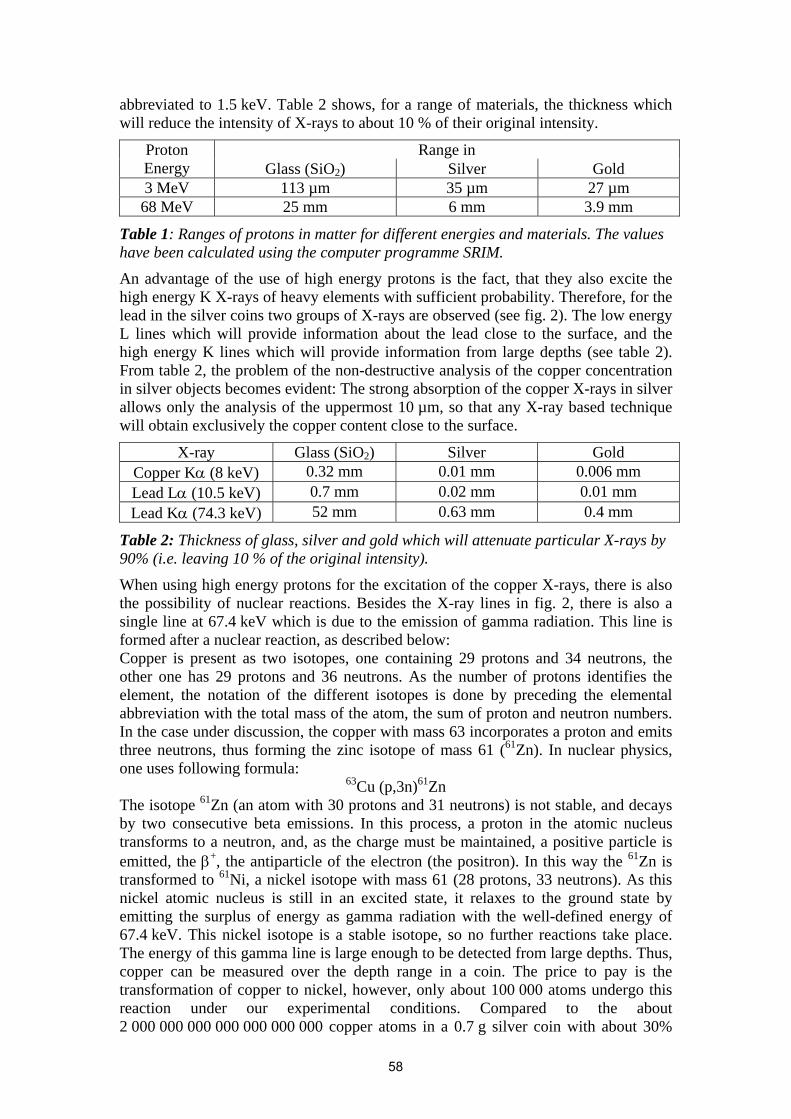
abbreviated to 1.5 keV. Table 2 shows, for a range of materials, the thickness which will reduce the intensity of X-rays to about 10 % of their original intensity.
Range in Proton Energy Glass (SiO2) Silver Gold 3 MeV 113 µm 35 µm 27 µm 68 MeV 25 mm 6 mm 3.9 mm
Table 1: Ranges of protons in matter for different energies and materials. The values have been calculated using the computer programme SRIM.
An advantage of the use of high energy protons is the fact, that they also excite the high energy K X-rays of heavy elements with sufficient probability. Therefore, for the lead in the silver coins two groups of X-rays are observed (see fig. 2). The low energy L lines which will provide information about the lead close to the surface, and the high energy K lines which will provide information from large depths (see table 2). From table 2, the problem of the non-destructive analysis of the copper concentration in silver objects becomes evident: The strong absorption of the copper X-rays in silver allows only the analysis of the uppermost 10 µm, so that any X-ray based technique will obtain exclusively the copper content close to the surface.
X-ray Glass (SiO2) Silver Gold Copper Kα (8 keV) 0.32 mm 0.01 mm 0.006 mm Lead Lα (10.5 keV) 0.7 mm 0.02 mm 0.01 mm Lead Kα (74.3 keV) 52 mm 0.63 mm 0.4 mm
Table 2: Thickness of glass, silver and gold which will attenuate particular X-rays by 90% (i.e. leaving 10 % of the original intensity).
When using high energy protons for the excitation of the copper X-rays, there is also the possibility of nuclear reactions. Besides the X-ray lines in fig. 2, there is also a single line at 67.4 keV which is due to the emission of gamma radiation. This line is formed after a nuclear reaction, as described below: Copper is present as two isotopes, one containing 29 protons and 34 neutrons, the other one has 29 protons and 36 neutrons. As the number of protons identifies the element, the notation of the different isotopes is done by preceding the elemental abbreviation with the total mass of the atom, the sum of proton and neutron numbers. In the case under discussion, the copper with mass 63 incorporates a proton and emits three neutrons, thus forming the zinc isotope of mass 61 (61Zn). In nuclear physics, one uses following formula:
63Cu (p,3n)61Zn The isotope 61Zn (an atom with 30 protons and 31 neutrons) is not stable, and decays by two consecutive beta emissions. In this process, a proton in the atomic nucleus transforms to a neutron, and, as the charge must be maintained, a positive particle is emitted, the β+, the antiparticle of the electron (the positron). In this way the 61Zn is transformed to 61Ni, a nickel isotope with mass 61 (28 protons, 33 neutrons). As this nickel atomic nucleus is still in an excited state, it relaxes to the ground state by emitting the surplus of energy as gamma radiation with the well-defined energy of 67.4 keV. This nickel isotope is a stable isotope, so no further reactions take place. The energy of this gamma line is large enough to be detected from large depths. Thus, copper can be measured over the depth range in a coin. The price to pay is the transformation of copper to nickel, however, only about 100 000 atoms undergo this reaction under our experimental conditions. Compared to the about 2 000 000 000 000 000 000 000 copper atoms in a 0.7 g silver coin with about 30%
58
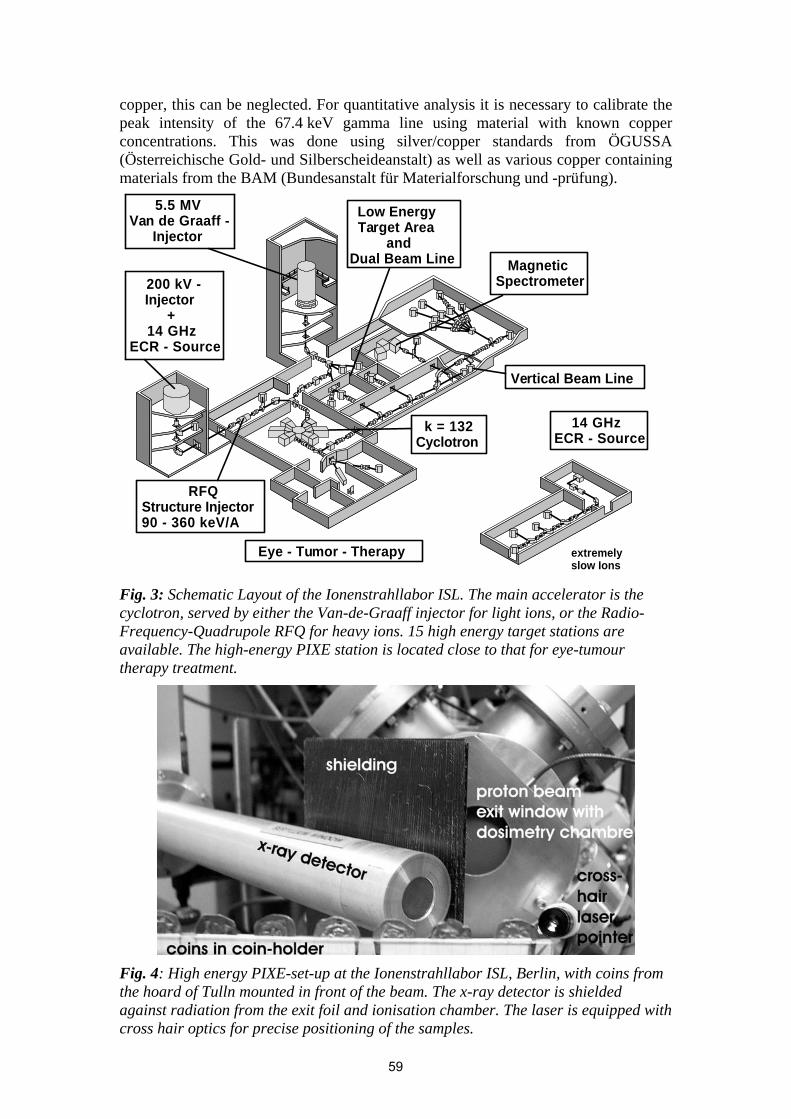
copper, this can be neglected. For quantitative analysis it is necessary to calibrate the peak intensity of the 67.4 keV gamma line using material with known copper concentrations. This was done using silver/copper standards from ÖGUSSA (Österreichische Gold- und Silberscheideanstalt) as well as various copper containing materials from the BAM (Bundesanstalt für Materialforschung und -prüfung).
MagneticSpectrometer
Low Energy Target Area andDual Beam Line
extremelyslow Ions
5.5 MVVan de Graaff - Injector
200 kV - Injector + 14 GHzECR - Source
RFQStructure Injector90 - 360 keV/A
Eye - Tumor - Therapy
k = 132Cyclotron
14 GHzECR - Source
Vertical Beam Line
Fig. 3: Schematic Layout of the Ionenstrahllabor ISL. The main accelerator is the cyclotron, served by either the Van-de-Graaff injector for light ions, or the Radio-Frequency-Quadrupole RFQ for heavy ions. 15 high energy target stations are available. The high-energy PIXE station is located close to that for eye-tumour therapy treatment.
Fig. 4: High energy PIXE-set-up at the Ionenstrahllabor ISL, Berlin, with coins from the hoard of Tulln mounted in front of the beam. The x-ray detector is shielded against radiation from the exit foil and ionisation chamber. The laser is equipped with cross hair optics for precise positioning of the samples.
59
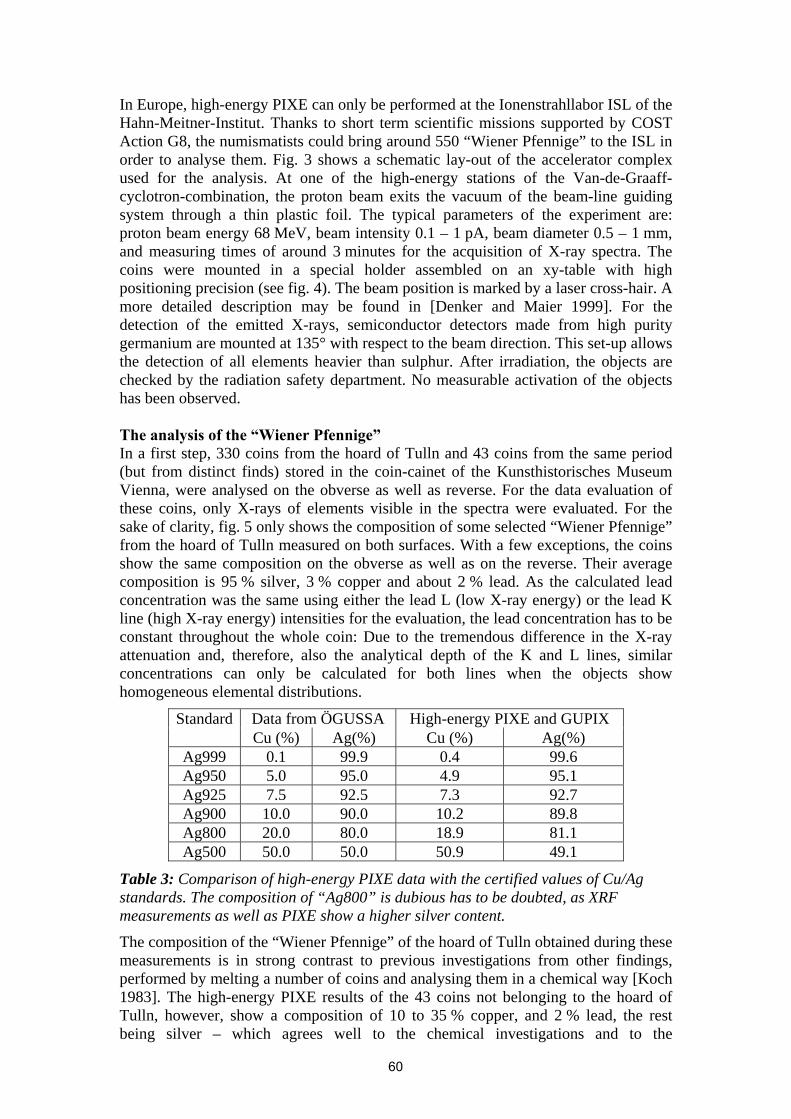
In Europe, high-energy PIXE can only be performed at the Ionenstrahllabor ISL of the Hahn-Meitner-Institut. Thanks to short term scientific missions supported by COST Action G8, the numismatists could bring around 550 “Wiener Pfennige” to the ISL in order to analyse them. Fig. 3 shows a schematic lay-out of the accelerator complex used for the analysis. At one of the high-energy stations of the Van-de-Graaff-cyclotron-combination, the proton beam exits the vacuum of the beam-line guiding system through a thin plastic foil. The typical parameters of the experiment are: proton beam energy 68 MeV, beam intensity 0.1 – 1 pA, beam diameter 0.5 – 1 mm, and measuring times of around 3 minutes for the acquisition of X-ray spectra. The coins were mounted in a special holder assembled on an xy-table with high positioning precision (see fig. 4). The beam position is marked by a laser cross-hair. A more detailed description may be found in [Denker and Maier 1999]. For the detection of the emitted X-rays, semiconductor detectors made from high purity germanium are mounted at 135° with respect to the beam direction. This set-up allows the detection of all elements heavier than sulphur. After irradiation, the objects are checked by the radiation safety department. No measurable activation of the objects has been observed. The analysis of the “Wiener Pfennige” In a first step, 330 coins from the hoard of Tulln and 43 coins from the same period (but from distinct finds) stored in the coin-cainet of the Kunsthistorisches Museum Vienna, were analysed on the obverse as well as reverse. For the data evaluation of these coins, only X-rays of elements visible in the spectra were evaluated. For the sake of clarity, fig. 5 only shows the composition of some selected “Wiener Pfennige” from the hoard of Tulln measured on both surfaces. With a few exceptions, the coins show the same composition on the obverse as well as on the reverse. Their average composition is 95 % silver, 3 % copper and about 2 % lead. As the calculated lead concentration was the same using either the lead L (low X-ray energy) or the lead K line (high X-ray energy) intensities for the evaluation, the lead concentration has to be constant throughout the whole coin: Due to the tremendous difference in the X-ray attenuation and, therefore, also the analytical depth of the K and L lines, similar concentrations can only be calculated for both lines when the objects show homogeneous elemental distributions.
Data from ÖGUSSA High-energy PIXE and GUPIX StandardCu (%) Ag(%) Cu (%) Ag(%)
Ag999 0.1 99.9 0.4 99.6 Ag950 5.0 95.0 4.9 95.1 Ag925 7.5 92.5 7.3 92.7 Ag900 10.0 90.0 10.2 89.8 Ag800 20.0 80.0 18.9 81.1 Ag500 50.0 50.0 50.9 49.1
Table 3: Comparison of high-energy PIXE data with the certified values of Cu/Ag standards. The composition of “Ag800” is dubious has to be doubted, as XRF measurements as well as PIXE show a higher silver content.
The composition of the “Wiener Pfennige” of the hoard of Tulln obtained during these measurements is in strong contrast to previous investigations from other findings, performed by melting a number of coins and analysing them in a chemical way [Koch 1983]. The high-energy PIXE results of the 43 coins not belonging to the hoard of Tulln, however, show a composition of 10 to 35 % copper, and 2 % lead, the rest being silver – which agrees well to the chemical investigations and to the
60
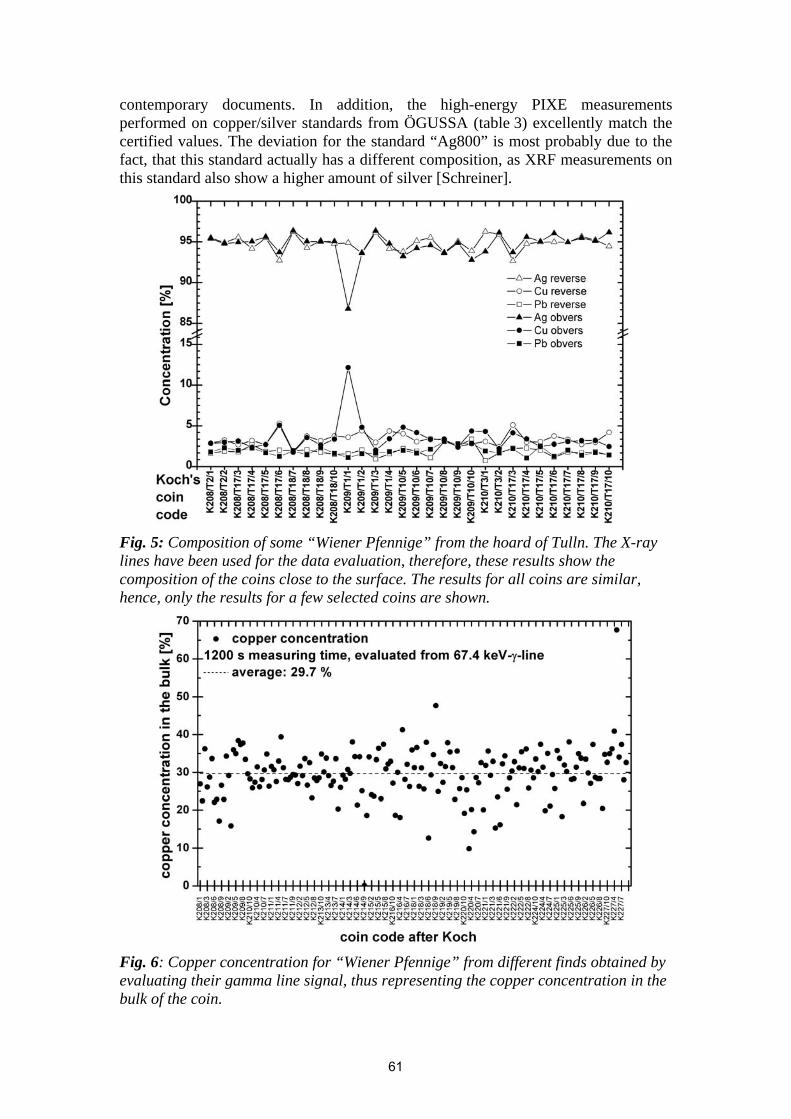
contemporary documents. In addition, the high-energy PIXE measurements performed on copper/silver standards from ÖGUSSA (table 3) excellently match the certified values. The deviation for the standard “Ag800” is most probably due to the fact, that this standard actually has a different composition, as XRF measurements on this standard also show a higher amount of silver [Schreiner].
Fig. 5: Composition of some “Wiener Pfennige” from the hoard of Tulln. The X-ray lines have been used for the data evaluation, therefore, these results show the composition of the coins close to the surface. The results for all coins are similar, hence, only the results for a few selected coins are shown.
Fig. 6: Copper concentration for “Wiener Pfennige” from different finds obtained by evaluating their gamma line signal, thus representing the copper concentration in the bulk of the coin.
61
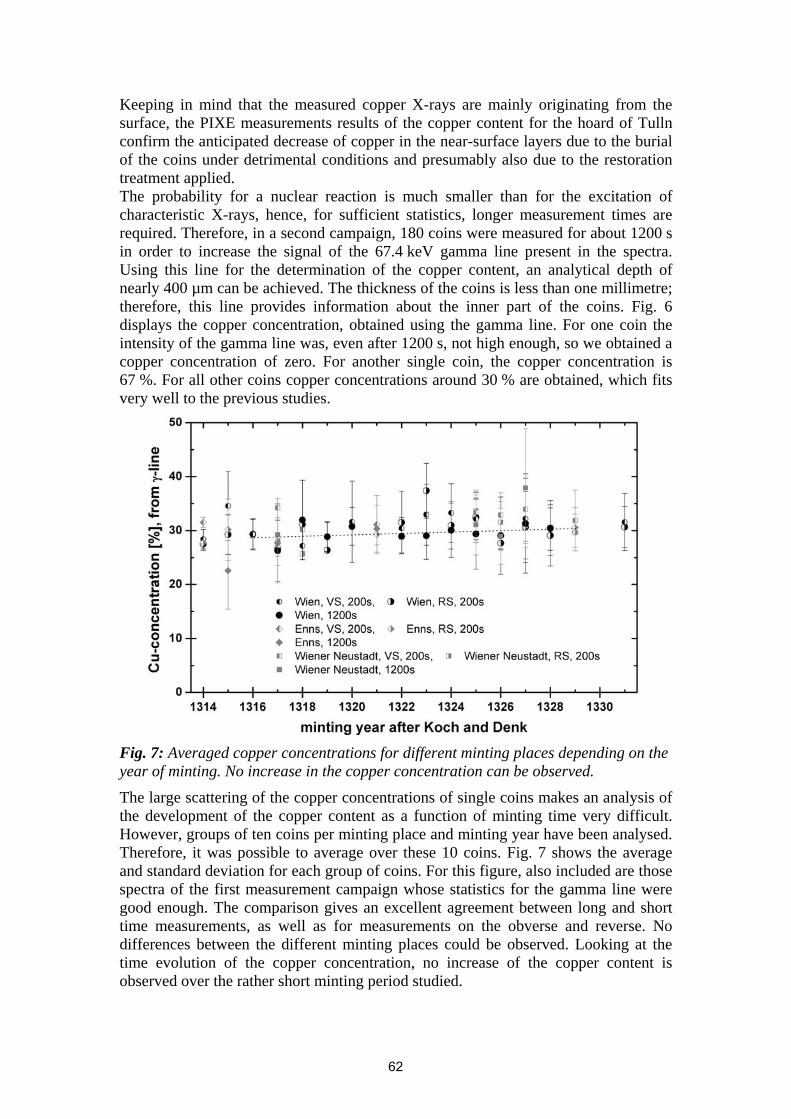
Keeping in mind that the measured copper X-rays are mainly originating from the surface, the PIXE measurements results of the copper content for the hoard of Tulln confirm the anticipated decrease of copper in the near-surface layers due to the burial of the coins under detrimental conditions and presumably also due to the restoration treatment applied. The probability for a nuclear reaction is much smaller than for the excitation of characteristic X-rays, hence, for sufficient statistics, longer measurement times are required. Therefore, in a second campaign, 180 coins were measured for about 1200 s in order to increase the signal of the 67.4 keV gamma line present in the spectra. Using this line for the determination of the copper content, an analytical depth of nearly 400 µm can be achieved. The thickness of the coins is less than one millimetre; therefore, this line provides information about the inner part of the coins. Fig. 6 displays the copper concentration, obtained using the gamma line. For one coin the intensity of the gamma line was, even after 1200 s, not high enough, so we obtained a copper concentration of zero. For another single coin, the copper concentration is 67 %. For all other coins copper concentrations around 30 % are obtained, which fits very well to the previous studies.
Fig. 7: Averaged copper concentrations for different minting places depending on the year of minting. No increase in the copper concentration can be observed.
The large scattering of the copper concentrations of single coins makes an analysis of the development of the copper content as a function of minting time very difficult. However, groups of ten coins per minting place and minting year have been analysed. Therefore, it was possible to average over these 10 coins. Fig. 7 shows the average and standard deviation for each group of coins. For this figure, also included are those spectra of the first measurement campaign whose statistics for the gamma line were good enough. The comparison gives an excellent agreement between long and short time measurements, as well as for measurements on the obverse and reverse. No differences between the different minting places could be observed. Looking at the time evolution of the copper concentration, no increase of the copper content is observed over the rather short minting period studied.
62
Conclusion The analysis of about 550 historical copper/silver coins, the so-called “Wiener Pfennige”, belonging to various finds, was only possible due to the non-destructiveness of the PIXE technique. High-energy PIXE is able to provide bulk information in a non-destructive way, without sampling or polishing, by evaluating the K X-ray lines of the heavy elements. Also for lighter elements, information about the composition in larger depths can be obtained utilizing nuclear reactions. Using the characteristic X-rays of the alloy elements, the average composition close to the surface was determined to be 95 % silver, 3 % copper and 2 % lead. The apprehension of the numismatists, that the composition of the coins belonging to the hoard of Tulln has been changed due to detrimental – strongly corrosive – burial conditions and the surface cleaning method applied during restoration, was confirmed. The use of the 67.4 keV gamma line allows the determination of the copper concentration in the bulk. The copper content of the “Wiener Pfennige” minted during the reign of “Friedrich dem Schönen” is in the order of 30 %. Contrary to the expectations of the numismatists, no considerable change in the coins composition, i.e. the decrease in the silver content, was observed. The assumption of a correlation between weight and different copper contents could not be confirmed. These findings now provide the basis of further numismatic considerations. Acknowledgements The authors would like to thank Prof. M. Schreiner from the Academy of Fine Arts, Vienna, and Dr. S. Merchel of the Bundesanstalt für Materialforschung und –prüfung, BAM, Berlin for lending the various standards. We are grateful for the help of C. Couzon during the beam times and the data evaluation. The idea for this work came up during a COST G8 workshop and was made possible by an STSM from the COST Action G8. References
• Koch, B. 1983. ‘Der Wiener Pfennig. Ein Kapitel aus der Periode der regionalen Pfennigmünze (Numismatische Zeitschrift 97)’, Wien
• Koch, B. 1994. ‘Corpus Nummorum Austriacorum’ (CNA), Band I Mittelalter, Wien
• Herold, K. ‘Konservierung eines Münzschatzfundes aus Tulln’ • Johansson, S.A. (Hrsg.), 1995. Particle-Induced X-Ray Emission Spectrometry
(PIXE), John Wiley & Sons. • Maxwell, J.A., Campbell, J.L., Teesdale, W.J. 1989. Nuclear Instruments and
Methothds B 43: 218 • Maxwell, J.A., Teesdale, W.J., Campbell, J.L. 1995. Nuclear Instruments and
Methods B 95: 407 • J. F. Ziegler, www.srim.org • Denker, A., Maier, K. H. 1999. Nuclear Instruments and Methods B 150: 118-
123. • Schreiner, M. private communication
63
Photon, Electron and Proton induced- X-rays: Powerful Tools for the Identification and the Characterisation of
Medieval Silver Coins
R. Linke1, M. Schreiner1, G. Demortier2 1 Institute of Humanities, Sciences and Technologies in Art, Academy of Fine Arts, Schillerplatz 3, A-
1010 Vienna, Austria 2 LARN, Facultés Universitaires Notre-Dame de la Paix, Rue de Bruxelles 61, B-5000 Namur, Belgium
(corresponding author: [email protected]) Abstract Photons, electrons and protons applied to the scientific investigation of archaeological materials provide complementary information for characterising the state of preservation and the provenance of the objects. Investigations were carried out on medieval silver and gold coins: silver coins known as ‘Tiroler Kreuzer’ belonging to the Kunsthistorisches Museum Vienna and the Oesterreichische Nationalbank. The techniques employed and briefly described in the experimental section were EDXRF, SEM/EDX, XRF induced by radioactive gamma-ray sources and PIXE. The PIXE results were obtained during a Short Term Scientific mission by one of us (R.L) in the LARN (Namur). The collaboration was extended to the accelerator team of Dresden and was probably the starting point for a Nuclear Physics group in Vienna to be involved in analytical research on archaeological objects. The results reported here outline advantages and disadvantages of these techniques when applied to corroded silver objects.
Keywords: non-destructive testing, photon irradiation, electron irradiation, proton irradiation, X-ray spectroscopy, electron microprobe, silver coins, traces of nickel, classification from elemental analysis
Introduction Coins are important objects in our heritage and are usually of high artistic and cultural value. The material (silver based alloys) used for their production has already been of interest for several centuries [Klaproth 1792/7] when the investigation of the chemical composition involved the dissolution of number of coins in nitric acid and development of wet chemical procedures for the quantitative separation of silver, lead, tin and copper. Modern non-destructive methods involving the irradiation of the samples with photons, electrons or protons do not require any sampling and are also able to check the surface corrosion. Although the iconography assists in finding answers to questions concerning dating, provenance, technology of production or authenticity, frequently, these questions may only be solved by means of scientific investigations. Apart from the identification of the composition, chemical analyses also enable a determination of the state of preservation and therefore the development and application of suitable treatments of conservation and restoration. Coins are usually of small size and sometimes of high value or even unique. Therefore, scientific investigations should be non-destructive, which implies that no original sample material (including patina) can be removed and that the object itself must not be permanently modified in any way during or after examination. Analytical studies were carried out on Austrian medieval silver ‘Tiroler Kreuzer’ coins in order to gain information regarding their provenance. The coins belong to the Kunsthistorisches Museum Vienna and the Oesterreichische Nationalbank. Apart from the main compositional elements which are silver and copper, silver coins from these periods usually contain minor and trace elements. These components originate
64
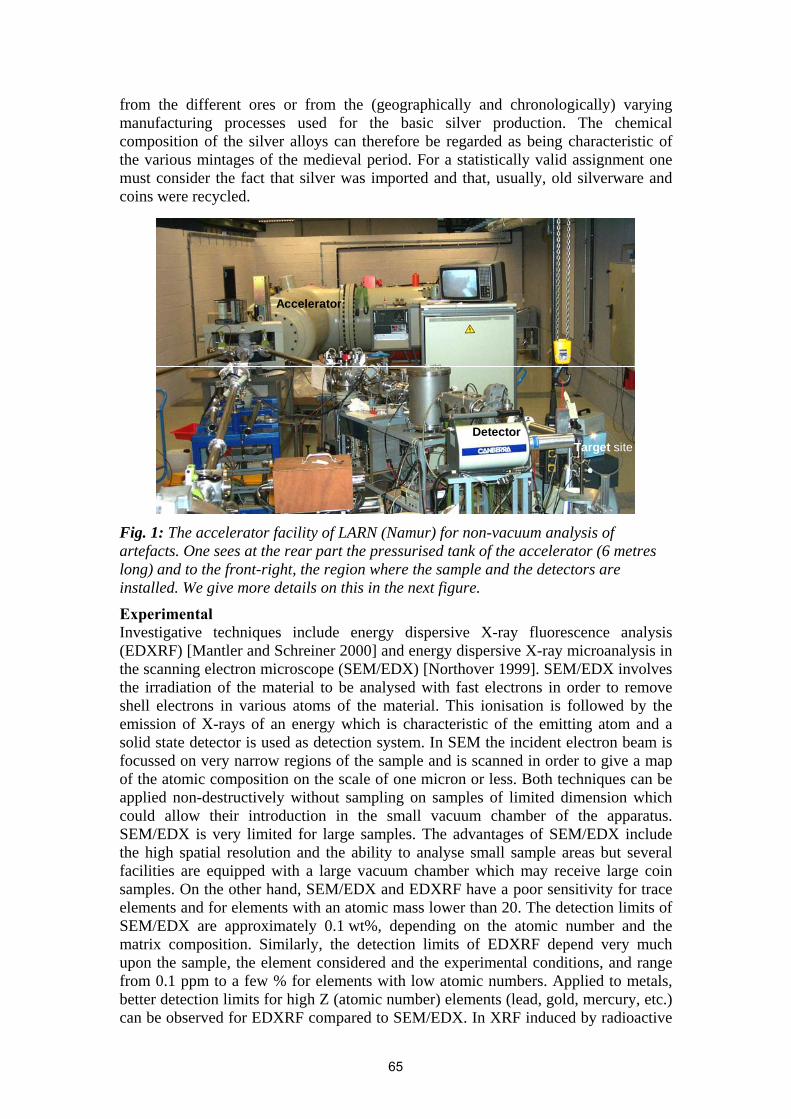
from the different ores or from the (geographically and chronologically) varying manufacturing processes used for the basic silver production. The chemical composition of the silver alloys can therefore be regarded as being characteristic of the various mintages of the medieval period. For a statistically valid assignment one must consider the fact that silver was imported and that, usually, old silverware and coins were recycled.
Accelerator
Target siteDetector
Fig. 1: The accelerator facility of LARN (Namur) for non-vacuum analysis of artefacts. One sees at the rear part the pressurised tank of the accelerator (6 metres long) and to the front-right, the region where the sample and the detectors are installed. We give more details on this in the next figure.
Experimental Investigative techniques include energy dispersive X-ray fluorescence analysis (EDXRF) [Mantler and Schreiner 2000] and energy dispersive X-ray microanalysis in the scanning electron microscope (SEM/EDX) [Northover 1999]. SEM/EDX involves the irradiation of the material to be analysed with fast electrons in order to remove shell electrons in various atoms of the material. This ionisation is followed by the emission of X-rays of an energy which is characteristic of the emitting atom and a solid state detector is used as detection system. In SEM the incident electron beam is focussed on very narrow regions of the sample and is scanned in order to give a map of the atomic composition on the scale of one micron or less. Both techniques can be applied non-destructively without sampling on samples of limited dimension which could allow their introduction in the small vacuum chamber of the apparatus. SEM/EDX is very limited for large samples. The advantages of SEM/EDX include the high spatial resolution and the ability to analyse small sample areas but several facilities are equipped with a large vacuum chamber which may receive large coin samples. On the other hand, SEM/EDX and EDXRF have a poor sensitivity for trace elements and for elements with an atomic mass lower than 20. The detection limits of SEM/EDX are approximately 0.1 wt%, depending on the atomic number and the matrix composition. Similarly, the detection limits of EDXRF depend very much upon the sample, the element considered and the experimental conditions, and range from 0.1 ppm to a few % for elements with low atomic numbers. Applied to metals, better detection limits for high Z (atomic number) elements (lead, gold, mercury, etc.) can be observed for EDXRF compared to SEM/EDX. In XRF induced by radioactive
65
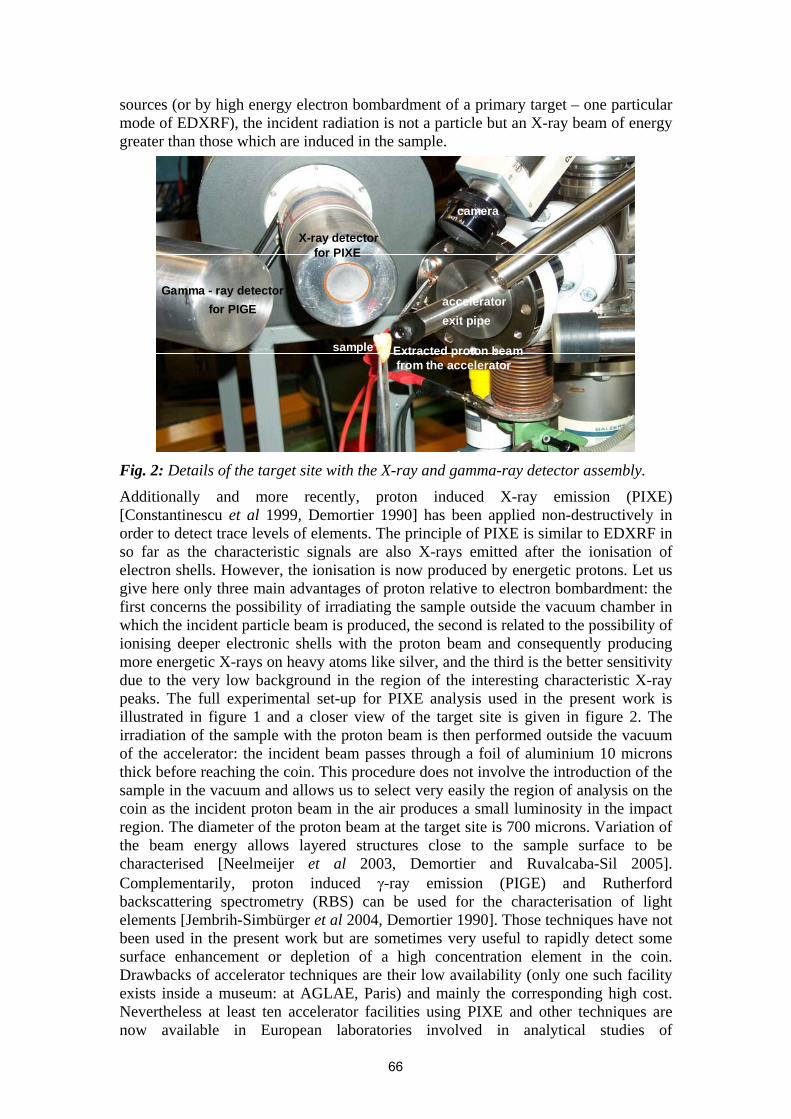
sources (or by high energy electron bombardment of a primary target – one particular mode of EDXRF), the incident radiation is not a particle but an X-ray beam of energy greater than those which are induced in the sample.
Gamma - ray detector
X-ray detector
sample
camera
for PIXE
for PIGE
Extracted proton beamfrom the accelerator
acceleratorexit pipe
Fig. 2: Details of the target site with the X-ray and gamma-ray detector assembly.
Additionally and more recently, proton induced X-ray emission (PIXE) [Constantinescu et al 1999, Demortier 1990] has been applied non-destructively in order to detect trace levels of elements. The principle of PIXE is similar to EDXRF in so far as the characteristic signals are also X-rays emitted after the ionisation of electron shells. However, the ionisation is now produced by energetic protons. Let us give here only three main advantages of proton relative to electron bombardment: the first concerns the possibility of irradiating the sample outside the vacuum chamber in which the incident particle beam is produced, the second is related to the possibility of ionising deeper electronic shells with the proton beam and consequently producing more energetic X-rays on heavy atoms like silver, and the third is the better sensitivity due to the very low background in the region of the interesting characteristic X-ray peaks. The full experimental set-up for PIXE analysis used in the present work is illustrated in figure 1 and a closer view of the target site is given in figure 2. The irradiation of the sample with the proton beam is then performed outside the vacuum of the accelerator: the incident beam passes through a foil of aluminium 10 microns thick before reaching the coin. This procedure does not involve the introduction of the sample in the vacuum and allows us to select very easily the region of analysis on the coin as the incident proton beam in the air produces a small luminosity in the impact region. The diameter of the proton beam at the target site is 700 microns. Variation of the beam energy allows layered structures close to the sample surface to be characterised [Neelmeijer et al 2003, Demortier and Ruvalcaba-Sil 2005]. Complementarily, proton induced γ-ray emission (PIGE) and Rutherford backscattering spectrometry (RBS) can be used for the characterisation of light elements [Jembrih-Simbürger et al 2004, Demortier 1990]. Those techniques have not been used in the present work but are sometimes very useful to rapidly detect some surface enhancement or depletion of a high concentration element in the coin. Drawbacks of accelerator techniques are their low availability (only one such facility exists inside a museum: at AGLAE, Paris) and mainly the corresponding high cost. Nevertheless at least ten accelerator facilities using PIXE and other techniques are now available in European laboratories involved in analytical studies of
66
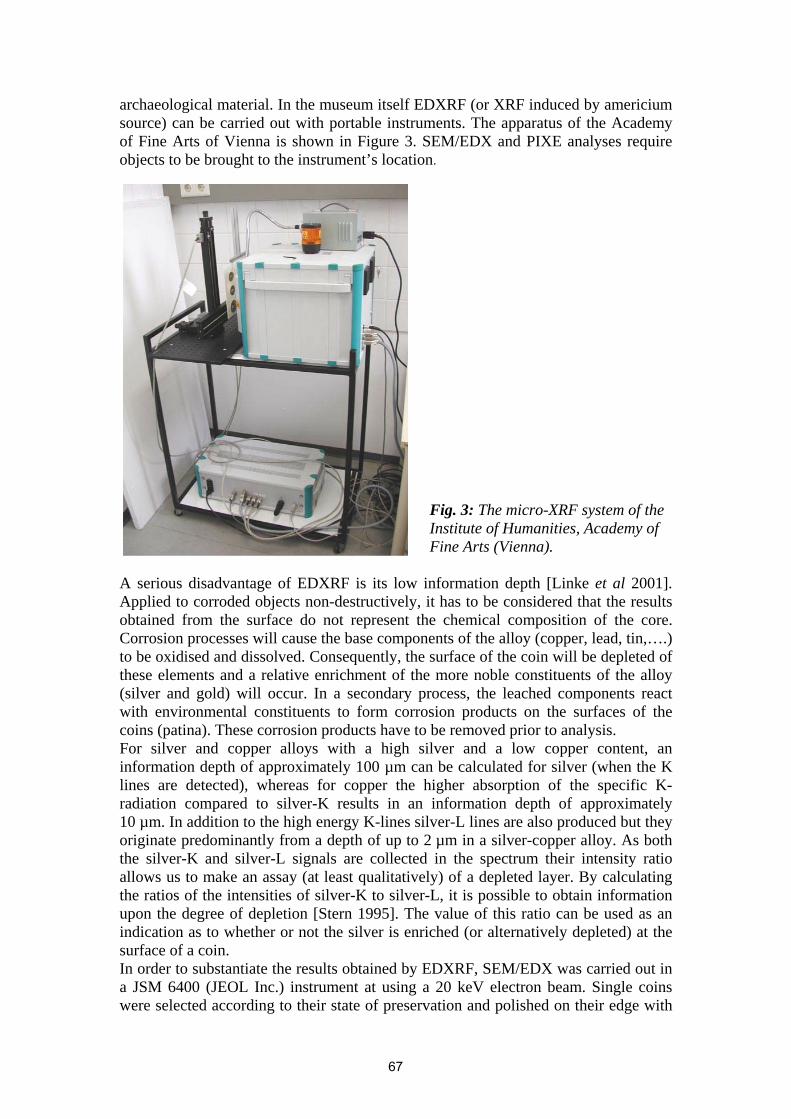
archaeological material. In the museum itself EDXRF (or XRF induced by americium source) can be carried out with portable instruments. The apparatus of the Academy of Fine Arts of Vienna is shown in Figure 3. SEM/EDX and PIXE analyses require objects to be brought to the instrument’s location.
Fig. 3: The micro-XRF system of the Institute of Humanities, Academy of Fine Arts (Vienna).
A serious disadvantage of EDXRF is its low information depth [Linke et al 2001]. Applied to corroded objects non-destructively, it has to be considered that the results obtained from the surface do not represent the chemical composition of the core. Corrosion processes will cause the base components of the alloy (copper, lead, tin,….) to be oxidised and dissolved. Consequently, the surface of the coin will be depleted of these elements and a relative enrichment of the more noble constituents of the alloy (silver and gold) will occur. In a secondary process, the leached components react with environmental constituents to form corrosion products on the surfaces of the coins (patina). These corrosion products have to be removed prior to analysis. For silver and copper alloys with a high silver and a low copper content, an information depth of approximately 100 µm can be calculated for silver (when the K lines are detected), whereas for copper the higher absorption of the specific K-radiation compared to silver-K results in an information depth of approximately 10 µm. In addition to the high energy K-lines silver-L lines are also produced but they originate predominantly from a depth of up to 2 µm in a silver-copper alloy. As both the silver-K and silver-L signals are collected in the spectrum their intensity ratio allows us to make an assay (at least qualitatively) of a depleted layer. By calculating the ratios of the intensities of silver-K to silver-L, it is possible to obtain information upon the degree of depletion [Stern 1995]. The value of this ratio can be used as an indication as to whether or not the silver is enriched (or alternatively depleted) at the surface of a coin. In order to substantiate the results obtained by EDXRF, SEM/EDX was carried out in a JSM 6400 (JEOL Inc.) instrument at using a 20 keV electron beam. Single coins were selected according to their state of preservation and polished on their edge with
67
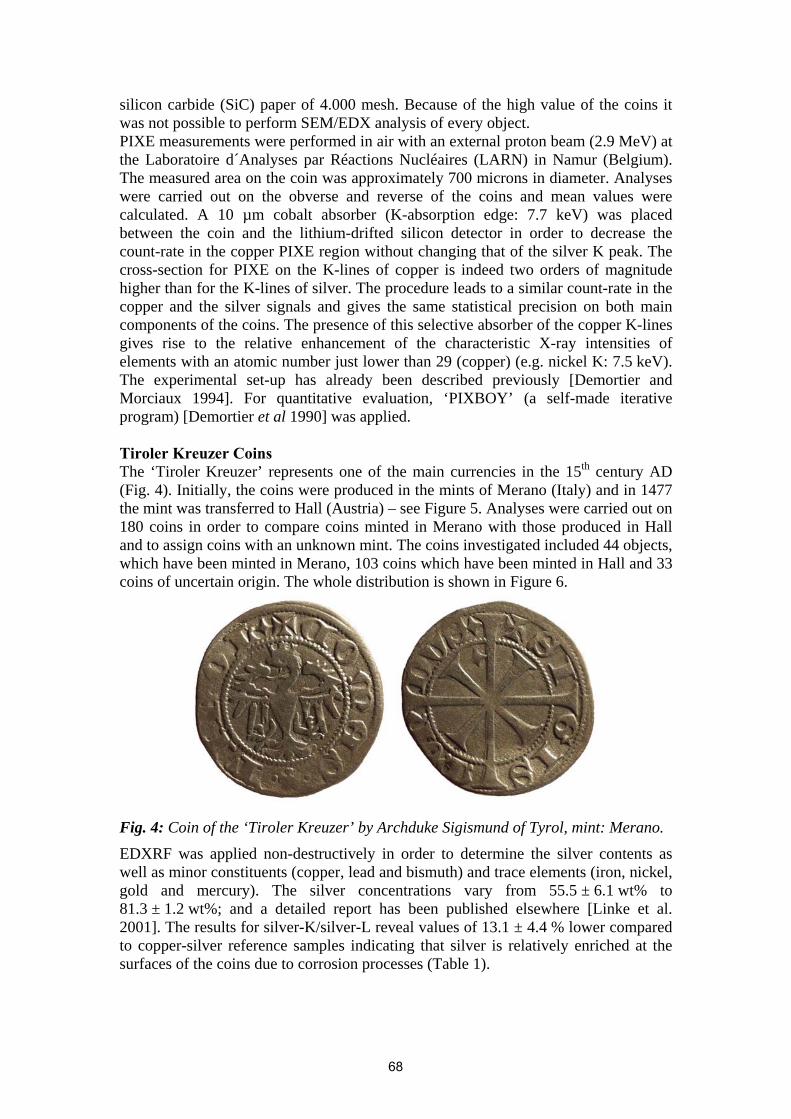
silicon carbide (SiC) paper of 4.000 mesh. Because of the high value of the coins it was not possible to perform SEM/EDX analysis of every object. PIXE measurements were performed in air with an external proton beam (2.9 MeV) at the Laboratoire d´Analyses par Réactions Nucléaires (LARN) in Namur (Belgium). The measured area on the coin was approximately 700 microns in diameter. Analyses were carried out on the obverse and reverse of the coins and mean values were calculated. A 10 µm cobalt absorber (K-absorption edge: 7.7 keV) was placed between the coin and the lithium-drifted silicon detector in order to decrease the count-rate in the copper PIXE region without changing that of the silver K peak. The cross-section for PIXE on the K-lines of copper is indeed two orders of magnitude higher than for the K-lines of silver. The procedure leads to a similar count-rate in the copper and the silver signals and gives the same statistical precision on both main components of the coins. The presence of this selective absorber of the copper K-lines gives rise to the relative enhancement of the characteristic X-ray intensities of elements with an atomic number just lower than 29 (copper) (e.g. nickel K: 7.5 keV). The experimental set-up has already been described previously [Demortier and Morciaux 1994]. For quantitative evaluation, ‘PIXBOY’ (a self-made iterative program) [Demortier et al 1990] was applied. Tiroler Kreuzer Coins The ‘Tiroler Kreuzer’ represents one of the main currencies in the 15th century AD (Fig. 4). Initially, the coins were produced in the mints of Merano (Italy) and in 1477 the mint was transferred to Hall (Austria) – see Figure 5. Analyses were carried out on 180 coins in order to compare coins minted in Merano with those produced in Hall and to assign coins with an unknown mint. The coins investigated included 44 objects, which have been minted in Merano, 103 coins which have been minted in Hall and 33 coins of uncertain origin. The whole distribution is shown in Figure 6.
Fig. 4: Coin of the ‘Tiroler Kreuzer’ by Archduke Sigismund of Tyrol, mint: Merano.
EDXRF was applied non-destructively in order to determine the silver contents as well as minor constituents (copper, lead and bismuth) and trace elements (iron, nickel, gold and mercury). The silver concentrations vary from 55.5 ± 6.1 wt% to 81.3 ± 1.2 wt%; and a detailed report has been published elsewhere [Linke et al. 2001]. The results for silver-K/silver-L reveal values of 13.1 ± 4.4 % lower compared to copper-silver reference samples indicating that silver is relatively enriched at the surfaces of the coins due to corrosion processes (Table 1).
68
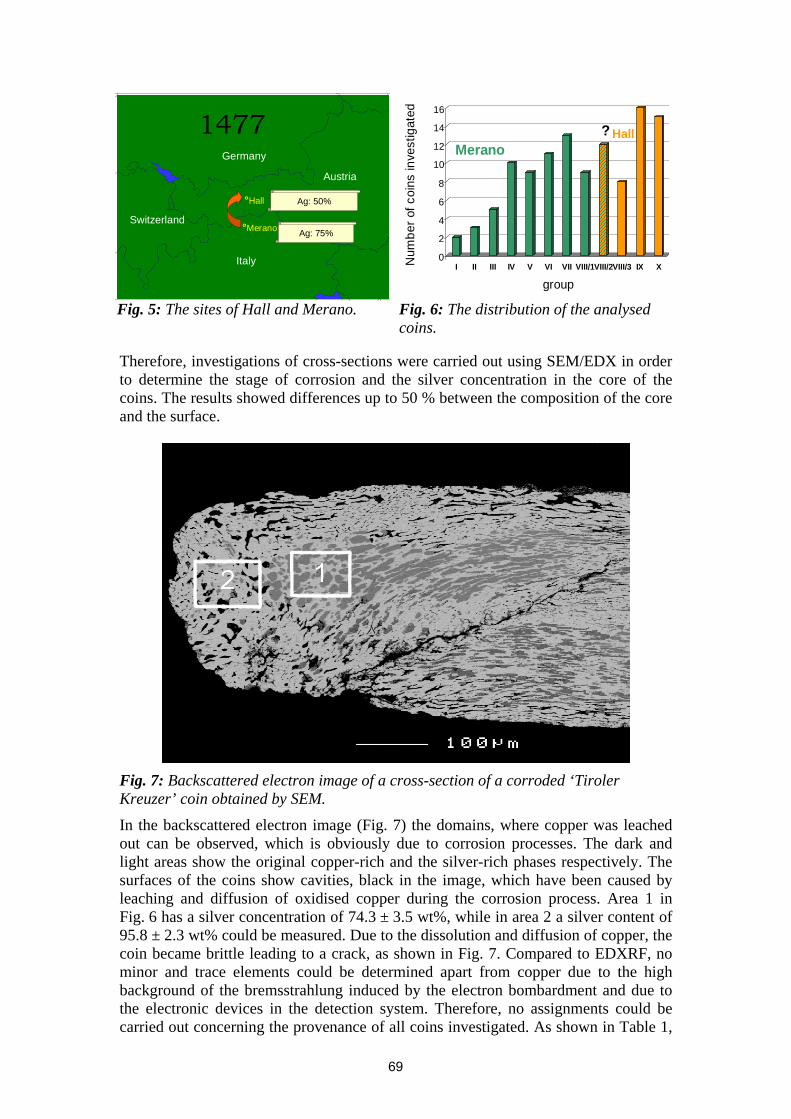
°Merano
°Hall
1477
Austria
Italy
Germany
SwitzerlandAg: 75%
Ag: 50%
Merano? Hall
0
2
4
6
8
10
12
14
16
I II III IV V VI VII VIII/1VIII/2VIII/3 IX X
group
Num
bero
f coi
nsin
vest
igat
ed
Fig. 5: The sites of Hall and Merano. Fig. 6: The distribution of the analysed
coins. Therefore, investigations of cross-sections were carried out using SEM/EDX in order to determine the stage of corrosion and the silver concentration in the core of the coins. The results showed differences up to 50 % between the composition of the core and the surface.
Fig. 7: Backscattered electron image of a cross-section of a corroded ‘Tiroler Kreuzer’ coin obtained by SEM.
In the backscattered electron image (Fig. 7) the domains, where copper was leached out can be observed, which is obviously due to corrosion processes. The dark and light areas show the original copper-rich and the silver-rich phases respectively. The surfaces of the coins show cavities, black in the image, which have been caused by leaching and diffusion of oxidised copper during the corrosion process. Area 1 in Fig. 6 has a silver concentration of 74.3 ± 3.5 wt%, while in area 2 a silver content of 95.8 ± 2.3 wt% could be measured. Due to the dissolution and diffusion of copper, the coin became brittle leading to a crack, as shown in Fig. 7. Compared to EDXRF, no minor and trace elements could be determined apart from copper due to the high background of the bremsstrahlung induced by the electron bombardment and due to the electronic devices in the detection system. Therefore, no assignments could be carried out concerning the provenance of all coins investigated. As shown in Table 1,
69
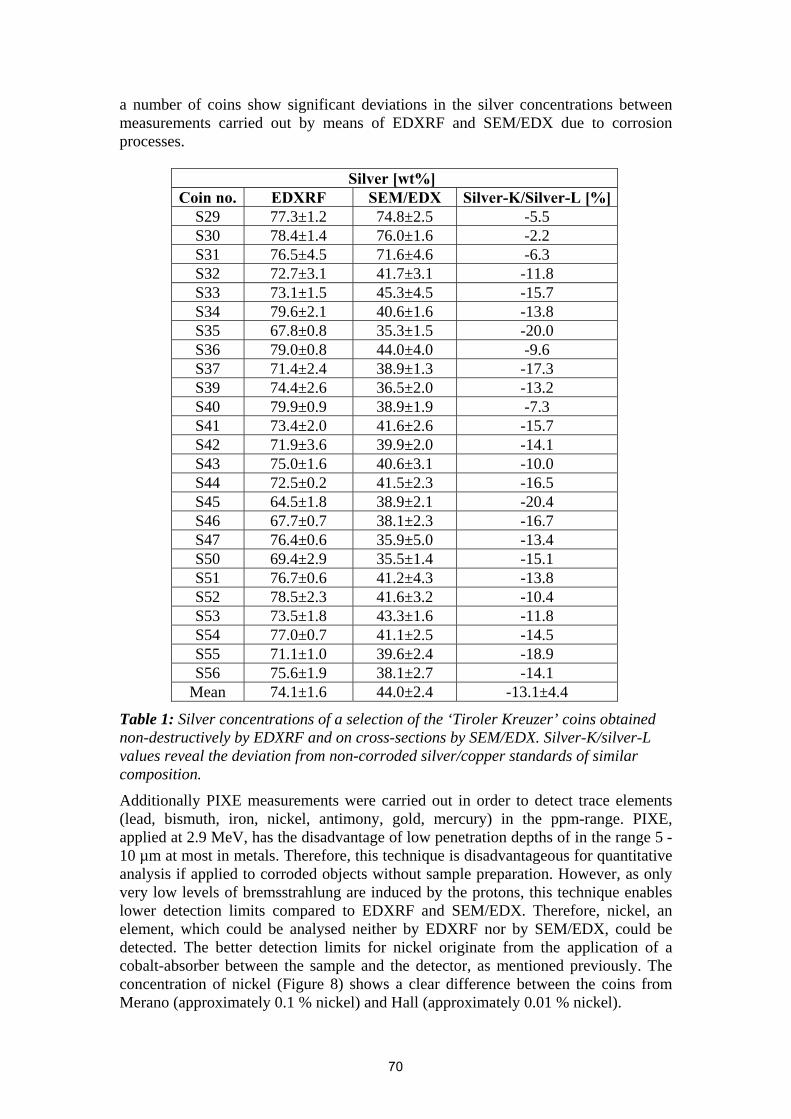
a number of coins show significant deviations in the silver concentrations between measurements carried out by means of EDXRF and SEM/EDX due to corrosion processes.
Silver [wt%]
Coin no. EDXRF SEM/EDX Silver-K/Silver-L [%] S29 77.3±1.2 74.8±2.5 -5.5 S30 78.4±1.4 76.0±1.6 -2.2 S31 76.5±4.5 71.6±4.6 -6.3 S32 72.7±3.1 41.7±3.1 -11.8 S33 73.1±1.5 45.3±4.5 -15.7 S34 79.6±2.1 40.6±1.6 -13.8 S35 67.8±0.8 35.3±1.5 -20.0 S36 79.0±0.8 44.0±4.0 -9.6 S37 71.4±2.4 38.9±1.3 -17.3 S39 74.4±2.6 36.5±2.0 -13.2 S40 79.9±0.9 38.9±1.9 -7.3 S41 73.4±2.0 41.6±2.6 -15.7 S42 71.9±3.6 39.9±2.0 -14.1 S43 75.0±1.6 40.6±3.1 -10.0 S44 72.5±0.2 41.5±2.3 -16.5 S45 64.5±1.8 38.9±2.1 -20.4 S46 67.7±0.7 38.1±2.3 -16.7 S47 76.4±0.6 35.9±5.0 -13.4 S50 69.4±2.9 35.5±1.4 -15.1 S51 76.7±0.6 41.2±4.3 -13.8 S52 78.5±2.3 41.6±3.2 -10.4 S53 73.5±1.8 43.3±1.6 -11.8 S54 77.0±0.7 41.1±2.5 -14.5 S55 71.1±1.0 39.6±2.4 -18.9 S56 75.6±1.9 38.1±2.7 -14.1
Mean 74.1±1.6 44.0±2.4 -13.1±4.4
Table 1: Silver concentrations of a selection of the ‘Tiroler Kreuzer’ coins obtained non-destructively by EDXRF and on cross-sections by SEM/EDX. Silver-K/silver-L values reveal the deviation from non-corroded silver/copper standards of similar composition.
Additionally PIXE measurements were carried out in order to detect trace elements (lead, bismuth, iron, nickel, antimony, gold, mercury) in the ppm-range. PIXE, applied at 2.9 MeV, has the disadvantage of low penetration depths of in the range 5 -10 µm at most in metals. Therefore, this technique is disadvantageous for quantitative analysis if applied to corroded objects without sample preparation. However, as only very low levels of bremsstrahlung are induced by the protons, this technique enables lower detection limits compared to EDXRF and SEM/EDX. Therefore, nickel, an element, which could be analysed neither by EDXRF nor by SEM/EDX, could be detected. The better detection limits for nickel originate from the application of a cobalt-absorber between the sample and the detector, as mentioned previously. The concentration of nickel (Figure 8) shows a clear difference between the coins from Merano (approximately 0.1 % nickel) and Hall (approximately 0.01 % nickel).
70
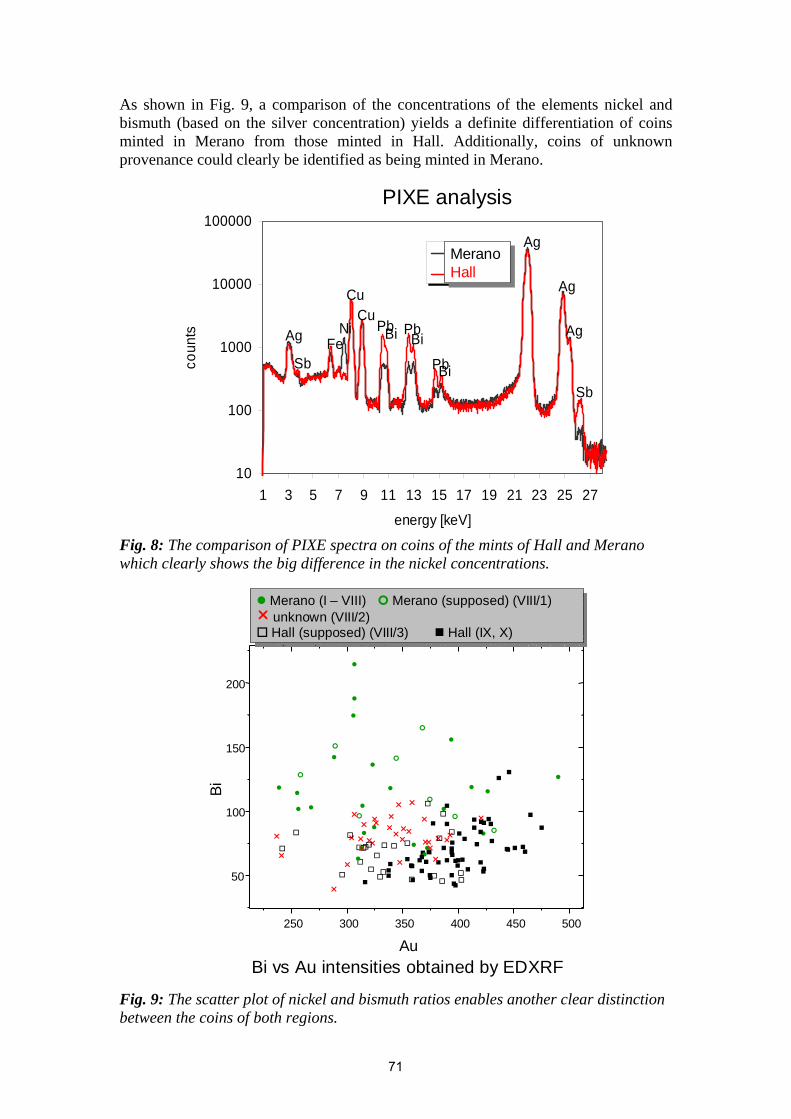
As shown in Fig. 9, a comparison of the concentrations of the elements nickel and bismuth (based on the silver concentration) yields a definite differentiation of coins minted in Merano from those minted in Hall. Additionally, coins of unknown provenance could clearly be identified as being minted in Merano.
PIXE analysis
Bi Bi
Ag
PbAg Pb
Cu
NiFe
Ag
Sb
Cu
PbBi
Ag
Sb
10
100
1000
10000
100000
1 3 5 7 9 11 13 15 17 19 21 23 25 27
energy [keV]
coun
ts
S30S53MeranoHall
MeranoHall
Fig. 8: The comparison of PIXE spectra on coins of the mints of Hall and Merano which clearly shows the big difference in the nickel concentrations.
Bi vs Au intensities obtained by EDXRF
250 300 350 400 450 500
50
100
150
200
r
r
r
r
r
r
r
r
r
rr
rr
r
r
r
r
rr
r
r
r
r
rr
r
rr
r
r
r
Bi
Au
Merano (I – VIII) Merano (supposed) (VIII/1)r unknown (VIII/2)
Hall (supposed) (VIII/3) Hall (IX, X)
Merano (I – VIII) Merano (supposed) (VIII/1)r unknown (VIII/2)
Hall (supposed) (VIII/3) Hall (IX, X)
Fig. 9: The scatter plot of nickel and bismuth ratios enables another clear distinction between the coins of both regions.
71
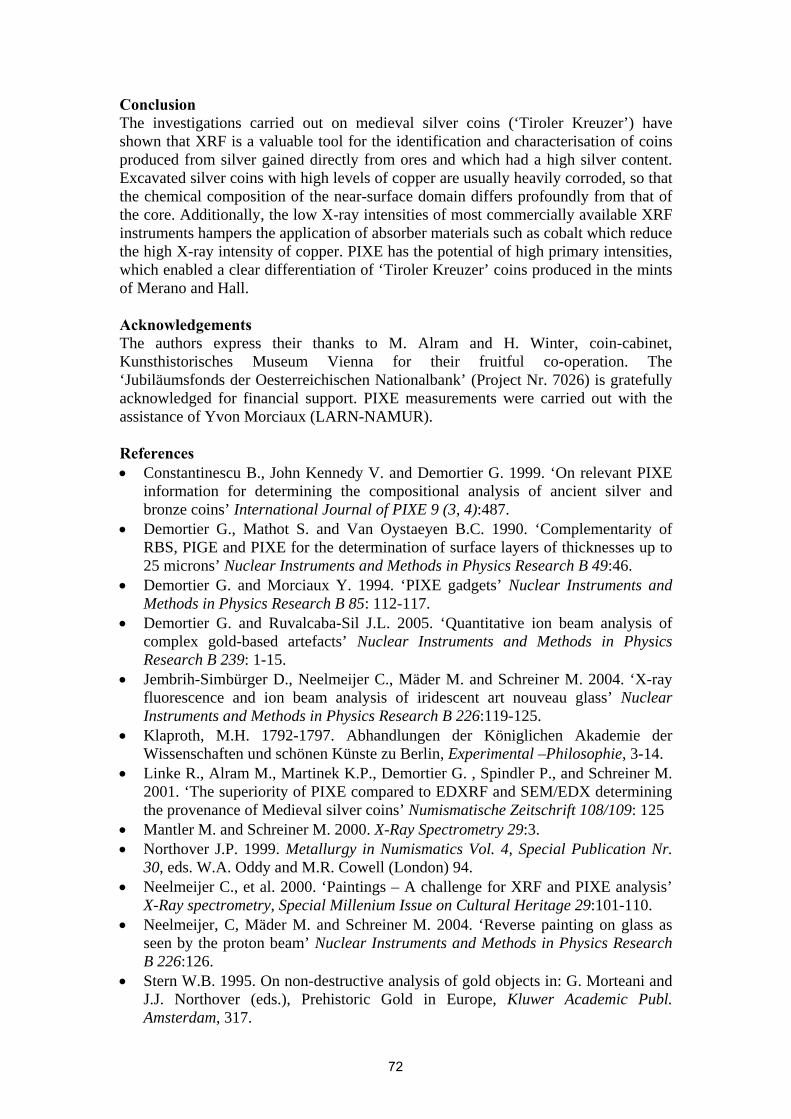
Conclusion The investigations carried out on medieval silver coins (‘Tiroler Kreuzer’) have shown that XRF is a valuable tool for the identification and characterisation of coins produced from silver gained directly from ores and which had a high silver content. Excavated silver coins with high levels of copper are usually heavily corroded, so that the chemical composition of the near-surface domain differs profoundly from that of the core. Additionally, the low X-ray intensities of most commercially available XRF instruments hampers the application of absorber materials such as cobalt which reduce the high X-ray intensity of copper. PIXE has the potential of high primary intensities, which enabled a clear differentiation of ‘Tiroler Kreuzer’ coins produced in the mints of Merano and Hall. Acknowledgements The authors express their thanks to M. Alram and H. Winter, coin-cabinet, Kunsthistorisches Museum Vienna for their fruitful co-operation. The ‘Jubiläumsfonds der Oesterreichischen Nationalbank’ (Project Nr. 7026) is gratefully acknowledged for financial support. PIXE measurements were carried out with the assistance of Yvon Morciaux (LARN-NAMUR). References • Constantinescu B., John Kennedy V. and Demortier G. 1999. ‘On relevant PIXE
information for determining the compositional analysis of ancient silver and bronze coins’ International Journal of PIXE 9 (3, 4):487.
• Demortier G., Mathot S. and Van Oystaeyen B.C. 1990. ‘Complementarity of RBS, PIGE and PIXE for the determination of surface layers of thicknesses up to 25 microns’ Nuclear Instruments and Methods in Physics Research B 49:46.
• Demortier G. and Morciaux Y. 1994. ‘PIXE gadgets’ Nuclear Instruments and Methods in Physics Research B 85: 112-117.
• Demortier G. and Ruvalcaba-Sil J.L. 2005. ‘Quantitative ion beam analysis of complex gold-based artefacts’ Nuclear Instruments and Methods in Physics Research B 239: 1-15.
• Jembrih-Simbürger D., Neelmeijer C., Mäder M. and Schreiner M. 2004. ‘X-ray fluorescence and ion beam analysis of iridescent art nouveau glass’ Nuclear Instruments and Methods in Physics Research B 226:119-125.
• Klaproth, M.H. 1792-1797. Abhandlungen der Königlichen Akademie der Wissenschaften und schönen Künste zu Berlin, Experimental –Philosophie, 3-14.
• Linke R., Alram M., Martinek K.P., Demortier G. , Spindler P., and Schreiner M. 2001. ‘The superiority of PIXE compared to EDXRF and SEM/EDX determining the provenance of Medieval silver coins’ Numismatische Zeitschrift 108/109: 125
• Mantler M. and Schreiner M. 2000. X-Ray Spectrometry 29:3. • Northover J.P. 1999. Metallurgy in Numismatics Vol. 4, Special Publication Nr.
30, eds. W.A. Oddy and M.R. Cowell (London) 94. • Neelmeijer C., et al. 2000. ‘Paintings – A challenge for XRF and PIXE analysis’
X-Ray spectrometry, Special Millenium Issue on Cultural Heritage 29:101-110. • Neelmeijer, C, Mäder M. and Schreiner M. 2004. ‘Reverse painting on glass as
seen by the proton beam’ Nuclear Instruments and Methods in Physics Research B 226:126.
• Stern W.B. 1995. On non-destructive analysis of gold objects in: G. Morteani and J.J. Northover (eds.), Prehistoric Gold in Europe, Kluwer Academic Publ. Amsterdam, 317.
72
Micro-PIXE studies on Visigothic ‘Pietroasa’ Gold Hoard
B. Constantinescu1, R. Bugoi1, V. Cojocaru1, D. Voiculescu1, D. Grambole2, F. Herrmann2, D. Ceccato3, T. Calligaro4, J. Salomon4, L. Pichon4, S. Röhrs4
1National Institute of Nuclear Physics and Engineering “Horia Hulubei”, PO BOX MG-6, Bucharest 077125, Romania
2Forschungszentrum Rossendorf, Institute for Ion Beam Physics and Materials Research, PO BOX 510119, D-01314 Dresden, Germany
3Istituto Nazionale di Fisica Nucleare, Laboratori Nazionali di Legnaro, Padova, Italy 4Laboratoire de Recherche et de Restauration des Musées de France, CNRS UMR 171, Palais du
Louvre, Paris CEDEX 01, France (corresponding author: [email protected])
Abstract Several fragments of ancient gold objects belonging to Pietroasa ‘Cloşca cu Puii de Aur (‘The Golden Brood Hen with Its Chickens’) Romanian hoard were analysed using micro-beam particle induced X-ray emission (micro-PIXE). The purpose of the study was to gain some more knowledge regarding the metal provenance by determining the presence of platinum group elements (PGE), high-temperature melting point trace elements (tantalum, niobium), as well as traces of tin and tellurium- at a micrometric scale. Several tantalum inclusions (micrometric areas of composition different from the surroundings) on three samples and iridium inclusions on other samples were found. Tin, an important fingerprint for ancient South European gold, was detected in two samples at trace level. No tellurium - the main fingerprint for Transylvanian gold - was found. The measurements led to some conclusions for the possible gold ore sources of Pietroasa treasury: the South-Ural Mountains, Nubia (Sudan) and/or Anatolian deposits and Roman imperial coins, but certainly not Transylvania. A remelting procedure for the gold used to manufacture these artifacts is very probable and must be also considered.
Keywords: micro-PIXE, gold, PGE, inclusions, provenance, archaeometry
Introduction The hoard of Pietroasa, Buzay county, Romania (today the village is named Pietroasele) was discovered in 1837 on the Istriţa hill by four villagers. At the time of the discovery, the hoard comprised 22 pieces, some adorned with gems. By the time the authorities heard about the finding of the hoard and decided to confiscate it, 10 pieces had already disappeared, most probably having been melted shortly after their discovery. What remains from the hoard today is a tray - cut in four by the villagers who shared the gold between them, a patera with representations of pagan (Germanic) gods, an octagonal basket, a dodecagonal basket, an oenochoe cup, some girdles and some fibulae. These remaining pieces of the hoard weigh about 19 kilogrammes. An evident characteristic of the hoard is its stylistic diversity, indicating different provenances (workshops). The patera and the oenochoe vessel were crafted in classical Hellenistic style. The other pieces are characterized by the insertion of gems into the body of the objects, a setting technique characteristic to the peoples of the Pontic steppe [Oprescu 1968]. Fibulae were used in antiquity as broaches or safety-pins for fastening garments - a substitute for buttons. Usual fibulae had a bow-shaped head and a pin. Some fibulae also had pendants. Oenochoe or oinochoe is a deep wine jug, with a graceful aspect, having a trefoil-shaped mouth in order to facilitate the pouring of wine. The name of this jug originates from the Greek word oinos meaning wine. A runic inscription on one of the girdles is worth mentioning: ‘Guthâni Ocwi Hailag’, translated as ‘to Odin blessed country’ or maybe ‘of the Goths sacred propriety am I’.
73
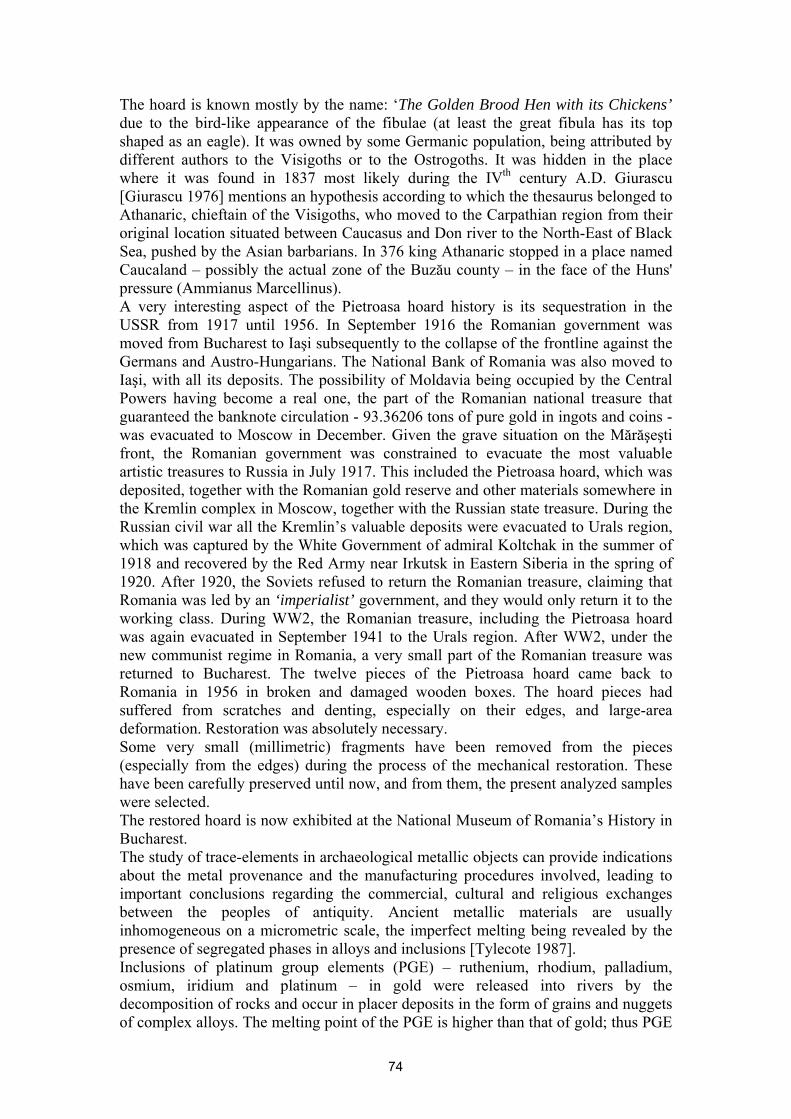
The hoard is known mostly by the name: ‘The Golden Brood Hen with its Chickens’ due to the bird-like appearance of the fibulae (at least the great fibula has its top shaped as an eagle). It was owned by some Germanic population, being attributed by different authors to the Visigoths or to the Ostrogoths. It was hidden in the place where it was found in 1837 most likely during the IVth century A.D. Giurascu [Giurascu 1976] mentions an hypothesis according to which the thesaurus belonged to Athanaric, chieftain of the Visigoths, who moved to the Carpathian region from their original location situated between Caucasus and Don river to the North-East of Black Sea, pushed by the Asian barbarians. In 376 king Athanaric stopped in a place named Caucaland – possibly the actual zone of the Buzău county – in the face of the Huns' pressure (Ammianus Marcellinus). A very interesting aspect of the Pietroasa hoard history is its sequestration in the USSR from 1917 until 1956. In September 1916 the Romanian government was moved from Bucharest to Iaşi subsequently to the collapse of the frontline against the Germans and Austro-Hungarians. The National Bank of Romania was also moved to Iaşi, with all its deposits. The possibility of Moldavia being occupied by the Central Powers having become a real one, the part of the Romanian national treasure that guaranteed the banknote circulation - 93.36206 tons of pure gold in ingots and coins - was evacuated to Moscow in December. Given the grave situation on the Mărăşeşti front, the Romanian government was constrained to evacuate the most valuable artistic treasures to Russia in July 1917. This included the Pietroasa hoard, which was deposited, together with the Romanian gold reserve and other materials somewhere in the Kremlin complex in Moscow, together with the Russian state treasure. During the Russian civil war all the Kremlin’s valuable deposits were evacuated to Urals region, which was captured by the White Government of admiral Koltchak in the summer of 1918 and recovered by the Red Army near Irkutsk in Eastern Siberia in the spring of 1920. After 1920, the Soviets refused to return the Romanian treasure, claiming that Romania was led by an ‘imperialist’ government, and they would only return it to the working class. During WW2, the Romanian treasure, including the Pietroasa hoard was again evacuated in September 1941 to the Urals region. After WW2, under the new communist regime in Romania, a very small part of the Romanian treasure was returned to Bucharest. The twelve pieces of the Pietroasa hoard came back to Romania in 1956 in broken and damaged wooden boxes. The hoard pieces had suffered from scratches and denting, especially on their edges, and large-area deformation. Restoration was absolutely necessary. Some very small (millimetric) fragments have been removed from the pieces (especially from the edges) during the process of the mechanical restoration. These have been carefully preserved until now, and from them, the present analyzed samples were selected. The restored hoard is now exhibited at the National Museum of Romania’s History in Bucharest. The study of trace-elements in archaeological metallic objects can provide indications about the metal provenance and the manufacturing procedures involved, leading to important conclusions regarding the commercial, cultural and religious exchanges between the peoples of antiquity. Ancient metallic materials are usually inhomogeneous on a micrometric scale, the imperfect melting being revealed by the presence of segregated phases in alloys and inclusions [Tylecote 1987]. Inclusions of platinum group elements (PGE) – ruthenium, rhodium, palladium, osmium, iridium and platinum – in gold were released into rivers by the decomposition of rocks and occur in placer deposits in the form of grains and nuggets of complex alloys. The melting point of the PGE is higher than that of gold; thus PGE
74
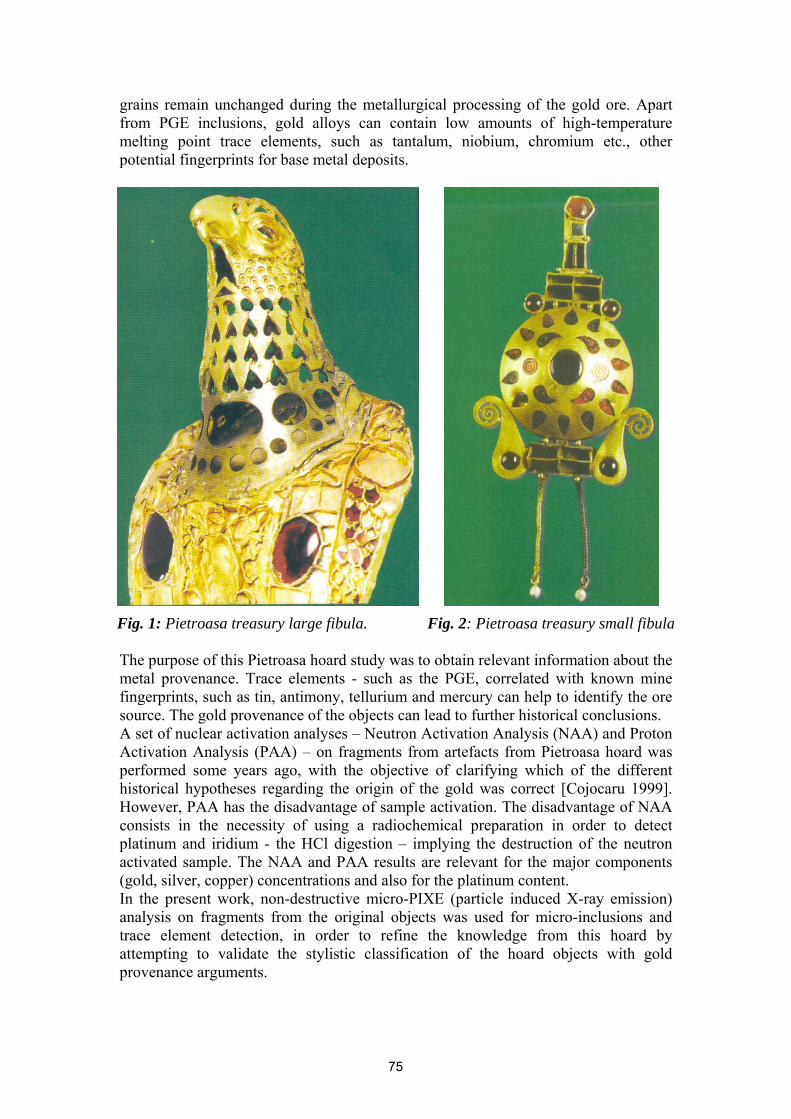
grains remain unchanged during the metallurgical processing of the gold ore. Apart from PGE inclusions, gold alloys can contain low amounts of high-temperature melting point trace elements, such as tantalum, niobium, chromium etc., other potential fingerprints for base metal deposits.
Fig. 1: Pietroasa treasury large fibula. Fig. 2: Pietroasa treasury small fibula The purpose of this Pietroasa hoard study was to obtain relevant information about the metal provenance. Trace elements - such as the PGE, correlated with known mine fingerprints, such as tin, antimony, tellurium and mercury can help to identify the ore source. The gold provenance of the objects can lead to further historical conclusions. A set of nuclear activation analyses – Neutron Activation Analysis (NAA) and Proton Activation Analysis (PAA) – on fragments from artefacts from Pietroasa hoard was performed some years ago, with the objective of clarifying which of the different historical hypotheses regarding the origin of the gold was correct [Cojocaru 1999]. However, PAA has the disadvantage of sample activation. The disadvantage of NAA consists in the necessity of using a radiochemical preparation in order to detect platinum and iridium - the HCl digestion – implying the destruction of the neutron activated sample. The NAA and PAA results are relevant for the major components (gold, silver, copper) concentrations and also for the platinum content. In the present work, non-destructive micro-PIXE (particle induced X-ray emission) analysis on fragments from the original objects was used for micro-inclusions and trace element detection, in order to refine the knowledge from this hoard by attempting to validate the stylistic classification of the hoard objects with gold provenance arguments.
75
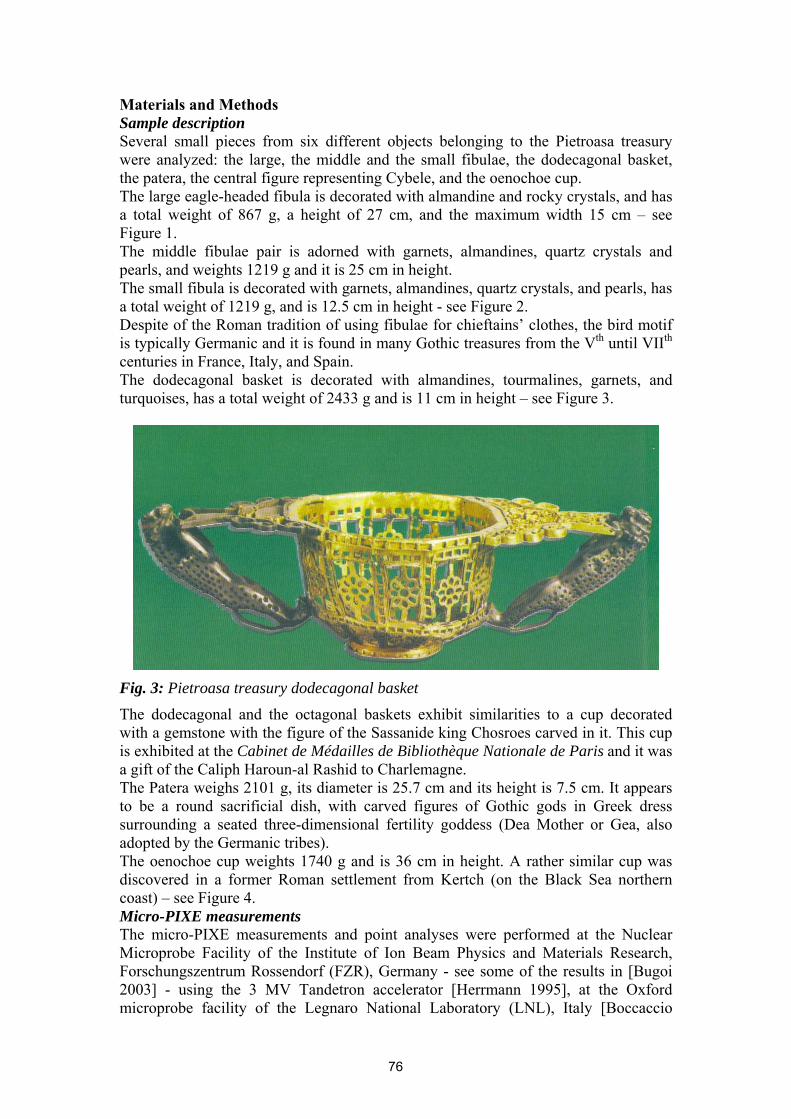
Materials and Methods Sample description Several small pieces from six different objects belonging to the Pietroasa treasury were analyzed: the large, the middle and the small fibulae, the dodecagonal basket, the patera, the central figure representing Cybele, and the oenochoe cup. The large eagle-headed fibula is decorated with almandine and rocky crystals, and has a total weight of 867 g, a height of 27 cm, and the maximum width 15 cm – see Figure 1. The middle fibulae pair is adorned with garnets, almandines, quartz crystals and pearls, and weights 1219 g and it is 25 cm in height. The small fibula is decorated with garnets, almandines, quartz crystals, and pearls, has a total weight of 1219 g, and is 12.5 cm in height - see Figure 2. Despite of the Roman tradition of using fibulae for chieftains’ clothes, the bird motif is typically Germanic and it is found in many Gothic treasures from the Vth until VIIth centuries in France, Italy, and Spain. The dodecagonal basket is decorated with almandines, tourmalines, garnets, and turquoises, has a total weight of 2433 g and is 11 cm in height – see Figure 3.
Fig. 3: Pietroasa treasury dodecagonal basket
The dodecagonal and the octagonal baskets exhibit similarities to a cup decorated with a gemstone with the figure of the Sassanide king Chosroes carved in it. This cup is exhibited at the Cabinet de Médailles de Bibliothèque Nationale de Paris and it was a gift of the Caliph Haroun-al Rashid to Charlemagne. The Patera weighs 2101 g, its diameter is 25.7 cm and its height is 7.5 cm. It appears to be a round sacrificial dish, with carved figures of Gothic gods in Greek dress surrounding a seated three-dimensional fertility goddess (Dea Mother or Gea, also adopted by the Germanic tribes). The oenochoe cup weights 1740 g and is 36 cm in height. A rather similar cup was discovered in a former Roman settlement from Kertch (on the Black Sea northern coast) – see Figure 4. Micro-PIXE measurements The micro-PIXE measurements and point analyses were performed at the Nuclear Microprobe Facility of the Institute of Ion Beam Physics and Materials Research, Forschungszentrum Rossendorf (FZR), Germany - see some of the results in [Bugoi 2003] - using the 3 MV Tandetron accelerator [Herrmann 1995], at the Oxford microprobe facility of the Legnaro National Laboratory (LNL), Italy [Boccaccio
76
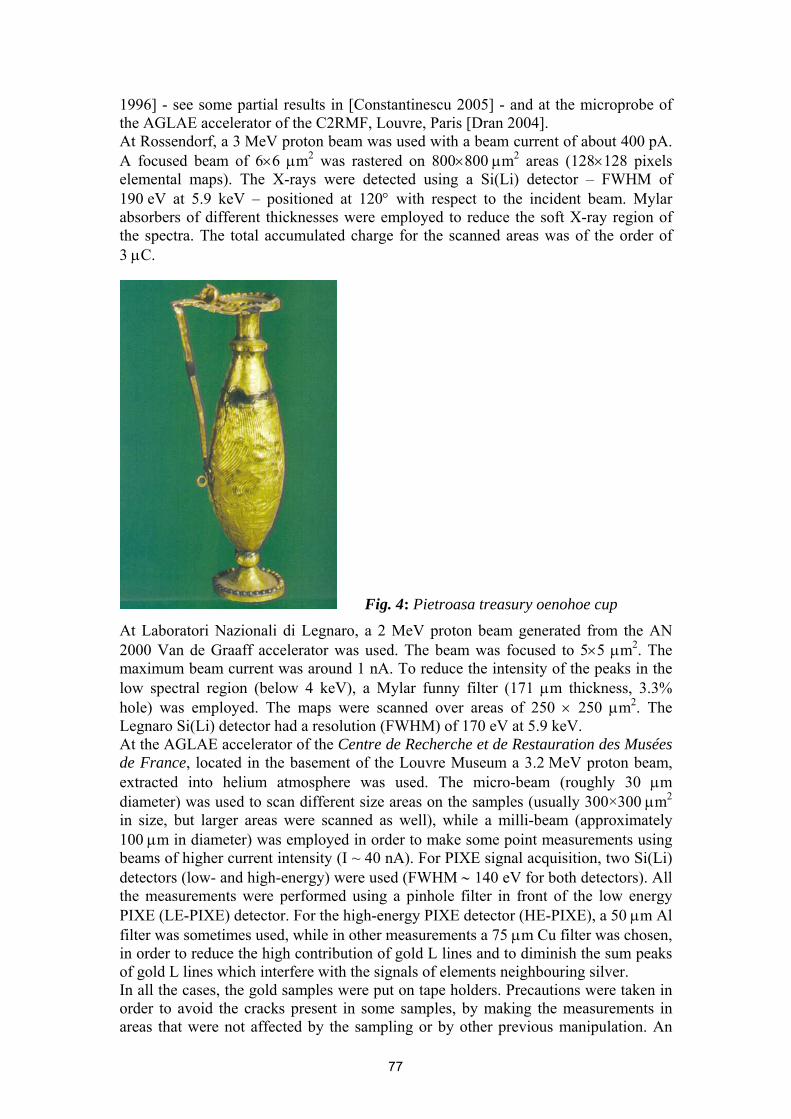
1996] - see some partial results in [Constantinescu 2005] - and at the microprobe of the AGLAE accelerator of the C2RMF, Louvre, Paris [Dran 2004]. At Rossendorf, a 3 MeV proton beam was used with a beam current of about 400 pA. A focused beam of 6×6 µm2 was rastered on 800×800 µm2 areas (128×128 pixels elemental maps). The X-rays were detected using a Si(Li) detector – FWHM of 190 eV at 5.9 keV – positioned at 120° with respect to the incident beam. Mylar absorbers of different thicknesses were employed to reduce the soft X-ray region of the spectra. The total accumulated charge for the scanned areas was of the order of 3 µC.
Fig. 4: Pietroasa treasury oenohoe cup
At Laboratori Nazionali di Legnaro, a 2 MeV proton beam generated from the AN 2000 Van de Graaff accelerator was used. The beam was focused to 5×5 µm2. The maximum beam current was around 1 nA. To reduce the intensity of the peaks in the low spectral region (below 4 keV), a Mylar funny filter (171 µm thickness, 3.3% hole) was employed. The maps were scanned over areas of 250 × 250 µm2. The Legnaro Si(Li) detector had a resolution (FWHM) of 170 eV at 5.9 keV. At the AGLAE accelerator of the Centre de Recherche et de Restauration des Musées de France, located in the basement of the Louvre Museum a 3.2 MeV proton beam, extracted into helium atmosphere was used. The micro-beam (roughly 30 µm diameter) was used to scan different size areas on the samples (usually 300×300 µm2 in size, but larger areas were scanned as well), while a milli-beam (approximately 100 µm in diameter) was employed in order to make some point measurements using beams of higher current intensity (I ~ 40 nA). For PIXE signal acquisition, two Si(Li) detectors (low- and high-energy) were used (FWHM ∼ 140 eV for both detectors). All the measurements were performed using a pinhole filter in front of the low energy PIXE (LE-PIXE) detector. For the high-energy PIXE detector (HE-PIXE), a 50 µm Al filter was sometimes used, while in other measurements a 75 µm Cu filter was chosen, in order to reduce the high contribution of gold L lines and to diminish the sum peaks of gold L lines which interfere with the signals of elements neighbouring silver. In all the cases, the gold samples were put on tape holders. Precautions were taken in order to avoid the cracks present in some samples, by making the measurements in areas that were not affected by the sampling or by other previous manipulation. An
77
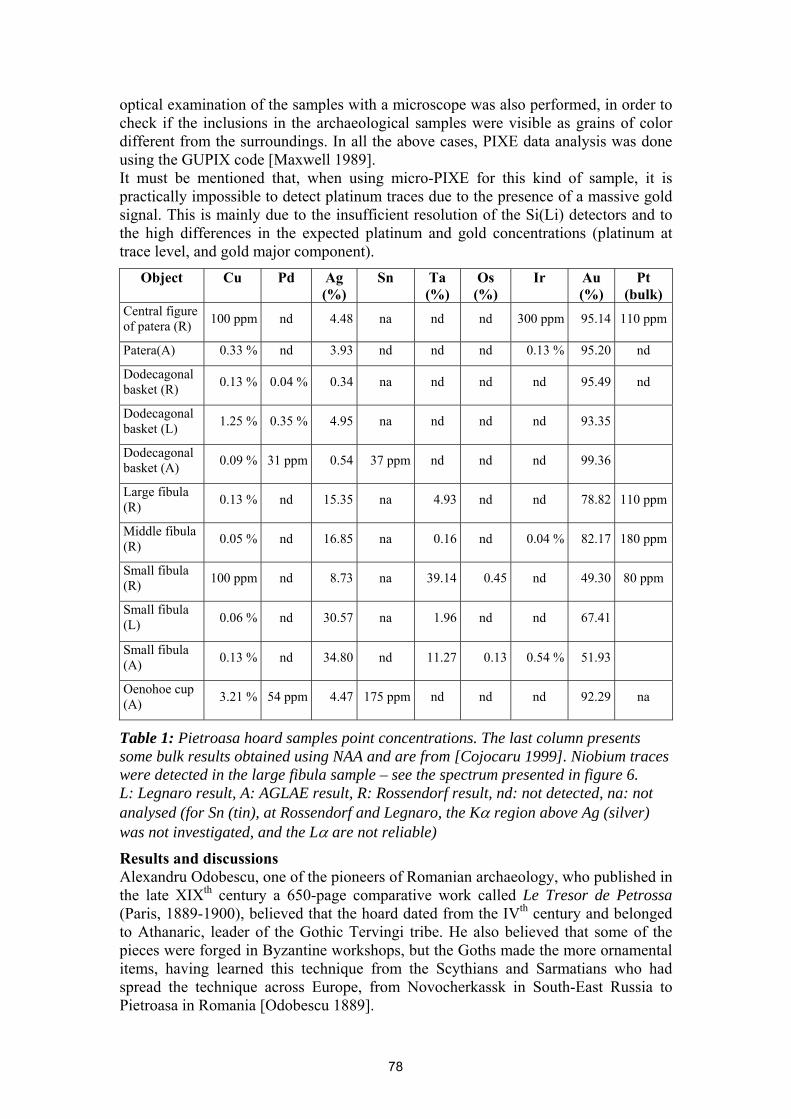
optical examination of the samples with a microscope was also performed, in order to check if the inclusions in the archaeological samples were visible as grains of color different from the surroundings. In all the above cases, PIXE data analysis was done using the GUPIX code [Maxwell 1989]. It must be mentioned that, when using micro-PIXE for this kind of sample, it is practically impossible to detect platinum traces due to the presence of a massive gold signal. This is mainly due to the insufficient resolution of the Si(Li) detectors and to the high differences in the expected platinum and gold concentrations (platinum at trace level, and gold major component).
Object Cu Pd Ag (%)
Sn Ta (%)
Os (%)
Ir Au (%)
Pt (bulk)
Central figure of patera (R) 100 ppm nd 4.48 na nd nd 300 ppm 95.14 110 ppm
Patera(A) 0.33 % nd 3.93 nd nd nd 0.13 % 95.20 nd
Dodecagonal basket (R) 0.13 % 0.04 % 0.34 na nd nd nd 95.49 nd
Dodecagonal basket (L) 1.25 % 0.35 % 4.95 na nd nd nd 93.35
Dodecagonal basket (A) 0.09 % 31 ppm 0.54 37 ppm nd nd nd 99.36
Large fibula (R) 0.13 % nd 15.35 na 4.93 nd nd 78.82 110 ppm
Middle fibula (R) 0.05 % nd 16.85 na 0.16 nd 0.04 % 82.17 180 ppm
Small fibula (R) 100 ppm nd 8.73 na 39.14 0.45 nd 49.30 80 ppm
Small fibula (L) 0.06 % nd 30.57 na 1.96 nd nd 67.41
Small fibula (A) 0.13 % nd 34.80 nd 11.27 0.13 0.54 % 51.93
Oenohoe cup (A) 3.21 % 54 ppm 4.47 175 ppm nd nd nd 92.29 na
Table 1: Pietroasa hoard samples point concentrations. The last column presents some bulk results obtained using NAA and are from [Cojocaru 1999]. Niobium traces were detected in the large fibula sample – see the spectrum presented in figure 6. L: Legnaro result, A: AGLAE result, R: Rossendorf result, nd: not detected, na: not analysed (for Sn (tin), at Rossendorf and Legnaro, the Kα region above Ag (silver) was not investigated, and the Lα are not reliable)
Results and discussions Alexandru Odobescu, one of the pioneers of Romanian archaeology, who published in the late XIXth century a 650-page comparative work called Le Tresor de Petrossa (Paris, 1889-1900), believed that the hoard dated from the IVth century and belonged to Athanaric, leader of the Gothic Tervingi tribe. He also believed that some of the pieces were forged in Byzantine workshops, but the Goths made the more ornamental items, having learned this technique from the Scythians and Sarmatians who had spread the technique across Europe, from Novocherkassk in South-East Russia to Pietroasa in Romania [Odobescu 1889].
78
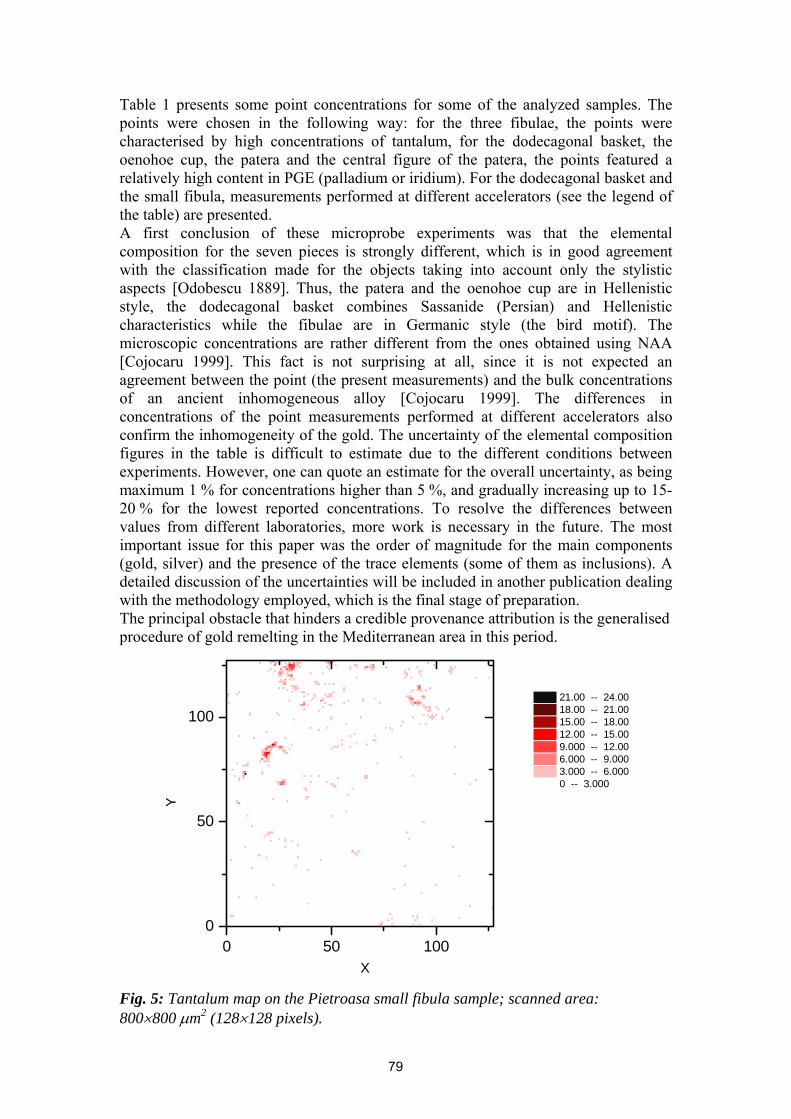
Table 1 presents some point concentrations for some of the analyzed samples. The points were chosen in the following way: for the three fibulae, the points were characterised by high concentrations of tantalum, for the dodecagonal basket, the oenohoe cup, the patera and the central figure of the patera, the points featured a relatively high content in PGE (palladium or iridium). For the dodecagonal basket and the small fibula, measurements performed at different accelerators (see the legend of the table) are presented. A first conclusion of these microprobe experiments was that the elemental composition for the seven pieces is strongly different, which is in good agreement with the classification made for the objects taking into account only the stylistic aspects [Odobescu 1889]. Thus, the patera and the oenohoe cup are in Hellenistic style, the dodecagonal basket combines Sassanide (Persian) and Hellenistic characteristics while the fibulae are in Germanic style (the bird motif). The microscopic concentrations are rather different from the ones obtained using NAA [Cojocaru 1999]. This fact is not surprising at all, since it is not expected an agreement between the point (the present measurements) and the bulk concentrations of an ancient inhomogeneous alloy [Cojocaru 1999]. The differences in concentrations of the point measurements performed at different accelerators also confirm the inhomogeneity of the gold. The uncertainty of the elemental composition figures in the table is difficult to estimate due to the different conditions between experiments. However, one can quote an estimate for the overall uncertainty, as being maximum 1 % for concentrations higher than 5 %, and gradually increasing up to 15-20 % for the lowest reported concentrations. To resolve the differences between values from different laboratories, more work is necessary in the future. The most important issue for this paper was the order of magnitude for the main components (gold, silver) and the presence of the trace elements (some of them as inclusions). A detailed discussion of the uncertainties will be included in another publication dealing with the methodology employed, which is the final stage of preparation. The principal obstacle that hinders a credible provenance attribution is the generalised procedure of gold remelting in the Mediterranean area in this period.
0 50 1000
50
100
Y
X
21.00 -- 24.00 18.00 -- 21.00 15.00 -- 18.00 12.00 -- 15.00 9.000 -- 12.00 6.000 -- 9.000 3.000 -- 6.000 0 -- 3.000
Fig. 5: Tantalum map on the Pietroasa small fibula sample; scanned area: 800×800 µm2 (128×128 pixels).
79
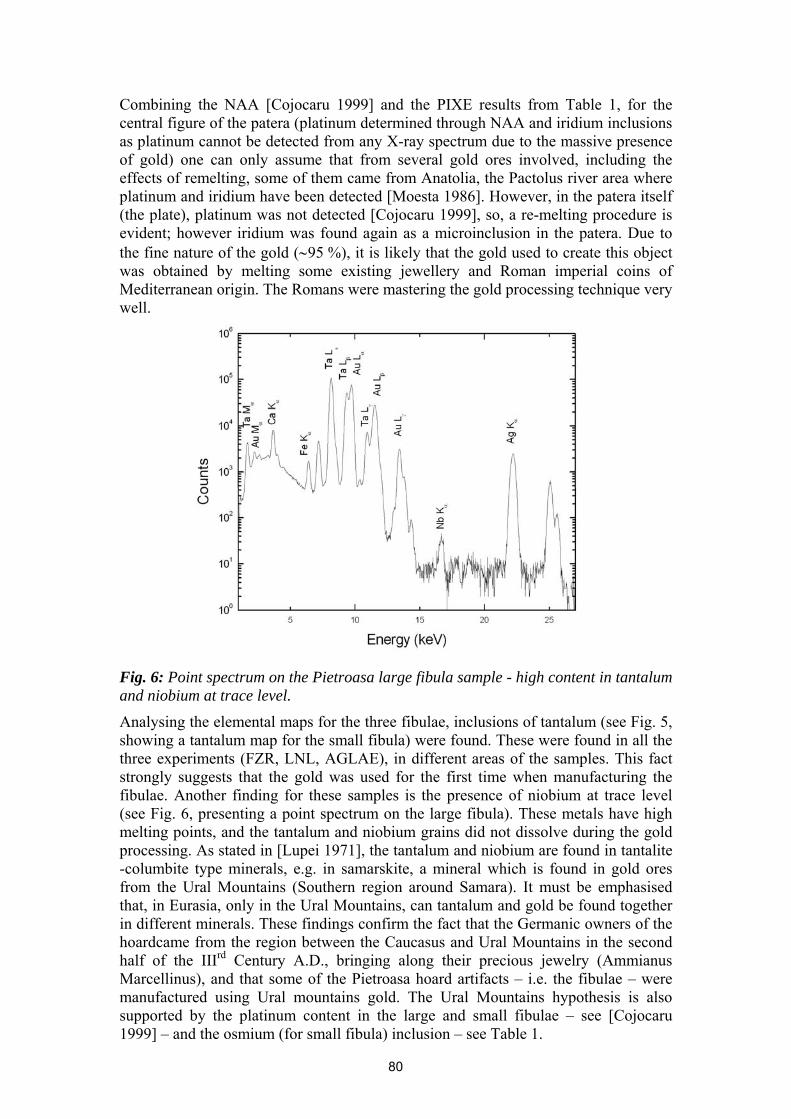
Combining the NAA [Cojocaru 1999] and the PIXE results from Table 1, for the central figure of the patera (platinum determined through NAA and iridium inclusions as platinum cannot be detected from any X-ray spectrum due to the massive presence of gold) one can only assume that from several gold ores involved, including the effects of remelting, some of them came from Anatolia, the Pactolus river area where platinum and iridium have been detected [Moesta 1986]. However, in the patera itself (the plate), platinum was not detected [Cojocaru 1999], so, a re-melting procedure is evident; however iridium was found again as a microinclusion in the patera. Due to the fine nature of the gold (∼95 %), it is likely that the gold used to create this object was obtained by melting some existing jewellery and Roman imperial coins of Mediterranean origin. The Romans were mastering the gold processing technique very well.
Fig. 6: Point spectrum on the Pietroasa large fibula sample - high content in tantalum and niobium at trace level.
Analysing the elemental maps for the three fibulae, inclusions of tantalum (see Fig. 5, showing a tantalum map for the small fibula) were found. These were found in all the three experiments (FZR, LNL, AGLAE), in different areas of the samples. This fact strongly suggests that the gold was used for the first time when manufacturing the fibulae. Another finding for these samples is the presence of niobium at trace level (see Fig. 6, presenting a point spectrum on the large fibula). These metals have high melting points, and the tantalum and niobium grains did not dissolve during the gold processing. As stated in [Lupei 1971], the tantalum and niobium are found in tantalite -columbite type minerals, e.g. in samarskite, a mineral which is found in gold ores from the Ural Mountains (Southern region around Samara). It must be emphasised that, in Eurasia, only in the Ural Mountains, can tantalum and gold be found together in different minerals. These findings confirm the fact that the Germanic owners of the hoardcame from the region between the Caucasus and Ural Mountains in the second half of the IIIrd Century A.D., bringing along their precious jewelry (Ammianus Marcellinus), and that some of the Pietroasa hoard artifacts – i.e. the fibulae – were manufactured using Ural mountains gold. The Ural Mountains hypothesis is also supported by the platinum content in the large and small fibulae – see [Cojocaru 1999] – and the osmium (for small fibula) inclusion – see Table 1.
80
Regarding the dodecagonal basket, the most important result of these experiments is the finding of palladium traces. The only accessible gold sources with palladium in the IVth Century A.D. were the Nubian (Sudan) and Anatolian (Turkey) deposits, intensively used in Egyptian (Alexandria) and Syrian (Antiochia) workshops - see [Guerra 1999], where palladium was determined in the coins minted by Alexander the Great after the Persian Empire conquest. So, at least one source of gold was most probably in Anatolia, but also the Egyptian (Nubian) origin is possible. The high gold content of this sample (gold from 93 % up to 99 %, depending on the points in which the measurements were performed in the three different laboratories) also suggests a re-melting procedure, probably using Roman imperial coins struck in Oriental provinces – see [Oberländer-Târnoveanu 1996]. The tin presence - see [Hartmann 1970, 1982] – detected in the dodecagonal basket and in the oenohoe cup could be an argument for Persian provenance – see [Gondonneau 2000] – but it is necessary to also look for platinum, eventually with an analytical method other than PIXE. Some fragments from nuggets coming from Transylvanian mines were also analysed, to check whether the hypothesis of local – Carpathian Mountains – gold holds. Tellurium (from gold telluride) is known to be an element characteristic of the native gold of Transylvania. None of the archaeological samples contains tellurium, so the hypothesis of Transylvanian gold provenance can be definitely rejected. Summarising the results, one can conclude for the analyzed objects of Pietroasa hoard that we have at least three possible geographical gold sources: The southern region of the Ural Mountains, Nubian (Sudanese) deposits or a Persian source (most likely the Pactolus river in Anatolia), a reusable gold source – various issues of Roman imperial coins, and probably, other coins not yet identifiable used in the remelting procedure. A relevant result is the connection between the stylistic characterisation and the geographical gold sources for the Germanic fibulae (the Southern Ural Mountains are close to the first Visigoths ‘homeland’) and for the Sassanide basket (partially used Persian-type gold). Conclusions The results obtained by micro-PIXE experiments on gold ancient artefacts, especially the findings related to inclusions, provided some useful hints regarding the possible provenance of fragments of the manufacturing metal. The Pietroasa hoard artefacts were again proven to be of different origins, confirming the stylistic arguments with the different possible gold sources identified: The southern region of Ural Mountains, Nubian (Sudanese) or Pactolus river deposits. The most probable remelting procedure, e.g. using Roman imperial coins must also be considered. Further analyses on other artefacts belonging to the same hoard are to be done. However, a correct answer to the question of the native metal provenance used for each artefact remains a difficult task, taking into account that a complete data bank for the composition of Euro-Asian native gold is not yet available. Acknowledgments The measurements at The Forschungszentrum Rossendorf, Germany and at Legnaro National Laboratory, Italy described in this paper were performed in the frame of Access to Research Infrastructures (ARI) activity of the European Union Fifth Programme (FP5), while the AGLAE experiment was performed under the frame of the EU-ARTECH project. The work presented in this paper was also possible because in the frame of EU COST G8 action the contacts with the Rossendorf (Dr. Christian Neelmeijer) and AGLAE
81
(Dr. Jean-Claude Dran) accelerator teams have been intensified during the meetings of this European action. References
• Ammianus Marcellinus ‘Rerum gestarum libri qui supersunt’ in Clark C. U., Berlin, 1963.
• Boccaccio P., Bollini D., Ceccato D., et al. 1996. ‘The LNL proton microprobe: original technical solutions and new developments.’ Nuclear Instruments and Methods in Physics Research B, 109/110: 94-98.
• Bugoi R., Cojocaru V., Constantinescu B., et al. 2003. ‘Micro-PIXE study of gold archaeological objects’. Journal of Radioanalytical and Nuclear Chemistry, 257 (2): 375-383.
• Cojocaru V., Besliu C., Manea C. A. 1999. ‘Nuclear analyses of the Pietroasa gold hoard’. Journal of Radioanalytical and Nuclear Chemistry, 240 (3): 897-908.
• Constantinescu B., Bugoi R., Cojocaru V. et al. 2005. ‘Romanian ancient gold objects provenance studies using micro-beam methods: the case of “Pietroasa” hoard’. Nuclear Instruments and Methods in Physics Research B, 231: 541-545.
• Dran J. - C., Salomon J., Calligaro T. et al. 2004. ‘Ion beam analysis of art works: 14 years of use in the Louvre’. Nuclear Instruments and Methods in Physics Research B, 219-220: 7-15.
• Giurescu C. C., Giurescu D. C., 1976. ‘History of the Romanians’. Bucharest, Romanian Academy Publishing House.
• Gondonneau A., Guerra M. F., 2000. ‘L’or perse a travers l’analyse de monnayages antiques et medievaux’, Revue d’ Archaeometrie 24: 27-28.
• Guerra M. F., Sarthre C. - O., Gondonneau A. et al. 1999. ‘Precious Metals and Provenance Enquiries using LA-ICP-MS’. Journal of Archaeological Science. 26: 1101-1110.
• Hartmann A. 1970. Prähistorische Goldfunde in Europa I, Studien zu den Anfängen der Metallurgie Band 3 Berlin.
• Hartmann A. 1982. Prähistorische Goldfunde in Europa” II, Studien zu den Anfängen der Metallurgie Band 5 Berlin.
• Herrmann F., Grambole D. 1995. ‘The new Rossendorf nuclear microprobe’. Nuclear Instruments and Methods in Physics Research B, 104: 26-30.
• Lupei N., Barna C. 1971. Zestrea de minerale a lumii. Bucuresti: Ed. Stiintifica (in Romanian).
• Maxwell J. A., Campbell L. A., Teesdale W. 1989. ‘The Guelph PIXE software package’. Nuclear Instruments and Methods in Physics Research B, 43: 218-230.
• Moesta H., 1986. Erze und Metalle – ihre Kulturgeschichte im Experiment, Springer Verlag, Berlin.
• Oberländer-Târnoveanu E., Zoran V., Poenaru-Bordea G. et al. 1996. Revue Numismatique 151:141.
• Odobescu Al., 1889. Le tresor de Petrossa: Etude sur l’orfevrerie antique, Paris-Leipzig (in French).
• Oprescu G., 1968. History of Plastic Arts in Romania (in Romanian), Bucharest, Romanian Academy Publishing House.
• Tylecote, R. F. 1987. The early history of metallurgy in Europe, London and New York: Longman.
82
Paintings, Graphics, Pigments

Neutron Autoradiography of Paintings, ‘The Hermit’ by an Unknown Artist, and ‘Armida abducts the sleeping Rinaldo’
(c. ~ 1637) by Nicolas Poussin
B. Schröder-Smeibidl2, C. Laurenze-Landsberg1, C. Schmidt1, L.A. Mertens2, 1 Berlin Picture Gallery, Stauffenbergstr. 40, D 10785 Berlin, Germany
2 Hahn-Meitner-Institut Berlin, Glienicker Str. 100, D 14109 Berlin, Germany (corresponding author: [email protected])
Abstract Neutron autoradiography (NAR) is used to analyse materials and techniques used in paintings. X-ray-radiography indicates the distribution of heavy elements. In contrast, NAR is capable of revealing different paint layers superimposed during the creation of the painting. In many cases the individual brushstrokes applied by the artist are made visible, as well as, changes made during the painting process. When investigating paintings that have been reliably authenticated, it is possible to identify the particular style of an artist. For example, it was suspected that the painting ‘The Hermit’ could be attributed to Rembrandt himself. The observed conceptual changes are in remarkable accordance to the results of a previous autoradiography of a painting ascribed to the Dutch painter Flinck. In the painting ‘Armida abducts the sleeping Rinaldo’, originally catalogued as a copy of a Poussin, corrections are revealed indicating that the picture could be ascribed to Poussin himself.
Keywords: neutron autoradiography, paintings, Rembrandt, Poussin, Flinck
Introduction In a close collaboration, the Berlin Picture Gallery (Gemäldegalerie Berlin, Stiftung Preußischer Kulturbesitz) and the Hahn-Meitner-Institut investigate old master paintings by means of neutron autoradiography (NAR). Which is a very effective, non-destructive, but rather exceptional method applied to the examination and analysis of materials and techniques used in painting. It allows the visualisation of structures and layers beneath the top surface and, in addition, enables one to identify in detail the elements contained in the pigments. The instrument B8 at the Berlin Neutron Scattering Center BENSC is dedicated to these investigations. In this article the procedure of investigation is explained in detail and two examples are given which demonstrate the efficiency and success of this method. NAR – the method and the instrument Usually, when examining paintings, museums apply methods based upon the use of photon radiation. However, the information provided by these methods is limited. Infrared reflectography reveals black carbon-based media, e.g. preparatory drawings – dark lines on light prime coat - made by Indian ink or charcoal. Whilst X-rays have a high penetration depth, X-ray transmission records only indicate dense matter or the distribution of heavy elements such as iron or lead, e.g. in the pigment lead white. Neutrons have no charge and therefore exhibit a high penetration depth as well. However, they also interact with light elements and, as a real complementary method, NAR is capable of revealing different paint layers superimposed during the creation of the painting. In many cases, the individual brushstroke applied by the artist is made visible, as well as changes and corrections introduced during the painting process. By using paintings that have been reliably authenticated, one can identify the unique style or ‘hand’ of a particular artist.
85
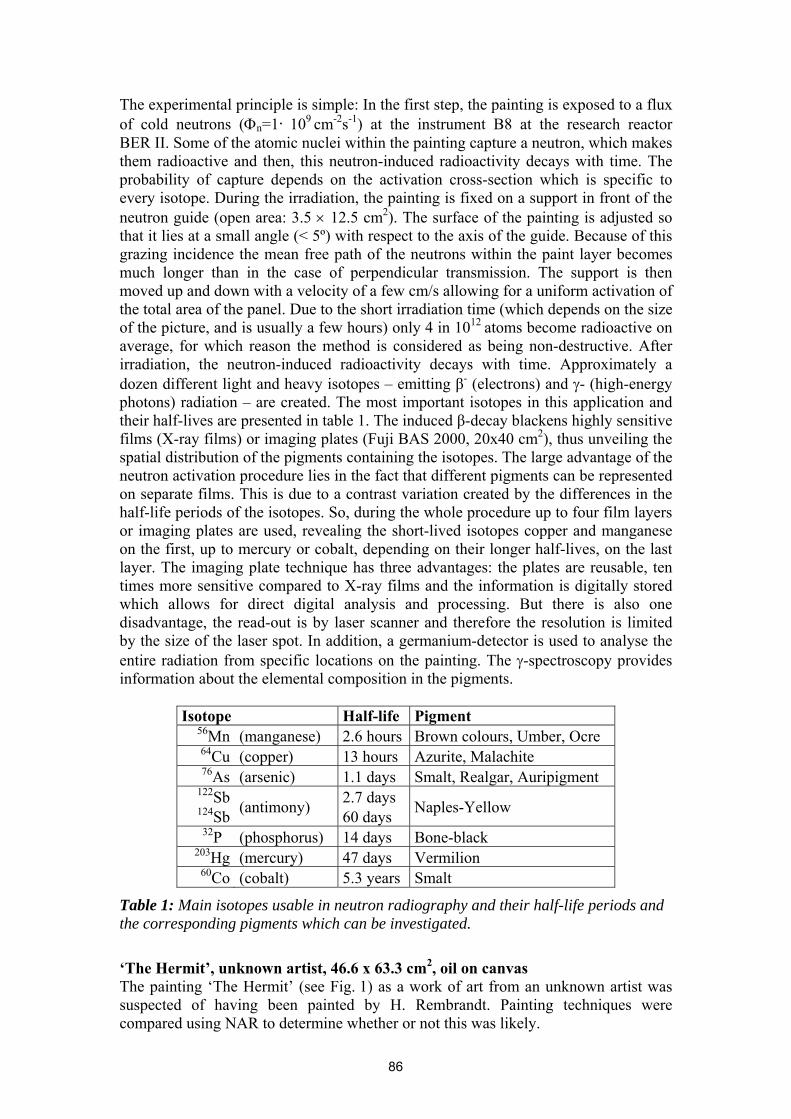
The experimental principle is simple: In the first step, the painting is exposed to a flux of cold neutrons (Φn=1· 109 cm-2s-1) at the instrument B8 at the research reactor BER II. Some of the atomic nuclei within the painting capture a neutron, which makes them radioactive and then, this neutron-induced radioactivity decays with time. The probability of capture depends on the activation cross-section which is specific to every isotope. During the irradiation, the painting is fixed on a support in front of the neutron guide (open area: 3.5 × 12.5 cm2). The surface of the painting is adjusted so that it lies at a small angle (< 5º) with respect to the axis of the guide. Because of this grazing incidence the mean free path of the neutrons within the paint layer becomes much longer than in the case of perpendicular transmission. The support is then moved up and down with a velocity of a few cm/s allowing for a uniform activation of the total area of the panel. Due to the short irradiation time (which depends on the size of the picture, and is usually a few hours) only 4 in 1012 atoms become radioactive on average, for which reason the method is considered as being non-destructive. After irradiation, the neutron-induced radioactivity decays with time. Approximately a dozen different light and heavy isotopes – emitting β- (electrons) and γ- (high-energy photons) radiation – are created. The most important isotopes in this application and their half-lives are presented in table 1. The induced β-decay blackens highly sensitive films (X-ray films) or imaging plates (Fuji BAS 2000, 20x40 cm2), thus unveiling the spatial distribution of the pigments containing the isotopes. The large advantage of the neutron activation procedure lies in the fact that different pigments can be represented on separate films. This is due to a contrast variation created by the differences in the half-life periods of the isotopes. So, during the whole procedure up to four film layers or imaging plates are used, revealing the short-lived isotopes copper and manganese on the first, up to mercury or cobalt, depending on their longer half-lives, on the last layer. The imaging plate technique has three advantages: the plates are reusable, ten times more sensitive compared to X-ray films and the information is digitally stored which allows for direct digital analysis and processing. But there is also one disadvantage, the read-out is by laser scanner and therefore the resolution is limited by the size of the laser spot. In addition, a germanium-detector is used to analyse the entire radiation from specific locations on the painting. The γ-spectroscopy provides information about the elemental composition in the pigments.
Isotope Half-life Pigment 56Mn (manganese) 2.6 hours Brown colours, Umber, Ocre 64Cu (copper) 13 hours Azurite, Malachite 76As (arsenic) 1.1 days Smalt, Realgar, Auripigment
122Sb 124Sb (antimony) 2.7 days
60 days Naples-Yellow 32P (phosphorus) 14 days Bone-black
203Hg (mercury) 47 days Vermilion 60Co (cobalt) 5.3 years Smalt
Table 1: Main isotopes usable in neutron radiography and their half-life periods and the corresponding pigments which can be investigated.
‘The Hermit’, unknown artist, 46.6 x 63.3 cm2, oil on canvas The painting ‘The Hermit’ (see Fig. 1) as a work of art from an unknown artist was suspected of having been painted by H. Rembrandt. Painting techniques were compared using NAR to determine whether or not this was likely.
86
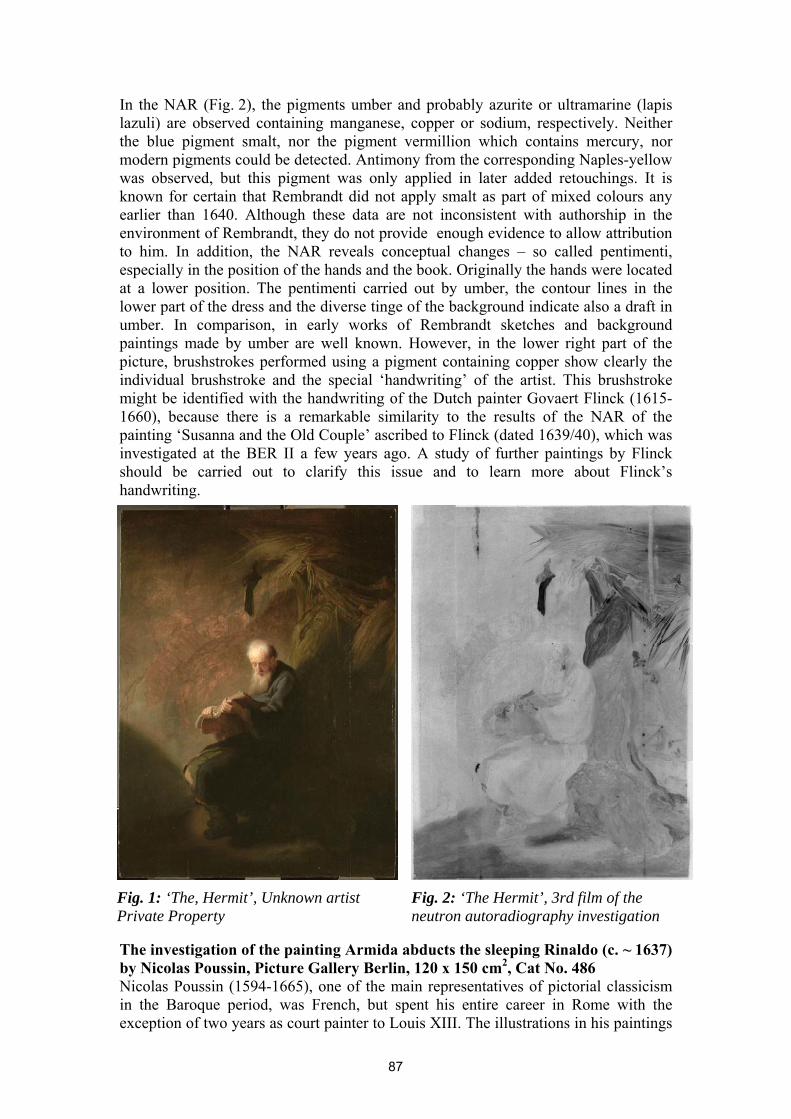
In the NAR (Fig. 2), the pigments umber and probably azurite or ultramarine (lapis lazuli) are observed containing manganese, copper or sodium, respectively. Neither the blue pigment smalt, nor the pigment vermillion which contains mercury, nor modern pigments could be detected. Antimony from the corresponding Naples-yellow was observed, but this pigment was only applied in later added retouchings. It is known for certain that Rembrandt did not apply smalt as part of mixed colours any earlier than 1640. Although these data are not inconsistent with authorship in the environment of Rembrandt, they do not provide enough evidence to allow attribution to him. In addition, the NAR reveals conceptual changes – so called pentimenti, especially in the position of the hands and the book. Originally the hands were located at a lower position. The pentimenti carried out by umber, the contour lines in the lower part of the dress and the diverse tinge of the background indicate also a draft in umber. In comparison, in early works of Rembrandt sketches and background paintings made by umber are well known. However, in the lower right part of the picture, brushstrokes performed using a pigment containing copper show clearly the individual brushstroke and the special ‘handwriting’ of the artist. This brushstroke might be identified with the handwriting of the Dutch painter Govaert Flinck (1615-1660), because there is a remarkable similarity to the results of the NAR of the painting ‘Susanna and the Old Couple’ ascribed to Flinck (dated 1639/40), which was investigated at the BER II a few years ago. A study of further paintings by Flinck should be carried out to clarify this issue and to learn more about Flinck’s handwriting.
Fig. 1: ‘The, Hermit’, Unknown artist Private Property
Fig. 2: ‘The Hermit’, 3rd film of the neutron autoradiography investigation
The investigation of the painting Armida abducts the sleeping Rinaldo (c. ~ 1637) by Nicolas Poussin, Picture Gallery Berlin, 120 x 150 cm2, Cat No. 486 Nicolas Poussin (1594-1665), one of the main representatives of pictorial classicism in the Baroque period, was French, but spent his entire career in Rome with the exception of two years as court painter to Louis XIII. The illustrations in his paintings
87
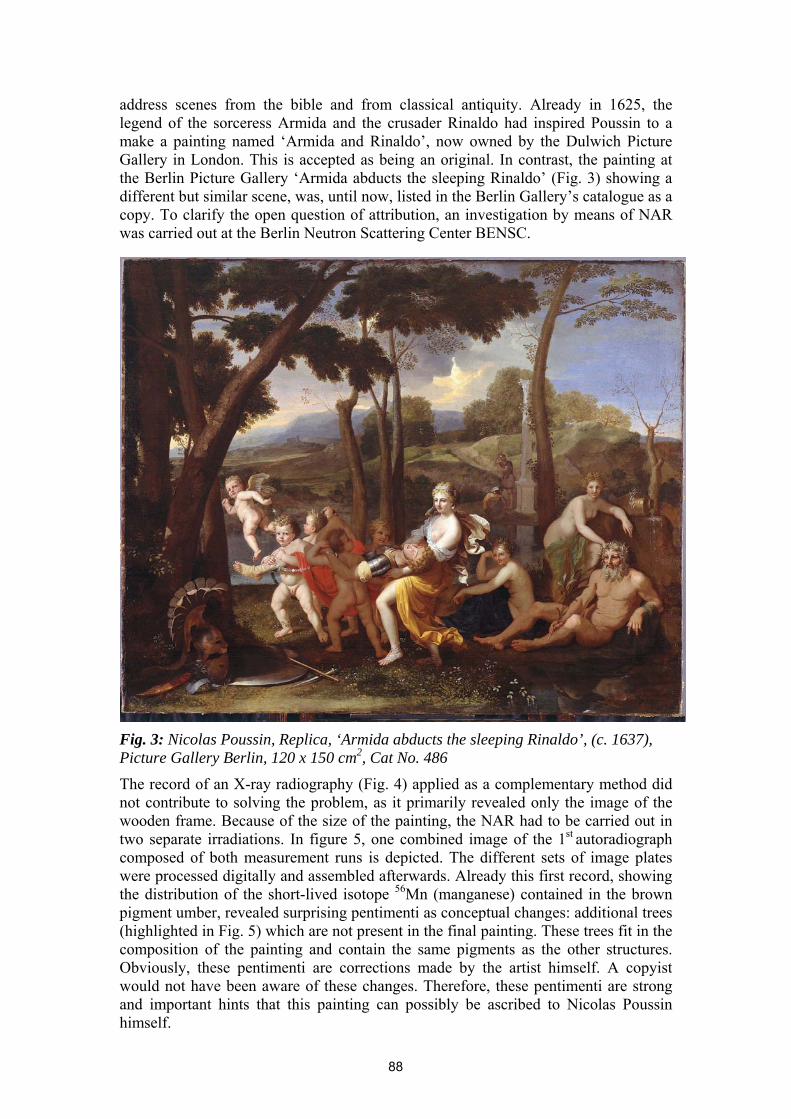
address scenes from the bible and from classical antiquity. Already in 1625, the legend of the sorceress Armida and the crusader Rinaldo had inspired Poussin to a make a painting named ‘Armida and Rinaldo’, now owned by the Dulwich Picture Gallery in London. This is accepted as being an original. In contrast, the painting at the Berlin Picture Gallery ‘Armida abducts the sleeping Rinaldo’ (Fig. 3) showing a different but similar scene, was, until now, listed in the Berlin Gallery’s catalogue as a copy. To clarify the open question of attribution, an investigation by means of NAR was carried out at the Berlin Neutron Scattering Center BENSC.
Fig. 3: Nicolas Poussin, Replica, ‘Armida abducts the sleeping Rinaldo’, (c. 1637), Picture Gallery Berlin, 120 x 150 cm2, Cat No. 486
The record of an X-ray radiography (Fig. 4) applied as a complementary method did not contribute to solving the problem, as it primarily revealed only the image of the wooden frame. Because of the size of the painting, the NAR had to be carried out in two separate irradiations. In figure 5, one combined image of the 1st autoradiograph composed of both measurement runs is depicted. The different sets of image plates were processed digitally and assembled afterwards. Already this first record, showing the distribution of the short-lived isotope 56Mn (manganese) contained in the brown pigment umber, revealed surprising pentimenti as conceptual changes: additional trees (highlighted in Fig. 5) which are not present in the final painting. These trees fit in the composition of the painting and contain the same pigments as the other structures. Obviously, these pentimenti are corrections made by the artist himself. A copyist would not have been aware of these changes. Therefore, these pentimenti are strong and important hints that this painting can possibly be ascribed to Nicolas Poussin himself.
88
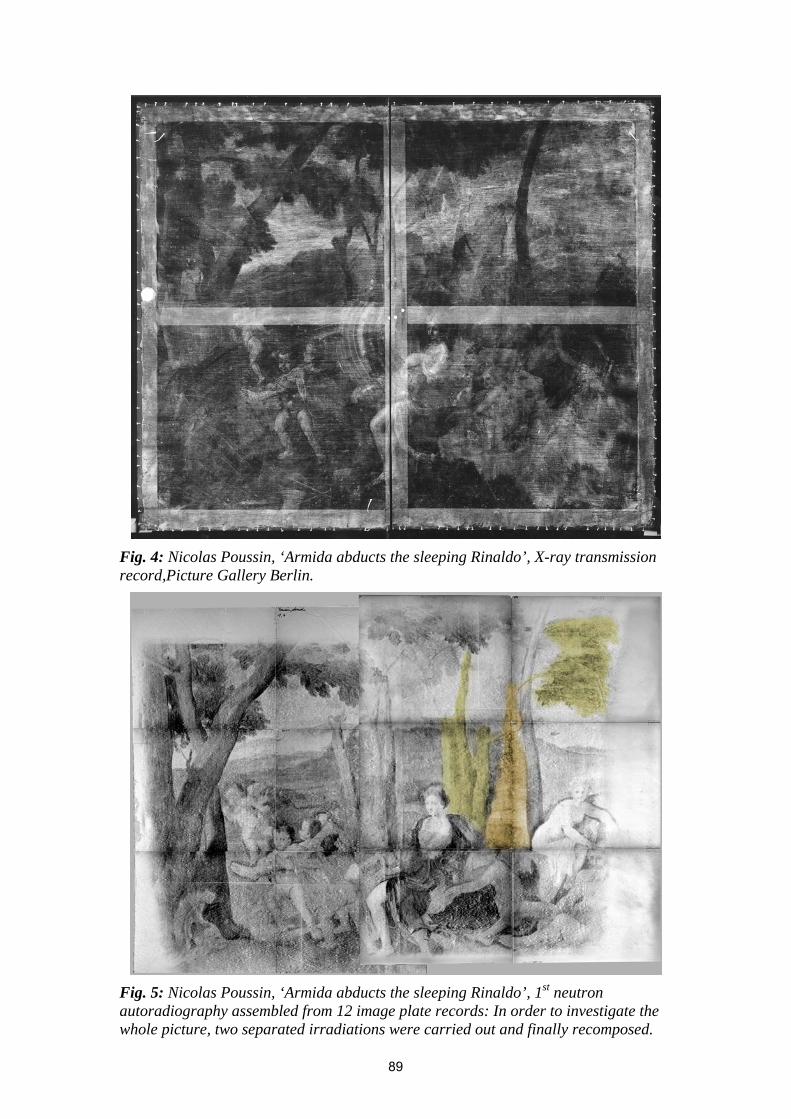
Fig. 4: Nicolas Poussin, ‘Armida abducts the sleeping Rinaldo’, X-ray transmission record,Picture Gallery Berlin.
Fig. 5: Nicolas Poussin, ‘Armida abducts the sleeping Rinaldo’, 1st neutron autoradiography assembled from 12 image plate records: In order to investigate the whole picture, two separated irradiations were carried out and finally recomposed.
89
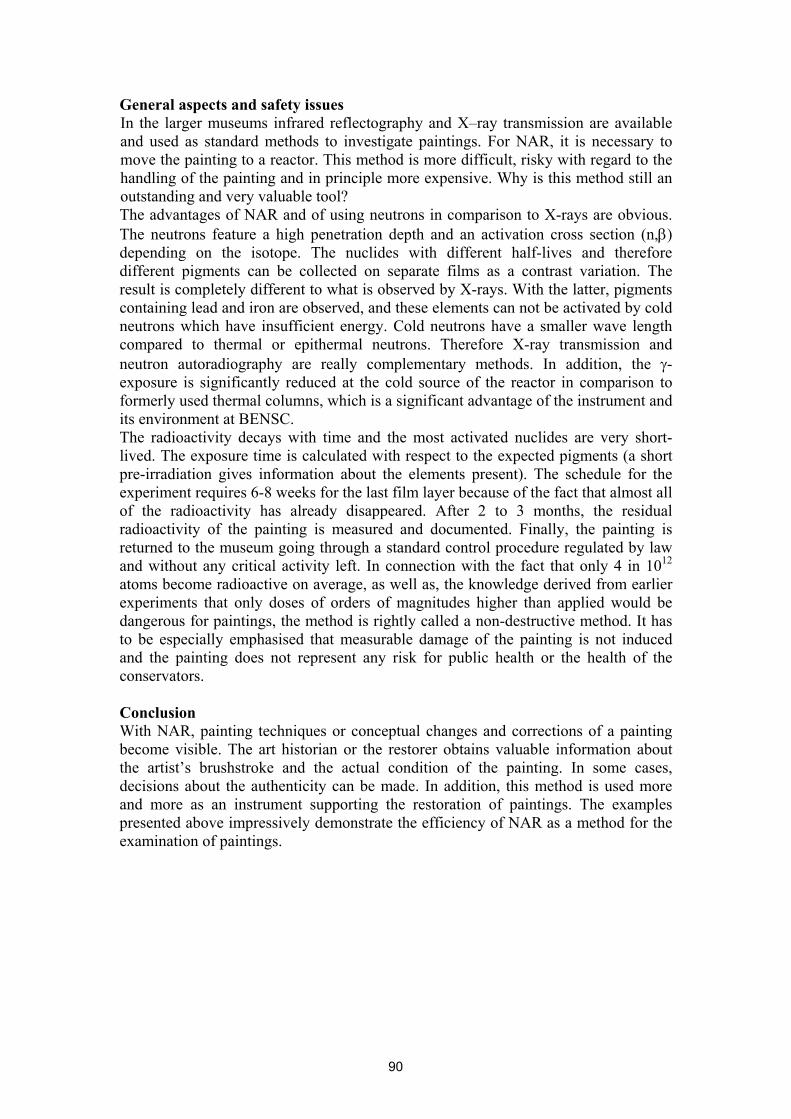
General aspects and safety issues In the larger museums infrared reflectography and X–ray transmission are available and used as standard methods to investigate paintings. For NAR, it is necessary to move the painting to a reactor. This method is more difficult, risky with regard to the handling of the painting and in principle more expensive. Why is this method still an outstanding and very valuable tool? The advantages of NAR and of using neutrons in comparison to X-rays are obvious. The neutrons feature a high penetration depth and an activation cross section (n,β) depending on the isotope. The nuclides with different half-lives and therefore different pigments can be collected on separate films as a contrast variation. The result is completely different to what is observed by X-rays. With the latter, pigments containing lead and iron are observed, and these elements can not be activated by cold neutrons which have insufficient energy. Cold neutrons have a smaller wave length compared to thermal or epithermal neutrons. Therefore X-ray transmission and neutron autoradiography are really complementary methods. In addition, the γ-exposure is significantly reduced at the cold source of the reactor in comparison to formerly used thermal columns, which is a significant advantage of the instrument and its environment at BENSC. The radioactivity decays with time and the most activated nuclides are very short-lived. The exposure time is calculated with respect to the expected pigments (a short pre-irradiation gives information about the elements present). The schedule for the experiment requires 6-8 weeks for the last film layer because of the fact that almost all of the radioactivity has already disappeared. After 2 to 3 months, the residual radioactivity of the painting is measured and documented. Finally, the painting is returned to the museum going through a standard control procedure regulated by law and without any critical activity left. In connection with the fact that only 4 in 1012
atoms become radioactive on average, as well as, the knowledge derived from earlier experiments that only doses of orders of magnitudes higher than applied would be dangerous for paintings, the method is rightly called a non-destructive method. It has to be especially emphasised that measurable damage of the painting is not induced and the painting does not represent any risk for public health or the health of the conservators. Conclusion With NAR, painting techniques or conceptual changes and corrections of a painting become visible. The art historian or the restorer obtains valuable information about the artist’s brushstroke and the actual condition of the painting. In some cases, decisions about the authenticity can be made. In addition, this method is used more and more as an instrument supporting the restoration of paintings. The examples presented above impressively demonstrate the efficiency of NAR as a method for the examination of paintings.
90
Synchrotron radiation and protons on the traces of famous artists: Non-destructive analyses of silverpoint drawings by Albrecht Dürer
I. Reiche1, A. Berger2, A. Duval*, W. Görner2, H. Guicharnaud*, S. Merchel2, M. Radtke2, J. Riederer1,
H. Riesemeier2, M. Roth3 *Centre de Recherche et de Restauration des Musées de France (C2RMF) - UMR 171 du CNRS,
Palais du Louvre, F-75001 Paris, France 1 Rathgen-Forschungslabor, Staatliche Museen zu Berlin - Preußischer Kulturbesitz,
D-14059 Berlin, Germany 2 Bundesanstalt für Materialforschung und –prüfung (BAM), D-12205 Berlin, Germany
3 Kupferstichkabinett, Staatliche Museen zu Berlin - Preußischer Kulturbesitz, D-10785 Berlin, Germany
(corresponding author: [email protected]) Abstract A series of silverpoint drawings created by Albrecht Dürer (1476-1528) was analysed by spatially resolved synchrotron-radiation induced X-ray fluorescence analysis (SR-XRF). The SR-XRF results are compared with other results on silverpoint drawings from the same or similar context obtained with external beam micro-proton induced X-ray emission (µ-PIXE) at the particle accelerator AGLAE at C2RMF in Paris. The study of these drawings allows the differentiation between drawing materials and the better understanding of the drawing technique of this Renaissance artist. The analysed drawings cover different production periods of Albrecht Dürer. Three different silver alloys (with about 11 and 24 % copper or with 12 % copper and about 5 % zinc) could be distinguished as a function of the working period in the life of the artist. This work highlights the potential of scientific analysis to get new detailed insights into the history and genesis of graphical art objects that cannot be revealed by art historical investigations alone.
Keywords: History of art, silverpoint drawings, SR-XRF, µ-PIXE, chemical analysis, silver alloys
Introduction These days, artists have a large panoply of drawing materials at their disposal. But when searching for drawing materials used by Renaissance's artists in Europe, only little information is available. Very few ancient drawing instruments are conserved and only some ancient texts testify their use. Therefore, the possibility of obtaining insights into former drawing techniques is basically restricted to the analysis of the drawings themselves. Two main drawing materials were common during the Renaissance: ink, and chalks of different colours. A third, less well known, drawing instrument was also used: the metalpoint. For drawing with a metal stylus, the metal must be soft, so as to leave a trace without scraping off the surface of the support. The support has to be abrasive to ensure ablation and fixation of the metal particles. Silver alloys are particularly well suited for constituting metalpoints but other metals as copper or gold can also be used. Leadpoints have to be distinguished from the above-mentioned metalpoints because they can be erased in contrast to the others. The metal stylus was first used as a writing instrument during the Roman period. Its use was expanded in the Middle Ages for the preparation of manuscripts and illuminations. This instrument became a discrete drawing material during the 14th century. Its culminating period lies at the transition of the 15th to the 16th century. Later on, other materials like chalks replaced it because of their less constraining use. Many questions arise regarding the metal alloys used by Renaissance artists, the preparation of the drawing support, special techniques of some artists or schools or
91
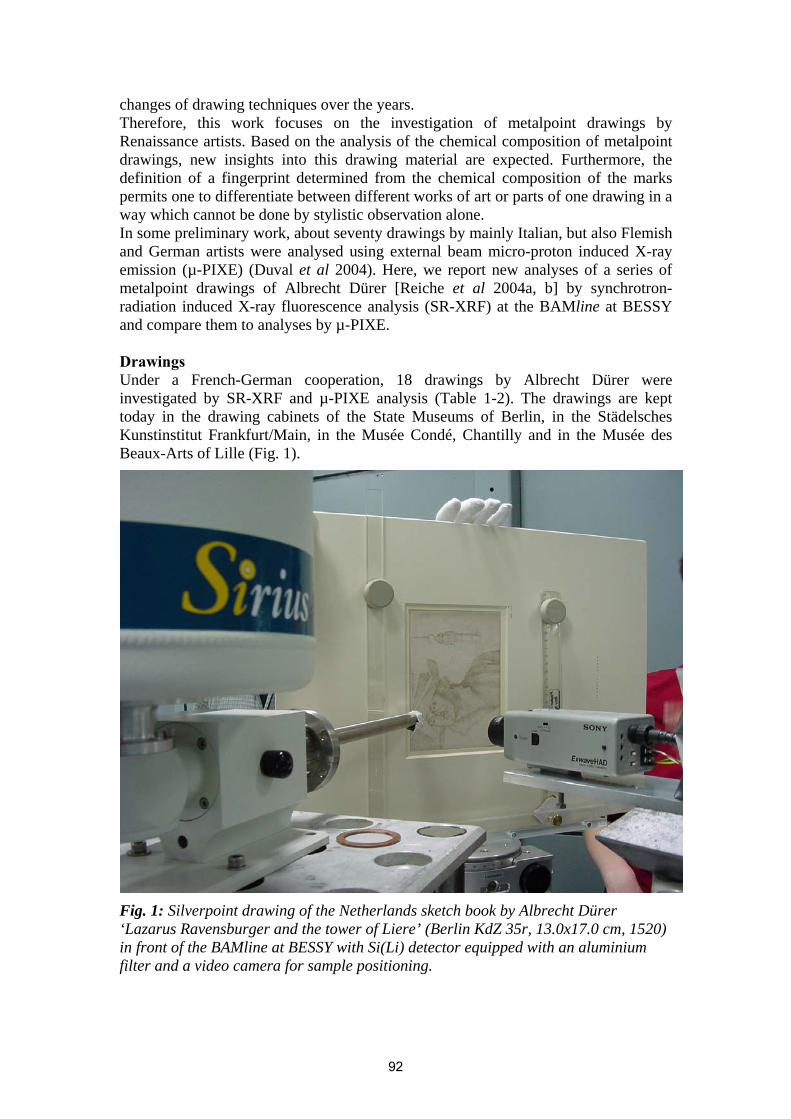
changes of drawing techniques over the years. Therefore, this work focuses on the investigation of metalpoint drawings by Renaissance artists. Based on the analysis of the chemical composition of metalpoint drawings, new insights into this drawing material are expected. Furthermore, the definition of a fingerprint determined from the chemical composition of the marks permits one to differentiate between different works of art or parts of one drawing in a way which cannot be done by stylistic observation alone. In some preliminary work, about seventy drawings by mainly Italian, but also Flemish and German artists were analysed using external beam micro-proton induced X-ray emission (µ-PIXE) (Duval et al 2004). Here, we report new analyses of a series of metalpoint drawings of Albrecht Dürer [Reiche et al 2004a, b] by synchrotron-radiation induced X-ray fluorescence analysis (SR-XRF) at the BAMline at BESSY and compare them to analyses by µ-PIXE. Drawings Under a French-German cooperation, 18 drawings by Albrecht Dürer were investigated by SR-XRF and µ-PIXE analysis (Table 1-2). The drawings are kept today in the drawing cabinets of the State Museums of Berlin, in the Städelsches Kunstinstitut Frankfurt/Main, in the Musée Condé, Chantilly and in the Musée des Beaux-Arts of Lille (Fig. 1).
Fig. 1: Silverpoint drawing of the Netherlands sketch book by Albrecht Dürer ‘Lazarus Ravensburger and the tower of Liere’ (Berlin KdZ 35r, 13.0x17.0 cm, 1520) in front of the BAMline at BESSY with Si(Li) detector equipped with an aluminium filter and a video camera for sample positioning.
92
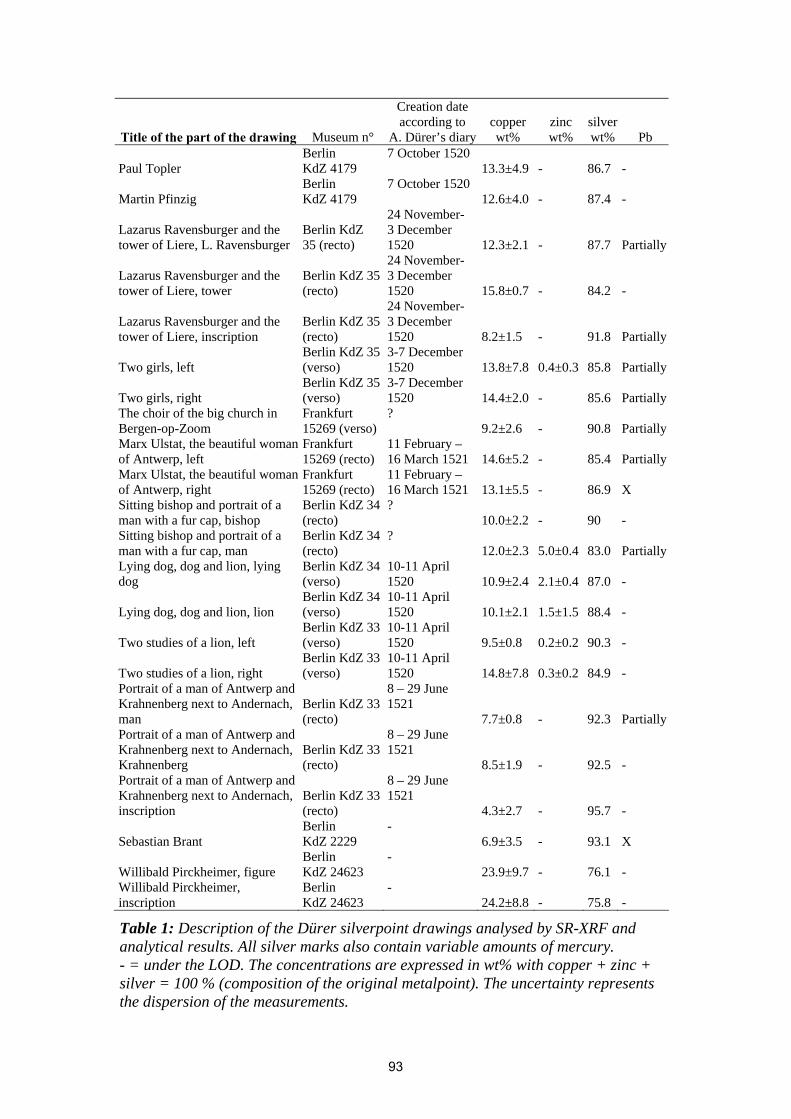
Title of the part of the drawing Museum n°
Creation date according to
A. Dürer’s diarycopper wt%
zinc wt%
silver wt% Pb
Paul Topler Berlin KdZ 4179
7 October 1520 13.3±4.9 - 86.7 -
Martin Pfinzig Berlin KdZ 4179
7 October 1520 12.6±4.0 - 87.4 -
Lazarus Ravensburger and the tower of Liere, L. Ravensburger
Berlin KdZ 35 (recto)
24 November- 3 December 1520 12.3±2.1 - 87.7 Partially
Lazarus Ravensburger and the tower of Liere, tower
Berlin KdZ 35 (recto)
24 November- 3 December 1520 15.8±0.7 - 84.2 -
Lazarus Ravensburger and the tower of Liere, inscription
Berlin KdZ 35 (recto)
24 November- 3 December 1520 8.2±1.5 - 91.8 Partially
Two girls, left Berlin KdZ 35 (verso)
3-7 December 1520 13.8±7.8 0.4±0.3 85.8 Partially
Two girls, right Berlin KdZ 35 (verso)
3-7 December 1520 14.4±2.0 - 85.6 Partially
The choir of the big church in Bergen-op-Zoom
Frankfurt 15269 (verso)
? 9.2±2.6 - 90.8 Partially
Marx Ulstat, the beautiful woman of Antwerp, left
Frankfurt 15269 (recto)
11 February – 16 March 1521 14.6±5.2 - 85.4 Partially
Marx Ulstat, the beautiful woman of Antwerp, right
Frankfurt 15269 (recto)
11 February – 16 March 1521 13.1±5.5 - 86.9 X
Sitting bishop and portrait of a man with a fur cap, bishop
Berlin KdZ 34 (recto)
? 10.0±2.2 - 90 -
Sitting bishop and portrait of a man with a fur cap, man
Berlin KdZ 34 (recto)
? 12.0±2.3 5.0±0.4 83.0 Partially
Lying dog, dog and lion, lying dog
Berlin KdZ 34 (verso)
10-11 April 1520 10.9±2.4 2.1±0.4 87.0 -
Lying dog, dog and lion, lion Berlin KdZ 34 (verso)
10-11 April 1520 10.1±2.1 1.5±1.5 88.4 -
Two studies of a lion, left Berlin KdZ 33 (verso)
10-11 April 1520 9.5±0.8 0.2±0.2 90.3 -
Two studies of a lion, right Berlin KdZ 33 (verso)
10-11 April 1520 14.8±7.8 0.3±0.2 84.9 -
Portrait of a man of Antwerp and Krahnenberg next to Andernach, man
Berlin KdZ 33 (recto)
8 – 29 June 1521
7.7±0.8 - 92.3 PartiallyPortrait of a man of Antwerp and Krahnenberg next to Andernach, Krahnenberg
Berlin KdZ 33 (recto)
8 – 29 June 1521
8.5±1.9 - 92.5 - Portrait of a man of Antwerp and Krahnenberg next to Andernach, inscription
Berlin KdZ 33 (recto)
8 – 29 June 1521
4.3±2.7 - 95.7 -
Sebastian Brant Berlin KdZ 2229
- 6.9±3.5 - 93.1 X
Willibald Pirckheimer, figure Berlin KdZ 24623
- 23.9±9.7 - 76.1 -
Willibald Pirckheimer, inscription
Berlin KdZ 24623
- 24.2±8.8 - 75.8 -
Table 1: Description of the Dürer silverpoint drawings analysed by SR-XRF and analytical results. All silver marks also contain variable amounts of mercury. - = under the LOD. The concentrations are expressed in wt% with copper + zinc + silver = 100 % (composition of the original metalpoint). The uncertainty represents the dispersion of the measurements.
93
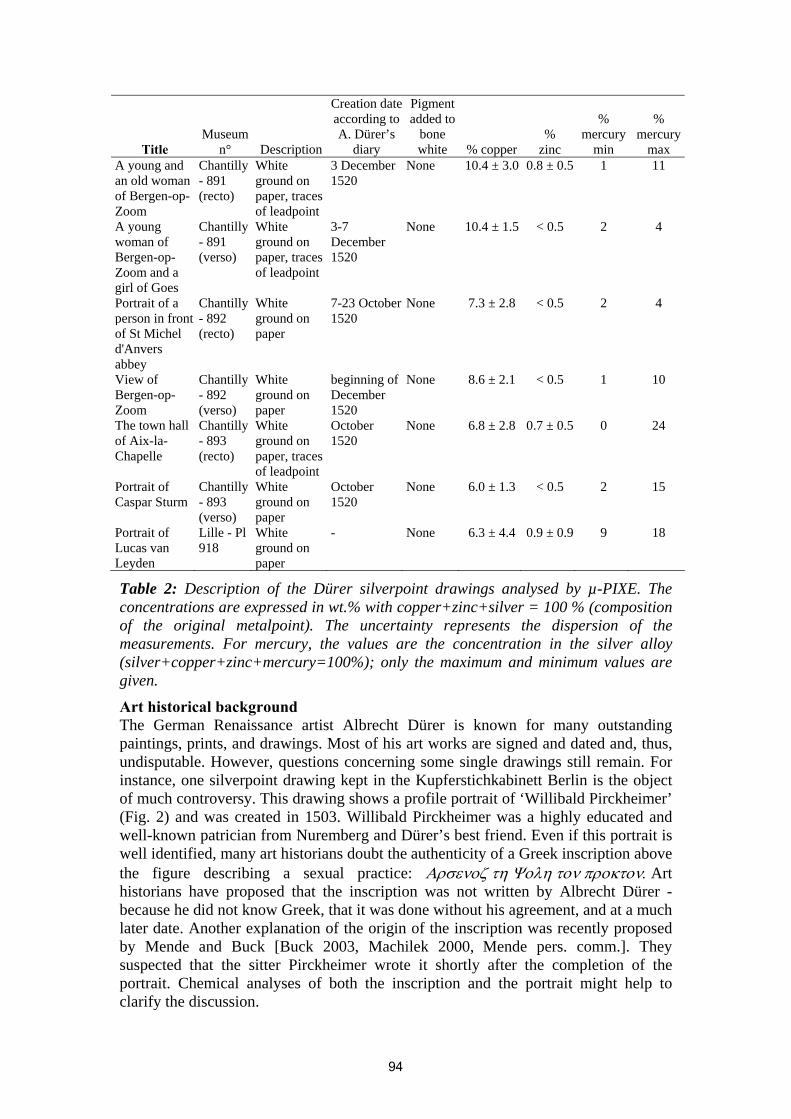
Title Museum
n° Description
Creation date according to A. Dürer’s
diary
Pigment added to
bone white % copper
% zinc
% mercury
min
% mercury
max A young and an old woman of Bergen-op-Zoom
Chantilly - 891 (recto)
White ground on paper, traces of leadpoint
3 December 1520
None 10.4 ± 3.0 0.8 ± 0.5 1 11
A young woman of Bergen-op-Zoom and a girl of Goes
Chantilly - 891 (verso)
White ground on paper, traces of leadpoint
3-7 December 1520
None 10.4 ± 1.5 < 0.5 2 4
Portrait of a person in front of St Michel d'Anvers abbey
Chantilly - 892 (recto)
White ground on paper
7-23 October 1520
None 7.3 ± 2.8 < 0.5 2 4
View of Bergen-op-Zoom
Chantilly - 892 (verso)
White ground on paper
beginning of December 1520
None 8.6 ± 2.1 < 0.5 1 10
The town hall of Aix-la-Chapelle
Chantilly - 893 (recto)
White ground on paper, traces of leadpoint
October 1520
None 6.8 ± 2.8 0.7 ± 0.5 0 24
Portrait of Caspar Sturm
Chantilly - 893 (verso)
White ground on paper
October 1520
None 6.0 ± 1.3 < 0.5 2 15
Portrait of Lucas van Leyden
Lille - Pl 918
White ground on paper
- None 6.3 ± 4.4 0.9 ± 0.9 9 18
Table 2: Description of the Dürer silverpoint drawings analysed by µ-PIXE. The concentrations are expressed in wt.% with copper+zinc+silver = 100 % (composition of the original metalpoint). The uncertainty represents the dispersion of the measurements. For mercury, the values are the concentration in the silver alloy (silver+copper+zinc+mercury=100%); only the maximum and minimum values are given. Art historical background The German Renaissance artist Albrecht Dürer is known for many outstanding paintings, prints, and drawings. Most of his art works are signed and dated and, thus, undisputable. However, questions concerning some single drawings still remain. For instance, one silverpoint drawing kept in the Kupferstichkabinett Berlin is the object of much controversy. This drawing shows a profile portrait of ‘Willibald Pirckheimer’ (Fig. 2) and was created in 1503. Willibald Pirckheimer was a highly educated and well-known patrician from Nuremberg and Dürer’s best friend. Even if this portrait is well identified, many art historians doubt the authenticity of a Greek inscription above the figure describing a sexual practice: Αρσενοζ τη Ψολη τον προκτον. Art historians have proposed that the inscription was not written by Albrecht Dürer - because he did not know Greek, that it was done without his agreement, and at a much later date. Another explanation of the origin of the inscription was recently proposed by Mende and Buck [Buck 2003, Machilek 2000, Mende pers. comm.]. They suspected that the sitter Pirckheimer wrote it shortly after the completion of the portrait. Chemical analyses of both the inscription and the portrait might help to clarify the discussion.
94
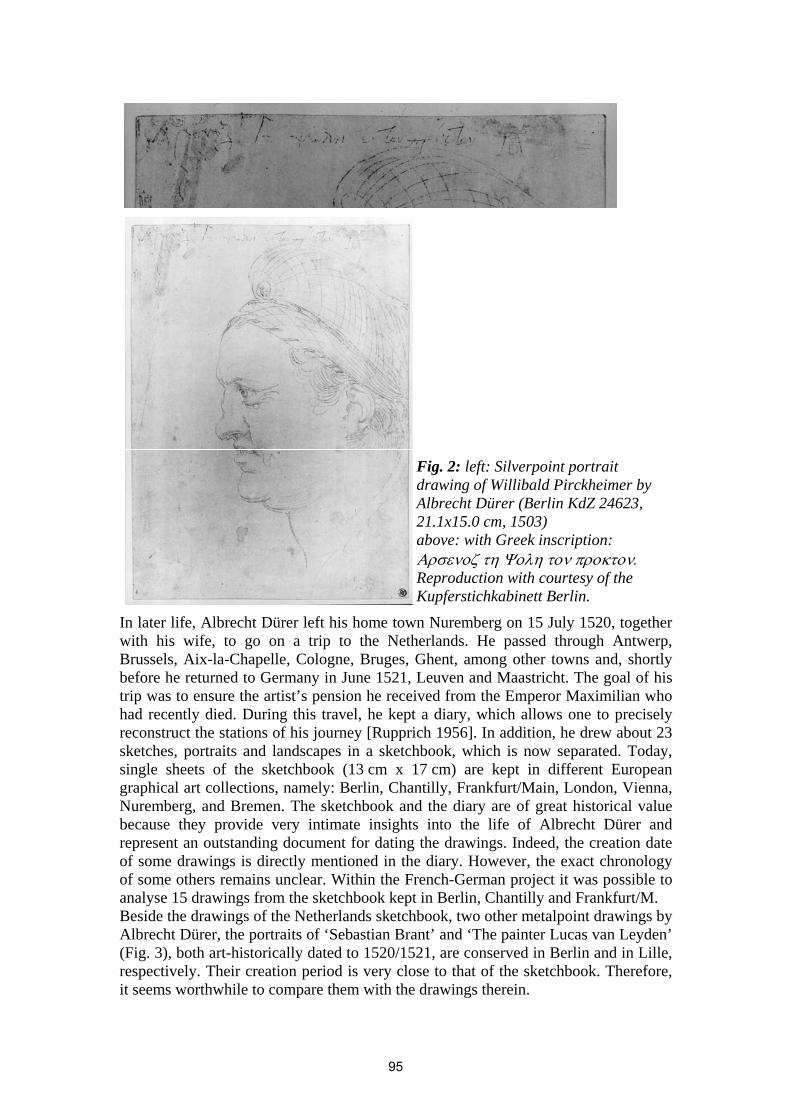
Fig. 2: left: Silverpoint portrait drawing of Willibald Pirckheimer by Albrecht Dürer (Berlin KdZ 24623, 21.1x15.0 cm, 1503) above: with Greek inscription: Αρσενοζ τη Ψολη τον προκτον. Reproduction with courtesy of the Kupferstichkabinett Berlin.
In later life, Albrecht Dürer left his home town Nuremberg on 15 July 1520, together with his wife, to go on a trip to the Netherlands. He passed through Antwerp, Brussels, Aix-la-Chapelle, Cologne, Bruges, Ghent, among other towns and, shortly before he returned to Germany in June 1521, Leuven and Maastricht. The goal of his trip was to ensure the artist’s pension he received from the Emperor Maximilian who had recently died. During this travel, he kept a diary, which allows one to precisely reconstruct the stations of his journey [Rupprich 1956]. In addition, he drew about 23 sketches, portraits and landscapes in a sketchbook, which is now separated. Today, single sheets of the sketchbook (13 cm x 17 cm) are kept in different European graphical art collections, namely: Berlin, Chantilly, Frankfurt/Main, London, Vienna, Nuremberg, and Bremen. The sketchbook and the diary are of great historical value because they provide very intimate insights into the life of Albrecht Dürer and represent an outstanding document for dating the drawings. Indeed, the creation date of some drawings is directly mentioned in the diary. However, the exact chronology of some others remains unclear. Within the French-German project it was possible to analyse 15 drawings from the sketchbook kept in Berlin, Chantilly and Frankfurt/M. Beside the drawings of the Netherlands sketchbook, two other metalpoint drawings by Albrecht Dürer, the portraits of ‘Sebastian Brant’ and ‘The painter Lucas van Leyden’ (Fig. 3), both art-historically dated to 1520/1521, are conserved in Berlin and in Lille, respectively. Their creation period is very close to that of the sketchbook. Therefore, it seems worthwhile to compare them with the drawings therein.
95
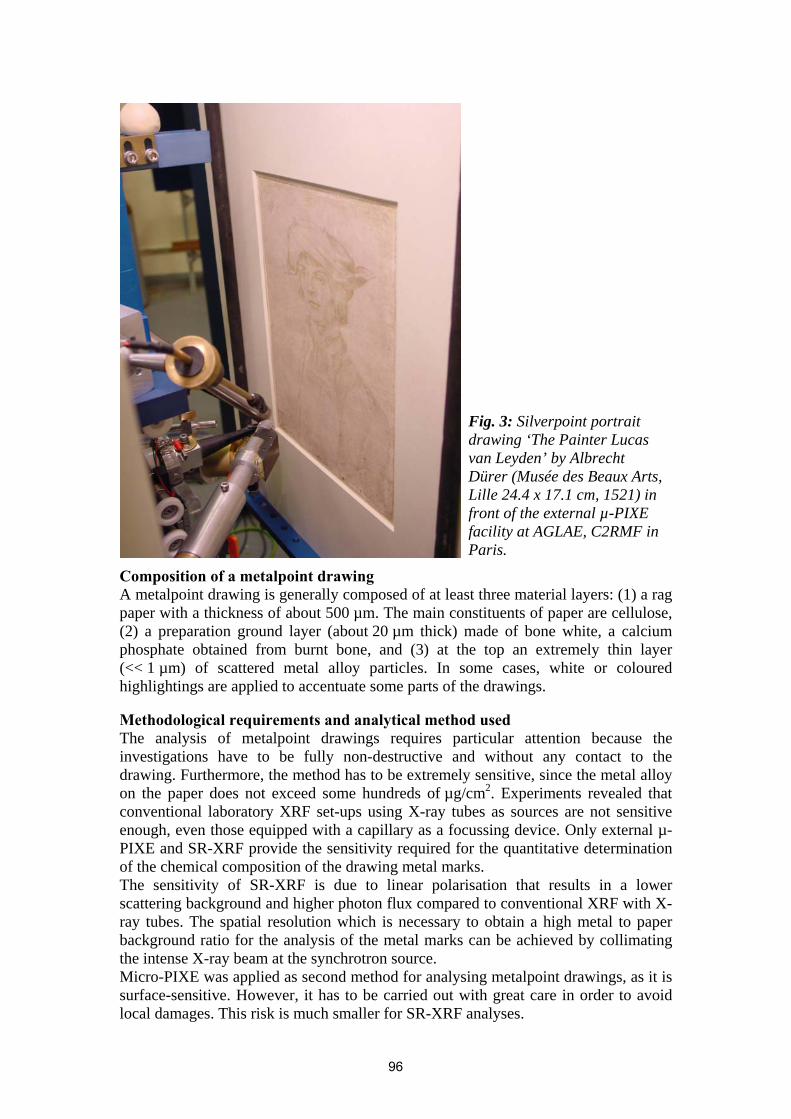
Fig. 3: Silverpoint portrait drawing ‘The Painter Lucas van Leyden’ by Albrecht Dürer (Musée des Beaux Arts, Lille 24.4 x 17.1 cm, 1521) in front of the external µ-PIXE facility at AGLAE, C2RMF in Paris.
Composition of a metalpoint drawing A metalpoint drawing is generally composed of at least three material layers: (1) a rag paper with a thickness of about 500 µm. The main constituents of paper are cellulose, (2) a preparation ground layer (about 20 µm thick) made of bone white, a calcium phosphate obtained from burnt bone, and (3) at the top an extremely thin layer (<< 1 µm) of scattered metal alloy particles. In some cases, white or coloured highlightings are applied to accentuate some parts of the drawings. Methodological requirements and analytical method used The analysis of metalpoint drawings requires particular attention because the investigations have to be fully non-destructive and without any contact to the drawing. Furthermore, the method has to be extremely sensitive, since the metal alloy on the paper does not exceed some hundreds of µg/cm2. Experiments revealed that conventional laboratory XRF set-ups using X-ray tubes as sources are not sensitive enough, even those equipped with a capillary as a focussing device. Only external µ-PIXE and SR-XRF provide the sensitivity required for the quantitative determination of the chemical composition of the drawing metal marks. The sensitivity of SR-XRF is due to linear polarisation that results in a lower scattering background and higher photon flux compared to conventional XRF with X-ray tubes. The spatial resolution which is necessary to obtain a high metal to paper background ratio for the analysis of the metal marks can be achieved by collimating the intense X-ray beam at the synchrotron source. Micro-PIXE was applied as second method for analysing metalpoint drawings, as it is surface-sensitive. However, it has to be carried out with great care in order to avoid local damages. This risk is much smaller for SR-XRF analyses.
96
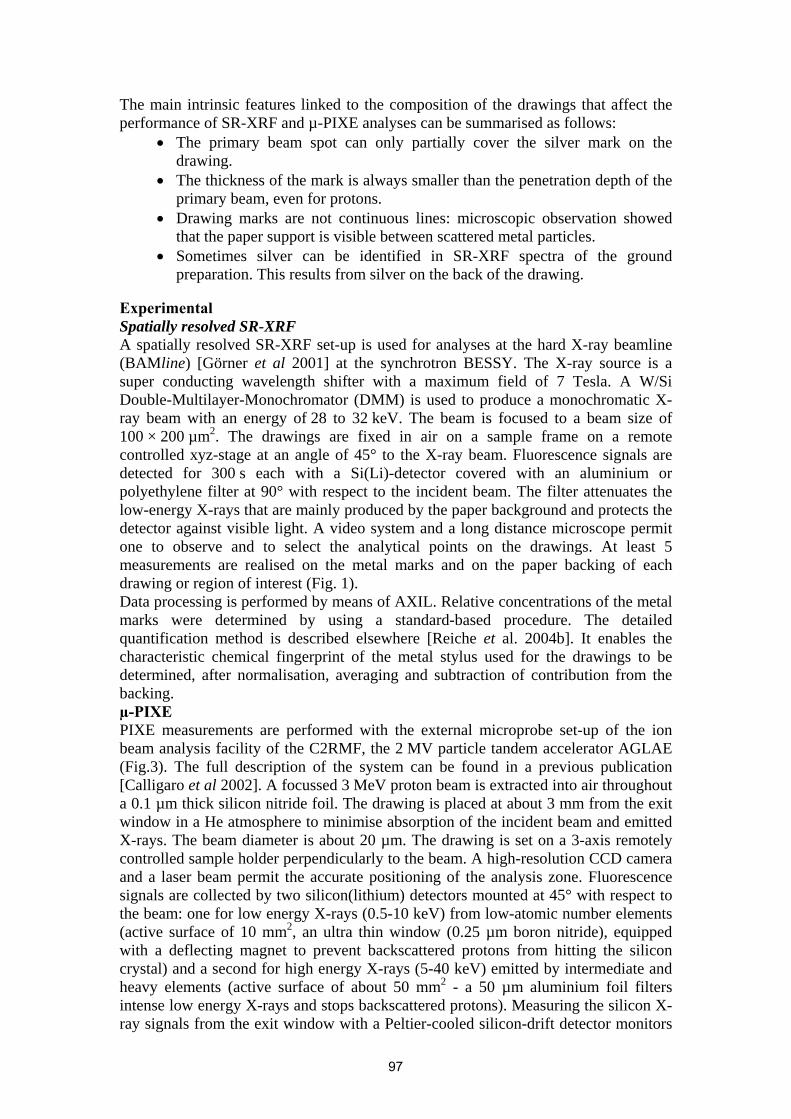
The main intrinsic features linked to the composition of the drawings that affect the performance of SR-XRF and µ-PIXE analyses can be summarised as follows:
• The primary beam spot can only partially cover the silver mark on the drawing.
• The thickness of the mark is always smaller than the penetration depth of the primary beam, even for protons.
• Drawing marks are not continuous lines: microscopic observation showed that the paper support is visible between scattered metal particles.
• Sometimes silver can be identified in SR-XRF spectra of the ground preparation. This results from silver on the back of the drawing.
Experimental Spatially resolved SR-XRF A spatially resolved SR-XRF set-up is used for analyses at the hard X-ray beamline (BAMline) [Görner et al 2001] at the synchrotron BESSY. The X-ray source is a super conducting wavelength shifter with a maximum field of 7 Tesla. A W/Si Double-Multilayer-Monochromator (DMM) is used to produce a monochromatic X-ray beam with an energy of 28 to 32 keV. The beam is focused to a beam size of 100 × 200 µm2. The drawings are fixed in air on a sample frame on a remote controlled xyz-stage at an angle of 45° to the X-ray beam. Fluorescence signals are detected for 300 s each with a Si(Li)-detector covered with an aluminium or polyethylene filter at 90° with respect to the incident beam. The filter attenuates the low-energy X-rays that are mainly produced by the paper background and protects the detector against visible light. A video system and a long distance microscope permit one to observe and to select the analytical points on the drawings. At least 5 measurements are realised on the metal marks and on the paper backing of each drawing or region of interest (Fig. 1). Data processing is performed by means of AXIL. Relative concentrations of the metal marks were determined by using a standard-based procedure. The detailed quantification method is described elsewhere [Reiche et al. 2004b]. It enables the characteristic chemical fingerprint of the metal stylus used for the drawings to be determined, after normalisation, averaging and subtraction of contribution from the backing. µ-PIXE PIXE measurements are performed with the external microprobe set-up of the ion beam analysis facility of the C2RMF, the 2 MV particle tandem accelerator AGLAE (Fig.3). The full description of the system can be found in a previous publication [Calligaro et al 2002]. A focussed 3 MeV proton beam is extracted into air throughout a 0.1 µm thick silicon nitride foil. The drawing is placed at about 3 mm from the exit window in a He atmosphere to minimise absorption of the incident beam and emitted X-rays. The beam diameter is about 20 µm. The drawing is set on a 3-axis remotely controlled sample holder perpendicularly to the beam. A high-resolution CCD camera and a laser beam permit the accurate positioning of the analysis zone. Fluorescence signals are collected by two silicon(lithium) detectors mounted at 45° with respect to the beam: one for low energy X-rays (0.5-10 keV) from low-atomic number elements (active surface of 10 mm2, an ultra thin window (0.25 µm boron nitride), equipped with a deflecting magnet to prevent backscattered protons from hitting the silicon crystal) and a second for high energy X-rays (5-40 keV) emitted by intermediate and heavy elements (active surface of about 50 mm2 - a 50 µm aluminium foil filters intense low energy X-rays and stops backscattered protons). Measuring the silicon X-ray signals from the exit window with a Peltier-cooled silicon-drift detector monitors
97
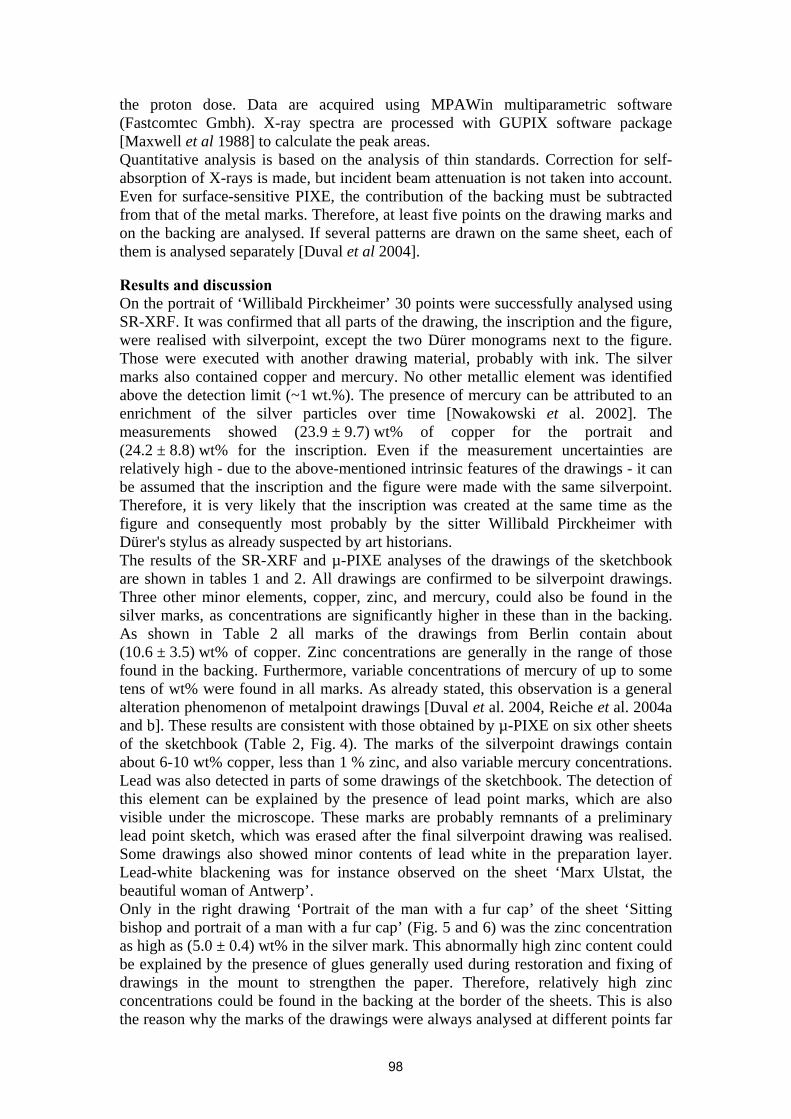
the proton dose. Data are acquired using MPAWin multiparametric software (Fastcomtec Gmbh). X-ray spectra are processed with GUPIX software package [Maxwell et al 1988] to calculate the peak areas. Quantitative analysis is based on the analysis of thin standards. Correction for self-absorption of X-rays is made, but incident beam attenuation is not taken into account. Even for surface-sensitive PIXE, the contribution of the backing must be subtracted from that of the metal marks. Therefore, at least five points on the drawing marks and on the backing are analysed. If several patterns are drawn on the same sheet, each of them is analysed separately [Duval et al 2004]. Results and discussion On the portrait of ‘Willibald Pirckheimer’ 30 points were successfully analysed using SR-XRF. It was confirmed that all parts of the drawing, the inscription and the figure, were realised with silverpoint, except the two Dürer monograms next to the figure. Those were executed with another drawing material, probably with ink. The silver marks also contained copper and mercury. No other metallic element was identified above the detection limit (~1 wt.%). The presence of mercury can be attributed to an enrichment of the silver particles over time [Nowakowski et al. 2002]. The measurements showed (23.9 ± 9.7) wt% of copper for the portrait and (24.2 ± 8.8) wt% for the inscription. Even if the measurement uncertainties are relatively high - due to the above-mentioned intrinsic features of the drawings - it can be assumed that the inscription and the figure were made with the same silverpoint. Therefore, it is very likely that the inscription was created at the same time as the figure and consequently most probably by the sitter Willibald Pirckheimer with Dürer's stylus as already suspected by art historians. The results of the SR-XRF and µ-PIXE analyses of the drawings of the sketchbook are shown in tables 1 and 2. All drawings are confirmed to be silverpoint drawings. Three other minor elements, copper, zinc, and mercury, could also be found in the silver marks, as concentrations are significantly higher in these than in the backing. As shown in Table 2 all marks of the drawings from Berlin contain about (10.6 ± 3.5) wt% of copper. Zinc concentrations are generally in the range of those found in the backing. Furthermore, variable concentrations of mercury of up to some tens of wt% were found in all marks. As already stated, this observation is a general alteration phenomenon of metalpoint drawings [Duval et al. 2004, Reiche et al. 2004a and b]. These results are consistent with those obtained by µ-PIXE on six other sheets of the sketchbook (Table 2, Fig. 4). The marks of the silverpoint drawings contain about 6-10 wt% copper, less than 1 % zinc, and also variable mercury concentrations. Lead was also detected in parts of some drawings of the sketchbook. The detection of this element can be explained by the presence of lead point marks, which are also visible under the microscope. These marks are probably remnants of a preliminary lead point sketch, which was erased after the final silverpoint drawing was realised. Some drawings also showed minor contents of lead white in the preparation layer. Lead-white blackening was for instance observed on the sheet ‘Marx Ulstat, the beautiful woman of Antwerp’. Only in the right drawing ‘Portrait of the man with a fur cap’ of the sheet ‘Sitting bishop and portrait of a man with a fur cap’ (Fig. 5 and 6) was the zinc concentration as high as (5.0 ± 0.4) wt% in the silver mark. This abnormally high zinc content could be explained by the presence of glues generally used during restoration and fixing of drawings in the mount to strengthen the paper. Therefore, relatively high zinc concentrations could be found in the backing at the border of the sheets. This is also the reason why the marks of the drawings were always analysed at different points far
98
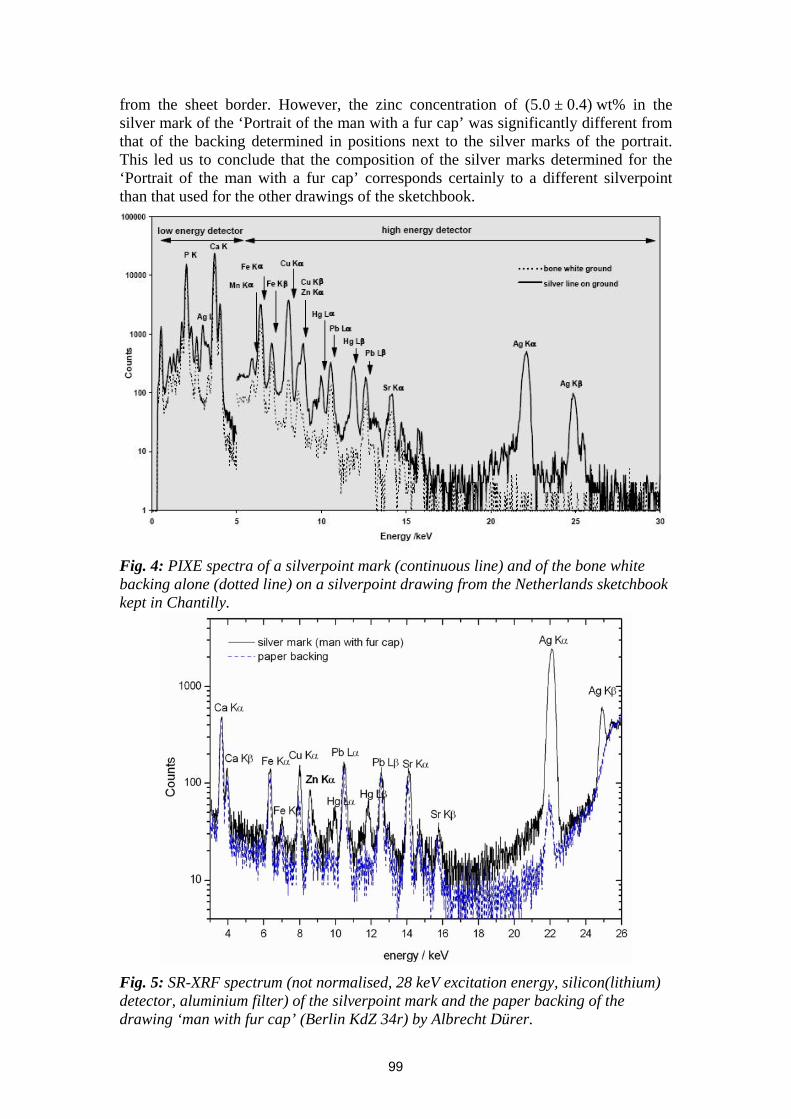
from the sheet border. However, the zinc concentration of (5.0 ± 0.4) wt% in the silver mark of the ‘Portrait of the man with a fur cap’ was significantly different from that of the backing determined in positions next to the silver marks of the portrait. This led us to conclude that the composition of the silver marks determined for the ‘Portrait of the man with a fur cap’ corresponds certainly to a different silverpoint than that used for the other drawings of the sketchbook.
Fig. 4: PIXE spectra of a silverpoint mark (continuous line) and of the bone white backing alone (dotted line) on a silverpoint drawing from the Netherlands sketchbook kept in Chantilly.
Fig. 5: SR-XRF spectrum (not normalised, 28 keV excitation energy, silicon(lithium) detector, aluminium filter) of the silverpoint mark and the paper backing of the drawing ‘man with fur cap’ (Berlin KdZ 34r) by Albrecht Dürer.
99
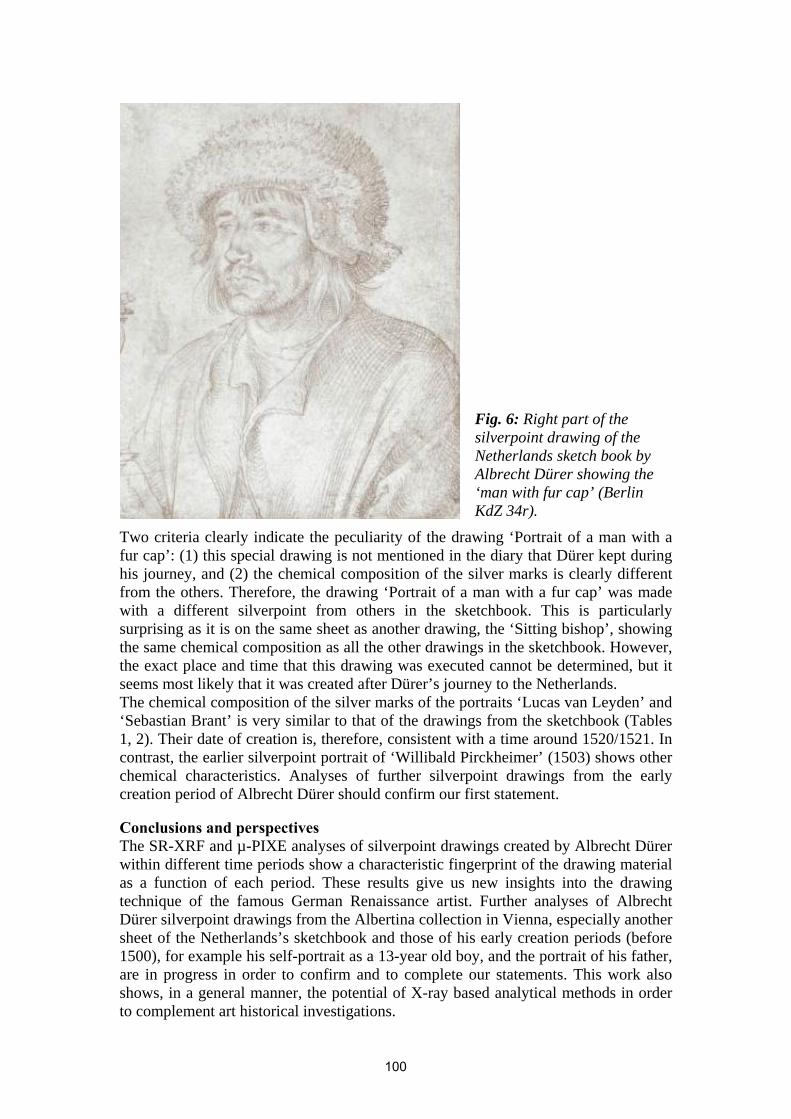
Fig. 6: Right part of the silverpoint drawing of the Netherlands sketch book by Albrecht Dürer showing the ‘man with fur cap’ (Berlin KdZ 34r).
Two criteria clearly indicate the peculiarity of the drawing ‘Portrait of a man with a fur cap’: (1) this special drawing is not mentioned in the diary that Dürer kept during his journey, and (2) the chemical composition of the silver marks is clearly different from the others. Therefore, the drawing ‘Portrait of a man with a fur cap’ was made with a different silverpoint from others in the sketchbook. This is particularly surprising as it is on the same sheet as another drawing, the ‘Sitting bishop’, showing the same chemical composition as all the other drawings in the sketchbook. However, the exact place and time that this drawing was executed cannot be determined, but it seems most likely that it was created after Dürer’s journey to the Netherlands. The chemical composition of the silver marks of the portraits ‘Lucas van Leyden’ and ‘Sebastian Brant’ is very similar to that of the drawings from the sketchbook (Tables 1, 2). Their date of creation is, therefore, consistent with a time around 1520/1521. In contrast, the earlier silverpoint portrait of ‘Willibald Pirckheimer’ (1503) shows other chemical characteristics. Analyses of further silverpoint drawings from the early creation period of Albrecht Dürer should confirm our first statement. Conclusions and perspectives The SR-XRF and µ-PIXE analyses of silverpoint drawings created by Albrecht Dürer within different time periods show a characteristic fingerprint of the drawing material as a function of each period. These results give us new insights into the drawing technique of the famous German Renaissance artist. Further analyses of Albrecht Dürer silverpoint drawings from the Albertina collection in Vienna, especially another sheet of the Netherlands’s sketchbook and those of his early creation periods (before 1500), for example his self-portrait as a 13-year old boy, and the portrait of his father, are in progress in order to confirm and to complete our statements. This work also shows, in a general manner, the potential of X-ray based analytical methods in order to complement art historical investigations.
100
Acknowledgements We gratefully acknowledge the help and support prior to and during beam time of H. Bevers, E. Alex, C. Severit, R. Fricke and R. Wittich (Staatliche Museen Berlin, Kupferstichkabinett), R. Schmutzler, M. Sonnabend and S. Buck (Graphische Sammlung Städel, Frankfurt/M). We would also like to thank BESSY for allocating beam time at BAMline. The AGLAE team is acknowledged for support during PIXE measurements. This work was also supported by the German Academic Exchange Service (DAAD) and the French Ministry of Research and Education under the contract number (D/0122896). It also benefited from a COST G8 short term mission to Vienna for continuing this project and analysing Albrecht Dürer drawings from the Albertina collection in Vienna. References
• AXIL QXAS package, IAEA Vienna. • Buck, S. 2003 Wendepunkte deutscher Zeichenkunst. Spätgotik und
Renaissance im Städel, Exh.Cat., Städelsches Kunstinstitut und Städtische Galerie, Graphische Sammlung 2003, Frankfurt a.M., Nr. 28.
• Calligaro, T., Dran, J.C., Moignard, B. et al. 2002. Ion beam analysis with external beams : Recent set-up improvements. Nuclear Instruments and Methods in Physics Research B 188, 135-140.
• Duval, A., Guicharnaud, H., Dran, J.C. 2004. Particle induced X-ray emission: a valuable tool for the analysis of metalpoint drawings Nuclear Instruments and Methods in Physics Research B 226, 60-74.
• Görner, W., Hentschel, M.P., Müller, B.R. et al. 2001. BAMline: the first hard X-ray beamline at BESSY II. Nuclear Instruments and Methods in Physics Research A 467, 703-706.
• Guicharnaud, H., Duval, A. 1999. Analyse des dessins de Dürer à la pointe métallique au Laboratoire de Recherche des Musées de France, in : exhibition catalogue ‘Dessins allemands et flamands au musée Condé à Chantilly’, 15 sept.99-17 janv. 00. Editions de la Réunion des musées nationaux, Paris, 144-146.
• Maxwell, J. A., Campbell, J.L., Teesdale, W.J. 1988. The Guelph PIXE Software Package. Nuclear Instruments and Methods in Physics Research B 43, 218-230
• Machilek, F. 2000. Exhibition catalogue. Albrecht Dürer und der Humanismus in Nürnberg. In: Matthias Mende: Albrecht Dürer - ein Künstler in seiner Stadt. Stadtmuseum Fembohaus Nürnberg 23.7.-17.9.2000, Nürnberg, 44-76.
• Mende, M. pers. comm. • Nowakowski, R., Pielaszek, J. and Dus R. 2002. Surface mediated Ag-Hg-
alloy formation under ambient and vacuum conditions - AFM and XRD investigations Applied Surface Science 199, 40-51.
• Reiche, I., Berger, A., Görner, W. et al. 2004a. Following the traces of Albrecht Dürer: Analysis of silverpoint drawings by spatially resolved synchrotron-induced X-ray fluorescence analysis Nuclear Instruments and Methods in Physics Research B 226, 83-91.
• Reiche, I., Berger, A., Görner, W. et al. 2004b. Spatially resolved Synchrotron-induced X-ray fluorescence analyses of metal point drawings and their mysterious inscriptions. Spectrochimica Acta B 59, 1657-1662.
• Rupprich, H. (Ed.) 1956. Dürer Schriftlicher Nachlass, Deutscher Verein für Kunstwissenschaft, Berlin, 146-204.
101
Bronze Age Painted Plaster in Mycenaean Greece: An Application of Micro-Raman Spectroscopy within the context of collaborative
research
Ann Brysbaert1 and Peter Vandenabeele² 1Dept. of Museum Studies, Univ. of Leicester, U.K., Geoarchaeology Research Associate, Wiener
Laboratory, ASCSA, 54 Odos Souidias, 106-76 Athens, Greece ² Dept. of Analytical Chemistry, Ghent University, Belgium
(corresponding author: [email protected]) Abstract Minoan and Mycenaean painted plaster, found in several locations in Greece from the end of the 19th and early 20th centuries onwards, have been subjected to iconographic and technological studies in order to understand the socio-political and economic dynamics of these prehistoric societies. These Bronze Age paintings on plaster claim to be among the first ones to be executed in the buon fresco technique. In order to investigate technological aspects of these fragmentary paintings past studies employed wet chemical methods, X-Ray Diffraction (XRD), Optical Emission Spectroscopy (OES) and a range of microscopic techniques based on cross-sections of samples. Since most of these methods require destructive sampling, other non/micro-destructive approaches are being tested at present. Micro-Raman Spectroscopy (MRS) has proven more than once its potential in non-destructive analysis in works of art and archaeology in the recent past. This contribution, first, presents its application to the early fragmentary material of Minoan and Mycenaean Bronze Age painted plaster for the first time. Second, by aiming to employ a virtual non-destructive technique such as MRS, it also demonstrates how collaborative interdisciplinary research benefits all parties involved. Interesting scientific outcomes were the identification of both organic (indigo) and non-crystalline materials (limonite). Especially the identification of indigo was unique and complements the knowledge obtained from traditionally used techniques. Furthermore, since the non-destructive MRS results were compared favourably with the traditional, more destructive XRD results, the method can hence be considered very useful in future sample reducing strategies for archaeological material and technical studies. We see this outcome as the result of a very positive interdisciplinary collaboration between scientists and archaeologists.
Keywords: Aegean Bronze Age, wall paintings, micro-Raman spectroscopy, non-destructive material analysis
Introduction Via studies based on either iconography or on technological aspects, Bronze Age Aegean and Eastern Mediterranean painted plaster remains have become better understood since their first discoveries early last century [e.g. Cameron et al 1977]. These studies, investigated, among other issues, the chronology of wall paintings and added to our knowledge about contacts between Bronze Age societies [e.g. Crowley 1989, Immerwahr 1990, Caubet 1998, Knapp 1998, Niemeier 1998, Manning 2000]. Although both iconographic [see for instance the articles by Morgan: 1995, 1996, 1998] and technological studies [several contributions in Sherratt 2000] each have their value, they have never been combined through an interdisciplinary approach [see for instance Karetsou 2000, Shortland 2001, Brysbaert 2004a, 2004b], in order to provide the maximum on information to be extracted from this fragile and scarce material.
102
During the last 5 to 10 years another factor has become increasingly limiting to the entirety of this study, namely the ‘easy’ access to sample material. In this context, traditional instrumental analysis brought with it obvious and inherent problems and difficulties, one being the fact that sampling with the purpose of analysis of pigments, plaster mixtures and painting techniques was seriously destructive. Although the issue of destructiveness versus non-destructiveness is open to discussion and interpretation, the only way to continue to work with archaeological material was to move towards non-destructive techniques for analytical purposes [see also Brysbaert 2004]. Non-destructive approaches, both analytical and experimental, are many fold and their application field is expanding rapidly [e.g. Devos et al. 1995; Paolletti and Schirripa Spagnolo 1995; Vandenabeele et al. 2000, 2002, 2003; Chryssikopoulou 2000; Brysbaert 2003a, 2003b]. Nevertheless, it is felt that care needs to be taken during the new period of enthusiasm and that none of these new techniques may be employed haphazardly without having been tested thoroughly for their uses (demonstrating their advantages and disadvantages) and potential applications. These tests need to demonstrate what the technique can provide in relation to and in answer to the archaeological, historical, archaeometric or art historical questions posed. This can only be achieved through a comparative approach, using traditional (destructive) techniques and new (non-destructive) techniques. Results obtained by both approaches need to be compared [see also Brysbaert and Vandenabeele 2004; Brysbaert et al. in press] and evaluated in order to see how non-destructive new methods can contribute to technological studies on archaeological fragile and scarce material. Of utmost importance within this framework is the necessary thorough communication between the different parties involved. Too often in the past, information was lost or misunderstood because people from completely different backgrounds either did not communicate or did not understand each other enough to be satisfied with their collaborative efforts [Jones 2002]. This paper presents the aims, the objectives, and the first results of a small research project that was set up between the University of Ghent (P. Vandenabeele) and the University of Glasgow (Ann Brysbaert) to employ, for the first time systematically and comparatively, Micro-Raman Spectroscopy as a non-destructive technique. This work aims, among others, to identify the pigments of Bronze Age painted plaster from the Aegean and Eastern Mediterranean. The implications of this work are many fold, one being that these paintings on walls and floors can claim to be the first ones ever to have been executed in the buon fresco technique. In this context the non-destructive approach, therefore, is crucial. This collaborative work is considered a pilot study and entails several future strands for potential research and applications, some of which will be referred to below. Aims and objectives Since the COST G8 objectives are: ‘to achieve a better preservation and conservation of our cultural heritage by increasing the knowledge in museum objects through non-destructive analysis and testing and by improving the synergy between art historians, archaeologists, conservators and natural scientists.’ it was felt that within the framework of COST G8, the collaboration between the two coworkers (Dr. P. Vandenabeele: a chemist and Dr. A. Brysbaert: an archaeologist-archaeological conservator), both having an interest in each other’s field, could provide a useful interdisciplinary approach to this material. The aims of the proposed project were outlined as follows:
103
1. To carry out the analysis of painted plaster surfaces from the Aegean and Eastern Mediterranean Bronze Age and to interpret the results in order to identify the pigments by means of the non-destructive Micro-Raman Spectroscopy method.
2. To compare the results of this pilot study with those obtained by traditional means (such as XRD) on Aegean Bronze Age painted plaster. (In more recent work, however, XRD has become less destructive when not used as a powder sample but as a surface sample. Since the 1990s, this technique has been applied successfully, [see for instance Perdikatsis 1998, Perdikatsis et al. 2000, Brysbaert and Perdikatsis: in press]),
3. To provide materials for the extension of a comparative database upon which Raman techniques are based.
4. To make both scientists involved (chemist, archaeologist-conservator) acquainted with each other’s research field. P. Vandenabeele is interested in new application fields for the Raman technique and A. Brysbaert is interested in the use of the non-destructive Micro-Raman instrumentation.
Methodology [see Strommen 1997, Cariati and Bruni 2000] The material under study comprised a selection of pigments from Bronze Age decorated plaster from the Aegean and the broader East Mediterranean, covering the period of the late Middle Bronze Age until the end of the Bronze Age. The following sites were selected: Knossos, Palaikastro, Monastiraki (Crete), Phylakopi (Milos), Gla, Thebes, Mycenae, Tiryns and Orchomenos (mainland Greece), Miletus (Asia Minor), Tell Alalakh (Hatay-Turkey, stored in the Ashmolean Museum), and Tell el-Dab'a (Egypt). Since A. Brysbaert employed X-Ray Diffraction (XRD), Scanning Electron Microscope (SEM) and several optical microscopy techniques as part of her PhD research project, using samples small in number and size, it was decided that micro-sampling from the already existing samples was a legitimate way to work as non-destructively as possible. The micro-sampling method that was employed, using tiny cotton wool Q-tips for pigment removal from the substrate, has been described in detail elsewhere [Devos et al 1995, Vandenabeele et al 2000, 2002, 2003; Brysbaert and Vandenabeele 2004]. Of the 87 samples that were to be measured and analysed, 3/4 were measured before A. Brysbaert’s arrival at the analytical Chemistry Laboratories at Ghent University. She then measured the remaining 1/4 as part of the learning process in order for her to get familiar with the equipment and the procedure. The Q-tip was tapped onto the surface of a cleaned microscope glass slide in order to release some pigment grains/particles onto this glass carrier. By focussing the laser beam onto the individual particle, a molecular spectrum of that particle was recorded. All measurements were carried out using the Renishaw System-1000 spectrometer with a 785 nm diode laser, and CCD detector. By means of an X50 objective lens the grains were examined and measured. Spectra were then computerised using the Grams/32 (version 5.21) software while the Peaker Q-basic reference collection of spectra facilitated the interpretation and identification of the spectra measured. Inconclusive or incomplete spectra were re-measured and re-interpreted [see also Brysbaert: forthcoming]. Achievements and preliminary results The direct outcome of this collaboration proved to be even more successful than initially expected.
104
1. Interesting and satisfying results were obtained from a comparative study between samples analysed by XRD and by MRS. For those samples that could be identified a comparative preliminary study demonstrated clearly that the Raman results match the results given by XRD and SEM. In a few cases extra information was provided by the Raman technique, such as the first positive identification of indigo as a pigment on painted plaster from Thebes (Boeotia, Greece) [Brysbaert and Vandenabeele 2004: fig. 7], because Raman Spectroscopy also detects organic matter, not detectable by XRD nor SEM. This could be the reason why organic pigments have not yet frequently and positively identified in the past apart from the obvious carbon black (lamp black, bone black). The retrieval of spectra of organic substances, however, formed another problem in that not all were already covered by reference spectra. This meant that their identification was limited or impossible until references are found (but see below).
2. The non-destructive Micro-Raman analysis, employing the instrumentation as it was set up, worked for a range of pigments but not for all. While A. Brysbaert had put emphasis on blue, green and purple colours, several of the blue pigments could not be identified via MRS. This was due to the fact that the wavelength of the laser was not compatible with this blue pigment, causing most often an overload or fluorescence in the measured particles. However, this fact in itself became a useful result in that communication between the two co-workers clarified the fact that Raman is not a problematic technique for this material but that certain adjustments in the configuration of the instrument may provide analytical data. In order to solve this problem, a small selection of blue pigments will be re-measured with another Micro-Raman laser beam. The purple samples from Gla need further investigation because it is clear that this colouring material is of organic origin and has, until now, not been identified yet [Brysbaert: forthcoming].
3. A. Brysbaert achieved a far better understanding of the entire process of analysis by carrying out the measurements of a certain number of the samples herself, and this acquired skill became very helpful in the next step of interpreting the spectra. In becoming familiar with the software (Grams/32, Version 5.21, Peaker Q-Basic) and the use of the reference libraries that Raman Spectroscopy offers, A. Brysbaert also followed through this last step of the analytical work. This again provided the necessary information to bridge the gap between the disciplines involved and provided, as such, a much better insight in the problems that can occur in employing a certain analytical technique on a specific group of material. In a technological study as outlined above, it is of vital importance to work at an interdisciplinary level. Having followed up every single step of the work that starts at the material retrieval, to sampling and to the range of steps involved in the analytical work, until the communication stage of the results with experts, existing gaps between the interdisciplinary understanding of the entire process became smaller.
4. The analytical work itself also provided some unexpected data and these were presented in a joint paper at the Raman Spectroscopy Conference in Ghent (Sept. 2003) [Brysbaert and Vandenabeele 2004].
5. Both co-workers have discussed the continuation of this collaboration since this work provided multiple windows to future more extensive and focused research applications in this field. One of the potential future collaborations is related to finding and measuring more reference materials, present in pigments from the
105
above-mentioned paintings, for the expansion of the Micro-Raman reference library upon which all identifications of spectra are based.
In the meantime, A. Brysbaert has provided a small selection of raw materials as reference materials to P. Vandenabeele at the Analytical Chemistry Laboratory, Ghent, Belgium, with the intention to expand the possibilities to identify specific blue pigments used during the Bronze Age in the Aegean and eastern Mediterranean. Conclusions In summary the following advantages of the use of Micro-Raman Spectroscopy in this study became clear: - Given certain adaptations of the variables within the set-up of the instrumentation,
traditional (destructive) techniques, previously used. - Because of the analytical power of the instrumentation, new and, therefore, rather
unexpected results were produced, such as the positive identification of indigo blue at Thebes. Other unidentified organic and inorganic pigments need further investigation in the future and this is already planned.
- More general, where good communication is possible, interesting and fruitful collaborations between scholars from the exact sciences and those from the archaeological and art historical disciplines may exist. We feel this study has amply demonstrated this point. Such collaboration also helps in the dissemination of information in both directions.
Acknowledgements A. Brysbaert would like to thank first of all Prof. L. Moens and Dr. P. Vandenabeele at the University of Ghent, Belgium, for their hospitality and kind help in guiding an archaeologist into the new world of Micro-Raman Spectroscopy. She, furthermore, wants to thank warm heartedly Prof. A. Adriaens for her encouragement in this specific research and for interesting discussions about non-destructive techniques in works of art and archaeology. The funding she received in 2003 as a young researcher within the framework of COST G8 to carry out this work at the Dept. of Analytical Chemistry at Ghent University, Belgium, is hereby greatly acknowledged. Lastly, she wants to thank Prof. B. Knapp and Dr. R. Jones, University of Glasgow, whose continuous help during her PhD research was crucial to its outcome. P. Vandenabeele acknowledges the FWO-Vlaanderen for his Post Doctoral Fellowship. References
• Brysbaert A. 2003(a). Rotating Angles in Measuring the Aegean Bronze Age. The Technology of Bronze Age Painted Plaster from the Aegean and Eastern Mediterranean. In: K. Foster and R. Laffineur (eds). METRON. Measuring the Aegean Bronze Age. Proceedings of the 9th International Aegean Conference. New Haven, Yale University, 18-21 April, 2002, Liège-Austin: Université de Liège, 167-178.
• Brysbaert A. 2003(b). Does DIY Work? Experimentation and the Archaeology of Technology in an Aegean Bronze Age Context. In: A. Brysbaert, N. De Bruijn, E. Gibson, A. Michael and M. Monaghan (eds.) Symposium on Mediterranean Archaeology (SOMA) 2002. Proceedings of the 6th Annual Meeting of Postgraduate Researchers. Held at the University of Glasgow, Department of Archaeology, 15-17 Feb., 2002, Oxford: Archaeopress, 7-16.
• Brysbaert A. 2004. Take It or Leave It? Implications and Results of Destructive Versus non-Destructive Analysis of Bronze Age Painted Plaster in
106
the Eastern Aegean. In: L. Cleland, K. Stears with G. Davies (eds.) Colours in the Ancient Mediterranean World. Conference held at the University of Edinburgh: 10-13 Sept. 2001, (British Archaeological Reports, International Series), Oxford: Archaeopress, 9-15.
• Brysbaert A. (forthcoming) Characterisation of a ‘purple’ pigment used for al fresco painting at Gla, Greece, Studies in Conservation.
• Brysbaert A. and P. Vandenabeele 2004. Bronze Age Painted Plaster in Mycenaean Greece: A Pilot Study on the Testing and Application of Micro-Raman Spectroscopy. Journal of Raman Spectroscopy 35, 8/9, 686-693.
• Brysbaert A., Melessanaki K., Anglos D. Pigment Analysis in Bronze Age Aegean and Eastern Mediterranean Painted Plaster by Laser Induced Breakdown Spectroscopy. Journal of Archaeological Science (in press).
• Brysbaert A., Perdikatsis V. Bronze Age Painted Plaster from the Greek Mainland: a Comparative Study of its Technology by Means of XRD Analysis and Optical Microscopy Techniques. In: Y. Facorellis, N. Zacharias, K. Polikreti, T. Vakoulis, Y. Bassiakos, V. Kiriatzi, E. Aloupi (eds.) Archaeometry Studies in the Aegean: Reviews and Recent Developments. Proceedings of the 4th HSA Symposium on Archaeometry, (British Archaeological Reports, International Series), Oxford: Archaeopress. (in press).
• Cameron M.A.S., Jones R.E., Philippakis S.E. 1977. Scientific Analysis of Minoan Fresco Samples from Knossos. Annual of the British School at Athens 72, 121-184.
• Chryssikopoulou E., Kilikoglou V., Perdikatsis V., Sotiropoulou S., Birtacha K., Zacharioudakis M. 2000. Making Wall Paintings: An Attempt to Reproduce the Painting Techniques of Bronze Age Thera. In : S. Sherratt (ed.) The Wall Paintings of Thera. Proceedings of the First International Symposium. Petros M. Nomikos Conference Centre, Thera, Hellas. 30 August-4 Sept. 1997, Athens: Petros M. Nomikos and The Thera Foundation, 119-127.
• Cariati F. and S. Bruni 2000. Raman Spectroscopy. In: E. Ciliberto and G. Spoto (eds) Modern Analytical Methods in Art and Archaeology, New York: A John Wiley and Sons, Inc., Publication, 255-176.
• Caubet A. 1998. The International Style. In: E.H. Cline and D. Harris-Cline (eds) The Aegean and the Orient in the Second Millennium (Aegaeum 18), 105-116.
• Crowley J.L. 1989. The Aegean and the East. An Investigation into the Transference of Artistic Motifs between the Aegean, Egypt, and the Near East in the Bronze Age, Jonsered: P. Åström Förlag.
• Devos W., Moens L., von Bohlen A. and R. Klockenkaemper 1995. Ultra-Microanalysis of Inorganic Pigments on Painted Objects by Total Reflection X-Ray Fluorescence Analysis. Studies in Conservation 40, 153-162.
• Immerwahr S.A. 1990. Aegean Painting in the Bronze Age, Philadelphia: Pennsylvania State University Press.
• Jones A. 2002. Archaeological Theory and Scientific Practice, Cambridge: Cambridge University Press.
• Karetsou A. (ed.) 2000. Κρήτη-Αίγυπτος. Πολυτισµικοί δέσµοι τριών χιλιετών. Μελέτες. Αθήνα: Υπουργείο Πολιτισµού-Αρχαιολογικό µουσείο Ηρακλείου.
• Knapp A.B. 1998. Mediterranean Bronze Age Trade: Distance, Power and Place. In: E.H. Cline and D. Harris-Cline (eds.) The Aegean and the Orient in the Second Millennium – (Aegaeum 18), 193-207.
107
• Manning S. 1999. A Test of Time. The Volcano of Thera and the Chronology and History of the Aegean and East Mediterranean in the Second Millennium BC, Oxford: Oxbow Books.
• Morgan L. 1995. Minoan Painting and Egypt: The Case of Tell el-Dab’a. In: W.V.Davies and L. Schofield (eds.) Egypt, the Aegean and the Levant: Interconnections in the Second Millennium BC, London: British Museum Press, 29-53.
• Morgan L. 1996. Of Animals and Men: the Symbolic Parallel. In: C. Morris (ed.). Klados: Essays in Honour of J.N. Coldstream. London: Institute of Classical Studies, 171-185.
• Morgan L. 1998. Power of the Beast: Human-Animal Symbolism in Egyptian and Aegean Art. In: M. Bietak (ed.) Egypt and the Levant: International Journal for Egyptian Archaeology and Related Disciplines VII. Ferdinand Berger & Söhne Ges.m.b.H, Horn :17-32.
• Niemeier W-D and B. 1998. Minoan Frescoes in the Eastern Mediterranean. In: E.H. Cline and D. Harris-Cline (eds.) The Aegean and the Orient in the Second Millennium, (Aegaeum 18), 61-98.
• Paoletti D., Schirripa Spagnolo G. 1995. The Potential of Portable TV Holography for Examining Frescoes in situ. Studies in Conservation 40, 127-132.
• Perdikatsis V. 1998. Analysis of Greek Bronze Age Wall Painting Pigments. In: S. Colinart and M. Menu (eds) La Couleur dans la Peinture et l’ Emaillage de l’ Egypte Ancienne. Actes de la Table Ronde, Ravello, 20-22 Mars 1997, Bari: Epuglia: 103-108.
• Perdikatsis V., Kilikoglou V., Sotiropoulou S. and E. Chryssikopoulou 2000. Physiochemical characterization of pigments of Theran wall paintings. In: S. Sherratt (ed.), The wall paintings of Thera. Proceedings of the first international symposium. Petros M. Nomikos Conference Centre, Thera, Hellas. 30 August-4 September 1997, Athens: Petros M. Nomikos and The Thera Foundation, 103-118.
• Sherratt S. (ed.) 2000. The Wall Paintings of Thera. Proceedings of the First International Symposium. Petros M. Nomikos Conference Centre, Thera, Hellas. 30 August-4 September 1997, Athens: Petros M. Nomikos and The Thera Foundation.
• Shortland A.J. (ed.) 2001. The Social Context of Technological Change. Egypt and the Near East, 1650-1550 BC. Proceedings of a Conference held at St Edmund Hall, Oxford, 12-14 Sept. 2000, Oxford: Oxbow Books.
• Strommen D.P. 1997. Raman Spectroscopy. In: F.A. Settle (ed.) Handbook of Instrumental Techniques for Analytical Chemistry, Upper Saddle River: Prentice Hall PTR, 285-307.
• Vandenabeele P., von Bohlen A., Moens L., Klockenkaemper R., Joukes F., Dewispelaere G. 2000. Spectroscopic Examination of Two Egyptian Masks: A Combined Method Approach. Analytical Letters 33 (15), 3315-3332.
• Vandenabeele P. and L. Moens 2002. La Spectroscopie Micro-Raman et l’ Analyse des objets d’ Art: Une Fructueuse Association. In: D. Allart and P. Hoffsummer (eds) L’ Archeometrie au Service des Monuments et des Oeuvres d’ Art. (Dossier de la Commission Royale des Monuments, Sites et Fouilles, 10), 173-177.
• Vandenabeele P. and L. Moens 2003. Micro-Raman Spectroscopy of Natural and Synthetic Indigo Samples. Analyst 128, 187-193.
108
Ceramics and Stone

Provenancing Merovingian Garnets by PIXE and µ-Raman Spectrometry
P. Périn1, F. Vallet1, T. Calligaro2, D. Bagault2, J.-P. Poirot3
1 Musée des Antiquités Nationales, 78100 Saint-Germain-en-Laye, France 2 C2RMF, Palais du Louvre, 75001 Paris, France
3 56 rue de paradis, 75010 Paris, France (corresponding author: [email protected])
Abstract PIXE and µ-Raman spectroscopy can provide non-destructive, non-invasive, rapid and sensitive analyses of artefacts that can be used to address the three major issues in the field of Art and Archaeology: 1) identification of the material, 2) determination of the provenance and 3) study of surface modification (ageing, alteration). The present study deals with the determination of the provenance of the red garnets mounted on Merovingian jewels (5th-7th century A.D.). The composition in major elements obtained by PIXE allowed these gemstones to be identified as garnets of the pyraldine family (X3Al2Si3O12, X=Fe (iron), Mg (magnesium), Mn (manganese)). The trace element content of these garnets, combined with the characterisation of microscopic mineral inclusions by µ-Raman spectrometry and by PIXE with a nuclear microprobe allowed the determination of their origin. The majority of archaeological garnets (75 %) appear to be almandines originating from India, while pyropes from East Europe were employed for the latest jewels (7th century A.D.). On a few artefacts we observed intermediate pyraldines garnets coming from Ceylon, a type of garnet usually also found on Roman jewels. This study yields interesting historical implications concerning the evolution of gem routes during the Dark ages.
Keywords: Middle Ages, Merovingian, cloisonné, provenance, garnet, Raman, microprobe, PIXE
Introduction The Germanic peoples who settled in Western Europe during the fall of the Roman Empire introduced a very specific style of jewellery labelled ‘Cloisonné Polychrome’ [Scukin, Bazan 1993, Kazanski, Périn, Calligaro 2000]. The gemstones used for these jewels were mostly red garnets, as thin and polished slices (<1 mm) inserted in a metallic cell structure, as shown in Fig. 1. The provenance of these garnets represents an important archaeological issue, in particular if we consider the large amounts of garnets required to manufacture these artefacts, which were not re-employed but eventually buried in tombs according to the Barbarian custom. The determination of their origin could also shed some light on the establishment and evolution of the routes for precious goods during the Dark ages. The studies conducted during the past forty years have generally concluded that these garnets were obtained through long distance trade with Asia or with Northern or Eastern Europe. [Greiff 1999, Mellis 1963, Roth 1980, Bimson 1982, Arrhenius 1985,Van Roy 1997, Farges 1998, Quast 2000]. Dealing with an unprecedented number of garnets (more than one thousand) mounted on Merovingian artefacts, this work aims to confirm these conclusions and to identify more precisely the sources of ancient garnets. Among the artefacts spanning the entire Merovingian period (5th-7th c.) which were investigated are pieces of jewellery from the necropolis of the basilica of Saint-Denis near Paris, and the famous jewels of the Frankish queen Aregonde today on display at the Louvre museum [Fleury 1998]. As in previous studies, mineralogical and chemical fingerprints of garnets were compared with reference garnets from various sources.
111
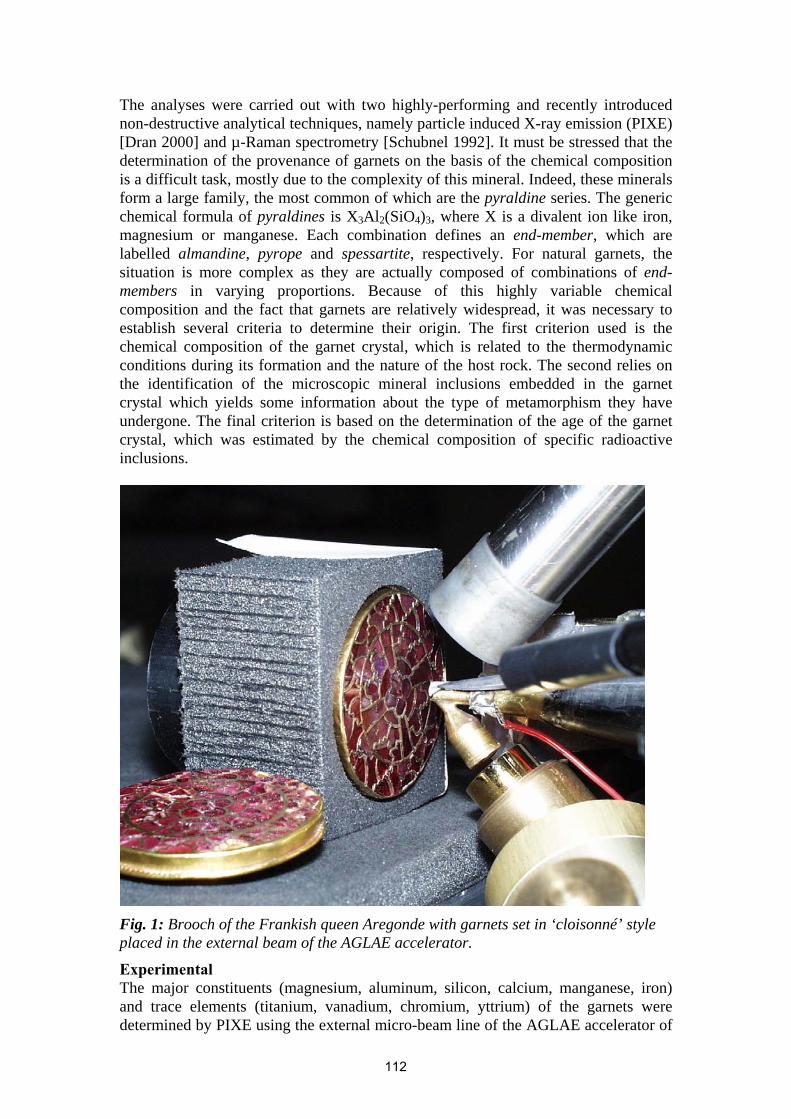
The analyses were carried out with two highly-performing and recently introduced non-destructive analytical techniques, namely particle induced X-ray emission (PIXE) [Dran 2000] and µ-Raman spectrometry [Schubnel 1992]. It must be stressed that the determination of the provenance of garnets on the basis of the chemical composition is a difficult task, mostly due to the complexity of this mineral. Indeed, these minerals form a large family, the most common of which are the pyraldine series. The generic chemical formula of pyraldines is X3Al2(SiO4)3, where X is a divalent ion like iron, magnesium or manganese. Each combination defines an end-member, which are labelled almandine, pyrope and spessartite, respectively. For natural garnets, the situation is more complex as they are actually composed of combinations of end-members in varying proportions. Because of this highly variable chemical composition and the fact that garnets are relatively widespread, it was necessary to establish several criteria to determine their origin. The first criterion used is the chemical composition of the garnet crystal, which is related to the thermodynamic conditions during its formation and the nature of the host rock. The second relies on the identification of the microscopic mineral inclusions embedded in the garnet crystal which yields some information about the type of metamorphism they have undergone. The final criterion is based on the determination of the age of the garnet crystal, which was estimated by the chemical composition of specific radioactive inclusions.
Fig. 1: Brooch of the Frankish queen Aregonde with garnets set in ‘cloisonné’ style placed in the external beam of the AGLAE accelerator.
Experimental The major constituents (magnesium, aluminum, silicon, calcium, manganese, iron) and trace elements (titanium, vanadium, chromium, yttrium) of the garnets were determined by PIXE using the external micro-beam line of the AGLAE accelerator of
112
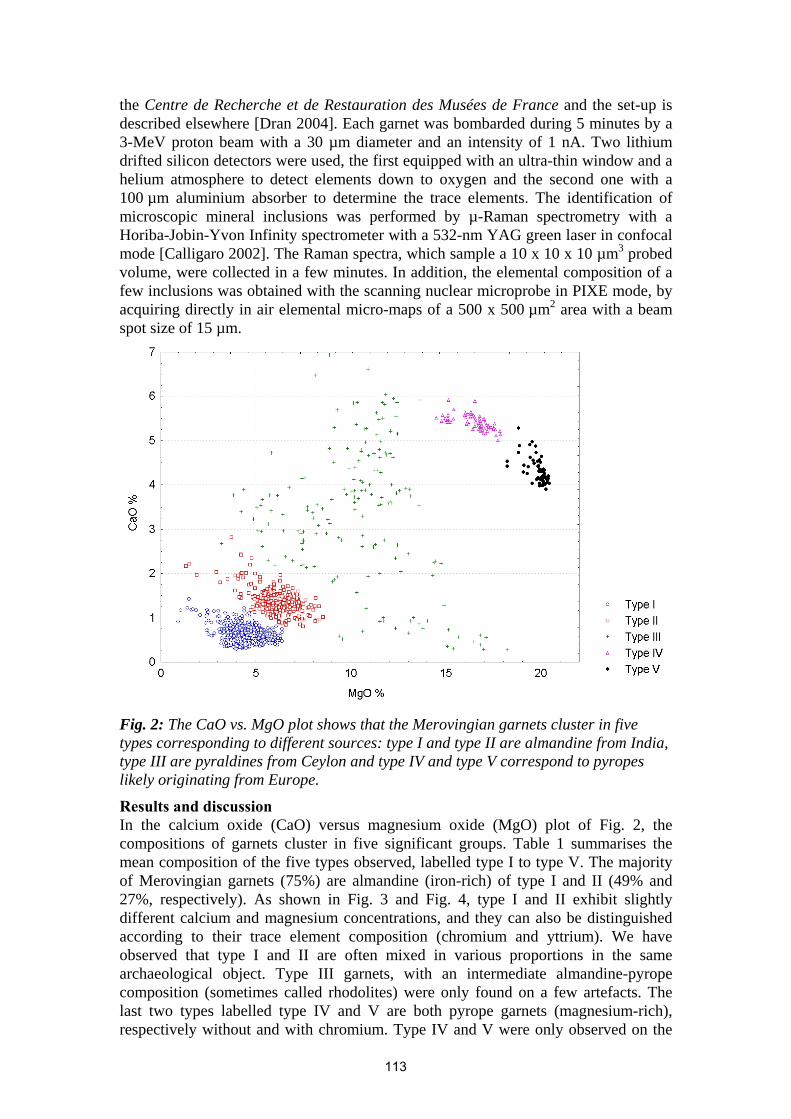
the Centre de Recherche et de Restauration des Musées de France and the set-up is described elsewhere [Dran 2004]. Each garnet was bombarded during 5 minutes by a 3-MeV proton beam with a 30 µm diameter and an intensity of 1 nA. Two lithium drifted silicon detectors were used, the first equipped with an ultra-thin window and a helium atmosphere to detect elements down to oxygen and the second one with a 100 µm aluminium absorber to determine the trace elements. The identification of microscopic mineral inclusions was performed by µ-Raman spectrometry with a Horiba-Jobin-Yvon Infinity spectrometer with a 532-nm YAG green laser in confocal mode [Calligaro 2002]. The Raman spectra, which sample a 10 x 10 x 10 µm3 probed volume, were collected in a few minutes. In addition, the elemental composition of a few inclusions was obtained with the scanning nuclear microprobe in PIXE mode, by acquiring directly in air elemental micro-maps of a 500 x 500 µm2 area with a beam spot size of 15 µm.
Fig. 2: The CaO vs. MgO plot shows that the Merovingian garnets cluster in five types corresponding to different sources: type I and type II are almandine from India, type III are pyraldines from Ceylon and type IV and type V correspond to pyropes likely originating from Europe.
Results and discussion In the calcium oxide (CaO) versus magnesium oxide (MgO) plot of Fig. 2, the compositions of garnets cluster in five significant groups. Table 1 summarises the mean composition of the five types observed, labelled type I to type V. The majority of Merovingian garnets (75%) are almandine (iron-rich) of type I and II (49% and 27%, respectively). As shown in Fig. 3 and Fig. 4, type I and II exhibit slightly different calcium and magnesium concentrations, and they can also be distinguished according to their trace element composition (chromium and yttrium). We have observed that type I and II are often mixed in various proportions in the same archaeological object. Type III garnets, with an intermediate almandine-pyrope composition (sometimes called rhodolites) were only found on a few artefacts. The last two types labelled type IV and V are both pyrope garnets (magnesium-rich), respectively without and with chromium. Type IV and V were only observed on the
113
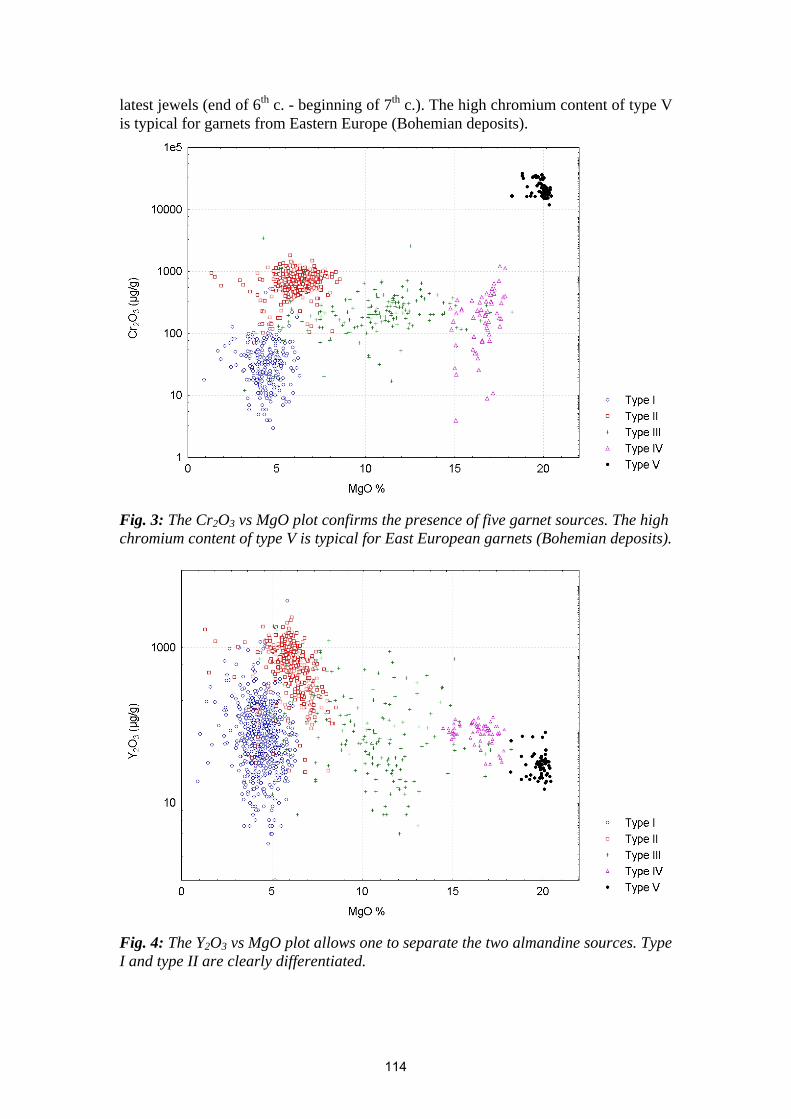
latest jewels (end of 6th c. - beginning of 7th c.). The high chromium content of type V is typical for garnets from Eastern Europe (Bohemian deposits).
Fig. 3: The Cr2O3 vs MgO plot confirms the presence of five garnet sources. The high chromium content of type V is typical for East European garnets (Bohemian deposits).
Fig. 4: The Y2O3 vs MgO plot allows one to separate the two almandine sources. Type I and type II are clearly differentiated.
114
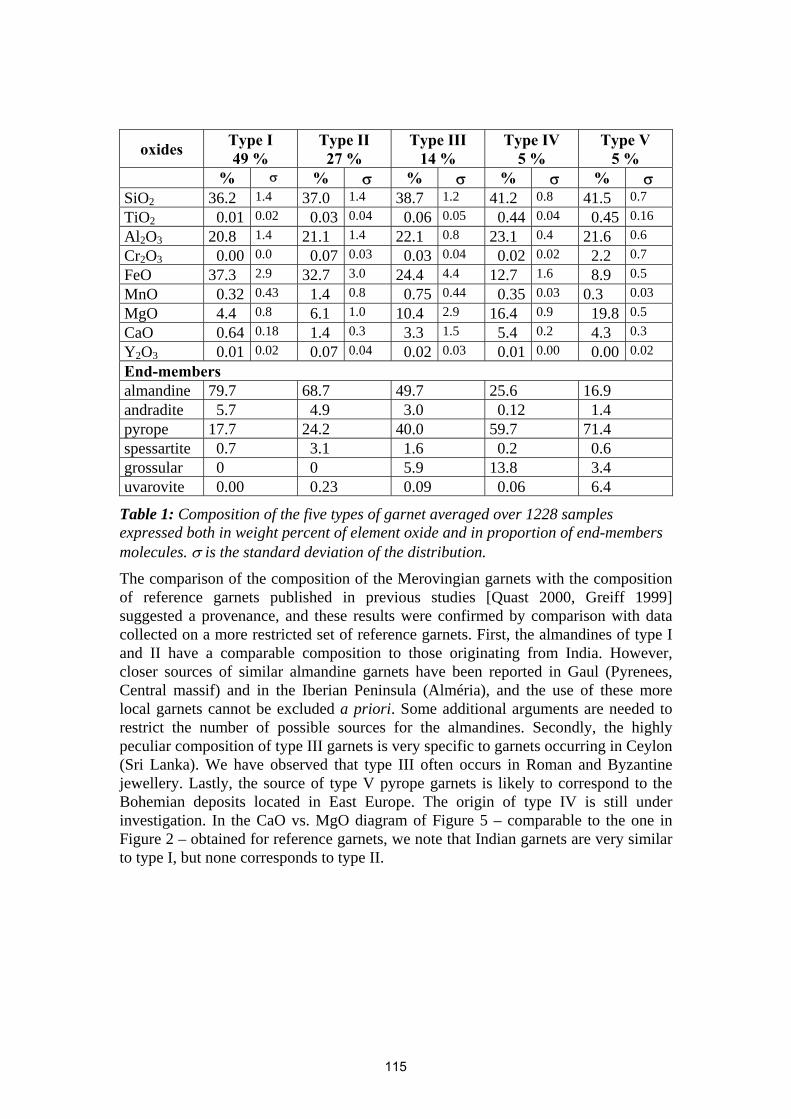
oxides Type I 49 %
Type II 27 %
Type III 14 %
Type IV 5 %
Type V 5 %
% σ % σ % σ % σ % σ SiO2 36.2 1.4 37.0 1.4 38.7 1.2 41.2 0.8 41.5 0.7 TiO2 0.01 0.02 0.03 0.04 0.06 0.05 0.44 0.04 0.45 0.16 Al2O3 20.8 1.4 21.1 1.4 22.1 0.8 23.1 0.4 21.6 0.6 Cr2O3 0.00 0.0 0.07 0.03 0.03 0.04 0.02 0.02 2.2 0.7 FeO 37.3 2.9 32.7 3.0 24.4 4.4 12.7 1.6 8.9 0.5 MnO 0.32 0.43 1.4 0.8 0.75 0.44 0.35 0.03 0.3 0.03 MgO 4.4 0.8 6.1 1.0 10.4 2.9 16.4 0.9 19.8 0.5 CaO 0.64 0.18 1.4 0.3 3.3 1.5 5.4 0.2 4.3 0.3 Y2O3 0.01 0.02 0.07 0.04 0.02 0.03 0.01 0.00 0.00 0.02
End-members almandine 79.7 68.7 49.7 25.6 16.9 andradite 5.7 4.9 3.0 0.12 1.4 pyrope 17.7 24.2 40.0 59.7 71.4 spessartite 0.7 3.1 1.6 0.2 0.6 grossular 0 0 5.9 13.8 3.4 uvarovite 0.00 0.23 0.09 0.06 6.4
Table 1: Composition of the five types of garnet averaged over 1228 samples expressed both in weight percent of element oxide and in proportion of end-members molecules. σ is the standard deviation of the distribution.
The comparison of the composition of the Merovingian garnets with the composition of reference garnets published in previous studies [Quast 2000, Greiff 1999] suggested a provenance, and these results were confirmed by comparison with data collected on a more restricted set of reference garnets. First, the almandines of type I and II have a comparable composition to those originating from India. However, closer sources of similar almandine garnets have been reported in Gaul (Pyrenees, Central massif) and in the Iberian Peninsula (Alméria), and the use of these more local garnets cannot be excluded a priori. Some additional arguments are needed to restrict the number of possible sources for the almandines. Secondly, the highly peculiar composition of type III garnets is very specific to garnets occurring in Ceylon (Sri Lanka). We have observed that type III often occurs in Roman and Byzantine jewellery. Lastly, the source of type V pyrope garnets is likely to correspond to the Bohemian deposits located in East Europe. The origin of type IV is still under investigation. In the CaO vs. MgO diagram of Figure 5 – comparable to the one in Figure 2 – obtained for reference garnets, we note that Indian garnets are very similar to type I, but none corresponds to type II.
115
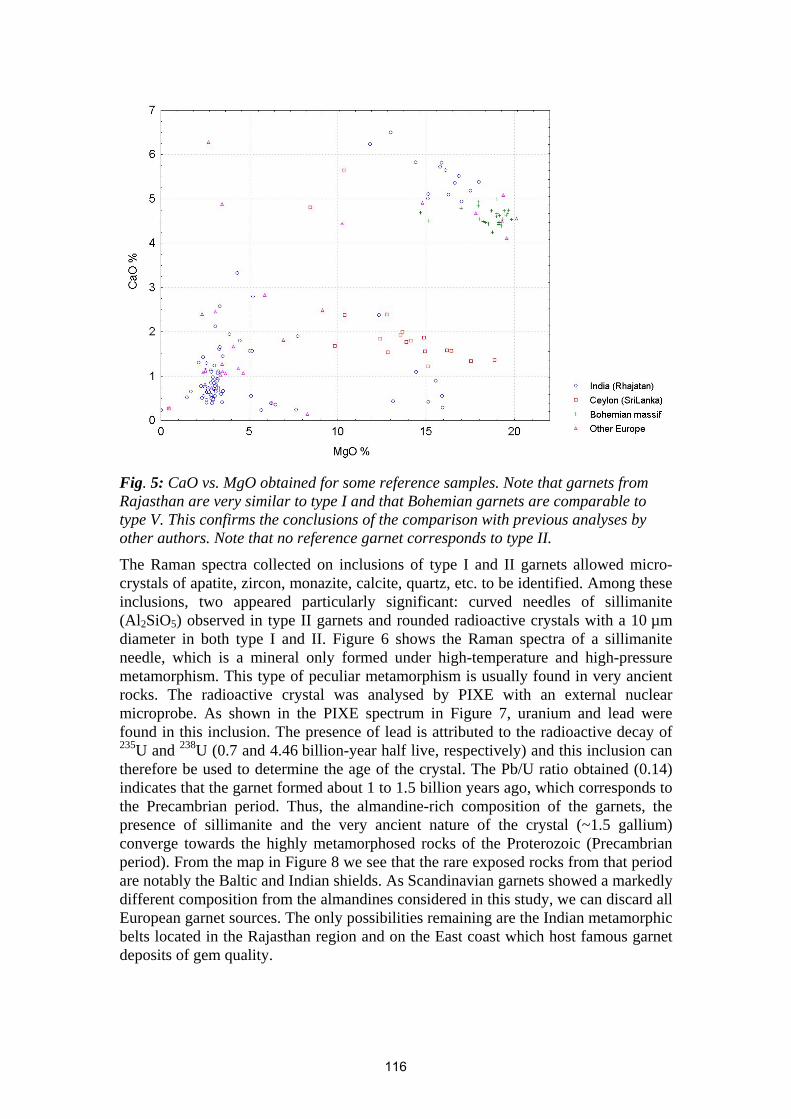
Fig. 5: CaO vs. MgO obtained for some reference samples. Note that garnets from Rajasthan are very similar to type I and that Bohemian garnets are comparable to type V. This confirms the conclusions of the comparison with previous analyses by other authors. Note that no reference garnet corresponds to type II.
The Raman spectra collected on inclusions of type I and II garnets allowed micro-crystals of apatite, zircon, monazite, calcite, quartz, etc. to be identified. Among these inclusions, two appeared particularly significant: curved needles of sillimanite (Al2SiO5) observed in type II garnets and rounded radioactive crystals with a 10 µm diameter in both type I and II. Figure 6 shows the Raman spectra of a sillimanite needle, which is a mineral only formed under high-temperature and high-pressure metamorphism. This type of peculiar metamorphism is usually found in very ancient rocks. The radioactive crystal was analysed by PIXE with an external nuclear microprobe. As shown in the PIXE spectrum in Figure 7, uranium and lead were found in this inclusion. The presence of lead is attributed to the radioactive decay of 235U and 238U (0.7 and 4.46 billion-year half live, respectively) and this inclusion can therefore be used to determine the age of the crystal. The Pb/U ratio obtained (0.14) indicates that the garnet formed about 1 to 1.5 billion years ago, which corresponds to the Precambrian period. Thus, the almandine-rich composition of the garnets, the presence of sillimanite and the very ancient nature of the crystal (~1.5 gallium) converge towards the highly metamorphosed rocks of the Proterozoic (Precambrian period). From the map in Figure 8 we see that the rare exposed rocks from that period are notably the Baltic and Indian shields. As Scandinavian garnets showed a markedly different composition from the almandines considered in this study, we can discard all European garnet sources. The only possibilities remaining are the Indian metamorphic belts located in the Rajasthan region and on the East coast which host famous garnet deposits of gem quality.
116
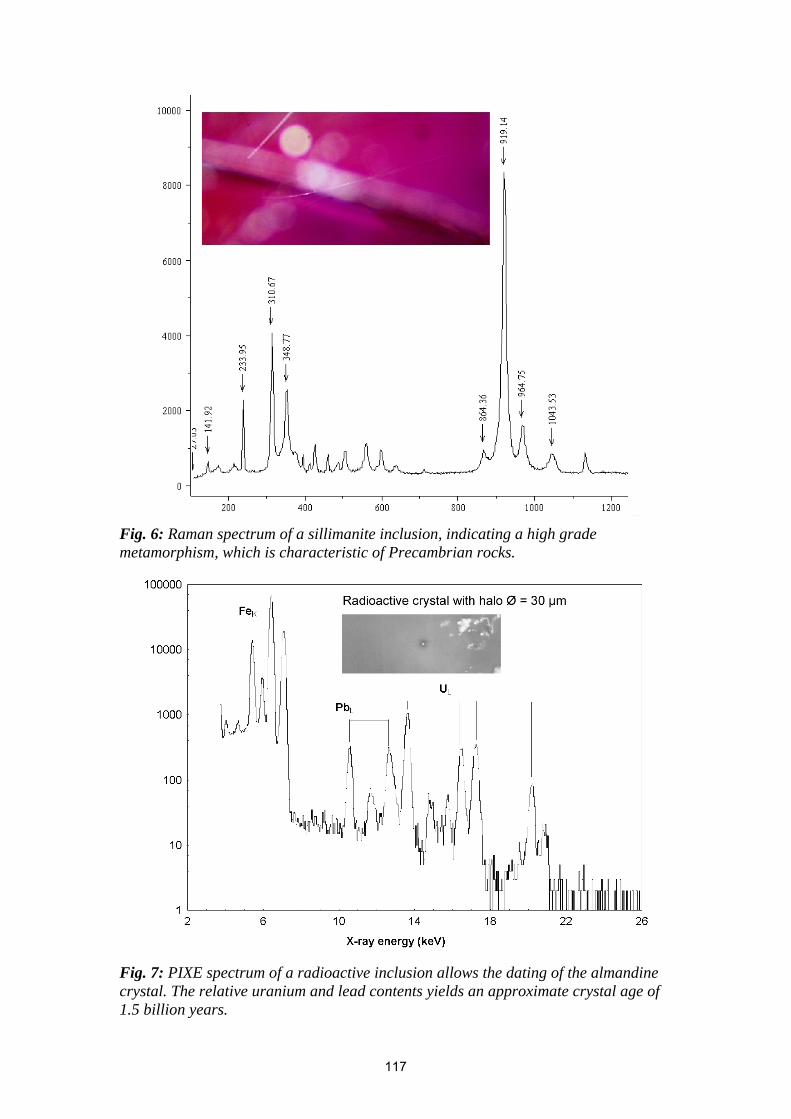
Fig. 6: Raman spectrum of a sillimanite inclusion, indicating a high grade metamorphism, which is characteristic of Precambrian rocks.
Fig. 7: PIXE spectrum of a radioactive inclusion allows the dating of the almandine crystal. The relative uranium and lead contents yields an approximate crystal age of 1.5 billion years.
117
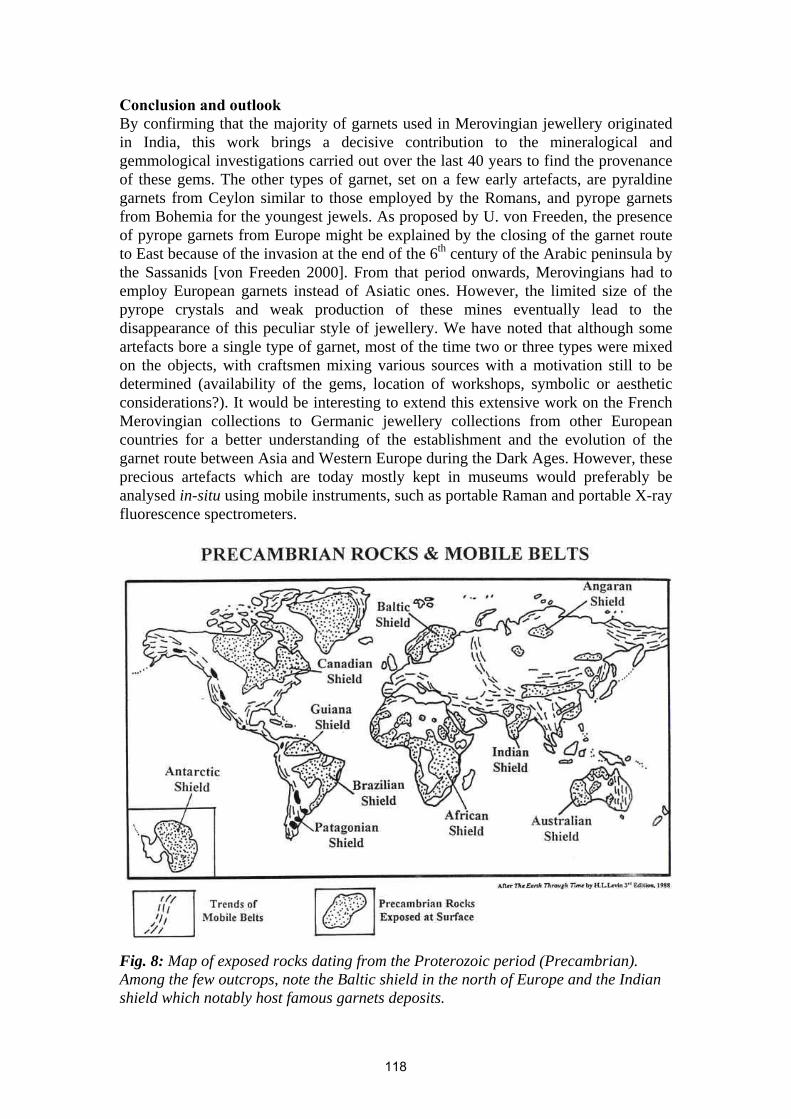
Conclusion and outlook By confirming that the majority of garnets used in Merovingian jewellery originated in India, this work brings a decisive contribution to the mineralogical and gemmological investigations carried out over the last 40 years to find the provenance of these gems. The other types of garnet, set on a few early artefacts, are pyraldine garnets from Ceylon similar to those employed by the Romans, and pyrope garnets from Bohemia for the youngest jewels. As proposed by U. von Freeden, the presence of pyrope garnets from Europe might be explained by the closing of the garnet route to East because of the invasion at the end of the 6th century of the Arabic peninsula by the Sassanids [von Freeden 2000]. From that period onwards, Merovingians had to employ European garnets instead of Asiatic ones. However, the limited size of the pyrope crystals and weak production of these mines eventually lead to the disappearance of this peculiar style of jewellery. We have noted that although some artefacts bore a single type of garnet, most of the time two or three types were mixed on the objects, with craftsmen mixing various sources with a motivation still to be determined (availability of the gems, location of workshops, symbolic or aesthetic considerations?). It would be interesting to extend this extensive work on the French Merovingian collections to Germanic jewellery collections from other European countries for a better understanding of the establishment and the evolution of the garnet route between Asia and Western Europe during the Dark Ages. However, these precious artefacts which are today mostly kept in museums would preferably be analysed in-situ using mobile instruments, such as portable Raman and portable X-ray fluorescence spectrometers.
Fig. 8: Map of exposed rocks dating from the Proterozoic period (Precambrian). Among the few outcrops, note the Baltic shield in the north of Europe and the Indian shield which notably host famous garnets deposits.
118
References • Arrhenius, B. 1985. Merovingian Garnet Jewellery; Emergence and Social
Implications, Stockholm. • Bimson, M., La Neice S., and Leese, M. 1982. ‘The characterisation of
mounted garnets’ Archaeometry 24: 51-58. • Calligaro, T., Colinart, S., Poirot, J.-P., Sudres, C. 2002. ‘Combined external-
beam PIXE and µ-Raman characterisation of garnets used in Merovingian jewellery’ Nuclear Instruments and Methods in Physics Research B 189: 320-327.
• Dran, J.-C., Calligaro, T., Salomon, J. 2000. ‘Particle induced X-ray Emission’ in ‘Modern Analytical Methods in Art and Achaeology’, eds Ciliberto and Spoto, Vol 155 in Chemical analysis, John Wiley, New York, 135-166
• Dran, J.-C., Salomon, J., Calligaro, T., Walter, P. 2004. ‘Ion beam analysis of art works: 14 years of use in the Louvre’ Nuclear Instruments and Methods in Physics Research B 219/220: 7-15.
• Farges, F. 1998. ‘Mineralogy of the Louvres Merovingian garnet cloisonné jewelry: origins of the gems of the first kings of France’, American Mineralogist, 83: 323-330.
• von Freeden, U. 2000. ‘Das Ende engzelligen Cloisonnés und die Eroberung Südarabiens durch die Sasaniden’ Germania, 78: 97-124.
• Greiff, S. 1998. ‘Naturwissenschaftliche Untersuchungen zur Frage der Rohsteinquellen für frühmittelalterlichen Almandingranatschmuck rheinfränkische Provenienz’ Jahrbuch des Römisch-Germanischen Zentral Museums Mainz, 45: 599-646.
• Fleury, M,. France-Lanord, A. 1998. ‘Les trésors mérovingiens de la basilique de Saint-Denis’ Gérard Klopp eds, Woippy, France, 1998.
• Kazanski, M., Périn, P., Calligaro, T. 2000. ‘Le style polychrome au Ve siècle : orfèvrerie cloisonnée et peirres montées en bâtes, L’or des princes barbares. Du Caucase à la gaule au Ve siècle après J.-C.’ (P. Périn, F. Vallet, M. Kazanski dir.), Réunion des Musées nationaux, Paris, 2000, 15-18.
• Mellis, O. 1963. ‘Mineralogische Untersuchen an Granaten aus in Schweden gefundenen Schmuckgegenstanden des Merowinger und Karolingerzeit’ Arkiv for mineralogi och geologi, 3, Nr 15, Stockholm, 297-362.
• Quast, D,. Schüssler, U. 2000. ‘Mineralogische Untersuchungen zur Herkunft der Granate merowingerzeitlicher Cloisonnéarbeiten’ Germania 78, 1: 75-96.
• Roth, H. 1980. ‘Almandinhandel und -verarbeitung im Bereich des Mittelsmeeres’ Allgemeine und vergleichende Archäologie, München, 2: 309-335.
• Schubnel, H.J., Pinet, M., Smith, D.C., Lasnier, B. 1992 ‘La microsonde Raman en gemmologie’ Revue de Gemmologie, A.F.G. 1992, hors série
• Scukin, M., Bazan, I. 1993. ‘L’origine du style cloisonné de l’époque des Grandes Migrations, La noblesse et les chefs barbares du IIIe au VIIe siècle’ (F. Vallet, M. Kazanski dir.), Mémoires publiés par l’Association française d’Archéologie mérovingienne V: 63-69.
• Van Roy, S., Vanhaeke, L. 1997. ‘L’origine des grenats à l’époque mérovingienne, La vie Archéologique’ Bulletin de la fédération des archéologues de Wallonie, 48: 124-137.
119
The mineralogy of Böttger stoneware
Winfried Kockelmann1, Armin Kirfel2, Christian Neelmeijer3 and Hans-Martin Walcha4 1Rutherford Appleton Laboratory, ISIS Facility, Chilton, OX11 0QX, UK
2 Mineralogisch-Petrologisches Institut, Universität Bonn, Poppelsdorfer Schloss, D-53115 Bonn, Germany
3 Forschungszentrum Rossendorf Inc., P.O.B. 510119, D-01314 Dresden, Germany 4 Staatliche Kunstsammlungen Dresden, Porzellansammlung im Zwinger, Sophienstr. 1,
D-01067, Dresden, Germany (corresponding author: [email protected])
Abstract In the early eighteenth century Johann Friedrich Böttger produced a remarkable type of red stoneware which is extraordinary hard and suitable for surface polishing. Although of considerable value for museums and collectors, surprisingly little is known of the elemental and mineral compositions of this type of stoneware. We have analysed Böttger objects and other red stoneware pieces from the Porcelain Collection of the State Art Collections Dresden by non-destructive neutron diffraction. The neutron analyses of about 20 intact jugs, vases and plates carried out at the spallation source ISIS provides a quantitative overview of the main mineral phase compositions. The data confirm the fine raw material selection by Böttger for the production of his stoneware. The mineral phase composition of Böttger objects, however, is not unique and similar to the also studied Yixing red stoneware.
Keywords: Böttger stoneware, neutron diffraction, mineral phase analysis, material analysis
Introduction Johann Friedrich Böttger (* 4. February 1682 in Schleiz; † 13. March 1719 in Dresden) was an alchemist who acquired the reputation of a ‘gold maker’ in his quest to produce the noble metal by chemical methods. He was assigned to experiment with ceramic bodies under the orders of August the Strong, Elector of Saxony and King of Poland [Swann and Nelson 2000]. In 1708 and together with the scientist and economic advisor to the elector, Ehrenfried Walther von Tschirnhaus, Böttger produced white hard porcelain in Europe for the first time, an achievement that set the stage for the start-up of the Meissen porcelain factory. As a by-product of the porcelain experiments Böttger was able to create a special type of red stoneware in 1706-1707. This stoneware is similar to Yixing red stoneware that was imported from China in the mid-17th century and which was copied in the second half of the 17th century in Delft in the Netherlands by A.J. de Milde and in the 18th century in England by the Elers Brothers, Wedgewood. Böttger’s stoneware was later also produced by an associate of Böttger at Plaue, Prussia, which became a competitive place of manufacturing stoneware in the 18th century [Swann and Nelson 2000]. Böttger stoneware represents a unique technological development. It is, in comparison to other ceramic bodies, characterised by a high material density, extremely hard and suitable for surface polishing. Böttger achieved these excellent ceramic properties by using basic raw materials of very high quality and a special firing procedure. Böttger objects are highly valued on the international arts market and, as a consequence, some of them are suspected to be modern fakes. There is therefore a growing interest by museums and collectors in establishing the authenticity of Böttger stoneware and in methods for distinguishing it from ceramics of comparable visual design produced in China, England and Holland, as well as from modern replicas. Moreover, there is considerable interest in discriminating between Böttger and Plaue objects using
120
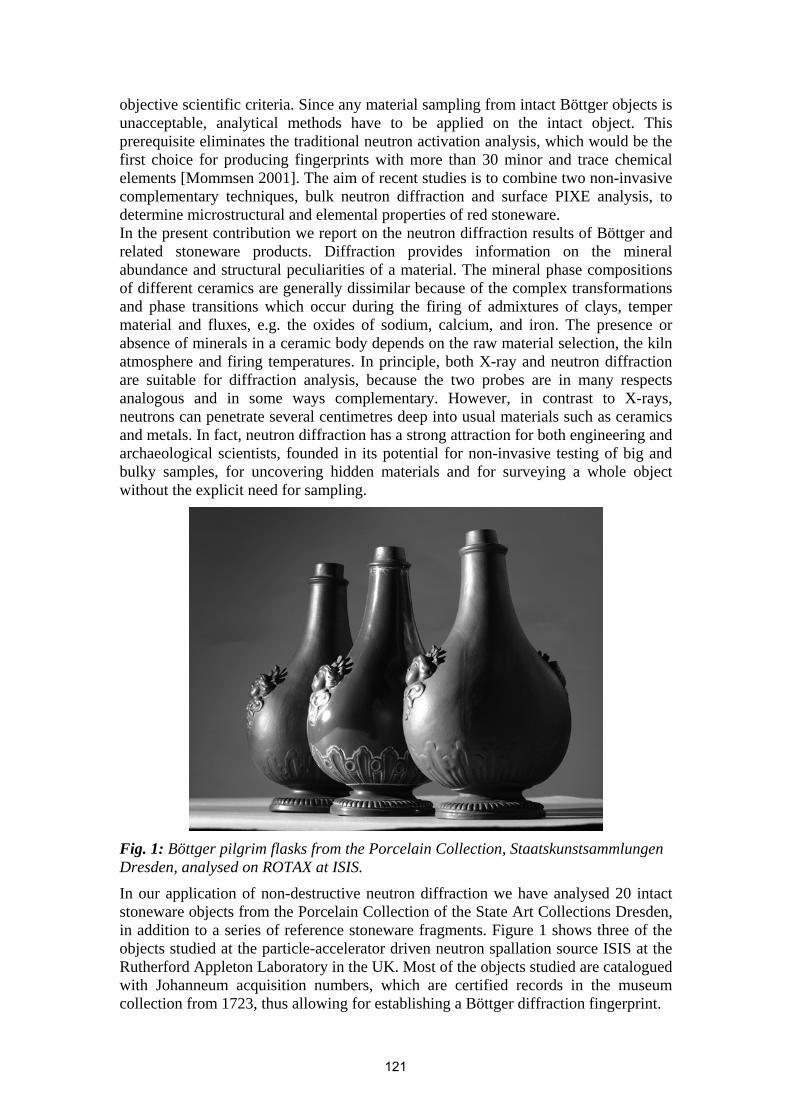
objective scientific criteria. Since any material sampling from intact Böttger objects is unacceptable, analytical methods have to be applied on the intact object. This prerequisite eliminates the traditional neutron activation analysis, which would be the first choice for producing fingerprints with more than 30 minor and trace chemical elements [Mommsen 2001]. The aim of recent studies is to combine two non-invasive complementary techniques, bulk neutron diffraction and surface PIXE analysis, to determine microstructural and elemental properties of red stoneware. In the present contribution we report on the neutron diffraction results of Böttger and related stoneware products. Diffraction provides information on the mineral abundance and structural peculiarities of a material. The mineral phase compositions of different ceramics are generally dissimilar because of the complex transformations and phase transitions which occur during the firing of admixtures of clays, temper material and fluxes, e.g. the oxides of sodium, calcium, and iron. The presence or absence of minerals in a ceramic body depends on the raw material selection, the kiln atmosphere and firing temperatures. In principle, both X-ray and neutron diffraction are suitable for diffraction analysis, because the two probes are in many respects analogous and in some ways complementary. However, in contrast to X-rays, neutrons can penetrate several centimetres deep into usual materials such as ceramics and metals. In fact, neutron diffraction has a strong attraction for both engineering and archaeological scientists, founded in its potential for non-invasive testing of big and bulky samples, for uncovering hidden materials and for surveying a whole object without the explicit need for sampling.
Fig. 1: Böttger pilgrim flasks from the Porcelain Collection, Staatskunstsammlungen Dresden, analysed on ROTAX at ISIS.
In our application of non-destructive neutron diffraction we have analysed 20 intact stoneware objects from the Porcelain Collection of the State Art Collections Dresden, in addition to a series of reference stoneware fragments. Figure 1 shows three of the objects studied at the particle-accelerator driven neutron spallation source ISIS at the Rutherford Appleton Laboratory in the UK. Most of the objects studied are catalogued with Johanneum acquisition numbers, which are certified records in the museum collection from 1723, thus allowing for establishing a Böttger diffraction fingerprint.
121
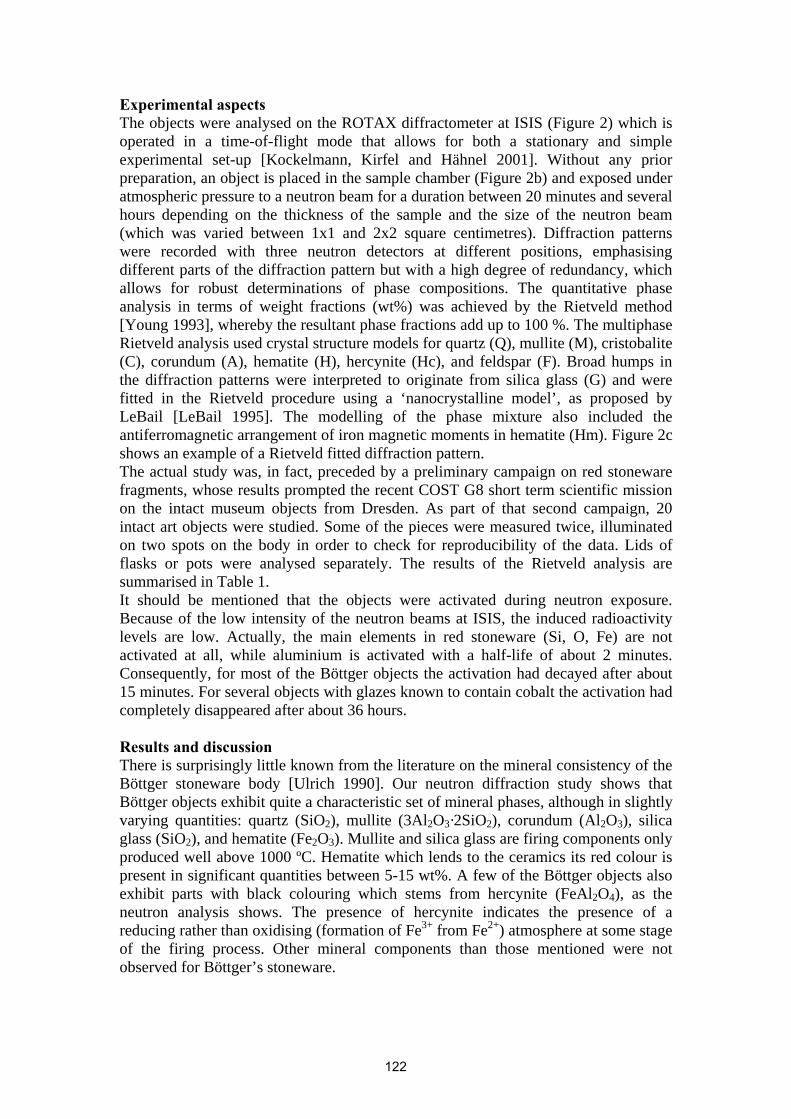
Experimental aspects The objects were analysed on the ROTAX diffractometer at ISIS (Figure 2) which is operated in a time-of-flight mode that allows for both a stationary and simple experimental set-up [Kockelmann, Kirfel and Hähnel 2001]. Without any prior preparation, an object is placed in the sample chamber (Figure 2b) and exposed under atmospheric pressure to a neutron beam for a duration between 20 minutes and several hours depending on the thickness of the sample and the size of the neutron beam (which was varied between 1x1 and 2x2 square centimetres). Diffraction patterns were recorded with three neutron detectors at different positions, emphasising different parts of the diffraction pattern but with a high degree of redundancy, which allows for robust determinations of phase compositions. The quantitative phase analysis in terms of weight fractions (wt%) was achieved by the Rietveld method [Young 1993], whereby the resultant phase fractions add up to 100 %. The multiphase Rietveld analysis used crystal structure models for quartz (Q), mullite (M), cristobalite (C), corundum (A), hematite (H), hercynite (Hc), and feldspar (F). Broad humps in the diffraction patterns were interpreted to originate from silica glass (G) and were fitted in the Rietveld procedure using a ‘nanocrystalline model’, as proposed by LeBail [LeBail 1995]. The modelling of the phase mixture also included the antiferromagnetic arrangement of iron magnetic moments in hematite (Hm). Figure 2c shows an example of a Rietveld fitted diffraction pattern. The actual study was, in fact, preceded by a preliminary campaign on red stoneware fragments, whose results prompted the recent COST G8 short term scientific mission on the intact museum objects from Dresden. As part of that second campaign, 20 intact art objects were studied. Some of the pieces were measured twice, illuminated on two spots on the body in order to check for reproducibility of the data. Lids of flasks or pots were analysed separately. The results of the Rietveld analysis are summarised in Table 1. It should be mentioned that the objects were activated during neutron exposure. Because of the low intensity of the neutron beams at ISIS, the induced radioactivity levels are low. Actually, the main elements in red stoneware (Si, O, Fe) are not activated at all, while aluminium is activated with a half-life of about 2 minutes. Consequently, for most of the Böttger objects the activation had decayed after about 15 minutes. For several objects with glazes known to contain cobalt the activation had completely disappeared after about 36 hours. Results and discussion There is surprisingly little known from the literature on the mineral consistency of the Böttger stoneware body [Ulrich 1990]. Our neutron diffraction study shows that Böttger objects exhibit quite a characteristic set of mineral phases, although in slightly varying quantities: quartz (SiO2), mullite (3Al2O3·2SiO2), corundum (Al2O3), silica glass (SiO2), and hematite (Fe2O3). Mullite and silica glass are firing components only produced well above 1000 ºC. Hematite which lends to the ceramics its red colour is present in significant quantities between 5-15 wt%. A few of the Böttger objects also exhibit parts with black colouring which stems from hercynite (FeAl2O4), as the neutron analysis shows. The presence of hercynite indicates the presence of a reducing rather than oxidising (formation of Fe3+ from Fe2+) atmosphere at some stage of the firing process. Other mineral components than those mentioned were not observed for Böttger’s stoneware.
122
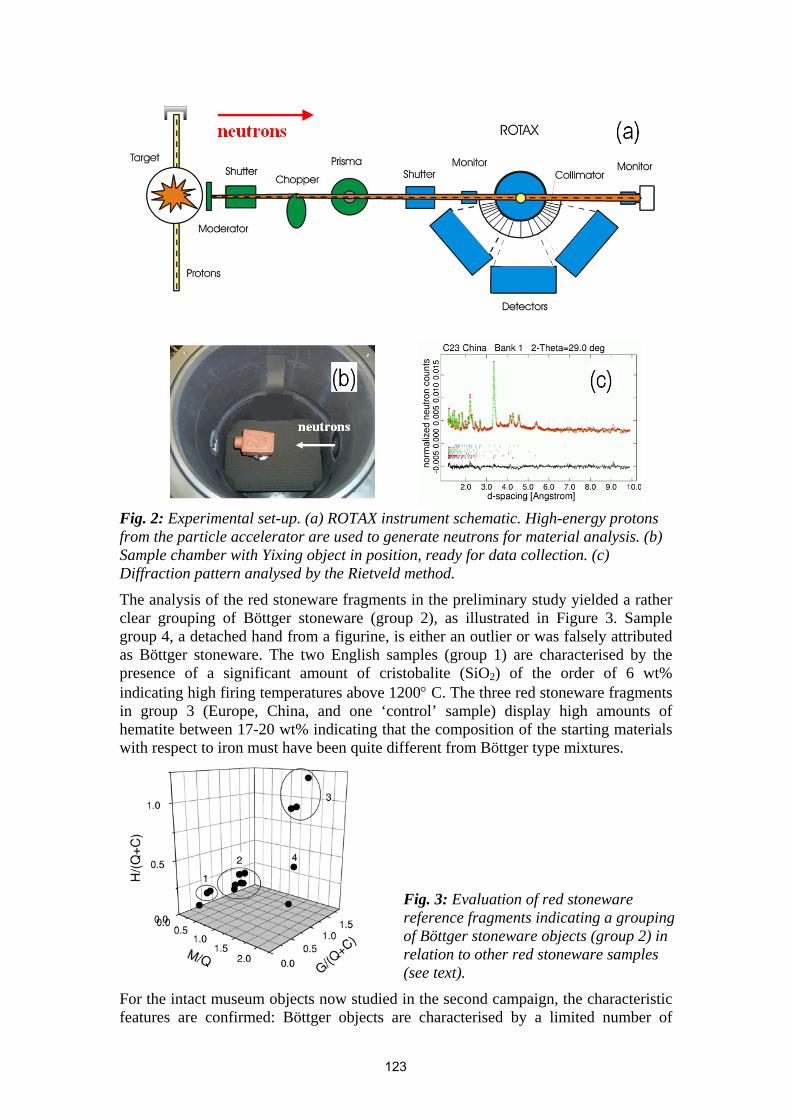
Fig. 2: Experimental set-up. (a) ROTAX instrument schematic. High-energy protons from the particle accelerator are used to generate neutrons for material analysis. (b) Sample chamber with Yixing object in position, ready for data collection. (c) Diffraction pattern analysed by the Rietveld method.
The analysis of the red stoneware fragments in the preliminary study yielded a rather clear grouping of Böttger stoneware (group 2), as illustrated in Figure 3. Sample group 4, a detached hand from a figurine, is either an outlier or was falsely attributed as Böttger stoneware. The two English samples (group 1) are characterised by the presence of a significant amount of cristobalite (SiO2) of the order of 6 wt% indicating high firing temperatures above 1200° C. The three red stoneware fragments in group 3 (Europe, China, and one ‘control’ sample) display high amounts of hematite between 17-20 wt% indicating that the composition of the starting materials with respect to iron must have been quite different from Böttger type mixtures.
Fig. 3: Evaluation of red stoneware reference fragments indicating a grouping of Böttger stoneware objects (group 2) in relation to other red stoneware samples (see text).
For the intact museum objects now studied in the second campaign, the characteristic features are confirmed: Böttger objects are characterised by a limited number of
123
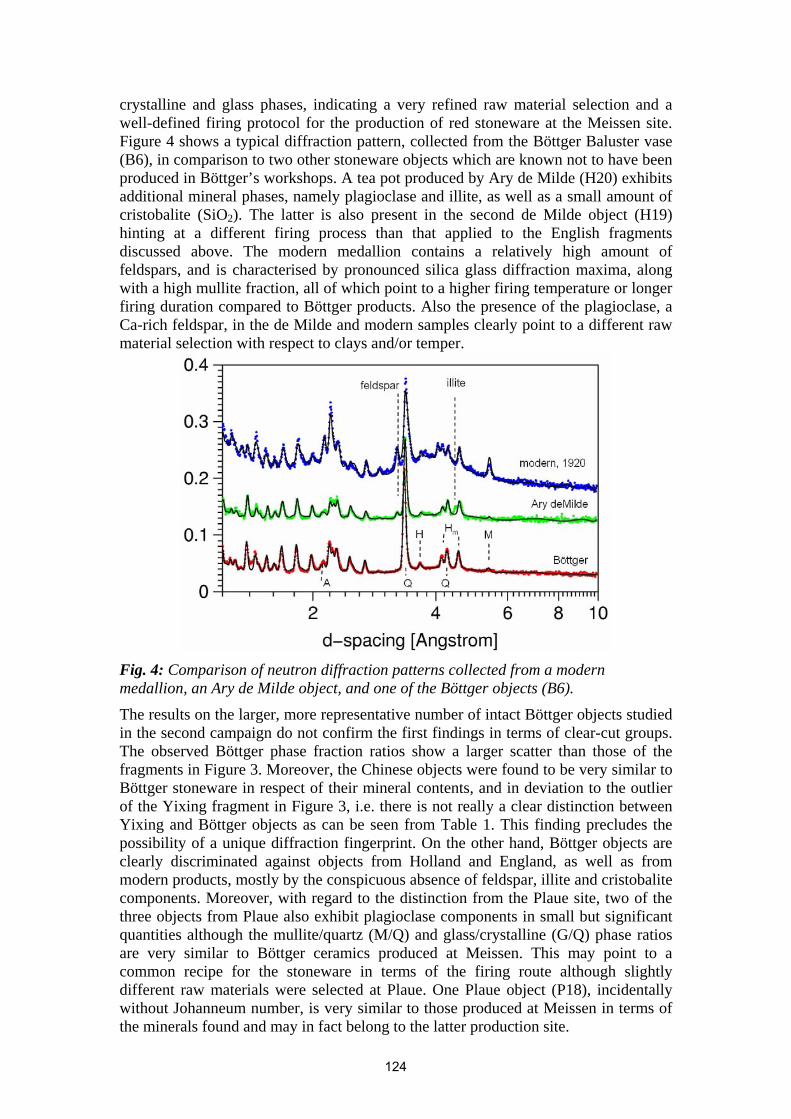
crystalline and glass phases, indicating a very refined raw material selection and a well-defined firing protocol for the production of red stoneware at the Meissen site. Figure 4 shows a typical diffraction pattern, collected from the Böttger Baluster vase (B6), in comparison to two other stoneware objects which are known not to have been produced in Böttger’s workshops. A tea pot produced by Ary de Milde (H20) exhibits additional mineral phases, namely plagioclase and illite, as well as a small amount of cristobalite (SiO2). The latter is also present in the second de Milde object (H19) hinting at a different firing process than that applied to the English fragments discussed above. The modern medallion contains a relatively high amount of feldspars, and is characterised by pronounced silica glass diffraction maxima, along with a high mullite fraction, all of which point to a higher firing temperature or longer firing duration compared to Böttger products. Also the presence of the plagioclase, a Ca-rich feldspar, in the de Milde and modern samples clearly point to a different raw material selection with respect to clays and/or temper.
Fig. 4: Comparison of neutron diffraction patterns collected from a modern medallion, an Ary de Milde object, and one of the Böttger objects (B6).
The results on the larger, more representative number of intact Böttger objects studied in the second campaign do not confirm the first findings in terms of clear-cut groups. The observed Böttger phase fraction ratios show a larger scatter than those of the fragments in Figure 3. Moreover, the Chinese objects were found to be very similar to Böttger stoneware in respect of their mineral contents, and in deviation to the outlier of the Yixing fragment in Figure 3, i.e. there is not really a clear distinction between Yixing and Böttger objects as can be seen from Table 1. This finding precludes the possibility of a unique diffraction fingerprint. On the other hand, Böttger objects are clearly discriminated against objects from Holland and England, as well as from modern products, mostly by the conspicuous absence of feldspar, illite and cristobalite components. Moreover, with regard to the distinction from the Plaue site, two of the three objects from Plaue also exhibit plagioclase components in small but significant quantities although the mullite/quartz (M/Q) and glass/crystalline (G/Q) phase ratios are very similar to Böttger ceramics produced at Meissen. This may point to a common recipe for the stoneware in terms of the firing route although slightly different raw materials were selected at Plaue. One Plaue object (P18), incidentally without Johanneum number, is very similar to those produced at Meissen in terms of the minerals found and may in fact belong to the latter production site.
124
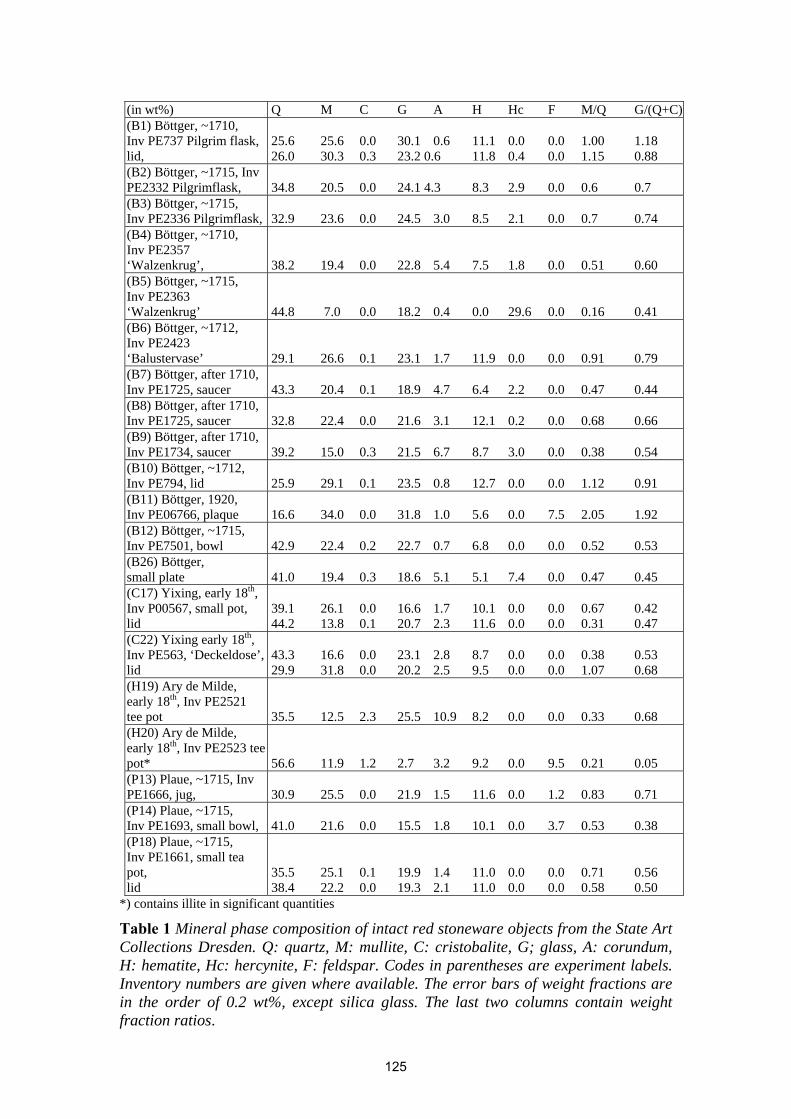
(in wt%) Q M C G A H Hc F M/Q G/(Q+C)(B1) Böttger, ~1710, Inv PE737 Pilgrim flask, lid,
25.6 25.6 0.0 30.1 0.6 11.1 0.0 0.0 1.00 1.18 26.0 30.3 0.3 23.2 0.6 11.8 0.4 0.0 1.15 0.88
(B2) Böttger, ~1715, Inv PE2332 Pilgrimflask,
34.8 20.5 0.0 24.1 4.3 8.3 2.9 0.0 0.6 0.7
(B3) Böttger, ~1715, Inv PE2336 Pilgrimflask,
32.9 23.6 0.0 24.5 3.0 8.5 2.1 0.0 0.7 0.74
(B4) Böttger, ~1710, Inv PE2357 ‘Walzenkrug’,
38.2 19.4 0.0 22.8 5.4 7.5 1.8 0.0 0.51 0.60
(B5) Böttger, ~1715, Inv PE2363 ‘Walzenkrug’
44.8 7.0 0.0 18.2 0.4 0.0 29.6 0.0 0.16 0.41
(B6) Böttger, ~1712, Inv PE2423 ‘Balustervase’
29.1 26.6 0.1 23.1 1.7 11.9 0.0 0.0 0.91 0.79
(B7) Böttger, after 1710, Inv PE1725, saucer
43.3 20.4 0.1 18.9 4.7 6.4 2.2 0.0 0.47 0.44
(B8) Böttger, after 1710, Inv PE1725, saucer
32.8 22.4 0.0 21.6 3.1 12.1 0.2 0.0 0.68 0.66
(B9) Böttger, after 1710, Inv PE1734, saucer
39.2 15.0 0.3 21.5 6.7 8.7 3.0 0.0 0.38 0.54
(B10) Böttger, ~1712, Inv PE794, lid
25.9 29.1 0.1 23.5 0.8 12.7 0.0 0.0 1.12 0.91
(B11) Böttger, 1920, Inv PE06766, plaque
16.6 34.0 0.0 31.8 1.0 5.6 0.0 7.5 2.05 1.92
(B12) Böttger, ~1715, Inv PE7501, bowl
42.9 22.4 0.2 22.7 0.7 6.8 0.0 0.0 0.52 0.53
(B26) Böttger, small plate
41.0 19.4 0.3 18.6 5.1 5.1 7.4 0.0 0.47 0.45
(C17) Yixing, early 18th, Inv P00567, small pot, lid
39.1 26.1 0.0 16.6 1.7 10.1 0.0 0.0 0.67 0.42 44.2 13.8 0.1 20.7 2.3 11.6 0.0 0.0 0.31 0.47
(C22) Yixing early 18th, Inv PE563, ‘Deckeldose’, lid
43.3 16.6 0.0 23.1 2.8 8.7 0.0 0.0 0.38 0.53 29.9 31.8 0.0 20.2 2.5 9.5 0.0 0.0 1.07 0.68
(H19) Ary de Milde, early 18th, Inv PE2521 tee pot
35.5 12.5 2.3 25.5 10.9 8.2 0.0 0.0 0.33 0.68
(H20) Ary de Milde, early 18th, Inv PE2523 tee pot*
56.6 11.9 1.2 2.7 3.2 9.2 0.0 9.5 0.21 0.05
(P13) Plaue, ~1715, Inv PE1666, jug,
30.9 25.5 0.0 21.9 1.5 11.6 0.0 1.2 0.83 0.71
(P14) Plaue, ~1715, Inv PE1693, small bowl,
41.0 21.6 0.0 15.5 1.8 10.1 0.0 3.7 0.53 0.38
(P18) Plaue, ~1715, Inv PE1661, small tea pot, lid
35.5 25.1 0.1 19.9 1.4 11.0 0.0 0.0 0.71 0.56 38.4 22.2 0.0 19.3 2.1 11.0 0.0 0.0 0.58 0.50
*) contains illite in significant quantities
Table 1 Mineral phase composition of intact red stoneware objects from the State Art Collections Dresden. Q: quartz, M: mullite, C: cristobalite, G; glass, A: corundum, H: hematite, Hc: hercynite, F: feldspar. Codes in parentheses are experiment labels. Inventory numbers are given where available. The error bars of weight fractions are in the order of 0.2 wt%, except silica glass. The last two columns contain weight fraction ratios.
125
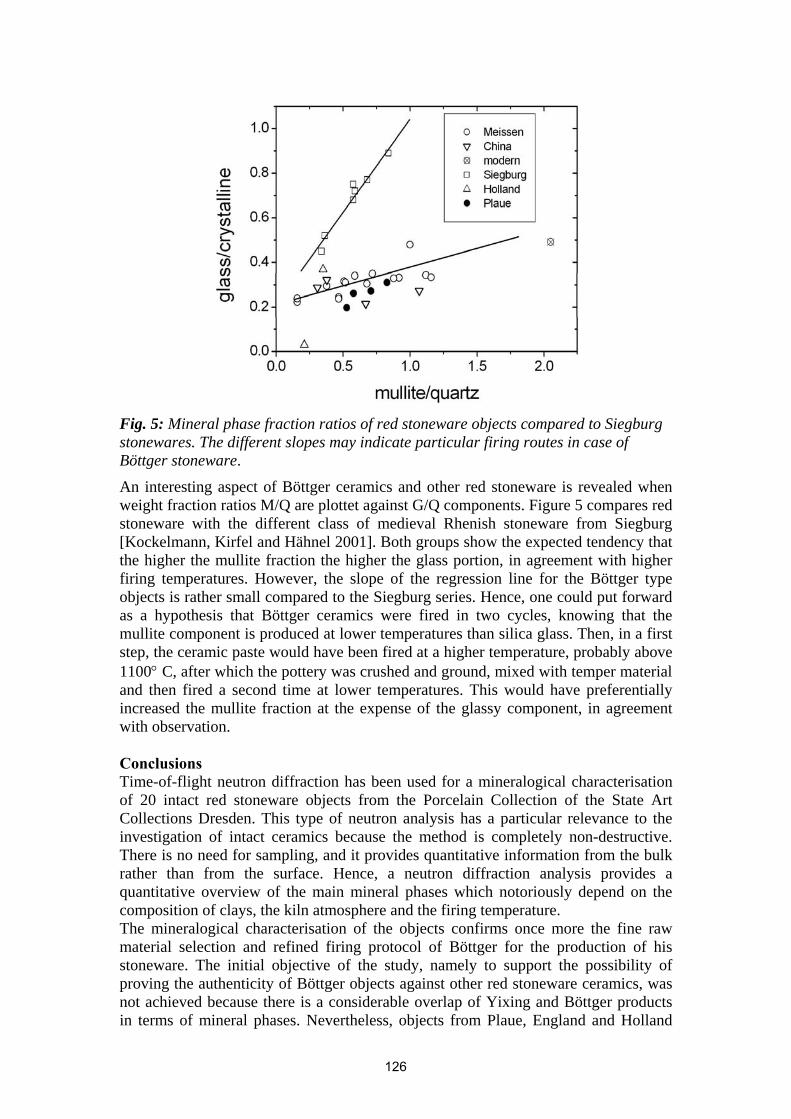
Fig. 5: Mineral phase fraction ratios of red stoneware objects compared to Siegburg stonewares. The different slopes may indicate particular firing routes in case of Böttger stoneware.
An interesting aspect of Böttger ceramics and other red stoneware is revealed when weight fraction ratios M/Q are plottet against G/Q components. Figure 5 compares red stoneware with the different class of medieval Rhenish stoneware from Siegburg [Kockelmann, Kirfel and Hähnel 2001]. Both groups show the expected tendency that the higher the mullite fraction the higher the glass portion, in agreement with higher firing temperatures. However, the slope of the regression line for the Böttger type objects is rather small compared to the Siegburg series. Hence, one could put forward as a hypothesis that Böttger ceramics were fired in two cycles, knowing that the mullite component is produced at lower temperatures than silica glass. Then, in a first step, the ceramic paste would have been fired at a higher temperature, probably above 1100° C, after which the pottery was crushed and ground, mixed with temper material and then fired a second time at lower temperatures. This would have preferentially increased the mullite fraction at the expense of the glassy component, in agreement with observation. Conclusions Time-of-flight neutron diffraction has been used for a mineralogical characterisation of 20 intact red stoneware objects from the Porcelain Collection of the State Art Collections Dresden. This type of neutron analysis has a particular relevance to the investigation of intact ceramics because the method is completely non-destructive. There is no need for sampling, and it provides quantitative information from the bulk rather than from the surface. Hence, a neutron diffraction analysis provides a quantitative overview of the main mineral phases which notoriously depend on the composition of clays, the kiln atmosphere and the firing temperature. The mineralogical characterisation of the objects confirms once more the fine raw material selection and refined firing protocol of Böttger for the production of his stoneware. The initial objective of the study, namely to support the possibility of proving the authenticity of Böttger objects against other red stoneware ceramics, was not achieved because there is a considerable overlap of Yixing and Böttger products in terms of mineral phases. Nevertheless, objects from Plaue, England and Holland
126
can be distinguished through extra mineral components. That is to say, a mineralogical analysis is generally not able to provide unambiguous answers in terms of authentication but it may support or undermine the authenticity of Böttger stoneware objects because of the limited set of minerals that are expected to be found. Acknowledgements We would like to thank the European Community COST-G8 action for financial support of this study in the frame of a Short Term Scientific Mission. References
• Kockelmann, W., Kirfel, A., Hähnel, E. 2001. ‘Non-destructive Phase Analysis of Archaeological Ceramics using TOF Neutron Diffraction’. Journal of Archaeological Science, 28: 213-222.
• Mommsen, H. 2001. ‘Provenance determination of pottery by trace element analysis: problems, solutions and applications’. Journal of Radioanalytical and Nuclear Chemistry, 247(3): 657-662.
• Swann, C.P. and Nelson, C.H. 2000. ‘Böttger stoneware from North Amerika and Europe; are they authentic?’. Nuclear Instruments and Methods B, 161-163: 694-698.
• LeBail, A. 1995. ‘Modelling the silica glass structure by the Rietveld Method’. Journal of Non-Crystalline Solids, 183: 39-42.
• Ulrich, B. 1990. ‘Vergleichende Untersuchungen an historischen deutschen und chinesischen Steinzeugen des frühen 18. Jahrhunderts’. Silikattechnik, 41(10): 328-330.
• Young, R.A. 1993. ‘Introduction to the Rietveld method’. In The Rietveld Method, Young, R.A. (ed.) 1-38. International Union of Crystallography, Oxford: University Press.
127
Non-destructive Evaluation of some Physical and Mechanical Properties of Museum Objects
Valentin Vladimirov
Sofia University St.Kl.Ohridski, Dept. of Mineralogy, Petrology & Economic Geology, 15 Tzar Osvoboditel bd. Sofia 1000, Bulgaria
Telephone: (359 2) 93 08 255 or 93 08 570 Fax: (359 2) 944 64 87 or (359 2) 946 02 55
(corresponding author: [email protected]) Abstract A non-destructive methodology for establishing a range of physical and mechanical properties of the materials in different museum objects such as rocks, terracotta, etc. are presented. The objective is to show how this non-traditional emerging approach may be effective in improving our understanding of museum objects and their successful preservation. The following physical parameters can be obtained: effective porosity, conditional momentary saturation, pore space structure, saturation constant, density, Poisson's ratio, Young's modulus, shear modulus, acoustic impedance, and Debye temperature. Some of these properties are well known in a qualitative sense, but modern research needs their quantitative values. These are rather rare in the scientific literature. The objective of this study is the creation of a database of the physical properties of museum objects, based on commonly used non-destructive measuring techniques applied to rocks. Such a database will be very appropriate as well ascompletely new and original, and will serve the needs of archaeology, museum sciences, conservation, origin, provenance, etc. Two case studies of the non-destructive analysis of museum objects are presented. One is petrophysical investigation of a Cybele marble Thracian votive plate from the very early centuries AD. The second is a non-destructive study of Qumran pottery related to Dead Sea Scrolls jars of ca. 2000 years old.
Keywords: physical-mechanical properties, museum objects, non-destructive, Cybele, marble, petrophysical, Thracian, ceramic, Dead Sea Scrolls jars, Qumran, conservation, restoration, origin, provenance.
Introduction The conservation of museum objects aims at making them durable and stable. Meanwhile, the efficiency of conservation procedures can be monitored by non-destructive measurement of their physical parameters. For stone and ceramic monuments, it is important to measure their elastic properties before and after the conservation procedure, as these parameters indicate the quality of the stone and ceramic [Vladimirov 2000, 2005a, b]. The procedure for stone and ceramic conservation is to soak them in hardening liquids to maximum saturation, so it is further important to determine the pore-filtration parameters. The non-destructive investigation of the physical and mechanical properties can also show if different fragments belong to the same monument or not. It is also possible to obtain important information about their origin and provenance. Our contribution to the COST G8 action is mainly in the field of non-destructive measurement of the physical and mechanical properties (petrophysical properties) of the materials in different museum objects, such as rocks, terracotta, metals etc. Using non destructive methods, the objective of this study is to create a data base of the physical properties of museum objects which will supply the needs of archaeology, museum sciences, conservation, origin, provenance, etc.
128
Some of these properties are well known in a qualitative sense, but modern research needs their quantitative values, which are rather rare in the scientific literature. Establishment of non-destructive museum objects physical properties database will be both timely and novel. Methodology Non-destructive petrophysical investigation is performed in the Ore-Petrophysical lab of the Sofia University St. Kliment Ohridski, Department of Mineralogy, Petrology and Economic Geology, in close collaboration with the Laboratory of Mechanics, Diagnostics and Non-destructive Testing of Solids, which is part of the Institute of Mechanics of the Bulgarian Academy of Science. Our experience of more than 20 years in the non-destructive investigation of rocks is significant. It is important because they are heterogeneous materials, which are very difficult to study, and whose formation conditions are only approximately known. Thousands of rock samples have been physically investigated, such as the following: volcanic (tuffs, tuffaceous sandstones, tuff breccias, volcanic breccias, riolites, latites, latite breccias, andesites, andesitobasalts, dolerites, basalts, trachybasalts) and plutonic (monzonites, syenites, gabbros, gabbro-porphyrys, monzogabbros), sediments (sandstones, limestones), metamorphic (amphibolites, marbles, gneisses, skarns) and many others. We have also experience in studying ceramics, metals, and synthetic materials (crystals, ceramics), etc. The methodological approach is according to Starostin (1979) and involves two groups of experiments: measurements of the free water saturation and determination of the ultrasonic wave velocities [Vladimirov, V. D., Dimitrov, D. P., Mavroudchiev B. 1999, Vladimirov 2000]. The quantity of water absorbed in the sample prior to and at saturation is measured for both turbulent and laminar flow of the water, and the absorbed fraction is recorded as a function of time. Processing the measured data, allows a number of physical parameters to be determined: Effective porosity Pef is the percentage of the total volume of the rock that consists of interconnecting voids. Conditional momentary saturation A is the degree of saturation in the first twenty minutes and, in fact, corresponds to the liquid permeability. The relative fractions of pore sizes are evaluated and distributed into three groups: The fractions P1, P2 and P3 respectively contain pores larger than 10-2 mm, between 10-2 and 10-4 mm and below 10-4 mm. The saturation constant B describes the exponential tail of the saturation curve, i.e. how fast the saturation is reached. The saturation constant appears to be independent of the total porosity. Weighing in water also provides the stone density ρ. By measuring the velocities of ultrasonic waves (high frequency sound) in the object it is possible to extract important physical (mechanical, mainly elastic) parameters. Both longitudinal (push) and transverse (shear) velocities Vp and Vs are measured. The Poisson parameter µ is the ratio between the lateral and the longitudinal strain for the body exposed to the longitudinal stress. Young’s modulus E and the shear modulus G measure deformation of the elastic body exposed to the longitudinal and tangential stress, respectively. The volume deformation coefficient K describes the volume change of the body exposed to an increased pressure. The acoustic impedance Z is the ratio between the acoustic wave pressure and the variation of the instantaneous velocity of the elementary particles of the material; it is measured in units of g/cm2·s. The Debye temperature θ is related to the cut-off frequency of acoustic phonon modes; a larger Debye temperature indicates greater structure stability and stronger connections between individual constituent elements etc.
129
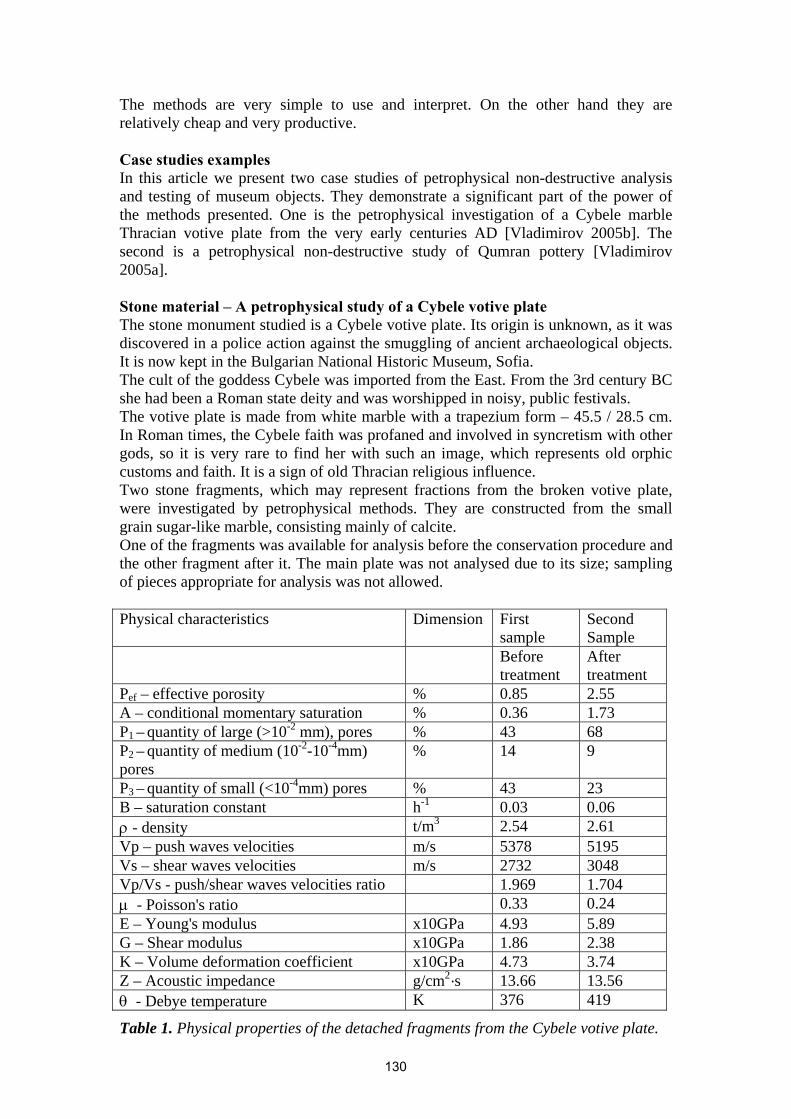
The methods are very simple to use and interpret. On the other hand they are relatively cheap and very productive. Case studies examples In this article we present two case studies of petrophysical non-destructive analysis and testing of museum objects. They demonstrate a significant part of the power of the methods presented. One is the petrophysical investigation of a Cybele marble Thracian votive plate from the very early centuries AD [Vladimirov 2005b]. The second is a petrophysical non-destructive study of Qumran pottery [Vladimirov 2005a]. Stone material – A petrophysical study of a Cybele votive plate The stone monument studied is a Cybele votive plate. Its origin is unknown, as it was discovered in a police action against the smuggling of ancient archaeological objects. It is now kept in the Bulgarian National Historic Museum, Sofia. The cult of the goddess Cybele was imported from the East. From the 3rd century BC she had been a Roman state deity and was worshipped in noisy, public festivals. The votive plate is made from white marble with a trapezium form – 45.5 / 28.5 cm. In Roman times, the Cybele faith was profaned and involved in syncretism with other gods, so it is very rare to find her with such an image, which represents old orphic customs and faith. It is a sign of old Thracian religious influence. Two stone fragments, which may represent fractions from the broken votive plate, were investigated by petrophysical methods. They are constructed from the small grain sugar-like marble, consisting mainly of calcite. One of the fragments was available for analysis before the conservation procedure and the other fragment after it. The main plate was not analysed due to its size; sampling of pieces appropriate for analysis was not allowed. Physical characteristics Dimension First
sample Second Sample
Before treatment
After treatment
Pef – effective porosity % 0.85 2.55 A – conditional momentary saturation % 0.36 1.73 P1 – quantity of large (>10-2 mm), pores % 43 68 P2 – quantity of medium (10-2-10-4mm) pores
% 14 9
P3 – quantity of small (<10-4mm) pores % 43 23 B – saturation constant h-1 0.03 0.06 ρ - density t/m3 2.54 2.61 Vp – push waves velocities m/s 5378 5195 Vs – shear waves velocities m/s 2732 3048 Vp/Vs - push/shear waves velocities ratio 1.969 1.704 µ - Poisson's ratio 0.33 0.24 E – Young's modulus x10GPa 4.93 5.89 G – Shear modulus x10GPa 1.86 2.38 K – Volume deformation coefficient x10GPa 4.73 3.74 Z – Acoustic impedance g/cm2·s 13.66 13.56 θ - Debye temperature K 376 419
Table 1. Physical properties of the detached fragments from the Cybele votive plate.
130
The material consolidation was performed with Paraloid B 72 toluol solution in a vacuum chamber, starting with a low reagent concentration and increasing it gradually to its maximum level. The mechanic parameters, measured on the two stone fragments, one untreated, and one post-conservation treatment, are given in Table 1. Low density for the first sample detected is result of material weathering, deterioration and dropping, but not because of porosity which is also low. This is proved by the low values of the elastic parameters and the acoustic impedance. The most clear evidence for this is the low value of the Debye temperature – a fundamental structural characteristic. After material consolidation of the second sample, it is obvious from the observed increase in the elastic parameters, acoustic impedance and Debye temperature that this sample is anomalous Significant increases in pore-filtration parameters after conservation treatment are more than suspicious. Most probably, this sample is representative of material not belonging to the plate. It is obvious that the second specimen was accidentally incorporated in the observed set and could not be fitted by the reconstruction. The consolidation procedure should increase the density of the sample, which had been partly decreased by weathering and deterioration of the material. This is also evident through the increased effective porosity Pef and the conditional momentary saturation A. The measurement of ultrasound velocities reveals significantly increased Young’s and shear modulus, but significantly decreased Poisson ratio. This may be due to the properties of the vacancy-filling liquid. However, the mechanical properties of the conserved stone are generally good, which can be seen also by a small acoustic impedance Z and a large Debye temperature. Large values of pore-filtration parameters in the second (conserved) sample are suspicious and may lead to another explanation. This sample probably represents material not belonging to the main plate and represents an accidental fragment, which physically cannot be fitted to the main plate by reconstruction. Conclusions The petrophysical investigation of the Cybele votive plate provided two important results. The procedure of stone conservation consists of soaking in hardening liquids to achieve maximum saturation, so the determination of the pore filtration parameters is very important to the conservation and restoration processes. Moreover the presented method could be used to determine whether or not the observed part belongs to investigated object. It also possible to obtain important information relating to origin and provenance for which one need the properties database of prospective rock locations. Ceramics – Qumran scrolls jars petrophysical study Much of the religious and cultural heritage of the Western world is derived from events which occurred in Qumran [Gunneweg, 2000]. A cache of manuscripts which were found there and dated to 300 BC-70 AD, have become one of the most important literary finds of the 20th century. These manuscripts, numbering over 1000, known today as the Dead Sea Scrolls, have over the last 55 years shed light on the origins of Judaism and Christianity as well as providing insight into the life-style of the inhabitants of the sect called the Essenes who reportedly wrote them. This sect, along with the Pharisees and Sadducees, played an important part in the new movement known today as Christianity.
131
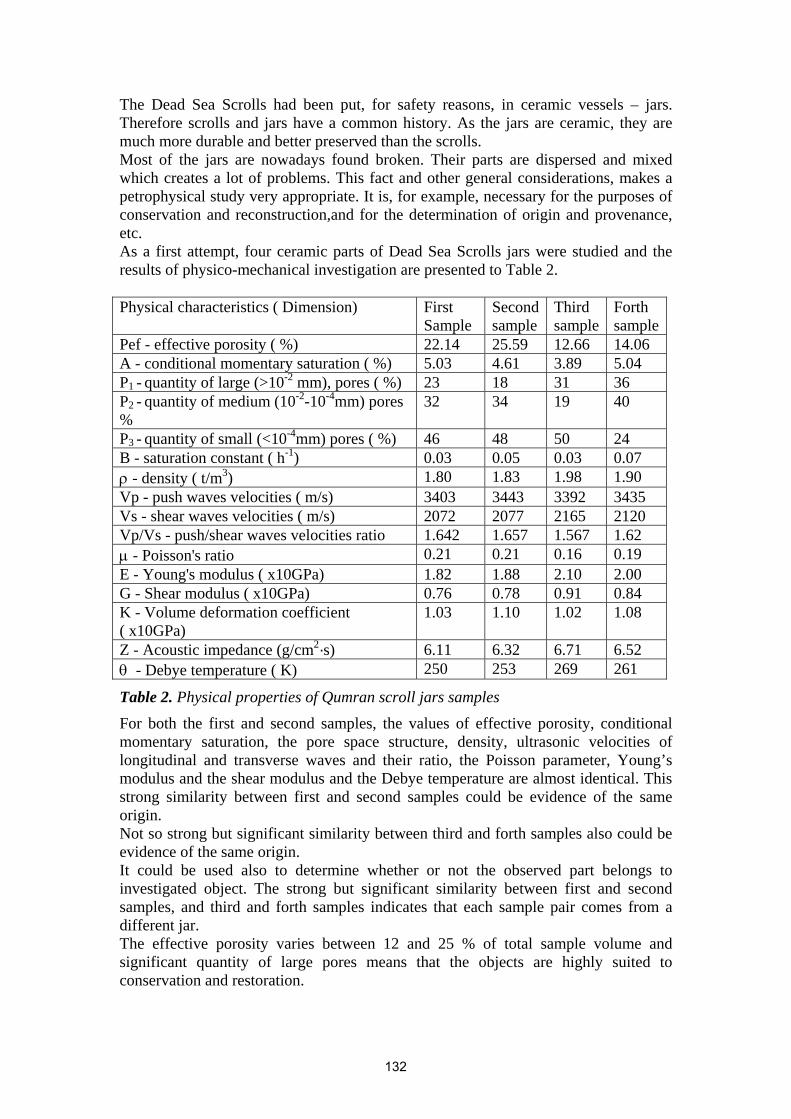
The Dead Sea Scrolls had been put, for safety reasons, in ceramic vessels – jars. Therefore scrolls and jars have a common history. As the jars are ceramic, they are much more durable and better preserved than the scrolls. Most of the jars are nowadays found broken. Their parts are dispersed and mixed which creates a lot of problems. This fact and other general considerations, makes a petrophysical study very appropriate. It is, for example, necessary for the purposes of conservation and reconstruction,and for the determination of origin and provenance, etc. As a first attempt, four ceramic parts of Dead Sea Scrolls jars were studied and the results of physico-mechanical investigation are presented to Table 2. Physical characteristics ( Dimension) First
Sample Second sample
Third sample
Forth sample
Pef - effective porosity ( %) 22.14 25.59 12.66 14.06 A - conditional momentary saturation ( %) 5.03 4.61 3.89 5.04 P1 - quantity of large (>10-2 mm), pores ( %) 23 18 31 36 P2 - quantity of medium (10-2-10-4mm) pores %
32 34 19 40
P3 - quantity of small (<10-4mm) pores ( %) 46 48 50 24 B - saturation constant ( h-1) 0.03 0.05 0.03 0.07 ρ - density ( t/m3) 1.80 1.83 1.98 1.90 Vp - push waves velocities ( m/s) 3403 3443 3392 3435 Vs - shear waves velocities ( m/s) 2072 2077 2165 2120 Vp/Vs - push/shear waves velocities ratio 1.642 1.657 1.567 1.62 µ - Poisson's ratio 0.21 0.21 0.16 0.19 E - Young's modulus ( x10GPa) 1.82 1.88 2.10 2.00 G - Shear modulus ( x10GPa) 0.76 0.78 0.91 0.84 K - Volume deformation coefficient ( x10GPa)
1.03 1.10 1.02 1.08
Z - Acoustic impedance (g/cm2·s) 6.11 6.32 6.71 6.52 θ - Debye temperature ( K) 250 253 269 261
Table 2. Physical properties of Qumran scroll jars samples
For both the first and second samples, the values of effective porosity, conditional momentary saturation, the pore space structure, density, ultrasonic velocities of longitudinal and transverse waves and their ratio, the Poisson parameter, Young’s modulus and the shear modulus and the Debye temperature are almost identical. This strong similarity between first and second samples could be evidence of the same origin. Not so strong but significant similarity between third and forth samples also could be evidence of the same origin. It could be used also to determine whether or not the observed part belongs to investigated object. The strong but significant similarity between first and second samples, and third and forth samples indicates that each sample pair comes from a different jar. The effective porosity varies between 12 and 25 % of total sample volume and significant quantity of large pores means that the objects are highly suited to conservation and restoration.
132
Conclusions Data analysis of physical properties of investigated Qumran pottery shows strong similarity between first and second samples which could be evidence of the same origin. Similarity between third and forth samples is not so strong but could also be indicative the same origin. Moreover, the methods presented can be used to determine whether or not the observed part belongs to investigated object, and shows that the jars would be highly suitable for conservation and restoration. The aim of the study was to see how this method could work in the Qumran case and it is obvious, that it could be very useful and effective. The better planning of specimen collection will significantly improve the petrophysical investigations, which, with their productiveness, simplicity, low costs and high information content, will help very much in better describing and understanding of museum objects and their conservation and restoration. These results confirm the importance of non-destructive physical methods for stone investigation. References
• Gunneweg, J. 2000. Introduction: Dead Sea Scrolls and Pottery at Qumran. http://pluto.mscc.huji.ac.il/~msjan/qumran.html
• Starostin, V.I. 1979. Structure-petrophysical analysis of endogenous ore fields. Nedra, Moscow, 257 p., (in Russian)
• Vladimirov, V. D., Dimitrov, D. P., Mavroudchiev B. 1999. Physicomechanical properties of Pacific Ocean floor rocks. In the Proceedings of 9th International Congress on Rock Mechanics (eds.G. Vouille & P. Berest), Volime 2, A.A.Balkema, ISBN 90 5809 071 X, Rotterdam, 695-699
• Vladimirov, V. D 2000 Non-destructive characterization of synthetic cordierite ceramic. Proceedings of the 10th Iketani Conference on Materials research toward the 21st century. Karuizawa, Japan, 26-30 June 2000, (ed. Okobo T., Kishi T., Saito T.) 487-488
• Vladimirov, V.D. 2005a. Petrophysical non destructive study of Qumran pottery. In preparation for the Qumran workshop proceedings May 2005.
• Vladimirov, V.D. 2005b. Nondestructive X-ray analysis and petrophysical evaluation of a Cybele votive plaque. Nuclear Instruments and Methods in Physics Research Section B: Beam Interactions with Materials and Atoms, Volume 239, Issues 1-2, p. 122-126
133
Cobalt Blue Pigments in Ceramics during the Italian Renaissance
Alessandro Zucchiatti1, Alessandra D’Alessandro1, Federico Mazzei1, Anne Bouquillon2, Ildiko Katona2
1Dipartimento di Fisica dell’Università e INFN, via Dodecaneso 33, 16146 Genova, Italy 2Centre de Recherche et de Restauration des Musées de France, UMR 171 du CNRS, Palais du Louvre
- Porte des Lions, 14 quai François Mitterrand, 75001 Paris- France (corresponding author. [email protected])
Abstract Changes in cobalt blue pigments during the Italian artistic Renaissance could be observed in great detail studying the elemental composition and the microscopic texture of cobalt blue glazes in the largest ensemble ever analysed of terracotta sculptures from the Florentine della Robbia school. The richness of the data demonstrates the presence of different basic ingredients in the sculptures and a rapid change in the composition of blue glazes just before 1520. We speculate that our observations are related to the widening of the blue pigment market and to procedures introduced to industrialise their production. Keywords: PIXE, glazes, blue, Renaissance, della Robbia
Introduction The palette of primitive artists was limited to the shades of ochre, to the white of carbonates and the black of carbon. Although in history the use of colours has been dictated more by their symbolic meaning [Pastoreau, 1990], than by the availability of adequate pigments, man could produce several artificial pigments already in the second millennium BC. This was particularly important for blue which is extremely rare both in inorganic and organic natural forms and was produced from copper minerals, like azurite, mixtures of copper salts like Egyptian blue, or as cobalt oxide derived first as a by-product of alum and later from silver minerals. The history of mining and transformation of cobalt ores and of the use of cobalt blue in glass, ceramics and painting is partly known from documentary evidence, beginning with some ancient Egyptian recipes up to the 17th century treatises on industrial production [Agricola, 1556; Kunckel, 1689]. A considerable part of this history has been recently reconstructed through the instrumental analysis of artefacts using sensitive techniques, either non-destructive, like SEM-EDS (scanning electron microscopy with energy dispersive spectroscopy) in the case of small objects which can be put into the SEM chamber, and PIXE (particle induced X-ray emission) or micro-destructive like LA-ICP-MS (Laser ablation inductively coupled plasma mass spectrometry). Of particular interest is the Renaissance period, when the use of blue, identified in common belief as the colour of majesty and purity [Pastoreau, 1990], became widespread in all forms of art (e.g. sculptures, paintings) and artisanship (e.g. jewellery, clothing). One of the most innovative productions of the Italian artistic Renaissance were the glazed terracotta sculptures (robbiane) created in Florence by the talent and technical skill of Luca della Robbia (1399-1482). Luca’s masterpieces featured essentially white figures on a blue background: a distinctive sign of this art from a family workshop which was run for almost a century with an enormous commercial success; first by Luca, then by his nephew Andrea and finally by Andrea’s sons Giovanni, Girolamo and Luca the younger, until the family split because of the 1527 plague [Gaborit 2002, Gentilini 1992]. The preparation recipes had been kept secret for years until, by the betrayal of a della Robbia maid [Gaborit 2002, Gentilini 1992], they were
134
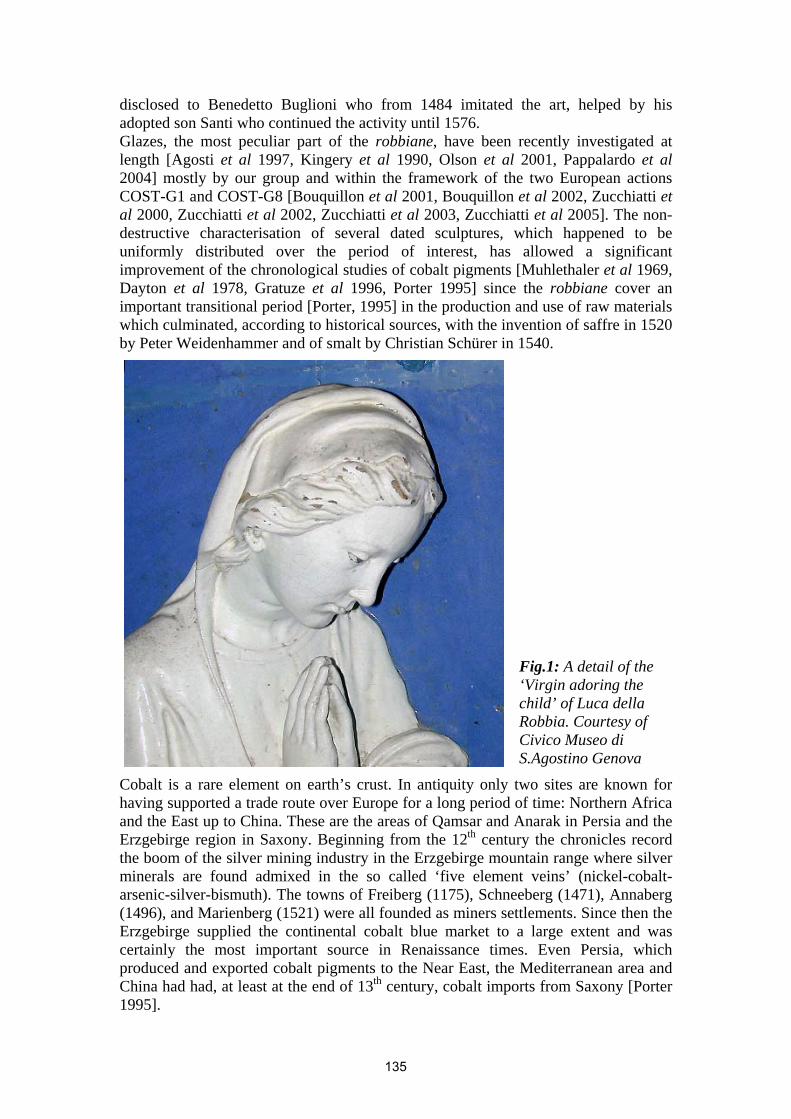
disclosed to Benedetto Buglioni who from 1484 imitated the art, helped by his adopted son Santi who continued the activity until 1576. Glazes, the most peculiar part of the robbiane, have been recently investigated at length [Agosti et al 1997, Kingery et al 1990, Olson et al 2001, Pappalardo et al 2004] mostly by our group and within the framework of the two European actions COST-G1 and COST-G8 [Bouquillon et al 2001, Bouquillon et al 2002, Zucchiatti et al 2000, Zucchiatti et al 2002, Zucchiatti et al 2003, Zucchiatti et al 2005]. The non-destructive characterisation of several dated sculptures, which happened to be uniformly distributed over the period of interest, has allowed a significant improvement of the chronological studies of cobalt pigments [Muhlethaler et al 1969, Dayton et al 1978, Gratuze et al 1996, Porter 1995] since the robbiane cover an important transitional period [Porter, 1995] in the production and use of raw materials which culminated, according to historical sources, with the invention of saffre in 1520 by Peter Weidenhammer and of smalt by Christian Schürer in 1540.
Fig.1: A detail of the ‘Virgin adoring the child’ of Luca della Robbia. Courtesy of Civico Museo di S.Agostino Genova
Cobalt is a rare element on earth’s crust. In antiquity only two sites are known for having supported a trade route over Europe for a long period of time: Northern Africa and the East up to China. These are the areas of Qamsar and Anarak in Persia and the Erzgebirge region in Saxony. Beginning from the 12th century the chronicles record the boom of the silver mining industry in the Erzgebirge mountain range where silver minerals are found admixed in the so called ‘five element veins’ (nickel-cobalt-arsenic-silver-bismuth). The towns of Freiberg (1175), Schneeberg (1471), Annaberg (1496), and Marienberg (1521) were all founded as miners settlements. Since then the Erzgebirge supplied the continental cobalt blue market to a large extent and was certainly the most important source in Renaissance times. Even Persia, which produced and exported cobalt pigments to the Near East, the Mediterranean area and China had had, at least at the end of 13th century, cobalt imports from Saxony [Porter 1995].
135
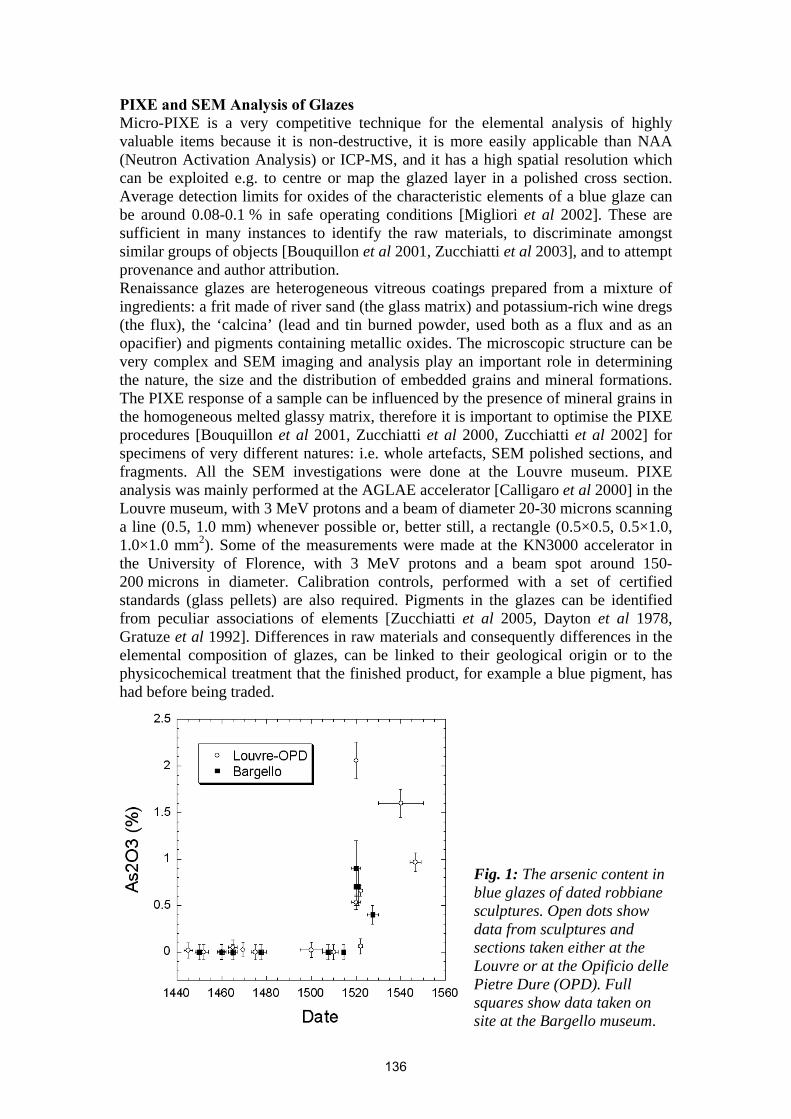
PIXE and SEM Analysis of Glazes Micro-PIXE is a very competitive technique for the elemental analysis of highly valuable items because it is non-destructive, it is more easily applicable than NAA (Neutron Activation Analysis) or ICP-MS, and it has a high spatial resolution which can be exploited e.g. to centre or map the glazed layer in a polished cross section. Average detection limits for oxides of the characteristic elements of a blue glaze can be around 0.08-0.1 % in safe operating conditions [Migliori et al 2002]. These are sufficient in many instances to identify the raw materials, to discriminate amongst similar groups of objects [Bouquillon et al 2001, Zucchiatti et al 2003], and to attempt provenance and author attribution. Renaissance glazes are heterogeneous vitreous coatings prepared from a mixture of ingredients: a frit made of river sand (the glass matrix) and potassium-rich wine dregs (the flux), the ‘calcina’ (lead and tin burned powder, used both as a flux and as an opacifier) and pigments containing metallic oxides. The microscopic structure can be very complex and SEM imaging and analysis play an important role in determining the nature, the size and the distribution of embedded grains and mineral formations. The PIXE response of a sample can be influenced by the presence of mineral grains in the homogeneous melted glassy matrix, therefore it is important to optimise the PIXE procedures [Bouquillon et al 2001, Zucchiatti et al 2000, Zucchiatti et al 2002] for specimens of very different natures: i.e. whole artefacts, SEM polished sections, and fragments. All the SEM investigations were done at the Louvre museum. PIXE analysis was mainly performed at the AGLAE accelerator [Calligaro et al 2000] in the Louvre museum, with 3 MeV protons and a beam of diameter 20-30 microns scanning a line (0.5, 1.0 mm) whenever possible or, better still, a rectangle (0.5×0.5, 0.5×1.0, 1.0×1.0 mm2). Some of the measurements were made at the KN3000 accelerator in the University of Florence, with 3 MeV protons and a beam spot around 150-200 microns in diameter. Calibration controls, performed with a set of certified standards (glass pellets) are also required. Pigments in the glazes can be identified from peculiar associations of elements [Zucchiatti et al 2005, Dayton et al 1978, Gratuze et al 1992]. Differences in raw materials and consequently differences in the elemental composition of glazes, can be linked to their geological origin or to the physicochemical treatment that the finished product, for example a blue pigment, has had before being traded.
Fig. 1: The arsenic content in blue glazes of dated robbiane sculptures. Open dots show data from sculptures and sections taken either at the Louvre or at the Opificio delle Pietre Dure (OPD). Full squares show data taken on site at the Bargello museum.
136
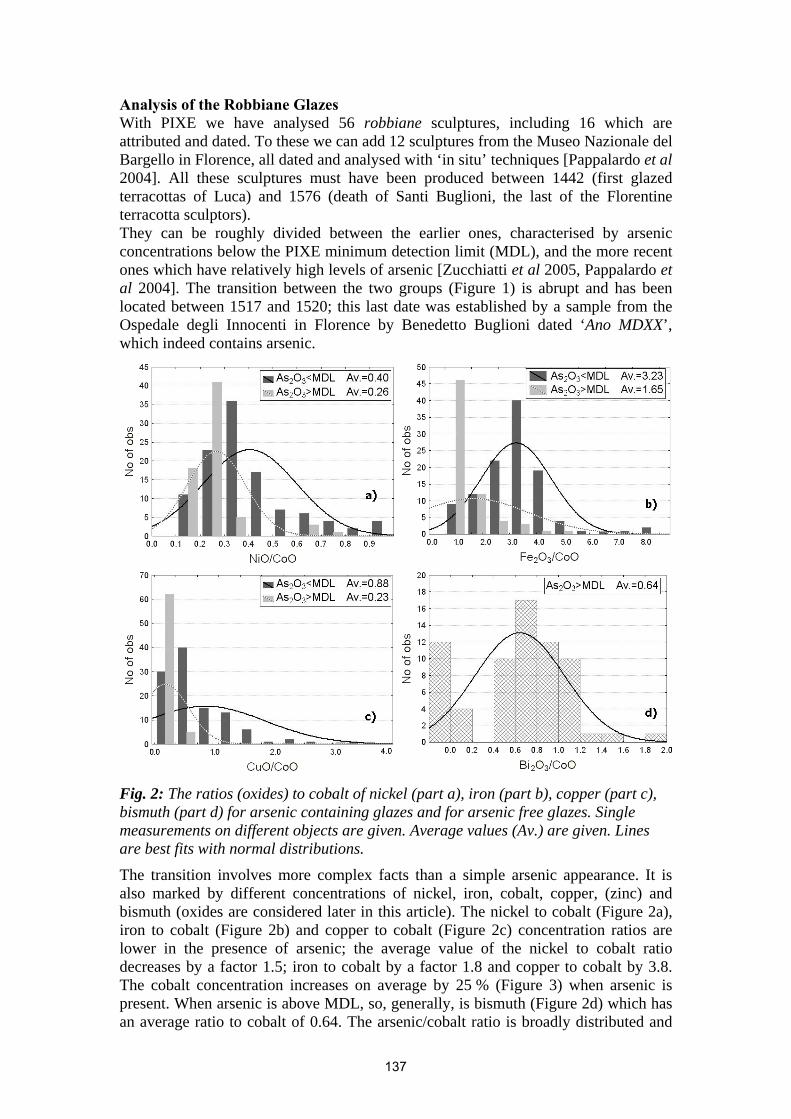
Analysis of the Robbiane Glazes With PIXE we have analysed 56 robbiane sculptures, including 16 which are attributed and dated. To these we can add 12 sculptures from the Museo Nazionale del Bargello in Florence, all dated and analysed with ‘in situ’ techniques [Pappalardo et al 2004]. All these sculptures must have been produced between 1442 (first glazed terracottas of Luca) and 1576 (death of Santi Buglioni, the last of the Florentine terracotta sculptors). They can be roughly divided between the earlier ones, characterised by arsenic concentrations below the PIXE minimum detection limit (MDL), and the more recent ones which have relatively high levels of arsenic [Zucchiatti et al 2005, Pappalardo et al 2004]. The transition between the two groups (Figure 1) is abrupt and has been located between 1517 and 1520; this last date was established by a sample from the Ospedale degli Innocenti in Florence by Benedetto Buglioni dated ‘Ano MDXX’, which indeed contains arsenic.
Fig. 2: The ratios (oxides) to cobalt of nickel (part a), iron (part b), copper (part c), bismuth (part d) for arsenic containing glazes and for arsenic free glazes. Single measurements on different objects are given. Average values (Av.) are given. Lines are best fits with normal distributions.
The transition involves more complex facts than a simple arsenic appearance. It is also marked by different concentrations of nickel, iron, cobalt, copper, (zinc) and bismuth (oxides are considered later in this article). The nickel to cobalt (Figure 2a), iron to cobalt (Figure 2b) and copper to cobalt (Figure 2c) concentration ratios are lower in the presence of arsenic; the average value of the nickel to cobalt ratio decreases by a factor 1.5; iron to cobalt by a factor 1.8 and copper to cobalt by 3.8. The cobalt concentration increases on average by 25 % (Figure 3) when arsenic is present. When arsenic is above MDL, so, generally, is bismuth (Figure 2d) which has an average ratio to cobalt of 0.64. The arsenic/cobalt ratio is broadly distributed and
137
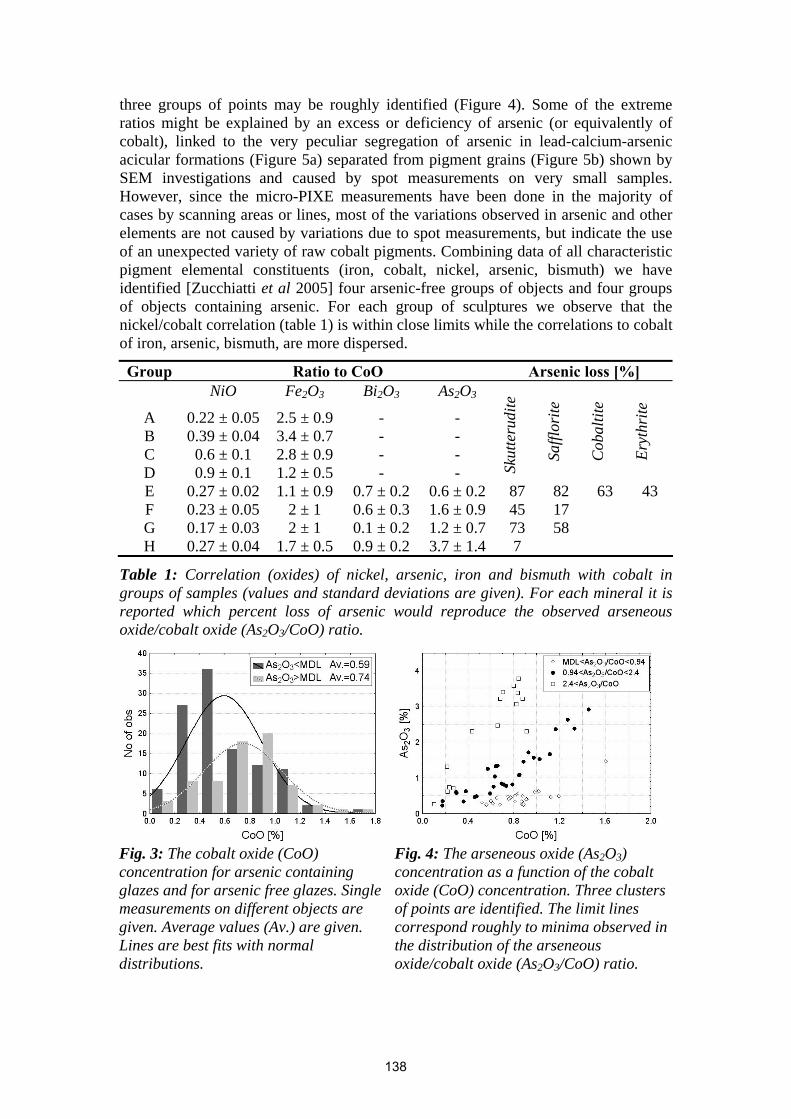
three groups of points may be roughly identified (Figure 4). Some of the extreme ratios might be explained by an excess or deficiency of arsenic (or equivalently of cobalt), linked to the very peculiar segregation of arsenic in lead-calcium-arsenic acicular formations (Figure 5a) separated from pigment grains (Figure 5b) shown by SEM investigations and caused by spot measurements on very small samples. However, since the micro-PIXE measurements have been done in the majority of cases by scanning areas or lines, most of the variations observed in arsenic and other elements are not caused by variations due to spot measurements, but indicate the use of an unexpected variety of raw cobalt pigments. Combining data of all characteristic pigment elemental constituents (iron, cobalt, nickel, arsenic, bismuth) we have identified [Zucchiatti et al 2005] four arsenic-free groups of objects and four groups of objects containing arsenic. For each group of sculptures we observe that the nickel/cobalt correlation (table 1) is within close limits while the correlations to cobalt of iron, arsenic, bismuth, are more dispersed.
Group Ratio to CoO Arsenic loss [%] NiO Fe2O3 Bi2O3 As2O3
A 0.22 ± 0.05 2.5 ± 0.9 - - B 0.39 ± 0.04 3.4 ± 0.7 - - C 0.6 ± 0.1 2.8 ± 0.9 - - D 0.9 ± 0.1 1.2 ± 0.5 - - S
kutte
rudi
te
Saffl
orite
Cob
altit
e
Eryt
hrite
E 0.27 ± 0.02 1.1 ± 0.9 0.7 ± 0.2 0.6 ± 0.2 87 82 63 43 F 0.23 ± 0.05 2 ± 1 0.6 ± 0.3 1.6 ± 0.9 45 17 G 0.17 ± 0.03 2 ± 1 0.1 ± 0.2 1.2 ± 0.7 73 58 H 0.27 ± 0.04 1.7 ± 0.5 0.9 ± 0.2 3.7 ± 1.4 7
Table 1: Correlation (oxides) of nickel, arsenic, iron and bismuth with cobalt in groups of samples (values and standard deviations are given). For each mineral it is reported which percent loss of arsenic would reproduce the observed arseneous oxide/cobalt oxide (As2O3/CoO) ratio.
Fig. 3: The cobalt oxide (CoO) concentration for arsenic containing glazes and for arsenic free glazes. Single measurements on different objects are given. Average values (Av.) are given. Lines are best fits with normal distributions.
Fig. 4: The arseneous oxide (As2O3) concentration as a function of the cobalt oxide (CoO) concentration. Three clusters of points are identified. The limit lines correspond roughly to minima observed in the distribution of the arseneous oxide/cobalt oxide (As2O3/CoO) ratio.
138
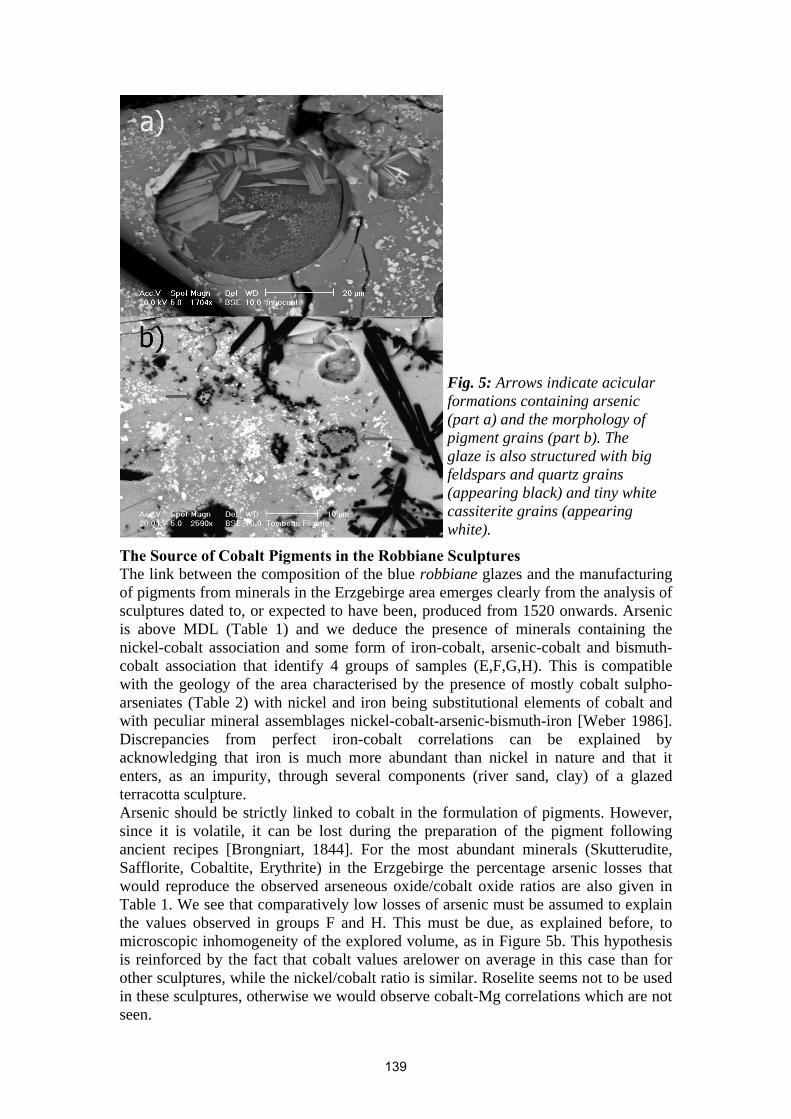
Fig. 5: Arrows indicate acicular formations containing arsenic (part a) and the morphology of pigment grains (part b). The glaze is also structured with big feldspars and quartz grains (appearing black) and tiny white cassiterite grains (appearing white).
The Source of Cobalt Pigments in the Robbiane Sculptures The link between the composition of the blue robbiane glazes and the manufacturing of pigments from minerals in the Erzgebirge area emerges clearly from the analysis of sculptures dated to, or expected to have been, produced from 1520 onwards. Arsenic is above MDL (Table 1) and we deduce the presence of minerals containing the nickel-cobalt association and some form of iron-cobalt, arsenic-cobalt and bismuth-cobalt association that identify 4 groups of samples (E,F,G,H). This is compatible with the geology of the area characterised by the presence of mostly cobalt sulpho-arseniates (Table 2) with nickel and iron being substitutional elements of cobalt and with peculiar mineral assemblages nickel-cobalt-arsenic-bismuth-iron [Weber 1986]. Discrepancies from perfect iron-cobalt correlations can be explained by acknowledging that iron is much more abundant than nickel in nature and that it enters, as an impurity, through several components (river sand, clay) of a glazed terracotta sculpture. Arsenic should be strictly linked to cobalt in the formulation of pigments. However, since it is volatile, it can be lost during the preparation of the pigment following ancient recipes [Brongniart, 1844]. For the most abundant minerals (Skutterudite, Safflorite, Cobaltite, Erythrite) in the Erzgebirge the percentage arsenic losses that would reproduce the observed arseneous oxide/cobalt oxide ratios are also given in Table 1. We see that comparatively low losses of arsenic must be assumed to explain the values observed in groups F and H. This must be due, as explained before, to microscopic inhomogeneity of the explored volume, as in Figure 5b. This hypothesis is reinforced by the fact that cobalt values arelower on average in this case than for other sculptures, while the nickel/cobalt ratio is similar. Roselite seems not to be used in these sculptures, otherwise we would observe cobalt-Mg correlations which are not seen.
139
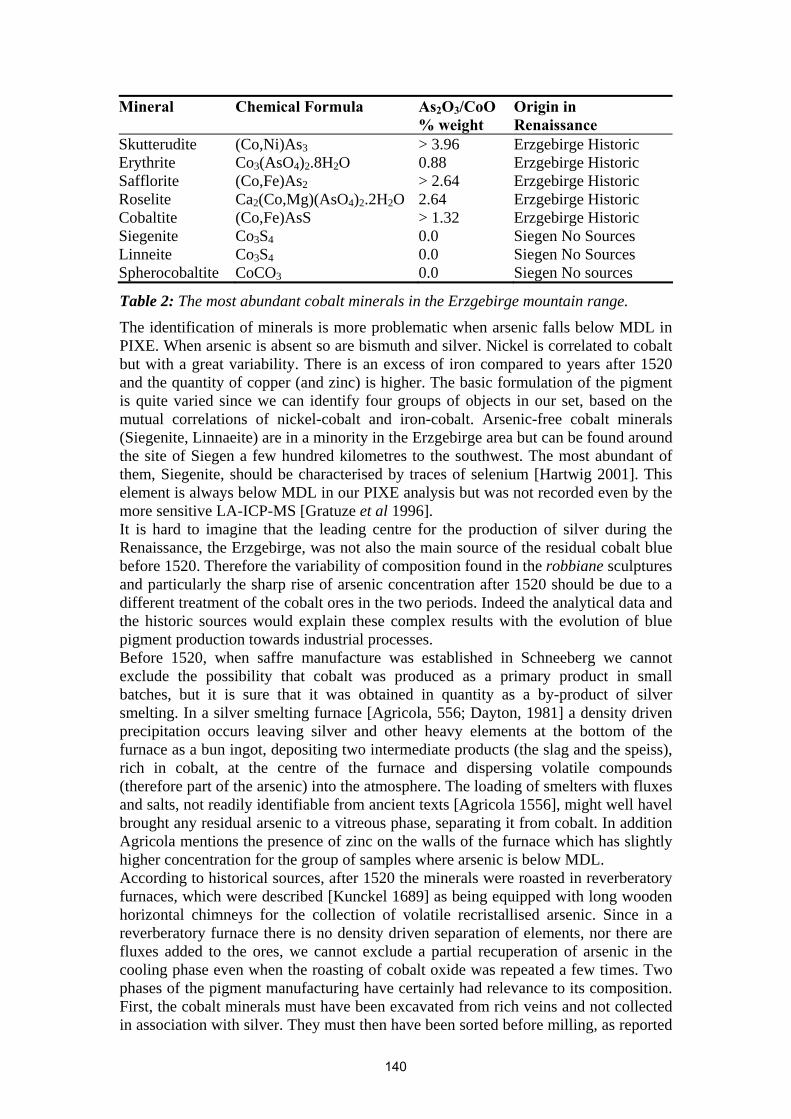
Mineral Chemical Formula As2O3/CoO % weight
Origin in Renaissance
Skutterudite (Co,Ni)As3 > 3.96 Erzgebirge Historic Erythrite Co3(AsO4)2.8H2O 0.88 Erzgebirge Historic Safflorite (Co,Fe)As2 > 2.64 Erzgebirge Historic Roselite Ca2(Co,Mg)(AsO4)2.2H2O 2.64 Erzgebirge Historic Cobaltite (Co,Fe)AsS > 1.32 Erzgebirge Historic Siegenite Co3S4 0.0 Siegen No Sources Linneite Co3S4 0.0 Siegen No Sources Spherocobaltite CoCO3 0.0 Siegen No sources
Table 2: The most abundant cobalt minerals in the Erzgebirge mountain range.
The identification of minerals is more problematic when arsenic falls below MDL in PIXE. When arsenic is absent so are bismuth and silver. Nickel is correlated to cobalt but with a great variability. There is an excess of iron compared to years after 1520 and the quantity of copper (and zinc) is higher. The basic formulation of the pigment is quite varied since we can identify four groups of objects in our set, based on the mutual correlations of nickel-cobalt and iron-cobalt. Arsenic-free cobalt minerals (Siegenite, Linnaeite) are in a minority in the Erzgebirge area but can be found around the site of Siegen a few hundred kilometres to the southwest. The most abundant of them, Siegenite, should be characterised by traces of selenium [Hartwig 2001]. This element is always below MDL in our PIXE analysis but was not recorded even by the more sensitive LA-ICP-MS [Gratuze et al 1996]. It is hard to imagine that the leading centre for the production of silver during the Renaissance, the Erzgebirge, was not also the main source of the residual cobalt blue before 1520. Therefore the variability of composition found in the robbiane sculptures and particularly the sharp rise of arsenic concentration after 1520 should be due to a different treatment of the cobalt ores in the two periods. Indeed the analytical data and the historic sources would explain these complex results with the evolution of blue pigment production towards industrial processes. Before 1520, when saffre manufacture was established in Schneeberg we cannot exclude the possibility that cobalt was produced as a primary product in small batches, but it is sure that it was obtained in quantity as a by-product of silver smelting. In a silver smelting furnace [Agricola, 556; Dayton, 1981] a density driven precipitation occurs leaving silver and other heavy elements at the bottom of the furnace as a bun ingot, depositing two intermediate products (the slag and the speiss), rich in cobalt, at the centre of the furnace and dispersing volatile compounds (therefore part of the arsenic) into the atmosphere. The loading of smelters with fluxes and salts, not readily identifiable from ancient texts [Agricola 1556], might well havel brought any residual arsenic to a vitreous phase, separating it from cobalt. In addition Agricola mentions the presence of zinc on the walls of the furnace which has slightly higher concentration for the group of samples where arsenic is below MDL. According to historical sources, after 1520 the minerals were roasted in reverberatory furnaces, which were described [Kunckel 1689] as being equipped with long wooden horizontal chimneys for the collection of volatile recristallised arsenic. Since in a reverberatory furnace there is no density driven separation of elements, nor there are fluxes added to the ores, we cannot exclude a partial recuperation of arsenic in the cooling phase even when the roasting of cobalt oxide was repeated a few times. Two phases of the pigment manufacturing have certainly had relevance to its composition. First, the cobalt minerals must have been excavated from rich veins and not collected in association with silver. They must then have been sorted before milling, as reported
140
in ancient texts mentioned by Beguin [Beguin 1981] and Harley [Harley 1982]. The data show after 1520 a reduction of nickel and iron in relation to cobalt. This can be explained by the sorting of minerals. In sulpho-arseniates cobalt can be replaced by nickel and iron to form series that go from 100 % cobalt to complete substitution. A hand sorting of the minerals, based most probably on the colour, should obviously enhance the presence of cobalt rich minerals as compared to the nickel and iron rich minerals as we indeed observe in the data. The reduced amount of iron (and zinc) in the pigment can also be due to the separation of impurities such as pyrite, hematite, and zinc-blend. It is not straightforward to explain the correlations between arsenic and cobalt that seem to persist after a complex mineral treatment, especially considering the weight ratios in the mineral, and the many possibilities for loss of arsenic from batch to batch of the production and from different grades of finished product. The microscopic analysis has revealed that, if arsenic comes from the pigment, there is a mechanism which separates it from cobalt and brings it into the vitreous phase from where it re-crystallises in association with calcium and lead (Figure 5b): a process that is perhaps analogous to the hypothesis of the removal of arsenic in a vitreous phase in smelters. It is surprising to note that the sharp compositional transition of materials takes place, as far as the data show, in year 1520 - i.e. in the very same year that Peter Weidenhammer invented saffre. However it could well be that both cobalt mining and saffre manufacture were introduced earlier than was actually documented. It appears that the supply of pigments to the potteries of Florence was in the form of small batches with frequent replacements of fresh products, and, moreover, no stock was kept. This is seen also from the great variability of composition both before and after 1520, and was not the habit in other contexts. Conclusions The work performed on the robbiane glazed terracotta sculptures is a good example of how the synergy between different professional experience and the use of several types of information are necessary and effective in understanding the evolution of an artistic technique. The non-destructive nature of PIXE analysis, the opportunity for several samplings of artefacts under restoration, the careful use of documents, and the accessibility of museum sculptures of the della Robbia school, have combined to offer a deep insight into the problem of use and trade of cobalt pigments during the Renaissance. The combination of SEM-EDS and PIXE techniques has given an overview of the microscopic and elemental composition of blue glazes that was never possible before, and that helps to identify with some confidence the nature of pigments used in this historical period. The analytical data have highlighted a transition in the composition of pigments just before 1520 but also a change in selecting and processing the raw materials during the entire period of the robbiane sculptures (1440-1576). We interpret the results assuming that the source of materials was the same throughout this historical period: the cobalt sulpho-arseniates of the Erzgebirge. The variability of composition that we observe before 1520 can be related to erratic changes in the smelting process of silver, of which cobalt was a by-product, and mainly to the mixing of different cobalt lodes with the native silver ores. Just before 1520 we observe a sharp modification of the pigment composition, which becomes enriched in arsenic and bismuth. This seems to be due to the transformation of cobalt-blue into a real industrial product with a specific production process based on minerals sorting and roasting in a reverberatory furnace. This industrial change is documented by historical sources that date it at 1520.
141
Acknowledgments Many colleagues have helped in various stages of this complex work: artefacts maintenance and manipulation, accelerator runs, data analysis, scientific and artistic discussions. It is a great pleasure to acknowledge the contribution of E. Alloin, J. Castaing, R. Corvisiero, C. Di Fabio, G. Francolini, J.R. Gaborit, F. Kumar, G. Lanterna, F. Lucarelli, P.A. Mandò, A. Migliori, B. Moignard, G. Pappalardo, L. Pappalardo, P. Prati, P.F. Romano, J. Salomon, M.G. Vaccari and the assistance of the Musée du Louvre and the Museo Nazionale del Bargello. We are indebted to the European G8 action for subsidising two short term scientific missions and to CNRS for a temporary position (A.Z.) at the UMR171 (Louvre). References
• Agosti, G., Androni, A., Fabbri, B., Kumar, F., Lanterna, G., Mingazzini, C., Moioli, P., Moradei, R., Seccaroni, C., Vaccari, M.G., 1997, ‘Una pala in terracotta invetriata di produzione robbiana: metodi integrati di indagine e restauro’, OPD Restauro, 9, pp. 73-90
• Agricola, G.,1556, De re metallica, Translated from the first latin edition of 1556 by Hoover, H.C. and Hoover, L.H, 1950, Dover Publications, New York
• Beguin, A.,1981, Dictionnaire technique de la peinture, A. Beguin editor, Paris
• Bouquillon, A., Castaing, J., Salomon, J., Lucarelli, F., Mandò, P.A., Prati, P., Zucchiatti, A., 2001, ‘Iba Techniques to Study Renaissance Pottery Techniques’, In: Connel, S.H., Tegen, R., (eds.) Proceedings of the International Conference on Fundamental & Applied Aspects of Modern Physiscs, Luderitz 13-17 November 2000, World Scientific, Singapore, pp. 441-448
• Bouquillon, A., Castaing, J., Vartanian, E., Zink, A., Zucchiatti, A., 2002, Etude des Oeuvres robbiesques au Centre de Recherche et Restauration des Musées de France, in : Gaborit, J.R., Bormand, M., (eds) Les Della Robbia, Sculptures en terre cuite émaillée de la Renaissance italienne, Rèunion des Musées Nationaux, Paris
• Brongniart, A., 1844, Traité des arts Céramiques ou des poteries, Editions Bechet-Jeune, Paris
• Calligaro, T., Dran, J.C., Ioannidou, E., Moignard, B., Pichon, L., Salomon, J., 2000, ‘Development of an External Beam Nuclear Microprobe on the AGLAE Facility at The Louvre Museum’, Nuclear Instruments and Methods, 161-163, pp. 328-332
• Dayton, J., Bowles, J., Shepperd, C., 1978, Egyptian blue or kyanos and the problem of Cobalt, in: Dayton, J., and Dayton, A., Minerals Metals Glazing and Men, App. I, Harrap, London
• Dayton, J., 1981, ‘Geological evidence for the discovery of cobalt blue glass in Mycenean times as a by product of silver smelting in the Schneeberg area of the Bohemian Erzgebirge’, Archeometrie, vol II suppl., pp. 57-61
• Gaborit, J.R., Bormand, M., (eds), 2002, Les Della Robbia, Sculptures en terre cuite émaillée de la Renaissance italienne, Rèunion des Musées Nationaux, Paris
• Gentilini, G., 1992, I Della Robbia- La scultura Invetriata del Rinascimento, tomo 1 e 2, Cantini editore, Milano
142
• Gratuze, B., Soulier, I., Barrandon, J.N., Foy, D., 1992, ’De l’origine du cobalt dans les verres’, Revue d’Archéométrie, 16, pp. 97-108
• Gratuze, B., Soulier, I., Blet, M., Vallauri, L., 1996, ‘De l’origine du cobalt: du verre a la céramique’, Revue d’Archéométrie, 20, pp. 77-94
• Harley, R.D., 1982, Artists pigments c. 1600-1835. A study of English documentary sources , Sec. Edition, Butterworth Scientific, London
• Hartwig, J., 2001, ‘De la fabrication et de l’utilisation du safre ou zaffera (cobalt) et du smalte par les verriers du 16e au 18e siècle’, Verre, vol. 7, pp. 40-48
• Kingery, W.D., Aronson, M., 1990, ‘The glazes of Luca della Robbia’, Faenza annata LXXVI, pp.221-225
• Kunckel, J., 1689, Ars vitraria experimentalis, Frankfurt and Leipzig • Migliori, A., Chiari, M., Mandò, P.A., 2002, ‘Investigation of beam-induced
damage to ancient ceramics in external-PIXE measurements’, Nucl. Instr. and Meth., B188, pp. 151-155
• Muhlethaler, B., Thissen, J., 1969, ‘Smalt ’, Studies in Conservation, 14, pp. 47-61
• Olson, R.J.M. and Barbour, D.S., 2001, ‘Toward a new method for studying glazed terracottas. Examining a group of tondi by Andrea della Robbia’, Apollo, CLIV, pp. 44-52
• Pappalardo, G., Costa, E., Marchetta, C., Pappalardo, L., Romano, F.P., Zucchiatti, A., Prati, P., Mandò, P.A., Migliori, A., Palombo, L., Vaccari, M.G., 2004, ‘Non-destructive characterization of Della Robbia sculptures at the Bargello museum in Florence by the combined use of PIXE and XRF portable systems’, Journal of Cultural Heritage, 5, pp. 183-188
• Pastoureau, M., 1990, La couleur et l’historien, in: Pigments et colorants de l’antiquité et du moyen age, Editions du CNRS, Paris
• Porter, Y., 1995, ‘Origines et diffusion du cobalt utilisé en céramique à l’époque médiévale. Etude préliminaire’, in: VIe congres International sur la Céramique Médiévale en Méditerranée, Aix en Provence 13-18 Nov 1995
• Weber, W., 1986, ‘ Der Freiberg Bergbau ’, Lapis, 11, pp. 13-27 • Zucchiatti, A., Bouquillon, A., Salomon, J., Gaborit, J.R., 2000, ‘Study of
Italian Renaissance Sculptures Using An External Beam Nuclear Microprobe’, Nuclear Instruments And Methods, B161-163, pp. 699-703
• Zucchiatti, A., Bouquillon, A., Lanterna, G., Lucarelli, F., Mandò, P.A., Prati, P., Salomon, J., Vaccari, M.G., 2002, ‘PIXE and µ-PIXE analysis of glazes from terracotta sculptures of the della Robbia workshop’, Nuclear Instruments And Methods, B189, pp.358-363
• Zucchiatti, A., Bouquillon, A., Castaing, J., Gaborit, J.R., 2003, ‘Elemental analyses of a group of glazed terracotta angels from the Italian renaissance, as a tool for the reconstruction of a complex conservation history’, Archaeometry, 45,3, pp. 391-404
• Zucchiatti, A., Bouquillon, A., Katona, I., D’Alessandro, A., 2005, ‘The della Robbia Blue: a study case for the use of cobalt pigments in ceramics during the Italian Renaissance’, Archaeometry, accepted for publication
143


Glass

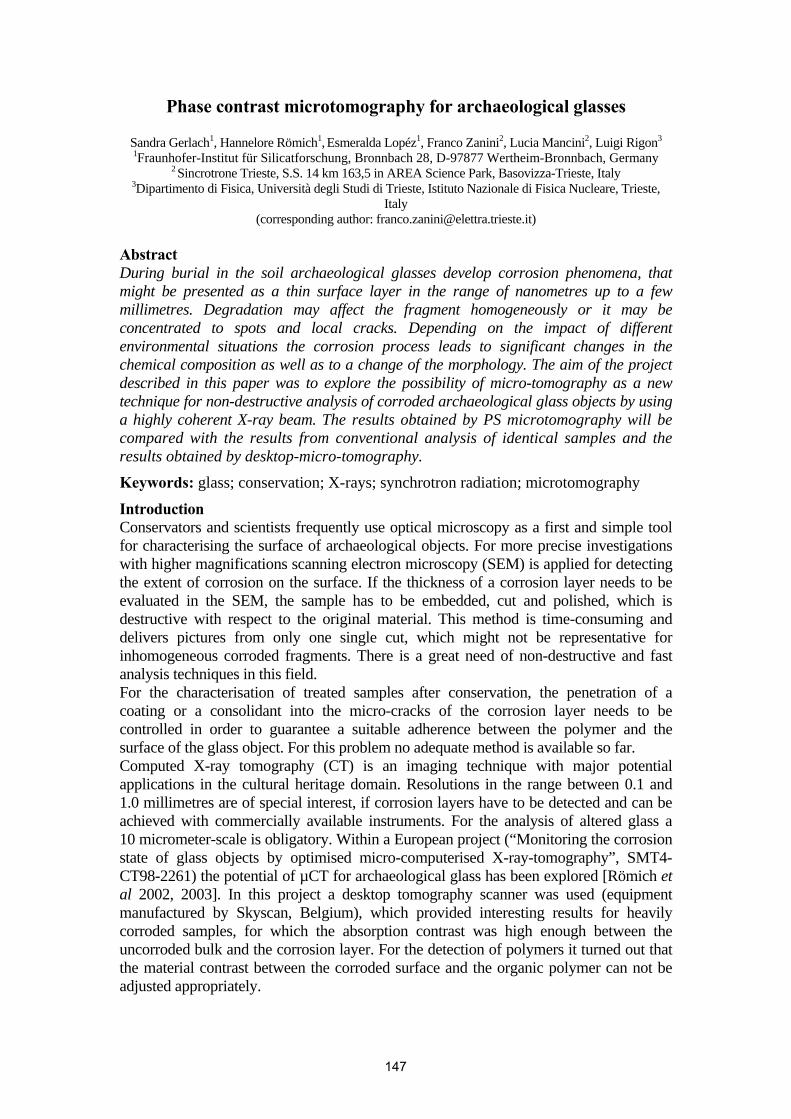
Phase contrast microtomography for archaeological glasses
Sandra Gerlach1, Hannelore Römich1, Esmeralda Lopéz1, Franco Zanini2, Lucia Mancini2, Luigi Rigon3 1Fraunhofer-Institut für Silicatforschung, Bronnbach 28, D-97877 Wertheim-Bronnbach, Germany
2 Sincrotrone Trieste, S.S. 14 km 163,5 in AREA Science Park, Basovizza-Trieste, Italy 3Dipartimento di Fisica, Università degli Studi di Trieste, Istituto Nazionale di Fisica Nucleare, Trieste,
Italy (corresponding author: [email protected])
Abstract During burial in the soil archaeological glasses develop corrosion phenomena, that might be presented as a thin surface layer in the range of nanometres up to a few millimetres. Degradation may affect the fragment homogeneously or it may be concentrated to spots and local cracks. Depending on the impact of different environmental situations the corrosion process leads to significant changes in the chemical composition as well as to a change of the morphology. The aim of the project described in this paper was to explore the possibility of micro-tomography as a new technique for non-destructive analysis of corroded archaeological glass objects by using a highly coherent X-ray beam. The results obtained by PS microtomography will be compared with the results from conventional analysis of identical samples and the results obtained by desktop-micro-tomography.
Keywords: glass; conservation; X-rays; synchrotron radiation; microtomography
Introduction Conservators and scientists frequently use optical microscopy as a first and simple tool for characterising the surface of archaeological objects. For more precise investigations with higher magnifications scanning electron microscopy (SEM) is applied for detecting the extent of corrosion on the surface. If the thickness of a corrosion layer needs to be evaluated in the SEM, the sample has to be embedded, cut and polished, which is destructive with respect to the original material. This method is time-consuming and delivers pictures from only one single cut, which might not be representative for inhomogeneous corroded fragments. There is a great need of non-destructive and fast analysis techniques in this field. For the characterisation of treated samples after conservation, the penetration of a coating or a consolidant into the micro-cracks of the corrosion layer needs to be controlled in order to guarantee a suitable adherence between the polymer and the surface of the glass object. For this problem no adequate method is available so far. Computed X-ray tomography (CT) is an imaging technique with major potential applications in the cultural heritage domain. Resolutions in the range between 0.1 and 1.0 millimetres are of special interest, if corrosion layers have to be detected and can be achieved with commercially available instruments. For the analysis of altered glass a 10 micrometer-scale is obligatory. Within a European project (“Monitoring the corrosion state of glass objects by optimised micro-computerised X-ray-tomography”, SMT4-CT98-2261) the potential of µCT for archaeological glass has been explored [Römich et al 2002, 2003]. In this project a desktop tomography scanner was used (equipment manufactured by Skyscan, Belgium), which provided interesting results for heavily corroded samples, for which the absorption contrast was high enough between the uncorroded bulk and the corrosion layer. For the detection of polymers it turned out that the material contrast between the corroded surface and the organic polymer can not be adjusted appropriately.
147
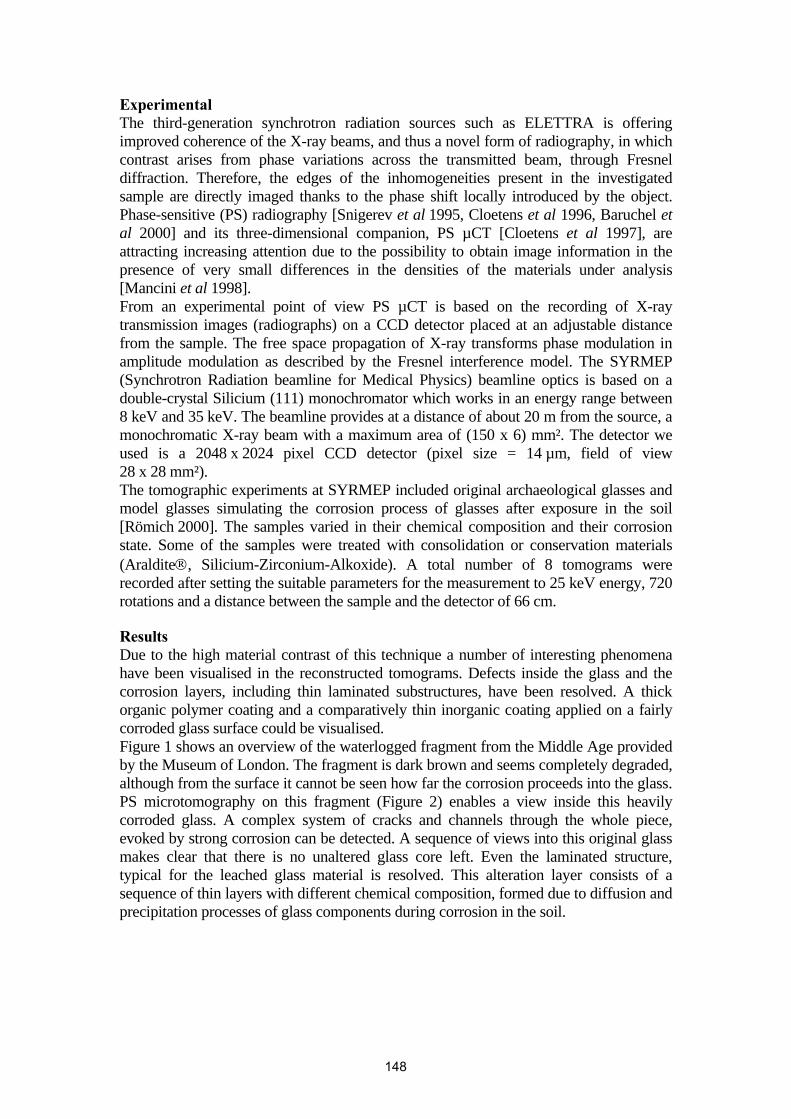
Experimental The third-generation synchrotron radiation sources such as ELETTRA is offering improved coherence of the X-ray beams, and thus a novel form of radiography, in which contrast arises from phase variations across the transmitted beam, through Fresnel diffraction. Therefore, the edges of the inhomogeneities present in the investigated sample are directly imaged thanks to the phase shift locally introduced by the object. Phase-sensitive (PS) radiography [Snigerev et al 1995, Cloetens et al 1996, Baruchel et al 2000] and its three-dimensional companion, PS µCT [Cloetens et al 1997], are attracting increasing attention due to the possibility to obtain image information in the presence of very small differences in the densities of the materials under analysis [Mancini et al 1998]. From an experimental point of view PS µCT is based on the recording of X-ray transmission images (radiographs) on a CCD detector placed at an adjustable distance from the sample. The free space propagation of X-ray transforms phase modulation in amplitude modulation as described by the Fresnel interference model. The SYRMEP (Synchrotron Radiation beamline for Medical Physics) beamline optics is based on a double-crystal Silicium (111) monochromator which works in an energy range between 8 keV and 35 keV. The beamline provides at a distance of about 20 m from the source, a monochromatic X-ray beam with a maximum area of (150 x 6) mm². The detector we used is a 2048 x 2024 pixel CCD detector (pixel size = 14 µm, field of view 28 x 28 mm²). The tomographic experiments at SYRMEP included original archaeological glasses and model glasses simulating the corrosion process of glasses after exposure in the soil [Römich 2000]. The samples varied in their chemical composition and their corrosion state. Some of the samples were treated with consolidation or conservation materials (Araldite®, Silicium-Zirconium-Alkoxide). A total number of 8 tomograms were recorded after setting the suitable parameters for the measurement to 25 keV energy, 720 rotations and a distance between the sample and the detector of 66 cm. Results Due to the high material contrast of this technique a number of interesting phenomena have been visualised in the reconstructed tomograms. Defects inside the glass and the corrosion layers, including thin laminated substructures, have been resolved. A thick organic polymer coating and a comparatively thin inorganic coating applied on a fairly corroded glass surface could be visualised. Figure 1 shows an overview of the waterlogged fragment from the Middle Age provided by the Museum of London. The fragment is dark brown and seems completely degraded, although from the surface it cannot be seen how far the corrosion proceeds into the glass. PS microtomography on this fragment (Figure 2) enables a view inside this heavily corroded glass. A complex system of cracks and channels through the whole piece, evoked by strong corrosion can be detected. A sequence of views into this original glass makes clear that there is no unaltered glass core left. Even the laminated structure, typical for the leached glass material is resolved. This alteration layer consists of a sequence of thin layers with different chemical composition, formed due to diffusion and precipitation processes of glass components during corrosion in the soil.
148
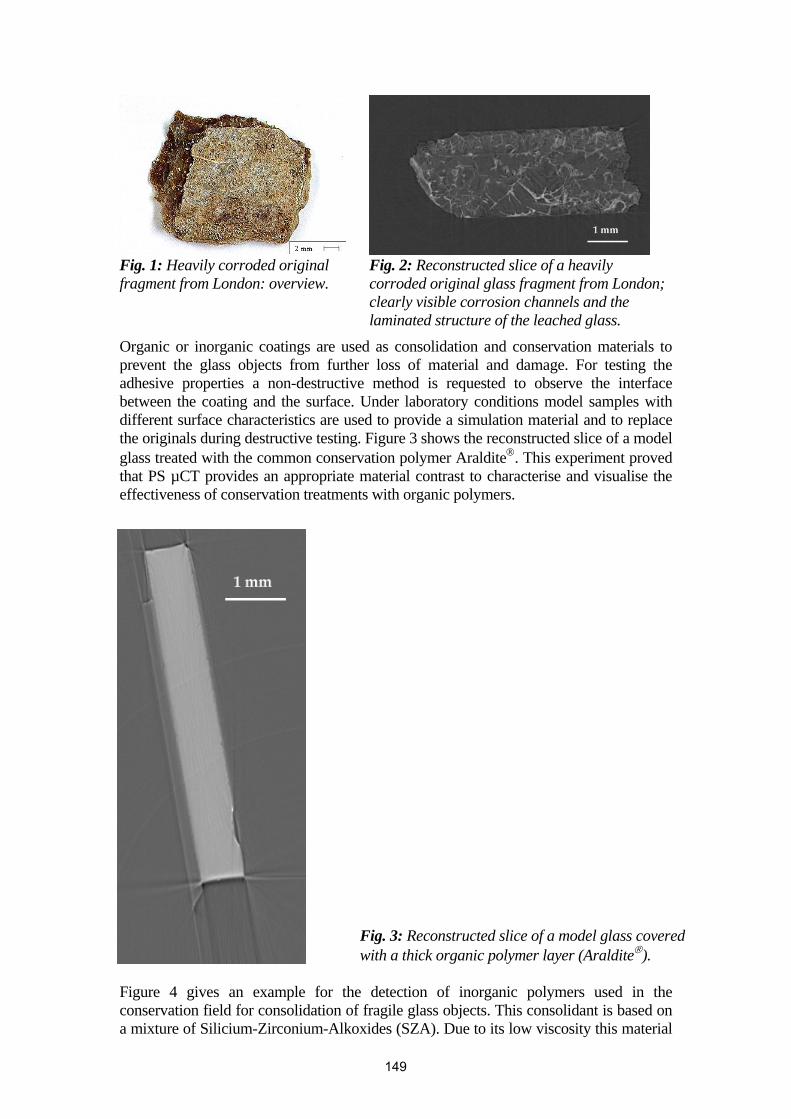
Fig. 1: Heavily corroded original fragment from London: overview.
Fig. 2: Reconstructed slice of a heavily corroded original glass fragment from London; clearly visible corrosion channels and the laminated structure of the leached glass.
Organic or inorganic coatings are used as consolidation and conservation materials to prevent the glass objects from further loss of material and damage. For testing the adhesive properties a non-destructive method is requested to observe the interface between the coating and the surface. Under laboratory conditions model samples with different surface characteristics are used to provide a simulation material and to replace the originals during destructive testing. Figure 3 shows the reconstructed slice of a model glass treated with the common conservation polymer Araldite®. This experiment proved that PS µCT provides an appropriate material contrast to characterise and visualise the effectiveness of conservation treatments with organic polymers.
Fig. 3: Reconstructed slice of a model glass covered with a thick organic polymer layer (Araldite®).
Figure 4 gives an example for the detection of inorganic polymers used in the conservation field for consolidation of fragile glass objects. This consolidant is based on a mixture of Silicium-Zirconium-Alkoxides (SZA). Due to its low viscosity this material
149
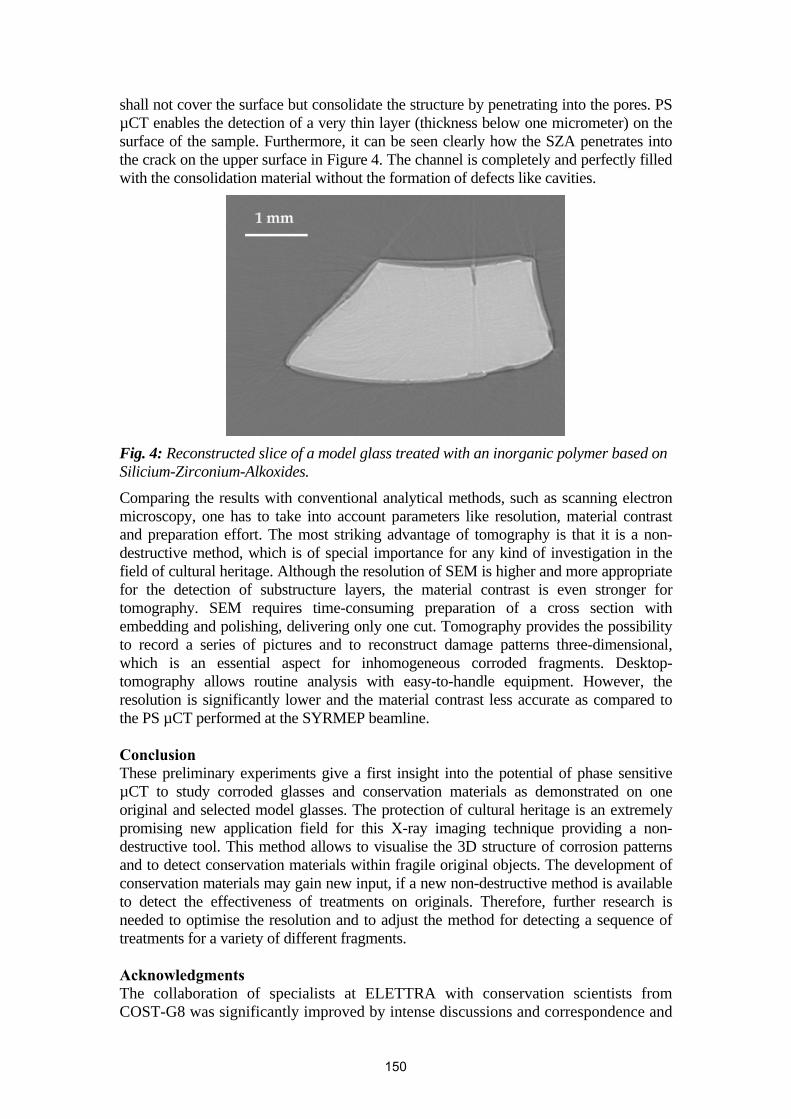
shall not cover the surface but consolidate the structure by penetrating into the pores. PS µCT enables the detection of a very thin layer (thickness below one micrometer) on the surface of the sample. Furthermore, it can be seen clearly how the SZA penetrates into the crack on the upper surface in Figure 4. The channel is completely and perfectly filled with the consolidation material without the formation of defects like cavities.
Fig. 4: Reconstructed slice of a model glass treated with an inorganic polymer based on Silicium-Zirconium-Alkoxides.
Comparing the results with conventional analytical methods, such as scanning electron microscopy, one has to take into account parameters like resolution, material contrast and preparation effort. The most striking advantage of tomography is that it is a non-destructive method, which is of special importance for any kind of investigation in the field of cultural heritage. Although the resolution of SEM is higher and more appropriate for the detection of substructure layers, the material contrast is even stronger for tomography. SEM requires time-consuming preparation of a cross section with embedding and polishing, delivering only one cut. Tomography provides the possibility to record a series of pictures and to reconstruct damage patterns three-dimensional, which is an essential aspect for inhomogeneous corroded fragments. Desktop-tomography allows routine analysis with easy-to-handle equipment. However, the resolution is significantly lower and the material contrast less accurate as compared to the PS µCT performed at the SYRMEP beamline. Conclusion These preliminary experiments give a first insight into the potential of phase sensitive µCT to study corroded glasses and conservation materials as demonstrated on one original and selected model glasses. The protection of cultural heritage is an extremely promising new application field for this X-ray imaging technique providing a non-destructive tool. This method allows to visualise the 3D structure of corrosion patterns and to detect conservation materials within fragile original objects. The development of conservation materials may gain new input, if a new non-destructive method is available to detect the effectiveness of treatments on originals. Therefore, further research is needed to optimise the resolution and to adjust the method for detecting a sequence of treatments for a variety of different fragments. Acknowledgments The collaboration of specialists at ELETTRA with conservation scientists from COST-G8 was significantly improved by intense discussions and correspondence and
150
by participation at several meetings. Furthermore, several members of G8 had been invited to present their results at conferences at ELETTRA. References
• Baruchel, J., Cloetens, P., Härtwig, J., Ludwig, W., Mancini, L., Pernot, P. and Schlenker, M. 2000. 'Phase imaging using highly coherent X-rays: radiography, tomography, diffraction topography'. Journal of Synchrotron Radiation 7: 196-201.
• Cloetens, P., Barrett, R., Baruchel, J., Guigay, J.P. and Schlenker, M. 1996. 'Phase objects in synchrotron radiation hard X-ray imaging', Journal of Physics D: Applied Physics, 29: 133-146.
• Cloetens, P., Pateyron-Salomé, M., Buffière, J.Y., Peix, G., Baruchel, J., Peyrin, F. and Schlenker, M. 1997. 'Observation of microstructure and damage in materials by phase sensitive radiography and tomography' Journal of Applied Physics, 81: 5878-5886.
• Mancini, L., Reinier, E., Cloetens, P., Gastaldi, J. , Härtwig, J., Schlenker, M. and Baruchel, J. 1998. 'Investigation of structural defects and inhomogeneities in Al-Pd-Mn icosahedral quasicrystals by combined synchrotron X-ray topography and phase radiography', Philosophical Magazine A, 78: 1175-1194.
• Römich, H. 2000. 'Simulation of corrosion phenomena of historical glasses on model glasses: an update’, Proc. conference. The Suface: a Bug in New an Old Glasses – GS 2000, Rivista della Stazione Sperimentale del Vetro, ISSN: 0391-4259, 9-14.
• Römich, H., López, E., Mees, F., Jacobs, P., Cornelis, E., Van Dyck, D., Doménech Carbó, T. 2002. Proc. 7th International Conference on Non-destructive Testing and Microanalysis for the Diagnostics and Conservation of the Cultural and Environmental Heritage, Antwerp, Belgium, publ. by University of Antwerp, 1-12.
• Römich, H., Gerlach, S., Mottner, P., Mees, F., Jacobs, P., Van Dyck, D., Domenech Carbo, T. 2003. 'Results From Burial Experiments With Simulated Medieval Glasses', Proc. MRS Symposium Vol. 757, 97-109
• Snigirev, A., Snigireva, I., Kohn, V., Kuznetsov, S. and Schelokov, I., 1995. 'On the possibilities of X-ray phase contrast microimaging by coherent high-energy synchrotron radiation', Review of Scientific Instruments 66, 5486-5492.
151
What can bring the PIXE –PIGE method to the study of stained glass window?
G. Weber1 , D. Strivay1, Y. Vanden Bemden2, M. Pirotte3
1 IPNAS, Université de Liège, Sart-Tilman B15, 4000 Liège, Belgium 2 Dpt. Histoire de l’Art et Archéologie, FUNDP, Namur
3 Lumière et couleur S.A., Richelle-Visé, CEA - Centre Européen d’Archéométrie
Région Wallonne – Division du Patrimoine
Abstract We had the opportunity to study by PIXE-PIGE a large panel (100x80 cm) containing more than forty stained glass pieces. Among the glass pieces, several come from restorations having taken place at different periods. The study of this rather complex arrangement has proceeded by stages: - the elemental composition of 16 zones were determined : several differences were identified and among them the Na/K ratio which allowed to set three groups of glass type; - the red-coloured pieces were specially investigated in order to determine which coloration technique was employed (bulk coloration, superficial staining, multilayered flashing,…); - the silver yellow glass were studied using the variable incident beam angle and the depth at which the silver layer lies was measured. This study shows the possibilities of the PIGE-PIXE association but also points out some weaknesses which have to be resolved by other techniques but in that case, the non-destructive aspect could be lost. Keywords: PIXE, PIGE, stained glass, window glass, corrosion
Introduction In the field of archaeometry, stained glass has been extensively studied by several techniques as ICP-MS, SEM-EDX, XRF [Borbely-Kiss et al 1994, Baxter et al 1994, Schreiner 1987] and very interesting results have been obtained. Unfortunately, all these tools need small glass specimen and sometimes the techniques are destructive. The aim of the present paper is to show what it is possible to collect information by applying totally non-destructive techniques. Having the opportunity to study a large panel removed from its usual location for restoration, we applied PIXE and PIGE under normal and differential ways, in order to get the maximum of data likely to be useful for the restorer. This panel is part of the stained glass decoration of the chapel located in the park of the Enghien’s castle in Belgium. The original set of glass windows was put into place during the 16th century but, several restorations took place later (19th and 20th centuries). Panel identification: window IV – panel 2A). Material and methods PIXE (particle induced X-ray emission) and PIGE (particle induced γ-ray emission) are simultaneously used at atmospheric pressure. So, large artefacts can be analyzed and the disadvantages of working under vacuum can be avoided. The particle beam leaves the vacuum of the beam line by a thin nickel foil (2.5 µm). This metal has been chosen because of its good thermal strength and because it doesn’t produce γ-rays under proton bombardment. The particle beam is monitored by counting the charged particles scattered by a gold layer (50 nm) deposited on a polycarbonate backing, which interrupts the beam at a 2 Hz frequency.
152
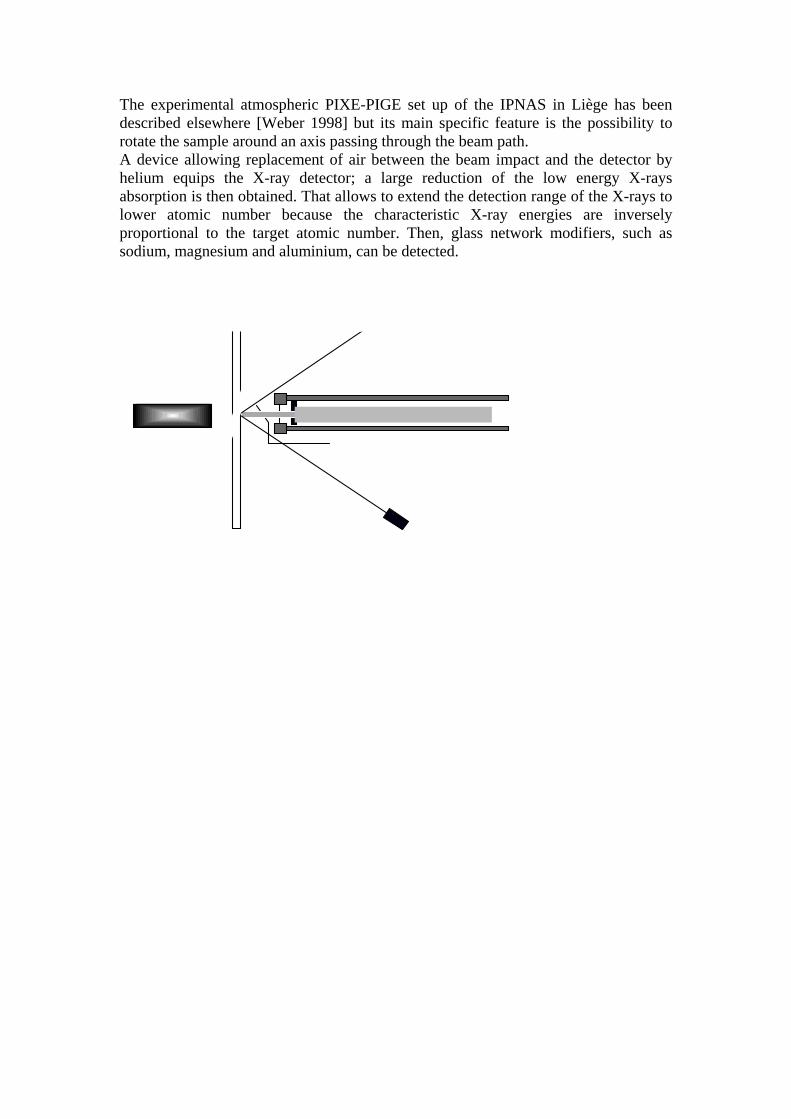
The experimental atmospheric PIXE-PIGE set up of the IPNAS in Liège has been described elsewhere [Weber 1998] but its main specific feature is the possibility to rotate the sample around an axis passing through the beam path. A device allowing replacement of air between the beam impact and the detector by helium equips the X-ray detector; a large reduction of the low energy X-rays absorption is then obtained. That allows to extend the detection range of the X-rays to lower atomic number because the characteristic X-ray energies are inversely proportional to the target atomic number. Then, glass network modifiers, such as sodium, magnesium and aluminium, can be detected.
laser
laser
chopper
sample
XTRAγ-ray detection
LEGeX-ray detection
protons
RBS
He
γ
x
Fig. 1: Atmospheric PIXE-PIGE set-up.
Results and discussion Quantitative analysis The impacts have been chosen in function of the considering coloration and possible restorations. They concern the reverse side of the panel (Figure 2). All these zones were free from grisaille and only cleaned with distilled water. The beam diameter was 0.8 mm. The results of these measurements are reported on Table 1. The first two columns give the concentrations respectively obtained by PIGE and PIXE. The major element concentration are expressed in % of oxides, whereas the minor and trace ones are expressed in ppm (µg/g) of elements. In addition to the basic elements of glass, several ones are responsible for the coloration (cobalt for blue, silver for yellow, copper for red and green). The results of these measurements are reported on Table 1. The first two columns give the concentrations respectively obtained by PIGE and PIXE. The major element concentration are expressed in % of oxides, whereas the minor and trace ones are expressed in ppm (µg/g) of elements. In addition to the basic elements of glass, several elements are responsible for the colouration (cobalt for blue, silver for yellow, copper for red and green). The Figure 3 shows the ratio Na/K (sodium/potassium) for the 16 analyses. Three zones have been selected with respect to that ratio. They correspond to three types of glass.
Potash glass Na/K < 2 Soda – potash glass 2 <Na/K <20 Soda glass 20 <Na/K
153
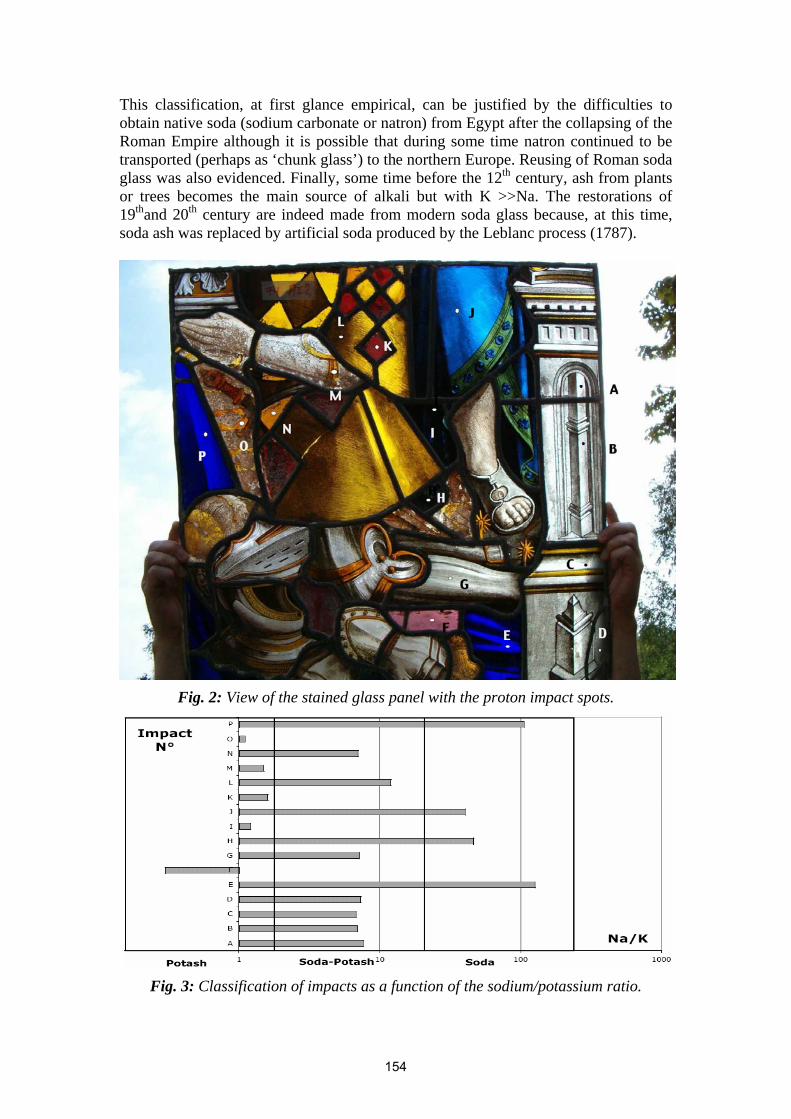
This classification, at first glance empirical, can be justified by the difficulties to obtain native soda (sodium carbonate or natron) from Egypt after the collapsing of the Roman Empire although it is possible that during some time natron continued to be transported (perhaps as ‘chunk glass’) to the northern Europe. Reusing of Roman soda glass was also evidenced. Finally, some time before the 12th century, ash from plants or trees becomes the main source of alkali but with K >>Na. The restorations of 19thand 20th century are indeed made from modern soda glass because, at this time, soda ash was replaced by artificial soda produced by the Leblanc process (1787).
Fig. 2: View of the stained glass panel with the proton impact spots.
Fig. 3: Classification of impacts as a function of the sodium/potassium ratio.
154
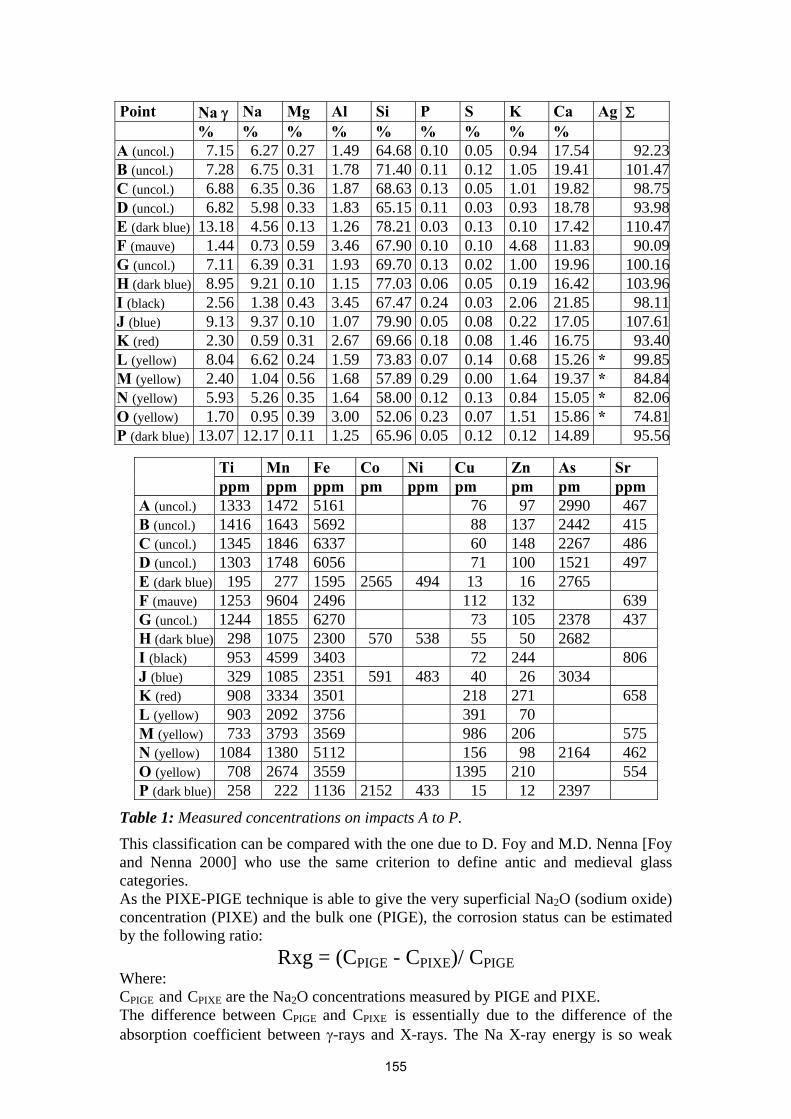
Point Na γ Na Mg Al Si P S K Ca Ag Σ % % % % % % % % % A (uncol.) 7.15 6.27 0.27 1.49 64.68 0.10 0.05 0.94 17.54 92.23B (uncol.) 7.28 6.75 0.31 1.78 71.40 0.11 0.12 1.05 19.41 101.47C (uncol.) 6.88 6.35 0.36 1.87 68.63 0.13 0.05 1.01 19.82 98.75D (uncol.) 6.82 5.98 0.33 1.83 65.15 0.11 0.03 0.93 18.78 93.98E (dark blue) 13.18 4.56 0.13 1.26 78.21 0.03 0.13 0.10 17.42 110.47F (mauve) 1.44 0.73 0.59 3.46 67.90 0.10 0.10 4.68 11.83 90.09G (uncol.) 7.11 6.39 0.31 1.93 69.70 0.13 0.02 1.00 19.96 100.16H (dark blue) 8.95 9.21 0.10 1.15 77.03 0.06 0.05 0.19 16.42 103.96I (black) 2.56 1.38 0.43 3.45 67.47 0.24 0.03 2.06 21.85 98.11J (blue) 9.13 9.37 0.10 1.07 79.90 0.05 0.08 0.22 17.05 107.61K (red) 2.30 0.59 0.31 2.67 69.66 0.18 0.08 1.46 16.75 93.40L (yellow) 8.04 6.62 0.24 1.59 73.83 0.07 0.14 0.68 15.26 * 99.85M (yellow) 2.40 1.04 0.56 1.68 57.89 0.29 0.00 1.64 19.37 * 84.84N (yellow) 5.93 5.26 0.35 1.64 58.00 0.12 0.13 0.84 15.05 * 82.06O (yellow) 1.70 0.95 0.39 3.00 52.06 0.23 0.07 1.51 15.86 * 74.81P (dark blue) 13.07 12.17 0.11 1.25 65.96 0.05 0.12 0.12 14.89 95.56
Ti Mn Fe Co Ni Cu Zn As Sr ppm ppm ppm pm ppm pm pm pm ppm A (uncol.) 1333 1472 5161 76 97 2990 467 B (uncol.) 1416 1643 5692 88 137 2442 415 C (uncol.) 1345 1846 6337 60 148 2267 486 D (uncol.) 1303 1748 6056 71 100 1521 497 E (dark blue) 195 277 1595 2565 494 13 16 2765 F (mauve) 1253 9604 2496 112 132 639 G (uncol.) 1244 1855 6270 73 105 2378 437 H (dark blue) 298 1075 2300 570 538 55 50 2682 I (black) 953 4599 3403 72 244 806 J (blue) 329 1085 2351 591 483 40 26 3034 K (red) 908 3334 3501 218 271 658 L (yellow) 903 2092 3756 391 70 M (yellow) 733 3793 3569 986 206 575 N (yellow) 1084 1380 5112 156 98 2164 462 O (yellow) 708 2674 3559 1395 210 554 P (dark blue) 258 222 1136 2152 433 15 12 2397
Table 1: Measured concentrations on impacts A to P. This classification can be compared with the one due to D. Foy and M.D. Nenna [Foy and Nenna 2000] who use the same criterion to define antic and medieval glass categories. As the PIXE-PIGE technique is able to give the very superficial Na2O (sodium oxide) concentration (PIXE) and the bulk one (PIGE), the corrosion status can be estimated by the following ratio:
Rxg = (CPIGE - CPIXE)/ CPIGE Where: CPIGE and CPIXE are the Na2O concentrations measured by PIGE and PIXE. The difference between CPIGE and CPIXE is essentially due to the difference of the absorption coefficient between γ-rays and X-rays. The Na X-ray energy is so weak
155
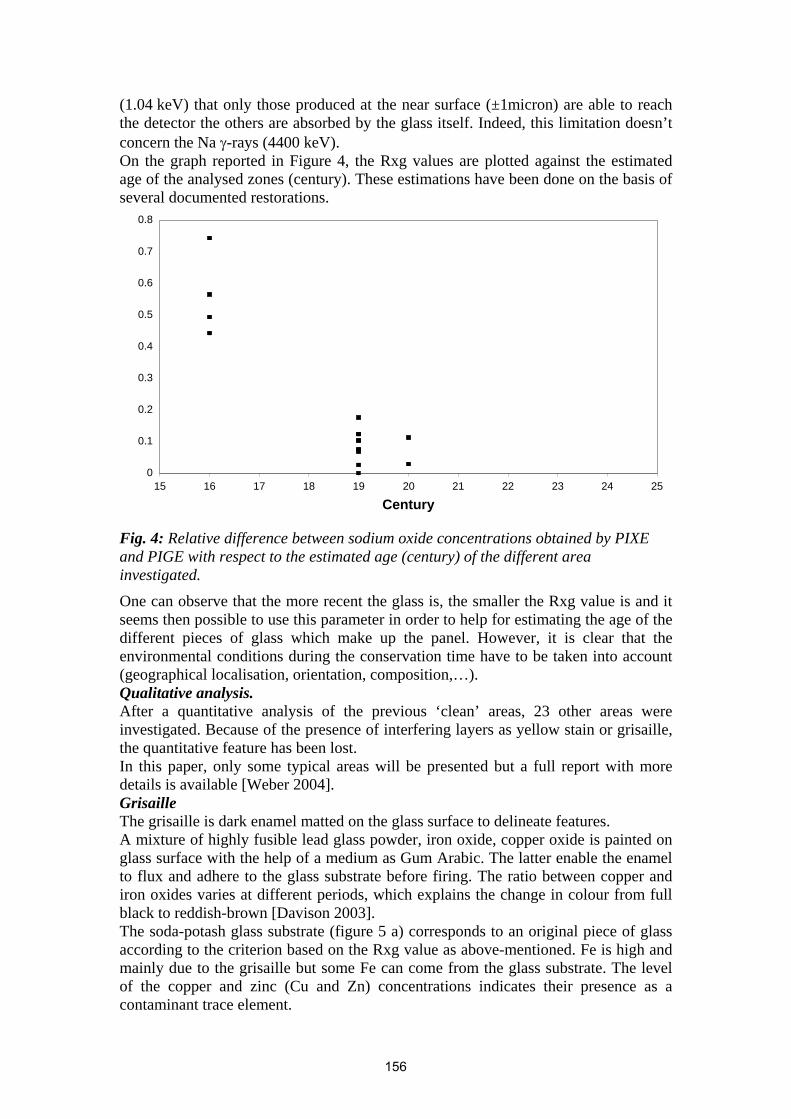
(1.04 keV) that only those produced at the near surface (±1micron) are able to reach the detector the others are absorbed by the glass itself. Indeed, this limitation doesn’t concern the Na γ-rays (4400 keV). On the graph reported in Figure 4, the Rxg values are plotted against the estimated age of the analysed zones (century). These estimations have been done on the basis of several documented restorations.
0
0.1
0.2
0.3
0.4
0.5
0.6
0.7
0.8
15 16 17 18 19 20 21 22 23 24 25
Century
Fig. 4: Relative difference between sodium oxide concentrations obtained by PIXE and PIGE with respect to the estimated age (century) of the different area investigated. One can observe that the more recent the glass is, the smaller the Rxg value is and it seems then possible to use this parameter in order to help for estimating the age of the different pieces of glass which make up the panel. However, it is clear that the environmental conditions during the conservation time have to be taken into account (geographical localisation, orientation, composition,…). Qualitative analysis. After a quantitative analysis of the previous ‘clean’ areas, 23 other areas were investigated. Because of the presence of interfering layers as yellow stain or grisaille, the quantitative feature has been lost. In this paper, only some typical areas will be presented but a full report with more details is available [Weber 2004]. Grisaille The grisaille is dark enamel matted on the glass surface to delineate features. A mixture of highly fusible lead glass powder, iron oxide, copper oxide is painted on glass surface with the help of a medium as Gum Arabic. The latter enable the enamel to flux and adhere to the glass substrate before firing. The ratio between copper and iron oxides varies at different periods, which explains the change in colour from full black to reddish-brown [Davison 2003]. The soda-potash glass substrate (figure 5 a) corresponds to an original piece of glass according to the criterion based on the Rxg value as above-mentioned. Fe is high and mainly due to the grisaille but some Fe can come from the glass substrate. The level of the copper and zinc (Cu and Zn) concentrations indicates their presence as a contaminant trace element.
156
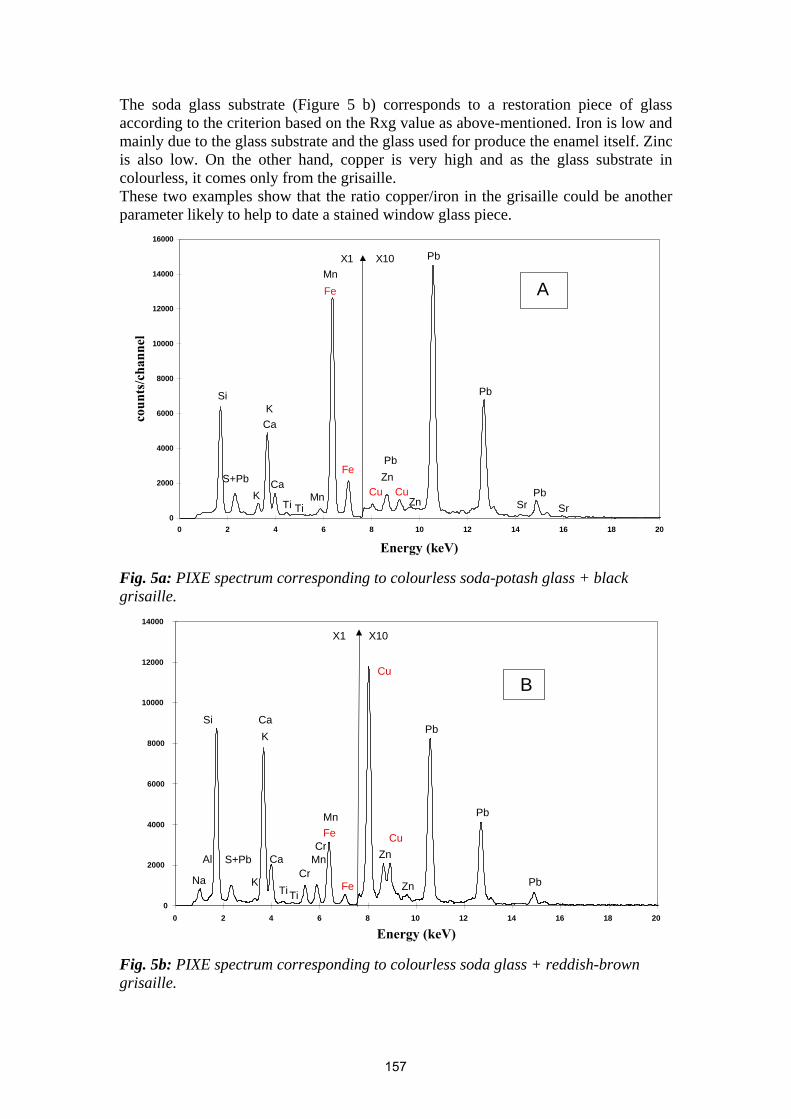
The soda glass substrate (Figure 5 b) corresponds to a restoration piece of glass according to the criterion based on the Rxg value as above-mentioned. Iron is low and mainly due to the glass substrate and the glass used for produce the enamel itself. Zinc is also low. On the other hand, copper is very high and as the glass substrate in colourless, it comes only from the grisaille. These two examples show that the ratio copper/iron in the grisaille could be another parameter likely to help to date a stained window glass piece.
0
2000
4000
6000
8000
10000
12000
14000
16000
0 2 4 6 8 10 12 14 16 18 20
Energy (keV)
coun
ts/c
hann
el
X1 X10
A
Si
K
KCa
Ca
Ti TiMn
MnFe
Fe
Cu CuZn
Zn
Pb
Pb
Pb
PbSr Sr
S+Pb
Fig. 5a: PIXE spectrum corresponding to colourless soda-potash glass + black grisaille.
0
2000
4000
6000
8000
10000
12000
14000
0 2 4 6 8 10 12 14 16 18 20
Energy (keV)
X1 X10
B
Na
Al
Si
S+Pb
K
K
Ca
Ca
TiTi
Cr
CrMn
MnFe
Fe
Cu
Cu
Zn
Zn
Pb
Pb
Pb
Fig. 5b: PIXE spectrum corresponding to colourless soda glass + reddish-brown grisaille.
157
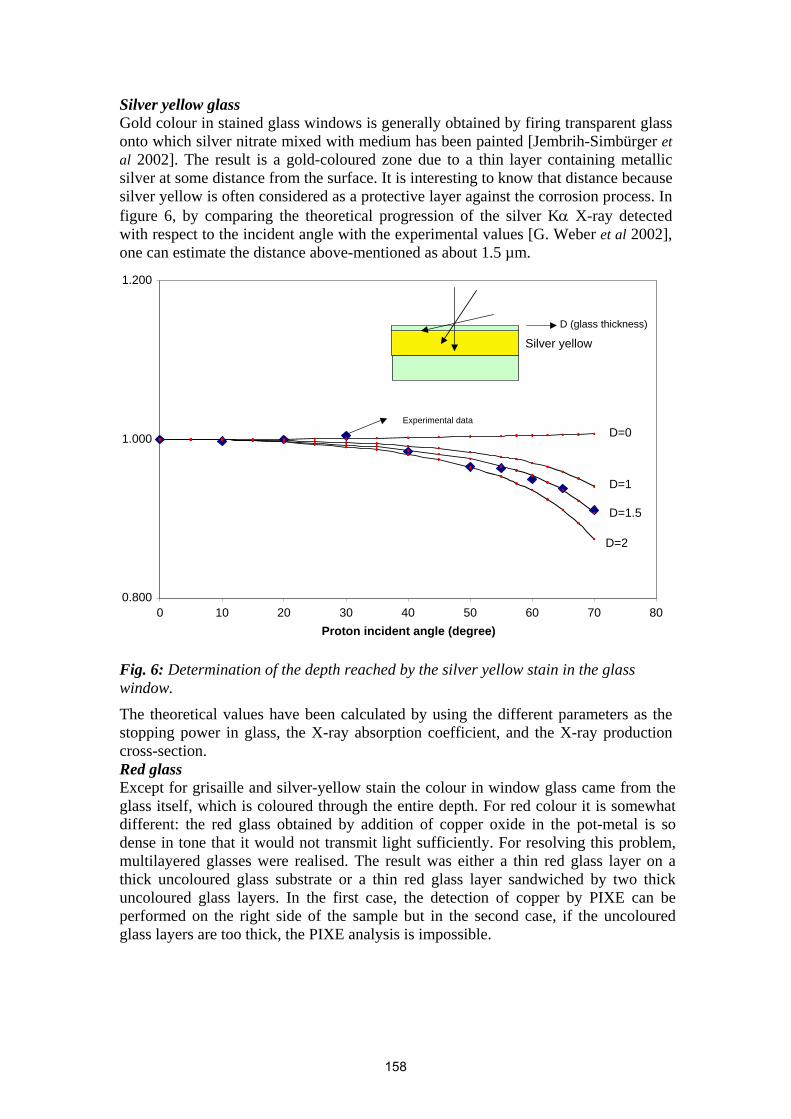
Silver yellow glass Gold colour in stained glass windows is generally obtained by firing transparent glass onto which silver nitrate mixed with medium has been painted [Jembrih-Simbürger et al 2002]. The result is a gold-coloured zone due to a thin layer containing metallic silver at some distance from the surface. It is interesting to know that distance because silver yellow is often considered as a protective layer against the corrosion process. In figure 6, by comparing the theoretical progression of the silver Kα X-ray detected with respect to the incident angle with the experimental values [G. Weber et al 2002], one can estimate the distance above-mentioned as about 1.5 µm.
0.800
1.000
1.200
0 10 20 30 40 50 60 70 80Proton incident angle (degree)
Silver yellowD (glass thickness)
D=0
D=1
D=1.5
D=2
Experimental data
Fig. 6: Determination of the depth reached by the silver yellow stain in the glass window.
The theoretical values have been calculated by using the different parameters as the stopping power in glass, the X-ray absorption coefficient, and the X-ray production cross-section. Red glass Except for grisaille and silver-yellow stain the colour in window glass came from the glass itself, which is coloured through the entire depth. For red colour it is somewhat different: the red glass obtained by addition of copper oxide in the pot-metal is so dense in tone that it would not transmit light sufficiently. For resolving this problem, multilayered glasses were realised. The result was either a thin red glass layer on a thick uncoloured glass substrate or a thin red glass layer sandwiched by two thick uncoloured glass layers. In the first case, the detection of copper by PIXE can be performed on the right side of the sample but in the second case, if the uncoloured glass layers are too thick, the PIXE analysis is impossible.
158
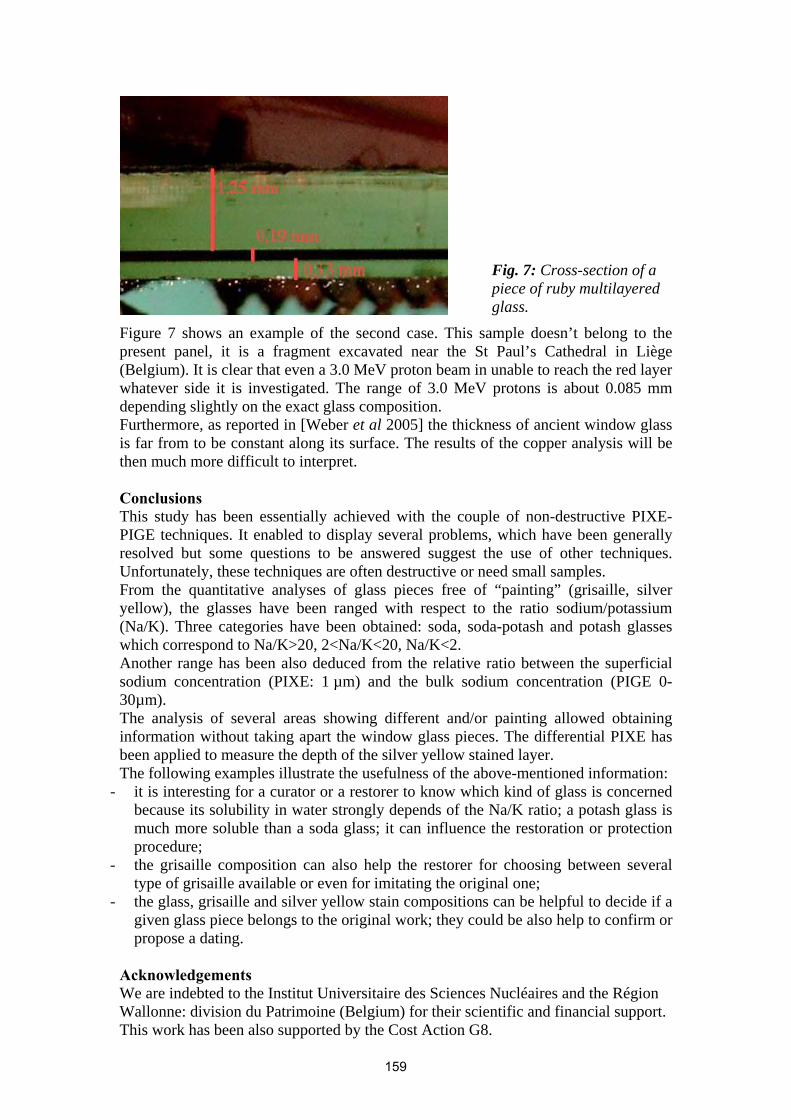
Fig. 7: Cross-section of a piece of ruby multilayered glass.
Figure 7 shows an example of the second case. This sample doesn’t belong to the present panel, it is a fragment excavated near the St Paul’s Cathedral in Liège (Belgium). It is clear that even a 3.0 MeV proton beam in unable to reach the red layer whatever side it is investigated. The range of 3.0 MeV protons is about 0.085 mm depending slightly on the exact glass composition. Furthermore, as reported in [Weber et al 2005] the thickness of ancient window glass is far from to be constant along its surface. The results of the copper analysis will be then much more difficult to interpret. Conclusions This study has been essentially achieved with the couple of non-destructive PIXE-PIGE techniques. It enabled to display several problems, which have been generally resolved but some questions to be answered suggest the use of other techniques. Unfortunately, these techniques are often destructive or need small samples. From the quantitative analyses of glass pieces free of “painting” (grisaille, silver yellow), the glasses have been ranged with respect to the ratio sodium/potassium (Na/K). Three categories have been obtained: soda, soda-potash and potash glasses which correspond to Na/K>20, 2<Na/K<20, Na/K<2. Another range has been also deduced from the relative ratio between the superficial sodium concentration (PIXE: 1 µm) and the bulk sodium concentration (PIGE 0-30µm). The analysis of several areas showing different and/or painting allowed obtaining information without taking apart the window glass pieces. The differential PIXE has been applied to measure the depth of the silver yellow stained layer. The following examples illustrate the usefulness of the above-mentioned information:
- it is interesting for a curator or a restorer to know which kind of glass is concerned because its solubility in water strongly depends of the Na/K ratio; a potash glass is much more soluble than a soda glass; it can influence the restoration or protection procedure;
- the grisaille composition can also help the restorer for choosing between several type of grisaille available or even for imitating the original one;
- the glass, grisaille and silver yellow stain compositions can be helpful to decide if a given glass piece belongs to the original work; they could be also help to confirm or propose a dating.
Acknowledgements We are indebted to the Institut Universitaire des Sciences Nucléaires and the Région Wallonne: division du Patrimoine (Belgium) for their scientific and financial support. This work has been also supported by the Cost Action G8.
159
References • Borbely-Kiss I., Fueloep Z., Kiss A.Z., Koltay. E., and Szabo. G., 1994.
Nuclear Instruments and Methods B785: 836-839. • Baxter M.J., Cool, H.E.M., Heyworth M. and Jackson C., 1995. Archaeometry
37: 129-142. • Schreiner M., 1987. Proceedings of the Institute of Archaeometry Jubilee
Conservation Conference 73-78. • Weber, G., Delbrouck, J.M., Strivay, D., Kerff, F., Martinot L., 1998. Nuclear
Instruments and Methods B139: 196-201. • Foy D., Nenna D.D., 200. Tout feu tout sable, Musée de Marseille, Editions
Edisud: 23. • Weber G., 2004. Etude par PIXE d’un panneau de vitrail de la Chapelle
Castrale d’Enghien, Fenêtre IV Panneau 2A, Rapport final, Région Walonne (Belgium) – Division Patrimoine: 1-28.
• Davison S., 2003. Conservation and restauration of glass, Butterworth-Heinemann, ISBN 07 506 43412 :123-135.
• Jembrih-Simbürger D., Neelmeijer C., Schalm O., Fredrickx P., Schreiner M., De Vis K., Mäder M., Schreyvers D. and Caen J., 2002. Journal of Analytical Atomic Spectrometry, 17: 321-328.
• Weber G., Strivay D., Martinot L. and Garnir H.P., 2002. Nuclear Instruments and Methods, B189: 350-357.
• Weber G., Vanden Bemden Y., Pirotte M., and Gilbert B., 2005. Nuclear Instruments and Methods, B240: 512-519.
160
Production of Glass in the Venetian Manner
Žiga Šmit1,2, Koen Janssens3, Mateja Kos4 1 Faculty of Mathematics and Physics, University of Ljubljana, Jadranska 19, SI-1000 Ljubljana,
Slovenia 2J. Stefan Institute, Jamova 39, SI-1001 Ljubljana, Slovenia
3Department of Chemistry, University of Antwerp, Universiteitsplein 1, Antwerp B-2610, Belgium 4National Museum of Slovenia, Prešernova 20, SI-1000 Ljubljana, Slovenia
(corresponding author: [email protected], [email protected]) Abstract Glasses produced in the Venetian manner (à la façon de Venise) were studied by the ion-beam analytical methods (PIXE, PIGE), by X-ray fluorescence analysis induced by electrons (EPMA) or synchrotron radiation (SR XRF), and by LA ICP MS for trace elements. The investigation aimed to determine the type of glass and to distinguish between the original Venetian and the local production in two glass working centers, Antwerp and Ljubljana, outside Venice.
Keywords: façon de Venise glass, PIXE, PIGE, EDX, SR XRF, LA ICP MS.
Introduction During the Middle Ages, Venice developed into the leading manufacturer of glass [Verità 1985]. Origins of glass production may be traced back to the 10th or even 9th century, yet the Venetian supremacy in the trade with the east grew after the sack of Constantinople by Crusader knights in 1204. The delicate products of Venetian glass were in high demand, so the Venetian republic restricted dissemination of the manufacturing skills. From 1291, the glass working industry was located at the island of Murano, as founding of new glassworks on the main islands was forbidden because of the fire hazard. However, despite the death penalty, economic reasons drove the glassworkers abroad, so the art of making glass in the Venetian manner, also known as à la façon de Venise, slowly spread through the whole of Europe. New glassworks were established in different European towns, producing Venetian-like glass for the rapidly developing middle classes in the cities. Studies of local production are important from a number of points of view, e.g. technology – how well the Venetian recipes were followed, art history – which types of objects were made locally, and economic history of the region – as intensive glass production caused social changes. Outside the Venetian republic, the nearest glassworks developed in Ljubljana, located about 100 km from the sea coast. The first glassworks in Ljubljana was established before 1526, and two glassworks were operative in the middle of the century [Kos 1994]. Glass production is well documented in historical records: the last will of the glasswork lease-holder Christoff Prunner from 1563 contains a comprehensive list of glass products. Several documents report on the import of alkalis, required as raw materials for glass production. The importers frequently came into conflict with authorised dealers; on one occasion, a whole ship’s cargo was confiscated. Glassmaking in Ljubljana ended around 1713. Glassmaking à la façon de Venise spread as far as the Low Countries and London. An important glassmaking center was Antwerp, where production started around 1532 [De Raedt 2001]. The glass working activity was monopolised in the hands of Italian glassworkers: Jacomo Pasquetti between 1558 and 1578, and Phillipo Gridolphi between 1598 and 1623. The flourishing period of Gridolphi expired with his death. The glass objects produced outside Venice exhibit a high-quality workmanship and are usually indiscernible from Venetian originals. Small differences in the composition of various glasses can only be traced by chemical analysis.
161
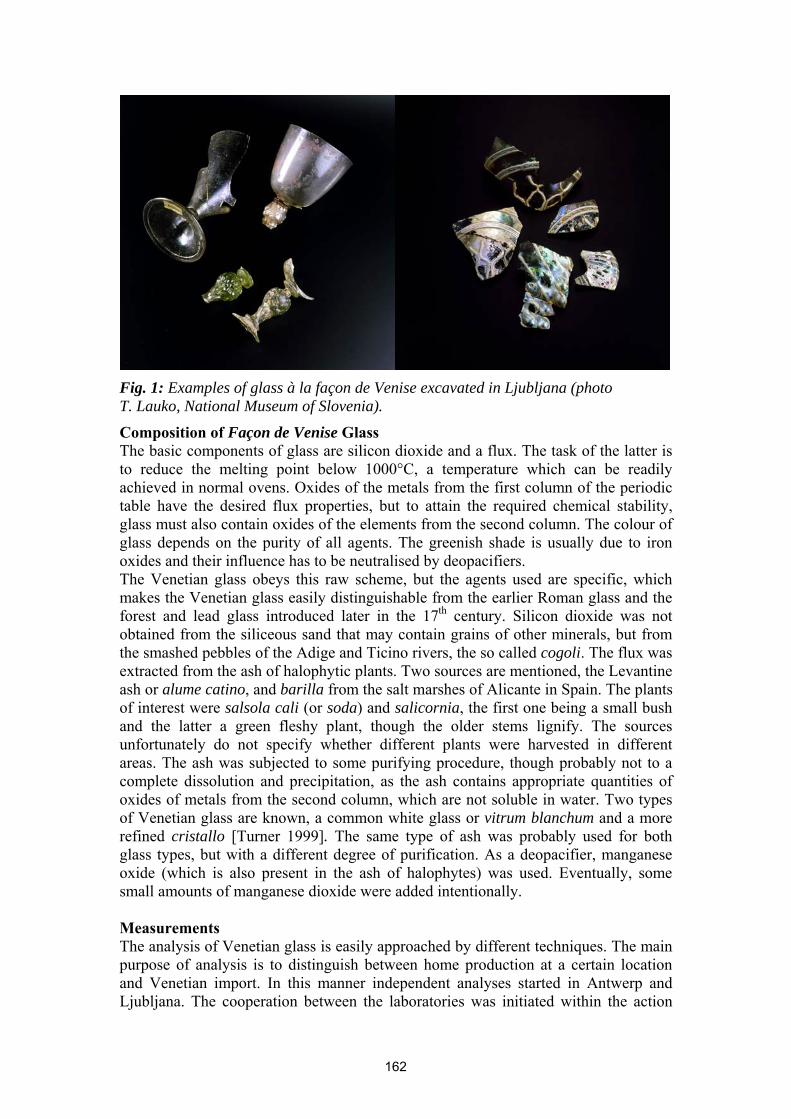
Fig. 1: Examples of glass à la façon de Venise excavated in Ljubljana (photo T. Lauko, National Museum of Slovenia).
Composition of Façon de Venise Glass The basic components of glass are silicon dioxide and a flux. The task of the latter is to reduce the melting point below 1000°C, a temperature which can be readily achieved in normal ovens. Oxides of the metals from the first column of the periodic table have the desired flux properties, but to attain the required chemical stability, glass must also contain oxides of the elements from the second column. The colour of glass depends on the purity of all agents. The greenish shade is usually due to iron oxides and their influence has to be neutralised by deopacifiers. The Venetian glass obeys this raw scheme, but the agents used are specific, which makes the Venetian glass easily distinguishable from the earlier Roman glass and the forest and lead glass introduced later in the 17th century. Silicon dioxide was not obtained from the siliceous sand that may contain grains of other minerals, but from the smashed pebbles of the Adige and Ticino rivers, the so called cogoli. The flux was extracted from the ash of halophytic plants. Two sources are mentioned, the Levantine ash or alume catino, and barilla from the salt marshes of Alicante in Spain. The plants of interest were salsola cali (or soda) and salicornia, the first one being a small bush and the latter a green fleshy plant, though the older stems lignify. The sources unfortunately do not specify whether different plants were harvested in different areas. The ash was subjected to some purifying procedure, though probably not to a complete dissolution and precipitation, as the ash contains appropriate quantities of oxides of metals from the second column, which are not soluble in water. Two types of Venetian glass are known, a common white glass or vitrum blanchum and a more refined cristallo [Turner 1999]. The same type of ash was probably used for both glass types, but with a different degree of purification. As a deopacifier, manganese oxide (which is also present in the ash of halophytes) was used. Eventually, some small amounts of manganese dioxide were added intentionally. Measurements The analysis of Venetian glass is easily approached by different techniques. The main purpose of analysis is to distinguish between home production at a certain location and Venetian import. In this manner independent analyses started in Antwerp and Ljubljana. The cooperation between the laboratories was initiated within the action
162
COST-G8 and was also supported by a NATO project. The joint work enabled studies on a large set of data, which lead to several general conclusions. Analytical techniques The analysis is intended to characterise the main type of glass, or attempts to detect the trace elements which could be used as a fingerprint for particular raw materials. The main components are conveniently detected by X-ray analytical techniques. In Antwerp, this was the X-ray emission analysis induced by electrons in the electron microscope – electron probe microanalysis (EPMA) or energy dispersive X-ray analysis (EDX) [De Raedt et al 1999, 2001]. In Ljubljana, the analysis was performed by proton-induced X-ray emission analysis (PIXE), using a proton beam in air [Šmit et al 2000]. Though both methods exploit the same physical principle, there are many practical differences between them. As the electrons in the energy range of a few 10 keV penetrate only about 1 µm into the solid target and the analysis is performed in vacuum, sampling of the investigated glass objects is required. Pieces of glass several mm in diameter were cut from the artefacts, embedded in a resin and polished up to mirror quality. Protons, on the other hand, travelling through the air can hit any spot on the object, positioned as a whole in the measuring location. Sampling of the artefacts can thus be avoided, which is quite important for museum curators. Protons with energy of a few MeV penetrate several 10 µm into the target, so they can easily penetrate a thin layer of glass degraded by corrosion. A further difference between the two methods is the range of elements they can detect. As the analysis by electrons is done in vacuum, an X-ray detector with an ultra thin window can easily measure light elements between sodium and silicon and can reach up to oxygen and carbon. For PIXE in the air, silicon is the lightest element that can be efficiently measured. The range of light elements can be extended by using a helium atmosphere in the interacting region. As the light elements sodium, magnesium, and aluminium are extremely important for the characterisation of glass, we determined them by another nuclear method, proton-induced gamma emission – PIGE [Šmit et al 2002]. In thick targets, energetic protons gradually loose their energy, passing several energies of resonant nuclear reactions. The resulting gamma rays are related to the elemental concentrations. The advantage of gamma rays is negligible absorption due to their high energy. Furthermore, protons with energies above 3 MeV reach deeper layers of material below the corrosion layer. For heavier elements, the efficiency of EPMA reduces due to electron bremsstrahlung and lower ionisation cross sections by electrons. The PIXE method is much more fitting in this region, as the bremsstrahlung of the heavier protons is low and the ionisation cross sections are larger than 1 barn up to the elements around tin. PIXE can then also be used for the determination of trace elements around zirconium with a sensitivity of about 10 µg/g. A sensitivity of about 1 µg/g can be attained by careful selection of absorbers. Such values are inaccessible by EPMA, so the measurements in Antwerp were combined with the synchrotron-induced XRF which exhibits a similar sensitivity (about 1 µg/g) for heavy elements [De Raedt et al 2001]. For trace element fingerprinting, rare-earth elements with concentrations well below 1 µg/g are of particular interest. Such values are inaccessible by X-ray methods, but are easily approached by laser-ablation inductively-coupled-plasma mass-spectroscopy (LA ICP MS). The method is semi-destructive, since the micro craters of about 30 µm diameter are hardly visible, but for practical reasons, larger objects are generally sampled.
163
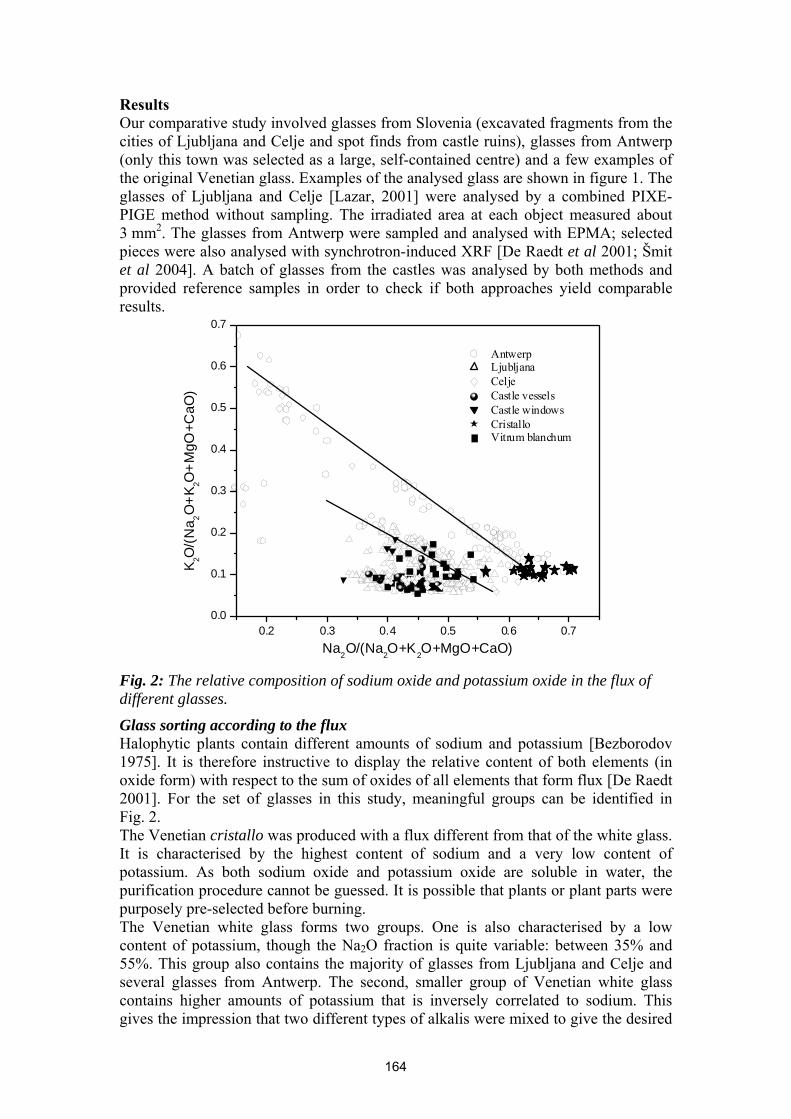
Results Our comparative study involved glasses from Slovenia (excavated fragments from the cities of Ljubljana and Celje and spot finds from castle ruins), glasses from Antwerp (only this town was selected as a large, self-contained centre) and a few examples of the original Venetian glass. Examples of the analysed glass are shown in figure 1. The glasses of Ljubljana and Celje [Lazar, 2001] were analysed by a combined PIXE-PIGE method without sampling. The irradiated area at each object measured about 3 mm2. The glasses from Antwerp were sampled and analysed with EPMA; selected pieces were also analysed with synchrotron-induced XRF [De Raedt et al 2001; Šmit et al 2004]. A batch of glasses from the castles was analysed by both methods and provided reference samples in order to check if both approaches yield comparable results.
0.2 0.3 0.4 0.5 0.6 0.70.0
0.1
0.2
0.3
0.4
0.5
0.6
0.7
Antwerp Ljubljana Celje Castle vessels Castle windows Cristallo Vitrum blanchum
K 2O/(N
a 2O+K
2O+M
gO+C
aO)
Na2O/(Na2O+K2O+MgO+CaO) Fig. 2: The relative composition of sodium oxide and potassium oxide in the flux of different glasses.
Glass sorting according to the flux Halophytic plants contain different amounts of sodium and potassium [Bezborodov 1975]. It is therefore instructive to display the relative content of both elements (in oxide form) with respect to the sum of oxides of all elements that form flux [De Raedt 2001]. For the set of glasses in this study, meaningful groups can be identified in Fig. 2. The Venetian cristallo was produced with a flux different from that of the white glass. It is characterised by the highest content of sodium and a very low content of potassium. As both sodium oxide and potassium oxide are soluble in water, the purification procedure cannot be guessed. It is possible that plants or plant parts were purposely pre-selected before burning. The Venetian white glass forms two groups. One is also characterised by a low content of potassium, though the Na2O fraction is quite variable: between 35% and 55%. This group also contains the majority of glasses from Ljubljana and Celje and several glasses from Antwerp. The second, smaller group of Venetian white glass contains higher amounts of potassium that is inversely correlated to sodium. This gives the impression that two different types of alkalis were mixed to give the desired
164
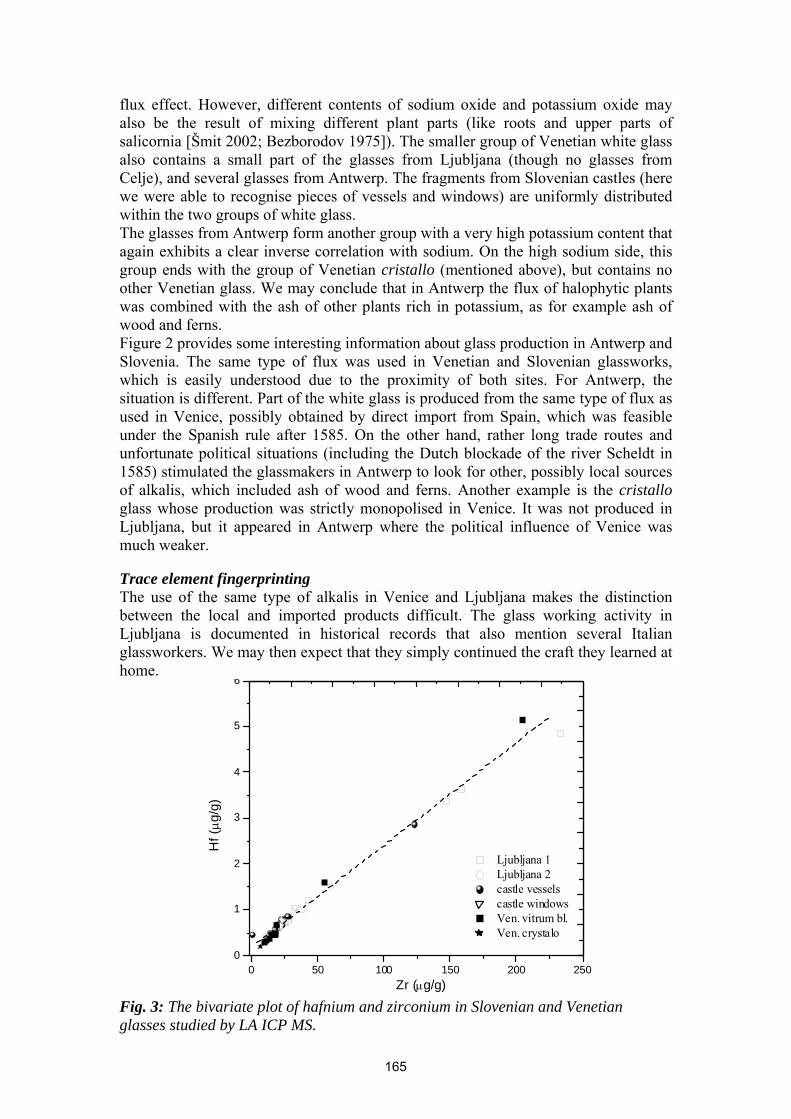
flux effect. However, different contents of sodium oxide and potassium oxide may also be the result of mixing different plant parts (like roots and upper parts of salicornia [Šmit 2002; Bezborodov 1975]). The smaller group of Venetian white glass also contains a small part of the glasses from Ljubljana (though no glasses from Celje), and several glasses from Antwerp. The fragments from Slovenian castles (here we were able to recognise pieces of vessels and windows) are uniformly distributed within the two groups of white glass. The glasses from Antwerp form another group with a very high potassium content that again exhibits a clear inverse correlation with sodium. On the high sodium side, this group ends with the group of Venetian cristallo (mentioned above), but contains no other Venetian glass. We may conclude that in Antwerp the flux of halophytic plants was combined with the ash of other plants rich in potassium, as for example ash of wood and ferns. Figure 2 provides some interesting information about glass production in Antwerp and Slovenia. The same type of flux was used in Venetian and Slovenian glassworks, which is easily understood due to the proximity of both sites. For Antwerp, the situation is different. Part of the white glass is produced from the same type of flux as used in Venice, possibly obtained by direct import from Spain, which was feasible under the Spanish rule after 1585. On the other hand, rather long trade routes and unfortunate political situations (including the Dutch blockade of the river Scheldt in 1585) stimulated the glassmakers in Antwerp to look for other, possibly local sources of alkalis, which included ash of wood and ferns. Another example is the cristallo glass whose production was strictly monopolised in Venice. It was not produced in Ljubljana, but it appeared in Antwerp where the political influence of Venice was much weaker. Trace element fingerprinting The use of the same type of alkalis in Venice and Ljubljana makes the distinction between the local and imported products difficult. The glass working activity in Ljubljana is documented in historical records that also mention several Italian glassworkers. We may then expect that they simply continued the craft they learned at home.
0 50 100 150 200 2500
1
2
3
4
5
6
Ljubljana 1 Ljubljana 2 castle vessels castle windows Ven. vitrum bl. Ven. crystalo
Hf (µg
/g)
Zr (µg/g) Fig. 3: The bivariate plot of hafnium and zirconium in Slovenian and Venetian glasses studied by LA ICP MS.
165
We next looked for fingerprints in the chemical composition that would confirm the local production. Though the alkalis were imported, the silica, at least, was exploited from domestic sources. The elements that may accompany natural silicon dioxide are elements from the fourth column of the periodic table (titanium, zirconium, and hafnium) and rare earths. Titanium is also found in ash, so the elements remaining for characterisation are zirconium and hafnium. Crystals of zircon (Zr2O3) are unevenly distributed within siliceous materials, so a large amount of collected material had to be melted and homogenised in order to make a representative sample. Such a procedure is indeed usual when preparing a large batch of raw glass. Zirconium can be measured by SR XRF or PIXE, and the results show that the Venetian glass typically contains about 20 µg/g zirconium, though samples with a larger zirconium concentration (up to 300 µg/g) can also be found. As the inclusion of zirconium is not homogeneous, zirconium/hafnium correlations may indicate the source of silica [De Raedt et al 2001, Janssens et al 2002]. As the concentration of hafnium was expected below 1 µg/g, LA ICP MS was applied as the analytical method for its investigation [De Raedt et al 2001, Šmit et al 2005]. Promising differences were observed between the Venetian glass and the glasses from Liguria [Janssens et al 2002], but the glasses from Slovenia show the same hafnium/zirconium ratio as the glasses of Venice (Fig. 3). This may be due to a similar origin of siliceous materials, as sediments of Alpine rives were used in both areas. Further differences between glasses were sought in the so called europium anomaly; this is the ratio between the actual concentration of europium and the value calculated as a geometric mean of concentrations of the europium neighbors, samarium and gadolinium. Meaningful differences were observed between the Venetian cristallo and the cristallo produced in Antwerp [De Raedt et al 2001], while the differences between the glasses of Slovenia and Venice were insignificant (Fig. 4). Rare earth elements have different chemical properties and their ratio given as a function of the total concentration, may also be indicative for the origin of minerals. The accuracy of our measurements allowed calculation of the ratios of the more abundant elements only. Figure 5 gives the ratio of neodymium and dysprosium as a function of the zirconium concentration for Venetian and Slovenian glass. We can see the formation of several groups. Particularly interesting is a small group containing examples of Venetian white glass, but no original Venetian glasses (Fig. 5). This indicates that siliceous materials of different origins were used for the production of glass à la façon de Venise, among them possibly some of local origin. Conclusions Nondestructive analytical techniques proved quite efficient for the characterisation of glass produced in the Venetian manner. The measurements identified the type of flux and discovered two characteristic groups of Venetian white glass. The identification of siliceous materials by the rare earth elements appears promising, but requires further systematic measurements of these elements below a ppm level.
166
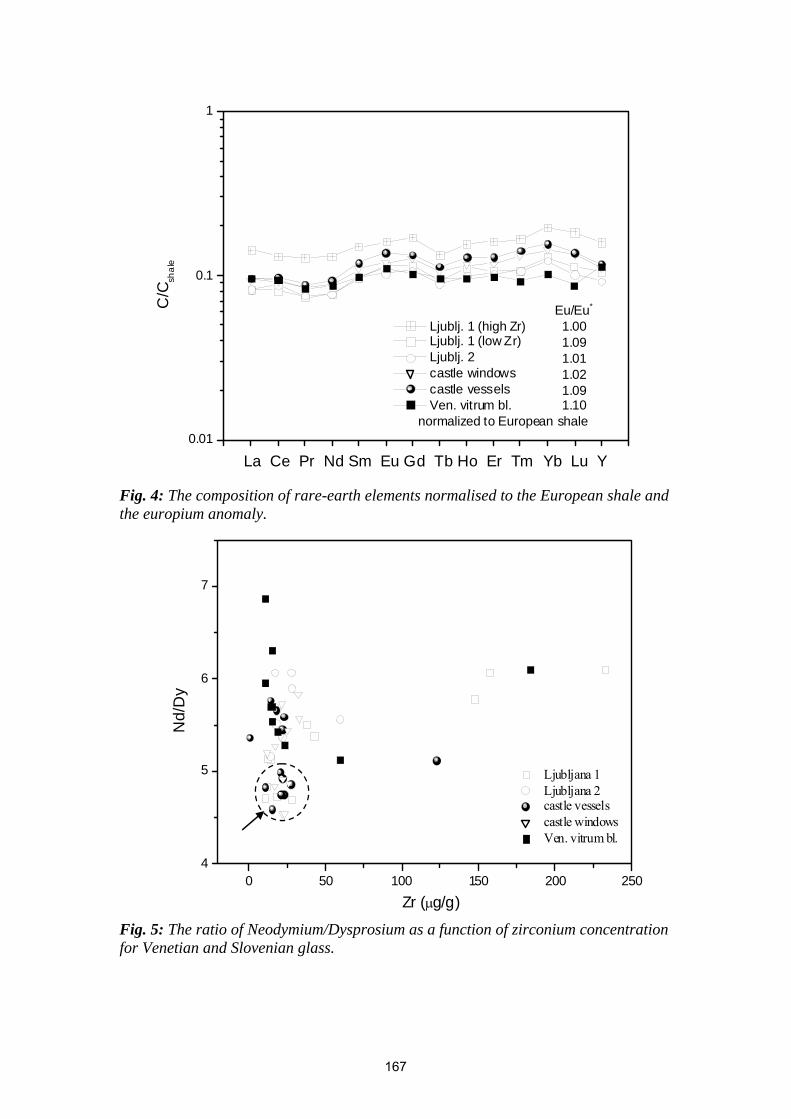
0.01
0.1
1
normalized to European shale
Eu/Eu*
1.00 1.09 1.01 1.02 1.09 1.10
Ljublj. 1 (high Zr) Ljublj. 1 (low Zr) Ljublj. 2 castle windows castle vessels Ven. vitrum bl.
La Ce Pr Nd Sm Eu Gd Tb Ho Er Tm Yb Lu Y
C/C
shal
e
Fig. 4: The composition of rare-earth elements normalised to the European shale and the europium anomaly.
0 50 100 150 200 2504
5
6
7
Ljubljana 1 Ljubljana 2 castle vessels castle windows Ven. vitrum bl.
Nd/
Dy
Zr (µg/g) Fig. 5: The ratio of Neodymium/Dysprosium as a function of zirconium concentration for Venetian and Slovenian glass.
167
References • Bezborodov, M.A. 1975. Chemie und Technologie der antiken und
mittelalterlichen Gläser. Mainz: Philipp von Zabern. • De Raedt, I., Janssens, K., Vekemans, B. 1999. ‘Compositional distinctions
between 16th century ‘Façon-de-Venise’ and Venetian glass vessels, excavated in Antwerp, Belgium. Journal of Analytical Atomic Spectrometry 14:493-498.
• De Raedt, I., Janssens, K., Veeckman, J., Vincze, L., Vekemans, B., Jeffries, T.E. 2001. ‘Trace analysis for distinguishing between Venetian and façon-de-Venise glass vessels of the 16th and 17th century’. Journal of Analytical Atomic Spectrometry 16:1012-1017.
• De Raedt, I. 2001. ‘Compositions of 16-17th Century Façon-de-Venise Glass Excavated in Antwerp and Neighbouring Cities’. Ph.D. dissertation. Department of Chemistry, University of Antwerp.
• Janssens, K., Jeffries, T.E., 2002, unpublished. • Lazar, I. 2001. ‘Medieval glass from Celje’. In Archaeologia historica
Slovenica, Guštin, M. (ed.). Ljubljana: Faculty of Arts. • Kos, M., Žvanut, M. 1994. Glass Factories in Ljubljana in the 16th Century
and their Products, Ljubljana: National Museum. • Šmit, Ž., Pelicon, P., Vidmar, G., Zorko, B., Budnar, M., Demortier, G.,
Gratuze, G., Šturm, S., Nečemer, M., Kump, P., Kos, M. 2000. 'Analysis of medieval glass by X-ray spectrometric methods'. Nucl. Instr. Meth. Phys. Res., B 161-163:718-723.
• Šmit, Ž., Pelicon, P., Holc, M., Kos, M. 2002. ‘PIXE-PIGE characterization of medieval glass’. Nuclear Instruments and Methods in Physics Research B 189: 344-349.
• Šmit, Ž., Janssens, K., Schalm, O., Kos, M. 2004. ‘Spread of façon-de-Venise glassmaking through central and western Europe’. Nuclear Instruments and Methods in Physics Research B 213: 717-722.
• Šmit, Ž., Janssens, K., Bulska, E., Wagner, B., Kos, M., Lazar, I. 2005. 'Trace element fingerprinting of façon-de-Venise glass’, Nuclear Instruments and Methods in Physics Research B 239: 94-99.
• Turner, G. 1999. ‘Allume Catina and the Aestetics of Venetian Cristallo’, J. Design History, 12:111-122.
• Verità, M. 1985. ‘L’Invenzione del Cristallo Muranese: una Verifica Analitica delle Fonti Storiche’. Rivista della Stazione Sperimentale del Vetro, 1:17-29.
168

Paper

Micro-destructive method for pH determination of paper documents and books
Jozef Hanus1, Jarmila Mináriková1, Zuzana Szabóová1, Emília Hanusová2, Karijn Lamens3
1Slovak National Archives Bratislava, Drotárska 42, 817 01 Bratislava, Slovak Republic 2University Library, Michalská 1, 814 17 Bratislava, Slovak Republic
3Royal Institute for Cultural Heritage, Jubelpark 1, B-1000 Brussels, Belgium (corresponding author: [email protected])
Abstract Paper is the principal information carrier for documents and books kept in archives and libraries. Of all paper properties, acidity/alkalinity is the crucial one for stability of its most important structural element, the cellulose. It is well known that in an acidic environment, the dominant degradation mechanism of cellulose is acid hydrolysis, and in an alkaline environment, two reaction pathways, oxidation and alkaline degradation are predominant. Using hollow needles, "micro"-sampling has become a popular method of obtaining small samples of paper in conservation science for pH determination. The main objectives of the Short-Term Scientific Missions within the framework COST G8 were: to become acquainted with the equipment and the methodology of this work, to compare it with “classical” pH measurement and to disseminate the gained knowledge in the field of preservation of paper cultural heritage in the Slovak Republic.
Keywords: pH, paper, degradation, acidity, micro-destruction
Introduction Archives and libraries all over the world contain a rich and irreplaceable source of information. They also represent a unique part of the cultural heritage of human society. The preservation and management of these precious resources and making them accessible for public are the main responsibilities and tasks of all these institutions. Of all writing and drawing materials that people have employed down the ages, paper is the most widely used around the world, and has become one of the most important bearers of our history and culture. Once it has been used as the carrier of ideas, administrative acts, treaties, books, documents, artistic creations, etc. it becomes part of cultural and information values also. From a chemical-physical point of view, paper is a felted sheet of fibres formed by introducing a water suspension of the fibres on a screen, leaving a wet sheet of paper which is removed and dried. Different additives are introduced before or after the sheets are formed in order to create the desired properties of the paper. Despite the fact that it is not defined uniquely by the composition of the fibres used in its fabrication, cellulose fibres are the chief material used in papermaking. The major part of paper production is based on wood pulp [Browning 1977]. Unfortunately, as with organic materials in general, paper is susceptible to several decay processes that may lead to irreversible losses in relatively short times [Havermans 1997, Bégin 1999, Bukovský 2000, Dupont 2000]. As paper is the principal information carrier, its degradation may cause the loss of a great part of mankind´s memory. The present state of knowledge confirms that paper degradation in the course of its ageing is the result of (acidic) hydrolysis and (alkaline) oxidation of cellulose by internal agents present in the paper in close coinfluence with contaminated atmospheres, humidity and light on the one hand, and cross-linking and fibre embrittlement on the other. Thermal, biological and mechanical destruction can occur as well. In most cases, however, a combination of all above mentioned effects causes degradation of the cellulose macromolecule, hemicellulose and lignin which
171
result in decrease of fibre strength, mechanical properties, creation of brittleness, fragility and colour changes (yellowing, darkening) of paper [Hanus 2004]. Of all paper properties, acidity/alkalinity is probably the crucial one for the stability of its most important structural element, the cellulose. It is well known that, in an acidic environment, the dominant degradation mechanism of cellulose is acid hydrolysis, and in an alkaline environment, two reaction pathways, oxidation and alkaline degradation are predominant - therefore an estimation of paper acidity/alkalinity is a pre-requisite. In addition, the decision for any chemical treatment with the aim of prolonging paper lifetime is based on such estimation [Strlič 2004]. Thus one of the most important factors that accelerate the decay of paper is acidity, usually expressed by the pH of an aqueous extract of the paper. Acidic papers yield extracts with a low pH, and hence with a high proton concentration. These papers can become brittle and, in some extreme cases, pulverise. At the molecular level this means that the long cellulose chains are broken down by hydrolysis in the presence of water bound to the paper [Saverwyns 2002]. By definition, the pH is measured in solutions, making the pH determination of paper, a solid material, a difficult task. In most cases this problem is dealt with by taking a certain amount of paper and adding water, so that a fixed ratio paper/water is obtained, followed by measuring the pH of the aqueous extract. To assure that the pH values found are reproducible, the procedure of taking the sample and measuring the pH is described in standards. Unfortunately for the conservation community, these standards stem from the paper industry, requiring the extraction of between one and two grams of paper. Although this leads to excellent results, these methods cannot be used on precious papers since they require too much sample to be taken. In order to make the procedure more accessible to the conservation community, a miniaturisation scheme was worked out. The goal of the research [Saverwyns 2002] was to compare existing methods for the pH determination of paper, and to develop a micro-destructive method (so-called microdrill technique) allowing conservators to use an extraction technique to provide accurate pH readings. The accuracy of the method excellent, and the additional advantage of high area specificity is obtained, while only about 40 µg of paper is necessary for a pH measurement. This is a reduction in the amount of paper by a factor of 50,000. A volume of water, with respect to the ratio paper/water mentioned in the ISO standard, is added and the pH of the extract measured using a micro pH-electrode. Using hollow needles, "micro"-sampling has become a popular method of obtaining small samples of paper in conservation science [Puchinger 2001, Wouters 2001]. The "Micro" method was also studied [Strlic 2004] in a comparative evaluation as one of seven procedures for determination of pH of paper, where 55 different paper and pulp samples were used. The correlation of results showed that most extraction methods give comparable data for acidic samples, with the exception of gelatine surface-sized samples. For samples with alkaline aqueous extracts, the effect of atmospheric CO2 and slow dissolution of earth-alkali metal carbonates should be taken into account, which is not the case with any of the standardised methods for determination of paper pH. Materials and methods The samples were prepared at the Slovak National archives and are as follows: original commercial acidic writing paper – 80 g /m2, pH cold extraction 4.4 (AP), AP deacidified by methoxi-methyl-magnesium carbonate (MMMK), AP deacidified by MMMK and strengthened by Thylose MH300, AP deacidified by magnesium
172
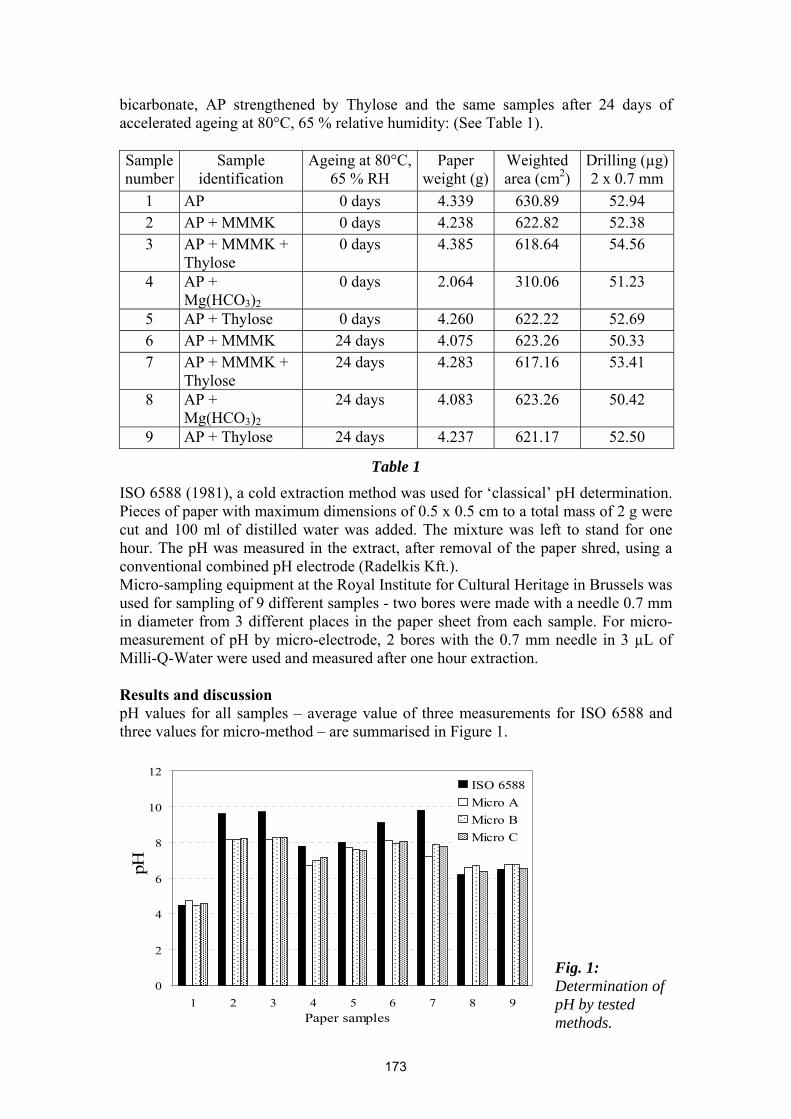
bicarbonate, AP strengthened by Thylose and the same samples after 24 days of accelerated ageing at 80°C, 65 % relative humidity: (See Table 1). Sample number
Sample identification
Ageing at 80°C, 65 % RH
Paper weight (g)
Weighted area (cm2)
Drilling (µg)2 x 0.7 mm
1 AP 0 days 4.339 630.89 52.94 2 AP + MMMK 0 days 4.238 622.82 52.38 3 AP + MMMK +
Thylose 0 days 4.385 618.64 54.56
4 AP + Mg(HCO3)2
0 days 2.064 310.06 51.23
5 AP + Thylose 0 days 4.260 622.22 52.69 6 AP + MMMK 24 days 4.075 623.26 50.33 7 AP + MMMK +
Thylose 24 days 4.283 617.16 53.41
8 AP + Mg(HCO3)2
24 days 4.083 623.26 50.42
9 AP + Thylose 24 days 4.237 621.17 52.50
Table 1 ISO 6588 (1981), a cold extraction method was used for ‘classical’ pH determination. Pieces of paper with maximum dimensions of 0.5 x 0.5 cm to a total mass of 2 g were cut and 100 ml of distilled water was added. The mixture was left to stand for one hour. The pH was measured in the extract, after removal of the paper shred, using a conventional combined pH electrode (Radelkis Kft.). Micro-sampling equipment at the Royal Institute for Cultural Heritage in Brussels was used for sampling of 9 different samples - two bores were made with a needle 0.7 mm in diameter from 3 different places in the paper sheet from each sample. For micro-measurement of pH by micro-electrode, 2 bores with the 0.7 mm needle in 3 µL of Milli-Q-Water were used and measured after one hour extraction. Results and discussion pH values for all samples – average value of three measurements for ISO 6588 and three values for micro-method – are summarised in Figure 1.
0
2
4
6
8
10
12
1 2 3 4 5 6 7 8 9Paper samples
pH
ISO 6588Micro AMicro BMicro C
Fig. 1: Determination of pH by tested methods.
173
They confirmed good correlation of the two tested methods in acidic and near neutral medium – samples 1, 5, 8, 9. Samples 2, 3, 6, 7 treated in the alkaline range showed differences between the two testing methods as values for ISO 6588 are significantly higher then those determined by the micro-method. From the comparison of samples 4 and 5 differences in pH in a mildly alkaline range can also be seen. While sample 4 treated with Mg(HCO3)2 showed significant differences between the two methods, the differences in pH values for sample 5 treated with Thylose MH300 are much smaller. It can be explained by the different solubility of these two agents used for paper treatment. Conclusion The main objectives of the Short-Term Scientific Missions within the framework COST G8, performed at the Royal Institute for Cultural Heritage in Brussels, were: to become acquainted with the equipment and the methodology of this work in order to apply the method in research the Slovak National Archives, and to disseminate the knowledge gained in the field of preservation of cultural paper heritage in the Slovak Republic (Hanus 2004a). The STSM project was successfully performed at the Royal Institute for Cultural Heritage in Brussels on August 2 – 6, 2004 [Hanus 2004b]. Acknowledgement J. Hanus is grateful to COST G8 for financial support within the framework of STSM projects, to the Royal Institute for Cultural Heritage in Brussels for hosting the mission and Dr. Jan Wouters and his staff for helpful discussions and cooperation. References
• Bégin, P., Deschâtelets, S., Grattan, D. W., Gurnagul, N., Iraci, J., Kaminska, E., Woods, D. and Zou, X. 1999. ‘The effect of air pollutants on paper stability’. Restaurator, 20 (1), 1–21.
• Browning, B. L. 1977. Analysis of Paper. 2nd edn. Marcel Dekker, Inc. New York and Basel.
• Bukovský, V. 2000. ‘The natural ageing of paper after exposure to daylight’, Restaurator, 21 (4), 229–37.
• Dupont, A-L and Tétreault, J, 2000. ‘Cellulose degradation in an acetic acid environment’, Studies in conservation, 45 (3), 201–210.
• Hanus, J., Katuščák, S., Katuščák, D., Bukovský, V., Rychlý, J. 2004. „Integrated effort for paper cultural heritage preservation in the Slovak Republic“. Presented at the International Conference Durability of paper and writings, Papylum, InkCor, MIP, Ljubljana, 16. – 20. 11. 2004. Proceedings of the conference, p. 86-87.
• Hanus, J. 2004a. Micro-destructive method for analysis of paper cultural heritage. Short-Term Scientific Mission Proposal, March 2004, DG RTD/B5 COST, COST Cooperation.
• Hanus. J. 2004b. Micro-destructive method for analysis of paper cultural heritage. Short-Term Scientific Mission Report. COST-STSM-G8-00313, August 2004.
• Havermans, J. B. G. A. and Dufour, J. 1997. ‘Photo oxidation of paper documents: a literature review’, Restaurator, 18 (3), 103–114.
174
• ISO 6588, ‘Paper, board and pulps – Determination of pH of aqueous extracts’, International Standard Organization, 1981, Reference number ISO 3588–1981 (E).
• Saverwyns, S., Sizaire, V., Wouters, J. 2002. The acidity of paper. Evaluation of methods to measure the pH of paper samples. ICOM-CC 13th Triennial Meeting, Rio de Janeiro 22 - 28 September 2002. Preprints (Volume II), ed. Roy Vontobel, James & James London, p. 628 - 634.
• Strlič, M., Kolar, J., Kočar, D., Drnovšek, T., Šelih, V. S., Susič, R., Pihlar, B. 2004. What is the pH of alkaline paper? ISSN: 1581-9280, www.e-PreservationScience.org, www.Morana-rtd.com, © by M O R A N A RTD d.o.o., e-PS, 1, 35-47.
• Puchinger, L. and Stachelberger, H. 2001. ‘A new “Micro Sampling Technique” for parchment’ in Larsen, R. (ed.), Handbook in the Micro Analysis of Parchments, 23–33.
• Wouters, J, Claeys, J, Lamens, K. and Van Bos, M. 2001. ‘Evaluation of methods for the Micro-analysis of Materials Added to Parchment’ in Larsen, R. (ed.), Handbook in the Micro Analysis of Parchments, 35–69.
175
Analysis of contamination and pigments on historical paper documents by means of laser induced plasma spectroscopy
K. Komar1, M. Martin2, J. Bredal-Jorgensen3, and G. Sliwinski1
1 Photophysics & Laser Lab. Pol. Acad. Sci, IF-FM, Fiszera 14, 80-952 Gdansk, Poland 2 Instituto de Quimica Fisica Rocasolano, CSIC, Serrano 119, 28006 Madrid, Spain
3School of Conservation, Esplanaden 34, 1263 Copenhagen, Denmark (corresponding author: [email protected])
Abstract For the rare Leopolita’s Bible (1561), and also archive documents (XIX c.), the LIPS spectra of the original surface contamination show similar rich structures where characteristic bands of the elements: calcium, aluminium, sodium, potassium and iron are ascribed to dust. The intensities of these bands decrease markedly for consecutive excitation pulses and this corresponds to the dust removal observed in the SEM images. Before conservation, the spectral analysis of pigments is performed using both the historical and model samples. For artificial contamination and model pigments the presence of elements: barium, copper, iron, manganese and titanium is confirmed by compounds recorded in the Raman spectra and pigments are identified in agreement with the literature. Results confirm the high sensitivity and virtually non-destructive character of the applied technique and its usefulness for analysis of historical documents.
Keywords: LIPS spectroscopy, historical paper, non-destructive analysis
Introduction Recently, it has been shown that spectroscopic techniques applied to the analysis of historical documents on paper and parchment deliver useful information on the chemical composition of the substrate, the surface contamination and the pigments as well. In addition, the light-induced deterioration and selective removal of the contamination layer by means of the well localized laser irradiation may be studied in this way [Ochocinska 2003a]. It should be mentioned that in case of radiation applied for the paper conservation the careful selection of the photon energy from the UV and visible spectral region is required. This prevents irreversible structural damage such as changes in the polymerisation degree and breakage of the cellulose bonds [Ochocinska 2003a]. Results obtained so far by means of laser induced plasma spectroscopy (LIPS) indicate its high sensitivity and potential for a well controlled, nearly non-destructive surface sampling [Melessanaki 2001, Ochocinska 2003b]. However, from the point of view of the conservator it is still desirable to collect more case studies in order to establish a firmer basis for the use of the spectroscopic diagnostic for conservation purposes. In this work performed within the COST G8 cooperation program the paper of a rare example of the Leopolita’s Bible from 1561 which had accumulated dust and surface contamination over time, and also of more recent archive document (Hypotheken Akten) from XIX c. is investigated by means of spectroscopic and surface observation, and the results are analysed for conservation purposes. Moreover, model substrate and pigments are used in order to minimize object damage via proper selection of the experimental conditions prior to diagnostic work on the original and its conservation. Experiment The representative fragments of original documents are shown in the upper part of Figure 1. Due to conservation needs, the investigation was concentrated on the most
176
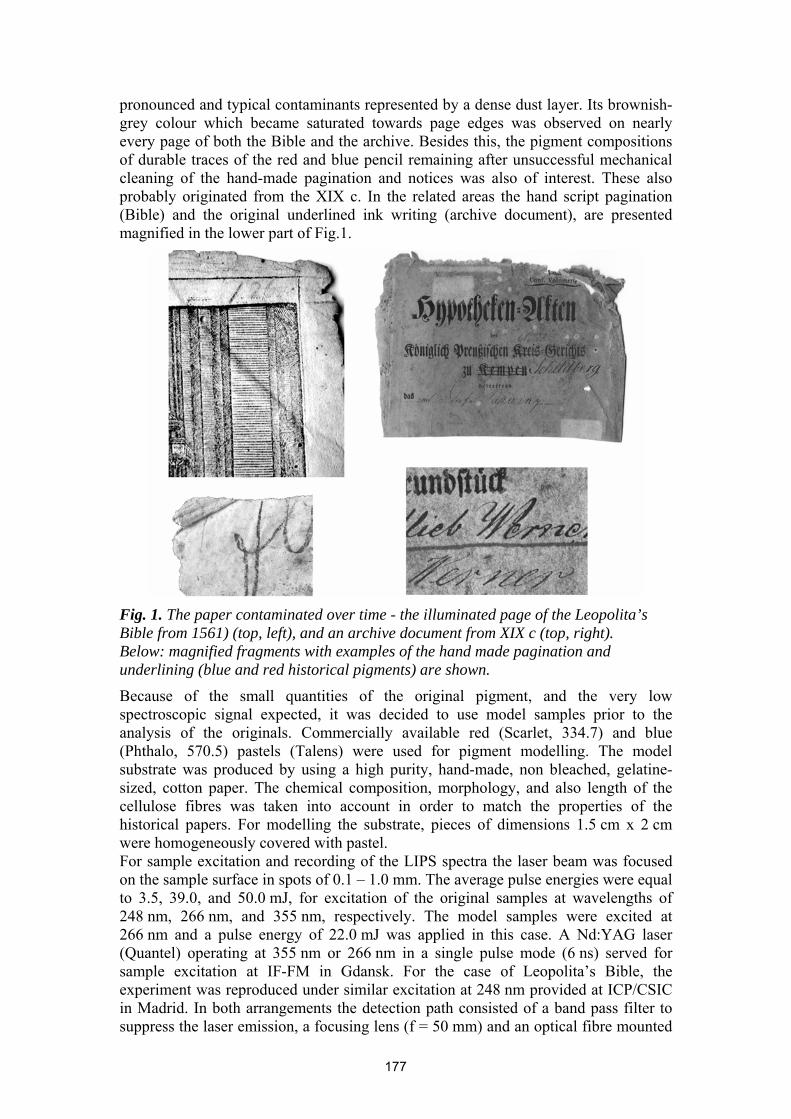
pronounced and typical contaminants represented by a dense dust layer. Its brownish-grey colour which became saturated towards page edges was observed on nearly every page of both the Bible and the archive. Besides this, the pigment compositions of durable traces of the red and blue pencil remaining after unsuccessful mechanical cleaning of the hand-made pagination and notices was also of interest. These also probably originated from the XIX c. In the related areas the hand script pagination (Bible) and the original underlined ink writing (archive document), are presented magnified in the lower part of Fig.1.
Fig. 1. The paper contaminated over time - the illuminated page of the Leopolita’s Bible from 1561) (top, left), and an archive document from XIX c (top, right). Below: magnified fragments with examples of the hand made pagination and underlining (blue and red historical pigments) are shown.
Because of the small quantities of the original pigment, and the very low spectroscopic signal expected, it was decided to use model samples prior to the analysis of the originals. Commercially available red (Scarlet, 334.7) and blue (Phthalo, 570.5) pastels (Talens) were used for pigment modelling. The model substrate was produced by using a high purity, hand-made, non bleached, gelatine-sized, cotton paper. The chemical composition, morphology, and also length of the cellulose fibres was taken into account in order to match the properties of the historical papers. For modelling the substrate, pieces of dimensions 1.5 cm x 2 cm were homogeneously covered with pastel. For sample excitation and recording of the LIPS spectra the laser beam was focused on the sample surface in spots of 0.1 – 1.0 mm. The average pulse energies were equal to 3.5, 39.0, and 50.0 mJ, for excitation of the original samples at wavelengths of 248 nm, 266 nm, and 355 nm, respectively. The model samples were excited at 266 nm and a pulse energy of 22.0 mJ was applied in this case. A Nd:YAG laser (Quantel) operating at 355 nm or 266 nm in a single pulse mode (6 ns) served for sample excitation at IF-FM in Gdansk. For the case of Leopolita’s Bible, the experiment was reproduced under similar excitation at 248 nm provided at ICP/CSIC in Madrid. In both arrangements the detection path consisted of a band pass filter to suppress the laser emission, a focusing lens (f = 50 mm) and an optical fibre mounted
177
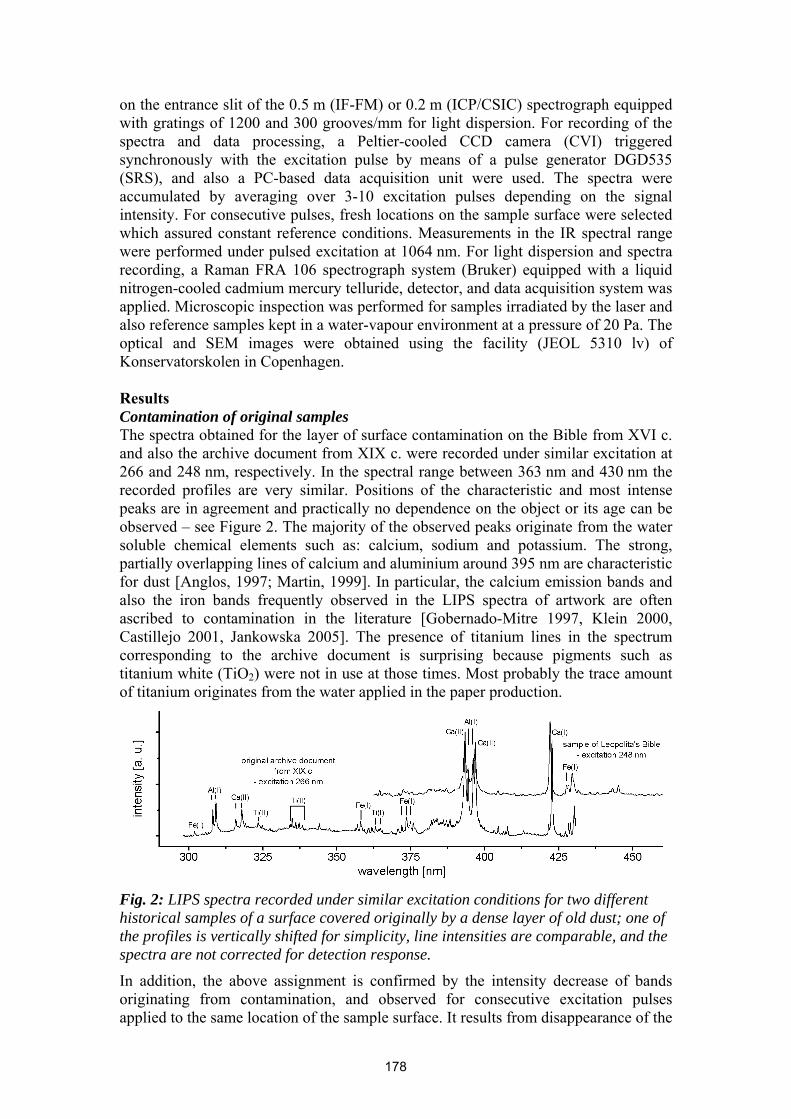
on the entrance slit of the 0.5 m (IF-FM) or 0.2 m (ICP/CSIC) spectrograph equipped with gratings of 1200 and 300 grooves/mm for light dispersion. For recording of the spectra and data processing, a Peltier-cooled CCD camera (CVI) triggered synchronously with the excitation pulse by means of a pulse generator DGD535 (SRS), and also a PC-based data acquisition unit were used. The spectra were accumulated by averaging over 3-10 excitation pulses depending on the signal intensity. For consecutive pulses, fresh locations on the sample surface were selected which assured constant reference conditions. Measurements in the IR spectral range were performed under pulsed excitation at 1064 nm. For light dispersion and spectra recording, a Raman FRA 106 spectrograph system (Bruker) equipped with a liquid nitrogen-cooled cadmium mercury telluride, detector, and data acquisition system was applied. Microscopic inspection was performed for samples irradiated by the laser and also reference samples kept in a water-vapour environment at a pressure of 20 Pa. The optical and SEM images were obtained using the facility (JEOL 5310 lv) of Konservatorskolen in Copenhagen. Results Contamination of original samples The spectra obtained for the layer of surface contamination on the Bible from XVI c. and also the archive document from XIX c. were recorded under similar excitation at 266 and 248 nm, respectively. In the spectral range between 363 nm and 430 nm the recorded profiles are very similar. Positions of the characteristic and most intense peaks are in agreement and practically no dependence on the object or its age can be observed – see Figure 2. The majority of the observed peaks originate from the water soluble chemical elements such as: calcium, sodium and potassium. The strong, partially overlapping lines of calcium and aluminium around 395 nm are characteristic for dust [Anglos, 1997; Martin, 1999]. In particular, the calcium emission bands and also the iron bands frequently observed in the LIPS spectra of artwork are often ascribed to contamination in the literature [Gobernado-Mitre 1997, Klein 2000, Castillejo 2001, Jankowska 2005]. The presence of titanium lines in the spectrum corresponding to the archive document is surprising because pigments such as titanium white (TiO2) were not in use at those times. Most probably the trace amount of titanium originates from the water applied in the paper production.
Fig. 2: LIPS spectra recorded under similar excitation conditions for two different historical samples of a surface covered originally by a dense layer of old dust; one of the profiles is vertically shifted for simplicity, line intensities are comparable, and the spectra are not corrected for detection response.
In addition, the above assignment is confirmed by the intensity decrease of bands originating from contamination, and observed for consecutive excitation pulses applied to the same location of the sample surface. It results from disappearance of the
178
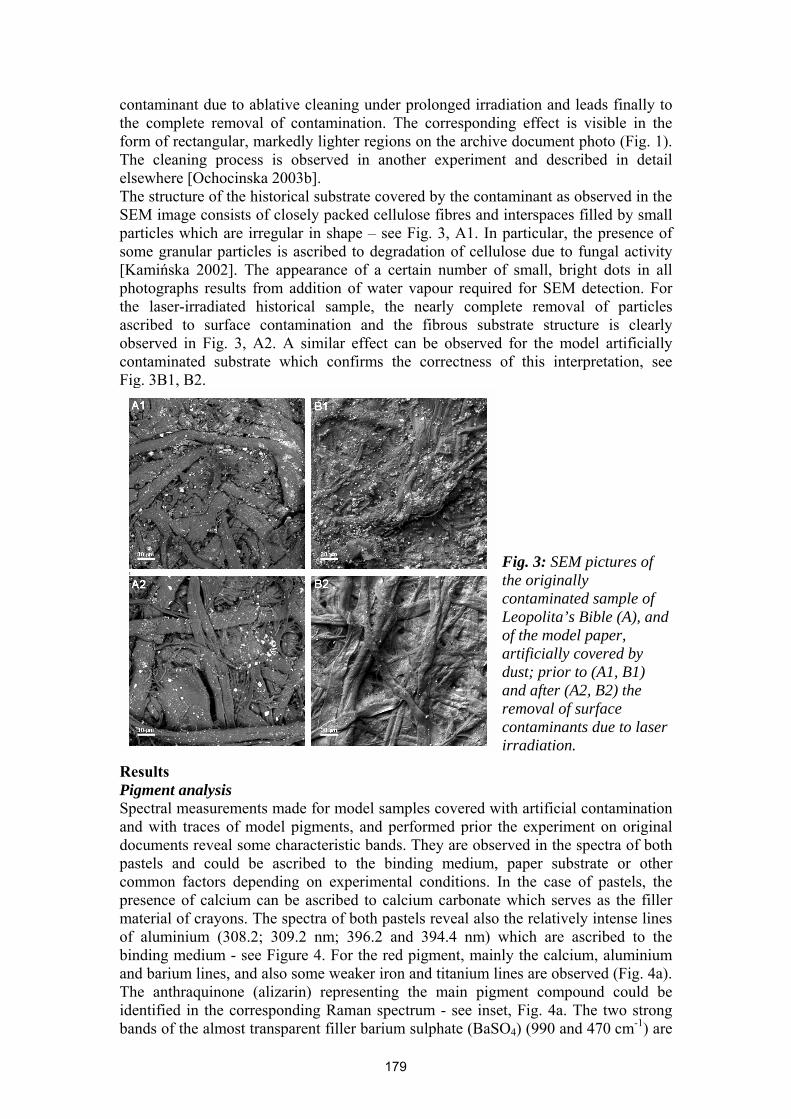
contaminant due to ablative cleaning under prolonged irradiation and leads finally to the complete removal of contamination. The corresponding effect is visible in the form of rectangular, markedly lighter regions on the archive document photo (Fig. 1). The cleaning process is observed in another experiment and described in detail elsewhere [Ochocinska 2003b]. The structure of the historical substrate covered by the contaminant as observed in the SEM image consists of closely packed cellulose fibres and interspaces filled by small particles which are irregular in shape – see Fig. 3, A1. In particular, the presence of some granular particles is ascribed to degradation of cellulose due to fungal activity [Kamińska 2002]. The appearance of a certain number of small, bright dots in all photographs results from addition of water vapour required for SEM detection. For the laser-irradiated historical sample, the nearly complete removal of particles ascribed to surface contamination and the fibrous substrate structure is clearly observed in Fig. 3, A2. A similar effect can be observed for the model artificially contaminated substrate which confirms the correctness of this interpretation, see Fig. 3B1, B2.
Fig. 3: SEM pictures of the originally contaminated sample of Leopolita’s Bible (A), and of the model paper, artificially covered by dust; prior to (A1, B1) and after (A2, B2) the removal of surface contaminants due to laser irradiation.
Results Pigment analysis Spectral measurements made for model samples covered with artificial contamination and with traces of model pigments, and performed prior the experiment on original documents reveal some characteristic bands. They are observed in the spectra of both pastels and could be ascribed to the binding medium, paper substrate or other common factors depending on experimental conditions. In the case of pastels, the presence of calcium can be ascribed to calcium carbonate which serves as the filler material of crayons. The spectra of both pastels reveal also the relatively intense lines of aluminium (308.2; 309.2 nm; 396.2 and 394.4 nm) which are ascribed to the binding medium - see Figure 4. For the red pigment, mainly the calcium, aluminium and barium lines, and also some weaker iron and titanium lines are observed (Fig. 4a). The anthraquinone (alizarin) representing the main pigment compound could be identified in the corresponding Raman spectrum - see inset, Fig. 4a. The two strong bands of the almost transparent filler barium sulphate (BaSO4) (990 and 470 cm-1) are
179
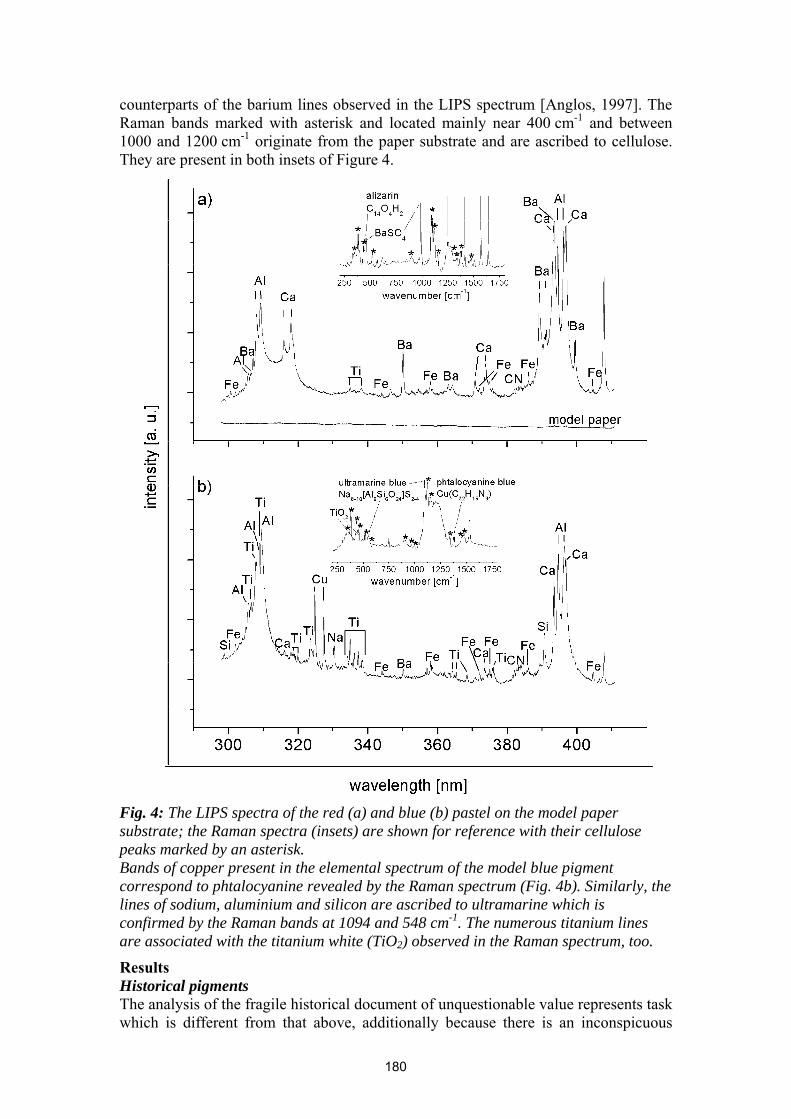
counterparts of the barium lines observed in the LIPS spectrum [Anglos, 1997]. The Raman bands marked with asterisk and located mainly near 400 cm-1 and between 1000 and 1200 cm-1 originate from the paper substrate and are ascribed to cellulose. They are present in both insets of Figure 4.
Fig. 4: The LIPS spectra of the red (a) and blue (b) pastel on the model paper substrate; the Raman spectra (insets) are shown for reference with their cellulose peaks marked by an asterisk. Bands of copper present in the elemental spectrum of the model blue pigment correspond to phtalocyanine revealed by the Raman spectrum (Fig. 4b). Similarly, the lines of sodium, aluminium and silicon are ascribed to ultramarine which is confirmed by the Raman bands at 1094 and 548 cm-1. The numerous titanium lines are associated with the titanium white (TiO2) observed in the Raman spectrum, too.
Results Historical pigments The analysis of the fragile historical document of unquestionable value represents task which is different from that above, additionally because there is an inconspicuous
180
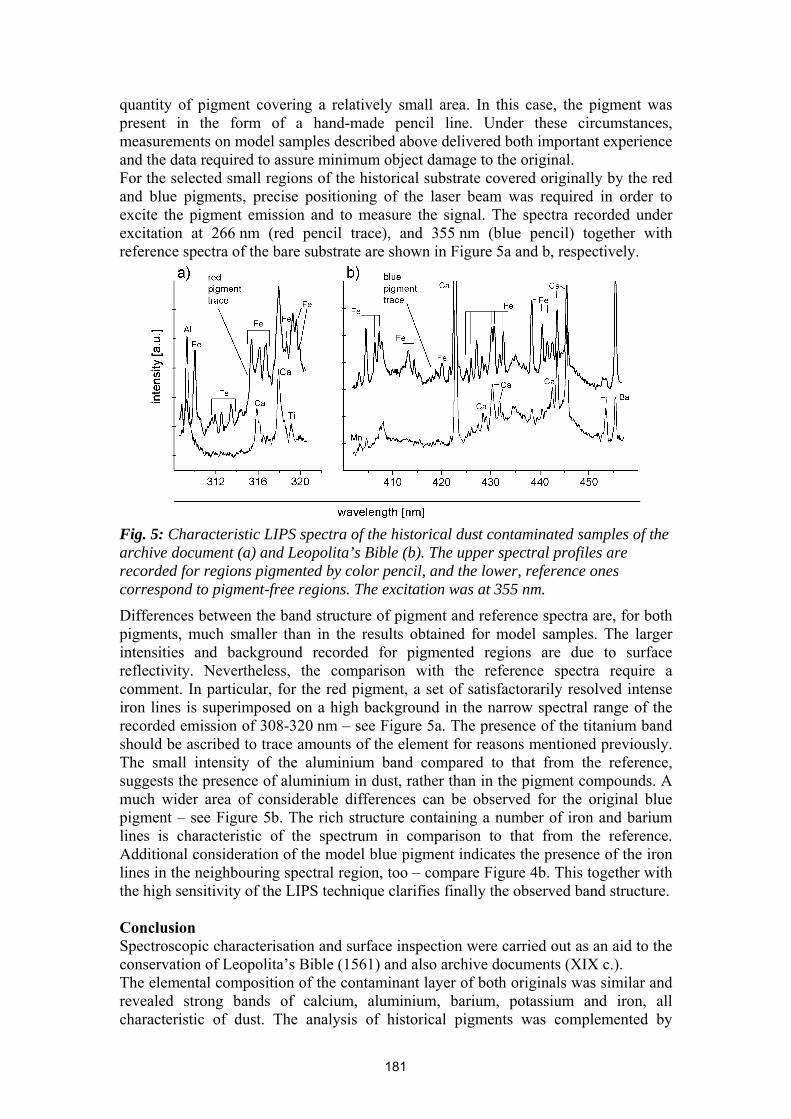
quantity of pigment covering a relatively small area. In this case, the pigment was present in the form of a hand-made pencil line. Under these circumstances, measurements on model samples described above delivered both important experience and the data required to assure minimum object damage to the original. For the selected small regions of the historical substrate covered originally by the red and blue pigments, precise positioning of the laser beam was required in order to excite the pigment emission and to measure the signal. The spectra recorded under excitation at 266 nm (red pencil trace), and 355 nm (blue pencil) together with reference spectra of the bare substrate are shown in Figure 5a and b, respectively.
Fig. 5: Characteristic LIPS spectra of the historical dust contaminated samples of the archive document (a) and Leopolita’s Bible (b). The upper spectral profiles are recorded for regions pigmented by color pencil, and the lower, reference ones correspond to pigment-free regions. The excitation was at 355 nm.
Differences between the band structure of pigment and reference spectra are, for both pigments, much smaller than in the results obtained for model samples. The larger intensities and background recorded for pigmented regions are due to surface reflectivity. Nevertheless, the comparison with the reference spectra require a comment. In particular, for the red pigment, a set of satisfactorarily resolved intense iron lines is superimposed on a high background in the narrow spectral range of the recorded emission of 308-320 nm – see Figure 5a. The presence of the titanium band should be ascribed to trace amounts of the element for reasons mentioned previously. The small intensity of the aluminium band compared to that from the reference, suggests the presence of aluminium in dust, rather than in the pigment compounds. A much wider area of considerable differences can be observed for the original blue pigment – see Figure 5b. The rich structure containing a number of iron and barium lines is characteristic of the spectrum in comparison to that from the reference. Additional consideration of the model blue pigment indicates the presence of the iron lines in the neighbouring spectral region, too – compare Figure 4b. This together with the high sensitivity of the LIPS technique clarifies finally the observed band structure. Conclusion Spectroscopic characterisation and surface inspection were carried out as an aid to the conservation of Leopolita’s Bible (1561) and also archive documents (XIX c.). The elemental composition of the contaminant layer of both originals was similar and revealed strong bands of calcium, aluminium, barium, potassium and iron, all characteristic of dust. The analysis of historical pigments was complemented by
181

measurements on model samples and confirmed by the presence of compounds of the red and blue pigment observed in Raman spectra which were in agreement with literature. For the case of valuable and rare historical documents on paper, we strongly recommend analytical trials made on model substrates and artificial coatings prior to sampling of the originals. This conclusion was supported by the SEM scans which revealed removal of the contaminant layer and also the minimal sampling thus nearly non-destructive character of the LIPS technique when applied in the analysis of fragile historical documents. Acknowledgement Authors acknowledge support of the Polish Ministry of Science and Information Society Technologies (MNiI) via projects 60/E-87/ H-01/DWM119, 60/E-87/KN/DWM102 and 0075/H01/03/25. References
• Anglos, D., Couris, S. and Fotakis, C. 1997. 'Laser diagnostics of painted artworks: laser-induced breakdown spectroscopy in pigment identification'. Applied Spectroscopy, 51:1025-1030.
• Castillejo, M., Martin, M., Ouija, M. et al. 2001. 'Spectroscopic analysis of pigments and binding media of polychromes by the combination of optical laser-based and vibrational techniques'. Applied Spectroscopy, 55:992-998.
• Gobernado-Mitre, I., Prieto, A., C., Zafiropulos, V. et al. 1997. 'On-line monitoring of laser cleaning of limestone by laser induced breakdown spectroscopy and laser-induced fluorescence'. Applied Spectroscopy, 51:1125-1129.
• Jankowska, M., Ochocińska, K. and Śliwiński, G. 2005. 'Laser cleaning monitored by a spectroscopic technique – experimental data on the gotlandic sandstone case'. In Lasers in the Conservation of Artwork, LACONA V Proceedings, 100 Springer Proceedings in Physics, Dickmann, K., Fotakis, C. and Asmus, J., F. (eds.) 411-418. Springer.
• Kamińska, A., Bredal-Jorgensen, J., Ochocińska, K. et al. 2002. 'Leopolita’s Bible conservation with the use of a laser and investigations of the paper and selected contaminants'. Scientific Issue IF-FM PAS, 524/1483/2002:157-171.
• Klein, S., Hildenhagen, J., Dickmann, K. et al. 2000. 'LIBS spectroscopy for monitoring and control of the laser cleaning process of stone and medieval glass'. Journal of Cultural Heritage, 1:287-292.
• Martin, M., Castillejo, M. Torres, R. et al. 1999. 'Analytical studies of polychromes by time-integrated Laser-Induced Breakdown Spectroscopy'. Laser Chemistry, 18:155-165.
• Melessanaki, K., Papadakis, V., Balas, C. et al. 2001. 'Laser induced breakdown spectroscopy and hyper-spectral imaging analysis of pigments on an illuminated manuscript'. Spectrochimica Acta Part B, 56:2337-2346.
• Ochocińska, K., Kamińska, A. and Śliwiński, G. 2003a. 'Experimental investigations of stained paper documents cleaned by the Nd:YAG laser pulses'. Journal of Cultural Heritage, 4:188-193.
• Ochocinska, K., Sawczak, M., Martin, M. et al. 2003b. 'LIPS spectroscopy for contamination analysis and the laser cleaning diagnostics of historical paper documents'. Radiation Physics and Chemistry, 68:227-232.
182
Miscellaneous Materials

A multi-interdisciplinary handshake between Humanities and Science at Qumran
Jan Gunneweg1, Marta Balla2, Jan Wouters3, Charles Greenblatt4, Martin Mueller5, Emmanuel Pantos6,
Hans van der Plicht7, Annemie Adriaens8, Kaare L. Rasmussen9, Christian Riekel10, Manfred Burghammer10 and Bridget Murphy5
1 Institute of Archaeology, The Hebrew University of Jerusalem, Mt. Scopus, 91905 Jerusalem, Israel
2 Institute of Nuclear Techniques, Budapest University of Technology and Economics, Hungary
3 Royal Institute for Cultural Heritage, Laboratories, Brussels, Belgium
4 Kuvin Center, Hebrew University of Jerusalem, Israel
5 Institut für Experimentelle und Angewandte Physik der Universität Kiel, D-24098 Kiel, Germany 6 Daresbury Laboratory, Warrington, WA4 4AD, England
7Center for Isotope Research, Groningen University, Nijenborgh 4, 9747 AG Groningen, Netherlands
8 Department of Analytical Chemistry, Ghent University, B-9000 Ghent, Belgium
9 University of Southern Denmark, Campusvei 55, DK-5230, Odense M. Denmark
10 ESRF, BP 220, 38043 Grenoble Cedex, France
(corresponding author: [email protected]) Abstract The famous Dead Sea scrolls, found in 1947 at Qumran, point to a group of people, the ‘Essenes’, described by Pliny, Flavius Josephus and Philo. A large number, recently estimated to be around 950 biblical, sectarian and apocryphal manuscripts have been associated with the Essenes. In 1998, interdisciplinary laboratory research started in Jerusalem between material scientists, museum curators and archaeologists to obtain fresh information of what the manuscripts and the material culture may demonstrate, and how to preserve this cultural heritage for the centuries to come. In 2001, Gunneweg became one of the two members of COST-G8, representing Israel. This opened a golden opportunity to contact various scientists in Europe. The Qumran project of the Hebrew University is a collaborative endeavour between 17 institutions applying Neutron Activation Analysis, Petrography, Thermoluminescence, Magnetic Susceptibility, Optical and Electron Microscopy, Synchrotron X-Ray Diffraction and Fluorescence, High Performance Liquid Chromatography, Raman Spectroscopy, Carbon 14 dating and DNA analysis of the scroll parchment.
Keywords: Qumran, Essenes, Synchrotron Radiation, Neutron Activation, Pottery, Dead Sea scrolls, Textiles, HPLC, Carbon 14, Thermoluminescence, DNA, Parchment
Introduction Between 1947 and 1956, a set of complete manuscripts and thousands of small pieces of text, roughly estimated to be part of some 950 documents, have been found in ten caves on the Qumran spur and the cliffs on the western shore of the Dead Sea in Israel. These are the so-called Dead Sea Scrolls. The French archaeologist, Roland de Vaux, excavated the small site of Qumran and the adjacent caves in the cliffs where the scrolls were found. Of course, as many scholars have done before us, we could also have continued studying the archaeology of Qumran and the scrolls by the usual ‘classic’ approach whereby archaeologists and text exegetes would study the remains by comparison, looking for parallels between the pottery finds at Qumran and those from other sites, or by palaeography (comparison of the way of writing) of the scroll texts. However, we soon became convinced that this approach would not work very well for Qumran, since most of the artefacts were unique and not comparable to other sites, while the primary question of ‘who wrote the scrolls and where’ remained unanswered.
185
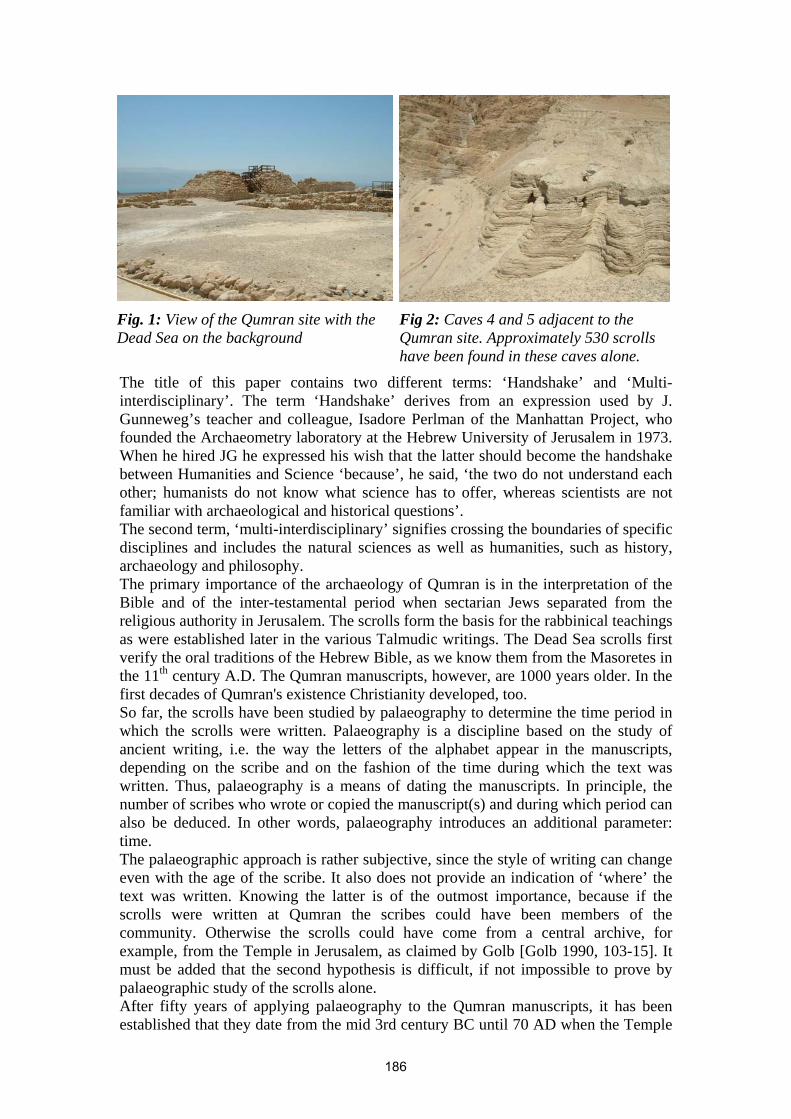
Fig. 1: View of the Qumran site with the Dead Sea on the background
Fig 2: Caves 4 and 5 adjacent to the Qumran site. Approximately 530 scrolls have been found in these caves alone.
The title of this paper contains two different terms: ‘Handshake’ and ‘Multi-interdisciplinary’. The term ‘Handshake’ derives from an expression used by J. Gunneweg’s teacher and colleague, Isadore Perlman of the Manhattan Project, who founded the Archaeometry laboratory at the Hebrew University of Jerusalem in 1973. When he hired JG he expressed his wish that the latter should become the handshake between Humanities and Science ‘because’, he said, ‘the two do not understand each other; humanists do not know what science has to offer, whereas scientists are not familiar with archaeological and historical questions’. The second term, ‘multi-interdisciplinary’ signifies crossing the boundaries of specific disciplines and includes the natural sciences as well as humanities, such as history, archaeology and philosophy. The primary importance of the archaeology of Qumran is in the interpretation of the Bible and of the inter-testamental period when sectarian Jews separated from the religious authority in Jerusalem. The scrolls form the basis for the rabbinical teachings as were established later in the various Talmudic writings. The Dead Sea scrolls first verify the oral traditions of the Hebrew Bible, as we know them from the Masoretes in the 11th century A.D. The Qumran manuscripts, however, are 1000 years older. In the first decades of Qumran's existence Christianity developed, too. So far, the scrolls have been studied by palaeography to determine the time period in which the scrolls were written. Palaeography is a discipline based on the study of ancient writing, i.e. the way the letters of the alphabet appear in the manuscripts, depending on the scribe and on the fashion of the time during which the text was written. Thus, palaeography is a means of dating the manuscripts. In principle, the number of scribes who wrote or copied the manuscript(s) and during which period can also be deduced. In other words, palaeography introduces an additional parameter: time. The palaeographic approach is rather subjective, since the style of writing can change even with the age of the scribe. It also does not provide an indication of ‘where’ the text was written. Knowing the latter is of the outmost importance, because if the scrolls were written at Qumran the scribes could have been members of the community. Otherwise the scrolls could have come from a central archive, for example, from the Temple in Jerusalem, as claimed by Golb [Golb 1990, 103-15]. It must be added that the second hypothesis is difficult, if not impossible to prove by palaeographic study of the scrolls alone. After fifty years of applying palaeography to the Qumran manuscripts, it has been established that they date from the mid 3rd century BC until 70 AD when the Temple
186
in Jerusalem and Qumran were destroyed. On the other hand, according to the material at our disposal, the site was inhabited between 50 BC and 70 AD by people we assume to be the ‘Essenes’. Such ancient writers as Pliny, Flavius Josephus and Philo Alexandrinus who lived during this period base this on historical accounts. This means that the ‘Essene period’ does not cover exactly the period to which the scrolls are dated. This in itself indicates that at least a part of the scrolls came from elsewhere. Furthermore, not much research has been carried out in order to clarify which population settled or camped at the site in the centuries preceding the ‘Essene’ Qumran or following Qumran’s destruction. This is important if we assume that all the finds belong to the ‘Essene’ period. Various publications in the Revue Biblique, Revue de Qumran and the Schweich lectures by R. de Vaux, [de Vaux 1951, 1954, 1959, 1973] demonstrate that the interpretation of the site was based on three criteria, i.e. the architectural finds (consisting of miqvot - ritual baths), the pottery and the cemetery with the 1200 graves. Ever since then, many have thought that everything about the site was crystal clear. What remained to be done, it was said, was translating the sectarian and secular texts. This huge endeavour was completed in 2002 with 39 volumes published by a team of the Hebrew University under the direction of Emmanuel Tov [Tov 2002]. However, after 50 years of scroll study, the question still remains: Who wrote the scrolls? In order to give an answer to this question a new approach was needed. In 1998 one of us (JG) resolved to give the scroll writers the place in history that they deserve, and to trace the site where they wrote the scrolls by determining the provenance of the jars that contained the manuscripts. This approach requires the determination of the chemical composition of the scroll jars, which can be used to prove that they were made in Qumran or some other location in Israel, e.g. Jerusalem. At the same time, a date for the jars was needed. This could be completed by Thermoluminescence measurements on the pottery and Carbon 14 dating of the scroll wraps found next to the jars. By doing so, the link between the jars, the scrolls and the textiles could be established. If such data could be correlated with dates obtained from artefacts from the settlement and the nearby cemetery, the picture would be clear. Before 1998, some scientific tests have been carried out on some fragments of scrolls and on ink [Nir-El and Broshi 1996a&b, Pole and Reed 1962] whereas also parchment was radiocarbon dated [Bonani et al. 1992, Libbi 1951, Sellers 1951] and textiles dyes were studied [Abraham and Edelstein 1963]. Nevertheless, these tests were not comprehensive and too few to reach final conclusions. Provenance of Qumran Pottery In 1998, we decided that the time had come to apply instrumental neutron activation analysis (INAA) – needing no chemical separation – to Qumran pottery in order to establish the links between the ‘Essenes’ and their immediate surrounding sites. INAA is a nuclear method especially adapted for the quantitative determination of the chemical composition of an artefact. The provenance, the pottery's place of origin, can be established through its chemical composition, its ‘fingerprint’. INAA measures accurately and precisely the gamma emission of radionuclides of many of the elements in a ceramic artefact after it has been submitted for a preset period of time to a steady flux of neutrons in a nuclear reactor. The premise is that every single clay source on earth has its unique geochemical history, hence a unique chemical composition.
187
The nuclear reactor at Budapest where the analyses were performed is a pool type reactor with a power of 100 kW at full capacity and has been operating since 1971 [Molnar et al 1993: 45-64]. The samples are submitted to a neutron beam of a thermal neutron flux of 2x10¹² n/cm2/sec. The typical size of a pottery sample is between 70-100 mg of drilled or pulverised ceramic material that represents a vessel or a shard. Marta Balla was willing to perform the INAA in the nuclear facility at the Technical Faculty of Budapest. A representative number of pottery samples from the Ecole Biblique [Humbert 2003] and the Israel Antiquity Authority were collected. We also had access to two sets of INAA data, one from the Lawrence Berkeley Laboratory (LBL) and the other the former Archaeometry laboratory at the Hebrew University of Jerusalem. As established by several publications [Perlman and Asaro 1969: 21-52, Gunneweg et al 1994: 227-239, Molnar et al 1993] INAA is an excellent choice for provenance of ceramics. Criteria for a reliable provenance technique From past experience it is clear that a technique for the provenance of pottery can only be successful when it takes into account of what we have dubbed ‘The seven holy rules of thumb’: 1. The technique must provide a chemical composition of the artefact, consisting of
major, minor and trace elements, measured simultaneously. 2. It must be as sensitive for trace elements as for major and minor ones. 3. Sample preparation should be easy and fast, without chemical pre-treatment. 4. The accuracy and precision of the technique should be well defined. 5. The set-up should be fully automated and the sample should be analysed in a short
period of time to minimise human and equipment error. 6. It should give quantitative results, suitable for processing by statistical methods. 7. A database should exist for comparison purposes. Care was taken to intercalibrate the data obtained at the Technical University of Budapest with international standards also used in the laboratories of Berkeley, Bonn and Jerusalem. The latter three laboratories have used the Perlman-Asaro Pottery standard as well as the coal-Fly ash (NBS SRM1633a) standard and the results have been published by Yellin et al. 1977. The same standards were also analysed at Budapest and Molnar [Molnar et al 1993] and Balla [Balla 2005:37-39] have published the results. Clays from Jerusalem and Beit ‘Ummar, pertinent to the Qumran project have been analysed at the Budapest facility and all individual INAA data can be found at http://dept.phy.bme.hu/phd/dissertations/Balla_disszertacio.pdf. Furthermore, it was possible to refer to a database of reference clays painstakingly collected at the Hebrew University over a period of 25 years from Jerusalem, the Judean Hills, the Negev Desert and elsewhere. The lack of information on the chemical composition of clays around the Dead Sea seemed, at the beginning, to be a problem. Initially, some time was spent in finding suitable local clay that the Qumranites could have used. Finally, clay collected from a rain puddle on the Qumran plateau and a pottery fragment from a kiln provided great chemical similarities with that of our ceramic reference databank. In this way, INAA established that the local pottery was certainly made in Qumran. The processing of trace element concentrations that originate from INAA data is based on multivariate statistics. Data points are generally viewed in terms of 'distance' between different groups, between groups and individual samples, or just among individuals. The most commonly used methods are Cluster Analysis and Principal
188
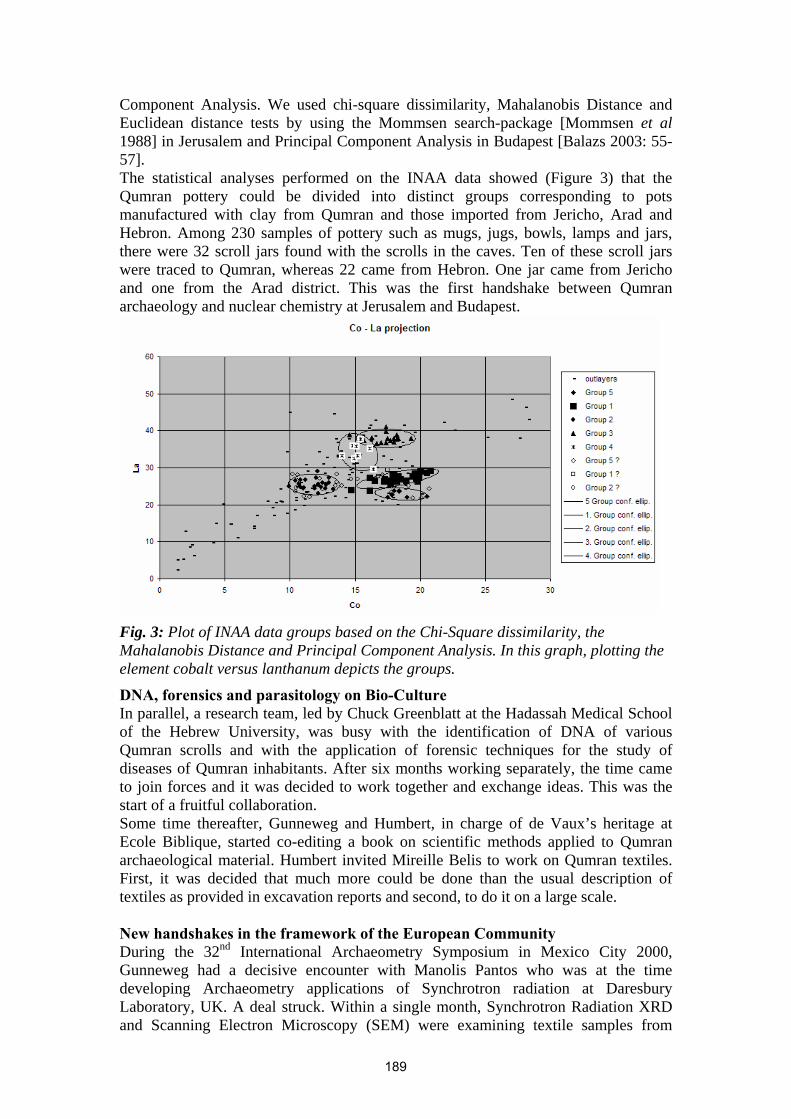
Component Analysis. We used chi-square dissimilarity, Mahalanobis Distance and Euclidean distance tests by using the Mommsen search-package [Mommsen et al 1988] in Jerusalem and Principal Component Analysis in Budapest [Balazs 2003: 55-57]. The statistical analyses performed on the INAA data showed (Figure 3) that the Qumran pottery could be divided into distinct groups corresponding to pots manufactured with clay from Qumran and those imported from Jericho, Arad and Hebron. Among 230 samples of pottery such as mugs, jugs, bowls, lamps and jars, there were 32 scroll jars found with the scrolls in the caves. Ten of these scroll jars were traced to Qumran, whereas 22 came from Hebron. One jar came from Jericho and one from the Arad district. This was the first handshake between Qumran archaeology and nuclear chemistry at Jerusalem and Budapest.
Fig. 3: Plot of INAA data groups based on the Chi-Square dissimilarity, the Mahalanobis Distance and Principal Component Analysis. In this graph, plotting the element cobalt versus lanthanum depicts the groups.
DNA, forensics and parasitology on Bio-Culture In parallel, a research team, led by Chuck Greenblatt at the Hadassah Medical School of the Hebrew University, was busy with the identification of DNA of various Qumran scrolls and with the application of forensic techniques for the study of diseases of Qumran inhabitants. After six months working separately, the time came to join forces and it was decided to work together and exchange ideas. This was the start of a fruitful collaboration. Some time thereafter, Gunneweg and Humbert, in charge of de Vaux’s heritage at Ecole Biblique, started co-editing a book on scientific methods applied to Qumran archaeological material. Humbert invited Mireille Belis to work on Qumran textiles. First, it was decided that much more could be done than the usual description of textiles as provided in excavation reports and second, to do it on a large scale. New handshakes in the framework of the European Community During the 32nd International Archaeometry Symposium in Mexico City 2000, Gunneweg had a decisive encounter with Manolis Pantos who was at the time developing Archaeometry applications of Synchrotron radiation at Daresbury Laboratory, UK. A deal struck. Within a single month, Synchrotron Radiation XRD and Scanning Electron Microscopy (SEM) were examining textile samples from
189
Qumran at Daresbury. Colleagues at Daresbury advised Pantos to analyse the textile fibre materials at the European Synchrotron Radiation Facility (ESRF) in Grenoble using micro-XRD on single fibrils. Martin Mueller from Kiel University in Germany, an expert in diffraction of linen fibres, Bridget Murphy, Christian Riekel and Manfred Burghammer joined the team. Technical details have been published in a volume on Khirbet Qumran and 'Ain Feshkha that appeared in 2003 [Mueller et al in Humbert and Gunneweg 2003, and in Mueller et al 2004]. Dating We now had the provenance of the pottery that the ‘Essenes’ had used, but these utensils had still to be put into a time frame, which was impossible to determine stylistically. The next step was to send pottery samples from a Qumran scroll jar and kiln to Kaare Rasmussen to be dated by Thermoluminescence. The dates corroborated the previous dates obtained from a scroll and other types of organic material examined at various laboratories [Rasmussen 2003]. The characterisation of the textile fibres is an interesting research topic in itself, but dating the fibres would provide important additional information correlated with pottery dating. The point was that the majority of the textiles had been used to wrap the scrolls. We decided to send the same textiles analysed at ESRF to Groningen, in the Netherlands where Hans van der Plicht subjected them to AMS-C14 (Accelerator Mass Spectroscopy) in collaboration with Rasmussen and us. The dates turned to be somewhat surprising. Some were much older, whereas others much younger than the ‘Essene’ age. This suggested that the textiles may have been contaminated by some sort of material that was the reason for discrepancies. At a later stage, this contamination was identified as castor oil or beeswax that had been used by de Vaux’s team in the 1950s to preserve the textiles. It took nine months to clean the textiles at the Risø laboratory in Copenhagen before re-dating them. The result of the dated textiles was important for crosschecking with the TL data from the jars, since some of the textiles could have been used as jar covers. At the same time, we were able to obtain a corroborating date from wood and date kernels from the settlement and the cemetery. As a result of all this work, we obtained confident date for materials from the three units that form Qumran: The settlement, the cemetery and the caves. At this point, we had a final proof regarding chronology. The scientific details on the C14 dating at Groningen AMS will be reported in the Proceedings of the Qumran Workshop to be published by COST in 2006. Textile dyes In 2002, when all this was going on, Gunneweg asked Jan Wouters of the Royal Institute for Cultural Heritage in Brussels if he could identify the textile dyes, expected to be of organic nature. Wouters subjected six dyed textile samples, two purple ones (QUM504 & 505), a blue one (QUM510), a red and black (QUM526) and a green one (QUM528), to High Performance Liquid Chromatography (HPLC) analysis and deduced that all except for the samples QUM504 & 505 contained indigotin, indirubin, ellagic acid, luteolin, alizarin and purpurin. The white yarns in QUM505 were not dyed and micro-chemical tests excluded the presence of an indigoid or an archil type of dyestuff [Gunneweg et al 2005]. Further micro-chemical tests, as well as SEM-EDX analysis showed that the color could only be due to an organic dye. The conclusion was that the red colour came from madder (Rubia tinctorum), black from Rubia tinctorum together with tannin, while green was weld (Reseda luteola) together with an indigoid dye source.
190
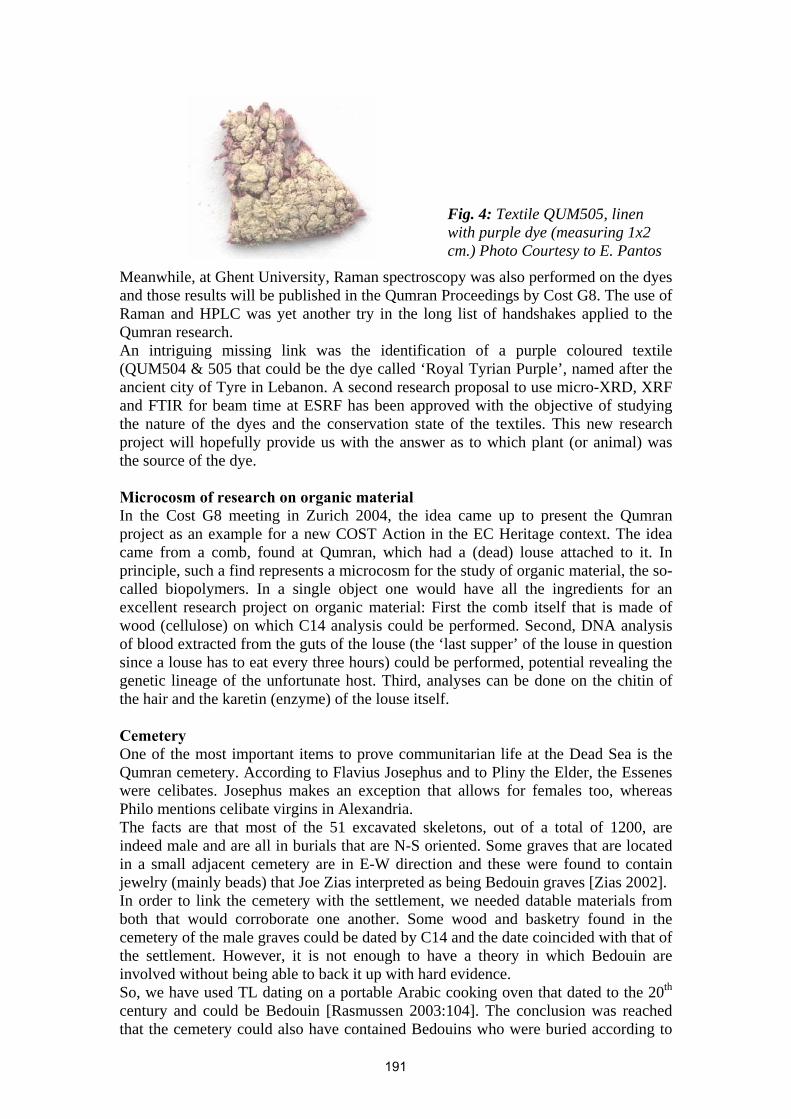
Fig. 4: Textile QUM505, linen with purple dye (measuring 1x2 cm.) Photo Courtesy to E. Pantos
Meanwhile, at Ghent University, Raman spectroscopy was also performed on the dyes and those results will be published in the Qumran Proceedings by Cost G8. The use of Raman and HPLC was yet another try in the long list of handshakes applied to the Qumran research. An intriguing missing link was the identification of a purple coloured textile (QUM504 & 505 that could be the dye called ‘Royal Tyrian Purple’, named after the ancient city of Tyre in Lebanon. A second research proposal to use micro-XRD, XRF and FTIR for beam time at ESRF has been approved with the objective of studying the nature of the dyes and the conservation state of the textiles. This new research project will hopefully provide us with the answer as to which plant (or animal) was the source of the dye. Microcosm of research on organic material In the Cost G8 meeting in Zurich 2004, the idea came up to present the Qumran project as an example for a new COST Action in the EC Heritage context. The idea came from a comb, found at Qumran, which had a (dead) louse attached to it. In principle, such a find represents a microcosm for the study of organic material, the so-called biopolymers. In a single object one would have all the ingredients for an excellent research project on organic material: First the comb itself that is made of wood (cellulose) on which C14 analysis could be performed. Second, DNA analysis of blood extracted from the guts of the louse (the ‘last supper’ of the louse in question since a louse has to eat every three hours) could be performed, potential revealing the genetic lineage of the unfortunate host. Third, analyses can be done on the chitin of the hair and the karetin (enzyme) of the louse itself. Cemetery One of the most important items to prove communitarian life at the Dead Sea is the Qumran cemetery. According to Flavius Josephus and to Pliny the Elder, the Essenes were celibates. Josephus makes an exception that allows for females too, whereas Philo mentions celibate virgins in Alexandria. The facts are that most of the 51 excavated skeletons, out of a total of 1200, are indeed male and are all in burials that are N-S oriented. Some graves that are located in a small adjacent cemetery are in E-W direction and these were found to contain jewelry (mainly beads) that Joe Zias interpreted as being Bedouin graves [Zias 2002]. In order to link the cemetery with the settlement, we needed datable materials from both that would corroborate one another. Some wood and basketry found in the cemetery of the male graves could be dated by C14 and the date coincided with that of the settlement. However, it is not enough to have a theory in which Bedouin are involved without being able to back it up with hard evidence. So, we have used TL dating on a portable Arabic cooking oven that dated to the 20th century and could be Bedouin [Rasmussen 2003:104]. The conclusion was reached that the cemetery could also have contained Bedouins who were buried according to
191
their tradition, with their head to Jerusalem and their feet to the East, with their heads facing Mecca. Conclusions What started as a sporadic INAA pottery provenance study, entirely disconnected from the scrolls in the caves and finds in the cemetery, has gradually turned into a large project linking the study of Qumran with its people, its material culture and the scrolls. The next step will be to let the ‘scroll-people’, expert in the exegesis of the texts, take advantage of the information that archaeology and science have provided. It is our opinion that new objective scientific information may permit the re-interpretation of the texts. More research is needed to shed further light on Qumran’s culture. Nuclear reactors and Synchrotron Radiation facilities, as well as a gamma of other techniques may well be the means by which this is achieved. References
• Abraham, D. H. and Edelstein, S. M. 1963. ‘A Study of the Textiles from the Color Standpoint.’ In Yadin, Y. The Finds from the Bar Kokhba Period in the Cave of the Letters. Judean Desert Series 1; Jerusalem, Israel Exploration Society, 1963. p270–279.
• Balla, M. 2005. PhD Dissertation published on the Internet under http://dept.phy.bme.hu/phd/dissertations/Balla_disszertacio.pdf
• Belis, M. 2003. ‘Des textiles, catalogues et commentaries’ In Qumran and ‘Ain Feshkha, II, Humbert, J-B. and Gunneweg, J. (Eds.). 207-277. Goettingen: Academic Press Fribourg, Vandenhoeck & Ruprecht.
• Bonani, G. et al., ‘Radiocarbon Dating of Fourteen Dead Sea Scrolls,’ Radiocarbon 34 (1992) 843-849.
• De Vaux, R. 1973. Archaeology and the Dead Sea Scrolls (Schweich Lectures 1959), London, British Academy.
• Golb, N. 1990, ‘Khirbet Qumran and the Manuscripts of the Judaean Wilderness: Observations in the Logic of their Investigation’, /JNES,/ 49, p.103-115
• Gunneweg, J. Perlman, I. and Asaro, F. 1994. ‘ Interregional contacts between Tell en-Nasbeh and littoral Philistine centres in Canaan during Early Iron Age I’, Archaeometry 36: 227-239
• Gunneweg, J. and Balla, M. 2003. ‘Neutron Activation Analysis: Scroll jars and Common ware’, In Qumran and ‘Ain Feshkha, II, Humbert, J-B. and Gunneweg, J. (Eds.). 3-57. Goettingen: Academic Press Fribourg, Vandenhoeck & Ruprecht.
• Gunneweg, J. Wouters, J. and Balla, M. 2005. Qumran and the Dead Sea scrolls: a jigsaw puzzle, in: Benefits of Non-destructive Analytical Techniques for Conservation, COST Action G8 workshop, Chapter. 17 A. Adriaens, C. Degrigny and J. Cassar (Eds). Kalkara, Malta, p. 111-122.
• Humbert, J-B. and Gunneweg, J. 2003. Archaeological Excavations at Khirbet Qumran and Ain Feshka - Studies in Archaeometry and Anthropology, volume II, Presses Universitaires de Fribourg (Suisse), Fribourg.
• Kahila Bar-Gal, G., Greenblatt, Ch., Woodward, S.R., Broshi, M. and Smith. P. 2001. ‘The Genetic Signature of the Dead Sea Scrolls.’ In Historical Perspectives: From the Hasmoneans to Bar Kokhba in Light of the Dead Sea Scrolls: Proceedings of the Fourth International Symposium of the Orion Center for the Study of the Dead Sea Scrolls and Associated Literature, 27-31
192
January 1999, eds. David Goodblatt, Avital Pinnick, and Daniel R. Schwartz, 165-71. STDJ 37. Leiden: Brill
• Libby, W. F. 1951. ‘Radiocarbon Dates II,’ Science 114 p. 291-296. • Molnar, Zs, Keoemley, G. Bodizs, D. & Lengyel, Z. 1993. Application of
Neutron Activation Analysis in the Institute of Nuclear techniques of the Technical University of Budapest, in Periodica Polytechnica Series Physics, Vol.I, No. 1, pp. 45-64
• Mommsen, H., Kreuser, A. and Weber, J. 1988. A method for grouping Pottery by Chemical Composition, Archaeometry 30:47-57
• Mumcuoglu, K. Y. Poster entitled: ‘Human lice from mummies and archaeological remains’, Proceedings of Qumran Meeting Working group 7 of Cost G8, Jerusalem
• Mueller, M., Papiz, M.Z., Clarke, D.T., Roberts, M.A., Murphy, B.M., Burghammer, M., Riekel, C., Pantos, E. and Gunneweg, J. 2003. ‘Identification of the textiles Using Microscopy and Synchrotron Radiation X-Ray Fibre Diffraction’, In Qumran and ‘Ain Feshkha, II, Humbert, J-B. and Gunneweg, J. (Eds.). 277-286. Goettingen: Academic Press Fribourg, Vandenhoeck & Ruprecht.
• Müller,M., Papiz, M.Z., Clarke, D.T., Roberts, M.A., Murphy, B.M., Burghammer, M., Riekel,C., Pantos E. and Gunneweg, J. 2004. Identification of ancient textile fibres from Khirbet Qumran caves using synchrotron radiation microbeam diffraction, Spectrochim. Acta B, 59(10-11): 1669-1674
• Nir-El, Y. and Broshi, M. 1996. ‘The Black Ink of the Qumran Scrolls.’ DSD 3/2: 157-167.
• Nir-El, Y. and Broshi, M. 1996. ‘The Red Ink of the Dead Sea Scrolls.’ Archaeometry 38/1: 97-102.
• Perlman, I. and Asaro, F. 1969. Neutron Activation and Pottery Analysis, Archaeometry 11: 21-52
• Poole, J.B. and Reed, R. 1962. ‘The Preparation of Leather and Parchment by the Dead Sea Scrolls Community.’ Technology and Culture 3
• Rasmussen, K.L. 2003. On the Provenance and the Firing Temperature of Pottery, In Qumran and ‘Ain Feshkha, II, Humbert, J-B. and Gunneweg, J. (Eds). p3-57. Goettingen: Academic Press Fribourg, Vandenhoeck & Ruprecht, pp. 101-104.
• Sellers, O. R. 1951. ‘Date of Cloth from the ‘Ayn Feshka cave,’ Biblical Archaeologist 14: 29.
• Sheridan, Susan Guise, Ullinger, J., and Ramp, J. 2003. ‘Anthropological Analysis of the Human Remains: The French Collection,’ in J.-B. Humbert and J. Gunneweg, eds., Khirbet Qumrân et '‘Ain Feshkha: Etudes d'anthropologie, de physique et de chimie. NTOA II; Fribourg and Goettingen: Vandenhoeck and Rupert, 2003. 129-169.
• Tov, E. and Abegg, M.G. 2002. The texts from the Judaean Desert : Indices and an Introduction to the Discoveries in the Judaean Desert, Discoveries in the Judaean Desert ; 39 Oxford : Clarendon Press, 2002.
• Van der Plicht, J., Rasmussen, K.L., Glastrup, J., Taylor, J.E. and Doudna, G. 2003. ‘Radiocarbon datings of material from the excavation’, In Khirbet Qumran and ‘Ain Feshkha, II, Humbert, J-B. and Gunneweg, J. (Eds.). Goettingen: Academic Press Fribourg, Vandenhoeck & Ruprecht, 193-200.
• Zias, J. E. 2002. ‘The Cemeteries of Qumran and Celibacy: Confusion Laid To Rest?’ Dead Sea Discoveries 7/2: 220-253.
193


Training Schools

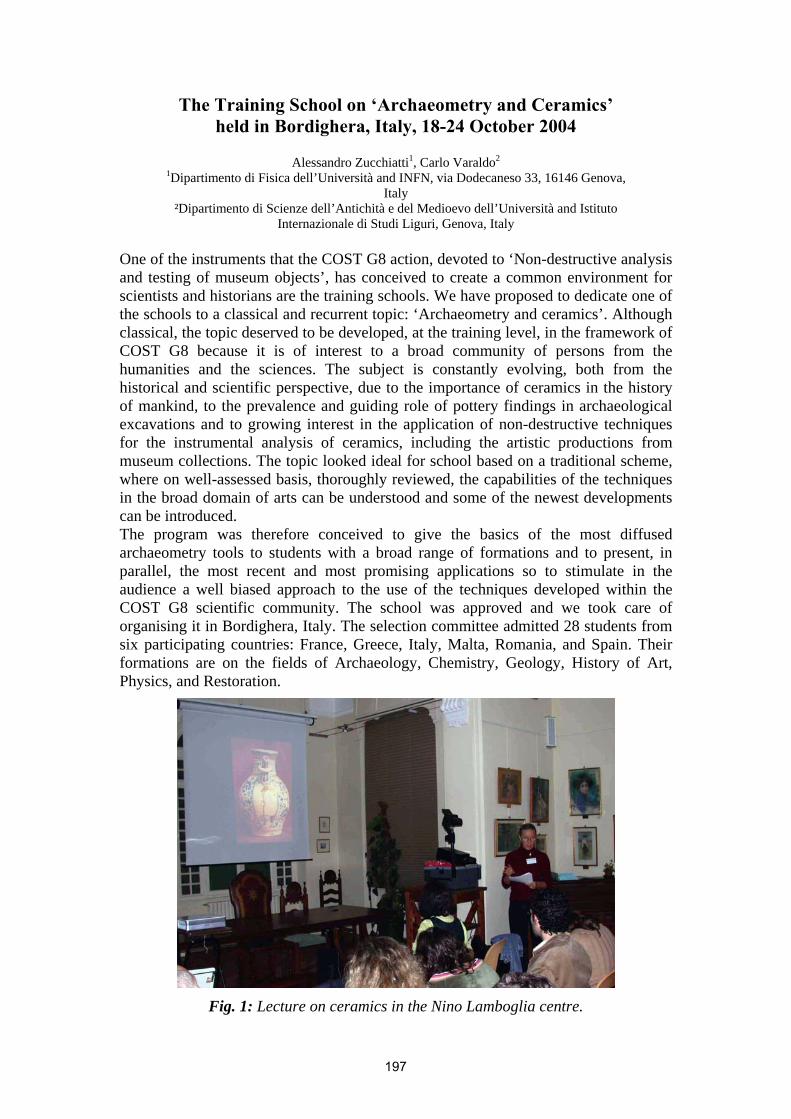
The Training School on ‘Archaeometry and Ceramics’ held in Bordighera, Italy, 18-24 October 2004
Alessandro Zucchiatti1, Carlo Varaldo2
1Dipartimento di Fisica dell’Università and INFN, via Dodecaneso 33, 16146 Genova, Italy
²Dipartimento di Scienze dell’Antichità e del Medioevo dell’Università and Istituto Internazionale di Studi Liguri, Genova, Italy
One of the instruments that the COST G8 action, devoted to ‘Non-destructive analysis and testing of museum objects’, has conceived to create a common environment for scientists and historians are the training schools. We have proposed to dedicate one of the schools to a classical and recurrent topic: ‘Archaeometry and ceramics’. Although classical, the topic deserved to be developed, at the training level, in the framework of COST G8 because it is of interest to a broad community of persons from the humanities and the sciences. The subject is constantly evolving, both from the historical and scientific perspective, due to the importance of ceramics in the history of mankind, to the prevalence and guiding role of pottery findings in archaeological excavations and to growing interest in the application of non-destructive techniques for the instrumental analysis of ceramics, including the artistic productions from museum collections. The topic looked ideal for school based on a traditional scheme, where on well-assessed basis, thoroughly reviewed, the capabilities of the techniques in the broad domain of arts can be understood and some of the newest developments can be introduced. The program was therefore conceived to give the basics of the most diffused archaeometry tools to students with a broad range of formations and to present, in parallel, the most recent and most promising applications so to stimulate in the audience a well biased approach to the use of the techniques developed within the COST G8 scientific community. The school was approved and we took care of organising it in Bordighera, Italy. The selection committee admitted 28 students from six participating countries: France, Greece, Italy, Malta, Romania, and Spain. Their formations are on the fields of Archaeology, Chemistry, Geology, History of Art, Physics, and Restoration.
Fig. 1: Lecture on ceramics in the Nino Lamboglia centre.
197
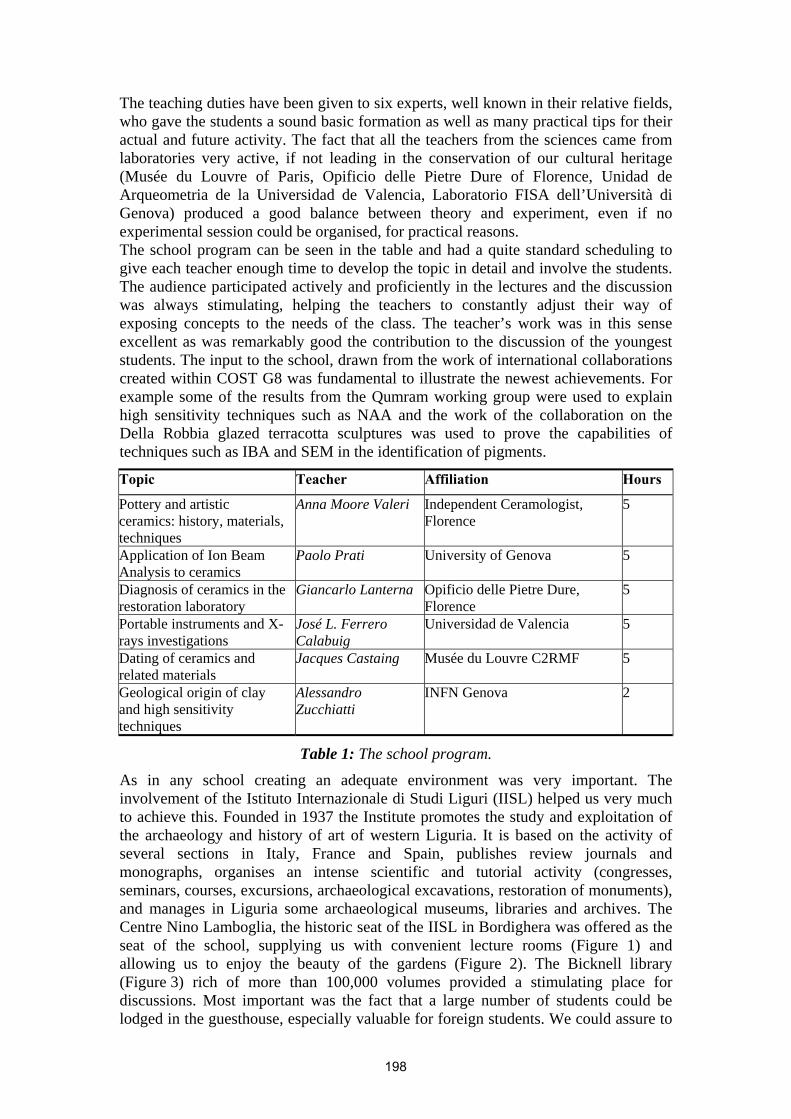
The teaching duties have been given to six experts, well known in their relative fields, who gave the students a sound basic formation as well as many practical tips for their actual and future activity. The fact that all the teachers from the sciences came from laboratories very active, if not leading in the conservation of our cultural heritage (Musée du Louvre of Paris, Opificio delle Pietre Dure of Florence, Unidad de Arqueometria de la Universidad de Valencia, Laboratorio FISA dell’Università di Genova) produced a good balance between theory and experiment, even if no experimental session could be organised, for practical reasons. The school program can be seen in the table and had a quite standard scheduling to give each teacher enough time to develop the topic in detail and involve the students. The audience participated actively and proficiently in the lectures and the discussion was always stimulating, helping the teachers to constantly adjust their way of exposing concepts to the needs of the class. The teacher’s work was in this sense excellent as was remarkably good the contribution to the discussion of the youngest students. The input to the school, drawn from the work of international collaborations created within COST G8 was fundamental to illustrate the newest achievements. For example some of the results from the Qumram working group were used to explain high sensitivity techniques such as NAA and the work of the collaboration on the Della Robbia glazed terracotta sculptures was used to prove the capabilities of techniques such as IBA and SEM in the identification of pigments.
Topic Teacher Affiliation Hours
Pottery and artistic ceramics: history, materials, techniques
Anna Moore Valeri Independent Ceramologist, Florence
5
Application of Ion Beam Analysis to ceramics
Paolo Prati University of Genova 5
Diagnosis of ceramics in the restoration laboratory
Giancarlo Lanterna Opificio delle Pietre Dure, Florence
5
Portable instruments and X-rays investigations
José L. Ferrero Calabuig
Universidad de Valencia 5
Dating of ceramics and related materials
Jacques Castaing Musée du Louvre C2RMF 5
Geological origin of clay and high sensitivity techniques
Alessandro Zucchiatti
INFN Genova 2
Table 1: The school program. As in any school creating an adequate environment was very important. The involvement of the Istituto Internazionale di Studi Liguri (IISL) helped us very much to achieve this. Founded in 1937 the Institute promotes the study and exploitation of the archaeology and history of art of western Liguria. It is based on the activity of several sections in Italy, France and Spain, publishes review journals and monographs, organises an intense scientific and tutorial activity (congresses, seminars, courses, excursions, archaeological excavations, restoration of monuments), and manages in Liguria some archaeological museums, libraries and archives. The Centre Nino Lamboglia, the historic seat of the IISL in Bordighera was offered as the seat of the school, supplying us with convenient lecture rooms (Figure 1) and allowing us to enjoy the beauty of the gardens (Figure 2). The Bicknell library (Figure 3) rich of more than 100,000 volumes provided a stimulating place for discussions. Most important was the fact that a large number of students could be lodged in the guesthouse, especially valuable for foreign students. We could assure to
198
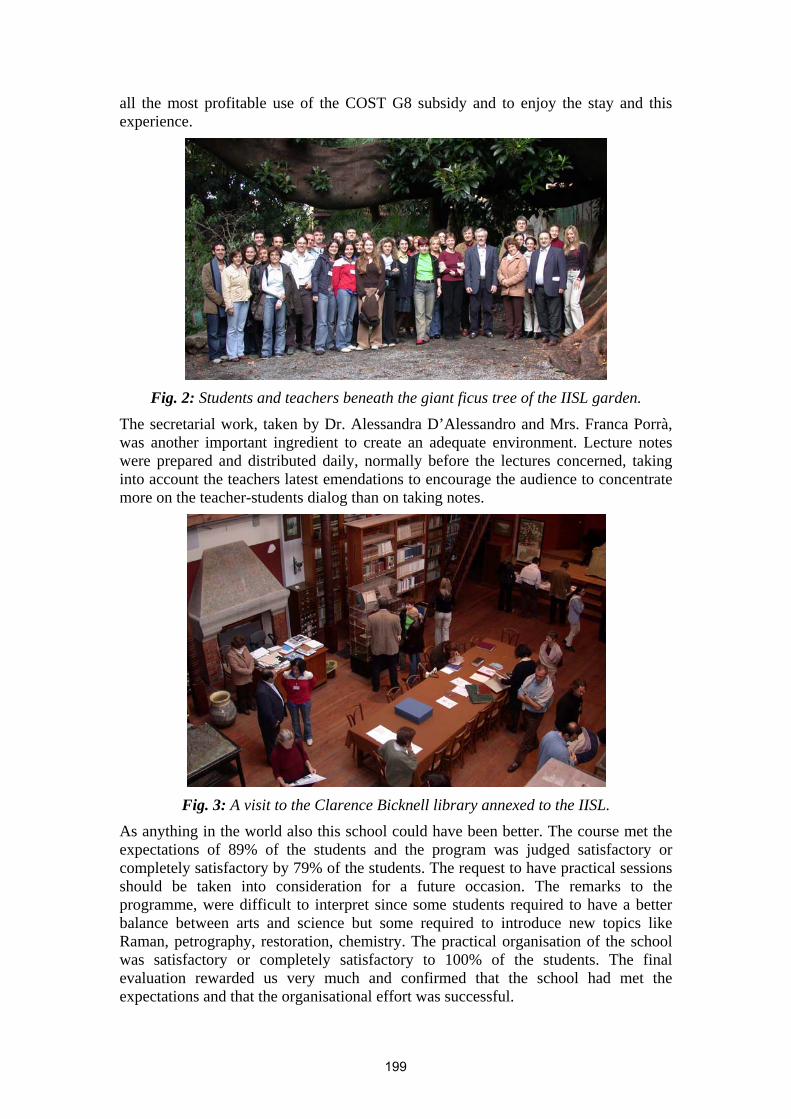
all the most profitable use of the COST G8 subsidy and to enjoy the stay and this experience.
Fig. 2: Students and teachers beneath the giant ficus tree of the IISL garden.
The secretarial work, taken by Dr. Alessandra D’Alessandro and Mrs. Franca Porrà, was another important ingredient to create an adequate environment. Lecture notes were prepared and distributed daily, normally before the lectures concerned, taking into account the teachers latest emendations to encourage the audience to concentrate more on the teacher-students dialog than on taking notes.
Fig. 3: A visit to the Clarence Bicknell library annexed to the IISL.
As anything in the world also this school could have been better. The course met the expectations of 89% of the students and the program was judged satisfactory or completely satisfactory by 79% of the students. The request to have practical sessions should be taken into consideration for a future occasion. The remarks to the programme, were difficult to interpret since some students required to have a better balance between arts and science but some required to introduce new topics like Raman, petrography, restoration, chemistry. The practical organisation of the school was satisfactory or completely satisfactory to 100% of the students. The final evaluation rewarded us very much and confirmed that the school had met the expectations and that the organisational effort was successful.
199
COST G8 Training School in Malta: Innovative tools for exhibition purposes: environmental and damage assessment
Christian Degrigny, Heritage Malta – Conservation Division, Diagnostic Science Laboratories, Kalkara,
Malta & COST Action G8 Maltese delegate / coordinator of WG3 Clara von Waldthausen, Fotorestauratie Atelier C.C. von Waldthausen, Amsterdam, The Netherlands &
assistant coordinator of WG3 Abstract Dosimeters, used to monitor the museum environment and to understand the deterioration of museum objects, are increasingly being employed in conservation, especially in the implementation and planning of preventive conservation policies. Other similar systems such as environmental sensors and early warning systems (EWS) have been designed or are being developed to give a quick, reliable indication of environmental parameters such as relative humidity, temperature, visible light, ultra-violet, etc. in the museum environment. The aims of this advanced course were to raise awareness amongst museum professionals of the effect of the environment on museum objects and to introduce them to some of the latest tools available to monitor environmental parameters. The possibilities, use and interpretation of results of various dosimeters were discussed during theoretical and practical sessions. Special emphasis was placed on light dosimeters. Another aspect of the workshop was to promote dialogue and exchange of experience between conservation professionals from various disciplines and world-class specialists in the field who are either delegates of COST Action G8 or coordinators / partners of EU funded projects.
Keywords: Early warning system (EWS), monitoring, deterioration, preventive conservation, WG3, EU projects
Objectives of the Training School The Training School was designed by Working Group 3 (WG3) of COST Action G8. WG3 attempts to integrate all topics related to the use of non-destructive analytical techniques to study degradation processes, corrosion and weathering. The theme proposed by the organisers for this training school was considered as a priority during the WG3 meeting held in Wertheim-Bronnbach in February 2004 (for more information visit the COST Action G8 website). The participants attending the meeting agreed indeed that it would be essential not only to list the different non-destructive techniques used to study the deterioration of museum objects but those too that could help understanding how the artefacts become damaged with time. These monitoring devices are either called dosimeters, sensors or early warning systems (EWS). They have been developed as a tool for conservation professionals and are essential in accompanying non-destructive diagnosis of artefacts. For that reason they should promote dialogue and an exchange of experience between conservation professionals from various disciplines and experts from COST Action G8. The 5-day advanced course scheduled between the 29th of October and the 03rd of November 2004 introduced conservation professionals to some of the latest tools developed with EU funds. Seven European projects on the monitoring of environmental conditions of museum exhibition spaces were presented by partners of these European projects or by the coordinators of the projects themselves. Some projects have been
200
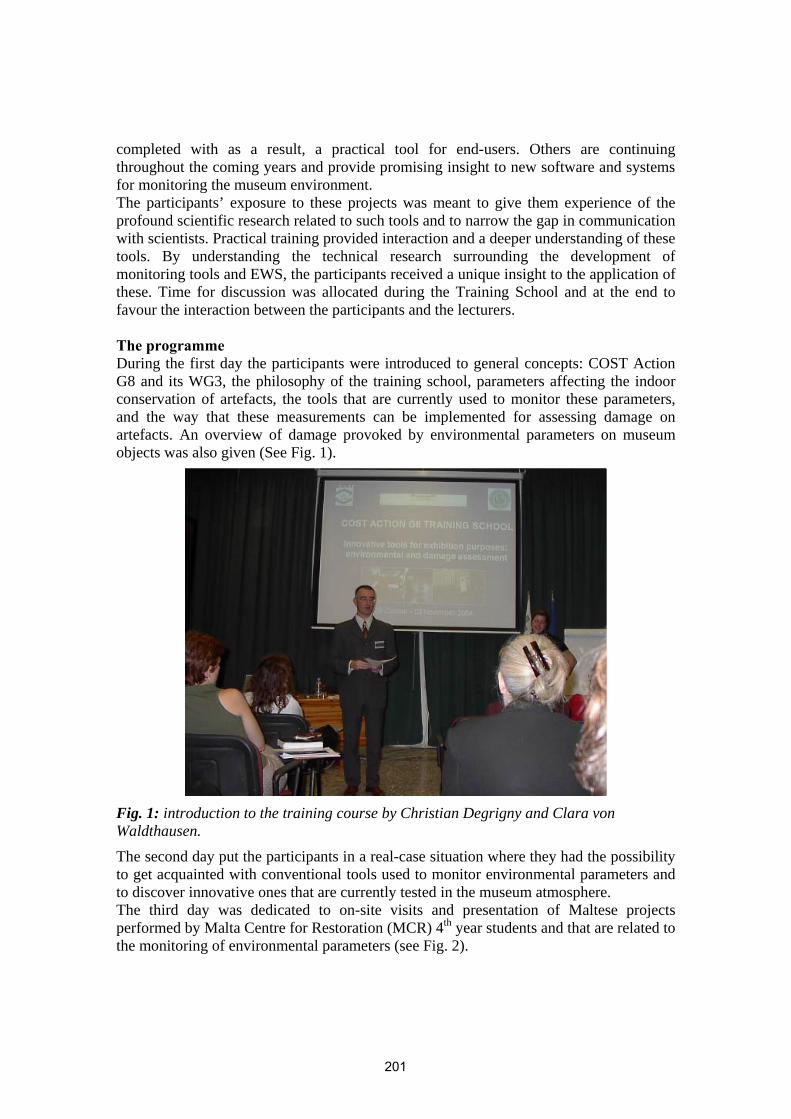
completed with as a result, a practical tool for end-users. Others are continuing throughout the coming years and provide promising insight to new software and systems for monitoring the museum environment. The participants’ exposure to these projects was meant to give them experience of the profound scientific research related to such tools and to narrow the gap in communication with scientists. Practical training provided interaction and a deeper understanding of these tools. By understanding the technical research surrounding the development of monitoring tools and EWS, the participants received a unique insight to the application of these. Time for discussion was allocated during the Training School and at the end to favour the interaction between the participants and the lecturers. The programme During the first day the participants were introduced to general concepts: COST Action G8 and its WG3, the philosophy of the training school, parameters affecting the indoor conservation of artefacts, the tools that are currently used to monitor these parameters, and the way that these measurements can be implemented for assessing damage on artefacts. An overview of damage provoked by environmental parameters on museum objects was also given (See Fig. 1).
Fig. 1: introduction to the training course by Christian Degrigny and Clara von Waldthausen.
The second day put the participants in a real-case situation where they had the possibility to get acquainted with conventional tools used to monitor environmental parameters and to discover innovative ones that are currently tested in the museum atmosphere. The third day was dedicated to on-site visits and presentation of Maltese projects performed by Malta Centre for Restoration (MCR) 4th year students and that are related to the monitoring of environmental parameters (see Fig. 2).
201
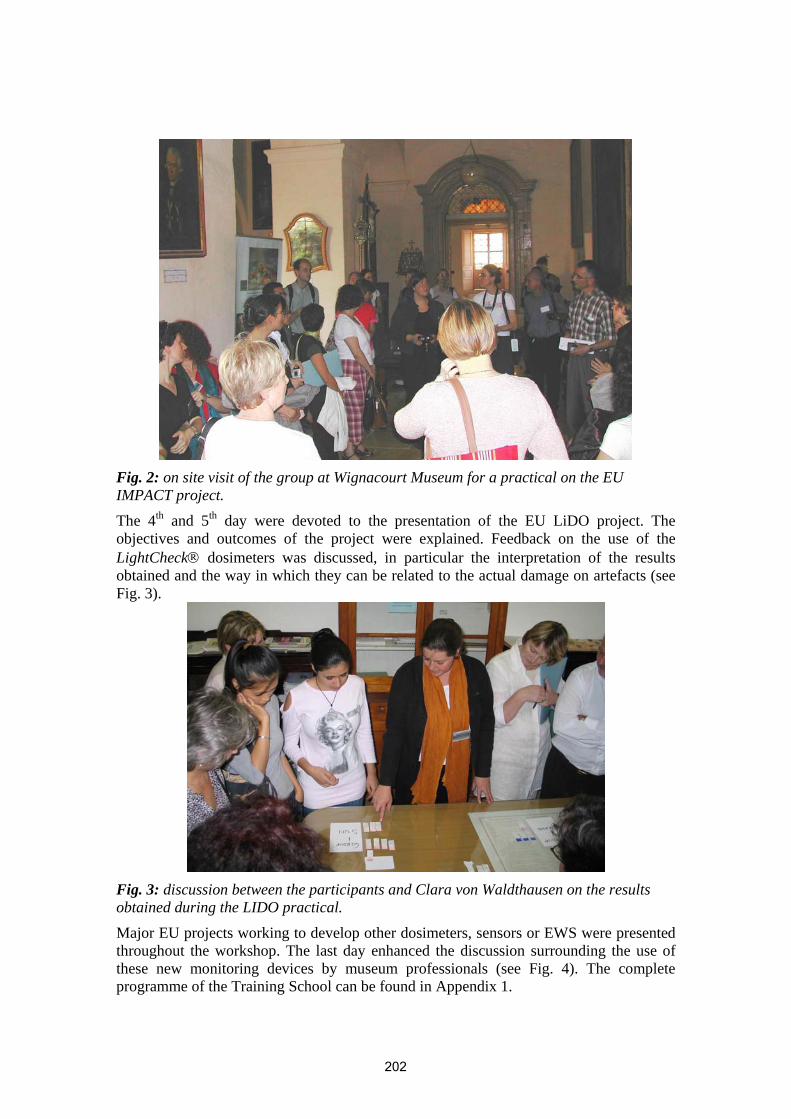
Fig. 2: on site visit of the group at Wignacourt Museum for a practical on the EU IMPACT project.
The 4th and 5th day were devoted to the presentation of the EU LiDO project. The objectives and outcomes of the project were explained. Feedback on the use of the LightCheck® dosimeters was discussed, in particular the interpretation of the results obtained and the way in which they can be related to the actual damage on artefacts (see Fig. 3).
Fig. 3: discussion between the participants and Clara von Waldthausen on the results obtained during the LIDO practical.
Major EU projects working to develop other dosimeters, sensors or EWS were presented throughout the workshop. The last day enhanced the discussion surrounding the use of these new monitoring devices by museum professionals (see Fig. 4). The complete programme of the Training School can be found in Appendix 1.
202
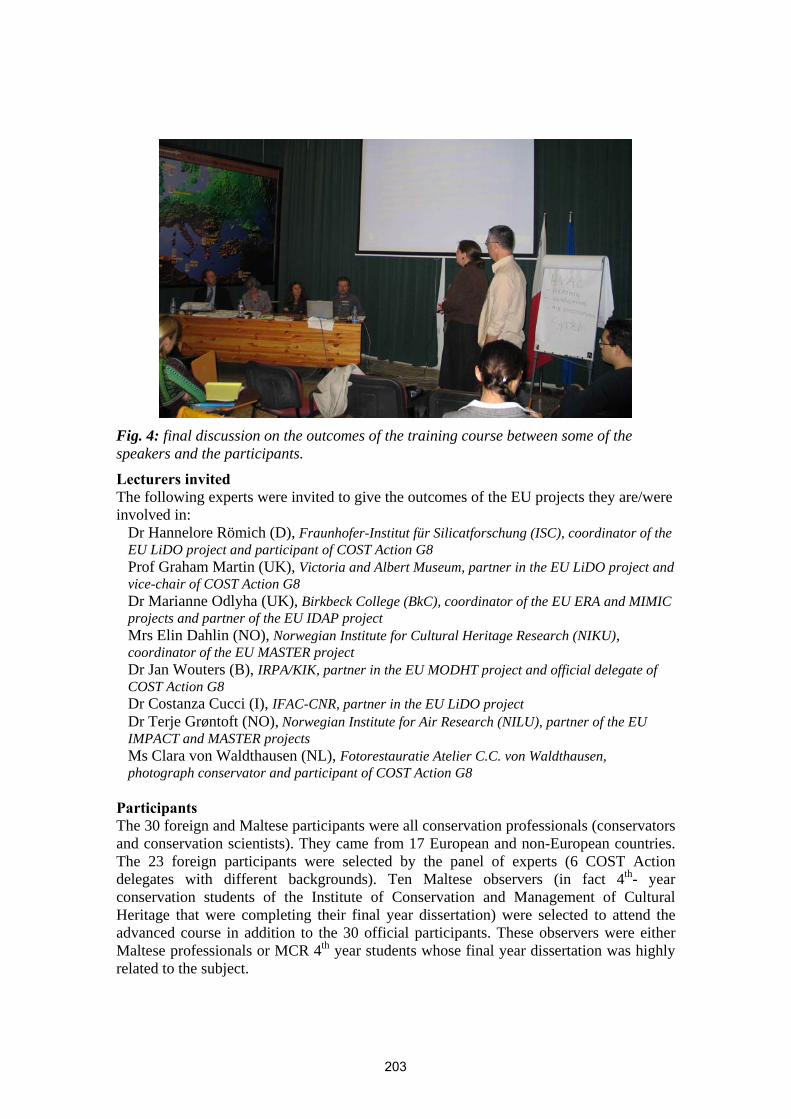
Fig. 4: final discussion on the outcomes of the training course between some of the speakers and the participants.
Lecturers invited The following experts were invited to give the outcomes of the EU projects they are/were involved in:
Dr Hannelore Römich (D), Fraunhofer-Institut für Silicatforschung (ISC), coordinator of the EU LiDO project and participant of COST Action G8 Prof Graham Martin (UK), Victoria and Albert Museum, partner in the EU LiDO project and vice-chair of COST Action G8 Dr Marianne Odlyha (UK), Birkbeck College (BkC), coordinator of the EU ERA and MIMIC projects and partner of the EU IDAP project Mrs Elin Dahlin (NO), Norwegian Institute for Cultural Heritage Research (NIKU), coordinator of the EU MASTER project Dr Jan Wouters (B), IRPA/KIK, partner in the EU MODHT project and official delegate of COST Action G8 Dr Costanza Cucci (I), IFAC-CNR, partner in the EU LiDO project Dr Terje Grøntoft (NO), Norwegian Institute for Air Research (NILU), partner of the EU IMPACT and MASTER projects Ms Clara von Waldthausen (NL), Fotorestauratie Atelier C.C. von Waldthausen, photograph conservator and participant of COST Action G8
Participants The 30 foreign and Maltese participants were all conservation professionals (conservators and conservation scientists). They came from 17 European and non-European countries. The 23 foreign participants were selected by the panel of experts (6 COST Action delegates with different backgrounds). Ten Maltese observers (in fact 4th- year conservation students of the Institute of Conservation and Management of Cultural Heritage that were completing their final year dissertation) were selected to attend the advanced course in addition to the 30 official participants. These observers were either Maltese professionals or MCR 4th year students whose final year dissertation was highly related to the subject.
203
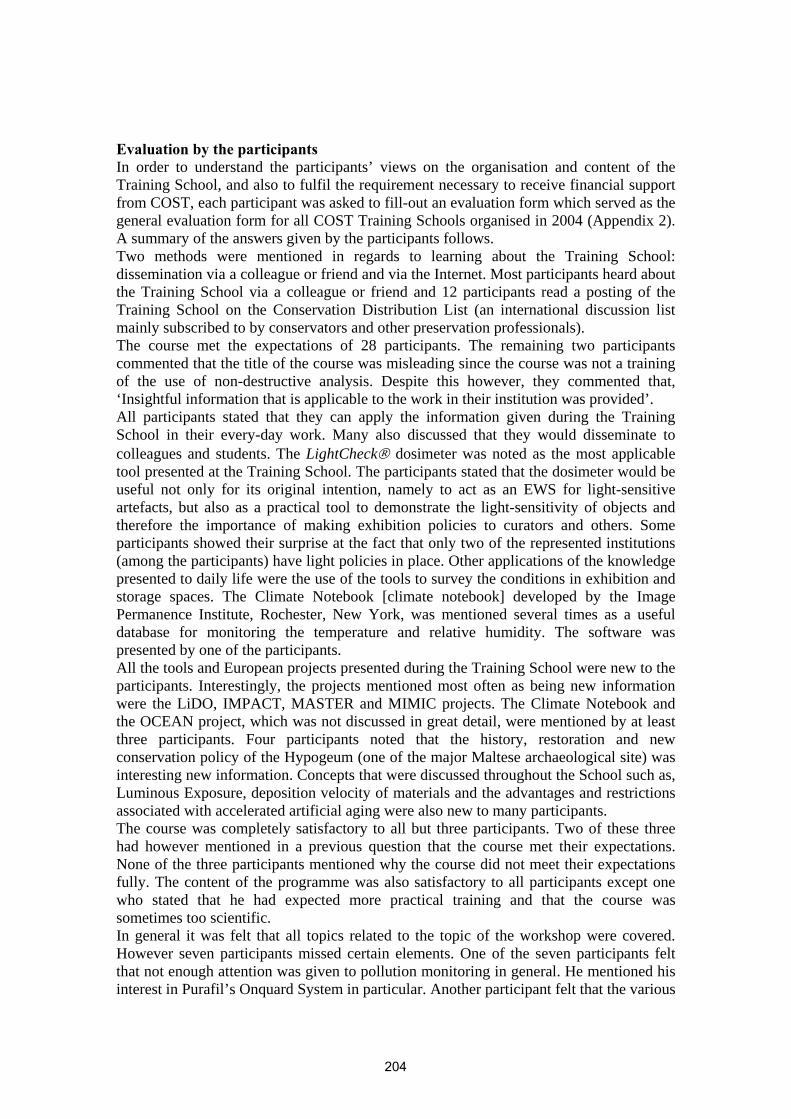
Evaluation by the participants In order to understand the participants’ views on the organisation and content of the Training School, and also to fulfil the requirement necessary to receive financial support from COST, each participant was asked to fill-out an evaluation form which served as the general evaluation form for all COST Training Schools organised in 2004 (Appendix 2). A summary of the answers given by the participants follows. Two methods were mentioned in regards to learning about the Training School: dissemination via a colleague or friend and via the Internet. Most participants heard about the Training School via a colleague or friend and 12 participants read a posting of the Training School on the Conservation Distribution List (an international discussion list mainly subscribed to by conservators and other preservation professionals). The course met the expectations of 28 participants. The remaining two participants commented that the title of the course was misleading since the course was not a training of the use of non-destructive analysis. Despite this however, they commented that, ‘Insightful information that is applicable to the work in their institution was provided’. All participants stated that they can apply the information given during the Training School in their every-day work. Many also discussed that they would disseminate to colleagues and students. The LightCheck® dosimeter was noted as the most applicable tool presented at the Training School. The participants stated that the dosimeter would be useful not only for its original intention, namely to act as an EWS for light-sensitive artefacts, but also as a practical tool to demonstrate the light-sensitivity of objects and therefore the importance of making exhibition policies to curators and others. Some participants showed their surprise at the fact that only two of the represented institutions (among the participants) have light policies in place. Other applications of the knowledge presented to daily life were the use of the tools to survey the conditions in exhibition and storage spaces. The Climate Notebook [climate notebook] developed by the Image Permanence Institute, Rochester, New York, was mentioned several times as a useful database for monitoring the temperature and relative humidity. The software was presented by one of the participants. All the tools and European projects presented during the Training School were new to the participants. Interestingly, the projects mentioned most often as being new information were the LiDO, IMPACT, MASTER and MIMIC projects. The Climate Notebook and the OCEAN project, which was not discussed in great detail, were mentioned by at least three participants. Four participants noted that the history, restoration and new conservation policy of the Hypogeum (one of the major Maltese archaeological site) was interesting new information. Concepts that were discussed throughout the School such as, Luminous Exposure, deposition velocity of materials and the advantages and restrictions associated with accelerated artificial aging were also new to many participants. The course was completely satisfactory to all but three participants. Two of these three had however mentioned in a previous question that the course met their expectations. None of the three participants mentioned why the course did not meet their expectations fully. The content of the programme was also satisfactory to all participants except one who stated that he had expected more practical training and that the course was sometimes too scientific. In general it was felt that all topics related to the topic of the workshop were covered. However seven participants missed certain elements. One of the seven participants felt that not enough attention was given to pollution monitoring in general. He mentioned his interest in Purafil’s Onquard System in particular. Another participant felt that the various
204
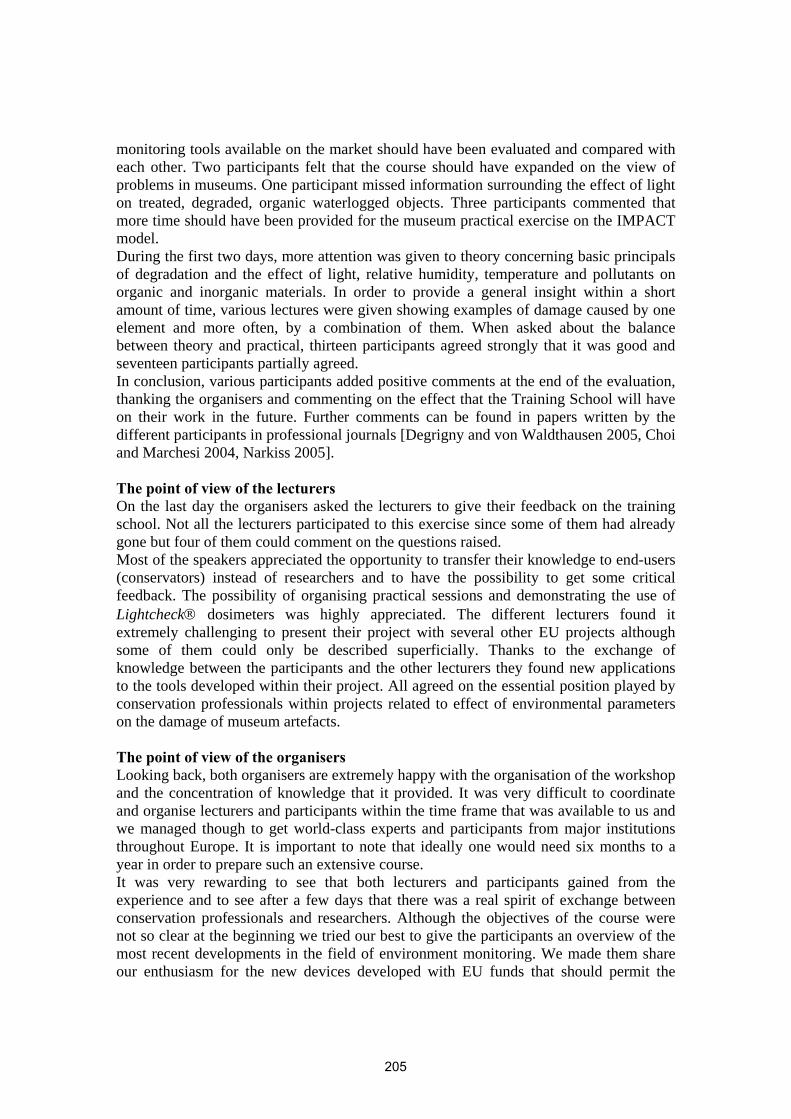
monitoring tools available on the market should have been evaluated and compared with each other. Two participants felt that the course should have expanded on the view of problems in museums. One participant missed information surrounding the effect of light on treated, degraded, organic waterlogged objects. Three participants commented that more time should have been provided for the museum practical exercise on the IMPACT model. During the first two days, more attention was given to theory concerning basic principals of degradation and the effect of light, relative humidity, temperature and pollutants on organic and inorganic materials. In order to provide a general insight within a short amount of time, various lectures were given showing examples of damage caused by one element and more often, by a combination of them. When asked about the balance between theory and practical, thirteen participants agreed strongly that it was good and seventeen participants partially agreed. In conclusion, various participants added positive comments at the end of the evaluation, thanking the organisers and commenting on the effect that the Training School will have on their work in the future. Further comments can be found in papers written by the different participants in professional journals [Degrigny and von Waldthausen 2005, Choi and Marchesi 2004, Narkiss 2005]. The point of view of the lecturers On the last day the organisers asked the lecturers to give their feedback on the training school. Not all the lecturers participated to this exercise since some of them had already gone but four of them could comment on the questions raised. Most of the speakers appreciated the opportunity to transfer their knowledge to end-users (conservators) instead of researchers and to have the possibility to get some critical feedback. The possibility of organising practical sessions and demonstrating the use of Lightcheck® dosimeters was highly appreciated. The different lecturers found it extremely challenging to present their project with several other EU projects although some of them could only be described superficially. Thanks to the exchange of knowledge between the participants and the other lecturers they found new applications to the tools developed within their project. All agreed on the essential position played by conservation professionals within projects related to effect of environmental parameters on the damage of museum artefacts. The point of view of the organisers Looking back, both organisers are extremely happy with the organisation of the workshop and the concentration of knowledge that it provided. It was very difficult to coordinate and organise lecturers and participants within the time frame that was available to us and we managed though to get world-class experts and participants from major institutions throughout Europe. It is important to note that ideally one would need six months to a year in order to prepare such an extensive course. It was very rewarding to see that both lecturers and participants gained from the experience and to see after a few days that there was a real spirit of exchange between conservation professionals and researchers. Although the objectives of the course were not so clear at the beginning we tried our best to give the participants an overview of the most recent developments in the field of environment monitoring. We made them share our enthusiasm for the new devices developed with EU funds that should permit the
205
conservation professionals to further exchange with researchers performing non-destructive investigation on artworks. The first two days were certainly too concentrated and we think that if the training school were to be given again, we would decrease the amount of lectures and provide the students with a few more practical sessions to strengthen, support and place into context the theory that they receive. This however is something that becomes clear only after evaluating such a workshop. If the lecturers had had a day prior to the training school to organise practicals with each other and in the spaces available, the time available for the practicals may have sufficed. Onsite preparation time was definitely not available. We tend to agree with some participants that some lectures were very technical and scientific but we believe that the participants had ample occasion to ask questions and discuss problems that they found confusing. Furthermore they realised through these theoretical lectures that the development of a simple monitoring tool requires thorough research behind. Perhaps it would help if the workshop is organised again to provide the general context and aims of the lecture prior to giving it so that the more technical and scientific parts of the lectures can be followed. Further perspectives and conclusion All participants showed some interest in continuing to exchange ideas and knowledge after this training school by forming a sub-Working Group within WG3. The organisers were asked to keep this new sub-Working Group active. Christian Degrigny proposed the different participants to join the Special Interest Group under COST Action G8. In addition, they were given a task: This was to test the Lightcheck® dosimeters offered to them during the advanced course on a site of their choice. The different case studies have been performed since and compiled together with a critical review on the results obtained in the CD of the training school that is available from the COST Office [Younger 2005]. Acknowledgment The organisers would like to thank the COST Office and COST Action G8 without which this training school would not have been possible. References
• Degrigny, C. and von Waldthausen, C. 2005. Innovative tools for exhibition purposes: environmental and damage assessment, CD of the training school, produced by the COST Office.
• Choi, Y. and Marchesi, M. 2004. ‘Innovative tools for exhibition purposes: environmental and damage assessment – Course review’. Paper Conservator News, 112, 12-13.
• Narkiss, I. 2005. ‘Innovative tools for exhibition purposes: environmental and damage assessment’. Conservation News, 17-19.
• [climate notebook] www.climatenotebook.org/Tfp/Software/Software_CNB.html • Younger, S. 2005. ‘Innovative tools for exhibition purposes: environmental and
damage assessment – Report’, SSCR Journal, 16, 1.
206
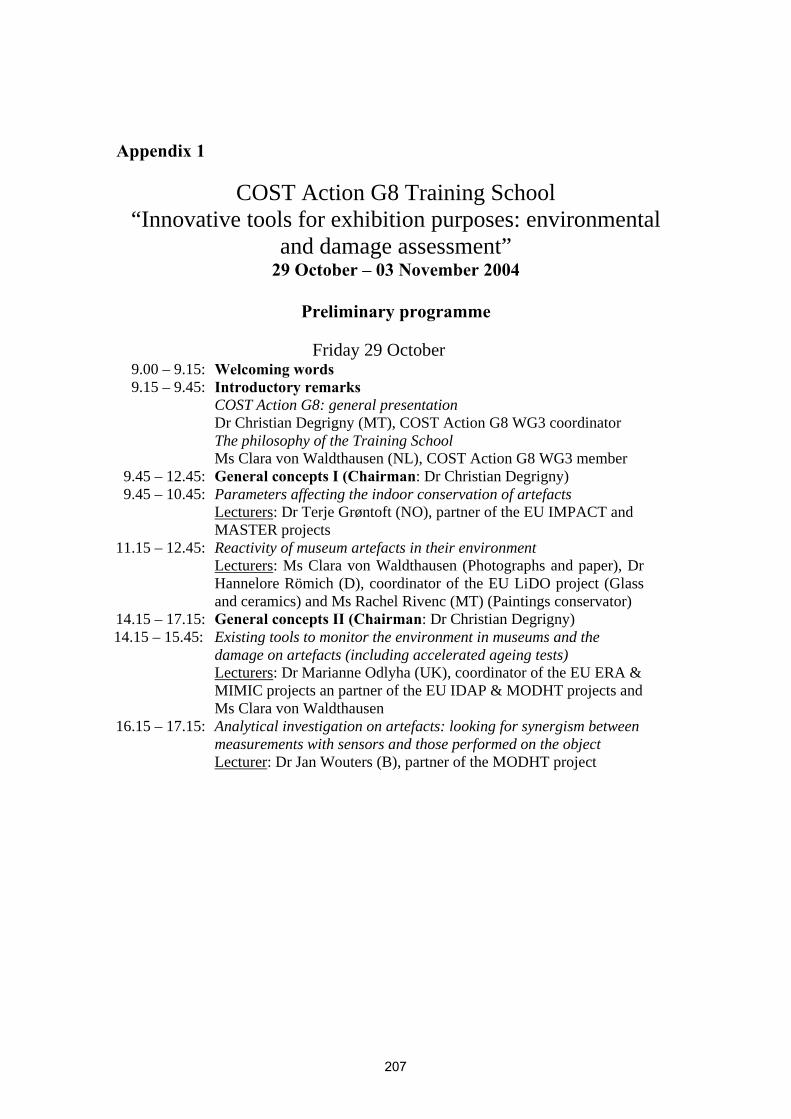
Appendix 1
COST Action G8 Training School “Innovative tools for exhibition purposes: environmental
and damage assessment” 29 October – 03 November 2004
Preliminary programme
Friday 29 October
9.00 – 9.15: Welcoming words 9.15 – 9.45: Introductory remarks
COST Action G8: general presentation Dr Christian Degrigny (MT), COST Action G8 WG3 coordinator The philosophy of the Training School Ms Clara von Waldthausen (NL), COST Action G8 WG3 member
9.45 – 12.45: General concepts I (Chairman: Dr Christian Degrigny) 9.45 – 10.45: Parameters affecting the indoor conservation of artefacts
Lecturers: Dr Terje Grøntoft (NO), partner of the EU IMPACT and MASTER projects
11.15 – 12.45: Reactivity of museum artefacts in their environment Lecturers: Ms Clara von Waldthausen (Photographs and paper), Dr Hannelore Römich (D), coordinator of the EU LiDO project (Glass and ceramics) and Ms Rachel Rivenc (MT) (Paintings conservator)
14.15 – 17.15: General concepts II (Chairman: Dr Christian Degrigny) 14.15 – 15.45: Existing tools to monitor the environment in museums and the
damage on artefacts (including accelerated ageing tests) Lecturers: Dr Marianne Odlyha (UK), coordinator of the EU ERA & MIMIC projects an partner of the EU IDAP & MODHT projects and Ms Clara von Waldthausen
16.15 – 17.15: Analytical investigation on artefacts: looking for synergism between measurements with sensors and those performed on the object Lecturer: Dr Jan Wouters (B), partner of the MODHT project
207
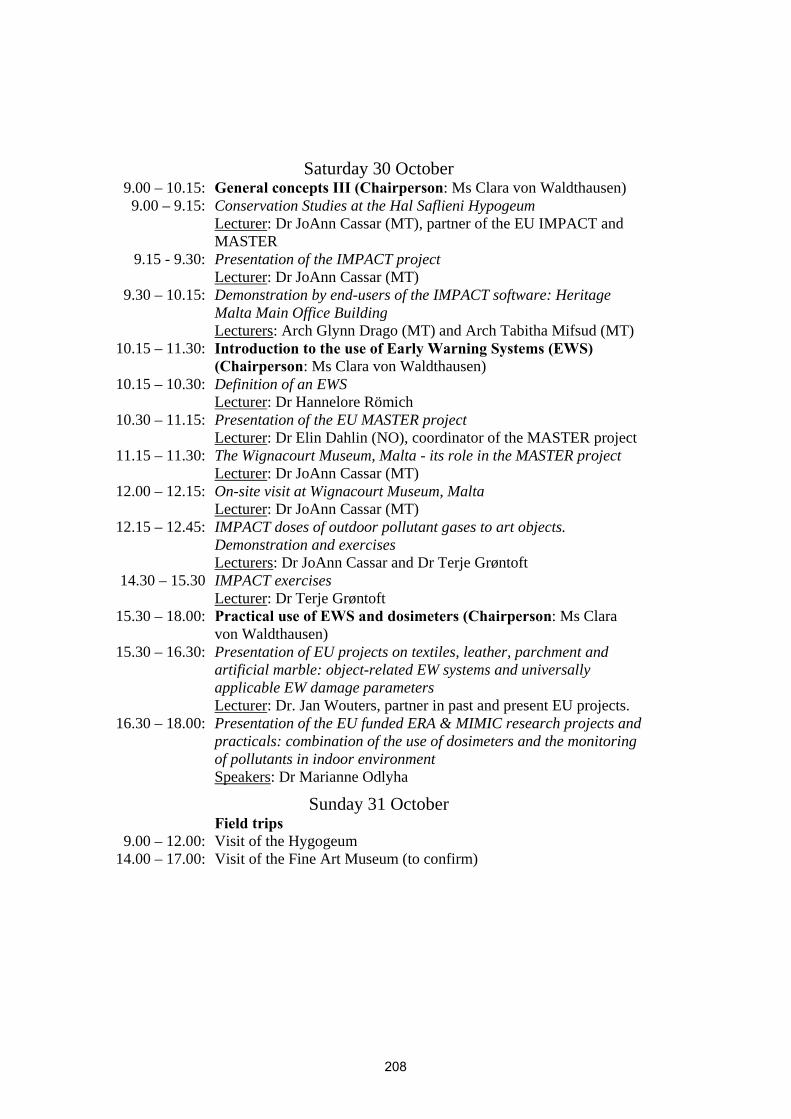
Saturday 30 October
9.00 – 10.15: General concepts III (Chairperson: Ms Clara von Waldthausen) 9.00 – 9.15: Conservation Studies at the Hal Saflieni Hypogeum
Lecturer: Dr JoAnn Cassar (MT), partner of the EU IMPACT and MASTER
9.15 - 9.30: Presentation of the IMPACT project Lecturer: Dr JoAnn Cassar (MT)
9.30 – 10.15: Demonstration by end-users of the IMPACT software: Heritage Malta Main Office Building Lecturers: Arch Glynn Drago (MT) and Arch Tabitha Mifsud (MT)
10.15 – 11.30: Introduction to the use of Early Warning Systems (EWS) (Chairperson: Ms Clara von Waldthausen)
10.15 – 10.30: Definition of an EWS Lecturer: Dr Hannelore Römich
10.30 – 11.15: Presentation of the EU MASTER project Lecturer: Dr Elin Dahlin (NO), coordinator of the MASTER project
11.15 – 11.30: The Wignacourt Museum, Malta - its role in the MASTER project Lecturer: Dr JoAnn Cassar (MT)
12.00 – 12.15: On-site visit at Wignacourt Museum, Malta Lecturer: Dr JoAnn Cassar (MT)
12.15 – 12.45: IMPACT doses of outdoor pollutant gases to art objects. Demonstration and exercises Lecturers: Dr JoAnn Cassar and Dr Terje Grøntoft
14.30 – 15.30 IMPACT exercises Lecturer: Dr Terje Grøntoft
15.30 – 18.00: Practical use of EWS and dosimeters (Chairperson: Ms Clara von Waldthausen)
15.30 – 16.30: Presentation of EU projects on textiles, leather, parchment and artificial marble: object-related EW systems and universally applicable EW damage parameters Lecturer: Dr. Jan Wouters, partner in past and present EU projects.
16.30 – 18.00: Presentation of the EU funded ERA & MIMIC research projects and practicals: combination of the use of dosimeters and the monitoring of pollutants in indoor environment Speakers: Dr Marianne Odlyha
Sunday 31 October Field trips
9.00 – 12.00: Visit of the Hygogeum 14.00 – 17.00: Visit of the Fine Art Museum (to confirm)
208
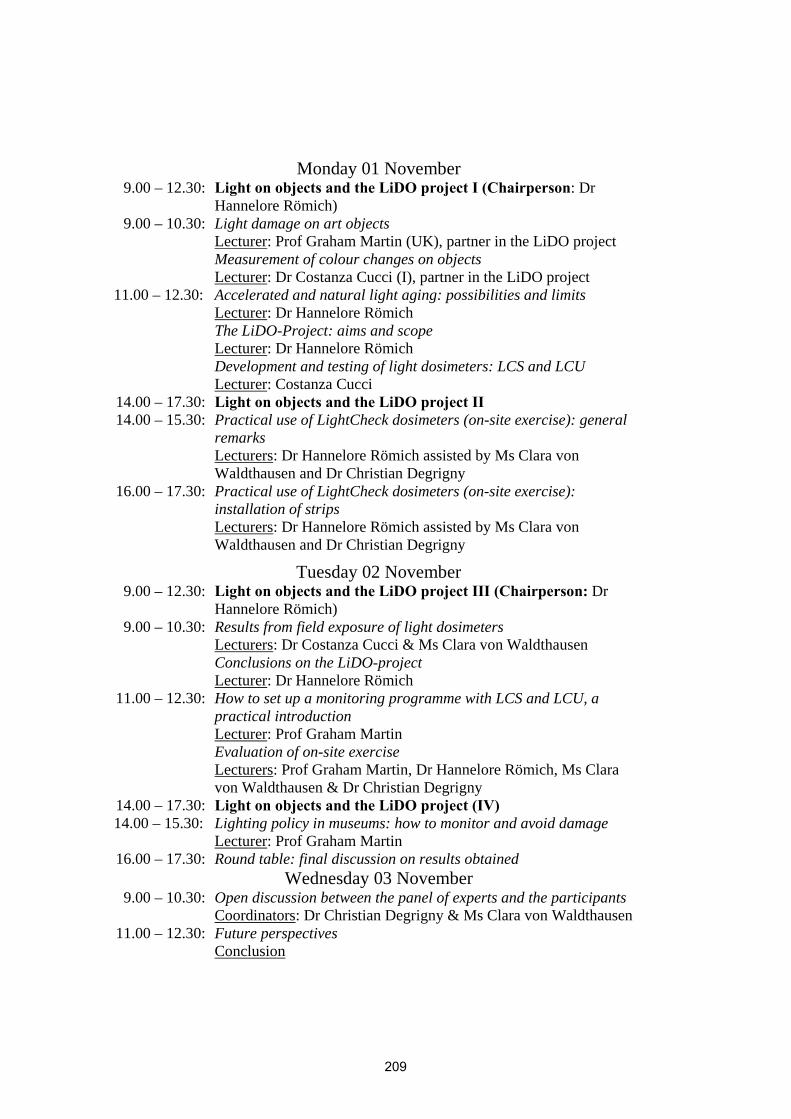
Monday 01 November
9.00 – 12.30: Light on objects and the LiDO project I (Chairperson: Dr Hannelore Römich)
9.00 – 10.30: Light damage on art objects Lecturer: Prof Graham Martin (UK), partner in the LiDO project
Measurement of colour changes on objects Lecturer: Dr Costanza Cucci (I), partner in the LiDO project
11.00 – 12.30: Accelerated and natural light aging: possibilities and limits Lecturer: Dr Hannelore Römich
The LiDO-Project: aims and scope Lecturer: Dr Hannelore Römich
Development and testing of light dosimeters: LCS and LCU Lecturer: Costanza Cucci
14.00 – 17.30: Light on objects and the LiDO project II 14.00 – 15.30: Practical use of LightCheck dosimeters (on-site exercise): general
remarks Lecturers: Dr Hannelore Römich assisted by Ms Clara von Waldthausen and Dr Christian Degrigny
16.00 – 17.30: Practical use of LightCheck dosimeters (on-site exercise): installation of strips Lecturers: Dr Hannelore Römich assisted by Ms Clara von Waldthausen and Dr Christian Degrigny
Tuesday 02 November 9.00 – 12.30: Light on objects and the LiDO project III (Chairperson: Dr
Hannelore Römich) 9.00 – 10.30: Results from field exposure of light dosimeters
Lecturers: Dr Costanza Cucci & Ms Clara von Waldthausen Conclusions on the LiDO-project
Lecturer: Dr Hannelore Römich 11.00 – 12.30: How to set up a monitoring programme with LCS and LCU, a
practical introduction Lecturer: Prof Graham Martin
Evaluation of on-site exercise Lecturers: Prof Graham Martin, Dr Hannelore Römich, Ms Clara von Waldthausen & Dr Christian Degrigny
14.00 – 17.30: Light on objects and the LiDO project (IV) 14.00 – 15.30: Lighting policy in museums: how to monitor and avoid damage
Lecturer: Prof Graham Martin 16.00 – 17.30: Round table: final discussion on results obtained
Wednesday 03 November 9.00 – 10.30: Open discussion between the panel of experts and the participants
Coordinators: Dr Christian Degrigny & Ms Clara von Waldthausen 11.00 – 12.30: Future perspectives
Conclusion
209

Appendix 2
COST G8
Training Schools
Evaluation form Family Name: First Name: Institution: Country:
_______________________________________________________ Please return this survey to the local organizer.
1. How did you learn about the training school? o colleague / friend o flyer o internet o other
2. Did the course meet your expectations? o yes o no
3. If not, why not?
4. Can the information learned in this course be used in your every-day work? o yes o no
5. If yes, please give an example.
6. Which information was new to you? Please list examples
7. The course met my expectations very well. o agree strongly o agree somewhat o disagree somewhat o disagree strongly
210

8. The content of the program was completely satisfactory. o agree strongly o agree somewhat o disagree somewhat o disagree strongly
9. There were several topics not covered. o yes o no
10. If yes, which ones?
11. The balance between theory and lab exercises was excellent. o agree strongly o agree somewhat o disagree somewhat o disagree strongly
12. If not, why not?
13. The practical organization of the school was completely satisfactory. o agree strongly o agree somewhat o disagree somewhat o disagree strongly
14. If not, what can be improved?
15. Do you have further suggestions?
Thank you for taking the time to answer these questions.
211
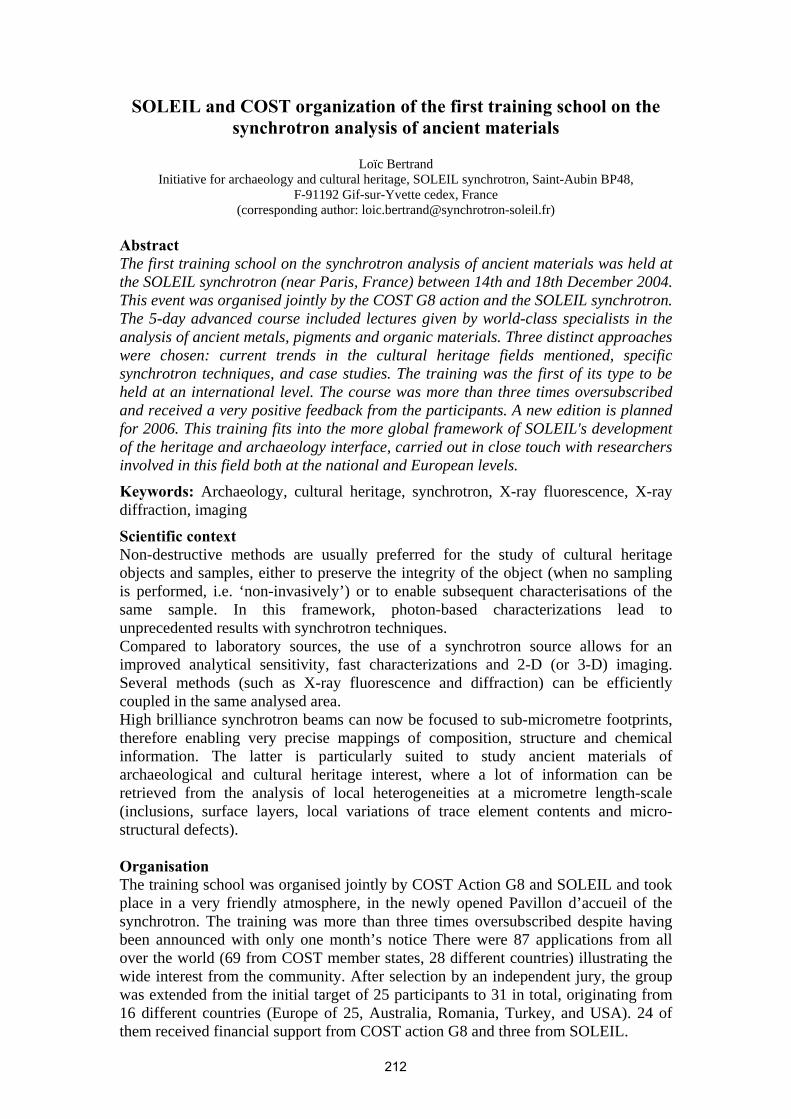
SOLEIL and COST organization of the first training school on the synchrotron analysis of ancient materials
Loïc Bertrand
Initiative for archaeology and cultural heritage, SOLEIL synchrotron, Saint-Aubin BP48, F-91192 Gif-sur-Yvette cedex, France
(corresponding author: [email protected]) Abstract The first training school on the synchrotron analysis of ancient materials was held at the SOLEIL synchrotron (near Paris, France) between 14th and 18th December 2004. This event was organised jointly by the COST G8 action and the SOLEIL synchrotron. The 5-day advanced course included lectures given by world-class specialists in the analysis of ancient metals, pigments and organic materials. Three distinct approaches were chosen: current trends in the cultural heritage fields mentioned, specific synchrotron techniques, and case studies. The training was the first of its type to be held at an international level. The course was more than three times oversubscribed and received a very positive feedback from the participants. A new edition is planned for 2006. This training fits into the more global framework of SOLEIL's development of the heritage and archaeology interface, carried out in close touch with researchers involved in this field both at the national and European levels.
Keywords: Archaeology, cultural heritage, synchrotron, X-ray fluorescence, X-ray diffraction, imaging
Scientific context Non-destructive methods are usually preferred for the study of cultural heritage objects and samples, either to preserve the integrity of the object (when no sampling is performed, i.e. ‘non-invasively’) or to enable subsequent characterisations of the same sample. In this framework, photon-based characterizations lead to unprecedented results with synchrotron techniques. Compared to laboratory sources, the use of a synchrotron source allows for an improved analytical sensitivity, fast characterizations and 2-D (or 3-D) imaging. Several methods (such as X-ray fluorescence and diffraction) can be efficiently coupled in the same analysed area. High brilliance synchrotron beams can now be focused to sub-micrometre footprints, therefore enabling very precise mappings of composition, structure and chemical information. The latter is particularly suited to study ancient materials of archaeological and cultural heritage interest, where a lot of information can be retrieved from the analysis of local heterogeneities at a micrometre length-scale (inclusions, surface layers, local variations of trace element contents and micro-structural defects). Organisation The training school was organised jointly by COST Action G8 and SOLEIL and took place in a very friendly atmosphere, in the newly opened Pavillon d’accueil of the synchrotron. The training was more than three times oversubscribed despite having been announced with only one month’s notice There were 87 applications from all over the world (69 from COST member states, 28 different countries) illustrating the wide interest from the community. After selection by an independent jury, the group was extended from the initial target of 25 participants to 31 in total, originating from 16 different countries (Europe of 25, Australia, Romania, Turkey, and USA). 24 of them received financial support from COST action G8 and three from SOLEIL.
212
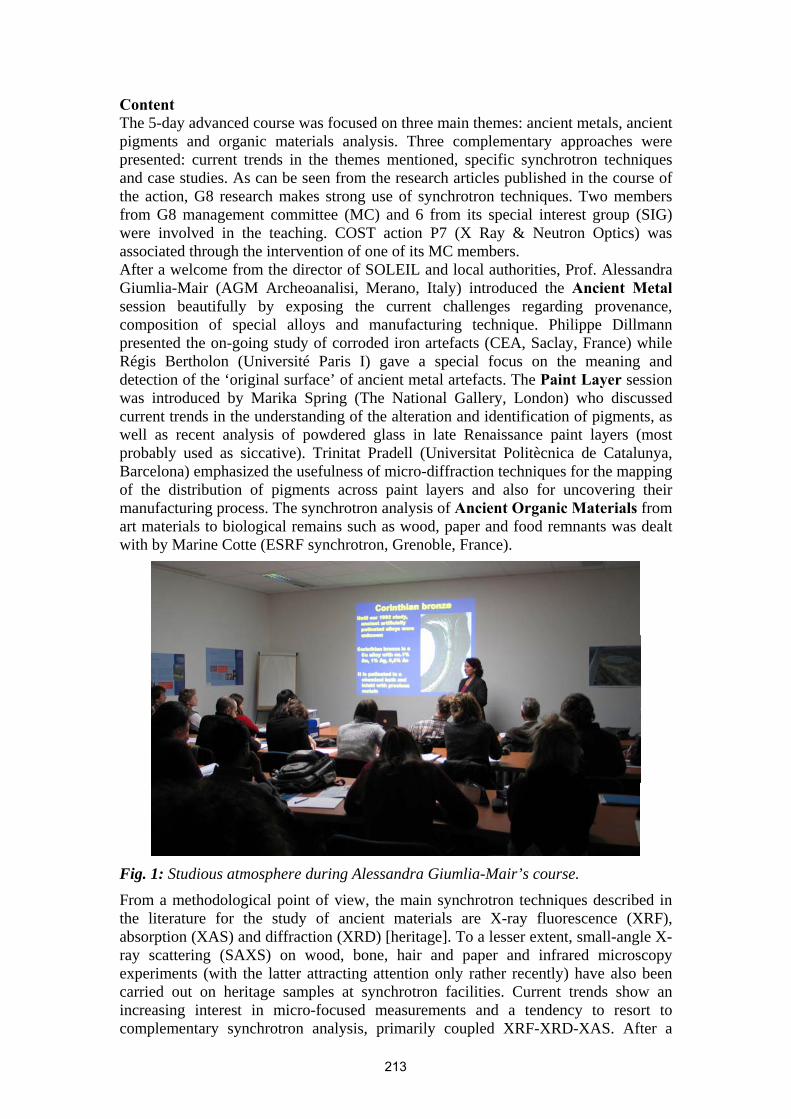
Content The 5-day advanced course was focused on three main themes: ancient metals, ancient pigments and organic materials analysis. Three complementary approaches were presented: current trends in the themes mentioned, specific synchrotron techniques and case studies. As can be seen from the research articles published in the course of the action, G8 research makes strong use of synchrotron techniques. Two members from G8 management committee (MC) and 6 from its special interest group (SIG) were involved in the teaching. COST action P7 (X Ray & Neutron Optics) was associated through the intervention of one of its MC members. After a welcome from the director of SOLEIL and local authorities, Prof. Alessandra Giumlia-Mair (AGM Archeoanalisi, Merano, Italy) introduced the Ancient Metal session beautifully by exposing the current challenges regarding provenance, composition of special alloys and manufacturing technique. Philippe Dillmann presented the on-going study of corroded iron artefacts (CEA, Saclay, France) while Régis Bertholon (Université Paris I) gave a special focus on the meaning and detection of the ‘original surface’ of ancient metal artefacts. The Paint Layer session was introduced by Marika Spring (The National Gallery, London) who discussed current trends in the understanding of the alteration and identification of pigments, as well as recent analysis of powdered glass in late Renaissance paint layers (most probably used as siccative). Trinitat Pradell (Universitat Politècnica de Catalunya, Barcelona) emphasized the usefulness of micro-diffraction techniques for the mapping of the distribution of pigments across paint layers and also for uncovering their manufacturing process. The synchrotron analysis of Ancient Organic Materials from art materials to biological remains such as wood, paper and food remnants was dealt with by Marine Cotte (ESRF synchrotron, Grenoble, France).
Fig. 1: Studious atmosphere during Alessandra Giumlia-Mair’s course. From a methodological point of view, the main synchrotron techniques described in the literature for the study of ancient materials are X-ray fluorescence (XRF), absorption (XAS) and diffraction (XRD) [heritage]. To a lesser extent, small-angle X-ray scattering (SAXS) on wood, bone, hair and paper and infrared microscopy experiments (with the latter attracting attention only rather recently) have also been carried out on heritage samples at synchrotron facilities. Current trends show an increasing interest in micro-focused measurements and a tendency to resort to complementary synchrotron analysis, primarily coupled XRF-XRD-XAS. After a
213
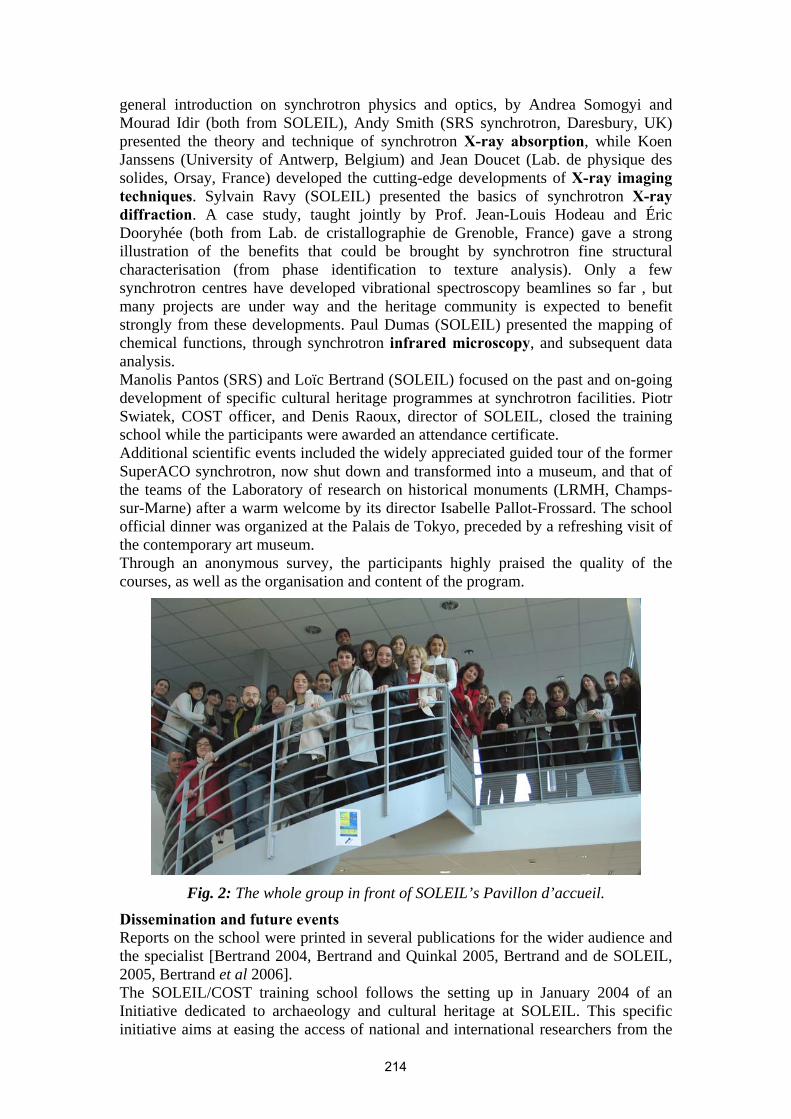
general introduction on synchrotron physics and optics, by Andrea Somogyi and Mourad Idir (both from SOLEIL), Andy Smith (SRS synchrotron, Daresbury, UK) presented the theory and technique of synchrotron X-ray absorption, while Koen Janssens (University of Antwerp, Belgium) and Jean Doucet (Lab. de physique des solides, Orsay, France) developed the cutting-edge developments of X-ray imaging techniques. Sylvain Ravy (SOLEIL) presented the basics of synchrotron X-ray diffraction. A case study, taught jointly by Prof. Jean-Louis Hodeau and Éric Dooryhée (both from Lab. de cristallographie de Grenoble, France) gave a strong illustration of the benefits that could be brought by synchrotron fine structural characterisation (from phase identification to texture analysis). Only a few synchrotron centres have developed vibrational spectroscopy beamlines so far , but many projects are under way and the heritage community is expected to benefit strongly from these developments. Paul Dumas (SOLEIL) presented the mapping of chemical functions, through synchrotron infrared microscopy, and subsequent data analysis. Manolis Pantos (SRS) and Loïc Bertrand (SOLEIL) focused on the past and on-going development of specific cultural heritage programmes at synchrotron facilities. Piotr Swiatek, COST officer, and Denis Raoux, director of SOLEIL, closed the training school while the participants were awarded an attendance certificate. Additional scientific events included the widely appreciated guided tour of the former SuperACO synchrotron, now shut down and transformed into a museum, and that of the teams of the Laboratory of research on historical monuments (LRMH, Champs-sur-Marne) after a warm welcome by its director Isabelle Pallot-Frossard. The school official dinner was organized at the Palais de Tokyo, preceded by a refreshing visit of the contemporary art museum. Through an anonymous survey, the participants highly praised the quality of the courses, as well as the organisation and content of the program.
Fig. 2: The whole group in front of SOLEIL’s Pavillon d’accueil.
Dissemination and future events Reports on the school were printed in several publications for the wider audience and the specialist [Bertrand 2004, Bertrand and Quinkal 2005, Bertrand and de SOLEIL, 2005, Bertrand et al 2006]. The SOLEIL/COST training school follows the setting up in January 2004 of an Initiative dedicated to archaeology and cultural heritage at SOLEIL. This specific initiative aims at easing the access of national and international researchers from the
214
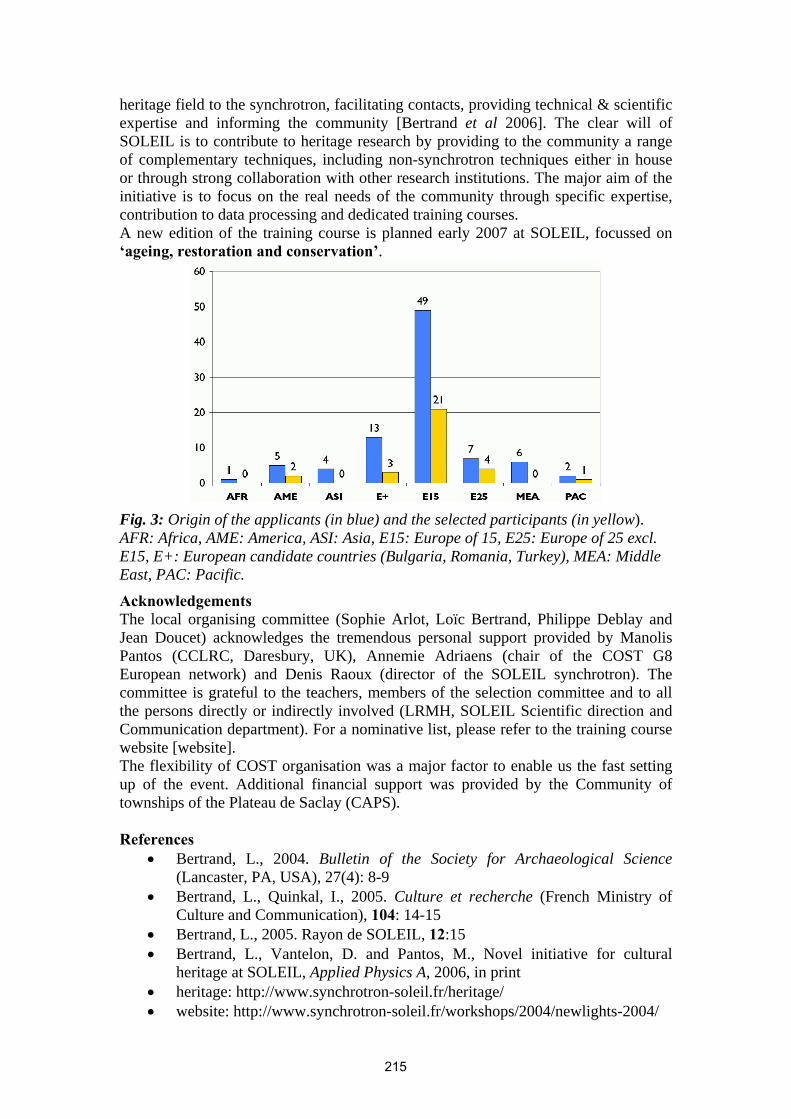
heritage field to the synchrotron, facilitating contacts, providing technical & scientific expertise and informing the community [Bertrand et al 2006]. The clear will of SOLEIL is to contribute to heritage research by providing to the community a range of complementary techniques, including non-synchrotron techniques either in house or through strong collaboration with other research institutions. The major aim of the initiative is to focus on the real needs of the community through specific expertise, contribution to data processing and dedicated training courses. A new edition of the training course is planned early 2007 at SOLEIL, focussed on ‘ageing, restoration and conservation’.
Fig. 3: Origin of the applicants (in blue) and the selected participants (in yellow). AFR: Africa, AME: America, ASI: Asia, E15: Europe of 15, E25: Europe of 25 excl. E15, E+: European candidate countries (Bulgaria, Romania, Turkey), MEA: Middle East, PAC: Pacific.
Acknowledgements The local organising committee (Sophie Arlot, Loïc Bertrand, Philippe Deblay and Jean Doucet) acknowledges the tremendous personal support provided by Manolis Pantos (CCLRC, Daresbury, UK), Annemie Adriaens (chair of the COST G8 European network) and Denis Raoux (director of the SOLEIL synchrotron). The committee is grateful to the teachers, members of the selection committee and to all the persons directly or indirectly involved (LRMH, SOLEIL Scientific direction and Communication department). For a nominative list, please refer to the training course website [website]. The flexibility of COST organisation was a major factor to enable us the fast setting up of the event. Additional financial support was provided by the Community of townships of the Plateau de Saclay (CAPS). References
• Bertrand, L., 2004. Bulletin of the Society for Archaeological Science (Lancaster, PA, USA), 27(4): 8-9
• Bertrand, L., Quinkal, I., 2005. Culture et recherche (French Ministry of Culture and Communication), 104: 14-15
• Bertrand, L., 2005. Rayon de SOLEIL, 12:15 • Bertrand, L., Vantelon, D. and Pantos, M., Novel initiative for cultural
heritage at SOLEIL, Applied Physics A, 2006, in print • heritage: http://www.synchrotron-soleil.fr/heritage/ • website: http://www.synchrotron-soleil.fr/workshops/2004/newlights-2004/
215


Appendix

Management Committee Members Chairperson: Prof Annemie Mieke Adriaens University of Ghent Department of Analytical Chemistry Krijgslaan 281 - S12 9000 Ghent Belgium Tel. +32 9 264 4826 Fax +32 9 264 4960 [email protected]
Austria Dr Martina Griesser Kunsthistorisches Museum Wien Naturwissenschaftliches Labor Burgring 5 1010 Wien Austria Tel. + 43 1 525 24 544 Fax + 43 1 525 24 309 [email protected]
Prof Manfred Schreiner Institute of Chemistry Academy of Fine Arts Schillerplatz 3 1010 Vienna Austria Tel. + 43 1 58816261 Fax + 43 1 58816121 [email protected]
Belgium Prof Guy Demortier Facultés Universitaires N.-D. de la Paix 61 rue de Bruxelles 5000 Namur Belgium Tel. + 32 (0)81 72 54 75 Fax + 32 (0)81 72 54 74 [email protected]
Dr Henri-Pierre Garnir University of Liege, I.P.N.A.S., Sart Tilman B15 4000 LIEGE, Belgium Tel. +32-4-366-3764 Fax +32-4-366-2884 [email protected]
Dr Jan Wouters Laboratory on Materials and Technologies Koninklijk Instituut coor het Kunstpatrimonium Jubelpark 1 1000 Brussels Belgium Tel. 32 2 7396840 Fax 32 2 7320105 [email protected]
Bulgaria Dr Valentin Vladimirov Sofia University St.Kl.Ohridski Dept. of Mineralogy, Petrology & Economic Geology, 15 Tzar Osvoboditel bd. Sofia 1000 Bulgaria Tel. (359 2) 93 08 255 or 93 08 570 Fax (359 2) 944 64 87 [email protected]
219
Cyprus Republic Dr Marios Nestoros Department of Engineering INTERCOLLEGE 46 Makedonitissas Avenue 1700 Nicosia, Cyprus Tel. +357 22841669 Fax +357 22357481 [email protected]
Czech Republic Dr František Peterka National Centre for Nanosurfaces Advanced Technology Group Praha Nad Kazankou 11 171 00 Praha 7 Czech R.epublic Tel. + 420-2-6880111 Fax +420-2-6271206 [email protected]
Denmark Mads Chr. Christensen National Museeum of Denmark , Dept. of Conservation Brede PO Box 260 2800 Lyngby Denmark Tel. +45 33473530 Fax +45 33 47 33 27 [email protected]
Prof Palle Waage Jensen Dept. of Chemistry University of Southern Denmark Campusvej 55 5230 Odense Denmark Tel. +45 65502505 Fax +45 66158780 [email protected]
Finland Dr Kirsti Harva Finnish National Gallery / Museum of Contemporary Art Conservation Department Kiasma 00100 Helsinki Finland Tel. +358 9 1733 6528 Fax + 358 9 1733 6573 [email protected]
Dr Aimo Hautojarvi Posiva Oy Töölönkatu 00100 Helsinki Finland Tel. + 358 9 2280 3747 Fax + 358 9 2280 3719 [email protected]
220
France
Dr Patrick Perin Musée des Antiquités Nationales Château de Saint-Germain-en-Laye BP 3030 78103 Saint-Germain-en-Laye cedex France Tel. +33 (0)1 39 10 13 00 Fax +33 1 34 51 73 93 [email protected]
Dr Jean-Claude Dran Laboratoire de recherche des musées de France, CNRS UMR 171 Palais du Louvre 14 Quai François Mitterrand 75001 Paris France Tel. +33 (0)1 40 20 57 49 Fax +33 (0)1 47 03 32 46 [email protected]
Germany Dr Andrea Denker Hahn-Meitner-Institut Ionenstrahllabor Glienickerstrasse 100 14109 Berlin Germany Tel. + 49 30 80622498, Fax + 49 30 80622097 [email protected]
Dr Christian Neelmeijer, Forschungszentrum Rossendorf, Institut für Ionenstrahlphysik und Materialforschung, Postfach 51 01 19, 01314 Dresden Germany Tel. +49 3512603254 Fax +49 3512603285 [email protected]
Greece Dr Yannis Maniatis Institute of Material Sciences Laboratory of Archaeometry NCSR 'Demokritos' Ag. Paraskevi 15310 Attiki Greece Tel. +30 1 6524821 Fax +30 1 6519430 [email protected]
Dr Andreas Karydas Institute of Nuclear Physics Laboratory for Material Analysis NCSR 'Demokritos' Ag. Paraskevi 153 10 Athens Greece Tel. +30-210-6503523 Fax 30-210-6511215 [email protected]
Hungary Dr Zoltán Szókefalvi-Nagy KFKI RMKI Research Institute for Particle and Nuclear Physics Konkoly Thegeu 29-33 1121 Budapest Hungary Tel. + 36 1 3959289 Fax + 36 1 3959151 [email protected]
Prof Árpád Zoltán Kiss ATOMKI Institute of Nuclear Research P.O. Box 51 4001 Debrecen Hungary Tel. + 36 52 417 266 Fax + 36 52 416 181 [email protected]
221
Israel
Prof Charles Greenblatt, The Kuvin Centre, Hebrew University of Jerusalem, PO Box 12272 91120 Jerusalem Israel Tel. +972 2 6757429 Fax +972 2 6757425 [email protected]
Dr Jan Gunneweg, Institute of Archaeology, Hebrew University of Jerusalem, 91905 Jerusalem Israel Tel. +972 26234830 Fax +972 26234830 [email protected]
Italy Prof Carlo Varaldo, University of Genova, Dipartimento di Scienze dell'Antichità e del Medioevo Via Lomellini 8 16126 Genova Italy Tel. +39 010 2099602 Fax +39 019 822708 [email protected]
Dr Alessandro Zucchiatti Istituto Nazionale di Fisica Nucleare Sezione di Genova Via Dodecanesco 33 16146 Genova Italy Tel. + 39 010 3536384 Fax + 39 010 313358 [email protected]
Macedonia Prof Biljana Minceva-Sukarova Ss. Cyril and Methodius University Faculty of Natural Science and Mathematics Institute of Chemistry 1000 Skopje Macedonia Tel. + 389-2-3117-055 Fax + 389-2-3226-865 [email protected]
Prof Orhideja Grupce Ss. Cyril and Methodius University Faculty of Natural Science and Mathematics Institute of Chemistry 1000 Skopje Macedonia Tel. +389-2-3117-055 Fax + 389-2-3226-865 [email protected]
Malta Dr JoAnn Cassar Institute for Masonry and Construction Research University of Malta Msida MSD 06 Malta Tel. (356) 2340 2866 Fax (356) 2134 6225 [email protected]
Dr Christian Degrigny Malta Centre for Restoration Bighi, Kalkara Malta now: Château de Germolles, Mellecey 71640 Germolles France Tel. +33-3-85-98-01-24 [email protected]
222
Netherlands
Prof Dr Jacob J. Boon FOM Institute AMOLF Kruislaan 407 1098 SJ Amsterdam The Netherlands Tel. +31 206081234 Fax +31 206684106 [email protected]
Dr Hans Scholten Art Innovation Westermaatsweg 11 7556 BW Hengelo The Netherlands Tel. +31-(0)74-2501239 Fax +31-(0)74-2913707 [email protected]
Poland Assoc. Prof Dr Gerard Sliwinski, Photophysics and Laser Lab., IF-FM, Polish Academy of Sciences , Fiszera 14, 80-952 Gdansk Poland Tel. +48 583411271 Fax +48 583416144 [email protected]
Dr Wojciech Skrzeczanowski, Institute of Optoelectronics MUT, 2 Kaliskiego str., 00-908 Warsaw Poland Tel. +48 22 683 77 17 Fax +48 22 666 89 50 [email protected]
Portugal Hugo Leal Gouveia ISQ - LABMM / Norte Rua do Mirante 258 4415-441 Grijó Portugal Tel. + 351 22 747 19 50 Fax + 351 22 745 57 78 [email protected]
Romania Dr Bogdan Constantinescu Institute of Atomic Physics Cyclotron Laboratory street Atomistilor 109 Bucuresti Romania Tel. +401 7807040 ext. 4401 Fax + 401 4231701 [email protected]
Dr Dragomir Popovici, National History Museum, Calea Victoriei 12, Bucuresti, Romania Tel. + 401.315.8207/118 Fax + 401.311.3356 [email protected]
Slovakia Dr Miroslav Hain Institute of Measurement Science, Slovak Academy of Sciences, Dubravska cesta 9, 84219 Bratislava Slovakia Tel. +421 2 5477 5949 ext. 2504 , Fax +421 2 5477 5943 [email protected]
Jozef Dorica Chamber of Restorers Lermontova 8 81105 Bratislava Slovakia Tel. +421 46 5430633, Fax 421 41 5643062 [email protected]
223
Slovenia Prof Dr Ziga Smit J. Stefan Institute Jadranska 19 1001 Ljubljana Slovenia Tel. +38614766589 Fax +38 6-1-2519385 [email protected], [email protected]
Mateja Kos Narodni Muzej Presernova 20 61000 Ljubljana Slovenia Tel. +38 6-1- 218 886 Fax +38 6-1- 221 882 [email protected]
Spain Prof Aurelio Climent-Font, Universidad Autonoma de Madrid, Departamento de Fisica - Aplicada C-XII Campus de Cantoblanco, 28049 Madrid Spain Tel. +34 91 397 3816 Fax +34 91 397 3969 [email protected]
Prof Miguel Angel Respaldiza Universidad de Sevilla Centro Nacional de Acelevadoresc Isla de la Cartuja 41092 Sevilla Spain Tel. +34 95 4460553 Fax +34 95 4460145 [email protected]
Switzerland Dr Eberhard H. Lehmann, Paul Scherrer Institut PSI, Spallation Neutron Source, 5232 Villigen PSI, Switzerland Tel. +41 563102963 Fax +41 563103131 [email protected]
Dr Marie Woerle (Soares), Swiss national Museum Hardturmstr 181, 8005 Zürich, Switzerland Tel. +41 (0) 1 218 68 06 Fax +41 (0) 1 272 19 165 [email protected]
United Kingdom Prof Graham Martin (Vice Chairman) Victoria & Albert Museum South Kensington London SW7 2RL UK Tel. +020 7942 2115 Fax +020 7942 2092 [email protected]
Dr Manolis Pantos (Webmaster) Daresbury Laboratory, Keckwick Lane, Warrington WA4 4AD, UK. Tel. +44 (0)1925 603275 Fax +44 (0)1925 603124 [email protected]
COST Science Officer TC Physics Rapporteur Dr Hannelore Römich COST Office 149 avenue Louise 1050 Brussels Belgium Tel. (+) 32 2 533 38 18 (direct line) Fax (+) 32 2 533 38 90 [email protected] http://costchemistry.epfl.ch http://cost.cordis.lu
Dr Zolt Kajcsos, KFKI Research Institute for Particle and Nuclear Physics P.O. Box 49 1525 Budapest Hungary Tel. 36 1 3922517 Fax 36 1 3922518 or 36 13959151 [email protected]
224
COST Action G8 – Dissemination of Results 1. Joint (= minimum 2 G8 members) Publications and Reports 1.1 Books
− Townsend J., K. Eremin, A. Adriaens (editors), Conservation Science 2002, Archetype Publications, 2003, 278 pp., ISBN: 1873132883.
− Adriaens A., C. Degrigny, J. Cassar (editors), Benefits of Non-destructive Analytical Techniques for Conservation, OPOC-EC Publications, in preparation.
− Smit Z. (editor) Archaeometry with IBA and Related Methods - Proceedings of the Workshop of the COST G8 action “Non-destructive Analysis and Testing of Museum Objects”, held in conjunction with the “10th International Conference on PIXE and its Analytical Applications” Nuclear Instruments and Methods B 239 (1-2) (2005).
− Gunneweg J., C. Greenblatt, A. Adriaens (editors), Bio- and Material Culture at Qumran, Office for the Official Publications of the European Union: Luxembourg, in press.
− Denker A., A. Adriaens, M. Dowsett, A. Giumlia-Mair (editors), Non-destructive analysis and testing of museum objects” in preparation.
1.2 Articles − Adriaens A., A. Denker, M. Griesser, Non-destructive Analysis and Testing
of Museum Objects: the new European Action COST G8, Archaeometry in Europe in the Third Millenium, Rome, Academia Nazionale dei Lincei (2002) 169-173.
− Adriaens A., G. Demortier, COST Actions G1 and G8: EU Programs on the Use of Radiation in Art and Archaeometry, Nuclear Instruments and Methods B 226 (2004) 3-9.
− Adriaens A., Dowsett M.G., “Electron Microscopy and its role in cultural heritage studies”, in Non-destructive microanalysis of cultural heritage materials, edited by Janssens K., van Grieken R., Elsevier (2004) Chapter 3.
− Adriaens A., Dowsett M.G., “Applications of SIMS to cultural heritage studies”, Appl. Surf. Sci (2006) in press.
− Aloupi E., A. G. Karydas, P. Kokkinias, T. Paradellis, A. Lekka and V. Karageorhis. Non destructive Analysis and visual recording survey of the pottery collection in the Nicosia Museum, Cyprus. Archaeometry Issues in Greek Prehistory and Antiquity, Eds. Y. Bassiakos, E. Aloupi and Y. Facorellis, (2001) 397-410.
− Bertrand L., D. Vantelon, E. Pantos, Novel interface for cultural heritage at SOLEIL, Applied Physics A 83-2 (2006) 225-228.
− Boccardo P., A. D’Alessandro, M.C. Galassi, F. Lucarelli, P. Prati, A. Zucchiatti, PIXE analysis of Italian xvi century ink drawings from Luca Cambiaso and his school, Int. Journal of PIXE 15 (2005) 337-343.
− Bouquillon A., J. Castaing, E. Vartanian, A. Zink, A. Zucchiatti , J.R Gaborit, Protocole d’etude des œuvres Robbiesques : la cas de San Frediano, in Les Della Robbia, Sculptures en terre cuite émaillée de la Renaissance italienne, M. Bormand et J.R. Gaborit Editors Editions des Musées de France 2002 pg 140-157
− Bouquillon A., A. Zucchiatti, J. Castaing, I. Katona, Les Della Robbia: matiere et transfiguration, Techne 20 (2004) 13-18.
225
− Bouquillon A., A. D’Alessandro, I. Katona, A. Zucchiatti, PIXE analysis of artistic blue glazes and the use of cobalt pigments in ceramics during the Italian renaissance, Int. Journal of PIXE 15 (2005) 317-322.
− Broekmans T., A. Adriaens, E. Pantos, Analytical Investigations of Cooking Pottery from Tell Beydar (NE Syria), Nuclear Instruments and Methods B 226 (2004) 92-97.
− Broekmans T., A. Adriaens, E. Pantos, Insights into North-Mesopotamian ‘Metallic Ware’, Archaeometry 48(2) (2006) 219-227.
− Bugoi R., B. Constantinescu, F. Constantin, C. Neelmeijer -"Potential of external IBA and LA-ICP-MS for compositional analysis of obsidians", Instruments and Methods B 226 (2004) 136-146.
− Bugoi R., A. Climent-Font, B. Constantinescu, A. D'Alessandro, P. Prati, A. Zucchiatti, Compositional studies on Iznik ceramics pigments, Proceedings of the EMAC'05 (8th European Meeting on Ancient Ceramics) workshop , Lyon, October 2005, Ed. Maison de l'Orient et de la Mediteraranee, Lyon, France.
− Bugoi R., V. Cojocaru, B. Constantinescu, F. Constantin, D. Grambole, F. Herrmann, Micro-PIXE study of gold archaeological objects, Journal of Radioanalytical and Nuclear Chemistry, 257(3) (2003) 375-383.
− Burgio L., R. Clark, G. Martin, E. Pantos and M. Roberts, A multidisciplinary approach to pigment analysis: king's yellow and dragon's blood from the Winsor and Newton pigment box at the Victoria and Albert Museum in Molecular and Structural Archaeology, NATO Science Series, edited by G. Tsoucaris and J. Lipkowski, Kluwer Academic Publishers, 2003, pp. 61-72.
− Constantinescu B., R. Bugoi, V. Cojocaru, D. Voiculescu, D. Grambole, F. Herrmann, D. Ceccato, Romanian ancient gold objects provenance studies using micro-beam methods: the case of “Pietroasa” hoard”, Nuclear Instruments and Methods in Physics Research B 231 (2005) 541-545.
− Denker A., J. Opitz-Coutureau, M. Griesser, R. Denk, H. Winter, Zerstörungsfreie Elementanalyse an mittelalterlichen "Wiener Pfennigen", Contribution to “Archäometrie und Denkmalpflege 2004” (ISSN 0949-4057), Eds. U. Schüssler, E. Pernicka, (2004) 87-90.
− Denker A., J. Opitz-Coutureau, M. Griesser, R. Denk, H. Winter, Non-destructive analysis of coins using high-energy PIXE, Nuclear Instruments and Methods, B 226 (2004) 163-171.
− Demortier G., J.-L. Ruvalcaba-Sil, Non destructive ion beam techniques for the depth profiling of elements in Amerindian gold jewelry artefacts”, Proceedings of ART 2002, Cultural Heritage Conservation: Eds Van Grieken and Janssens. Talor and Francis (2005) p. 91-100.
− De Ryck I., A. Adriaens, F. Adams, E. Pantos, A Comparison of Microbeam Techniques for the Analysis of Corroded Ancient Bronze Objects, Analyst 128 (2003) 1104-1109.
− Dowsett M., A. Adriaens, The Role of SIMS in Cultural Heritage Studies, Nuclear Instruments and Methods B 226 (2004) 38-52.
− Dowsett M., Adriaens A., Palitsin V., Gibbons R., The Use of Ultra Low Energy Dynamic SIMS in the Study of the Early Stages of Tarnishing on Metals, Nuclear Instruments and Methods B 239 (2005) 51-64.
226
− Dowsett M., A. Adriaens, A Cell for Simultaneous SR-XRD and Electrochemical Corrosion Measurements on Cultural Heritage Metals, Analytical Chemistry, 78(10) (2006) 3360-3365.
− Drakaki E., A. G. Karydas, B. Klinkenberg, M. Kokkoris, A.A. Serafetinides, E. Stavrou, R. Vlastou and Ch. Zarkadas, Laser cleaning on ancient coins, Appl. Phys. A 79, (2004), 1111-1115.
− Endrödi A., L. Reményi, E. Baradács, I. Uzonyi, Á. Z. Kiss, I. Montero, S. Rovira, Technical Study of Beaker Metallurgy in Hungary. Proceedings of the Int. Conf. on Archaeometallurgy in Europe. Milan, Italy, 24-26 Sept.,2003, Milan, Associazione Italiana di Metalurgia (2003) 29.
− Felicissimo M., J. Peixoto, J.-J. Pireaux, G. Demortier, U. Peirera, Estudos arqueometricos de ceramicas indigenas pre-colonias das Lagos do Castello e Vermelha, localizadas no Pantanal sul-Mato-Grossense. Canide, Revista do Museu de Arqueologia de Xingo, Universitade Federal de Sergipe (Brazil) 2004, 325-368.
− Flügel C., E. Blumenau, E. Deschler-Erb, S. Hartmann, E. Lehmann, Römische Cingulumbeschläge mit Millefiorieinlagen, Archäologisches Korrespondenzblatt 34, 2004, Heft 4.
− Gliozzo E., I.W. Kirkman, E. Pantos and I. Memmi-Turbanti, Black gloss pottery: production sites and technology in ancient Tuscany. Part II: gloss technology. Archaeometry 46:2 (2004) 227-246.
− Gunneweg, J., Balla, M., Neutron Activation of Scroll Jars and Common Ware. In /Khirbet Qumran and ’Ain Feshkha/. J-B Humbert and J. Gunneweg (eds), Volume II. Studies of Anthropology, Physics and Chemistry, Academic Press Fribourg, Vandenhoeck & Ruprecht Göttingen. (2003) p. 3-54.
− Gunneweg, J., Balla, M., Possible connection between the Inscriptions on Pottery, the Ostraca and the Scrolls found in the Caves. In /Khirbet Qumran and ’Ain Feshkha/. J-B Humbert and J. Gunneweg (eds), Volume II. Studies of Anthropology, Physics and Chemistry, Academic Press Fribourg, Vandenhoeck & Ruprecht Göttingen., (2003) p 389-397.
− Humbert, J-B., J. Gunneweg J. /Khirbet Qumran and ’Ain Feshkha/, Volume II. Studies of Anthropology, Physics and Chemistry, Academic Press Fribourg, Vandenhoeck & Ruprecht Göttingen. (2003) 484 pages.
− Huq A., P.W. Stephens, N. Ayed, H. Binous, L. Burgio, R.J.H. Clark and E.Pantos, Elemental, Mineralogical and Spectroscopic Analysis of Punic Make-Up, Appl. Phys. 83 (2006) 253-256.
− Jembrih-Simbuerger D., Ch. Neelmeijer, M. Maeder, M. Schreiner: X-ray fluorescence and ion beam analysis of iridescent Art Nouveau Glass - authenticity and Technology. Nuclear Instruments and Methods B (2004) 119-125.
− Karydas A.G., D. Kotzamani, R. Bernard, Ch. Zarkadas " A compositional study of a museum jewelry collection (7th-1st B.C.) by means of a portable XRF analysis, Nuclear Instruments and Methods B (2004) 15-28.
− Karydas A.G., V. La Rosa, P.Millitelo, G. Pappalardo , L. Pappalardo, F Rizzo, F.P. Romano, Provenance of obsidian artefacts from different archaeological layers of Phaistos and Haghia Triada. Creta Antica 4, (2003) 287-299.
227
− Karydas A.G., D. Kotzamani, R. Bernard, J. N. Barrandon and Ch. Zarkadas. A compositional study of a museum jewelry collection (7th-1st BC) by means of a portable XRF spectrometer. NIMB 226, (2004) 15-28.
− Karydas A.G, X. Brecoulaki, Th. Pantazis, E. Aloupi, V. Argyropoulos, D. Kotzamani, R. Bernard, Ch. Zarkadas and Th Paradellis, Importance of in-situ EDXRF measurements in the preservation and conservation of Material Culture. X-Rays for Archaeology, Edited by M. Uda, G. Demortier and I. Nakai, Springer (2005) 27-53.
− Karydas A.G., H. Brecoulaki, B. Bourgeois, Ph. Jockey and Ch. Zarkadas, In-situ XRF Analysis of raw pigments and traces of polychromy on marble sculpture surfaces. Possibilities and limitations, Proceedings book of the 28th International Symposium on the Conservation and Restoration of Cultural Property with thematic topic: “Non-destructive examination of Cultural Objects -Recent Advances in X-ray Analysis”, December 1-3, Tokyo, Japan (2004), 48-62.
− Kos M., Z. Smit, Ljubljana glassworks - new discoveries: the report on archaeometrical research V., In: S. Felgenhauer-Schmiedt, A. Eibner, H. Knittler (Eds.) Auf gläsernen Spuren : der Beiträg Mitteleuropas zur archäologisch - historischen Glasforschung, (Beiträge zur Mittelalterarchäologie in Österreich, 19, 2003). Wien: Österreichische Gesellschaft für Mittelalterarchäologie, 19 (2003) 75-80.
− Leyssens K., A. Adriaens, E. Pantos, C. Degrigny, Study of Corrosion Product Stability in the Storage and Stabilization Processes Used for Archaeological Copper Artefact, Proceedings of Metal 2004 (2004) 332-343.
− Leyssens K., A. Adriaens, M. Dowsett, B. Schotte, I. Oloff, E. Pantos, A. Bell and S. Thompson, Simultaneous In-situ time Resolved SR-XRD and Corrosion Potential Analyses to Monitor the Corrosion on Copper, Electrochemistry Communications 7 (2005) 1265-1270.
− Leyssens K., A. Adriaens, C. Degrigny, Electrochemical monitoring of the storage or stabilization of archaeological copper based artefacts in sodium sesquicarbonate solutions, ICOM-CC 14th Triennial meeting, James & James, London, 2005, 301-309.
− Leyssens K., A. Adriaens, C. Degrigny, E. Pantos, Study of Corrosion Potential Measurements as a Means to Monitor the Storage and Stabilization Processes of archaeological Copper Artefacts, Analytical Chemistry, 78(8) (2006) 2794-2801.
− Linke R., M. Alram, K.P. Martinek, G. Demortier, P. Spindler, M. Schreiner, “Materialanalytische Untersuchungen an Geprägen des Tiroler Kreuzers mittels Röntgenfluoreszenzanalyse, Röntgenmikroanalyse im Rasterelektronenmikroskop, Bleiisotopenanalyse und protoneninduzierter Röntgenemissonsanalyse“, Numismatische Zeitschrift, Karl Schulz-Gedächtnisschrift, Wien, 2001, 125-149
− Linke R., M. Schreiner, G. Demortier, M. Alram, Determination of the provenance of medieval silver coins : potential and limitations of x-ray analysis using protons, electrons and protons, X-ray Spectroscopy 32 (2003) 373-380.
− Linke R., M. Schreiner, G. Demortier: The application of photon, electron and proton induced X-ray analysis for the identification and characterization of medieval silver coins. Nuclear Instruments and Methods B (2004) 172-178.
228
− Linke R., S. Stanek, M. Schreiner, G. Demortier, H. Winter, M. Alram, B. Prokisch, “Energiedispersive Röntgenfluoreszenzanalyse zur Zerstörungsfreien Untersuchung von Münzen“, Symposium Proceedings Numismatics & technology: questions and answers, (Vienna) (2003), 63-78.
− Maeder M., D. Jembrih-Simburger, C. Neelmeijer, M. Schreiner, IBA of iridescent Art Nouveau glass – comparative studies, Nuclear Instruments and Methods B 239 (2005) 107-113.
− Molera J., T. Pradell, J. Roque, A.D. Smith, D. Crespo, E. Pantos and M. Vendrell-Saz, Ionic-exchange mechanism in the formation of medieval luster decorations, Journal of the American Ceramic Society (2004) in press.
− Montero I., Th. Calligaro, A. Climent, G. Demortier, J.C. Dran, A. Perea, “Del Estudio Analitico Del Oro” in “El Tesoro Visigodo de Guarrazar”, Libro III, Museo Arqueologicao Nacional, Madrid (Spain). A.Perea ed. (2001), 201-237.
− Müller M., M.Z. Papiz, D.T. Clarke, M.A. Roberts, B.M. Murphy, M. Burghammer, C. Riekel, E. Pantos and J. Gunneweg, Identification of ancient textile fibres from Khirbet Qumran caves using synchrotron radiation microbeam diffraction Spectrochimica Acta B (2004), 59.
− Müller M., M.Z. Papiz, D.T. Clarke, M.A. Roberts, B.M. Murphy, M. Burghammer, C. Riekel, E. Pantos and J. Gunneweg, Identification of textiles from the Khirbet Qumran caves using microscopy and synchrotron radiation x-ray fibre diffraction. in Khirbet Qumran et Ain Feshkha, II. Etudes d'anthropologie, de physique et de chimie., Fribourg (Suisse), Jean-Baptiste Humbert & Jan Gunneweg (Eds.), Academic Press / editions Saint-Paul & Goettingen, Vandenhoeck & Ruprecht, 2003.
− Mueller M., B. Murphy, M. Burghammer, I. Snigireva, C. Riekel, J. Gunneweg and E. Pantos, Identification of single archaeological textile fibres from the Cave of Letters using synchrotron radiation microbeam diffraction and microfluorescence, Appl. Phys. A 83 (2006) 183-188.
− Ochocinska K., M. Sawczak, M. Martin, J. Bredal-Jørgensen, A. Kaminska, G. Sliwinski, LIPS spectroscopy for contamination analysis and the laser cleaning diagnostics of historical paper documents, Radiation Physics and Chemistry, 68 (2003) 227-232.
− Ochocinska K., M. Martin, J. Bredal-Jørgensen, A. Kaminska, G. Sliwinski, Laser cleaning of historical paper documents and diagnostics by means of LIF technique, SPIE Proc. 5229 (2003) 296-300.
− Opitz-Coutureau J., A. Denker, C. Couzon, R. Denk, M. Griesser, H. Winter, E. Nagel, Zerstörungsfreie Elementanalyse durch Hochenergie-PIXE an mittelalterlichen "Wiener Pfennigen", und altchinesischen Münzen aus Karakorum (Mongolei), Proc. of "Numismatics and Technology: Questions and Answers", Eds. Griesser et.al. (2003) 49-61.
− Padovani, S., D. Puzzovio, C. Sada, P. Mazzoldi, I. Borgia, A. Sgamellotti, B.G. Brunetti, L. Cartechini, F. D'Acapito, C. Maurizio, F. Shokoui, P. Oliaiy, J. Rahighi, M. Lamehi-Rachti, E. Pantos, XAFS study of copper and silver nanoparticles in glazes of medieval middle-east lusterware (10th-13th century), Appl.Phys. A (2006) in press.
− Pantos E., N. Salvadó, T. Pradell, J. Molera, M. Vendrell, A.D. Smith, I.W. Kirkman, M. Marcus, E. Gliozzo and I. Memmi-Turbanti, SR-based molecular speciation of archaeomaterials in Molecular and Structural Archaeology, NATO Science Series, edited by G. Tsoucaris and J. Lipkowski, Kluwer Academic Publishers, 2003, pp. 221-229.
229
− Pantos E., T. Pradell, N. Salvadó, J. Molera, M. Vendrell, A.D. Smith, I.W. Kirkman, E. Gliozzo, I. Memmi-Turbanti, L. Burgio, G. Martin, W. Kockelmann and A.J.N.W. Prag, Synchrotron radiation and neutrons in archaeological and cultural heritage science, Proceedings of the International School of Physics "Enrico Fermi", Varenna, Italy, (2004), IOS Press, pp.299-307.
− Pantos E., W. Kockelmann, L.C. Chapon, L. Lutterotti, S.L. Bennet, M.J. Tobin, J.F.W. Mosselmans, T. Pradell, N. Salvadó, S. Buti, R. Garner, A.J.N.W. Prag, Neutron and X-ray characterization of the metallurgical properties of a 7th century BC Corinthian type bronze helmet, Nuclear Instruments ad Methods B 239 (2005) 16-26.
− Pantos E., N.Salvadó, S.Butí, M.J.Tobin and T.Pradell, Characterization of ancient painting pigments using synchrotron radiation, In Proc. G8 Workshop on Qumran, Jerusalem May 2005, (2006) in press.
− Pappalardo G., E. Costa, C. Marchetta, L. Pappalardo, F.P. Romano, A. Zucchiatti, P. Prati, P.A. Mandò, A. Migliori, L. Piombo, M.G. Vaccari, Non-destructive characterization of Della Robbia sculptures at the Bargello museum in Florence by the combined use of PIXE and XRF portable systems, Journal of Cultural Heritage 5 (2004) 183-188.
− Pappalardo L., A. Karydas, N. Kotzamani, G. Pappalardo, F.P. Romano, Ch. Zarkadas, Complementary use of PIXE-alpha and XRF portable systems for the non-destructive and in-situ characterization of gemstones in museums, Nuclear Instruments and Methods B 239 (2005) 114-121.
− Pedrazzani R., I. Alessandri, E. Bontempi, F. Cappitelli, M. Cianci, E. Pantos, L. Toniolo, L.E. Depero, Study of sulphation of Candoglia marble by means of micro X-ray diffraction experiments, Appl. Phys. A, (2006) in press.
− Perea A., B. Ambruster, G. Demortier, I. Montero, Atlantic technology for Mediterranean Gods. The Lebrija type gold "Candelara", Trabajos de Prehistoria 60(1) (2003)169-175.
− Perea A., A. Climont-Font, G. Demortier, J.C. Dran, I. Montero, "El Oro De Guarrazar", Proceedings III Congreso Nacional de Arqueometria, Eds : B.L.Tubio, M.A.Respaldiza, M-L. Pardo Rodriguez, Universidad de Sevilla, Fundacion El Monte (2001), 525-5
− Perea A., A. Climent-font, G. Demortier, J-C. Dran, I. Montero, T. Calligaro, E. Antoine, A European research collaboration : study of the Visighotic gold treasure of Guarrazar (Toledo), in press.
− Petroviciu I., J. Wouters, Analysis of Natural Dyes from Romanian 19th and 20th Century Ethnographical Textiles by DAD-HPLC, Dyes in History and Archaeology 18 (2002) 57-62.
− Petroviciu I., J. Wouters, I. Vanden Berghe, I. Cretu, Dyes in Some Textiles from the Romanian Medieval Art Gallery, Dyes in History and Archaeology 22, in press.
− Petroviciu I., J. Wouters, I. Vanden Berghe, I. Cretu, Dyes in Some 15th Century Byzantine Embroideries, Dyes in History and Archaeology 23, in press.
− Petroviciu I., J. Wouters, I. Vanden Berghe, I. Cretu, Analysis of Red Dyestuffs in 15th-17th Century Byzantine Embroideries from Putna Monastery, Romania, Dyes in History and Archaeology 24, in press.
230
− Pradell T., J. Molera, M. Vendrell, J. Perez-Arantegui, E. Pantos, M. Roberts, and M. M. DiMichiel, The role of cinnabar in lustre production, J.Am.Ceram.Soc. 87(6) (2004) 1018-1023.
− Roqué J., J. Molera, P. Sciau, E. Pantos, and M. Vendrell-Saz, Copper and silver nanocrystals in lustre lead glazes: development and optical properties, J.Europ.Ceramic Society, (2006), in press.
− Roqué J., N. Poolton, J. Molera, A. Smith, E. Pantos, M. Vendrell-Saz, X-ray absorption and luminescence properties of metallic copper nanoparticles embedded in a glass matrix, Phys .Stat. Solidi (2006) in press.
− Rudolf P., G. Demortier, B. Marino, C. Tamigniau, J. Riga, P. Louette, C. Coluzza, G. Gigante, A. Zappala, "The distribution of mass deacidification agents in paper studied by XPS, PIXE and PIGE", Proc. E-MRS 2001 Spring Meeting, Strasbourg, June 5-8/2001.
− Salvadó N., T. Pradell, E. Pantos, M.Z. Papiz, J. Molera, M. Seco and M. Vendrell-Saz, Identification of copper based green pigments in Jaume Huguet's Gothic altarpieces by Fourier transform infrared micro-spectroscopy and synchrotron radiation X-ray diffraction, J. Sync. Rad. (2002) Vol. 9, pp. 215-222.
− Gomez-Morilla I., A. Simon, R. Simon, C.T. Williams, A.Z. Kiss, G.W. Grime, An evaluation of the accuracy and precision of X-ray microanalysis techniques using BCR-126A glass reference material, Nuclear Instruments and Methods B (2006) doi:10.1016/j.nimb.2006.03.159.
− Smit Z., P. Pelicon, M. Holc, M. Kos, PIXE-PIGE characterization of medieval glass, Nuclear Instruments and Methods B 189 (2002) 344-349.
− Smit Z., K. Janssens, O. Schalm, M. Kos, Spread of facon-de-Venise glassmaking through central and western Europe, Nuclear Instruments and Methods B 213 (2004) 717-722.
− Smit Z., K. Janssens, K. Proost, I. Langus, Confocal micro-XRF depth analysis of paint layers, Nuclear Instruments and Methods B 219-220 (2004) 35-40.
− Smit Z., K. Janssens, E. Bulska, B. Wagner, M. Kos, I. Lazar, Trace element fingerprinting of facon-de-Venise glass, Nuclear Instruments and Methods B 239 (2005) 94-99.
− Smith A.D., T. Pradell, J. Molera, M. Vendrell, M.A. Marcus and E. Pantos, MicroEXAFS study into the oxidation states of copper coloured Hispano-Moresque lustre decorations. J. Phys. IV (2003) Vol.104 pp.519-522.
− Vella, D., Degrigny, C., Grech, M. Williams, A., Metallurgy of armour exhibited at the Palace Armoury Valletta, Malta, Proceedings of Metal 2004 (2004), 215-233.
− Zappala A., P. Rudolph, B. Marino, C. Tamigneau, J. Riga, P. Louette, C. Coluzza, G. Gigante, G. Demortier, Physical methods for evaluating the distribution of deacidificants in restaured paper materials, Proceedings "La Sciencia dell'Arte" in press.
− Zucchiatti A., A. Bouquillon, G. Lanterna, F. Lucarelli, P.A. Mandò, P. Prati, J. Salomon, M.G. Vaccari, PIXE AND micro-PIXE analysis of glazes from terracotta sculptures of the Della Robbia workshop, Nuclear Instruments and Methods B 189 (2002) 358-363.
− Zucchiatti A., A. Bouquillon, J. Castaing, J.R. Gaborit, Elemental analyses of a group of glazed terracotta angels from the Italian renaissance as a tool for
231
the reconstruction of a complex conservation history, Archaeometry 45 (2003) 391-404.
− Zucchiatti A., P. Prati, A. Bouquillon, L. Giuntini, M. Massi, A. Migliori, A. Cagnana, S. Roascio, Characterisation of early medieval frescoes by micro-PIXE, SEM and Raman spectroscopy, Nuclear Instruments and Methods B 219-220 (2004) 20-25
− Zucchiatti A., A. Bouquillon, I. Katona, A. D’Alessandro, The “Della Robbia blue”: a study case for the use of cobalt pigments in ceramics during the Italian renaissance, Archaeometry 48 (2006) 131-152.
− Zucchiatti A., A. Climent-Font, O. Enguita, M.T. Fernandez-Jimenez, G. Finaldi, C. Garrido, J.M. Matillas, PIXE analysis of Italian ink drawings of the xvi century, Nuclear Instruments and Methods B (2005) in press.
2. Conferences and Workshops
− 27-28 September 2001, Genoa (I), International G8 Workshop “Non-destructive Analyses in the Conservation/Restoration of Museum Objects”. No proceedings.
− 22-24 May 2002, Edinburgh (UK), Conference organized in collaboration with the Institute of Conservation Science, and The National Museums of Scotland “Conservation Science 2002”. Proceedings: Towsend J., Eremin K., Adriaens A. (editors), Conservation Science 2002. Archetype Publications: London (2003).
− 8 January 2004, Malta (MT), International G8 Workshop “Benefits of Non-destructive Analytical Techniques for Conservation”. Proceedings: Adriaens A., C. Degrigny, J. Cassar (editors), Benefits of Non-destructive Analytical Techniques for Conservation. EUR 21636. Luxembourg: Office for the Official Publications of the European Union, 2005, 122 pp., ISBN 92-898-0010-0.
− 9-10 June 2004, Ljubljana (SI), International G8 Workshop “Archaeometry with IBA and Related Methods”. Proceedings: special issue of Nuclear Instruments and Methods B
− 15 October 2004, Zurich (CH), International G8 Workshop “Inter-disciplinarity in Non-destructive Testing of Museums Objects”. Contributions available on web site.
− 15 April 2005, Bratislava, (SK), International G8 Workshop “In-situ non-destructive analysis and testing of museum objects”. No proceedings available.
− 22-23 May 2005, Jerusalem (IL), International Working Group meeting “Bio- and Material Culture at Qumran”. Proceedings: Gunneweg J., C. Greenblatt, A. Adriaens (editors), Bio- and Material Culture at Qumran, Luxembourg: Office for the Official Publications of the European Union, in press.
− 01 July 2005, Seville (ES), Special session of IBA conference “Archaeometry with IBA and related methods”. No proceedings available.
− 18-20 May 2006, Nicosia (CY), Final workshop of the Action “Non-destructive analysis and testing of museum objects”. Monograph in preparation.
232
3. Proceedings of Training Schools − 29/10-03/11/2004, Kalkara (Malta), Innovative tools for exhibition purposes:
environmental and damage assessment. CD with PowerPoint presentations of speakers.
4. Other
− Denker A., A. Adriaens, M. Dowsett, A. Giumlia-Mair (editors), Non-destructive analysis and testing of museum objects” in preparation.
5. Web site The G8 website, http://srs.dl.ac.uk/arch/cost-g8/index.htm, contains links to the aims and objectives of the action with contacts details of the national representatives in the management committee as well as to a database of members of a special interest group which contains information on each member's area of interest and expertise. The objectives and membership of the working group meetings, the agenda and minutes of MC meetings and the program and proceedings of associated workshops are also on the website and are free to access by anyone interested in the research topics addressed. All public mail shots issued to the special interest group membership and calls for STSM proposals are available. The website provides links to other meetings related to the activities of G8.
233

Glossary Activation A process whereby a material becomes radioactive due to
bombardment with particles such as neutrons. Atomic mass Roughly the sum of the numbers of protons and neutrons in
the nucleus of an atom (e.g. hydrogen 1; helium 4....). Atomic number The number of protons in the nucleus of an atom. For a neutral
atom, the number of electrons around the nucleus is the same. Barn A unit of area corresponding roughly to the cross-sectional
area of the uranium nucleus (10-28 m2). Origin of the term is by contrast of the extremely small with the large – ‘it’s as big as a barn-you can’t miss it’.
Beta- (β-) particles or radiation
High energy electrons which escape after being produced by radio-active decay in the nucleus of an atom.
CCD Charge-coupled device. A semiconductor array which converts light to electronic charge, and stores it locally (i.e. where the light struck the device) thus recording an image.
Electron The negatively charged particles found in a cloud around the nucleus of an atom, and also liberated from the nucleus during beta decay. A beam of free electrons can be generated by heating a tungsten wire in a vacuum, or by applying a large electric field to a sharply pointed metal tip. Such a beam is used as the probe in the electron microscope.
Energy levels Electrons which belong to a particular atom do not exist as individual particles, but as a waveform. The three-dimensional representation of this wave must fit into the space around the nucleus. With each waveform corresponding to an electron there is associated a specific energy which corresponds to the energy needed to release the electron from the atom. Thus the electrons are said to occupy discrete energy levels. (see also shell)
Fluorescence The electron cloud around the nucleus of an atom can absorb energy from incident particles such as electrons or X-rays. After a short time, the energy can be spontaneously re-radiated as electromagnetic radiation with specific energies (for example, if it were re-radiated as visible light, the light would be of colours specific to the atom, allowing the atom to be identified). This re-radiation process is called fluorescence, and occurs as an electron falls from a higher energy level to a lower one.
Flux ‘A flux of particles’ - a beam or particle flow. Gamma (γ) rays or radiation
High energy photons produced by radio-active decay in the nucleus of an atom.
Grating A device which, like a prism, will disperse light according to its wavelength (e.g. split white light into a rainbow).
235
Half-life Radioactive decay of a nucleus is a random process and for a
particular nucleus, one cannot say when it will occur. However, if I have n radioactive atoms of a particular type (e.g. potassium-40), where n is a very large number, the half-life is the time it takes for n/2 atoms to undergo radioactive decay (for potassium-40 this is 1 280 000 000 years, but for some elements it may be a small fraction of a second).
Ion, ionisation In a neutral atom, the number of electrons (negatively charged particles) is equal to the number of protons in the nucleus (positively charged particles). If one or more electrons are lost (ionisation), then the atom has a net positive charge and is called a positive ion. It is also possible for extra electrons to attach themselves to an atom, creating negative ions (see also shell, energy level).
Isotope Atoms of most chemical elements can exist in a stable form with several different atomic masses, corresponding to different numbers of neutrons in their nuclei. These atoms are known as isotopes. For example, silicon has three stable isotopes with atomic masses 28, 29, and 30. However, the addition of neutrons to a nucleus will also result in isotopes which are unstable - i.e. the nuclei are subject to radioactive decay (e.g. potassium-40, americium-241 (used in smoke detectors for the home)).
K-line (also L-line) When the most tightly bound shell (the K-shell) of an atom is ionised and an electron subsequently fills the shell by falling from a less tightly bound level, a high energy X-ray is emitted resulting in a K-line in the collected spectrum. The L shell is the next most tightly bound, so neutralisation of this shell results in lower energy X-rays (L-lines). Other shells are M, N… depending on the atomic number of the atom. (See also shell.)
Lithium drifted silicon detector
These detectors are used to count X-ray photons and other high energy particles such as ~MeV protons. They emit an electrical pulse whose height is dependent on the energy of the particle, so they are particularly useful in techniques involving X-ray and proton spectroscopy (e.g. EDX, PIXE, RBS).
Mean free path. The mean free path is the average distance a particle can travel in a medium (e.g. solid, liquid or gas) before interacting with it in some specified way - e.g. by being absorbed by an atomic nucleus.
Neutron One of the two particles found in the atomic nucleus. The neutron carries no electric charge and has a mass of 1.6749 × 10⁻²⁷ kg. Discovered by Chadwick in 1936 following work of Bothe, Becker, Curie (Irène) and Joliot. Neutrons are produced in a nuclear reactor, or by spallation (see Neutron spallation)
236
Neutron spallation A clever way of making a neutron beam without a reactor.
Accelerate the nuclei of hydrogen atoms (protons) to a very high velocity using electric fields and smash them into a target made of a heavy metal such as mercury. Neutrons are knocked or “spalled” out of the mercury nucleus, and suitable aperturing can select out a neutron beam.
Neutrons, cold Neutrons whose temperature is significantly below room temperature.
Neutrons, thermal Neutrons at around room temperature. Their mean velocity will be 2200 m/s.
Peltier Peltier, or Peltier cooled. A method using a semiconductor diode designed to transfer heat across its junction, thus cooling one end of the device (and anything attached thereto) and heating the other.
Photon The quantum of electromagnetic radiation viz: radio waves, infra red, visible light, X-rays, gamma rays. Whilst electromagnetic radiation travels as a wave, it interacts with matter in discrete packets of energy (quanta) or specifically, photons.
Proton One of two particles found in the atomic nucleus. The proton has a positive charge and a mass of 1.6726 × 10⁻²⁷ kg. Probably discovered by Rutherford in around 1918. A proton beam is easily made by ionising hydrogen gas.
Shell When describing the quantum structure of the atom, the electrons are considered to be in shells around the nucleus, and a specific small number of energy levels (and therefore electrons) is associated with each possible shell. If an electron is removed from a shell (e.g. by energetic photon or electron bombardment) the resulting “hole” will be filled after a very short time by an electron which “falls” from a lower energy shell. At the same time, the atom emits a characteristic photon (fluorescence) or electron (e.g. Auger electron) which allows it to be identified since the shell energy levels are unique to each atom. (See also energy level, K-lines, L-lines)
Silicon(lithium) or Si(Li) detector
See lithium drifted silicon detector
Spectrum A measurement of radiation intensity as a function of energy, frequency, wavelength, or mass depending on the type of radiation (e.g. light) or particle (e.g. atoms) involved. A rainbow is an example of a spectrum made from sunlight. If a rainbow is made using special instrumentation, bright and dark lines are seen superimposed on the 7 colours. These can be used to analyse the chemical composition of the sun (or a distant star), measure its rotational velocity, temperature, pressure, motion through space...)
237
Tomography If you were to project the shadow of your hand onto a screen,
and then slowly rotate the hand so that the shadow was formed from all angles, it would be possible by mathematically combining the information from different angles to reconstruct the shape of the outside of your hand. If the same thing is done to an object using a penetrating radiation such as X-rays or neutrons, the information can be mathematically processed to form a 3-dimensional solid model of the object which contains interior detail. This process is known as tomography.
Virtual An operation carried out on a model in computer memory and displayed using a graphics system. E.g. virtual section - a section through a 3D model of an object such as a statue.
X-ray Energetic electromagnetic radiation with a frequency between ultra-violet and gamma rays. X-rays are produced in the electron clouds of atoms with more than 3 electrons (e.g. from beryllium onwards in the periodic table) when the electron cloud has previously absorbed enough energy from somewhere to create a hole in a shell.
238

Back illustration:
The ‘Sky disk of Nebra’ (Bronze Age, excavated in 1999, restored, Landesmuseum für Vorgeschichte Sachsen-Anhalt/Halle): Non-destructive analysis of the gold applications using PIXE at the external proton beam (Research Centre Rossendorf, Dresden, Germany).
Stalk beaker (Krautstrunk), mid 16th Century, Ljubljana Glassworks, National Museum of Slovenia, Inv. No. N 1931, Photo: National Museum of Slovenia.
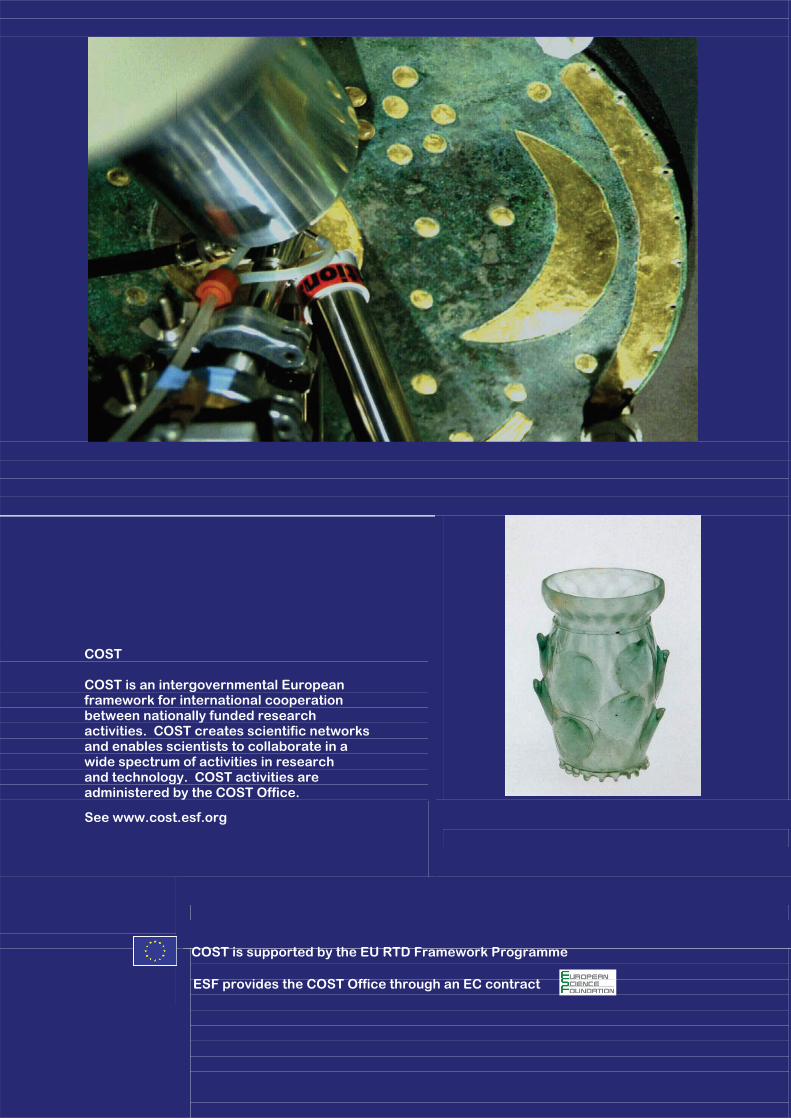
COST
COST is an intergovernmental European framework for international cooperation between nationally funded research activities. COST creates scientific networks and enables scientists to collaborate in a wide spectrum of activities in research and technology. COST activities are administered by the COST Office.
ESF provides the COST Office through an EC contract
COST is supported by the EU RTD Framework Programme
See www.cost.esf.org
Related Documents


