COSMOS Astronomy & Astrophysics Cluster 2014 PROJECT DESCRIPTIONS You will work on your research projects during Project Labs on Tuesday and Thursday from 1:15-4:00 pm. The labs are headed by Professor Tammy Smecker-Hane ([email protected]) and your teaching assistants. Each project will be done by a group of 2 to 3 students. Students will be assigned to a project group based on their stated interests. In Projects 7 – 8, students are given data taken previously for research projects done with large telescopes. In Projects 1 – 6, students actually will use the telescopes at the UCI Observatory to obtain their own data, guided by a teaching assistant or professor. One or two groups will be scheduled to use the Observatory each night Monday – Thursday nights of Weeks 1–3. When you get to computer lab, please bookmark our cluster’s web page, http://wwww.physics.uci.edu/ ˜observat/cosmos/cosmos index.html. On the menu on the left-hand side of the page, you will see up-to-date information on the nightly observing schedule, project groups, etc. Please check the observing schedule daily as things may change, especially if we have cloudy weather, and it is YOUR responsiblity to know which nights you are scheduled to observe and when to meet the van that will take you to the observatory that night. The following pages show a short description of the projects, the assigned reading and ques- tions for each. The reading assignments reference chapters, figures, tables, etc. in your textbook, 21st Century Astronomy (3rd Edition), by J. Hester, et al. (2010). Until you get data to work on, you will be reading and working on these questions during your project lab time on Tues/Thurs afternoons. The questions are designed to give you the background you need to do your specific project. You can work on the questions together with your lab partners. Once you are done with the questions, your TA will go over the answers with you, then you can proceed to work on your research project. Projects: 1. The Mass of Saturn Derived from the Orbital Periods of its Moons (Timothy Carleton) 2. Searching for Asteroids and Calculating Their Orbits (John Phillips) 3. Determining the Properties of an Eclipsing Binary System (Timothy Carleton) 4. Determining the Properties of Stars Using Stellar Spectra (John Phillips) 5. Measuring the Distance & Age of the Open Star Cluster M11 (Tammy Smecker-Hane) 6. Measuring the Distance & Age of the Globular Star Cluster M13 (Tammy Smecker-Hane) 7. Dark Matter in the Universe: Measuring the Rotation of Spiral Galaxies (Liuyi Pei) 8. Number Counts of Distant Galaxies and the Shape of the Universe (Liuyi Pei) 1

Welcome message from author
This document is posted to help you gain knowledge. Please leave a comment to let me know what you think about it! Share it to your friends and learn new things together.
Transcript

COSMOS Astronomy & Astrophysics Cluster 2014
PROJECT DESCRIPTIONS
You will work on your research projects during Project Labs on Tuesday and Thursday from1:15-4:00 pm. The labs are headed by Professor Tammy Smecker-Hane ([email protected]) andyour teaching assistants. Each project will be done by a group of 2 to 3 students. Students will beassigned to a project group based on their stated interests.
In Projects 7 – 8, students are given data taken previously for research projects done withlarge telescopes. In Projects 1 – 6, students actually will use the telescopes at the UCI Observatoryto obtain their own data, guided by a teaching assistant or professor. One or two groups willbe scheduled to use the Observatory each night Monday – Thursday nights of Weeks 1–3. Whenyou get to computer lab, please bookmark our cluster’s web page, http://wwww.physics.uci.edu/˜observat/cosmos/cosmos index.html. On the menu on the left-hand side of the page, you will seeup-to-date information on the nightly observing schedule, project groups, etc. Please check the
observing schedule daily as things may change, especially if we have cloudy weather,
and it is YOUR responsiblity to know which nights you are scheduled to observe and
when to meet the van that will take you to the observatory that night.
The following pages show a short description of the projects, the assigned reading and ques-tions for each. The reading assignments reference chapters, figures, tables, etc. in your textbook,21st Century Astronomy (3rd Edition), by J. Hester, et al. (2010). Until you get data to work on,you will be reading and working on these questions during your project lab time on Tues/Thursafternoons. The questions are designed to give you the background you need to do your specificproject. You can work on the questions together with your lab partners. Once you are done withthe questions, your TA will go over the answers with you, then you can proceed to work on yourresearch project.
Projects:
1. The Mass of Saturn Derived from the Orbital Periods of its Moons (Timothy Carleton)
2. Searching for Asteroids and Calculating Their Orbits (John Phillips)
3. Determining the Properties of an Eclipsing Binary System (Timothy Carleton)
4. Determining the Properties of Stars Using Stellar Spectra (John Phillips)
5. Measuring the Distance & Age of the Open Star Cluster M11 (Tammy Smecker-Hane)
6. Measuring the Distance & Age of the Globular Star Cluster M13 (Tammy Smecker-Hane)
7. Dark Matter in the Universe: Measuring the Rotation of Spiral Galaxies (Liuyi Pei)
8. Number Counts of Distant Galaxies and the Shape of the Universe (Liuyi Pei)
1

2

Project 1: The Mass of Saturn Derived from the Orbital Periods ofits Moons
In this project you will image Saturn and four of its moons (Tethys, Dione, Rhea, and Titan)with one of the portable 8-inch Meade LX200 telescopes and the SBIG ST-7 CCD camera at theUCI Observatory. By taking multiple images over the course of 4 to 5 nights, you will measure thechange in distance between Saturn and each moon as a function of time. Fitting a mathematicalcurve with sines and cosines to your data will allow you to determine the period (P ) and semi-majoraxis (a) of each moon’s orbit. Combining that information with Newton’s version of Kepler’s ThirdLaw,
P 2 =4πa3
G(M +m),
will allow you to calculate the mass of Saturn. In doing this experiment, you will learn howastrophysicists can deduce the mass of any object if it is orbitted by another body. This appliesto many important situations in astronomy such as a planet orbitting another star, stars orbittingthe black hole at the center of the Milky Way and dwarf galaxies orbits the Milky Way.
TA: Timothy CarletonEmail: [email protected]
Reading:
1. Appendix 1’s Section on “Angles and Distances” on pages A-5 to A-6 to learn about angles,radians, degrees, arcseconds and the Small Angle Approximation: θ = 206265 arcsec×(d/D).
2. Chapter 3 – Gravity and Orbits – A Celestial Ballet. Pay special attention to Section 3.5which develops the theory behind your project and Newton’s version of Kepler’s Third Law:P 2
∝ a3/M .
3. Chapter 5 – Tools of the Astronomer. Pay special attention to Sections 5.1 and 5.2 regardingangular resolution and CCD detectors.
4. Chapter 9 – Worlds of Gas and Liquid – The Gas Planets. Pay special attention to Sections9.1 and 9.2 on the gas giants.
5. Chapter 11, Sections 1 and 2 about the discoveries of Galileo and moons as unique worlds.
Questions to Answer:
1. Sketch a sine curve; show graphically the definition of the amplitude and period.
2. On Thursday, July 3, 2014, the average distance between the Earth and Saturn is 9.87 AU,where 1 AU = 1 Astronomical Unit, which is defined to be the average distance between theEarth and Sun over the course of a year. Look up in Appendix 2 of your textbook how manykm are in 1 AU. Look up the semimajor axis for each of the four satellites in Appendix 4of your textbook. What is the angular distance measured in units of arcminutes betweenSaturn and each of the moons at the farthest point in their orbits? Assume that the orbits
3
are inclined such that you are viewing the orbit nearly edge-on. To do this calculation, youshould use the small angle approximation:
θ =D
dradian,
where θ is the angular size of an object measured in radians, D is the physical diameter ofan object, and d is the object’s distance. These unit conversions are also helpful: 2 π radian= 360 degree, and 1 degree = 60 arcminute.
How does the maximum angular distance between the moons and Saturn compare withthe field of view of the SBIG ST-7 CCD on the portable Meade 8-inch telescope, which isabout 10.2 arcmin × 6.8 arcmin? Will you be able to see all four moons in one CCD image?Consider the situation when different moons happen to be on opposite sides of Saturn.
3. Look up the radius of Saturn in Appendix 4 of your textbook. If Saturn’s distance is 9.87 AUthen what is its angular diameter in arcseconds? What is its angular diameter in pixels onthe ST7? Note that the pixel scale of this camera is 0.80 arsec/pixel when used with theportable Meade 8-inch telescope.
4. Use the Starry Night software in Windows or the java applet athttp://www.skyandtelescope.com/observing/objects/javascript/saturn moons to view themotions of the four satellites of Saturn. Investigate their positions for the dates that youare schedule to observe at the UCI Observatory. See the observatory schedule on the web athttp://wwww.physics.uci.edu/˜observat/cosmos schedule.html and assume you’ll be workingfrom about 9 pm to midnight each night. Draw a diagram for yourself so you recognize whichsatellites are which on the CCD images. Note that sometimes the satellites may go behindor in front of Saturn and their positions will not be measureable. Don’t forget to mark Eastand West on your diagram!
5. If a moon or satellite of mass m maintains a stable circular orbit around a planet of massM then the centripetal acceleration the moon experiences (a = v2/r, where v is its velocity,and r is the distance between the center of the satellite and the center of the planet) mustbe equal to the acceleration due to gravity (a = F/m where F is the force due to gravity).Using what you have learned about the gravitational force F and how it depends on r, m andM , and the two facts given above, solve for the mass of the planet M in terms of the periodof its moon (P = v/2πr) and the radius r of the moon’s orbit.
Now use what you have derived in the following example. The Cassini satellite (seehttp://saturn.jpl.nasa.gov) is currently on a mission to study Saturn and its moons. Thesatellite was in orbit around Saturn and the orbit’s period was approximately 1 month. Howfar from the surface of Saturn was the satellite orbitting? Note that you can find the valueof Newton’s gravitational constant in Appendix 2 of your textbook.
4
Project 2: Searching for Asteroids and Calculating Their Orbits
In this project you will observe four star fields at different times and employ a techniqueknown as “blinking” in order to identify asteroids in the field. Even though asteroids are muchsmaller than stars, they are also much closer, which makes them appear as infinitely small, star-likeobjects when imaged with a telescope. This makes their identification confusing, as they can oftenbe mistaken for stars. However, their close proximity to the Earth also makes their apparent motionacross the sky much faster than the background stars. This allows us to identify asteroids by takingtwo images of the same region of the sky observed at different times and quickly flashing from oneto the other or “blinking” the images. While the background stars stay in the same positions, theasteroid will have moved, allowing us to identify it.
Once an asteroid has been identified its position can be measured using a technique knownas astrometry. This technique involves calculating the position on the image of the asteroid andat least two additional stars with known coordinates. The position of the asteroid can then bemeasured and its coordinates interpolated using the positions of the two reference stars.
After you have measured the coordinates of the asteroid at two different times, you will beable to calculate its motion across the sky or “proper motion” and predict its future position.In this project you will learn about coordinate systems and astrometry and how to measure thecoordinates of an unknown object and predict its motion across the sky.
TA: John PhillipsEmail: [email protected]
Reading:
1. Chapter 2 – Patterns in the Sky.
2. Chapter 3.2 – Kepler and Planetary Orbits.
3. Chapter 4 – Light. Pay special attention to Section 4.6.
4. Chapter 5 – Tools of the Astronomer. Pay special attention to Sections 5.1 and 5.2.
5. Chapter 12 – Asteroids, Meteorites, Comets, and Other Debris.
Questions to Answer:
1. Define Right Ascension (RA) and Declination (Dec). Why are angles in RA measured inhours, while angles in Dec are measured in degrees?
2. If object A has position (RA, Dec) = (12:15:40, −10:20:14) and object B has position (RA,Dec) = (12:35:12, −10:45:11), what is the distance between the two stars measured in units ofarcseconds? The following conversion from an angle of RA measured in seconds of time to anangle of RA measured in arcseconds be helpful: ∆RA (arcseconds) = ∆RA (timeseconds)×15 × cos (Dec). The factor of 15 is derived from the fact that in a full circle, there are 24hours, but there are 360◦, meaning for each hour there are 15 degrees. The cosine factor isnecessary because the only time the lines of RA are separated by 15 degrees for every hourin RA is right on the Celestial equator – the lines of RA gradually come together as you gethigher in declination, eventually meeting at the poles.
5
3. At 11:00 pm, you measure the position of an object in the sky to be (RA, Dec) = (14:32:10.0,+15:21:00). At 1:00 am, you measure the position again, and it is (RA, Dec) = (14:32:17.0,+15:19:45). What is the magnitude of the object’s proper motion, measured in arcsecondsper day?
4. For the above object, what do you predict its position will be at 11:00 pm the next night?
5. Where in the solar system are the largest number of asteroids found at the present time?Why? What can happen to cause them to be nudged out of their present orbit so theybecome asteroids that cross the Earth’s orbit?
6

Project 3: Determining the Properties of an Eclipsing BinarySystem
In this project you will use the UCI Observatory’s 24-inch telescope along with the ST-9CCD to observe a pair of eclipsing binary stars known as VW Cephei. Because the two stars in thisbinary are very close together and much farther away from us in comparison, the two stars appearsto be one single object, but the light you observe will be the combined light of both stars. Asthe one star in the system passes in front of the other, occulting part of its surface, the combinedcolor and brightness of the two stars will change with time in a periodic way. You will image theeclipsing binary over a few hours time on two different nights and measure the binary’s brightnessand color over time, which is known as a light curve. Your TA will continue observing for you afteryou leave the observatory so that you should be able to cover both the minimum and maximum ofthe binary’s light curve. By analyzing the light curve you will determine the relative temperaturesand radii of both stars and their orbital period. You will be surprised to learn just how close thetwo stars are to one another.
TA: Timothy CarletonEmail: [email protected]
Reading:
1. Chapter 4 – Light. Pay special attention to Sections 4.5 and 4.6.
2. Chapter 5 – Tools of the Astronomer. Pay special attention to Sections 5.1 and 5.2.
3. Chapter 13 – Taking the Measure of Stars
4. Appendix A of this document, which discusses stellar magnitudes.
5. Section 13.4 – Binary Stars. Very important!
Questions to Answer:
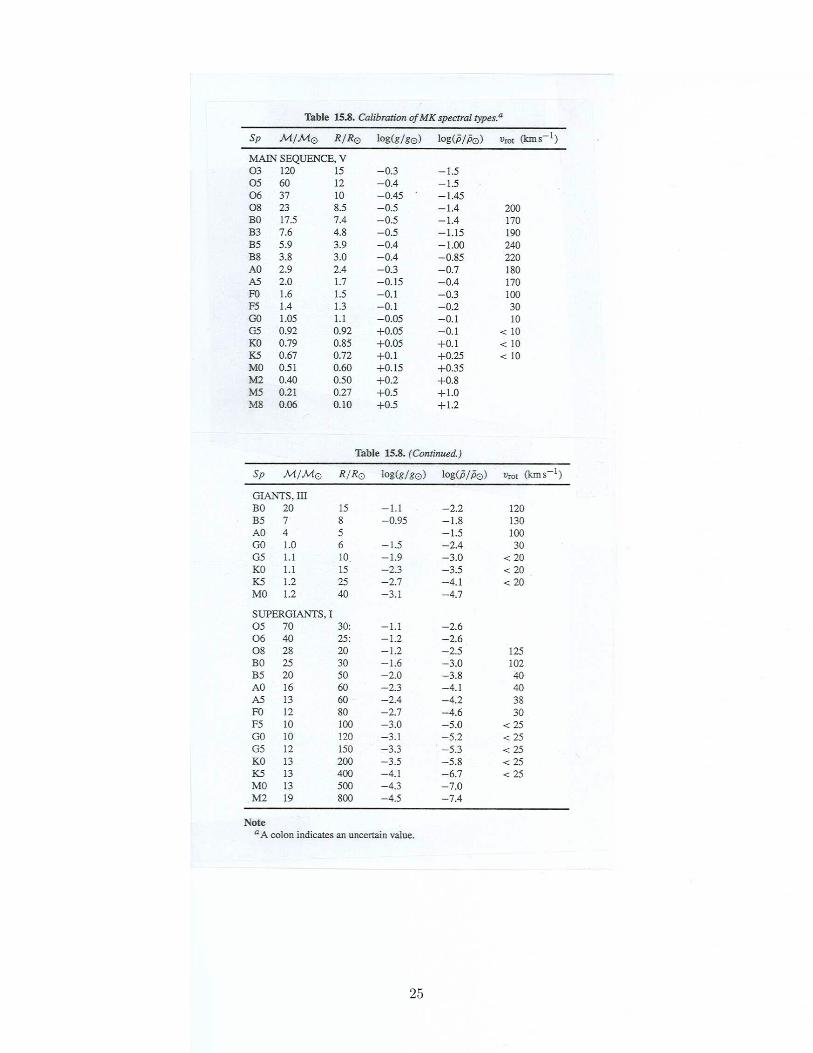
1. Use Table 15.8 in Appendix B of this document to find the luminosity and radius of a mainsequence star with each of the following spectral types: O5, B5, A5, F5, G5, K5, and M5.Note that the main property that sets the star’s features are its mass, which varies from 60 to0.5 solar masses for those spectral types, respectively. Then use the Stefan-Boltzmann Law
Φ =L
4πR2= σT 4
(page 383) to determine each star’s temperature. Check the values you derive against thosegiven in the table. Do they approximately agree?
2. Which stars are hotter, K stars or B stars? Which are bluer?
3. Go to this website:http://media.wwnorton.com/college/astronomy/animations/interactive/eclipsingbinarysim.htmlwhich has a simulation of an eclipsing binary system that allows you to explore how the lightcurve changes when you change the masses, radii, temperatures, orbital separations and or-bital eccentricity of the binary system. Explore the six different “Preset” simulations and
7

watch the animation to see how changing the stars’ properties changes the observed lightcurve. Then play with the settings for the stars and the System Orientation, meaning theorbital plane’s orientation), by either typing in a given number for the quantities or using theslider bars to change them, and see how the light curve varies. What sort of light curve doyou get if you choose two stars that have the same spectral type? What if you choose starswith very different spectral types? What happens when you change the inclination of theorbital plane? What happens if you change the eccentricity of the orbit (e = 0 for a circularorbit and e approaches 1 for a very elliptical orbit)? What about the orbital separation? Ifyou could choose exactly what the parameters would be for the binary you will observe, whatwould they be, and why?
4. Suppose you have a binary system with a semimajor axis of A = 1 AU and a period of P = 1year. Use Newton’s version of Kepler’s Third Law,
P 2 =4πA3
G(M1 +M2),
where M1 is the mass of the primary star and m1 is the mass of the secondary star and G isNewton’s graviational constant, determine the total mass of the binary system, (M1 +M2),in units of solar masses. You can use the Appendix in the back of your book to find G andthe definition of 1 AU. Also, note that 1 N = 1 kg m/s2. Why should this answer not be asurprise?
8

Project 4: Determining the Properties of Stars Using StellarSpectra
For this project you will use the UCI Observatory’s 24-inch telescope along with its spec-trograph and ST-8 CCD camera to observe spectra of a number of stars. A spectrum is simplythe amount of light the star emits in a narrow (approximately 1 Angstrom) wavelength interval.You will learn how to use the computer software program called IRAF to extract and calibratethe spectra. By analyzing the strength of absorption features that come from electrons bound todifferent chemical elements in the atmospheres of the stars such as hydrogen, calcium, iron andvarious molecules, you will be able to determine each star’s spectral type, and therefore estimate itssurface temperature and mass. You will discover that a wide range of spectral types exist, and itrefects the fact that stars can vary widely in temperature from 3,000 to 40,000 K and their massescan range from 0.08 to 100 times that of the Sun.
TA: John PhillipsEmail: [email protected]
Reading:
1. Chapter 4 – Light. Pay special attention to Sections 4.2 through 4.6.
2. Chapter 5 – Tools of the Astronomer. Pay special attention to Sections 5.1 and 5.2.
3. Chapter 13 – Taking the Measure of Stars, especially the part of Section 13.3 on stellar spectraand spectral type.
Questions to Answer:
1. Many of the important lines observed in stellar spectra are produced by absorption by hy-drogen atoms. The visible region of the spectrum is filled with lines from the Balmer series(see Figures 4.10-4.25). The energy of each atomic level is given by:
En =−13.6eV
n2,
where En is the energy of atomic level and 1 eV = 1.602 × 10⁻¹⁹ J. Use the fact that theenergy of a photon is related to its wavelength λ and frequency ν by
E = hν =hc
λ
to determine the wavelength of the following Balmer series transition lines:
Line Name Energy Level TransitionHα n = 3 → 2Hβ n = 4 → 2Hγ n = 5 → 2Hδ n = 6 → 2
9
2. Use Table 13.3 to find the mass and radius of a main-sequence star with each of the followingspectral types: O5, B5, A5, F5, G5, K5, and M5. Then, use the Stefan-Boltzmann Law andthe equation
L = 4πR2σT 4
(page 372) to determine each star’s temperature.
3. If star A is bluer than star B, which star has a hotter surface temperature?
4. You observe a star’s spectrum, which has a maximum brightness at a wavelength of 540 nm.Use Wien’s Law (page 115) to find the temperature of this star. What spectral type is thisstar?
10

Projects 5 & 6: Measuring the Distance and Age of a Star Clusterin the Milky Way
In this project, the students will use the UCI Observatory 24-inch telescope and ST-9 CCDcamera to image a star cluster in the V- and I-band filters and determine the distance and age ofthe star cluster. Two groups will do this project. One group will choose a Milky Way open cluster,and the other will choose a Milky Way globular cluster. Globular clusters contain some of the mostancient stars in the Milky Way, having ages of 12–13 billion years, which means they formed inthe first 1 to 2 billion years after the Big Bang, whereas most open star clusters are much youngerand range in age from a few hundred million to a few billion years. Most globular clusters lie inthe spherical halo of the Milky Way while open clusters lie in the disk of the Milky Way whereall current star formation occurs. Under the supervision from Professor Smecker-Hane, studentswill perform profile-fitting photometry on the images to automatically measure the brightnessesand colors of hundreds to thousands of the stars. This is a much more sophisticated method thanthe aperture photometry that all students will do in the CLEA lab called the HR Diagrams ofStar Clusters. In this project, students will create an observed Hertzsprung-Russel (HR) Diagramfor their star cluster and by overplotting theoretical stellar evolutionary models they will deducetheir cluster’s distance, age and chemical composition. In doing so, they also will learn about theformation and evolution our own Milky Way galaxy.
TA: Tammy Smecker-HaneEmail: [email protected]
Reading:
1. Chapter 4 – Light. Pay special attention to the electromagnetic spectrum, blackbody radia-tion and Wien’s Law. Pay special attention to Figure 4.21 on blackbody radiation.
2. Chapter 5 – Tools of the Astronomer. Read only Sections 5.1 and 5.2, optical telescopes andCCDs.
3. Appendix 6 – Observing the Sky. Read the section on Astronomical Magnitudes. Also readAppendix A – Stellar Magnitudes at the end of this document to learn about apparent andabsolute magnitudes.
4. Chapter 13 – Taking the Measure of Stars. Pay special attention to the definitions of magni-tudes, temperature and luminosity classifications of stars and the Hertzsprung-Russel (HR)Diagram.
5. Chapter 16 & 17 – Stars in the Slow Lane and Live Fast, Die Young. These chapters discusshow low and high mass stars evolve with time.
6. Chapter 19 – The Milky Way. Pay special attention to Section 19.3 that discusses how starclusters help us learn about the past evolution of the Milky Way.
Questions to Answer:
1. What is a CCD? To what wavelengths or colors of light are CCDs sensitive?
11
2. The V–band filter is about 100 nm (1 nanometer = 1 nm = 10−9 m) wide and centeredon a wavelength of 550 nm while the I–band filter is about 150 nm wide and centered on awavelength of 850 nm. If two main sequence stars have the same apparent brightness in theV–band, but star A has a spectral type of A0 and star B has a spectral type of K0. Whichstar will be brighter in the I–band image? Explain why. Hint: Use Table 13.3 - The MainSequence of Stars to determine the temperature of the stars. Then consider Figure 4.21,but imagine scaling the brightness of two curves so that they have the same brightness at awavelength of 550 nm.
3. Calculate the main-sequence lifetimes (the time spent in the main sequence phase of evolutionbefore the star evolved to become a giant) for stars with spectral types B0, A0 and G0. Assumetheir masses are 18, 3.2, 1.1 M⊙, respectively. Use the approximation that the main-sequencelifetime is given by
tMS ∝
M
L∝
M
M−3.5∝ M−2.5
and compare to the Sun, whose main-sequence lifetime is 1010 yrs, giving you a convienentway to calculate the main- sequence lifetime for any star of mass M ,
tMS =
(
M
M⊙
)−2.5
× 1010 yr.
4. If you obtained photometry of a star cluster and found that the brightest, bluest stars on itsmain sequence had a color similar to a main-sequence star with spectral type F0 then whatis the cluster’s age? You’ll find Table 13.3 - The Main Sequence of Stars and Figures 13.17and 17.16 on HR Diagrams useful in answering this question.
5. Describe four basic differences in the characteristics of open and globular clusters? Comparetheir ages, sizes, masses and the locations where you find them in the Milky Way.
6. The Milky Way’s globular clusters are all very old, 12–13 billion years. What clues does thisgive us to the evolution of the Milky Way? Hint: What may have been different between itsevolution in the first 1 to 2 billion years after the Big Bang compared to its later evolution?
12
Project 7: Dark Matter in the Universe: Measuring the Rotationof Spiral Galaxies
Dark matter plays a major role in our understanding of the universe because approximately90% of all the matter in the universe is dark matter and thus it contributes the most to thegravitational force in the universe. The high rotation rate of spiral galaxies is one indication thatmore mass is present in the galaxies than in the stars and gas that we can see. In this project,you will measure the mass in dark matter in nearby spiral galaxies by measuring the speeds atwhich gas clouds rotate around the centers of the galaxies. You will use optical long-slit spectraobtained with the Kitt Peak National Observatory 4-meter telescope, which has a much largerlight-gathering power than the UCI telescopes, and use the Doppler shift to measure the velocityof gas at given radii in the galaxies. You will compare with the amount of luminous matter (starsand gas) in the galaxies and deduce how much dark matter exists in them.
TA: Liuyi PeiEmail: [email protected]
Reading:
1. Chapter 3 – Gravity and Orbits, particularly Sections 3.4 and 3.5
• Learn about laws of motion:
- Newton’s Law of Gravity, Fgrav = Gm1m2
r2
- Newton’s version of Kepler’s 3rd Law, P 2 = 4π2r3
GM⊙
- Circular Velocity, Vcirc =√
GMr
Chapter 4 – Light, particularly Section 4.4 and 4.3
• Learn about orbital structure of atoms and how emission-line spectra are made (Section4.3).
• Learn about Doppler shift and how to use it to calculate velocity (Section 4.4).
2. Chapter 15.2 (Chapter 14.2 in the First Edition) – Interstellar Gas Has Different Temperatures& Densities
• Learn about HII regions.
3. Chapter 19.3 – Galaxies Are Mostly Dark Matter
• Read about galaxy rotation curves and dark matter.
4. Read Appendix A at the end of this document.
• Learn about luminosity, absolute magnitude and apparent magnitude.
• Learn how absolute and apparent magnitudes are related to distance: m = M +5 log(d/10 pc)
13

Questions to Answer:
1. Look up the period (P ) in years and semimajor axis (r) in kilometers of the Earth’s orbitaround the Sun in Appendix 4. Use Newton’s version of Kepler’s 3rd Law
P 2 =4π2r3
GM⊙
where M⊙ = MSun and G is the gravitational constant, to calculate the mass of the Sun inkilograms. Remember that the mass of the Earth is negligible compared to the mass of theSun. Next, find the mass of the Sun in units of Earth masses to determine how many Earthsits takes to equal the mass of the Sun. You can find the value of G and the definition of aNewton in Appendix 2. Be sure to use consistent units!
2. Look up the average orbital speed in km/s and semimajor axis in km of each of the planets inour solar system in Appendix 4. Make a plot of orbital speed vs. semimajor axis. Consideringthat almost all of the mass of the solar system is in the center (the Sun), what does this plottell you about how gravity behaves as a function of distance away from a point-like mass?
3. Explain why the absorption lines of an element have the same wavelengths as the emissionlines of that element. Sketch an atom absorbing and emitting light as part of your answer.
4. Consider four stars that are rotating clockwise around the center of a galaxy that is at restrelative to us (see Figure 1 below). If you look at this galaxy edge-on (like looking at theedge of a plate rather than looking straight down at a plate), which stars will you be able tomeasure a Doppler shift for? Why? Which stars will not have a Doppler shift? Why not?Now imagine that you are looking straight down at the galaxy rather than from the side.How will your answer change?
Figure 1: Consider an astronomer viewing the motions of four different stars in a galaxy. Each starorbits the center of the galaxy in a circular orbit at roughly the same distance from the center.
5. You will be measuring the Hydrogen emission line Hα (‘H-alpha’) in nearby galaxies. Hαcomes from electrons making the transition from the n = 3 → 2 levels. Because these galaxiesare moving away from the Milky Way, the wavelength of Hα will be redshifted away from itsrest wavelength of 6563 A (Angstroms). Use the Doppler equation
vr =λ1 − λ0
λ0
c
14

where λ1 = λobserved, λ0 = λrest, c is the speed of light, and vr is the radial velocity, and thegalaxies’ recession velocities (listed in Table 1 below) to determine the wavelength of Hα foreach galaxy. You can find the speed of light in Appendix 2.
Galaxy V (km s−1)
UGC 477 2675UGC 3587 1284NGC 2998 4786
6. Imagine a (spherical) galaxy has a constant density (ρ). Recall that
ρ = MassV olume
and V olume = 4
3πR3.
for a sphere. Using the equation for circular speed,
Vcirc =
√
GM
R
how does the velocity of a star on a circular orbit change as a function of radius inside thegalaxy? How does the velocity change outside the galaxy? (Hint: Look at the plot you drewin Problem 2.) Use your answers to draw the expected rotation curve for a galaxy.
15

16
Project 8: Number Counts of Distant Galaxies and the Shape ofthe Universe
For this project, you will use deep astronomical images of galaxies from the WIYN telescopeon Kitt Peak, located near Tucson, Arizona (http://www.noao.edu/wiyn), which has a much largerlight-gathering power than our UCI telescopes. Most of the galaxies in the images are very faintbecause they are billions of light years away from us. You will make some simple assumptions,identify and count the galaxies in the images using an automated computer program, and use theresults to estimate the shape of the universe: open, flat or closed. The answer has implications onthe fate of the Universe. Following the Big Bang, will the universe continue expanding forever orwill it recollapse in a Big Crunch? Similar galaxy-counting techniques, combined with measures ofthe distances to these galaxies, are frequently used by astronomers to observe how galaxies evolveover cosmic time.
(NOTE: This project was designed by Professor Liese van Zee at Indiana University.)
TA: Liuyi PeiEmail: [email protected]
Reading:
1. Chapter 4 – Light
2. Chapter 5 – Tools of the Astronomer. Read Sections 5.1 and 5.2, which focus on the electro-magnetic spectrum, CCDs and optical telescopes.
3. Chapter 18 – Our Expanding Universe. Focus on the cosmic distance ladder, redshift, Hub-ble’s Law and the shape of space (flat, positively curved or negatively curved), which is centralto your project.
4. Chapter 19 – Galaxies
5. Chapter 22 – Origin of Structure. Read Sections 21.1-21.3 that focus on giant systems oftens, hundreds, and thousands of galaxies known to populate the universe.
Questions to Answer:
1. At our distance from the Sun, which is d = 1 AU = 1.5 × 10¹¹ m), the observed flux ofradiation that we get from the Sun is f = 1370 Watts/m2. What is the total luminosity ofthe Sun, L⊙, in units of Watts given that
f =L⊙
4πd2?
To understand the basis of this equation, consult Section 4.6 - Twice as Far Means One-Fourthas Bright.
2. Suppose a fictional galaxy is made up of 100 million stars that are identical in luminosity tothe Sun, and this galaxy is located at a distance of d = 1000 Megaparsecs, where 1 Megaparsec= 1 Mpc = 106 pc. How much energy per unit time would a telescope with a cirular 3.5-meter
17
(diameter) primary mirror receive from this galaxy? Note that the energy received per unittime is the galaxy’s flux at this distance, f , times the area of your telescope, which is equalto πd2
tel/4, and the flux of a galaxy at a distance d is equal to
f =L
4πd2,
where L is the total luminosity of this galaxy. (Neglect any effects caused of the expansionof the universe.)
3. Suppose that 5% of the energy of this galaxy is emitted in the R–band. Assume, for the sakeof argument, that R–band photons all have a wavelength of 6500 Angstroms (1 Angstrom= 10−10 m). If the telescope plus the detector have a total efficiency is 50%, how many R–band photons per second does the telescope intercept from the galaxy? Note that a photonwith wavelength, λ, carries an amount of energy E that is equal to
E =hc
λ
where h is Planck’s constant and c is the speed of light. You can loook up these quantitiesin Appendix 2 of your textbook. (Again, neglect any effects caused by the expansion of theuniverse.)
4. Suppose every galaxy in the universe has the same luminosity, which is not true, but is acommon simplifying assumption. How does the flux from each galaxy vary as a function ofour distance to the galaxy? Assume these galaxies inhabit the universe with a number densityequal to ρ = N/V , where N is the number of galaxies in a volume V whose radius is r andρ has units of galaxies per cubic megaparsec. How does the number of galaxies N havingdistances less than or equal to r vary as a function of r and ρ?
5. Combine your expressions from Problem 4 to eliminate r and count the expected numberdensity of sources as a function of their flux in a flat universe. How would the answer changeif space is positively or negatively curved? Read Sections 17.7 and 18.5 to understand howspace can be curved by the presence of mass and the application of this idea to the universeas a whole.
6. Describe the assumptions made for Problems 2-5. How accurate are these assumptions? Howdoes the real universe differ from our simple model? What effects will these differences haveon the final answer in Problem 5? You might want to skim Chapter 19 - Galaxies for someinsights into the answers to this question.
18
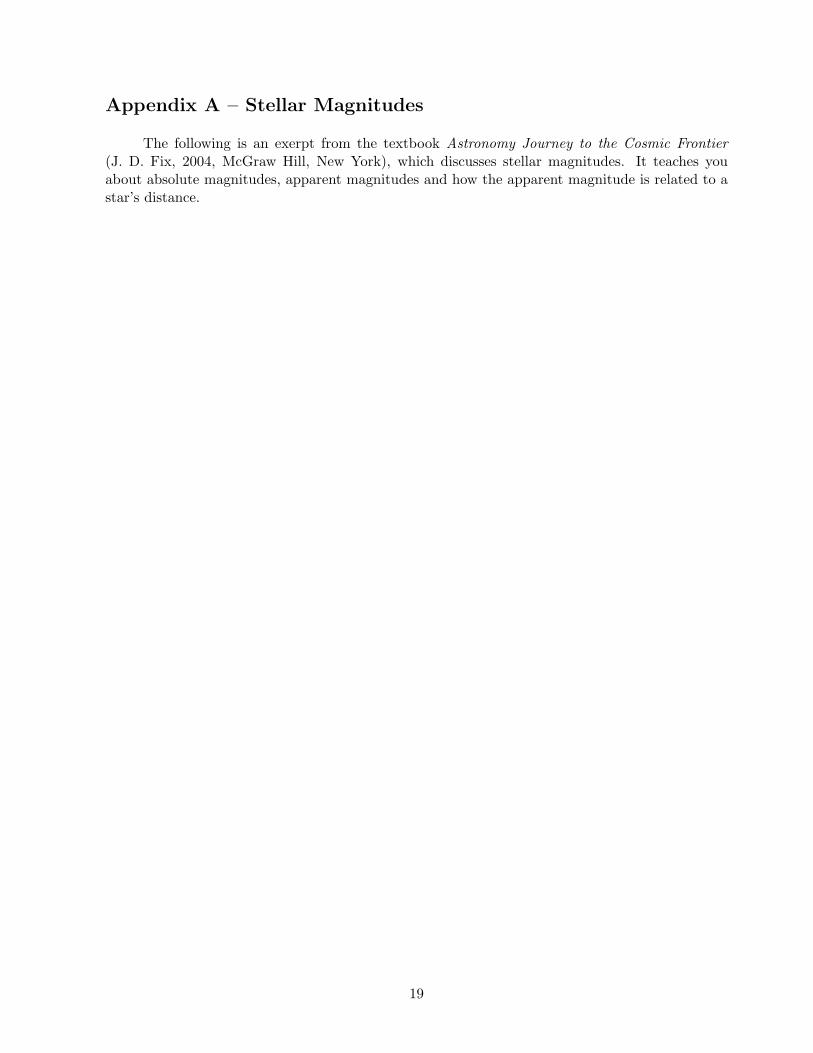
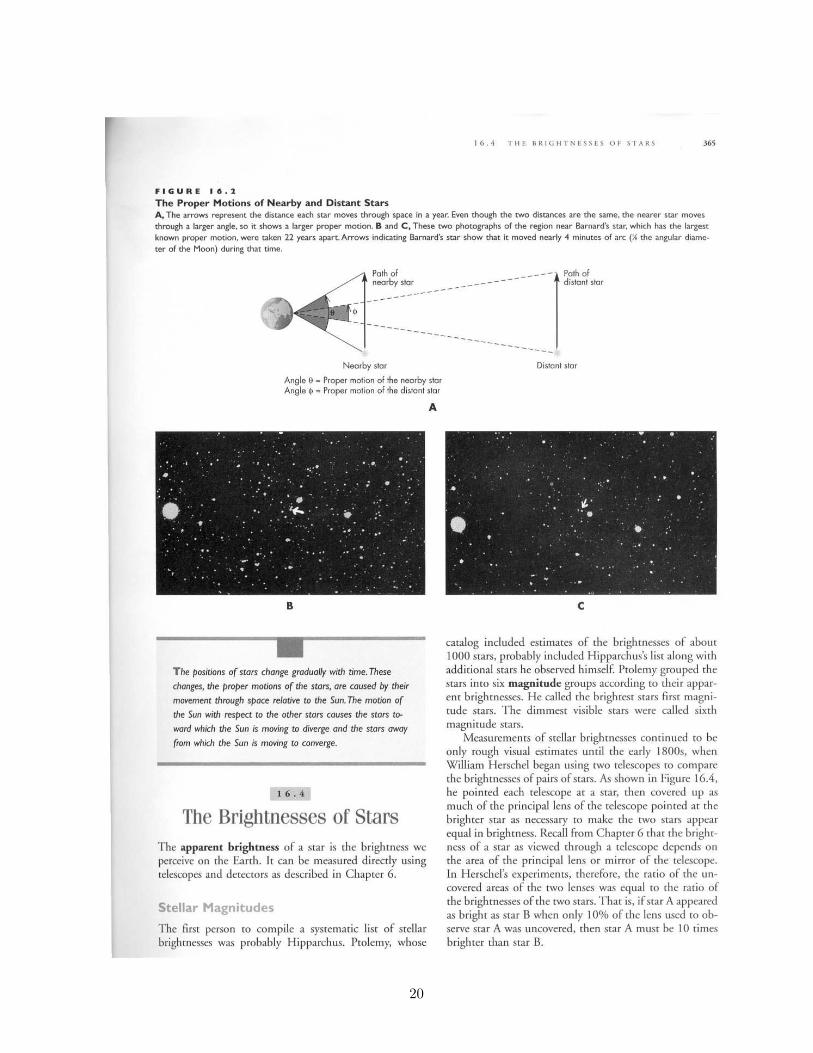
Appendix A – Stellar Magnitudes
The following is an exerpt from the textbook Astronomy Journey to the Cosmic Frontier(J. D. Fix, 2004, McGraw Hill, New York), which discusses stellar magnitudes. It teaches youabout absolute magnitudes, apparent magnitudes and how the apparent magnitude is related to astar’s distance.
19
20

21
22

23

Appendix B - Properties of Stars
The following tables, Tables 15.7–15.9 from “Allen’s Astrophysical Quantities” (A. N. Cox,2006, Springer-Verlag, New York) give you some useful information on the properties of stars.
24
25

26
Related Documents