Cosmological Tests using Redshift Space Clustering in BOSS DR11 (Y. -S. Song, C. G. Sabiu, T. Okumura, M. Oh, E. V. Linder) following Cosmological Constraints from the Anisotropic Clustering Analysis using BOSS DR9 (E. V. Linder, M. Oh, T. Okumura, C. G. Sabiu, Y.-S. Song) CosKASI (Cosmology group at Korea Astronomy and Space Science Institute) Minji Oh

Welcome message from author
This document is posted to help you gain knowledge. Please leave a comment to let me know what you think about it! Share it to your friends and learn new things together.
Transcript

Cosmological Tests using Redshift Space Clustering
in BOSS DR11(Y. -S. Song, C. G. Sabiu, T. Okumura, M. Oh, E. V.
Linder)
followingCosmological Constraints
from the Anisotropic Clustering Analysis using BOSS DR9(E. V. Linder, M. Oh, T. Okumura, C. G. Sabiu, Y.-S. Song)
CosKASI(Cosmology group at Korea Astronomy and Space Science Institute)
Minji Oh

2015 High1
Contents
MotivationRedshift Space Distortion(RSD)Measurements– Distances & Cosmic growth rate with Simula-
tionResults– Combined, Northern and Southern maps of
DR11Testing CosmologyConclusion

2015 High1
Contents
MotivationRedshift Space Distortion(RSD)Measurements– Distances & Cosmic growth rate with Simula-
tionResults– Combined, Northern and Southern maps of
DR11Testing CosmologyConclusion

2015 High1
Motivation
• As known, the Universe is undergoing the accelerated expansion.
• To understand the nature of Cosmic Accel-eration(CA), which is caused by, so-called, ‘Dark energy’, several models such as cos-mological constant, dynamic scalar field, and modified gravity, etc. were suggested.
• Among these, finding out the best descrip-tion for CA is one of the most challenging problems in cosmology.
2015 High1
Motivation
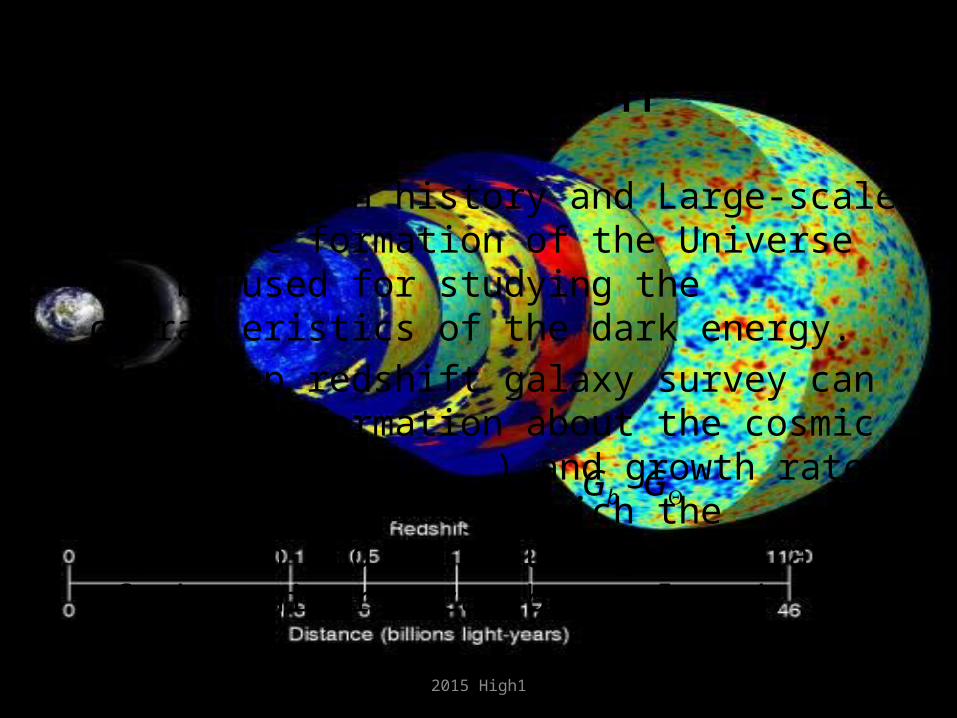
• The expansion history and Large-scale structure formation of the Universe can be used for studying the characteristics of the dark energy.
• Wide-deep redshift galaxy survey can provide information about the cosmic distances( DA, ) and growth rate ( , ) through which the expansion and struc-ture growth rate of the Universe can be explored.
1H bG G

2015 High1
Contents
MotivationRedshift Space Distortion(RSD)Measurements– Distances & Cosmic growth rate with Simula-
tionResults– Combined, Northern and Southern maps of
DR11Testing CosmologyConclusion
2015 High1
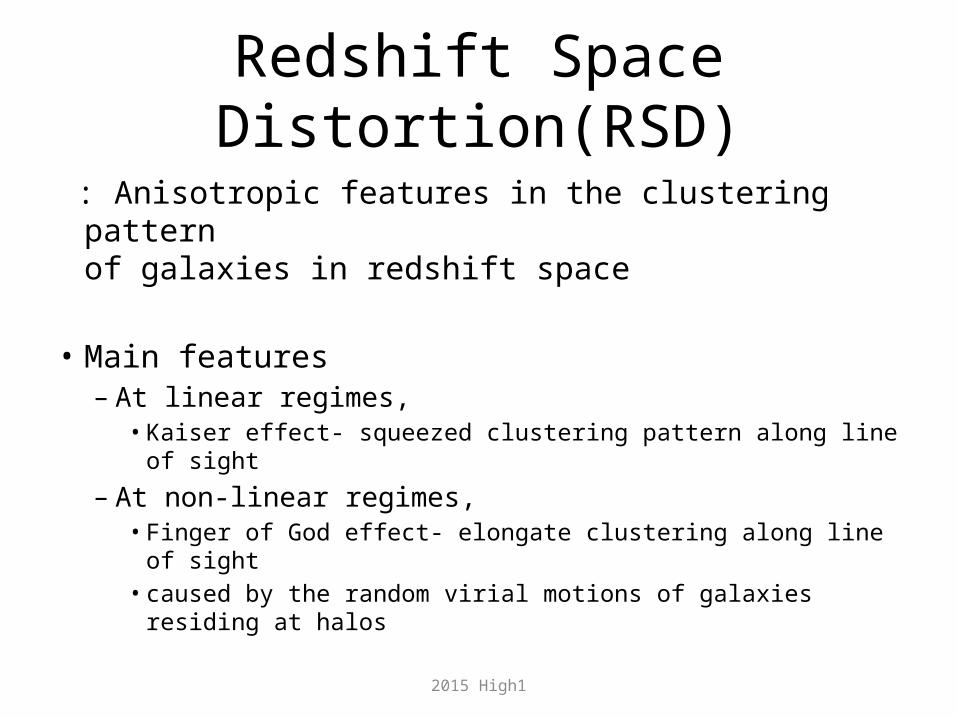
Redshift Space Distortion(RSD)
: Anisotropic features in the clustering pattern of galaxies in redshift space
• Main features– At linear regimes,
• Kaiser effect- squeezed clustering pattern along line of sight
– At non-linear regimes,• Finger of God effect- elongate clustering along line of
sight• caused by the random virial motions of galaxies residing
at halos

2015 High1
Redshift Space Distortion(RSD)
• Improvement in 2D Power spectrum in redshift space– Kaiser(1987)
– Scoccimarro(2004)
– Taruya, Nishimichi, and Saito (Improved)(2010) )( ),(),()()(2)( ),(
~ 42p
FoGTNS kGkBkAkPkPkPkP
)()(2)(),( 42 kPkPkPkP linlinlinKaiser
)( )()(2)( ),(~ 42
pFoG
oscoccimarr kGkPkPkPkP
2015 High1
Redshift Space Distortion(RSD)
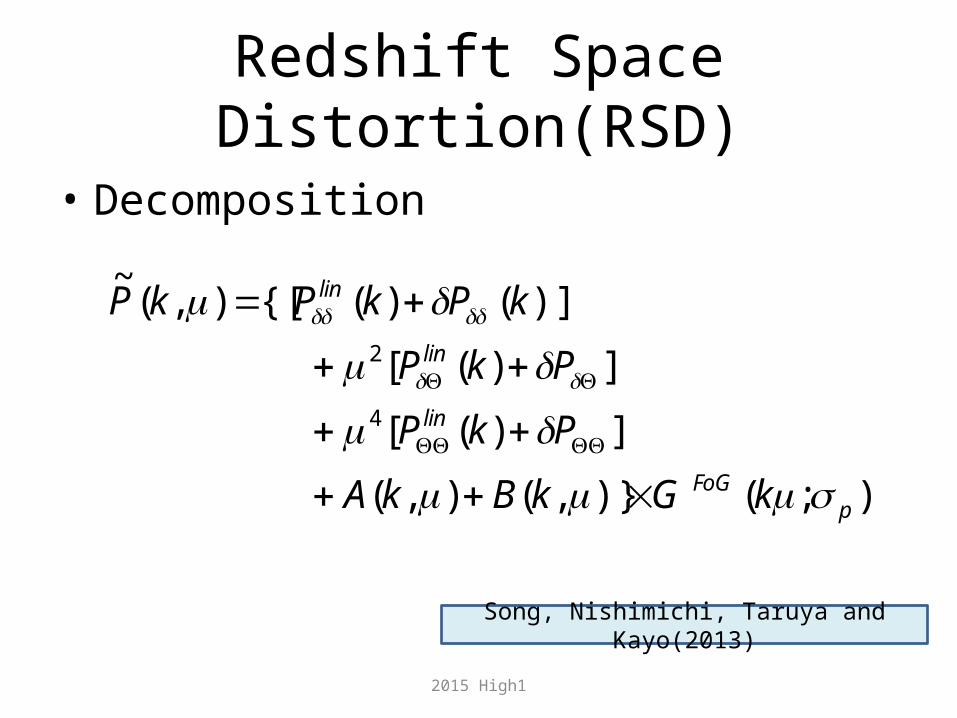
• Decomposition
);()},(),(
])([
])([
)]()({[),(~
4
2
pFoG
lin
lin
lin
kG kBkA
PkP
PkP
kPkPkP
Song, Nishimichi, Taruya and Kayo(2013)

2015 High1
Redshift Space Distortion(RSD)
- Comparison with simulation
Song, Nishimichi, Taruya and Kayo(2013)

2015 High1
Redshift Space Distortion(RSD)
• From to– in more explicit form
),( s),(~ kP
),(~ kP
])(exp[)]()()()([),(~ 2
66
44
22
0 pTNS kkQkQkQkQkP

2015 High1
Redshift Space Distortion(RSD)
• From to– By Fourier transformation
spolynomial Legendre theis where)()(
),(~
)2(),(
3
3
lleven
ll
skis
PPs
ekPkd
),( s),(~ kP
2122 ,/ /)π(σssν
...... )](5)(105)(315)(231[16/13)(
)](3)(30)(35[8/9)(
)]()(3[2/5)(
)()(
)()()(
01236
0124
012
00
2
kpkpkpkpkP
kpkpkpkP
kpkpkP
kpkP
ksjkdkPkis lll
l
22
62/7
42/5
22/3
02/1 )](/),2/7()(/),2/5()(/),2/3()(/),2/1([2/1)(
p
nnnnn
k
kQnkQnkQnkQnkp
Song, Okumura and Taruya(2014)

2015 High1
Redshift Space Distortion(RSD)
- Correlation functionSong, Okumura, and
Taruya(2014)
- The dotted: theory with simple Kaiser and Gaussian FoG effect- The solid: the improved/ blue filled contour: the observed using simu-lated map- Level: (0.2, 0.06, 0.016, 0.005, 0.002, -0.001, -0.006)
),( s),(
),(),(2),(),(
RR
RRDRDD
Landy & Szalay (1993)

2015 High1
Contents
MotivationRedshift Space Distortion(RSD)Measurements– Distances & Cosmic growth rate with Simula-
tionResult– Combined, Northern and Southern maps of
DR11Testing CosmologyConclusion

2015 High1
Measurement: distancesDecrease DA by 10%
(Thin black solid to thin blue dashed)
Decrease H-1 by 10%(Thin black solid to thin blue
dashed)
-The BAO circle :squeezed along the transverse direction
-The BAO circle :squeezed along the radial direction
Song, Okumura and Taruya et al.(2013)

2015 High1
Measurement: structure formationIncrease Gb by 10%
(Thin black solid to thin blue dashed)
Increase Gtheta by 10%(Thin black solid to thin blue
dashed)
- The BAO tip points move counter-clockwise- 2D BAO circle: inv.
- The BAO tip points shrink toward the pivot point- 2D BAO circle: inv.Song, Okumura and Taruya et al.
(2013)

2015 High1
Measurement: cut-off
Scut
σcut
1/222 )π(σ s
2015 High1
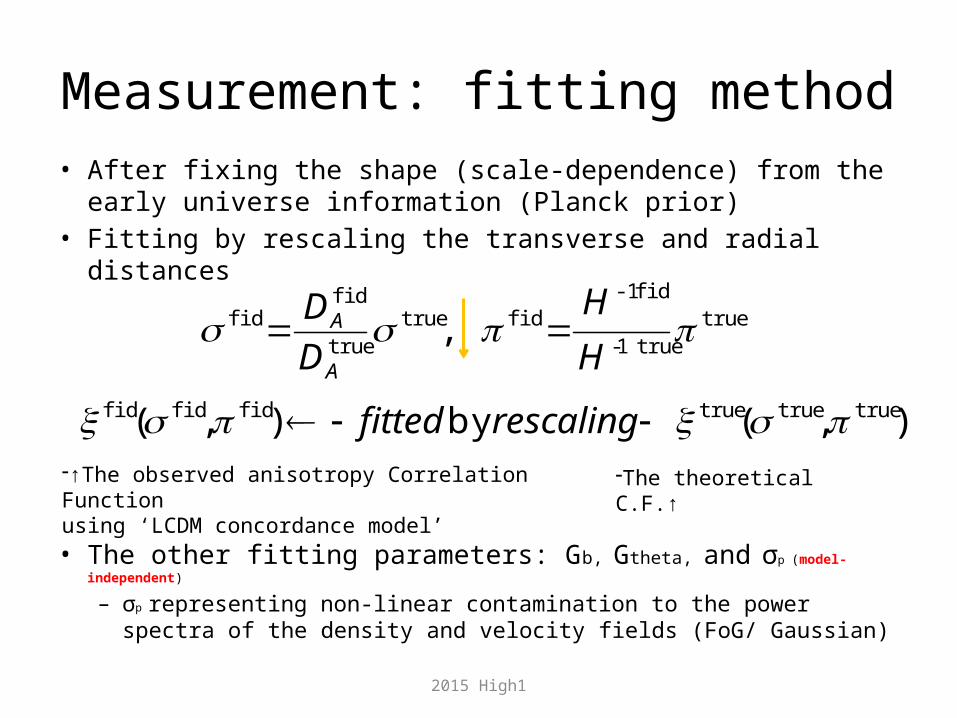
Measurement: fitting method• After fixing the shape (scale-dependence) from the
early universe information (Planck prior)• Fitting by rescaling the transverse and radial distances
• The other fitting parameters: Gb, Gtheta, and σp (model-indepen-dent)
– σp representing non-linear contamination to the power spectra of the density and velocity fields (FoG/ Gaussian)
),( by ),(
,
truetruetruefidfidfid
true true1-
fid -1fidtrue
true
fidfid
rescalingfitted
H
H
D
D
A
A
-↑The observed anisotropy Correlation Func-tionusing ‘LCDM concordance model’
-The theoretical C.F.↑
2015 High1
Contents
MotivationRedshift Space Distortion(RSD)Measurements– Distances & Cosmic growth rate with Simula-
tionResults– Combined, Northern and Southern map of
DR11Testing some CosmologyConclusion
2015 High1
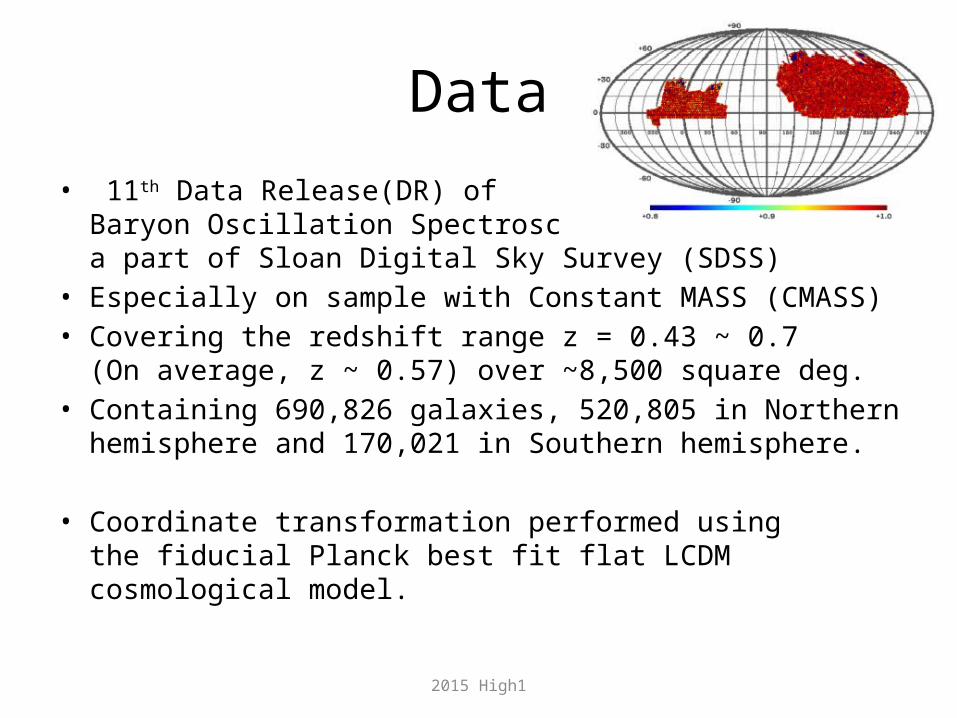
Data
• 11th Data Release(DR) of Baryon Oscillation Spectroscopic Survey (BOSS), a part of Sloan Digital Sky Survey (SDSS)
• Especially on sample with Constant MASS (CMASS)• Covering the redshift range z = 0.43 ~ 0.7
(On average, z ~ 0.57) over ~8,500 square deg.• Containing 690,826 galaxies, 520,805 in Northern
hemisphere and 170,021 in Southern hemisphere.
• Coordinate transformation performed using the fiducial Planck best fit flat LCDM cosmological model.

2015 High1
Result- applying on BOSS DR11 -
- The thin black solid represents the best fit and the thin dashed ‘LCDM concor-dance’model - The contour level=(0.2, 0.06, 0.016, 0.005, 0.002, -0.001, -0.006) from the inner one
2015 High1
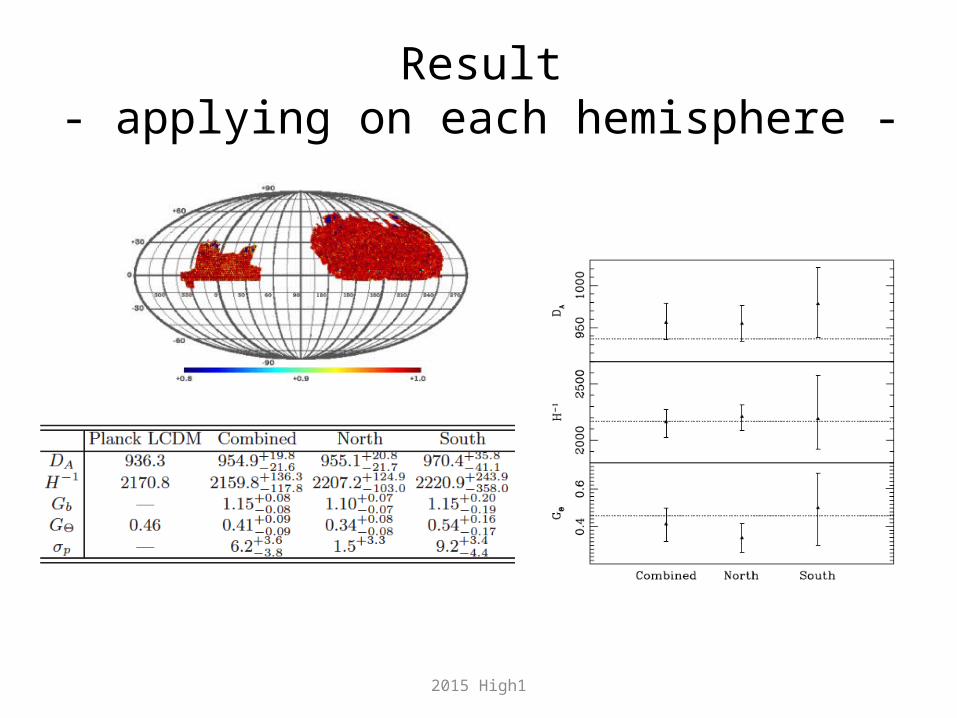
Result- applying on each hemisphere -

2015 High1
Contents
MotivationRedshift Space Distortion(RSD)Measurements– Distances & Cosmic growth rate with Simula-
tionResults– Combined, Northern and Southern maps of
D11Testing CosmologyConclusion

2015 High1
Testing Cosmology
• Several consistency-check on
• Friedmann-Robertson-Walker (FRW) cosmologyusing relation between DA and
• General relativity and FRWusing the relation between and
1H
1H

2015 High1
Testing Cosmology“Planck early universe prior”
DA-Hinv plane Gtheta-DA plane Gtheta-Hinv plane
- Our model-independent analysis agrees within the 68% confidence level with the cosmology that assumed LCDM and GR

2015 High1
Contents
MotivationRedshift Space Distortion(RSD)Measurements– Distances & Cosmic growth rate with Simula-
tionResults– Combined, Northern and Southern maps of
DR11Testing CosmologyConclusion

2015 High1
Conclusion
• Using BOSS DR11 CMASS sample with Planck CMB prior,• model-independent 2D redshift clustering analysis allow
us to:
– measure the angular diameter distance DA, Hubble scale Hinv, and growth rate Gtheta, which are consistent with Planck LCDM prediction
– test several cutoff on the small scale and find that convergence is achieved for >40h/Mpc
– find consistency with FRW and GR within 68% CL– compare the measurements from North and South sky samples
and find consistency with Planck LCDM
σcut

2015 High1
Thank you :)
Related Documents