This is a peer-reviewed, post-print (final draft post-refereeing) version of the following published document: Cosgrove, Catherine L, Wood, Matthew J ORCID: 0000-0003- 0920-8396, Day, Karen P and Sheldon, Ben C (2008) Seasonal variation in Plasmodium prevalence in a population of blue tits Cyanistes caeruleus. Journal of Animal Ecology, 77 (3). pp. 540-548. doi:10.1111/j.1365-2656.2008.01370.x Official URL: http://onlinelibrary.wiley.com/doi/10.1111/j.1365-2656.2008.01370.x/abstract DOI: http://dx.doi.org/10.1111/j.1365-2656.2008.01370.x EPrint URI: https://eprints.glos.ac.uk/id/eprint/552 Disclaimer The University of Gloucestershire has obtained warranties from all depositors as to their title in the material deposited and as to their right to deposit such material. The University of Gloucestershire makes no representation or warranties of commercial utility, title, or fitness for a particular purpose or any other warranty, express or implied in respect of any material deposited. The University of Gloucestershire makes no representation that the use of the materials will not infringe any patent, copyright, trademark or other property or proprietary rights. The University of Gloucestershire accepts no liability for any infringement of intellectual property rights in any material deposited but will remove such material from public view pending investigation in the event of an allegation of any such infringement. PLEASE SCROLL DOWN FOR TEXT.

Welcome message from author
This document is posted to help you gain knowledge. Please leave a comment to let me know what you think about it! Share it to your friends and learn new things together.
Transcript

This is a peer-reviewed, post-print (final draft post-refereeing) version of the following publisheddocument:
Cosgrove, Catherine L, Wood, Matthew J ORCID: 0000-0003-0920-8396, Day, Karen P and Sheldon, Ben C (2008) Seasonal variation in Plasmodium prevalence in a population of blue tits Cyanistes caeruleus. Journal of Animal Ecology, 77 (3). pp.540-548. doi:10.1111/j.1365-2656.2008.01370.x
Official URL: http://onlinelibrary.wiley.com/doi/10.1111/j.1365-2656.2008.01370.x/abstractDOI: http://dx.doi.org/10.1111/j.1365-2656.2008.01370.xEPrint URI: https://eprints.glos.ac.uk/id/eprint/552
Disclaimer
The University of Gloucestershire has obtained warranties from all depositors as to their title in the material deposited and as to their right to deposit such material.
The University of Gloucestershire makes no representation or warranties of commercial utility, title, or fitness for a particular purpose or any other warranty, express or implied in respect of any material deposited.
The University of Gloucestershire makes no representation that the use of the materials will notinfringe any patent, copyright, trademark or other property or proprietary rights.
The University of Gloucestershire accepts no liability for any infringement of intellectual property rights in any material deposited but will remove such material from public view pending investigation in the event of an allegation of any such infringement.
PLEASE SCROLL DOWN FOR TEXT.
This is a peer-reviewed, pre-print (final draft post-refereeing) version of the following published document:
Cosgrove, Catherine L. and Wood, Matthew J. and Day, Karen P. and Sheldon, Ben C. (2008). Seasonal variation in Plasmodium prevalence in a population of blue tits Cyanistes caeruleus. Journal of Animal Ecology, 77 (3) 540-548.
Published in the Journal of Animal Ecology, and available online at:
http://onlinelibrary.wiley.com/doi/10.1111/j.1365-2656.2008.01370.x/abstract
We recommend you cite the published (post-print) version.
The URL for the published version is
http://dx.doi.org/10.1111/j.1365-2656.2008.01370.x
Disclaimer
The University of Gloucestershire has obtained warranties from all depositors as to their title in the material deposited and as to their right to deposit such material.
The University of Gloucestershire makes no representation or warranties of commercial utility, title, or fitness for a particular purpose or any other warranty, express or implied in respect of any material deposited.
The University of Gloucestershire makes no representation that the use of the materials will not infringe any patent, copyright, trademark or other property or proprietary rights.
The University of Gloucestershire accepts no liability for any infringement of intellectual property rights in any material deposited but will remove such material from public view pending investigation in the event of an allegation of any such infringement.
PLEASE SCROLL DOWN FOR TEXT.
Seasonal variation in Plasmodium prevalence in a population of 1
blue tits Cyanistes caeruleus 2
3
Catherine L. Cosgrove1†‡, Matthew J. Wood1*†, Karen P. Day2 & Ben C. Sheldon1 4
5
1 Edward Grey Institute, Department of Zoology, University of Oxford, South 6
Parks Road, Oxford OX1 3PS, UK 7
2 Department of Medical Parasitology, New York University, 341 East 25th Street, 8
New York, NY 10010, USA 9
10
* Corresponding author: [email protected] 11
Telephone +44 1865 281999 12
Fax +44 1865 271168 13
† Joint first authors 14
‡ Current address: The Wellcome Centre for Human Genetics, Roosevelt Drive, 15
Oxford OX3 7BN, UK 16
17
Email addresses: [email protected], [email protected], 18
[email protected], [email protected] 19
20
Running head (48 characters): Seasonal variation in Plasmodium infection in blue tits 21
Summary 251 words, manuscript total 7072 words (including references), 4 figures, 2 22
tables. 23
24
1
Summary 25
26
1. Seasonal variation in environmental conditions is ubiquitous and can affect the 27
spread of infectious diseases. Understanding seasonal patterns of disease 28
incidence can help to identify mechanisms, such as the demography of hosts and 29
vectors, which influence parasite transmission dynamics. 30
2. We examined seasonal variation in Plasmodium infection in a blue tit Cyanistes 31
caeruleus population over three years using sensitive molecular diagnostic 32
techniques, in light of Beaudoin et al.’s (1971) model of seasonal variation in 33
avian malaria prevalence in temperate areas. This model predicts a within-year 34
bimodal pattern of spring and autumn peaks with a winter absence of infection 35
3. Avian malaria infections were mostly Plasmodium (24.4%) with occasional 36
Haemoproteus infections (0.8%). Statistical non-linear smoothing techniques 37
applied to longitudinal presence/absence data revealed marked temporal variation 38
in Plasmodium prevalence, which apparently showed a within-year bimodal 39
pattern similar to Beaudoin et al.’s model. However, of the two Plasmodium 40
morphospecies accounting for most infections, in only (Plasmodium 41
circumflexum) did seasonal patterns support Beaudoin et al.’s model. On closer 42
examination there was also considerable age structure in infection: Beaudoin et 43
al.’s seasonal pattern was observed only in first year and not older birds. 44
Plasmodium relictum prevalence was less seasonally variable. 45
4. For these two Plasmodium morphospecies, we reject Beaudoin et al.’s model as it 46
does not survive closer scrutiny of the complexities of seasonal variation among 47
2
Plasmodium morphospecies and host age classes. Studies of host-parasite 48
interactions should consider seasonal variation whenever possible. We discuss the 49
ecological and evolutionary implications of seasonal variation in disease 50
prevalence. 51
52
53
Introduction 54
55
The prevalence of many infectious diseases varies markedly through time, from short-56
term seasonal fluctuations to complex population dynamics (Altizer, Dobson, Hosseini et 57
al., 2006; Dietz, 1976; Greenman, Kamo & Boots, 2004). The dynamics of vector-borne 58
diseases are particularly likely to vary with environmental conditions, as vectors are 59
sensitive to climatic conditions (Aron & May, 1982; Hess, Randolph, Arneberg et al., 60
2001). For example, human malaria Plasmodium spp. shows marked seasonality in 61
transmission, largely due to the sensitivity of the mosquito vectors to climate (Childs, 62
Cattadori, Suwonkerd et al., 2006; Hay, Myers, Burke et al., 2000). 63
64
Host demography might play a greater role in the transmission dynamics of avian as 65
compared to human malaria, as the temporally discrete breeding and migratory periods of 66
avian hosts give rise to seasonally regular fluctuations in host abundance and the 67
proportion of susceptible individuals in the host population, due to the relatively 68
synchronous recruitment of immunologically naïve juveniles to the host population and 69
the arrival of migrant birds (and their parasites) to the wider bird community (White, 70
3
Grenfell, Hendry et al., 1996). In addition, there may also be a reduction in herd 71
immunity that exposes older individuals to an increased risk of infection, resulting in the 72
epidemic spread of previously rare parasite genotypes (Altizer et al., 2006; White et al., 73
1996). Revealing the environmental and demographic drivers that contribute to seasonal 74
disease dynamics aids the understanding of disease epidemiology (Pascual & Dobson, 75
2005). 76
77
In tropical climates, avian malaria occurs year-round (Valkiūnas, 2005), whereas studies 78
in temperate regions report consistent seasonal variation: a peak in prevalence during 79
spring or the breeding season, followed by a decline during winter (Applegate, 1971; 80
Beaudoin, Applegate, David et al., 1971; Kucera, 1981; Schrader, Walters, James et al., 81
2003; Weatherhead & Bennett, 1991), although some studies have found higher 82
prevalence of some haematozoa in winter (Hatchwell, Wood, Anwar et al., 2000). 83
Beaudoin et al. (1971) proposed a model to explain patterns of seasonal variation with 84
reference to the transmission requirements and life cycle of avian malaria parasites: a 85
peak in malaria prevalence is supposed to occur in late summer and autumn, when vector 86
populations (Cranston, Ramsdale, Snow et al., 1987; Marshall, 1938) and the proportion 87
of immunologically naïve juveniles in the host population are high. Prevalence then drops 88
in winter as vector activity wanes and malaria parasites disappear from the blood, but not 89
necessarily body tissues, followed by a spring relapse of infection prior to the breeding 90
season. 91
92
4
The development of molecular tools for diagnosis of avian malaria infection based on 93
mitochondrial cytochrome-b lineage variation (Bensch, Stjernman, Hasselquist et al., 94
2000; Fallon, Ricklefs, Swanson et al., 2003; Hellgren, Waldenström & Bensch, 2004; 95
Waldenström, Bensch, Hasselquist et al., 2004) allows avian malaria infections to be 96
examined in more detail than is possible using traditional light microscopy techniques 97
(Waldenström et al., 2004). Estimates of diversity of around 200 species using 98
microscopy (Valkiūnas, 2005) may mask diversity to the order of 10,000 species as 99
revealed by molecular approaches (Bensch, Pérez-Tris, Waldenström et al., 2004): most 100
ecological studies of malaria do not consider this diversity, a potentially important source 101
of variation in host-parasite interactions. Established parasitological techniques remain 102
important for identifying groups of lineages that are morphologically similar, a likely 103
indicator of similar parasite ecology (Valkiūnas, 2005). Here, we examine seasonal 104
variation in avian malaria infection in a woodland population of blue tits Cyanistes 105
caeruleus L., 1758, to test Beaudoin et al.’s (1971) model. We report marked seasonal 106
patterns of variation in infection that vary between parasite morphospecies and with host 107
age, based on screening more than 800 samples over three years. 108
109
110
Methods 111
112
Host-parasite system 113
Avian malaria, caused by Plasmodium and Haemoproteus spp. (sensu Pérez-Tris, 114
Hasselquist, Hellgren et al., 2005; see Valkiūnas, Anwar, Atkinson et al., 2005 for an 115
5
alternative view), is a globally distributed vector-borne disease (Beadell, Ishtiaq, Covas et 116
al., 2006; Valkiūnas, 2005). Plasmodium is transmitted primarily by mosquitoes 117
(Culicidae), and Haemoproteus by biting midges (Ceratopogonidae) and louse flies 118
(Hippoboscidae); parasite transmission is therefore dependent on vector activity, between 119
spring and autumn in temperate areas (Valkiūnas, 2005). Blue tits (Paridae) are small 120
passerine birds that take readily to nestboxes, laying eggs in spring with the peak of 121
broods hatching (in the south of England) in late April-early May. Chicks fledge 16-18 122
days later, with the last chicks fledging in early June (Perrins, 1979). 123
124
In the present study, we take 15th June as a biologically meaningful start to the sampling 125
year, because of (i) the addition to the population of many newly fledged young by this 126
time (all nestling tits had fledged by 15th June), (ii) the age transition from first year 127
(previous year’s nestlings) to older adults that occurs at this time, and (iii) the timing of 128
feather moult in blue tits, in mid to late summer. It is also difficult to catch blue tits at our 129
study site during late June and early July using mist-nets at artificial food stations, 130
resulting in a natural break in sampling at the beginning of our sampling year on 15th 131
June. Therefore, figures in this paper show the year’s sampling beginning in summer, 132
with date shown by calendar month for clarity. 133
134
Sampling and molecular diagnosis of infection 135
Blood samples of <20µL were taken, under licence, by brachial or jugular venepuncture 136
from blue tits in Wytham Woods, a ca. 380ha woodland in Oxfordshire, UK (51°47’ N, 137
1°20’W) between May 2003 and June 2005. Birds were captured at nest boxes while 138
6
feeding nestlings, and using mist nets at feeding stations approximately weekly at other 139
times of the year. Sex was determined by plumage characteristics or, during the breeding 140
season, on the presence/absence of a brood patch (Svensson, 1992). Blood samples were 141
stored in Queen’s lysis buffer (Seutin, White & Boag, 1991), and DNA extracted using a 142
DNeasy extraction kit (Qiagen, CA, USA). One sample from each individual is analysed 143
here, giving a total of 816 sampled individuals. 144
145
The presence/quality of extracted DNA was assessed by electrophoresing 2µl of the 146
extract on a 2% agarose gel containing ethidium bromide, and visualising under UV light. 147
Samples were then screened for the presence of Plasmodium and Haemoproteus using the 148
nested PCR method of Waldenström et al. (2004), amplifying a 478bp fragment of the 149
mitochondrial cytochrome-b gene. PCR reactions were performed in 25µl volumes, in 150
two separate rounds. First-round primers were HaemNF (5´-151
CATATATTAAGAGAATTATGGAG-3´) and HaemNR2 (5´-152
AGAGGTGTAGCATATCTATCTAC-3´): each reaction contained contained 2µl of 153
genomic DNA, 0.125mM each dNTP, 0.2µM each primer, 3mM MgCl2 and 0.25 units of 154
Platinum Taq polymerase (Invitrogen, CA, USA) with the accompanying PCR buffer at 155
1x final concentration. The thermal profile consisted of a 2 minute 94°C enzyme 156
activation step, followed by 20 cycles of 94°C for 30 sec, 50°C for 30 sec, and 72°C for 157
45 sec, ending with an elongation step of 72°C for 10 min. In the second PCR round, 158
primers HaemF (5’-ATGGTGCTTTCGATATATGCATG-3’) and HaemR2 were used 159
(5’-GCATTATCTGGATGTGATAATGGT-3’): the composition of the PCR reactions 160
was as above, except that 0.4µM of each primer and 0.5 units of Platinum Taq 161
7
Polymerase were used, and 2µl of the PCR product from the first round was used as 162
template instead of genomic DNA. The thermal profile for the second round PCR was the 163
same as for the first round, with the number of cycles increased from 20 to 35. 164
165
2-8µl of PCR products from the second round were run on 2% agarose gels stained with 166
ethidium bromide and visualised under UV light. Samples containing bands of 450-167
600bp in size were prepared for sequencing using a Qiagen MinElute 96 UF PCR 168
purification kit and a QiaVac multiwell vacuum manifold. The purified PCR fragments 169
were then sequenced directly by dye terminator cycle sequencing (Big Dye v3.1), and 170
loaded on an ABI PRISM 310 automated sequencer (Applied Biosystems, CA, USA). 171
Sequences were edited in Sequencher v. 4.2 (GeneCodes Corp., MI, USA), and aligned in 172
ClustalX (Jeanmougin, Thompson, Gouy et al., 1998). Sequences corresponding to 173
Plasmodium or Haemoproteus from known alignments were scored as positive for avian 174
malaria. Sequences corresponding to Leucocytozoon sequences were scored as negative 175
for the purposes of this study; while a study of the seasonal variation in Leucocytozoon 176
prevalence would certainly be of interest, the PCR test is not designed to amplify DNA 177
from these parasites, and is thus less efficient, particularly when either Haemoproteus or 178
Plasmodium are also present. Where possible, avian malaria sequences were further 179
characterised to the lineage level, with exact matches named as per existing lineages in 180
GenBank, whilst sequences differing by one or more base pairs from those in GenBank 181
were assigned new names. We report a new lineage, pBLUTI3 (now assigned GenBank 182
accession number DQ991069). Mixed infections were present at a low rate (ca. 2% in 183
2004-5, S.C.L. Knowles et al. unpubl.) and are not considered here. 184
8
185
Statistical analysis 186
Examining only linear changes of parasite prevalence through time can mask complex 187
oscillations in disease prevalence (Pascual & Dobson, 2005), so we employed a statistical 188
approach that seeks the best linear or non-linear fit to prevalence data. Seasonal variation 189
in the prevalence of malaria infection was examined using generalized additive modelling 190
(GAM), essentially a generalized linear model (GLZ) in which a smoothed function of a 191
covariate (sample date) can be considered alongside conventional linear predictors and 192
their interactions (Hastie, 1990). The smoothed term uses a cyclic spline for continuity 193
between the end and beginning of each year. More complex functions are penalised such 194
that a linear function would be retained if more parsimonious, with smoothing parameters 195
selected by penalized likelihood maximization via generalized cross validation (Wood, 196
2004). We incorporated a smoothed function of sampling date as a model term while 197
examining associations between malaria infection and linear functions of sampling date, 198
year, host age, and sex (and their interactions), using binomial errors and a logit link. This 199
starting model was optimised by the backward stepwise elimination of non-significant 200
terms, beginning with higher-order interactions. Interactions between conventional 201
factors were considered, but as those involving smoothed date cannot be incorporated 202
into GAMs, potential interactions between the smoothed date term and any retained linear 203
terms were examined by constructing GAMs subsetted by the retained term (e.g. age, see 204
Results). In order to compare seasonal patterns of prevalence between Plasmodium 205
morphospecies, we tested the factorial interaction between season (four three-month 206
periods beginning 15th June) and parasite species. In all models, terms were retained if 207
9

their removal caused a significant change (P<0.05) in model deviance. Means are 208
presented ±1 standard error. 209
210
211
Results 212
213
Samples collected between autumn 2003 and summer 2005 from 816 individual blue tits 214
were screened for avian malaria infection. The prevalence of avian malaria infection 215
across the study period was 25.6%, comprising 24.4% Plasmodium and 0.8% 216
Haemoproteus (the latter genus is excluded from analyses due to low prevalence and the 217
potential for different seasonal patterns due to different vector ecologies: Valkiūnas, 218
2005). A total of 11 cytochrome-b lineages were identified: eight Plasmodium and three 219
Haemoproteus spp. (Table 1). Some Plasmodium lineages have been matched to 220
morphological species known from light microscopy (Hellgren, Križanauskiene, 221
Valkiūnas et al., 2007; Palinauskas, Kosarev, Shapoval et al., 2007; Valkiūnas, 222
Zehtindjiev, Hellgren et al., 2007): we therefore analyse the seasonal pattern of 223
Plasmodium pooled across all lineages, in addition to the prevalence of the two most 224
common parasite morphospecies which together account for 93% of avian malaria 225
infections, namely Plasmodium relictum Grassi & Feletti, 1891 and P. circumflexum 226
Kikuth, 1931. As the prevalence of any single lineage never exceeded 10%, the available 227
sample sizes did not support the analysis of lineages within species. Two approximately 228
similar peaks of pooled Plasmodium prevalence were observed in May/June and 229
September/October, with a steep decline in infection in winter (Fig. 1). 230
10

231
A non-linear smoothed function of sampling date was retained as the most suitable 232
temporal predictor of pooled Plasmodium prevalence (Table 2a). Host age was also 233
retained in the model: over the year as a whole, prevalence was 45% higher in older birds 234
(29.8±2.5%) compared to first-year birds (20.5±1.9%). Year, host sex and a linear date 235
function were not retained (Table 2a). A residual plot of the final model describing 236
seasonal variation in prevalence (Fig. 2a) shows two prevalence peaks, one in autumn and 237
one in the breeding season in spring, with a marked drop in prevalence in winter. Similar 238
analyses, treating the morphospecies separately, produced contrasting results: the P. 239
circumflexum model retained a smoothed date function similar to that for pooled 240
Plasmodium (Fig. 2b and Fig. 3), and an age effect (Table 2b); prevalence was again 241
higher in older birds (17.1±2.1%) than first years (11.5±1.5%). P. relictum retained a 242
weak linear date function in preference to non-linear smoothed functions, increasing 243
gradually over the year, but with no age effect (Table 2c). Analysis of morphospecies 244
prevalence by bimonthly periods (as in Fig. 1) retained parasite species as a model factor, 245
reflecting a difference in overall prevalence across the year (2-way analysis of deviance: 246
χ2=4.89, df=1, P=0.027) and significant variation between bimonthly periods (χ2=5.89, 247
df=1, P=0.015), but no interaction term. Analysing prevalence variation by of the 248
sampling year (seasons being four, three-month periods beginning on June 15th) also 249
retained species as a model factor (2-way analysis of deviance: χ2=7.70, df=1, P=0.0055): 250
importantly, the season*species interaction was retained (χ2=10.4, df=3, P=0.016), 251
indicating different patterns of seasonal variation in prevalence, at the level of three-252
month seasons, shown by the two Plasmodium morphospecies (Fig. 3). 253
11

254
We further examined the differences in seasonal variation in prevalence by constructing 255
predicted response models, which use final models (Table 2) to predict the variation in 256
prevalence over a hypothetical range of daily sampling dates, an approach that is useful to 257
visualise complex non-linear variation in prevalence (Fig. 4). The predicted response 258
models were judged to be a good reflection of observed prevalence data, because (i) 259
bimonthly prevalence (e.g. from Fig. 1) did not deviate significantly from the predicted 260
variation in prevalence shown in Fig. 4 (bimonthly observed vs. predicted prevalence for 261
pooled Plasmodium, P. circumflexum, P. relictum; good ness of fit χ2 tests, df=5, 262
P>0.90), and (ii) observed and predicted bimonthly prevalence were significantly 263
correlated, with slopes close to unity, for pooled Plasmodium (r=1.03, P=0.01, R2=0.80) 264
and P. circumflexum (r=1.27, P=0.006, R2=0.85). These correlations reflect the retention 265
of smoothed date as a predictor of prevalence (Table 2), whereas no such correlation 266
existed between observed and predicted P. relictum prevalence (r=0.36, P=0.22, 267
R2=0.18), for which smoothed date was not retained. Predicted response models for P. 268
relictum (Fig. 4c) are, therefore, presented merely for visual comparison with pooled 269
Plasmodium and P. circumflexum. 270
271
Comparing these plots between morphospecies reveals different seasonal patterns of 272
prevalence (Figs. 4a-c): both pooled Plasmodium and P. circumflexum showed a clear 273
pattern of seasonal variation including an autumn peak and an increase in prevalence 274
early in the year. P. relictum infection (the modelling of which retained a linear function 275
in preference to a smoothed date function, Table 2c) showed a relatively stable seasonal 276
12
pattern of prevalence, if somewhat lower in winter. This strongly suggests that seasonal 277
variation in P. circumflexum prevalence is largely responsible for the observed seasonal 278
variation in pooled Plasmodium prevalence. 279
280
Considering subsets of these predicted prevalence models by age class showed that the 281
seasonal pattern of pooled Plasmodium infection differs markedly by host age (Fig 4a). 282
All age classes show evidence of a post-breeding peak in Plasmodium in autumn, but 283
older birds show a more marked increase in prevalence in early spring. This indicates that 284
the age structure in seasonal variation in pooled Plasmodium prevalence between age 285
classes (Table 2a) lies in the putative ‘spring relapse’ period. P. circumflexum showed 286
evidence for an autumn peak in prevalence, which was most apparent in first year blue 287
tits; notably an obvious spring relapse was absent regardless of age (Fig. 4b). As 288
modelling of P. relictum prevalence retained a linear function in preference to a 289
smoothed date function (Table 2c), and a poor fit was found between observed and 290
predicted P. relictum prevalence, examining predictive models subsetted by age is not 291
justified statistically for this morphospecies, so we may not draw conclusions from the 292
age-subsetted model of predicted P. relictum prevalence (Fig. 4c). Only a linear date 293
function, and not age, was not retained in the modelling of P. relictum prevalence. This 294
linear date function, suggesting a slight increase in prevalence over the year (Table 2c), 295
indicates that the prevalence of P. relictum is less seasonally variable than P. 296
circumflexum. 297
298
299
13
Discussion 300
301
Seasonal variation in Plasmodium prevalence in blue tits in our study population is 302
characterised by bimodal peaks in prevalence in autumn and spring, and a marked drop in 303
prevalence during winter. At first sight, this genus level pattern agrees with the model of 304
Beaudoin et al. (1971) for seasonal variation in avian malaria in temperate regions. 305
However, the two most prevalent avian Plasmodium morphospecies in our study 306
population showed different patterns of seasonal variation in prevalence: P. circumflexum 307
showed seasonal variation of a pattern similar to that for pooled Plasmodium, whereas P. 308
relictum prevalence was more stable. There was also clear age structure in the seasonality 309
of Plasmodium infection: first year birds showed a less marked spring relapse of 310
Plasmodium than older birds. The autumn peak in Plasmodium prevalence was largely 311
driven by P. circumflexum. As seasonal patterns vary between age classes and between 312
different Plasmodium morphospecies, we reject Beaudoin et al.’s model as it is not robust 313
to the underlying complexity of the blue tit-Plasmodium interaction in this population. 314
315
Following the post-breeding/fledging phase in June, blue tits showed a peak in prevalence 316
of pooled Plasmodium (and P. circumflexum) in autumn (Figs. 2, 4a&b). This October 317
peak might result from new transmission to previously uninfected birds, rather than a 318
relapse of previously infected birds, which could result either from a reduction in herd 319
immunity or the addition of immunologically naïve juveniles into the population during 320
the breeding season (Altizer et al., 2006). The October Plasmodium/P. circumflexum 321
prevalence peak seen in first-year birds (Fig. 4b) necessarily represents new transmission, 322
14

since these birds are new recruits to the population and so cannot have been previously 323
infected. This post-fledging period is considerable a gap in our knowledge of the ecology 324
of tits: after fledging, they are not easily trapped, so causes of the high rates of post-325
fledging mortality are poorly understood (Perrins, 1979). Assessing the impact of avian 326
malaria on the survival of juveniles presents an important challenge. 327
328
In winter, the prevalence of pooled Plasmodium infections and the P. circumflexum 329
morphospecies declined dramatically in both first year and adult birds, most likely due to 330
a cessation of transmission and decline of existing malaria parasites from the blood, with 331
negligible blood stages surviving the winter. P. relictum was also absent in winter, but 332
present at a stable prevalence for the rest of the year (Fig. 4c). Avian Plasmodium spp. 333
survive the lack of transmission during the winter by remaining in host tissues 334
(Valkiūnas, 2005); our use of sensitive PCR-based screening methods in this study 335
suggests that Plasmodium infections were indeed absent from the blood during in 336
November and December (Fig. 1), as these techniques can detect approximately one 337
malaria parasite per 105 erythrocytes (Waldenström et al., 2004). It is possible that some 338
malaria parasites are better adapted to surviving the winter than others, an idea supported 339
by the markedly different seasonal patterns shown by P. relictum and P. circumflexum 340
(Fig. 3). 341
342
Parasite prevalence has been reported to increase prior to the breeding season in 343
temperate wild bird populations, known as the ‘spring relapse’ (Applegate, 1971; Box, 344
1966; Schrader et al., 2003; Valkiūnas, 2005). Experimental studies have implicated day 345
15
length and hormone levels in inducing relapse (Applegate, 1970; Valkiūnas, Bairlein, 346
Iezhova et al., 2004). Pooled Plasmodium infection shows, and P. relictum infection 347
suggests, a spring peak in prevalence, prior to the onset of the breeding season in mid-348
May (Fig. 3). This may be due to relapse, or if infected birds die during the winter the 349
spring peak may result from re-infection with newly transmitted parasites. Contrary to 350
this latter interpretation is that vector populations are unlikely to have reached their peak 351
until later in the year (Cranston et al., 1987; Marshall, 1938). Therefore, it is reasonable 352
to suggest that the spring ‘relapse’ in prevalence among older birds is indeed due to a 353
relapse of old infections rather than to new transmission. 354
355
Previous studies report marked differences in the prevalence of avian malaria between 356
first year and older birds, but the direction of this effect is not consistent in previous 357
studies (Dale, Kruszewicz & Slagsvold, 1996; Kucera, 1979; Merilä & Andersson, 1999; 358
Sol, Jovani & Torres, 2000, 2003; Valkiūnas, 2005). Predicted models of seasonal 359
variation in Plasmodium prevalence between age classes in our blue tit population (Fig. 360
4) suggest that the age structure lies in the spring relapse: pooled age classes showed an 361
autumn peak in prevalence, but older birds had a more marked spring peak than first-362
years (Fig. 4a). From February to the breeding season, prevalence increased steadily in 363
first-years, but more rapidly in older birds. Although young birds breed later than older, 364
more experienced, birds, the difference in breeding time is small (2-3 days) so is unlikely 365
to account for the large discrepancy in relapse between age groups. Examining the age 366
structure of infection by morphospecies revealed that the pattern seen in pooled 367
Plasmodium prevalence was due to seasonal variation between both morphospecies and 368
16

age class: the autumn peak in pooled Plasmodium can be attributed to P. circumflexum in 369
first years (Fig. 4b), and our data hint that the spring relapse in pooled Plasmodium may 370
be attributable to P. relictum in older birds (Fig. 4c). 371
372
The different seasonal patterns of prevalence between these two Plasmodium 373
morphospecies suggest that P. circumflexum transmission may benefit from the post-374
fledging peak in numbers of immunologically naïve individuals or a reduction in herd 375
immunity. Potential spring relapses of P. relictum in older birds may represent lineages 376
transmitted only before the eggs hatch, and so not transmitted to first years after fledging. 377
Given that P. relictum is the most ubiquitous and least host-restricted of the avian 378
Plasmodia, one may speculate that it has a more successful transmission strategy than P. 379
circumflexum. This hypothesis would be supported if spring relapse in P. relictum but not 380
P. circumflexum was confirmed by further study, as P. relictum gametocytes are more 381
infective to vectors in spring than in autumn (Valkiūnas, 2005). The higher infectivity of 382
P. relictum in spring coincides with the arrival of migratory bird species and precedes the 383
increase in the host population, potentially facilitating the parasite’s spread and 384
persistence. Such speculation requires improved knowledge of the ecology of avian 385
malaria in resident and migrant birds at Wytham. The autumn peak in Plasmodium 386
prevalence, particularly in P. circumflexum, coincides with a peak in the post-fledging 387
dispersal of first year birds, presenting an opportunity for malaria parasites to disperse 388
with their hosts; older birds, having already bred and held a territory, disperse less far 389
than first years (Perrins, 1979). The epidemiological consequences of age-structure, both 390
in the seasonal variation of prevalence between Plasmodium morphospecies and in 391
17
dispersal distance, are intriguing. Clearly, our understanding of the epidemiology of host-392
parasite interactions involving avian Plasmodia would be enhanced by the study of vector 393
specificities and the seasonal availability of compatible vectors. 394
395
This study is reliant upon sensitive molecular diagnostic techniques, (Waldenström et al., 396
2004), knowledge of the taxonomy of avian Plasmodium in relation to molecular data 397
(Hellgren et al., 2007; Valkiūnas et al., 2007) and categorisation of hosts into first year 398
and older birds. Without these factors, the ‘two peaks and a trough’ model of seasonal 399
variation in avian malaria prevalence (Beaudoin et al., 1971) would have been accepted 400
by our study, when in fact the seasonal pattern of Plasmodium variation in blue tits in our 401
study is a complex combination of different patterns, both between Plasmodium 402
morphospecies and (in the case of P. circumflexum) between age classes. An additional 403
factor not considered here is that there may be marked spatial differences in the 404
prevalence and distribution of different parasite species. Indeed, we know this to be the 405
case for the present study population, which shows spatial variation in both the overall 406
prevalence of malaria and in the distribution of morphospecies (Wood, Cosgrove, Wilkin 407
et al., 2007). There are some intriguing parallels between the temporal patterns revealed 408
here and the spatial ones described elsewhere (Wood et al., 2007): in both cases, P. 409
relictum shows a broader distribution, while P. circumflexum shows a more clustered 410
distribution. 411
412
We found no evidence that the seasonal pattern of infection differed between years (Table 413
2), although the possibility of annual variation in seasonal patterns is suggested by 414
18

variation in the prevalence of some avian malaria lineages between breeding seasons 415
(Wood et al., 2007). Between-year fluctuations in parasite prevalence are commonly 416
reported for vector-borne and other diseases, suggesting that more long-term data is 417
required to examine between-year variation in avian malaria in our study population (e.g. 418
see (Bensch, Waldenström, Jonzen et al., 2007). There was no significant difference 419
between the malaria prevalence of males and females throughout the year, in contrast to 420
several field studies showing differences in parasite prevalence between the sexes of 421
breeding wild birds (Applegate, 1971; Merilä & Andersson, 1999; Richner, Christe & 422
Oppliger, 1995). 423
424
Our data demonstrate that studies of the ecology of parasites in wild populations should 425
take account of temporal variation within years (i.e. seasonal variation) in at least three 426
contexts. First, overall prevalence varies both with date and with host activity, meaning 427
that both factors must be known to make sense of any variation in prevalence, unless 428
sampling is restricted to specific temporal and activity classes. Second, prevalence varies 429
with host demographic factors, and the seasonal pattern differs among different host age 430
groups. Third, the seasonal pattern of prevalence differs among malaria parasite 431
morphospecies. Identifying the transmission periods when hosts and infective vectors 432
meet is crucial here: the study of vector ecology would greatly enhance our understanding 433
of the seasonality of avian malaria in our study system. Host-vector and vector-parasite 434
associations are poorly understood at present (Boete & Paul, 2006). In a broader context, 435
understanding the causes of seasonal variation in transmission might be attempted at a 436
wider geographic scale (Pérez-Tris & Bensch, 2005), or in the context of how these 437
19
diseases might respond to climate change (Kovats, Campbell-Lendrum, McMichael et al., 438
2001; Rogers & Randolph, 2000). Any study that aims to understand individual 439
heterogeneity in infection in avian malaria should consider both temporal (this study) and 440
spatial variation (Wood et al., 2007) as contributory factors. Continued research promises 441
increasing understanding of the ecology of avian malaria, and the epidemiology of 442
vector-borne disease in general. 443
444
Acknowledgments 445
The first two authors made an equal contribution to this paper. We thank Simon Griffith, 446
Iain Barr, Louise Rowe, Joanne Chapman and numerous Wytham fieldworkers for their 447
invaluable assistance in the field. CLC and MJW were supported by a NERC grant to 448
KPD and BCS. Sarah Knowles, Freya Fowkes and two anonymous reviewers made 449
valuable comments on the manuscript. 450
451
452
Table and Figure legends 453
454
Table 1. 455
A total of 816 individual blue tits, sampled between autumn 2003 and summer 2005 were 456
screened for avian malaria infection. Mitochondrial cytochrome-b lineages were assigned 457
using molecular techniques (see Methods), shown in the ‘Lineage’ column; the prefix “p” 458
denotes Plasmodium, and “h” denotes Haemoproteus. The frequency of infection of each 459
avian malaria lineage is shown, categorised by host species. 460
20

* Mitochondrial cytochrome-b lineages previously matched to morphological species 461
(Hellgren et al., 2007; Palinauskas et al., 2007; Valkiūnas et al., 2007). 462
† Some sequences could not be resolved to a particular malaria lineage, but in some cases 463
could be resolved to either Plasmodium or Haemoproteus. 464
‡ Percentages in parentheses indicate the overall population prevalence, which do not sum 465
to pooled prevalence due to low frequency (ca. 2%) mixed infections (S.C.L. Knowles et 466
al. unpublished). 467
468
Table 2. 469
Final Generalized Additive Models (GAMs) are shown, examining seasonal variation in 470
(a) pooled Plasmodium infections, (b) P. circumflexum and (c) P. relictum. In each 471
model, a smoothed function of sample date was modelled alongside linear predictors and 472
their interactions (linear date, host age, host sex and sampling year) using binomial errors 473
and a logit link. Each model was optimised by the backward stepwise elimination of non-474
significant terms, beginning with higher order interactions. Model terms were retained if 475
their removal caused a significant change (P<0.05) in model deviance. No interactions 476
were retained in final models. 477
478
Figure 1. 479
A total of 816 blue tits sampled between autumn 2003 and summer 2005 are analysed 480
here. Avian malaria infection was diagnosed using molecular techniques (see Methods). 481
Error bars represent ±1 s.e. 482
483
21

Figure 2. 484
The estimated effect of the smoothed function of date on prevalence is shown, controlling 485
for other model effects (e.g. host age, see Table 2). Generalized additive modelling 486
(GAM) was used to incorporate potential non-linear variation in prevalence (see 487
Methods). Note the marked peak in prevalence in October-November, a reduced 488
prevalence in mid-winter (December-January), another peak in prevalence in early spring 489
(March) before the breeding season (May-June). Dotted lines about plotted functions 490
show the Bayesian credible intervals of the model. 491
492
Figure 3. 493
Predictive models were constructed to visualise variation in prevalence with sampling 494
date and age, for Plasmodium infection, P. circumflexum and P. relictum, each using the 495
best non-linear smoothed function of sampling date (Table 2; P. relictum retained a linear 496
function in modelling, but a smoothed function is used here for comparison). Their 497
respective predicted prevalences through the year were then extrapolated from the model 498
fitted to prevalence data (e.g. Fig. 2). Points on each graph show the pooled Plasmodium 499
infection status of birds used in generating the predictive model, i.e. those positive (black 500
circles) and negative (open circles) for infection. Multiple samples on a particular day are 501
overlaid, so these points under-represent the extent of sampling. 502
503
Figure 4. 504
These plots follow the rationale in Fig. 3; predicted prevalence is shown for (a) 505
Plasmodium infection, (b) P. circumflexum and (c) P. relictum, by age category to 506
22
illustrate the age structure in infection (Table 2): (i) age classes superimposed, (ii) all 507
ages, (iii) first years and (iv) older birds. Smoothed date function and host age were not 508
retained in the modelling of P. relictum prevalence, and therefore is shown here (Fig. 3c) 509
merely for comparison. Circles on each graph show the infection status of birds used in 510
generating the predictive model, multiple samples on a particular day are overlaid and so 511
under-represent the extent of sampling. Grey squares show observed mean bimonthly 512
prevalence: predicted prevalence showed a good fit with observed prevalence data for 513
Plasmodium (r=1.03, P=0.01, R2=0.80) and P. circumflexum (r=1.27, P=0.006, R2=0.85), 514
but not for P. relictum (r=0.36, P=0.22, R2=0.18). Predicted prevalence is plotted only 515
within the range of observed data. 516
517
23
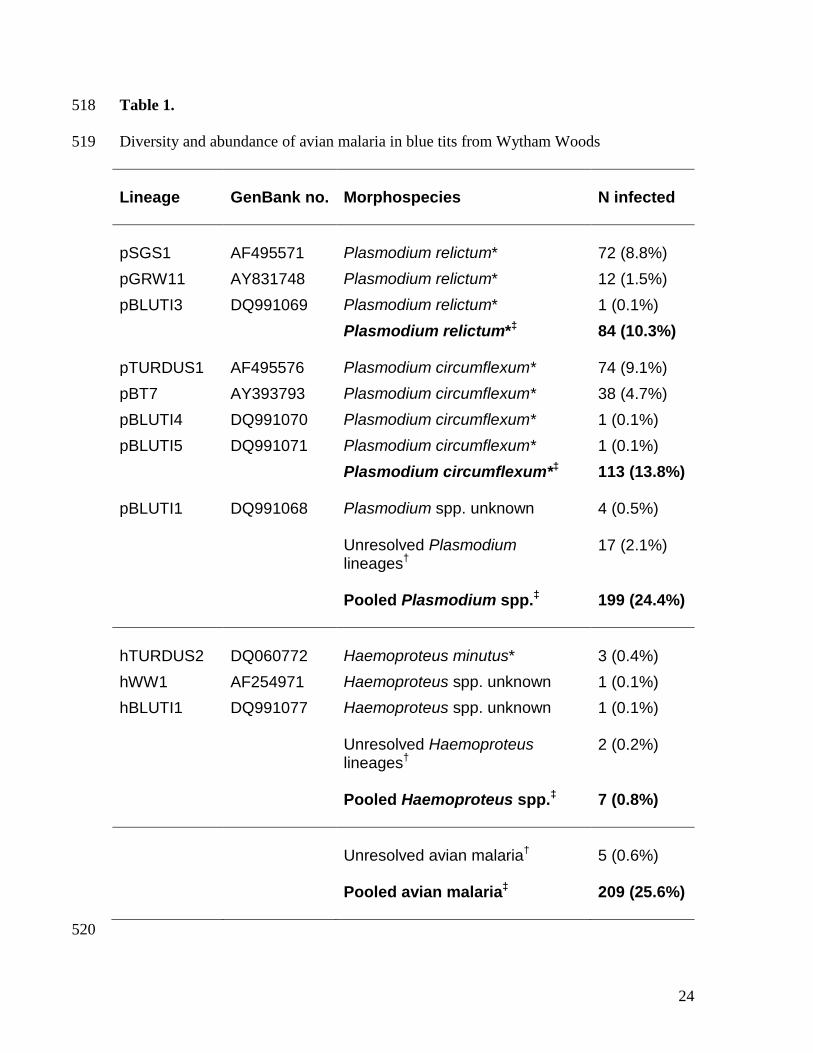
Table 1. 518
Diversity and abundance of avian malaria in blue tits from Wytham Woods 519
Lineage GenBank no. Morphospecies N infected pSGS1 AF495571 Plasmodium relictum* 72 (8.8%)
pGRW11 AY831748 Plasmodium relictum* 12 (1.5%)
pBLUTI3 DQ991069 Plasmodium relictum* 1 (0.1%)
Plasmodium relictum*‡ 84 (10.3%) pTURDUS1 AF495576 Plasmodium circumflexum* 74 (9.1%)
pBT7 AY393793 Plasmodium circumflexum* 38 (4.7%)
pBLUTI4 DQ991070 Plasmodium circumflexum* 1 (0.1%)
pBLUTI5 DQ991071 Plasmodium circumflexum* 1 (0.1%)
Plasmodium circumflexum*‡ 113 (13.8%) pBLUTI1 DQ991068 Plasmodium spp. unknown 4 (0.5%) Unresolved Plasmodium
lineages† 17 (2.1%)
Pooled Plasmodium spp.‡ 199 (24.4%) hTURDUS2 DQ060772 Haemoproteus minutus* 3 (0.4%)
hWW1 AF254971 Haemoproteus spp. unknown 1 (0.1%)
hBLUTI1 DQ991077 Haemoproteus spp. unknown 1 (0.1%) Unresolved Haemoproteus
lineages† 2 (0.2%)
Pooled Haemoproteus spp.‡ 7 (0.8%) Unresolved avian malaria† 5 (0.6%) Pooled avian malaria‡ 209 (25.6%) 520
24
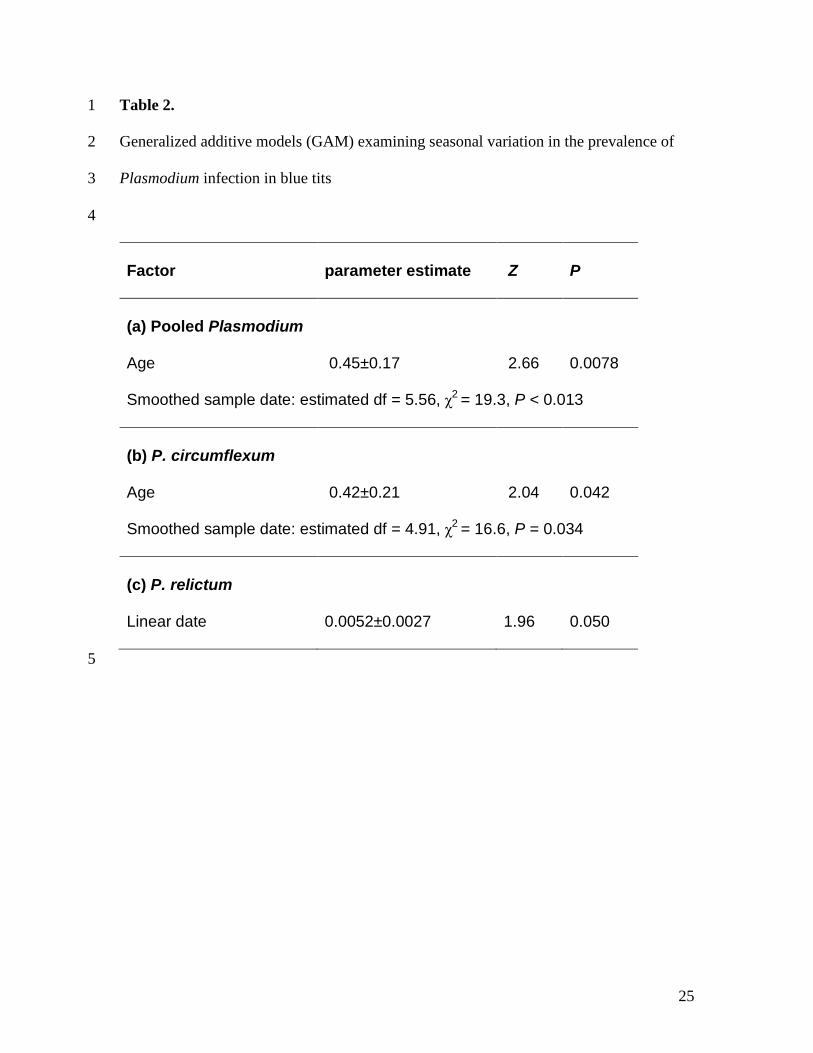
Table 2. 1
Generalized additive models (GAM) examining seasonal variation in the prevalence of 2
Plasmodium infection in blue tits 3
4
Factor parameter estimate Z P (a) Pooled Plasmodium Age 0.45±0.17 2.66 0.0078 Smoothed sample date: estimated df = 5.56, χ2 = 19.3, P < 0.013 (b) P. circumflexum Age 0.42±0.21 2.04 0.042 Smoothed sample date: estimated df = 4.91, χ2 = 16.6, P = 0.034 (c) P. relictum Linear date 0.0052±0.0027 1.96 0.050
5
25
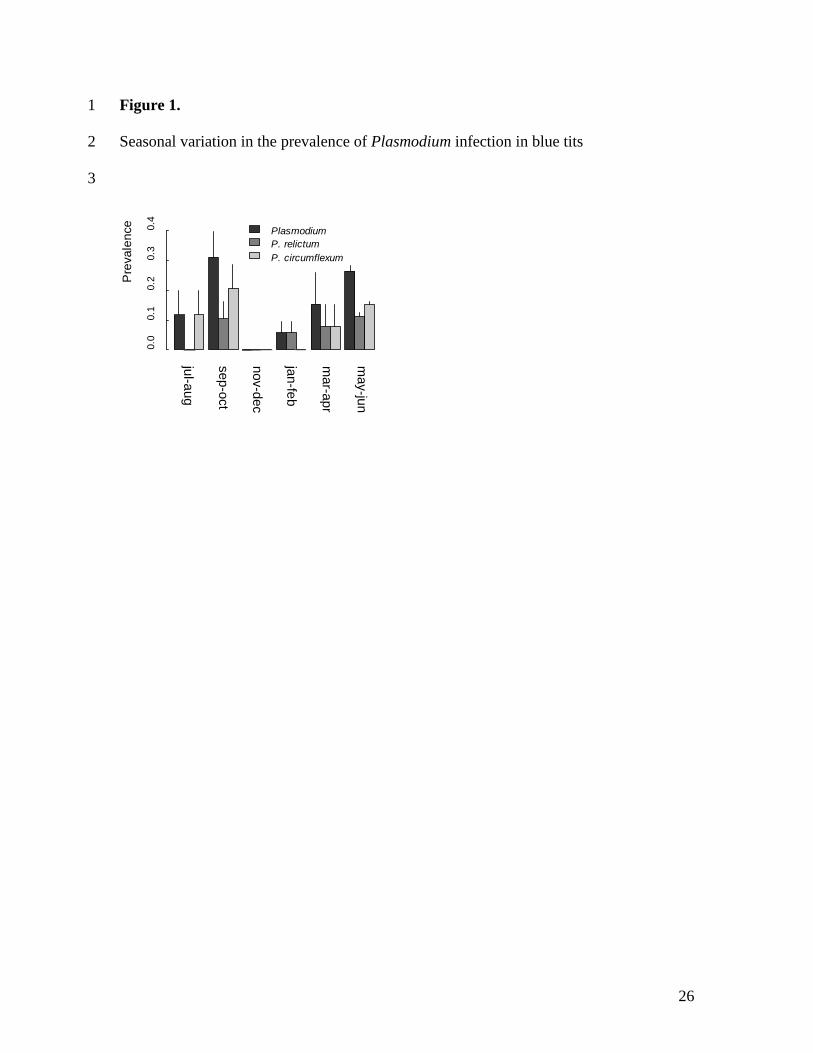
Figure 1. 1
Seasonal variation in the prevalence of Plasmodium infection in blue tits 2
3
0.0
0.1
0.2
0.3
0.4
PlasmodiumP. relictumP. circumflexum
Pre
vale
nce
jul-aug
sep-oct
nov-dec
jan-feb
mar-apr
may-jun
26
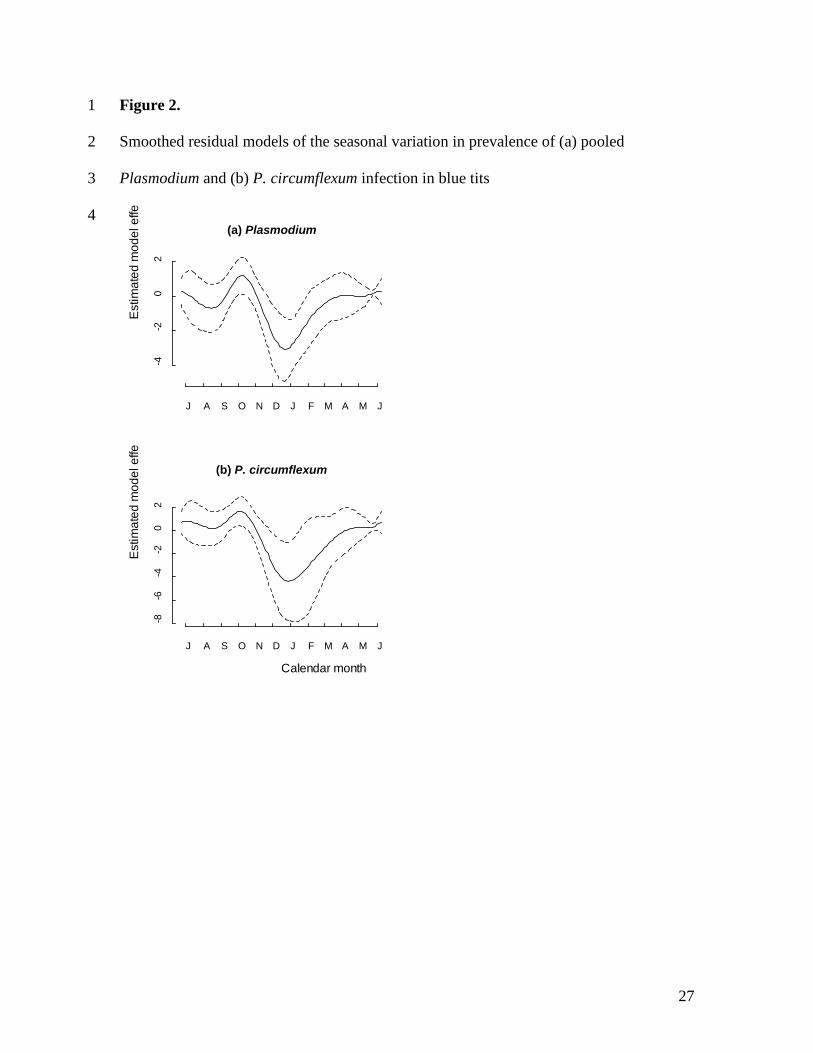
Figure 2. 1
Smoothed residual models of the seasonal variation in prevalence of (a) pooled 2
Plasmodium and (b) P. circumflexum infection in blue tits 3
4 (a) Plasmodium
(b) P. circumflexum
J A S O N D J F M A M J
-4-2
02
Est
imat
ed m
odel
effe
J A S O N D J F M A M J
-8-6
-4-2
02
Calendar month
Est
imat
ed m
odel
effe
27

Figure 3. 1
Predictive models of seasonal variation in Plasmodium infection in blue tits 2
3
J A S O N D J F M A M J
0.0
0.2
0.4
0.6
0.8
1.0
breeding season
Calendar month
Pre
dict
ed p
reva
lenc
e
PlasmodiumP. circumflexumP. relictum
28
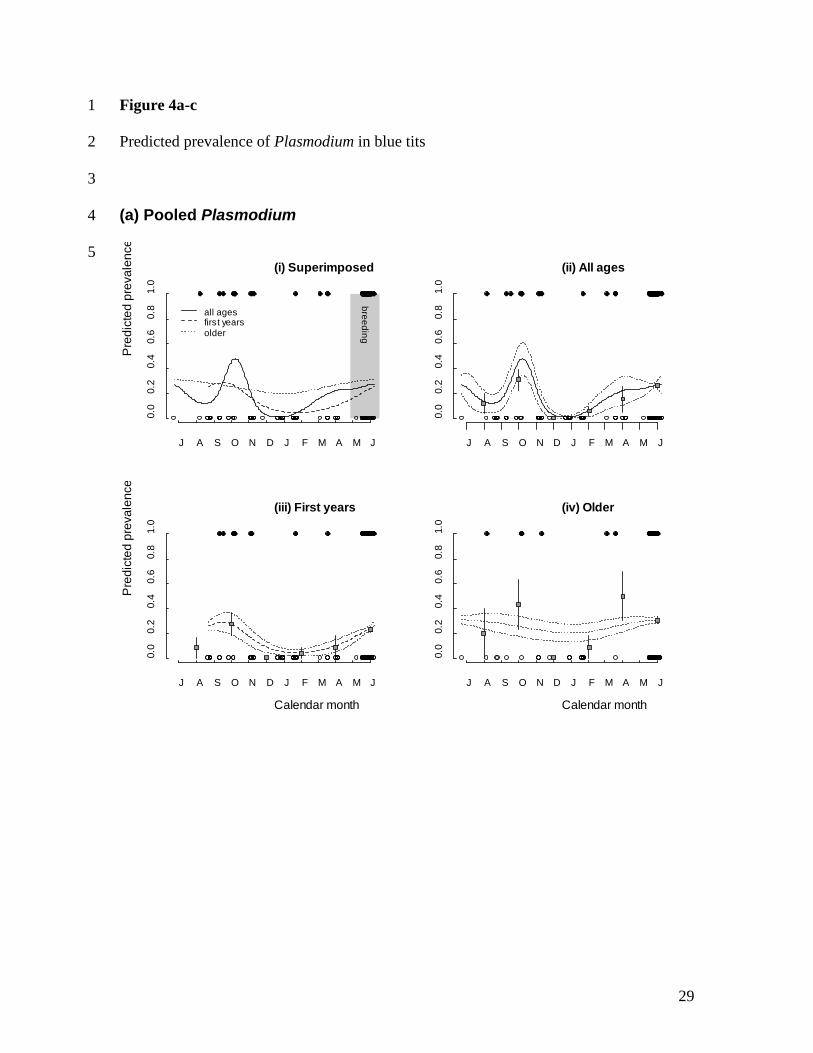
Figure 4a-c 1
Predicted prevalence of Plasmodium in blue tits 2
3
(a) Pooled Plasmodium 4
5
J A S O N D J F M A M J
0.0
0.2
0.4
0.6
0.8
1.0
breeding
(i) Superimposed
Pre
dict
ed p
reva
lenc
e
all agesfirst yearsolder
J A S O N D J F M A M J0.
00.
20.
40.
60.
81.
0
(ii) All ages
J A S O N D J F M A M J
0.0
0.2
0.4
0.6
0.8
1.0
(iii) First years
Calendar month
Pre
dict
ed p
reva
lenc
e
J A S O N D J F M A M J
0.0
0.2
0.4
0.6
0.8
1.0
(iv) Older
Calendar month
29
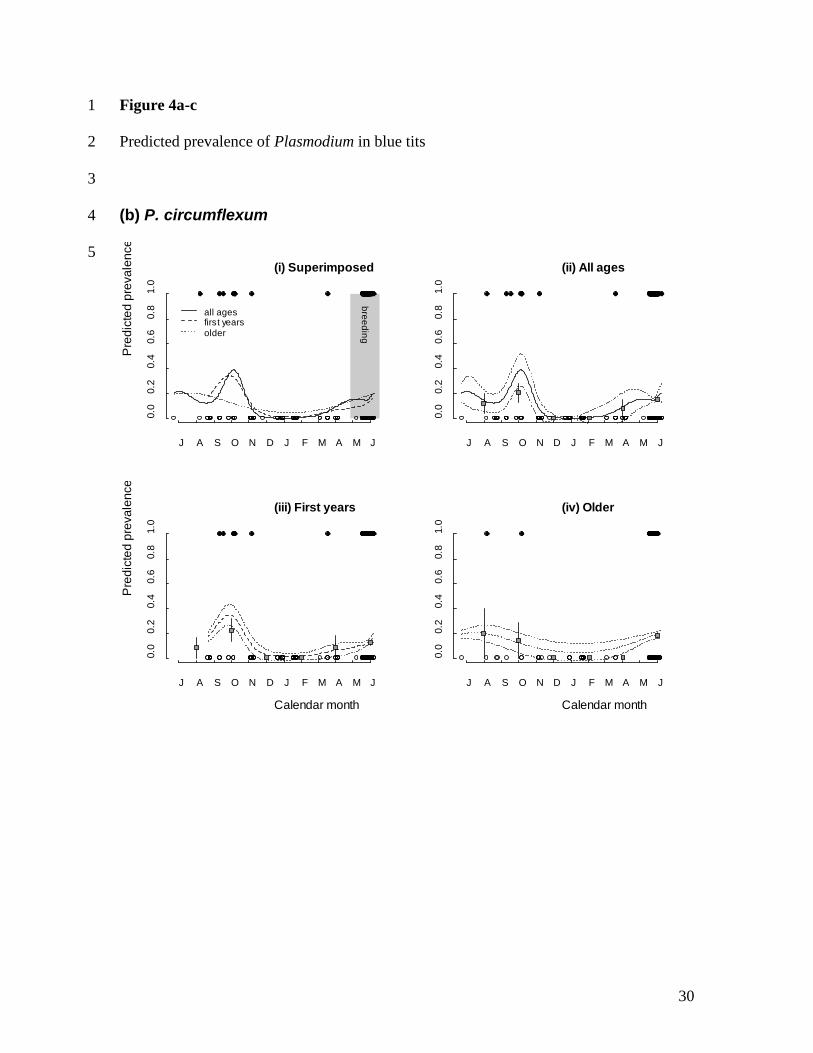
Figure 4a-c 1
Predicted prevalence of Plasmodium in blue tits 2
3
(b) P. circumflexum 4
5
J A S O N D J F M A M J
0.0
0.2
0.4
0.6
0.8
1.0
breeding
(i) Superimposed
Pre
dict
ed p
reva
lenc
e
all agesfirst yearsolder
J A S O N D J F M A M J0.
00.
20.
40.
60.
81.
0
(ii) All ages
J A S O N D J F M A M J
0.0
0.2
0.4
0.6
0.8
1.0
(iii) First years
Calendar month
Pre
dict
ed p
reva
lenc
e
J A S O N D J F M A M J
0.0
0.2
0.4
0.6
0.8
1.0
(iv) Older
Calendar month
30
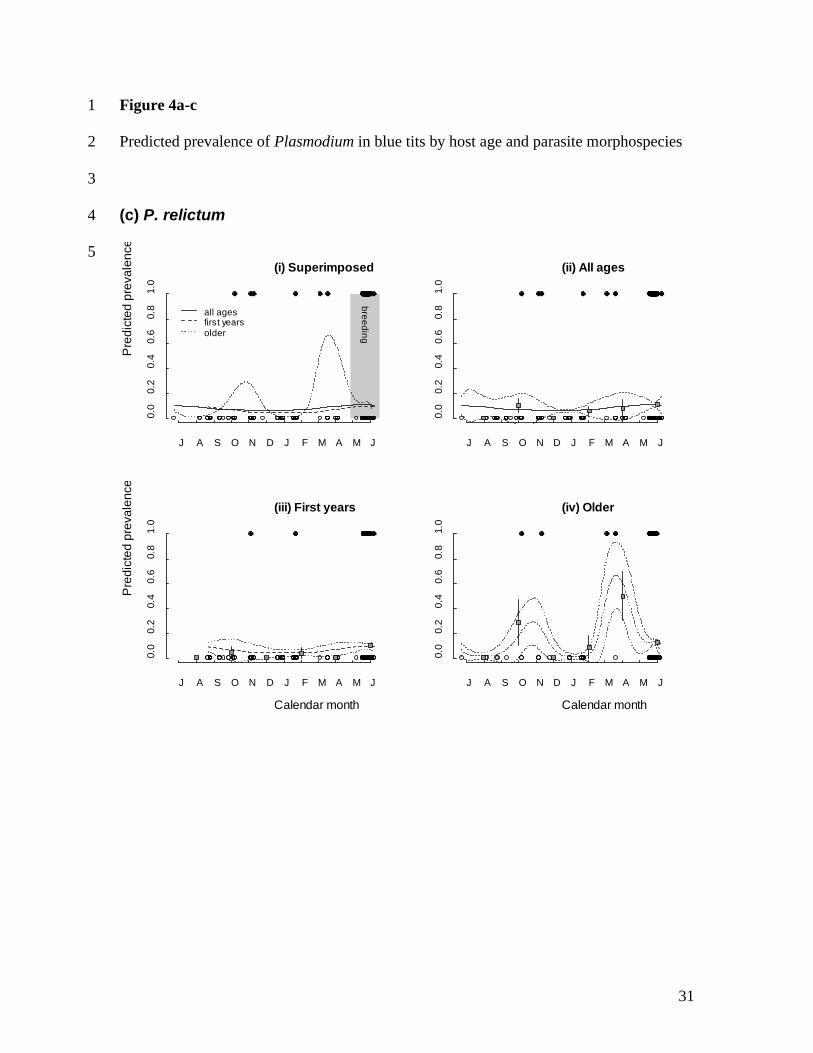
Figure 4a-c 1
Predicted prevalence of Plasmodium in blue tits by host age and parasite morphospecies 2
3
(c) P. relictum 4
5
J A S O N D J F M A M J
0.0
0.2
0.4
0.6
0.8
1.0
breeding
(i) Superimposed
Pre
dict
ed p
reva
lenc
e
all agesfirst yearsolder
J A S O N D J F M A M J0.
00.
20.
40.
60.
81.
0
(ii) All ages
J A S O N D J F M A M J
0.0
0.2
0.4
0.6
0.8
1.0
(iii) First years
Calendar month
Pre
dict
ed p
reva
lenc
e
J A S O N D J F M A M J
0.0
0.2
0.4
0.6
0.8
1.0
(iv) Older
Calendar month
31
References 1
2
Altizer, S., Dobson, A., Hosseini, P., Hudson, P., Pascual, M. & Rohani, P. (2006) 3
Seasonality and the dynamics of infectious diseases. Ecology Letters, 9, 467-484. 4
Applegate, J.E. (1970) Population changes in latent avian malaria infections associated 5
with season and corticosterone treatment. Journal of Parasitology, 56, 439-&. 6
Applegate, J.E. (1971) Spring relapse of Plasmodium relictum infections in an 7
experimental field population of English sparrows (Passer domesticus). Journal 8
of Wildlife Diseases, 7, 37-42. 9
Aron, J.L. & May, R.M. (1982). The population dynamics of malaria. In Population 10
Dynamics and Infectious Disease (ed R.M. Anderson), pp. 139-179. Chapman and 11
Hall, London, UK. 12
Beadell, J.S., Ishtiaq, F., Covas, R., Melo, M., Warren, B.H., Atkinson, C.T., Bensch, S., 13
Graves, G.R., Jhala, Y.V., Peirce, M.A., Rahmani, A.R., Fonseca, D.M. & 14
Fleischer, R.C. (2006) Global phylogeographic limits of Hawaii's avian malaria. 15
Proceedings of the Royal Society B-Biological Sciences, 273, 2935-2944. 16
Beaudoin, R.L., Applegate, J.E., David, D.E. & McLean, R.G. (1971) A model for the 17
ecology of avian malaria. Journal of Wildlife Diseases, 7, 5-13. 18
Bensch, S., Pérez-Tris, J., Waldenström, J. & Hellgren, O. (2004) Linkage between 19
nuclear and mitochondrial DNA sequences in avian malaria parasites: Multiple 20
cases of cryptic speciation? Evolution, 58, 1617-1621. 21
Bensch, S., Stjernman, M., Hasselquist, D., Ostman, O., Hansson, B., Westerdahl, H. & 22
Pinheiro, R.T. (2000) Host specificity in avian blood parasites: a study of 23
32

Plasmodium and Haemoproteus mitochondrial DNA amplified from birds. 1
Proceedings of the Royal Society of London Series B-Biological Sciences, 267, 2
1583-1589. 3
Bensch, S., Waldenström, J., Jonzen, N., Westerdahl, H., Hansson, B., Sejberg, D. & 4
Hasselquist, D. (2007) Temporal dynamics and diversity of avian malaria 5
parasites in a single host species. Journal of Animal Ecology, 76, 112-122. 6
Boete, C. & Paul, R.E.L. (2006) Can mosquitoes help to unravel the community structure 7
of Plasmodium species? Trends in Parasitology, 22, 21-25. 8
Box, E.D. (1966) Blood and tissue protozoa of the English Sparrow (Passer domesticus) 9
in Galveston, Texas. Journal of Protozoology, 13, 204-208. 10
Childs, D.Z., Cattadori, I.M., Suwonkerd, W., Prajakwong, S. & Boots, M. (2006) 11
Spatiotemporal patterns of malaria incidence in northern Thailand. Transactions 12
of the Royal Society of Tropical Medicine and Hygiene, 100, 623-631. 13
Cranston, P.S., Ramsdale, C.D., Snow, K.P. & White, G.B. (1987) Adults, larvae and 14
pupae of British mosquitoes (Culicidae). Freshwater Biological Association, 15
Ambleside, UK. 16
Dale, S., Kruszewicz, A. & Slagsvold, T. (1996) Effects of blood parasites on sexual and 17
natural selection in the pied flycatcher. Journal of Zoology, 238, 373-393. 18
Dietz, K. (1976) The incidence of infectious diseases under the influence of seasonal 19
fluctuations. Lecture Notes in Biomathematics, 11, 1-15. 20
Fallon, S.M., Ricklefs, R.E., Swanson, B.L. & Bermingham, E. (2003) Detecting avian 21
malaria: An improved polymerase chain reaction diagnostic. Journal of 22
Parasitology, 89, 1044-1047. 23
33
Greenman, J., Kamo, M. & Boots, M. (2004) External forcing of ecological and 1
epidemiological systems: a resonance approach. Physica D-Nonlinear 2
Phenomena, 190, 136-151. 3
Hastie, T.T., R. (1990) Generalized Additive Models. Chapman and Hall, London, UK. 4
Hatchwell, B.J., Wood, M.J., Anwar, M. & Perrins, C.M. (2000) The prevalence and 5
ecology of the haematozoan parasites of European blackbirds, Turdus merula. 6
Canadian Journal of Zoology-Revue Canadienne De Zoologie, 78, 684-687. 7
Hay, S.I., Myers, M.F., Burke, D.S., Vaughn, D.W., Endy, T., Ananda, N., Shanks, G.D., 8
Snow, R.W. & Rogers, D.J. (2000) Etiology of interepidemic periods of 9
mosquito-borne disease. Proceedings of the National Academy of Sciences of the 10
United States of America, 97, 9335-9339. 11
Hellgren, O., Križanauskiene, A., Valkiūnas, G. & Bensch, S. (2007) Diversity and 12
phylogeny of mitochondrial cytochrome b lineages from six morphospecies of 13
avian Haemoproteus (Haemosporida, Haemoproteidae). Journal of Parasitology, 14
93, 889–896 15
Hellgren, O., Waldenström, J. & Bensch, S. (2004) A new PCR assay for simultaneous 16
studies of Leucocytozoon, Plasmodium, and Haemoproteus from avian blood. 17
Journal of Parasitology, 90, 797-802. 18
Hess, G.R., Randolph, S.E., Arneberg, P., Chemini, C., Furlanello, C., Harwood, J., 19
Roberts, M.G. & Swinton, J. (2001). Spatial aspects of disease dynamics. In The 20
Ecology of Wildlife Diseases (eds P.J. Hudson, A. Rizzoli, B.T. Grenfell, H. 21
Heesterbeek & A.P. Dobson), pp. 102-118. Oxford University Press, Oxford, UK. 22
34

Jeanmougin, F., Thompson, J.D., Gouy, M., Higgins, D.G. & Gibson, T.J. (1998) 1
Multiple sequence alignment with Clustal X. Trends in Biochemical Sciences, 23, 2
403-405. 3
Kovats, R.S., Campbell-Lendrum, D.H., McMichael, A.J., Woodward, A. & Cox, J.S. 4
(2001) Early effects of climate change: do they include changes in vector-borne 5
disease? Philosophical Transactions of the Royal Society of London Series B-6
Biological Sciences, 356, 1057-1068. 7
Kucera, J. (1979) Leucocytozoon in Central European birds: II. Ecological studies. 8
Journal of Protozoology, 26, suppl. 43a. 9
Kucera, J. (1981) Blood parasites of birds in Central Europe: III. Plasmodium and Central 10
Europe. Folia Parasitologica, 28, 303-312. 11
Marshall, J.F. (1938) The British Mosquitoes. British Musuem, London, UK. 12
Merilä, J. & Andersson, M. (1999) Reproductive effort and success are related to 13
haematozoan infections in blue tits. Ecoscience, 6, 421-428. 14
Palinauskas, V., Kosarev, V.V., Shapoval, A.P., Bensch, S. & Valkiūnas, G. (2007) 15
Comparison of mitochondrial cytochrome b lineages and morphospecies of two 16
avian malaria parasites of the subgenera Haemamoeba and Giovannolaia 17
(Haemosporida: Plasmodiidae). Zootaxa, 1626, 39-50 18
Pascual, M. & Dobson, A. (2005) Seasonal patterns of infectious diseases. Plos Medicine, 19
2, 18-20. 20
Pérez-Tris, J. & Bensch, S. (2005) Dispersal increases local transmission of avian 21
malarial parasites. Ecology Letters, 8, 838-845. 22
35
Pérez-Tris, J., Hasselquist, D., Hellgren, O., Križanauskiene, A., Waldenström, J. & 1
Bensch, S. (2005) What are malaria parasites? Trends in Parasitology, 21, 209-2
211. 3
Perrins, C.M. (1979) British Tits. Collins, Glasgow. 4
Richner, H., Christe, P. & Oppliger, A. (1995) Paternal investment affects prevalence of 5
malaria. Proceedings of the National Academy of Sciences, USA, 92, 1192-1194. 6
Rogers, D.J. & Randolph, S.E. (2000) The global spread of malaria in a future, warmer 7
world. Science, 289, 1763-1766. 8
Schrader, M.S., Walters, E.L., James, F.C. & Greiner, E.C. (2003) Seasonal prevalence of 9
a haematozoan parasite of red-bellied woodpeckers (Melanerpes carolinus) and 10
its association with host condition and overwinter survival. Auk, 120, 130-137. 11
Seutin, G., White, B.N. & Boag, P.T. (1991) Preservation of avian blood and tissue 12
samples for DNA analyses. Canadian Journal of Zoology-Revue Canadienne De 13
Zoologie, 69, 82-90. 14
Sol, D., Jovani, R. & Torres, J. (2000) Geographical variation in blood parasites in feral 15
pigeons: the role of vectors. Ecography, 23, 307-314. 16
Sol, D., Jovani, R. & Torres, J. (2003) Parasite mediated mortality and host immune 17
response explain age-related differences in blood parasitism in birds. Oecologia, 18
135, 542-547. 19
Svensson, L. (1992) Identification guide to European passerines. 4th edn. Natural 20
History Museum, Stockholm. 21
Valkiūnas, G. (2005) Avian Malaria Parasites and other Haemosporidia. CRC Press, 22
Boca Raton, FL, USA. 23
36

Valkiūnas, G., Anwar, A.M., Atkinson, C.T., Greiner, E.C., Paperna, I. & Peirce, M.A. 1
(2005) What distinguishes malaria parasites from other pigmented 2
haemosporidians? Trends in Parasitology, 21, 357-358. 3
Valkiūnas, G., Bairlein, F., Iezhova, T.A. & Dolnik, O.V. (2004) Factors affecting the 4
relapse of Haemoproteus belopolskyi infections and the parasitaemia of 5
Trypanosoma spp. in a naturally infected European songbird, the blackcap, Sylvia 6
atricapilla. Parasitology Research, 93, 218-222. 7
Valkiūnas, G., Zehtindjiev, P., Hellgren, O., Ilieva, M., Iehzova, T.A. & Bensch, S. 8
(2007) Linkage between mitochondrial cytochrome b lineages and morphospecies 9
of two avian malaria parasites, with a description of Plasmodium (Novyella) 10
ashfordi sp. nov. Parasitology Research, 100, 1311-1322. 11
Waldenström, J., Bensch, S., Hasselquist, D. & Ostman, O. (2004) A new nested 12
polymerase chain reaction method very efficient in detecting Plasmodium and 13
Haemoproteus infections from avian blood. Journal of Parasitology, 90, 191-194. 14
Weatherhead, P.J. & Bennett, G.F. (1991) Ecology of red-winged blackbird parasitism by 15
hematozoa. Canadian Journal of Zoology-Revue Canadienne De Zoologie, 69, 16
2352-2359. 17
White, K.A.J., Grenfell, B.T., Hendry, R.J., Lejeune, O. & Murray, J.D. (1996) Effect of 18
seasonal host reproduction on host-macroparasite dynamics. Mathematical 19
Biosciences, 137, 79-99. 20
Wood, M.J., Cosgrove, C.L., Wilkin, T.A., Knowles, S.C.L., Day, K.P. & Sheldon, B.C. 21
(2007) Within-population variation in prevalence and lineage distribution of avian 22
malaria in blue tits Cyanistes caeruleus. Molecular Ecology, 16, 3263–3273. 23
37

Wood, S.N. (2004) Stable and efficient multiple smoothing parameter estimation for 1
generalized additive models. Journal of the American Statistical Association, 99, 2
673-686. 3
4
5
38
Related Documents


