Cory Searcy, IISD Maureen Hart, Sustainable Measures CSIN Seminar Understanding Indicators March 2, 2010 3:30 p.m. – 5:00 p.m.

Cory Searcy, IISD Maureen Hart, Sustainable Measures CSIN Seminar Understanding Indicators March 2, 2010 3:30 p.m. – 5:00 p.m.
Dec 23, 2015
Welcome message from author
This document is posted to help you gain knowledge. Please leave a comment to let me know what you think about it! Share it to your friends and learn new things together.
Transcript
Cory Searcy, IISDMaureen Hart, Sustainable Measures
CSIN SeminarUnderstanding Indicators
March 2, 20103:30 p.m. – 5:00 p.m.

Agenda
• Introduction and Overview
• Introduction to Indicators
• Developing Indicators
• Key Considerations
• Group Discussion
• Questions and Next steps

Goals and Indicators
• Goal – a description of future condition community members wish to achieve
• Indicator – a numeric measure that provides key information about conditions and trends– System level– Organizational/program level– Activity/action level

Goals or Indicators Which Comes First?
Indicators: • clarify and specify
what a goal means• track movement
towards or away from the goal
Goals:• provide a structure
or framework for developing indicators
• provide an impetus and context for tracking, reporting, and discussing the indicators
PlanEvaluate
Set Goals
Implement

• Need to be used as part of an ongoing process
• Need to be linked to goals
• Can be used to – Raise awareness
– Engage stakeholders
– Inform decisions
– Measure progress
PlanEvaluate
Set Goals
Implement
Indicators are tools

Traditional ThinkingEnvironment Economy Society
Water Quality
Air Quality
Natural Resources
Stockholder Profits
Materials for Production
Jobs
Education
Health
Poverty
Crime
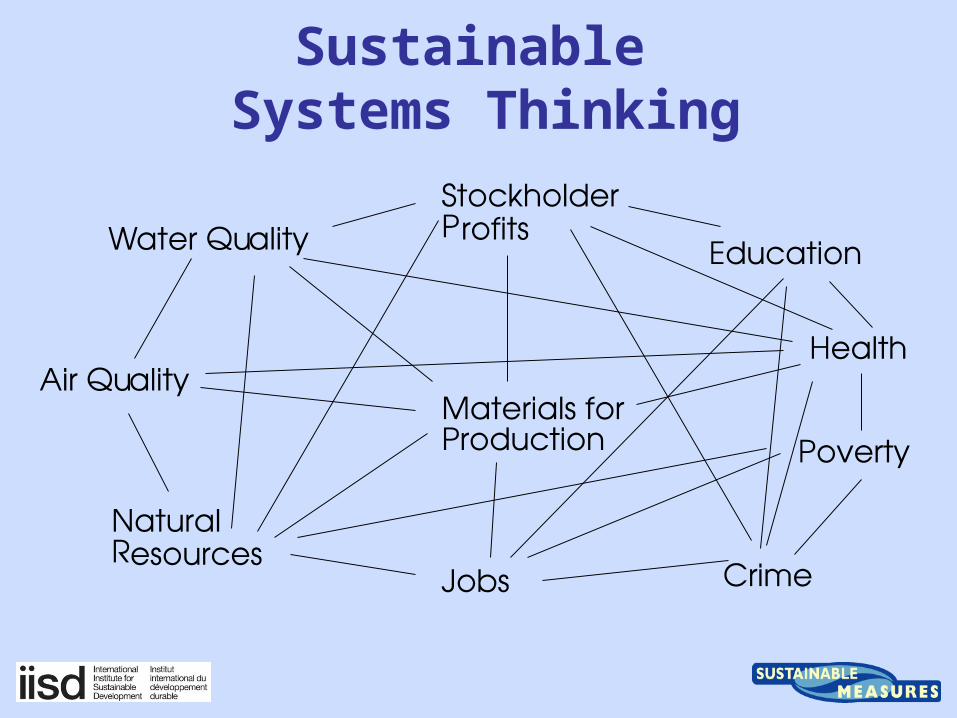
Sustainable Systems Thinking
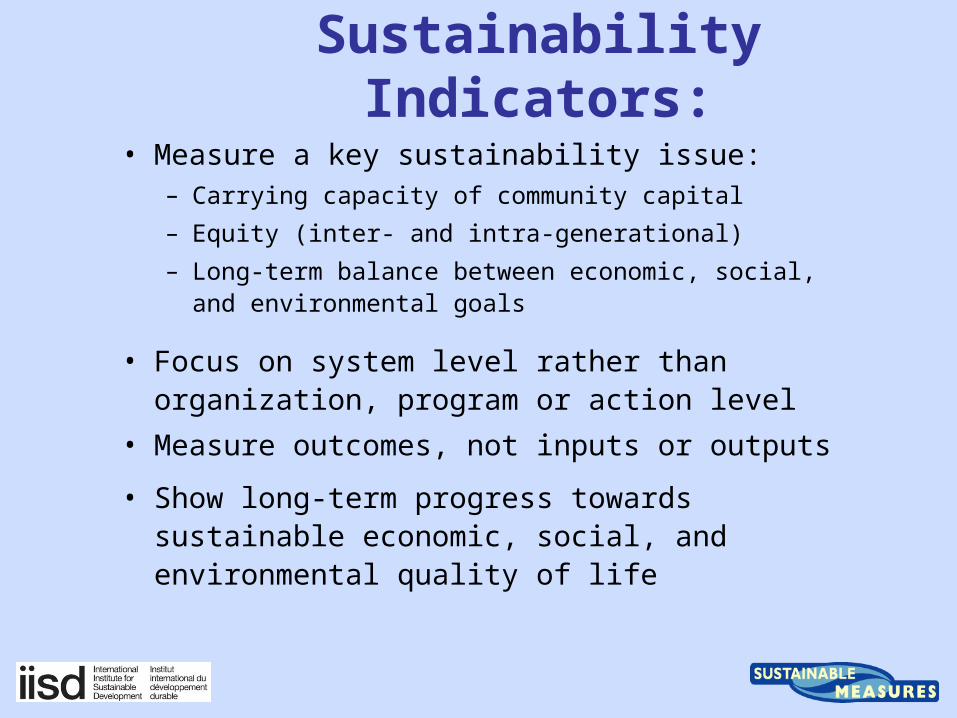
Sustainability Indicators:
• Measure a key sustainability issue: – Carrying capacity of community capital
– Equity (inter- and intra-generational)
– Long-term balance between economic, social, and environmental goals
• Focus on system level rather than organization, program or action level
• Measure outcomes, not inputs or outputs
• Show long-term progress towards sustainable economic, social, and environmental quality of life

Examples of SustainabilityIssues and Indicators
Issue Sustainability indicator
Resource Use Percent of energy from renewable sources Annual water use compared to sustainable annual yield of water supply
Green infrastructure
Percent of land area that is impervious Percent of critical resource lands that are permanently protected
Transpor-tation
Percent of population spending more than 30% of income on transportation
Education Percent of school children living in poverty
Housing Percent of population spending more than 30% of income on housing Percent of housing stock that is energy efficient

More Examples of SustainabilityIssues and Indicators
Issue Sample sustainability indicator
Economic Development
Percent of jobs that pay a living wage Percent of economy based on sustainable production and consumption
Ecosystem services
Annual C02 emissions compared to 1990 Fragmentation and parcelization of key resource lands
Resource use Percent of solid waste that is recycled
Human capital
Parents’ literacy rate Percent of population with health insurance
Social capital Percent of workers in community able to afford housing in the community Percent of population voting in local elections
Built capital Percent of housing/jobs within ¼ mile of public transportation

Discussion Question 1
• How do these indicators reflect characteristics of sustainability indicators?

Developing SD Indicators• In general, there are two approaches used to
develop SD indicators:– Use indicators developed and tested by others.– Develop indicators specifically tailored to the context in
which they will be used.
• There are many guidelines and standard sets of indicators available to support the first approach.– National: UN CSD Indicators.– Regional: Sustainable Calgary.– Organizational: Global Reporting Initiative.
• There is no universally applicable methodology for developing indicators to support the second approach, but guidelines are available.

Developing SD IndicatorsA Sustainable Development
Indicator Design Process
1. Conduct needs assessment.
2. Conduct process planning.
3. Develop a draft system of indicators.
4. Test and adjust the indicators.
5. Implement the indicators.
6. Review and improve.
REVI SI ON
REQ.
APPROVED
REVI SI ON
REQ.
APPROVED
REVI SI ON
REQ.
APPROVED
1
Approve
3
4
Review
Approve
5
2
6

Develop a Draft System of Indicators
There is no universally accepted method or formula
for creating indicators!
STEP 2
REVISION
REQ.
STEP 4
A. Develop Conceptual Framework
D. Develop DraftSystem of Indicators
Review Indicators
B. Identify Key Issues
C. Develop Indicator Selection Criteria

• A conceptual framework is a set of interrelated concepts, principles, and ideas that help organize and direct thinking about a particular issue. – An effective framework should help determine priorities
in the choice of indicators and help communicate those choices to interested stakeholders (Hardi and Zdan, 1997).
• There are three common classifications of frameworks:– Scope: Goals, Issues, Domains.– Location: Geographic Location, Organization Level.– Process: Input-Process-Output, PSR.
Develop a Conceptual Framework

• The key issues / aspects that the indicators must address must be identified and defined.– Key stakeholders should be involved.– Linkages between the issues should be considered.– This is normally an iterative process.
Identify Key Issues
Theme 1 - Stakeholder Relationships● Public Involvement● Staff Relations● Community Relations
Theme 2 - Land Use Practices● Private and Crown Land Usage● Alterations to the Landscape● Vegetation Management Practices
Theme 3 - Governance● Governance and Management Issues● Benefits to Customers and Stakeholders
Environment Society
Economy
CONSULT

• Choosing the indicators is a challenging task!– Indicator selection criteria are developed to guide choices.– The final criteria is always at the discretion of those
involved.
• Sample criteria:– Understandable, Actionable, Relevant, Credible,
Illustrative, Provide Linkages, etc.
• Guiding principles:– Data does not need to be currently available, but
measurement should be possible.– Must be acceptable to those involved in its use.
Develop Indicator Selection Criteria
Three key questions: (1)Will this indicator help users make decisions?
(2)Are stakeholders interested in this information?(3)What behaviour will this indicator encourage?
Three key questions: (1)Will this indicator help users make decisions?
(2)Are stakeholders interested in this information?(3)What behaviour will this indicator encourage?

• This is typically an iterative process and will vary from case to case.– Example Process: (1) develop a pool of indicators, (2)
consolidate the pool of indicators, and (3) finalize the draft system of indicators.
• Key Considerations:– The distribution between generic vs. unique indicators.– The number of indicators to include in the system.– The relationship of the indicators to each other.– The relationship of the indicators to existing
infrastructure.– The need for consultation with those who will use the
indicators.– The appropriateness of developing a composite index.
Develop a Draft System of Indicators

• Three key tests: 1. Has anything been missed? / Do the
indicators address the issues?
2. Is there any redundancy in the system?
3. Are all of the proposed indicators actually going to be used?
Review Indicators

Discussion Question 2
• What are some of the key sustainable development issues for your organization?
• What are some of the criteria you could use to develop/select an appropriate framework?”

What gets measured, gets managed(what isn’t measured, is often ignored)
• Two different levels– System level, sustainability indicator– Organizational or Program level performance
indicators
• System level:– Big picture, long term view – Not entirely under organizational control – Often ‘implied’ in organizational goals rather than
explicitly stated
• Organization/Program level:– Link programs, policies and actions to system level– Provide information about organization’s contribution
to system level sustainability

Who is in charge? Actors and Issues
Community Members
Regional Actors
Muni Gov’t

Community Members
Regional Actors
Muni Gov’t
R
R
R
R
R
B
B
B
B
O
O
O
O
Organizations
Residents
Businesses
Government
Who is in charge? Actors and Issues

Community Members
County
R
R
R
R
R
B
B
B
B
O
O
O
O
Organizations
Residents
Businesses
Government
Community Members
County
R
R
R
B
B
B
O
O
OO
M
M
M
Community Members
County
R
R
R
B
B
B
O
O
O
O
M
M
M
Muni Gov’t
Regional Actors
Who is in charge? Actors and Issues

Annual GHG regional emissions compared to 1990 baseline
• MARC– Number of municipalities that have signed on to the US Conference of Mayor’s
Climate Protection Agreement– Number of municipalities that have completed a emissions inventory– Total emissions reported annually by municipalities
• Municipalities– GHG Emissions from municipal operations
• Chamber of Commerce– Number of businesses that have signed on to the Greater Kansas City Climate
Protection Partnership– Total emissions reported by businesses
• Utilities– Number of customers who have done an energy audit – Total emissions by residential, commercial, industrial, and institutional
classifications
System and Program Indicators for: Climate Change
Program
System

Percent of regional land that is permeable
• MARC– Number of miles/acres of Metro Green plan completed– Number of municipalities and counties with adequate green
infrastructure standards, regulations and ordinances– Percent of regional stream miles with riparian buffers
• Municipalities– Percent of development projects permitted that include land
conservation– Total amount of open space permanently protected
• Developers– Percent of project area that is preserved as green infrastructure
• Home Owners– Percent of land developed vs land providing ecosystem services
System and Program Indicators for : Green Infrastructure
Program
System

Discussion Question 3
Select an organization or issue area to work on as a group
• What would you see as the key system level indicators for your organization or issue?
• Identify key actors (who needs to be involved and needs to have program level measures that link to system level?)
• What would you see as your key program level indicators that tie into the system level indicators?

Key Questions to Consider:
• What is the purpose of the indicators (raise awareness, inform decisions, monitor progress)?
• Who is the audience and how will they use the indicators?
• Who needs to be involved (including intended audience and keepers of the data)?
• What will be the scope and boundaries of the indicator system (geographic area, topic areas)?
• What will the balance be between ideal and do-able?
• What framework is most appropriate?
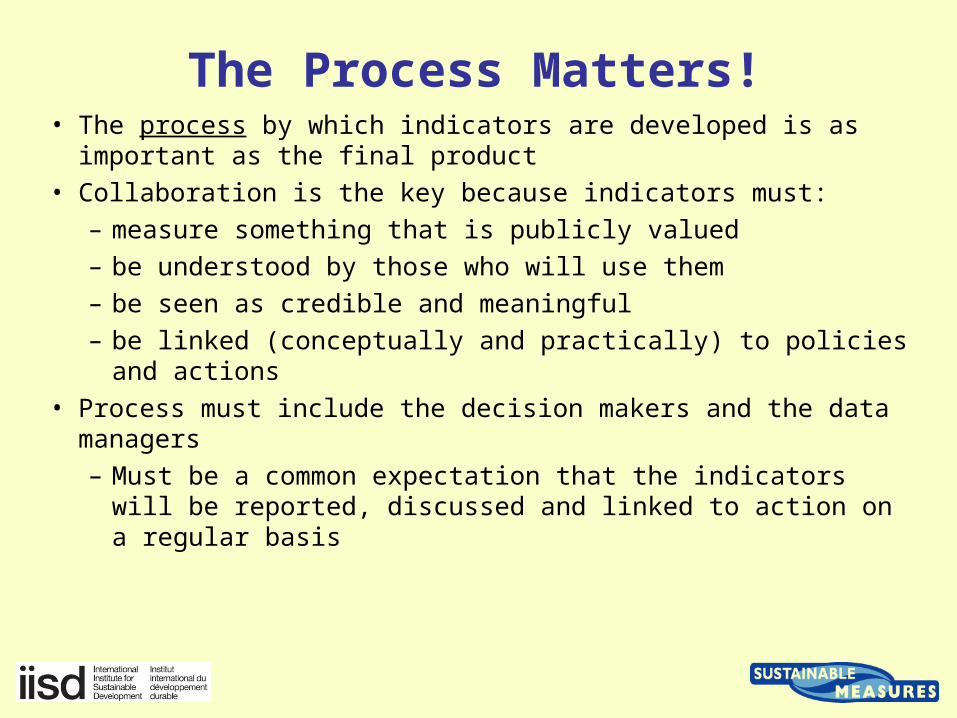
The Process Matters!• The process by which indicators are developed is as
important as the final product• Collaboration is the key because indicators must:
– measure something that is publicly valued– be understood by those who will use them– be seen as credible and meaningful– be linked (conceptually and practically) to policies and
actions• Process must include the decision makers and the data
managers– Must be a common expectation that the indicators will be
reported, discussed and linked to action on a regular basis

Discussion
• What are some of the key cautions to keep in mind when designing indicators?
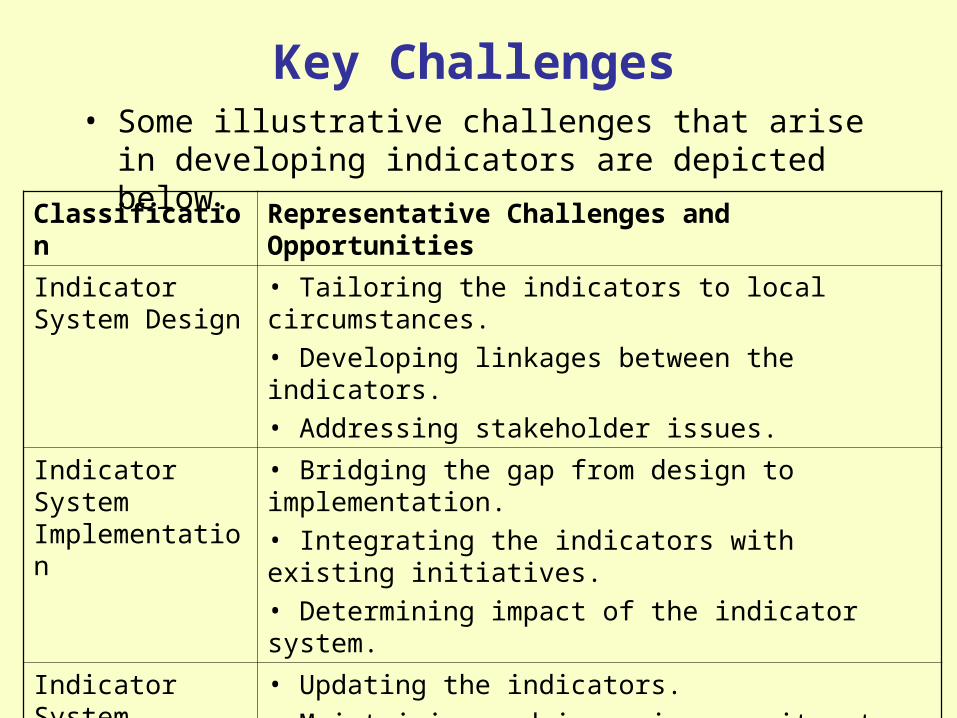
Classification Representative Challenges and Opportunities
Indicator System Design
• Tailoring the indicators to local circumstances.• Developing linkages between the indicators.• Addressing stakeholder issues.
Indicator System Implementation
• Bridging the gap from design to implementation.• Integrating the indicators with existing initiatives.• Determining impact of the indicator system.
Indicator System Evolution
• Updating the indicators.• Maintaining and improving commitment.• Establishing a governance structure.
Key Challenges• Some illustrative challenges that arise in
developing indicators are depicted below.

• A network of organizations and individuals using community indicators to inform decisions and create change
• Broad range of issue: – General: quality of life, healthy community, sustainability– Specific topics: education, health
• Conferences, outreach, technical assistance, webinars, research projects
• Current project – integrating community indicators and organizational performance measures
Community Indicators Consortiumwww.communityindicators.net
Related Documents