UNCORRECTED PROOF 1 Corticokinematic coherence mainly reflects movement-induced 2 proprioceptive feedback 3 Mathieu Bourguignon a, ⁎, Harri Piitulainen a , Xavier De Tiège b , Veikko Jousmäki a , Riitta Hari a 4 a Brain Research Unit and MEG Core, O.V. Lounasmaa Laboratory, Aalto University School of Science, PO BOX 15100, FI-00076-AALTO Espoo, Finland 5 b Laboratoire de Cartographie Fonctionnelle du Cerveau, UNI — ULB Neuroscience Institute, 808 Lennik Street, B-1070 Bruxelles, Belgium abstract 6 article info 7 Article history: 8 Accepted 14 November 2014 9 Available online xxxx 10 Keywords: 11 Kinematics 12 Human brain 13 Magnetoencephalography 14 Proprioception 15 Sensorimotor cortex 16 Partial directed coherence 17 Movement 18 Corticokinematic coherence (CKC) reflects coupling between magnetoencephalographic (MEG) signals and hand 19 kinematics, mainly occurring at hand movement frequency (F0) and its first harmonic (F1). Since CKC can be ob- 20 tained for both active and passive movements, it has been suggested to mainly reflect proprioceptive feedback to 21 the primary sensorimotor (SM1) cortex. However, the directionality of the brain–kinematics coupling has not 22 been previously assessed and was thus quantified in the present study by means of renormalized partial directed 23 coherence (rPDC). 24 MEG data were obtained from 15 subjects who performed right index-finger movements and whose finger was, 25 in another session, passively moved, with or without tactile input. Four additional subjects underwent the same 26 task with slowly varying movement pace, spanning the 1–5 Hz frequency range. The coupling between SM1 ac- 27 tivity recorded with MEG and finger kinematics was assessed with coherence and rPDC. 28 In all conditions, the afferent rPDC spectrum, which resembled the coherence spectrum, displayed higher values 29 than the efferent rPDC spectrum. The afferent rPDC was 37% higher when tactile input was present, and it was at 30 highest at F1 of the passive conditions; the efferent rPDC level did not differ between conditions. The apparent 31 latency for the afferent input, estimated within the framework of the rPDC analysis, was 50–100 ms. 32 The higher directional coupling between hand kinematics and SM1 activity in afferent than efferent direction 33 strongly supports the view that CKC mainly reflects movement-related somatosensory proprioceptive afferent 34 input to the contralateral SM1 cortex. 35 © 2014 The Authors. Published by Elsevier Inc. This is an open access article under the CC BY-NC-SA license 36 (http://creativecommons.org/licenses/by-nc-sa/3.0/). 37 38 39 40 41 Introduction 42 During fast repetitive hand movements, neuronal activity from the 43 contralateral primary sensorimotor (SM1) cortex, as measured with 44 magnetoencephalography (MEG), is coherent with hand kinematics at 45 movement frequency (F0) and its first harmonic (F1), a phenomenon 46 referred to as corticokinematic coherence (CKC) (Bourguignon et al., 47 2011, 2012b; Jerbi et al., 2007). During such repetitive movements, 48 the SM1 cortex phasically produces motor output and integrates so- 49 matosensory input in overlapping time windows. Until recently, the 50 brain oscillations emerging from the SM1 cortex at frequencies 51 matching the frequencies of hand kinematics have been thought to be 52 related to encoding of hand kinematics (Bourguignon et al., 2012a, 53 2012b; Jerbi et al., 2007; Kelso et al., 1998; Waldert et al., 2008), or to 54 be a superposition of motor and somatosensory signals (Muller et al., 55 2000; Pollok et al., 2003, 2004). The hypothesis of motor encoding 56 would imply descending motor commands that were backed up by 57 monkey recordings showing that the firing rate of some motor-cortex 58 neurons correlates with several kinematics parameters, such as direc- 59 tion (Georgopoulos et al., 1982), speed (Moran and Schwartz, 1999), 60 and acceleration (Ashe and Georgopoulos, 1994; Reina et al., 2001). To 61 which extent CKC reflects motor efferent vs. somatosensory afferent ac- 62 tivity had, however, not been quantified. 63 We recently found evidence for strong involvement of afferent input 64 in the generation of the CKC as both active and passive finger move- 65 ments lead to similar CKC level and neuronal generators at the hand 66 area of the contralateral SM1 cortex (Piitulainen et al., 2013). We thus 67 argued that CKC mainly reflects proprioceptive feedback to the SM1 68 cortex. However, this physiologically well-based interpretation was 69 not backed up by any quantitative analysis of the relative afferent vs. 70 efferent contributions to the CKC, nor was any directionality analysis 71 carried out. 72 Here, we disentangled the relative contributions of motor output 73 and somatosensory input to CKC by computing the directionality of cou- 74 pling between MEG signals and finger kinematics. Such quantification 75 can be performed with non-symmetric indices, such as partial directed 76 coherence (PDC), which relies on the concept of Granger-causality to re- 77 veal information directionality between processes in a frequency-spe- 78 cific way (Baccala et al., 1998; Sameshima and Baccala, 1999). NeuroImage xxx (2014) xxx–xxx ⁎ Corresponding author. Fax: +358 94 702 29 69. E-mail address: mathieu.bourguignon@aalto.fi (M. Bourguignon). YNIMG-11786; No. of pages: 9; 4C: 4, 6 http://dx.doi.org/10.1016/j.neuroimage.2014.11.026 1053-8119/© 2014 The Authors. Published by Elsevier Inc. This is an open access article under the CC BY-NC-SA license (http://creativecommons.org/licenses/by-nc-sa/3.0/). Contents lists available at ScienceDirect NeuroImage journal homepage: www.elsevier.com/locate/ynimg Please cite this article as: Bourguignon, M., et al., Corticokinematic coherence mainly reflects movement-induced proprioceptive feedback, NeuroImage (2014), http://dx.doi.org/10.1016/j.neuroimage.2014.11.026

Welcome message from author
This document is posted to help you gain knowledge. Please leave a comment to let me know what you think about it! Share it to your friends and learn new things together.
Transcript

1
2
3
45
6
789
1011121314151617
35
36
3738
39
40
41
42
43
44
45
46
47
48
49
50
51
52
53
54
55
56
57
NeuroImage xxx (2014) xxx–xxx
YNIMG-11786; No. of pages: 9; 4C: 4, 6
Contents lists available at ScienceDirect
NeuroImage
j ourna l homepage: www.e lsev ie r .com/ locate /yn img
Corticokinematic coherence mainly reflects movement-inducedproprioceptive feedback
OFMathieu Bourguignon a,⁎, Harri Piitulainen a, Xavier De Tiège b, Veikko Jousmäki a, Riitta Hari a
a Brain Research Unit and MEG Core, O.V. Lounasmaa Laboratory, Aalto University School of Science, PO BOX 15100, FI-00076-AALTO Espoo, Finlandb Laboratoire de Cartographie Fonctionnelle du Cerveau, UNI — ULB Neuroscience Institute, 808 Lennik Street, B-1070 Bruxelles, Belgium
⁎ Corresponding author. Fax: +358 94 702 29 69.E-mail address: [email protected] (M. Bou
http://dx.doi.org/10.1016/j.neuroimage.2014.11.0261053-8119/© 2014 The Authors. Published by Elsevier Inc
Please cite this article as: Bourguignon, M.,NeuroImage (2014), http://dx.doi.org/10.101
Oa b s t r a c t
a r t i c l e i n f o18
19
20
21
22
23
24
25
26
27
28
Article history:Accepted 14 November 2014Available online xxxx
Keywords:KinematicsHuman brainMagnetoencephalographyProprioceptionSensorimotor cortexPartial directed coherenceMovement
29
30
31
32
33
34
ECTED PRCorticokinematic coherence (CKC) reflects coupling betweenmagnetoencephalographic (MEG) signals and handkinematics, mainly occurring at handmovement frequency (F0) and its first harmonic (F1). Since CKC can be ob-tained for both active and passivemovements, it has been suggested tomainly reflect proprioceptive feedback tothe primary sensorimotor (SM1) cortex. However, the directionality of the brain–kinematics coupling has notbeen previously assessed andwas thus quantified in the present study bymeans of renormalized partial directedcoherence (rPDC).MEG data were obtained from 15 subjects who performed right index-finger movements and whose finger was,in another session, passively moved, with or without tactile input. Four additional subjects underwent the sametask with slowly varying movement pace, spanning the 1–5 Hz frequency range. The coupling between SM1 ac-tivity recorded with MEG and finger kinematics was assessed with coherence and rPDC.In all conditions, the afferent rPDC spectrum, which resembled the coherence spectrum, displayed higher valuesthan the efferent rPDC spectrum. The afferent rPDCwas 37% higher when tactile input was present, and it was athighest at F1 of the passive conditions; the efferent rPDC level did not differ between conditions. The apparentlatency for the afferent input, estimated within the framework of the rPDC analysis, was 50–100 ms.The higher directional coupling between hand kinematics and SM1 activity in afferent than efferent directionstrongly supports the view that CKC mainly reflects movement-related somatosensory proprioceptive afferentinput to the contralateral SM1 cortex.
© 2014 The Authors. Published by Elsevier Inc. This is an open access article under the CC BY-NC-SA license(http://creativecommons.org/licenses/by-nc-sa/3.0/).
R
58
59
60
61
62
63
64
65
66
67
68
69
70
71
72
73
74
75
UNCO
RIntroduction
During fast repetitive hand movements, neuronal activity from thecontralateral primary sensorimotor (SM1) cortex, as measured withmagnetoencephalography (MEG), is coherent with hand kinematics atmovement frequency (F0) and its first harmonic (F1), a phenomenonreferred to as corticokinematic coherence (CKC) (Bourguignon et al.,2011, 2012b; Jerbi et al., 2007). During such repetitive movements,the SM1 cortex phasically produces motor output and integrates so-matosensory input in overlapping time windows. Until recently, thebrain oscillations emerging from the SM1 cortex at frequenciesmatching the frequencies of hand kinematics have been thought to berelated to encoding of hand kinematics (Bourguignon et al., 2012a,2012b; Jerbi et al., 2007; Kelso et al., 1998; Waldert et al., 2008), or tobe a superposition of motor and somatosensory signals (Muller et al.,2000; Pollok et al., 2003, 2004). The hypothesis of motor encodingwould imply descending motor commands that were backed up bymonkey recordings showing that the firing rate of some motor-cortex
76
77
78rguignon).
. This is an open access article under
et al., Corticokinematic cohe6/j.neuroimage.2014.11.026
neurons correlates with several kinematics parameters, such as direc-tion (Georgopoulos et al., 1982), speed (Moran and Schwartz, 1999),and acceleration (Ashe and Georgopoulos, 1994; Reina et al., 2001). Towhich extent CKC reflects motor efferent vs. somatosensory afferent ac-tivity had, however, not been quantified.
We recently found evidence for strong involvement of afferent inputin the generation of the CKC as both active and passive finger move-ments lead to similar CKC level and neuronal generators at the handarea of the contralateral SM1 cortex (Piitulainen et al., 2013). We thusargued that CKC mainly reflects proprioceptive feedback to the SM1cortex. However, this physiologically well-based interpretation wasnot backed up by any quantitative analysis of the relative afferent vs.efferent contributions to the CKC, nor was any directionality analysiscarried out.
Here, we disentangled the relative contributions of motor outputand somatosensory input to CKCby computing the directionality of cou-pling between MEG signals and finger kinematics. Such quantificationcan be performed with non-symmetric indices, such as partial directedcoherence (PDC),which relies on the concept of Granger-causality to re-veal information directionality between processes in a frequency-spe-cific way (Baccala et al., 1998; Sameshima and Baccala, 1999).
the CC BY-NC-SA license (http://creativecommons.org/licenses/by-nc-sa/3.0/).
rence mainly reflects movement-induced proprioceptive feedback,

T
79
80
81
82
83
84
85
86
87
88
89
90
91
92
93
94
95
96
97
98
99
100
101
102
103
104
105
106
107
108
109
110
111
112
113
114
115
116
117
118
119
120
121
122
123
124
125
126
127
128
129
130
131
132
133
134
135
136
137
138
139
140
141
142
143
144
145
146
147
148
149
150
151
152
153
154
155
156
157
158
159
160
161
162
163
164
165
166
167
168
169
170
171
172
173
174
175
176
177
178
179
180
181
182
183
2 M. Bourguignon et al. / NeuroImage xxx (2014) xxx–xxx
ORREC
However, comparison of PDC values is fraught with caveats since ahigher PDC value does not necessarily indicate a stronger coupling be-tween the signals (Schelter et al., 2009). Renormalized PDC (rPDC),wherein PDC is normalized so that its null distribution follows a χ2 dis-tribution, has been designed to correct this shortcoming, allowing theinference of statistical significance and the comparison of two PDCvalues reflecting the direction of the information flow (Schelter et al.,2009).
Methods based on the concept of Granger causality were previouslyused to assess the directionality of the cortex–muscle coherence (Limet al., 2014; Tsujimoto et al., 2009;Withamet al., 2010, 2011), which re-flects coupling between activity of the primarymotor cortex and surfaceelectromyogram. During low-force isometric contraction the coherencepeaks at ~20 Hz (Conway et al., 1995) and the cortex leads the muscleby about 20 ms to upper limbs and by about 40 ms to lower limbs(Salenius et al., 1997), in agreement with corticomuscular conductiontimes evident also from other types of measurements (Gross et al.,2000). Proprioceptive feedback does not appear essential for the gener-ation of cortex–muscle coherence since the strength of the couplingassessedwithmethods based on Granger causality is higher in the effer-ent direction than in the afferent direction (Lim et al., 2014; Tsujimotoet al., 2009;Witham et al., 2010), and because ischemic sensory deaffer-entation in the upper limb diminishes but does not abolish cortex–mus-cle coherence nor alter the frequency of its dominant component (Pohjaand Salenius, 2003). Nevertheless, directionality analyses imply thatsignificant coupling to upper-limb muscles exists in both afferent andefferent directions with a similar delay of on average 24 ms for both(Witham et al., 2011). This result argues for the ability of directionalityanalysismethods to separate the afferent and efferent contributions andto estimate the associated delays, whereas inferences obtained fromthe phase of the cross-spectrum may fail due to a non-trivial mixing ofthe afferent and efferent signals (Baker, 2007). Still, methods basedon the Granger causality or othermeasures have not been used to assessthe directionality of CKC.
In thepresent study,we applied rPDC to the previously reported CKCdata where subjects performed ~4-Hz right forefinger movements (ac-tive) or where their finger was passively moved by an experimenter(passive), with or without tactile input (touch/no-touch) (Piitulainenet al., 2013). Here, rPDC measured the strength of the directional cou-pling between MEG signals picked up above the SM1 cortex and fingerkinematics. To evaluate the relative contributions of motor output andsomatosensory feedback, we compared rPDC values in the efferentand afferent directions. In addition, to determine the afferent and effer-ent delays between finger kinematics and brain signals, and to betterlink the CKC to themovement evoked fields (MEFs) associatedwith dis-crete movements (Neshige et al., 1988), we carried out recordings on anew set of subjects whomoved at varying rate within the same record-ing session.
C 184185
187187
188
189
191191
192
UNExperimental procedures
Subjects
The dataset related to the first (fixed-pace) experiment is derivedfrom Piitulainen et al. (2013) who studied 15 healthy adults (meanage 29.4 yrs, range 21–38; 8 males, 7 females). According to the Edin-burgh handedness scale (Oldfield, 1971), 14 subjects were right-handed and one was ambidextrous.
Four additional healthy right-handed subjects (mean age 30 yrs,range 26–35; 3 males, 1 female) participated in the second (variable-pace) experiment.
The study had a prior approval by the ethics committee of the Hel-sinki and Uusimaa district, and the subjects gave written informed con-sent before participation. Subjects were compensated monetarily forthe lost working hours and travel expenses.
Please cite this article as: Bourguignon, M., et al., Corticokinematic coheNeuroImage (2014), http://dx.doi.org/10.1016/j.neuroimage.2014.11.026
ED P
RO
OF
Experimental protocol
In the fixed-pace experiment described in Piitulainen et al. (2013),subjects performed four randomized movement conditions (active–touch, active–no-touch, passive–touch, and passive–no-touch) involvingfast repetitive flexion–extension movements of the metacar-pophalangeal joint of the right forefinger for 3.5min. In touch conditions,the tip of the index finger touched the table on which hand was resting,whereas in no-touch conditions, it did not. In active conditions, the sub-jects performed self-paced movements, whereas in passive conditions,an investigator moved the subjects' forefinger with a light aluminumstick. Before the recordings, we ensured that the subjects mastered thetask. During the recordings, no cues were delivered about the move-ments. The movement pace was analyzed only afterward, and it rangedfrom 3 to 5 Hz in all conditions and subjects.
The variable-pace experiment was designed to assess the delaybetween finger kinematics and MEG signals. Both active–touch andpassive–touch movements were performed with smoothly varyingrate, spanning frequencies from 1 to 5 Hz in ~20-s-long cycles for10 min. Subjects were instructed to start with tapping at ~1 Hz andthen smoothly increase the pace up to their limit, then slowly de-crease the pace back to ~1 Hz, and thereafter again starting the nextcycle. The task performance was evaluated similarly as in the fixed-pace experiment. In a few cases, the experimenter asked the subjectto start again because online monitoring of the acceleration signalsand the video image of the subject indicated deviation from the re-quested task.
Measurements
The measurements were carried out at the MEG Core of the BrainResearch Unit, Aalto University. Cortical activity was recorded with a306-channel whole-scalp neuromagnetometer (Elekta Neuromag™,Elekta Oy, Helsinki, Finland) and the kinematics of the right forefingerwas monitored with a 3-axis accelerometer (ADXL335 iMEMS Acceler-ometer, Analog Devices, Inc., Norwood, MA, USA) attached to the nail ofthe forefinger. The recording passband was 0.1–330 Hz for MEG signalsandDC–330Hz for accelerometer signals, and the signals were sampledat 1 kHz.
Data processing
Continuous MEG data were pre-processed off-line using the signal-space-separation method (SSS) to suppress external interferences andto correct for head movements (Taulu et al., 2005). Acceleration (Acc)was computed at every time bin as the Euclidian norm of the threeband-passed (1–195 Hz) Acc signals (Bourguignon et al., 2011). Signalsfrom gradiometer pairs indexed by r∈ {1 : 102} (gr,1 and gr,2) were usedto estimate the signal of virtual gradiometers in the orientationθ ∈ [0; π]:
gr;θ tð Þ ¼ gr;1 tð Þ cos θþ gr;2 tð Þ sin θ:
Following Halliday et al. (1995), coherence based on the Fouriertransform of artifact-free 2-s epochs was then computed between Accand gθ:
Coh r; f ; θð Þ ¼ Acc fð Þg�r;θ fð Þ2Acc fð Þj j2 gr;θ fð Þ�
���2;
where * is the Hermitian conjugate and ⟨ ⋅ ⟩ the mean across epochs.Practically, Coh(r, f, θ) was estimated from the cross-spectral densitymatrix formed with Acc, gr,1 and gr,2, and for θ spanning [0; π] by
rence mainly reflects movement-induced proprioceptive feedback,

T
193
194
196196
197
199199
200
201
202
204204
205
206
207
208
209
210
211
212
213
214
215
216
217
218
219
220
221
222
223
224
225
226
227
228
229
230
231
232
233
234
235
236
237
238
239
240
241
242
243
244
245
246
247
248
249
250
251
252
253
254
255
256
257
258
259
260
261
262
263
264
265
266
267
268
269
270
271
272
273
274
275
276
277
278
279
280
281
282
283
284
285
286
287
288
289
290
291
292
293
294
295
296
297
298
299
300
301
302
303
304
305
306
307
308
309
310
3M. Bourguignon et al. / NeuroImage xxx (2014) xxx–xxx
UNCO
RREC
steps of π/100. The optimum θ and the corresponding coherence valuewere obtained as follows:
θopt rð Þ ¼ argmaxθ∈ 0;π½ �
Coh r; f ; θð Þ f∈F ;
Cohopt rð Þ ¼ maxθ∈ 0;π½ �
Coh r; f ; θð Þ f∈F ;
F = {F0, F1} and ⟨ ⋅ ⟩ the geometric mean in fixed-pace, and F the fre-quency range of significant CKC (see Statistical analyses) and ⟨ ⋅ ⟩ thearithmetic mean in variable-pace. Finally, the optimal gradiometerpair chosen among a pre-selection of 9 gradiometer pairs locatedabove the left rolandic area (Rleft SM1) was selected as follows:
ropt ¼ argmaxr∈Rleft SM1
Cohopt rð Þ:
Given that CKCmainly arises from the SM1 cortex, the virtual gradi-ometer gropt;θopt roptð Þ will be referred to as MEGSM1 signal.
We further set out to estimate the causal influence of Acc andMEGSM1 signals on one another (in the efferent direction:Acc ← MEGSM1, and afferent direction: MEGSM1 ← Acc). rPDC waschosen as the index of directional influence since it provides goodproperties, such as inference of statistical significance and comparisonof values between conditions (Schelter et al., 2009). The computationof rPDC requires fitting a multivariate autoregressive model to thedata, and the order of this model should be high enough to avoid de-tecting spurious interactions and low enough for true interactions tosurvive the significance assessment (Schelter et al., 2009; Schneiderand Neumaier, 2001; Sommerlade et al., 2009). In addition, thedown-sampling applied to the data should afford a temporal resolu-tion better than the expected time-shift between the signals (Florinet al., 2010).
The model order was set to 100 and the model parameters wereestimated from Acc and MEGSM1 signals low-pass filtered at 25 Hzand resampled at 50 Hz with the ARfit package (Schneider andNeumaier, 2001). Across subjects and conditions, the optimal modelorder range was 41–61 (mean ± SD 50 ± 4) according to Schwarz'sBayesian criterion and 118–195 (149 ± 17) according to Akaike'sfinal prediction error, both implemented in the ARfit package(Schneider and Neumaier, 2001). Adopting model order of 100 there-fore represents a good compromise between the two criteria. Further-more, the chosen parameters (resampling and model order) enableexploring frequencies up to 25 Hz with a 0.5 Hz resolution. Hence,the frequency resolution is the same as used in previous CKC studies(Bourguignon et al., 2011, 2012b; Jerbi et al., 2007), and the down-sampling limits the range of investigated frequencies to 0–25 Hz,range in which the main coherence peaks fall.
As mentioned above, a sensitive issue in Granger-causality-basedmethods pertains to filtering of the data (Florin et al., 2010). To ensurethat our results are not contaminated by filtering or even reflectingsome filtering artifacts, we also analyzed the data by increasing thecut-off frequency of our low-pass filter (applied to our data prior torPDC analysis) from the previous 25 Hz to 50 Hz (with down-sampling at 100 Hz, model order at 200); the proportional increasein all these parameters allowed keeping the 0.5-Hz frequency resolu-tion. The similarity between the rPDC estimated with both sets of pa-rameters was assessed by the correlation coefficient between thecorresponding rPDC values pooled across subjects, conditions, andF0/F1.
Please cite this article as: Bourguignon, M., et al., Corticokinematic coheNeuroImage (2014), http://dx.doi.org/10.1016/j.neuroimage.2014.11.026
ED P
RO
OF
Finally, the delay between Acc and MEGSM1 signals in the variable-pace experiment was estimated as described by Campfens et al.(2014). Briefly, the phase of the Fourier-transformed coefficients ofthe multivariate autoregressive model was plotted as a function ofthe frequency, and the delay was obtained from the slope (dividedby 2π) in the range of 0–10 Hz, using only connected frequency binsof significant coherence. This delay estimation procedure has beenshown to perform well under different configurations of efferent/af-ferent coupling strengths (Campfens et al., 2014). Delays estimatedin such a way are however “apparent” rather than real latencies,since the estimation is affected by response shape (Hari et al., 1989),and it informs about the timing of the strongest response.
Statistical analyses
The statistical significance of the coherence was assessed under thehypothesis of linear independence (Halliday et al., 1995). To correctfor multiple comparisons, the alpha level was set to 0.05 / (Nf × Ns), Nf
being the number of frequency bins falling between 0 and 4 × F0(fixed-pace) or between 0 and 10 Hz (variable-pace), and Ns = 9, thenumber of sensor pairs included in the analysis.
The statistical significance of rPDC was assessed analytically usingthe procedure described in Schelter et al. (2006, 2009). Briefly, underthe null hypothesis of no directional coupling, rPDC values multipliedby the number of time bins used to fit the autoregressivemodel have achi-square distribution with 2 degrees of freedom. To correct for mul-tiple comparisons, the alpha level was set to 0.05 / Nf. Furthermore,the significance of the rPDC was assessed with statistics based onFourier-transform surrogate data (Faes et al., 2004). Fourier-transform surrogate of a signal is obtained by computing its Fourier-transform, replacing the phase of the Fourier coefficients by randomnumbers in the range [−π; π], and then computing the inverseFourier-transform (Faes et al., 2004; Theiler et al., 1992). The proce-dure of computing the rPDC between Fourier transform surrogateMEG and Acc signals was repeated 1000 times, and the maximumrPDC value across the Nf frequency bins was extracted for each repeti-tion in the afferent and in the efferent directions separately. Signifi-cance thresholds at p b 0.05 for the rPDC in the afferent and in theefferent directions were then computed as the 95-percentiles of thecorresponding cumulative density functions.
The significance thresholds obtained with the two independentmethods (analytical and surrogate-data-based) were very close toeach other (ratio between surrogate and analytical threshold 1.09 ±0.07 in the afferent direction and 1.08 ± 0.08 in the efferent direction;mean ± SD estimated from pooled values across subjects, conditions,and F0/F1). The significance of individual rPDC values was identicalwith both statistical methods, and thus no further reference will bemade to the use of different methods.
Possible differences in the strength of the directional couplingbetween fixed-pace movement conditions were compared separatelyusing a three-way 2 (active/passive) × 2 (touch/no-touch) × 2 (frequen-cies, F0 and F1) repeated-measures analysis of variance. The dependentvariablewas the subjects' individual rPDC. Afferent and efferent connec-tions were tested separately.
We finally compared rPDC in the afferent and efferent directionsusing paired t-tests. This comparison requires some precautionssince the between-signals difference in signal-to-noise ratio (SNR) af-fects the rPDC differently in the two directions (Schelter et al., 2009).To get around this shortcoming, the comparison between high-SNRAcc and the limited-SNR MEG signals was done with rPDC computed(1) directly (SNRMEG b SNRAcc) and (2) after adding noise to Acc sig-nals (SNRMEG N SNRAcc). We reasoned that if the same conclusioncan be drawn in these two configurations, the effect of SNR will beruled out. To reach configuration (2), the maximum CKC level acrossF0 and F1 (Coh) was used to estimate SNRMEG, and noise was addedaccordingly to Acc signals. Under the assumptions that (i) Acc signals
rence mainly reflects movement-induced proprioceptive feedback,

UNCO
RRECTED P
RO
OF
311
312
313
314
315
316
317
318
319
320
321
322
323
324
325
326
327
Passive no touchPassive touchActive no touchActive touch
0 1 32 40 1 32 40 1 32 4
0
0.01
0.02
0 1 320
0.5
1
4
0
0.2
0.4
0 1 32 40 1 32 40 1 32 40 1 320
0.01
4Frequency [F0 units]
A. COHERENCE
B. rPDC with noiseless Acc
Frequency [F0 units]
Passive no touchPassive touchActive no touchActive touch
SM1↑
Acc
Acc↑
SM1
left right
C. rPDC with noisy Acc
0
0.01
0.02
0 1 32 40 1 32 40 1 320
0.01
4Frequency [F0 units]
Passive no touchPassive touchActive no touchActive touch
SM1↑
Acc
Acc↑
SM10 1 32 4
Fig. 1. Fixed-pace experiment: coherence spectra and directionality results. A. Coherence spectra (one trace per subject) and associated group-level topographic distribution at F0, F1, andaveraged across F0 and F1. B. Renormalized partial directed coherence (rPDC) in the afferent and efferent directions (one trace per subject). C. Same as B with added noise to the accel-erometer (Acc) signal. The gray horizontal lines indicate the threshold of statistical significance. SM1: primary sensorimotor.
4 M. Bourguignon et al. / NeuroImage xxx (2014) xxx–xxx
have infinite SNR, (ii)MEGSM1 signals are the sum of SM1 activity andof uncorrelated noise, and (iii) coherence between Acc and noiseless-SM1 activity equals one, SNRMEG = Coh/(1 − Coh). Assumptions(i) and (iii) form the worst-case scenario, leading to a pessimisticSNR estimate. We therefore added noise to Acc signals so that itsSNR equaled this pessimistic SNRMEG in all frequencies; the addednoise was computed as the Fourier-transform surrogate Acc signalmultiplied by SNRMEG
−1/2. The simulation was repeated 21 times,and we report the median values to smooth out estimation inaccura-cies pertaining to the random character of the added noise. The
Please cite this article as: Bourguignon, M., et al., Corticokinematic coheNeuroImage (2014), http://dx.doi.org/10.1016/j.neuroimage.2014.11.026
similarity between the rPDC estimated with noisy and noiseless Accwas assessed by the correlation coefficient between the correspond-ing rPDC values pooled across subjects, conditions and F0/F1.
Results
Fixed-pace CKC results
We here sum up the fixed-pace CKC (coherence between finger ki-nematics and MEG) results reported by Piitulainen et al. (2013).
rence mainly reflects movement-induced proprioceptive feedback,
T
328
329
330
331
332
333
334
335
336
337
338
339
340
341
342
343
344
345
346
347
348
349
350
351
352
353
354
355
356
357
358
359
360
361
362
363
364
365
366
367
368
369
370
371
372
373
374
375
376
377
378
379
380
381
382
383
384
385
386
387
388
389
390
391
392
393
394
395
396
397
398
399
400
401
402
403
5M. Bourguignon et al. / NeuroImage xxx (2014) xxx–xxx
REC
Fig. 1A illustrates the spatial pattern of CKC at the sensor level. Statisti-cally significant (p b 0.05) CKC peaked at F0 and F1 in all conditions, ex-cept in two subjects in active-touch at F0. CKC sources—as reconstructedwith dynamic imaging of coherent sources (Gross et al., 2001)—were lo-cated in the hand area of the contralateral SM1 cortex, with no spatialdifferences between the four movement conditions (active/passivewith touch/no-touch) at F0 and F1. As reported by Piitulainen et al.(2013), CKC level was statistically significantly affected by the task(active vs. passive) and frequency (F0 vs. F1) with an interaction be-tween them, whereas tactile input (touch vs. no-touch) had no effect.
Afferent and efferent coupling
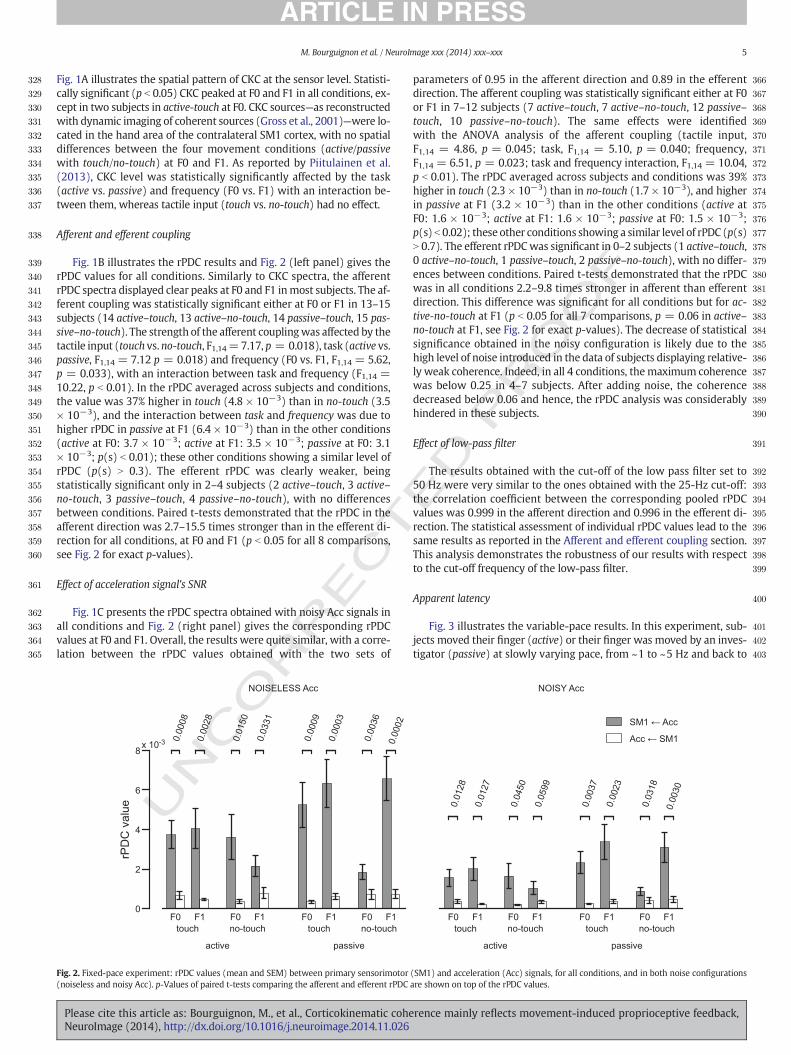
Fig. 1B illustrates the rPDC results and Fig. 2 (left panel) gives therPDC values for all conditions. Similarly to CKC spectra, the afferentrPDC spectra displayed clear peaks at F0 and F1 inmost subjects. The af-ferent coupling was statistically significant either at F0 or F1 in 13–15subjects (14 active–touch, 13 active–no-touch, 14 passive–touch, 15 pas-sive–no-touch). The strength of the afferent couplingwas affected by thetactile input (touch vs. no-touch, F1,14=7.17, p = 0.018), task (active vs.passive, F1,14 = 7.12 p = 0.018) and frequency (F0 vs. F1, F1,14 = 5.62,p = 0.033), with an interaction between task and frequency (F1,14 =10.22, p b 0.01). In the rPDC averaged across subjects and conditions,the value was 37% higher in touch (4.8 × 10⁻³) than in no-touch (3.5× 10⁻³), and the interaction between task and frequency was due tohigher rPDC in passive at F1 (6.4 × 10⁻³) than in the other conditions(active at F0: 3.7 × 10⁻³; active at F1: 3.5 × 10⁻³; passive at F0: 3.1× 10⁻³; p(s) b 0.01); these other conditions showing a similar level ofrPDC (p(s) N 0.3). The efferent rPDC was clearly weaker, beingstatistically significant only in 2–4 subjects (2 active–touch, 3 active–no-touch, 3 passive–touch, 4 passive–no-touch), with no differencesbetween conditions. Paired t-tests demonstrated that the rPDC in theafferent direction was 2.7–15.5 times stronger than in the efferent di-rection for all conditions, at F0 and F1 (p b 0.05 for all 8 comparisons,see Fig. 2 for exact p-values).
Effect of acceleration signal's SNR
Fig. 1C presents the rPDC spectra obtained with noisy Acc signals inall conditions and Fig. 2 (right panel) gives the corresponding rPDCvalues at F0 and F1. Overall, the results were quite similar, with a corre-lation between the rPDC values obtained with the two sets of
UNCO
R
x 10-3
0
4
2
6
8
rPD
C v
alue
F0 F1 F0 F0 F0F1 F1 F1touch no-touch touch no-touch
active passive
NOISELESS Acc
0.00
08
0.00
28
0.01
50
0.03
31
0.00
09
0.00
03
0.00
36
0.00
02
Fig. 2. Fixed-pace experiment: rPDC values (mean and SEM) between primary sensorimotor(noiseless and noisy Acc). p-Values of paired t-tests comparing the afferent and efferent rPDC
Please cite this article as: Bourguignon, M., et al., Corticokinematic coheNeuroImage (2014), http://dx.doi.org/10.1016/j.neuroimage.2014.11.026
ED P
RO
OF
parameters of 0.95 in the afferent direction and 0.89 in the efferentdirection. The afferent coupling was statistically significant either at F0or F1 in 7–12 subjects (7 active–touch, 7 active–no-touch, 12 passive–touch, 10 passive–no-touch). The same effects were identifiedwith the ANOVA analysis of the afferent coupling (tactile input,F1,14 = 4.86, p = 0.045; task, F1,14 = 5.10, p = 0.040; frequency,F1,14 = 6.51, p = 0.023; task and frequency interaction, F1,14 = 10.04,p b 0.01). The rPDC averaged across subjects and conditions was 39%higher in touch (2.3 × 10⁻³) than in no-touch (1.7 × 10⁻³), and higherin passive at F1 (3.2 × 10⁻³) than in the other conditions (active atF0: 1.6 × 10⁻³; active at F1: 1.6 × 10⁻³; passive at F0: 1.5 × 10⁻³;p(s) b 0.02); these other conditions showing a similar level of rPDC (p(s)N 0.7). The efferent rPDCwas significant in 0–2 subjects (1 active–touch,0 active–no-touch, 1 passive–touch, 2 passive–no-touch), with no differ-ences between conditions. Paired t-tests demonstrated that the rPDCwas in all conditions 2.2–9.8 times stronger in afferent than efferentdirection. This difference was significant for all conditions but for ac-tive-no-touch at F1 (p b 0.05 for all 7 comparisons, p = 0.06 in active–no-touch at F1, see Fig. 2 for exact p-values). The decrease of statisticalsignificance obtained in the noisy configuration is likely due to thehigh level of noise introduced in the data of subjects displaying relative-ly weak coherence. Indeed, in all 4 conditions, themaximum coherencewas below 0.25 in 4–7 subjects. After adding noise, the coherencedecreased below 0.06 and hence, the rPDC analysis was considerablyhindered in these subjects.
Effect of low-pass filter
The results obtained with the cut-off of the low pass filter set to50 Hz were very similar to the ones obtained with the 25-Hz cut-off:the correlation coefficient between the corresponding pooled rPDCvalues was 0.999 in the afferent direction and 0.996 in the efferent di-rection. The statistical assessment of individual rPDC values lead to thesame results as reported in the Afferent and efferent coupling section.This analysis demonstrates the robustness of our results with respectto the cut-off frequency of the low-pass filter.
Apparent latency
Fig. 3 illustrates the variable-pace results. In this experiment, sub-jects moved their finger (active) or their finger was moved by an inves-tigator (passive) at slowly varying pace, from ~1 to ~5 Hz and back to
F0 F0 F0 F0F1 F1 F1 F1touch no-touch touch no-touch
active passive
NOISY Acc
SM1 ← Acc
Acc ← SM1
0.01
28
0.01
27
0.04
50
0.05
99
0.00
37
0.00
23
0.03
18
0.00
30
(SM1) and acceleration (Acc) signals, for all conditions, and in both noise configurationsare shown on top of the rPDC values.
rence mainly reflects movement-induced proprioceptive feedback,

UNCO
RRECTED P
RO
OF
404
405
406
407
408
409
410
411
412
413
414
415
subject 4subject 3subject 2subject 1
Frequency [Hz]
A. COHERENCE
B. rPDC ( )
Frequency [Hz]0 5 1510
0
0.30
20
0
0.13left right
0 5 15100
0.55
20 0 5 15100
0.20
20 0 5 15100
0.45
20
0 5 15100
0.005
0.01
20
0– 0 5 10
0 5 1510 20
0– 0 5 10
0 5 1510 20
0– 0 5 10
0 5 1510 20
0– 0 5 10
SM1 ← Acc Acc ← SM1
0
0.27
0
0.07
0
0.23
subject 4subject 3subject 2subject 1
0
0.12
0
0.27
0
0.14
0
0.14
Frequency [Hz]
D. rPDC ( )
Frequency [Hz]0 5 1510
0
0.25
20 0 5 15100
0.45
20 0 5 15100
0.25
20 0 5 15100
0.25
20
0 5 15100
0.005
0.01
20
0– 0 5 10
0 5 1510 20
0– 0 5 10
0– 0 5 10
0– 0 5 10
SM1 ← Acc Acc ← SM1
0 5 1510 20 0 5 1510 20
ACTIVE
PASSIVEC. COHERENCE
right
Fig. 3.Variable-pace experiment: coherence spectra and directionality results. A (active) and C (passive): Coherence spectra and associated topographic distribution in the frequency rangeof significant coherence. B (active) and D (passive): Renormalized partial directed coherence (rPDC). The smaller insets display the phase–frequency plots of the Fourier coefficients of themultivariate autoregressive model, which were used to estimate the delay through linear regression (red line). The gray horizontal lines indicate the threshold of statistical significance.Acc: accelerometer. SM1: primary sensorimotor.
6 M. Bourguignon et al. / NeuroImage xxx (2014) xxx–xxx
~1Hz resulting in 9–21 cycles during 10min (the instructed rate changewould have resulted in ~30 cycles). In other words, F0 varied from 1to 5 Hz. All 4 subjects managed to perform the task and CKC was sig-nificant in a wide frequency range corresponding to the variable F0and higher harmonics (see Fig. 3 and Table 1). The apparent latencybetween Acc and MEGSM1 signals—estimated only in the afferentdirection since no consistent rPDC was identified in the efferent
Please cite this article as: Bourguignon, M., et al., Corticokinematic coheNeuroImage (2014), http://dx.doi.org/10.1016/j.neuroimage.2014.11.026
direction—was 59–104 ms in the active condition and 64–78 ms inthe passive condition (see Table 1).
Discussion
During fast repetitive (active and passive) fingermovements, the di-rectional coupling (as measured with rPDC) between finger kinematics
rence mainly reflects movement-induced proprioceptive feedback,

T
416
417
418
419
420
421
422
423
424
425
426
427
428
429
430
431
432
433
434
435
436
437
438
439
440
441
442
443
444
445
446
447
448
449
450
451
452
453
454
455
456
457
458
459
460
461
462
463
464
465
466
467
468
469
470Q1
471
472
473
474
475
476
477
478
479
480
481
482
483
484
485
486
487
488
489
490
491
492
493
494
495
496
497
498
499
500
501
502
503
504
505
506
507
508
509
510
511
512
513
514
515
516
517
518
519
520
521
522
523
524
525
526
527
t1:1 Table 1t1:2 Summary of variable-pace results.
t1:3 Condition Subject Frequencies [Hz] Mean coherence Delay [ms]
t1:4 Active S1 2.5–10 0.123 90.4t1:5 S2 1–10 0.267 58.9t1:6 S3 1–9 0.067 103.9t1:7 S4 1–10 0.224 78.8t1:8 Passive S1 2–8 0.111 64.2t1:9 S2 1.5–9 0.268 70.8t1:10 S3 1.5–10 0.133 78.2t1:11 S4 1.5–10 0.134 66.2
7M. Bourguignon et al. / NeuroImage xxx (2014) xxx–xxx
UNCO
RREC
and SM1 cortex activity is drastically higher in the afferent than in theefferent direction, thereby strongly supporting the view that CKCmain-ly reflects movement-induced somatosensory proprioceptive feedbackto the contralateral SM1 cortex, with an apparent latency of the orderof 50–100 ms. Cutaneous tactile input enhanced afferent coupling,even though it did not affect the CKC level (Piitulainen et al., 2013).
Motor versus proprioceptive contribution to CKC
In our previous study, we argued on the basis of similar coherencestrength and source location during active and passive movementsthat CKC mainly reflects proprioceptive feedback to the SM1 cortex(Piitulainen et al., 2013). The present study was designed to obtainquantitative support for this physiologically-based argumentation. Byusing rPDC, we found that the strength of the directional coupling be-tween hand kinematics and SM1 cortex activity is drastically higher inthe afferent than efferent direction, both during active and passivemovements. The results remained even when the possible effects ofSNR differences between Acc and MEGSM1 signals were ruled out. Thisanalysis thus strongly supports the view that CKC mainly reflectsmovement-induced proprioceptive feedback to the contralateral SM1cortex. Still, motor output might contribute to some extent to the CKC,but this contribution is clearly overshadowed by proprioceptive feed-back. This finding, together with the estimated afferent delay of50–100 ms, suggests that the CKC is closely linked to the movement-evoked fields, MEFs, that are robust evoked responses peaking about100 ms after movement onset (Kristeva et al., 1991; Neshige et al.,1988; Weinberg et al., 1990), related to muscle contraction and othersources of reafferent signals (Cheyne et al., 1997; Hoshiyama et al.,1997; Kristeva-Feige et al., 1996; Onishi et al., 2006, 2013). Further sup-port for this tight link comes from the findings that the time-courses ofMEF andmovement velocity are correlated (Kelso et al., 1998), as is thecase for the brain signals associatedwith the CKC (Bradberry et al., 2009,2010; Jerbi et al., 2007).
Still, we cannot saywhether the primarymotor, primary somatosen-sory, or both cortices are themain sources of the CKC since both of themreceive afferent proprioceptive projections (Jones et al., 1978), and sincethe MEGSM1 signal represents a mixing of activity at least from thesetwo brain areas. Our previous sourcemodeling study failed to segregatethe CKC sources to either side of the central sulcus (Piitulainen et al.,2013). Most likely, several areas of the cortical sensorimotor networkcan contribute to the sources of the CKC, as previously suggested(Bourguignon et al., 2012b). Such an assumption is indeed supportedby electrocorticographic (ECoG) recordings demonstrating that hand-movement-related evoked responses can be recorded from several sen-sorimotor regions, including the primarymotor and somatosensory cor-tices, and with lower amplitudes in the pre-motor, posterior parietaland pre-frontal cortices (Ball et al., 2009). These data also agree withfindings that MEFs may occur in both primary motor and primary so-matosensory cortices, as is evident from recordings of monkey localfield potentials and multiunit activity (Arezzo et al., 1977), as well asfrom human ECoG and EEG recordings (Neshige et al., 1988). Further-more, an event-related beamforming assessment of MEFs recordedwith MEG in humans showed that the first component peaks ~40 ms
Please cite this article as: Bourguignon, M., et al., Corticokinematic coheNeuroImage (2014), http://dx.doi.org/10.1016/j.neuroimage.2014.11.026
after movement onset in the primary somatosensory cortex, followedby a second component peaking at ~150ms in the primarymotor cortex(Cheyne et al., 2006).
Similar to the previous CKC results (Piitulainen et al., 2013), the af-ferent coupling was stronger at F1 than F0 during passive movementswhereas no statistical difference was observed during active move-ments. Although the mechanisms involved in the coupling at F1 arestill unsettled, this effect could be explained by the higher regularityof the passive movements compared with the active ones (Piitulainenet al., 2013).
ED P
RO
OF
Implication for brain–machine interfaces
Several studies have demonstrated that b5-HzMEG/EEG activity canbe used to decode movement direction (Hammon et al., 2008; Waldertet al., 2008), or to estimate hand kinematics (Bradberry et al., 2009,2010). The best decoding accuracy is typically reachedduring the courseof the movement and the associated brain signals have therefore beenviewed as promising control signals for brain–machine interfaces(Bradberry et al., 2009, 2010; Jerbi et al., 2011). However, our findingthat these movement-related low-frequency brain signals mainly per-tain to proprioceptive feedback suggests that brain–machine interfacesbased upon thesemotion-related signalsmight be impractical in the pa-tient population in need, i.e. the patients unable to move, as no propri-oceptive feedback will naturally reach the patients' brain in the absenceof movement.
Further studies should clarify whether the direction of even imag-ined movements could be decoded from low-frequency brain signals.This possibility actually seems likely since movement observation hasbeen shown to lead to coherence between MEG signals from the ob-server's SM1 cortices and the observed hand kinematics, in the absenceof movement of the observer (Bourguignon et al., 2012a). In otherwords, low-frequency brain signals from the SM1 cortex can in somecases be coherent with some kinematics parameters in the absence ofproprioceptive feedback, although the coherence is weaker than withexecuted movements (Bourguignon et al., 2012a). These contempla-tions, however, remain to be experimentally supported.
Effect of concomitant tactile stimulation
Our rPDC analysis revealed that tactile input strengthened the cou-pling between finger kinematics and SM1 activity in the afferent direc-tion, even though tactile input had no effect on the coherence level. Theenhanced afferent coupling induced by tactile input cannot beaccounted for by differences in movement frequency or regularitysince these two parameters were very similar in touch and no-touchconditions (Piitulainen et al., 2013). Of notice, a previous CKC studyfound an increase of CKC level induced by tactile input but the fast re-petitive finger movements used differed between the touch and notouch conditions (Bourguignon et al., 2012b).
In the present fast repetitive finger-tapping task, tactile input repre-sents an additional afferent flow of information to the SM1 cortex,phase-locked to finger's kinematics. Consequently, and as suggestedby our rPDC results, brain signals from the SM1 cortex might be betterpredicted by finger kinematics in the presence of tactile input, probablybecause of contribution by tactile evoked responses. But, the overallcoupling between brain signals and finger kinematics—as measuredwith CKC—was unaffected by the level of cutaneous input (Piitulainenet al., 2013). It is therefore likely that proprioceptive signals give thebasis to establish a strong coupling between brain signals and hand ki-nematics and that tactile information has limited additional contribu-tion to the overall coupling. Still, the increase in rPDC associated totactile information shows that rPDC is sensitive to subtle changes inthe neuronal information flow.
rence mainly reflects movement-induced proprioceptive feedback,

T
528
529
530
531
532
533
534
535
536
537
538
539
540
541
542
543
544
545
546
547
548
549
550
551
552
553
554
555
556
557
558
559
560
561
562
563
564
565
566
567
568
569
570
571
572
573
574
575
576
577
578Q2
579
580
581
582
583
584
585
586
587
588Q3
589
590
591
592
593
594
595
596
597598599600601602603604605606607608609610611612613614615616617618619620621622623624625626627628629630631632633634635636637638639640641642643644645646647648649650651652653654655656657658659660661662663
8 M. Bourguignon et al. / NeuroImage xxx (2014) xxx–xxx
UNCO
RREC
Delay estimation
The “apparent latency” (see Regan, 1972) between Acc andMEGSM1
signalswas 50–100ms in the four subjectswho performed the variable-pace experiment. This latency appears surprisingly long given that theafferent proprioceptive axons (type Ia fibers) are thick (diameters upto 14 μm;McComas, 1977) and thus very fast conducting (mean veloc-ities of about 75m/s for median-nerve innervated area; Macefield et al.,1989). Thus proprioceptive input from the upper limb should reach thecortex within ~20 ms, which agrees with the peak latencies of corticalresponses to median-nerve stimulation at the wrist (Chiappa, 1997)and to rapid extension of the wrist (Abbruzzese et al., 1985), withthe cortex–muscle lags after transcranial magnetic stimulation of thehand primary motor cortex (Rothwell et al., 1991), as well as with thecortex–muscle time lag estimated from corticomuscular coherence todistal hand muscles (Gross et al., 2000; Salenius et al., 1997). Hence, itis likely that the 50–100ms apparent latency mainly reflects the timingof the strongest cortical response, i.e. theMEF peaking at ~100ms, rath-er than the shortest neuronal conduction delay from periphery to thecortex.
Limitations of the study
To render the afferent and the efferent rPDC comparable we addednoise to the less noisy signal (i.e. the acceleration). Even though this ap-proach appeared satisfactory in the present study, more elegantmethods are needed in the future to allow the direct comparison of di-rectionality parameters, e.g. through properly modeling the effect ofSNR on the rPDC.
Although we here demonstrate a predominant contribution of theproprioceptive feedback to the CKC, further studies should identify thetinier role of the efferent motor commands. One possibility would beto use tourniquet ischemia to suppress the proprioceptive feedback,and assess the CKC during passivemovements (at the stagewhen activemovements are no more possible due to ischemia) and rPDC.
Finally, the apparent latency of 50–100 ms from Acc to MEGSMI wasestimated from a limited sample of 4 subjects. This latency seemed tobe fraught with substantial inter-individual variability, especially inthe active condition. Further studies should be designed to estimatemore precisely the latency in a larger population.
Conclusions
The present study demonstrates that the coupling between SM1 ac-tivity and finger kinematics is predominantly driven by proprioceptivefeedback during both active and passive movements. CKC thereforeseems to provide a reliable tool to monitor proprioceptive input to thecortex. Our rPDC analysis successfully probed the directionality of infor-mation flow, but one should be careful in the interpretation since theSNR affects the rPDC values. Finally, the apparent afferent delay estimat-ed from the phase–frequency plots of autoregressive coefficientsyielded values reflecting the timing of the strongest cortical responseassociated with proprioceptive feedback to the SM1 cortex, revealing atight link between CKC and MEFs occurring 100 ms after discretemovements.
Uncited reference
Riddle and Baker, 2005
Acknowledgments
This study has been supported by the Academy of Finland (grants#131483 and #263800 to Riitta Hari and grant #13266133 to HarriPiitulainen), by the SalWe Research Program for Mind and Body(Tekes — the Finnish Funding Agency for Innovation grant 1104/10),
Please cite this article as: Bourguignon, M., et al., Corticokinematic coheNeuroImage (2014), http://dx.doi.org/10.1016/j.neuroimage.2014.11.026
ED P
RO
OF
the European Research Council (Advanced Grant #232946 to RiittaHari), the Institut d'Encouragement de la Recherche Scientifique et del'Innovation de Bruxelles (Brussels, Belgium; “Brains Back to Brussels”grant to Veikko Jousmäki), and the Fonds de la Recherche Scientifique(FRS-FNRS, Belgium, Research Convention 3.4611.08; PostdoctorateClinical Master Specialist grant to Xavier De Tiège). We thank HelgeKainulainen and Ronny Schreiber at the Brain Research Unit (Aalto Uni-versity School of Science, Espoo, Finland) for technical support.
Conflict of interest
The authors declare no competing financial interests.
References
Abbruzzese, G., Berardelli, A., Rothwell, J.C., Day, B.L., Marsden, C.D., 1985. Cerebral poten-tials and electromyographic responses evoked by stretch of wrist muscles in man.Exp. Brain Res. 58, 544–551.
Arezzo, J., Vaughan Jr., H.G., Koss, B., 1977. Relationship of neuronal activity to grossmovement-related potentials in monkey pre- and postcentral cortex. Brain Res.132, 362–369.
Ashe, J., Georgopoulos, A.P., 1994. Movement parameters and neural activity inmotor cor-tex and area 5. Cereb. Cortex 4, 590–600.
Baccala, L.A., Sameshima, K., Ballester, G., Valle, A.C., Timo-laria, C., 1998. Studying the in-teraction between brain structures via directed coherence and Granger causality.Appl. Signal Process. 5, 40–48.
Baker, S.N., 2007. Oscillatory interactions between sensorimotor cortex and the periphery.Curr. Opin. Neurobiol. 17, 649–655.
Ball, T., Schulze-Bonhage, A., Aertsen, A., Mehring, C., 2009. Differential representation ofarmmovement direction in relation to cortical anatomy and function. J. Neural Eng. 6,016006.
Bourguignon, M., De Tiège, X., Op de Beeck, M., Pirotte, B., Van Bogaert, P., Goldman, S.,Hari, R., Jousmäki, V., 2011. Functional motor-cortex mapping using corticokinematiccoherence. NeuroImage 55, 1475–1479.
Bourguignon, M., De Tiège, X., de Beeck, M.O., Van Bogaert, P., Goldman, S., Jousmäki, V.,Hari, R., 2012a. Primary motor cortex and cerebellum are coupled with the kinemat-ics of observed hand movements. NeuroImage 66C, 500–507.
Bourguignon, M., Jousmäki, V., Op de Beeck, M., Van Bogaert, P., Goldman, S., De Tiège, X.,2012b. Neuronal network coherent with hand kinematics during fast repetitive handmovements. NeuroImage 59, 1684–1691.
Bradberry, T.J., Rong, F., Contreras-Vidal, J.L., 2009. Decoding center-out hand velocityfrom MEG signals during visuomotor adaptation. NeuroImage 47, 1691–1700.
Bradberry, T.J., Gentili, R.J., Contreras-Vidal, J.L., 2010. Reconstructing three-dimensionalhand movements from noninvasive electroencephalographic signals. J. Neurosci. 30,3432–3437.
Campfens, S.F., van der Kooij, H., Schouten, A.C., 2014. Face to phase: pitfalls in time delayestimation from coherency phase. J. Comput. Neurosci. 37 (1), 1–8.
Cheyne, D., Endo, H., Takeda, T., Weinberg, H., 1997. Sensory feedback contributes to earlymovement-evoked fields during voluntary finger movements in humans. Brain Res.771, 196–202.
Cheyne, D., Bakhtazad, L., Gaetz, W., 2006. Spatiotemporal mapping of cortical activity ac-companying voluntary movements using an event-related beamforming approach.Hum. Brain Mapp. 27, 213–229.
Chiappa, K.H., 1997. Evoked Potentials in Clinical Medicine. Lippincott Williams &Wilkins.
Conway, B.A., Halliday, D.M., Farmer, S.F., Shahani, U., Maas, P., Weir, A.I., Rosenberg, J.R.,1995. Synchronization between motor cortex and spinal motoneuronal pool duringthe performance of a maintained motor task in man. J. Physiol. 489, 917–924.
Faes, L., Pinna, G.D., Porta, A., Maestri, R., Nollo, G., 2004. Surrogate data analysis forassessing the significance of the coherence function. IEEE Trans. Biomed. Eng. 51,1156–1166.
Florin, E., Gross, J., Pfeifer, J., Fink, G.R., Timmermann, L., 2010. The effect of filtering onGranger causality based multivariate causality measures. NeuroImage 50, 577–588.
Georgopoulos, A.P., Kalaska, J.F., Caminiti, R., Massey, J.T., 1982. On the relations betweenthe direction of two-dimensional arm movements and cell discharge in primatemotor cortex. J. Neurosci. 2, 1527–1537.
Gross, J., Tass, P.A., Salenius, S., Hari, R., Freund, H.J., Schnitzler, A., 2000. Cortico-muscularsynchronization during isometric muscle contraction in humans as revealed by mag-netoencephalography. J. Physiol. 527, 623–631.
Gross, J., Kujala, J., Hämäläinen, M., Timmermann, L., Schnitzler, A., Salmelin, R., 2001. Dy-namic imaging of coherent sources: studying neural interactions in the human brain.Proc. Natl. Acad. Sci. U. S. A. 98, 694–699.
Halliday, D.M., Rosenberg, J.R., Amjad, A.M., Breeze, P., Conway, B.A., Farmer, S.F., 1995. Aframework for the analysis of mixed time series/point process data-theory and appli-cation to the study of physiological tremor, single motor unit discharges and electro-myograms. Prog. Biophys. Mol. Biol. 64, 237–278.
Hammon, P.S., Makeig, S., Poizner, H., Todorov, E., de Sa, V.R., 2008. Predicting reachingtargets from human EEG. IEEE Signal Proc. Mag. 25, 69–77.
Hari, R., Hämäläinen, M., Joutsiniemi, S.L., 1989. Neuromagnetic steady-state responses toauditory stimuli. J. Acoust. Soc. Am. 86, 1033–1039.
Hoshiyama, M., Kakigi, R., Berg, P., Koyama, S., Kitamura, Y., Shimojo, M., Watanabe, S.,Nakamura, A., 1997. Identification of motor and sensory brain activities during
rence mainly reflects movement-induced proprioceptive feedback,

T
664665666667668669670671672673674675676677678679680681682683684685686687688689690691692693694695696697698699700701702703704705706707708709710711
712713714715716717718719720721722723724725726727728729730731732733734735736737738739740741742743744745746747748749750751752753
9M. Bourguignon et al. / NeuroImage xxx (2014) xxx–xxx
C
unilateral finger movement: spatiotemporal source analysis of movement-associatedmagnetic fields. Exp. Brain Res. 115, 6–14.
Jerbi, K., Lachaux, J.P., N'Diaye, K., Pantazis, D., Leahy, R.M., Garnero, L., Baillet, S., 2007. Co-herent neural representation of hand speed in humans revealed by MEG imaging.Proc. Natl. Acad. Sci. U. S. A. 104, 7676–7681.
Jerbi, K., Vidal, J.R., Mattout, J., Maby, E., Lecaignard, F., Ossandon, T., Hamamé, C.M., Dalal,S.S., Bouet, R., Lachaux, J.P., Leahy, R.M., Baillet, S., Garnero, L., Delpuech, C., Bertrand,O., 2011. Inferring hand movement kinematics from MEG, EEG and intracranial EEG:from brain–machine interfaces to motor rehabilitation. IRBM 32, 8–18.
Jones, E.G., Coulter, J.D., Hendry, S.H., 1978. Intracortical connectivity of architectonicfields in the somatic sensory, motor and parietal cortex of monkeys. J. Comp. Neurol.181, 291–347.
Kelso, J.A., Fuchs, A., Lancaster, R., Holroyd, T., Cheyne, D., Weinberg, H., 1998. Dynamiccortical activity in the human brain reveals motor equivalence. Nature 392, 814–818.
Kristeva, R., Cheyne, D., Deecke, L., 1991. Neuromagnetic fields accompanying unilateraland bilateral voluntary movements: topography and analysis of cortical sources.Electroencephalogr. Clin. Neurophysiol. 81, 284–298.
Kristeva-Feige, R., Rossi, S., Pizzella, V., Sabato, A., Tecchio, F., Feige, B., Romani, G.L., Edrich,J., Rossini, P.M., 1996. Changes in movement-related brain activity during transientdeafferentation: a neuromagnetic study. Brain Res. 714, 201–208.
Lim, M., Kim, J.S., Kim, M., Chung, C.K., 2014. Ascending beta oscillation from fingermuscleto sensorimotor cortex contributes to enhanced steady-state isometric contraction inhumans. Clin. Neurophysiol. 125, 2036–2045.
Macefield, G., Gandevia, S.C., Burke, D., 1989. Conduction velocities of muscle and cutane-ous afferents in the upper and lower limbs of human subjects. Brain 112, 1519–1532.
McComas, A.J., 1977. Neuromuscular Function and Disorders. 5th edition. Butterworth-Heinemann.
Moran, D.W., Schwartz, A.B., 1999. Motor cortical representation of speed and directionduring reaching. J. Neurophysiol. 82, 2676–2692.
Muller, K., Schmitz, F., Schnitzler, A., Freund, H.J., Aschersleben, G., Prinz, W., 2000.Neuromagnetic correlates of sensorimotor synchronization. J. Cogn. Neurosci. 12,546–555.
Neshige, R., Luders, H., Shibasaki, H., 1988. Recording of movement-related potentialsfrom scalp and cortex in man. Brain 111, 719–736.
Oldfield, R.C., 1971. The assessment and analysis of handedness: the Edinburgh inventory.Neuropsychologia 9, 97–113.
Onishi, H., Soma, T., Kameyama, S., Oishi, M., Fuijmoto, A., Oyama, M., Furusawa, A.A.,Kurokawa, Y., 2006. Cortical neuromagnetic activation accompanying two types ofvoluntary finger extension. Brain Res. 1123, 112–118.
Onishi, H., Sugawara, K., Yamashiro, K., Sato, D., Suzuki, M., Kirimoto, H., Tamaki, H.,Murakami, H., Kameyama, S., 2013. Neuromagnetic activation following active andpassive finger movements. Brain Behav. 3, 178–192.
Piitulainen, H., Bourguignon,M., De Tiège, X., Hari, R., Jousmäki, V., 2013. Corticokinematiccoherence during active and passive finger movements. Neuroscience 238, 361–370.
Pohja, M., Salenius, S., 2003. Modulation of cortex–muscle oscillatory interaction byischaemia-induced deafferentation. Neuroreport 14, 321–324.
Pollok, B., Muller, K., Aschersleben, G., Schmitz, F., Schnitzler, A., Prinz, W., 2003. Corticalactivations associatedwith auditorily paced finger tapping. Neuroreport 14, 247–250.
UNCO
RRE
Please cite this article as: Bourguignon, M., et al., Corticokinematic coheNeuroImage (2014), http://dx.doi.org/10.1016/j.neuroimage.2014.11.026
ED P
RO
OF
Pollok, B., Muller, K., Aschersleben, G., Schnitzler, A., Prinz, W., 2004. The role of the pri-mary somatosensory cortex in an auditorily paced finger tapping task. Exp. BrainRes. 156, 111–117.
Regan, D., 1972. Evoked potentials to changes in the chromatic contrast and luminancecontrast of checkboard stimulus patterns. Adv. Exp. Med. Biol. 24, 171–187.
Reina, G.A., Moran, D.W., Schwartz, A.B., 2001. On the relationship between joint angularvelocity and motor cortical discharge during reaching. J. Neurophysiol. 85,2576–2589.
Riddle, C.N., Baker, S.N., 2005. Manipulation of peripheral neural feedback loops altershuman corticomuscular coherence. J. Physiol. 566, 625–639.
Rothwell, J.C., Thompson, P.D., Day, B.L., Boyd, S., Marsden, C.D., 1991. Stimulation of thehuman motor cortex through the scalp. Exp. Physiol. 76, 159–200.
Salenius, S., Portin, K., Kajola, M., Salmelin, R., Hari, R., 1997. Cortical control of humanmo-toneuron firing during isometric contraction. J. Neurophysiol. 77, 3401–3405.
Sameshima, K., Baccala, L.A., 1999. Using partial directed coherence to describe neuronalensemble interactions. J. Neurosci. Methods 94, 93–103.
Schelter, B., Winterhalder, M., Eichler, M., Peifer, M., Hellwig, B., Guschlbauer, B., Lucking,C.H., Dahlhaus, R., Timmer, J., 2006. Testing for directed influences among neural sig-nals using partial directed coherence. J. Neurosci. Methods 152, 210–219.
Schelter, B., Timmer, J., Eichler, M., 2009. Assessing the strength of directed influencesamong neural signals using renormalized partial directed coherence. J. Neurosci.Methods 179, 121–130.
Schneider, T., Neumaier, A., 2001. Algorithm 808: ARfit—a Matlab package for the estima-tion of parameters and eigenmodes of multivariate autoregressive models. ACMTrans. Math. Softw. 27, 58–65.
Sommerlade, L., Eichler, M., Jachan, M., Henschel, K., Timmer, J., Schelter, B., 2009. Esti-mating causal dependencies in networks of nonlinear stochastic dynamical systems.Phys. Rev. E Stat. Nonlinear Soft Matter Phys. 80, 051128.
Taulu, S., Simola, J., Kajola, M., 2005. Applications of the signal space separation method.IEEE Trans. Signal Process. 53, 3359–3372.
Theiler, J., Eubank, S., Longtin, A., Galdrikian, B., Farmer, J.D., 1992. Testing for nonlinearityin time series: the method of surrogate data. Phys. D 58, 77–94.
Tsujimoto, T., Mima, T., Shimazu, H., Isomura, Y., 2009. Directional organization of senso-rimotor oscillatory activity related to the electromyogram in the monkey. Clin.Neurophysiol. 120, 1168–1173.
Waldert, S., Preissl, H., Demandt, E., Braun, C., Birbaumer, N., Aertsen, A., Mehring, C.,2008. Hand movement direction decoded from MEG and EEG. J. Neurosci. 28,1000–1008.
Weinberg, H., Cheyne, D., Crisp, D., 1990. Electroencephalographic and magneto-encephalographic studies of motor function. Adv. Neurol. 54, 193–205.
Witham, C.L., Wang, M., Baker, S.N., 2010. Corticomuscular coherence between motorcortex, somatosensory areas and forearm muscles in the monkey. Front. Syst.Neurosci. 4.
Witham, C.L., Riddle, C.N., Baker, M.R., Baker, S.N., 2011. Contributions of descending andascending pathways to corticomuscular coherence in humans. J. Physiol. 589,3789–3800.
rence mainly reflects movement-induced proprioceptive feedback,
Related Documents