Mount Werner Water and Sanitation District City of Steamboat Springs CORROSION CONTROL STUDY FINAL | December 2020

Welcome message from author
This document is posted to help you gain knowledge. Please leave a comment to let me know what you think about it! Share it to your friends and learn new things together.
Transcript
Mount Werner Water and Sanitation District City of Steamboat Springs CORROSION CONTROL STUDY
FINAL | December 2020


Mount Werner Water and Sanitation District City of Steamboat Springs
CORROSION CONTROL STUDY
FINAL |
Digitally signed by Jason M. AssoulineContact Info: Carollo Engineers, Inc.
Date: 2020.12.29 13:59:37-07'00'


CORROSION CONTROL STUDAY | MOUNT WERNER WATER AND SANITATION DISTRICT/CITY OF STEAMBOAT SPRINGS
FINAL | DECEMBER 2020 | i
pw://Carollo/Documents/Client/CO/Mount Werner WSD/11272B00/Deliverables/RPT02/Rpt01 Corrosion Control
Contents Section 1 Introduction 1
Section 2 Literature Review 1
2.1 Corrosion Control Studies 1
2.2 Lead and Copper Rule 3
2.3 Future Corrosion Control Regulations 4
Section 3 Water System Information 5
3.1 Treatment Plant Overview 5
3.1.1 Fish Creek Filtration Plant 5
3.1.2 Yampa River Well Filtration Plant 6
3.2 Distribution System Information 9
Section 4 Water Quality Analysis 10
4.1 FCFP Finished Water Quality 10
4.2 YRWFP Finished Water Quality 12
4.3 Distribution System Water Quality 13
4.4 Corrosion Index Calculations 18
4.4.1 Langelier Saturation Index 21
4.4.2 Larson Ratio 22
4.4.3 Chloride to Sulfate Mass Ratio 23
4.4.4 Calcium Carbonate Precipitation Potential 24
4.4.5 Buffer Intensity 25
4.4.6 Other Indices 26
4.4.7 Summary of Corrosion Index Calculations 31
4.5 Lead and Copper Rule Monitoring Data 32
4.5.1 District LCR Monitoring Data 32
4.5.2 City of Steamboat Springs LCR Monitoring Data 33
Section 5 Pipe Loop Testing 34
5.1 Overview 34
5.1.1 Addition of Corrosion Inhibitor 35
5.1.2 Chemical Stabilization 35

MOUNT WERNER WATER AND SANITATION DISTRICT/CITY OF STEAMBOAT SPRINGS | CORROSION CONTROL STUDY
ii | DECEMBER 2020 | FINAL
5.2 Methods 35
5.2.1 Pipe Harvesting and Pipe Loop Construction 35
5.2.2 Corrosion Control Alternatives 40
5.2.3 Testing Plan and Sampling Protocol 42
5.3 Pipe Loop Testing Results 43
5.3.1 pH Stability and Alkalinity 43
5.3.2 Lead and Copper Sampling 45
5.3.3 Corrosion Indices 52
Section 6 Recommendations 54
6.1 pH Stability and Buffer Intensity 54
6.2 Corrosion Control Treatment 56
6.3 Optimal Corrosion Control Treatment Recommendation 59
Section 7 References 61
Appendices Appendix A Representative Corrosion Control Indices Calculations
Tables Table 1 LCR Sampling Site Tier Structure for Community Water Systems 3
Table 2 LCR Sampling Requirements 4
Table 3 Mount Werner Water and Sanitation District Distribution System Information 9
Table 4 City of Steamboat Springs Distribution System Information 10
Table 5 FCFP Finished Water Quality Data 11
Table 6 YRWFP Finished Water Quality Data 12
Table 7 Alpenglow Storage Tank Water Quality Data 14
Table 8 Burgess Creek Storage Tank Water Quality Data 15
Table 9 Booster I Storage Tank Water Quality Data 16
Table 10 Booster III Storage Tank Water Quality Data 17
Table 11 District Equipment Shop Tap Water Quality Data 18
Table 12 Additional Distribution Water Quality Samples 18
Table 13 Corrosion Indices Summary 20
Table 14 DIC in Finished Water and Distribution System 21
CORROSION CONTROL STUDAY | MOUNT WERNER WATER AND SANITATION DISTRICT/CITY OF STEAMBOAT SPRINGS
FINAL | DECEMBER 2020 | iii
Table 15 Pipe Loop Panel Summary 40
Table 16 Pipe Loop Testing 42
Table 17 Corrosion Indices Summary 53
Table 18 Pipe Loop Panel Average DIC Concentrations 55
Table 19 FCFP and YRWFP Caustic Soda and Carbon Dioxide Doses 60
Table 20 FCFP and YRWFP Chemical Systems Design Criteria Summary 61
Figures Figure 1 FCFP Treatment Process Overview 7
Figure 2 YRWFP Treatment Process Overview 8
Figure 3 FCFP Finished Water Quality Data 11
Figure 4 YRWFP Finished Water Quality Data 12
Figure 5 Alpenglow Storage Tank Water Quality Data 13
Figure 6 Burgess Creek Storage Tank Water Quality Data 14
Figure 7 Booster I Storage Tank Water Quality Data 15
Figure 8 Booster III Storage Tank Water Quality Data 16
Figure 9 MWW Equipment Shop Tap Water Quality Data 17
Figure 10 Langelier Saturation Index 22
Figure 11 Larson Ratio 23
Figure 12 Chloride-to-Sulfate Mass Ratio 24
Figure 13 Calcium Carbonate Precipitation Potential 25
Figure 14 Buffer Capacity 26
Figure 15 Ryznar Stability Index 27
Figure 16 Aggressive Index 28
Figure 17 Driving Force Index 29
Figure 18 Momentary Excess 30
Figure 19 Singley Index 31
Figure 20 District LCR Monitoring Results (2006-2020 Round 1) 33
Figure 21 City of Steamboat Springs LCR Monitoring Results (2006-2020 Round 1) 34
Figure 22 Pipe Loop Schematic 36
Figure 23 Harvested Pipe Segment Interior Scaling 37
Figure 24 Pipe Loop Panel Area 38
Figure 25 Pipe Loop Panel (1 of 4 used for testing for this project) 39
MOUNT WERNER WATER AND SANITATION DISTRICT/CITY OF STEAMBOAT SPRINGS | CORROSION CONTROL STUDY
iv | DECEMBER 2020 | FINAL
Figure 26 Calcium Carbonate Contactor 41
Figure 27 Panel 2 Alkalinity versus Final pH (Caustic Soda and Carbon Dioxide) 44
Figure 28 Panel 3 Alkalinity versus Final pH (Calcium Carbonate Contactor) 44
Figure 29 Panel 4 Alkalinity versus Final pH (Orthophosphate Addition with Caustic Soda pH Trim) 45
Figure 30 New Pipe Total Copper Sampling Results 46
Figure 31 COSS Pipe Total Copper Sampling Results 46
Figure 32 MWW Pipe Total Copper Sampling Results 47
Figure 33 New Pipe Dissolved Copper Sampling Results 48
Figure 34 COSS Pipe Dissolved Copper Sampling Results 48
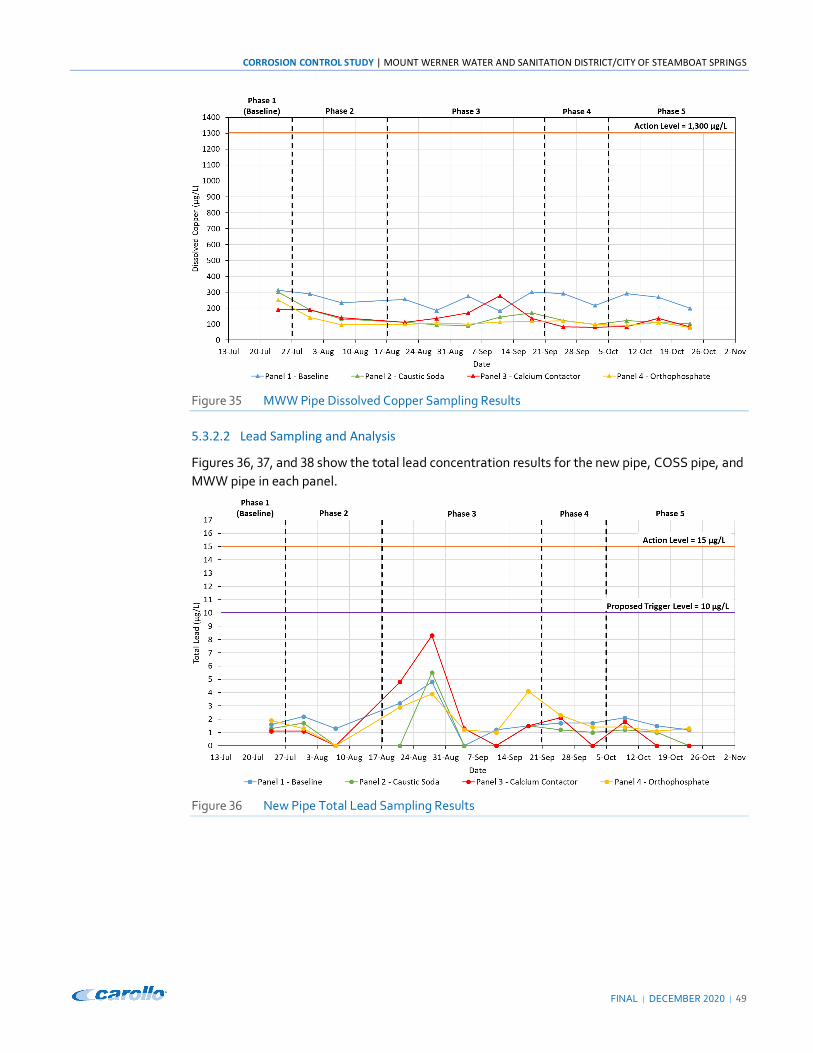
Figure 35 MWW Pipe Dissolved Copper Sampling Results 49
Figure 36 New Pipe Total Lead Sampling Results 49
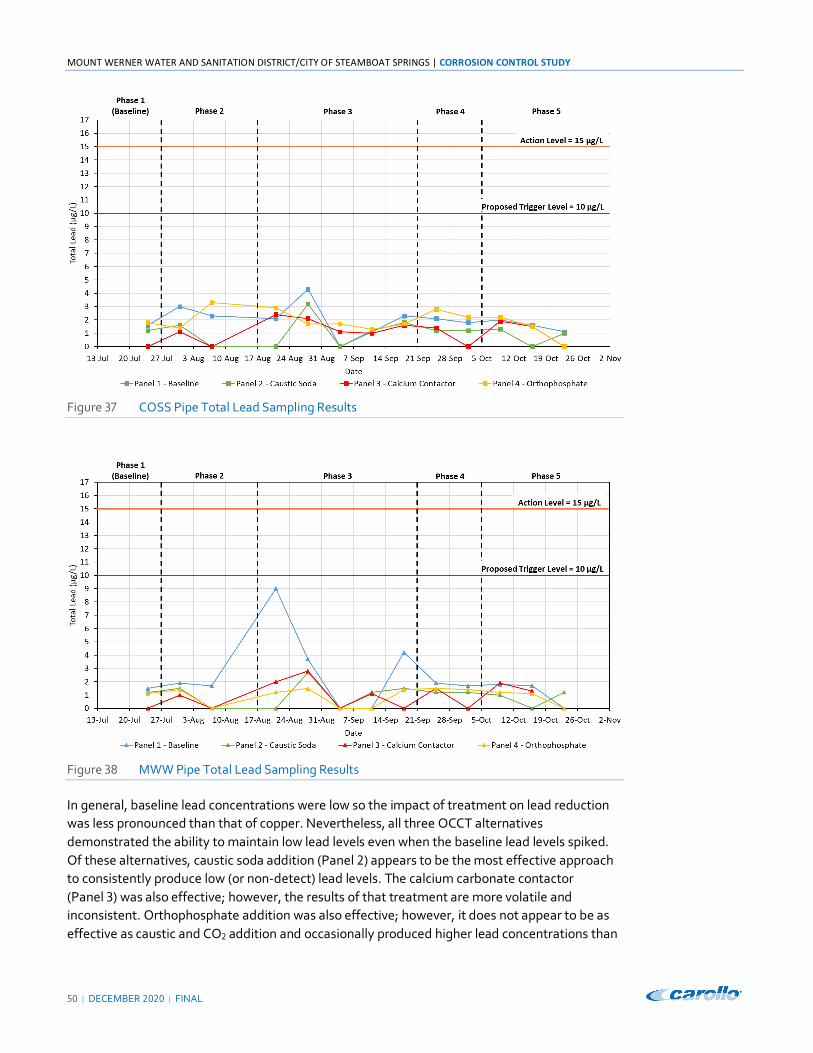
Figure 37 COSS Pipe Total Lead Sampling Results 50
Figure 38 MWW Pipe Total Lead Sampling Results 50
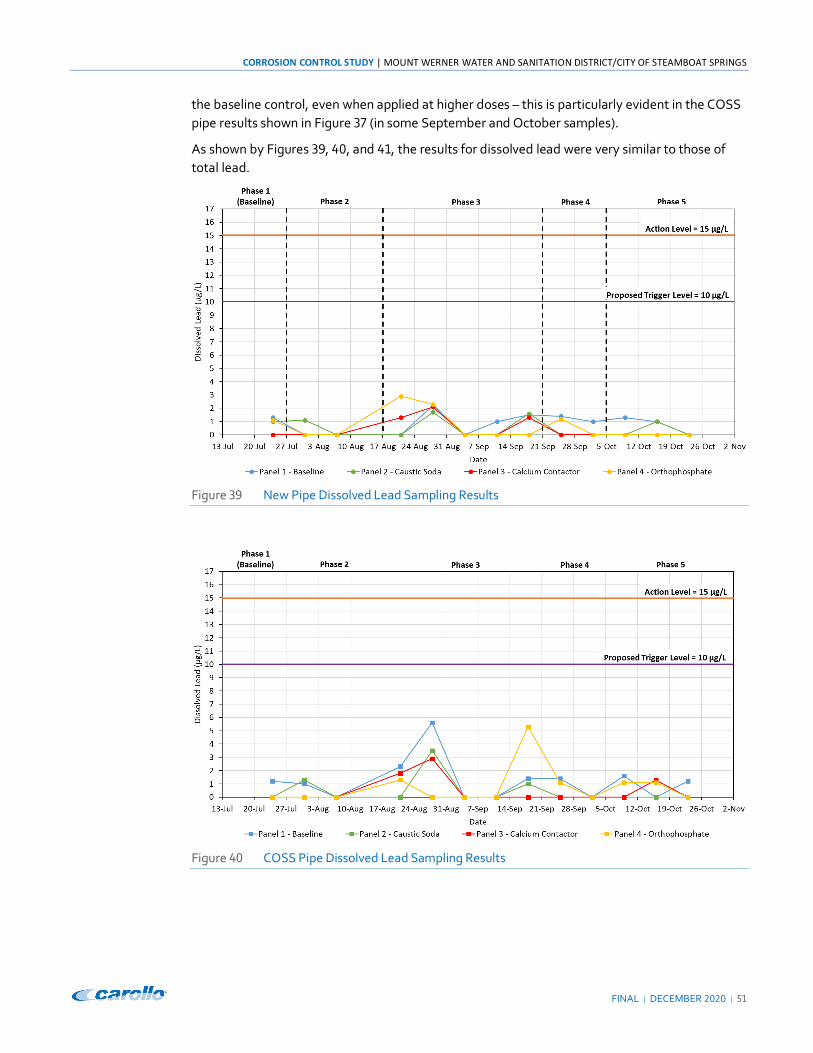
Figure 39 New Pipe Dissolved Lead Sampling Results 51
Figure 40 COSS Pipe Dissolved Lead Sampling Results 51
Figure 41 MWW Pipe Dissolved Lead Sampling Results 52
Figure 42 BI as Function of pH at Different DIC Values 55
Figure 43 USEPA Flowchart 1a: Selecting Treatment for Lead Only or Lead and Copper with pH <7.2 57
CORROSION CONTROL STUDAY | MOUNT WERNER WATER AND SANITATION DISTRICT/CITY OF STEAMBOAT SPRINGS
FINAL | DECEMBER 2020 | v
Abbreviations AI Aggressive Index
alum aluminum sulfate, Al2(SO4)3
BI buffer intensity
CaCO₃ calcium carbonate
Carollo Carollo Engineers, Inc.
CCPP calcium carbonate precipitation potential
CDPHE Colorado Department of Public Health and Environment
City City of Steamboat Springs
Cl2 free chlorine
CO2 carbon dioxide
COSS City of Steamboat Springs
CSMR chloride-to-sulfate mass ratio
CT contact time
DBP disinfection byproduct
DFI Driving Force Index
DIC dissolved inorganic carbon
District Mount Werner Water and Sanitation District
EBCT empty bed contact time
FCFP Fish Creek Filter Plant
gal/day gallons per day
HAA haloacetic acid
lb/day pounds per day
LCR Lead and Copper Rule
LCRR Lead and Copper Rule Revisions
LCRWG Lead and Copper Rule Working Group
LR Larson Ratio
LSI Langelier Saturation Index
LSL lead service line
ME momentary excess
µg/L micrograms per liter
MG million gallons
mg/L milligrams per liter
mgd million gallons per day
MWW Mount Werner Water
Na2CO3 soda ash
NaOH caustic soda

MOUNT WERNER WATER AND SANITATION DISTRICT/CITY OF STEAMBOAT SPRINGS | CORROSION CONTROL STUDY
vi | DECEMBER 2020 | FINAL
NDWAC National Drinking Water Advisory Council
NOM natural organic material
OCCT optimized corrosion control treatment
PbO2 particulate lead
PWS public water system
PWSID public water system identification number
RSI Ryznar Stability Index
SI Singley Index
Study Corrosion Control Study
S.U. Standard Unit
TDS total dissolved solids
THM trihalomethane
USEPA United States Environmental Protection Agency
WRF Water Research Foundation
YRWFP Yampa River Well Filtration Plant
ZOP zinc orthophosphate

CORROSION CONTROL STUDY | MOUNT WERNER WATER AND SANITATION DISTRICT/CITY OF STEAMBOAT SPRINGS
FINAL | DECEMBER 2020 | 1
Section 1
INTRODUCTION
Mount Werner Water and Sanitation District (District) and the City of Steamboat Springs (City), retained Carollo Engineers, Inc. (Carollo) to conduct a Corrosion Control Study (Study) to assess the distribution system corrosion. Samples from the Fish Creek Filter Plant (FCFP), the Yampa River Well Filtration Plant (YRWFP) and the distribution system were collected by the District, and the data were used to calculate various corrosion indices. Pipe loop testing was also conducted at the FCFP to further evaluate optimized corrosion control treatment (OCCT) for the system. Recommendations for OCCT are presented in this report based on the results of these analyses.
This Corrosion Control Study Report builds upon the preliminary corrosion control Study that Carollo conducted for the District and the City in 2019. The initial evaluation was focused on a smaller data set available for the FCFP only; this document builds upon that effort and incorporates additional water quality data for the YRWFP and the District and City's distribution systems. The goal of this project is to complete a comprehensive system study in compliance with United States Environmental Protection Agency (USEPA) and Colorado Department of Public Health and Environment (CDPHE) requirements which includes:
1. Evaluation of finished water and distribution system water quality, including calculation of corrosion indices to assess compatibility with distribution system and premise plumbing pipe materials.
2. Evaluation of existing distribution system infrastructure and lead and copper results from District and City sampling.
3. Evaluation of optimized corrosion control treatment alternatives. 4. Development of recommended corrosion control strategies at each water treatment
plant (as appropriate) and associated preliminary capital and operation and maintenance costs.
5. Development of a Corrosion Control Study Report, to document the analysis and OCCT recommendations for a system-wide corrosion control strategy for the District and the City, as is required by CDPHE under the USEPA Lead and Copper Rule (LCR).
Section 2
LITERATURE REVIEW
2.1 Corrosion Control Studies
The Water Research Foundation (WRF) published the report titled, "Lead and Copper Corrosion: An Overview of WRF Research," in October 2016. The report provides a summary of completed
MOUNT WERNER WATER AND SANITATION DISTRICT/CITY OF STEAMBOAT SPRINGS | CORROSION CONTROL STUDY
2 | DECEMBER 2020 | FINAL
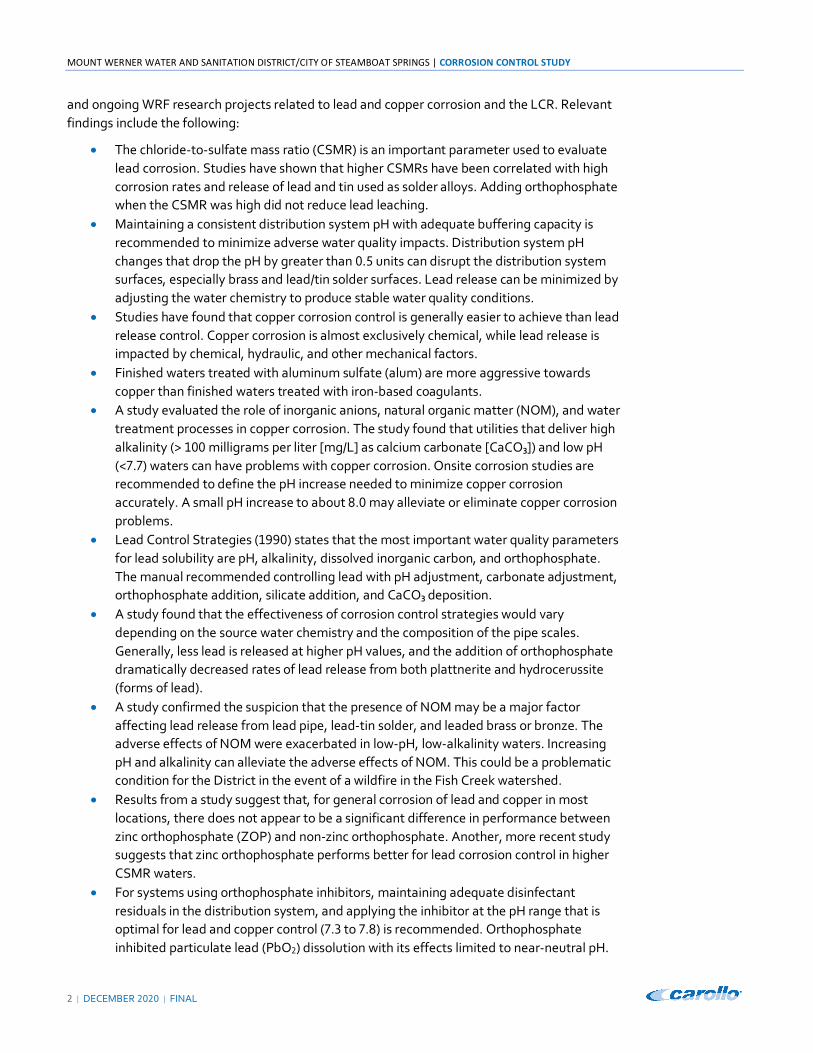
and ongoing WRF research projects related to lead and copper corrosion and the LCR. Relevant findings include the following:
• The chloride-to-sulfate mass ratio (CSMR) is an important parameter used to evaluate lead corrosion. Studies have shown that higher CSMRs have been correlated with high corrosion rates and release of lead and tin used as solder alloys. Adding orthophosphate when the CSMR was high did not reduce lead leaching.
• Maintaining a consistent distribution system pH with adequate buffering capacity is recommended to minimize adverse water quality impacts. Distribution system pH changes that drop the pH by greater than 0.5 units can disrupt the distribution system surfaces, especially brass and lead/tin solder surfaces. Lead release can be minimized by adjusting the water chemistry to produce stable water quality conditions.
• Studies have found that copper corrosion control is generally easier to achieve than lead release control. Copper corrosion is almost exclusively chemical, while lead release is impacted by chemical, hydraulic, and other mechanical factors.
• Finished waters treated with aluminum sulfate (alum) are more aggressive towards copper than finished waters treated with iron-based coagulants.
• A study evaluated the role of inorganic anions, natural organic matter (NOM), and water treatment processes in copper corrosion. The study found that utilities that deliver high alkalinity (> 100 milligrams per liter [mg/L] as calcium carbonate [CaCO₃]) and low pH (<7.7) waters can have problems with copper corrosion. Onsite corrosion studies are recommended to define the pH increase needed to minimize copper corrosion accurately. A small pH increase to about 8.0 may alleviate or eliminate copper corrosion problems.
• Lead Control Strategies (1990) states that the most important water quality parameters for lead solubility are pH, alkalinity, dissolved inorganic carbon, and orthophosphate. The manual recommended controlling lead with pH adjustment, carbonate adjustment, orthophosphate addition, silicate addition, and CaCO₃ deposition.
• A study found that the effectiveness of corrosion control strategies would vary depending on the source water chemistry and the composition of the pipe scales. Generally, less lead is released at higher pH values, and the addition of orthophosphate dramatically decreased rates of lead release from both plattnerite and hydrocerussite (forms of lead).
• A study confirmed the suspicion that the presence of NOM may be a major factor affecting lead release from lead pipe, lead-tin solder, and leaded brass or bronze. The adverse effects of NOM were exacerbated in low-pH, low-alkalinity waters. Increasing pH and alkalinity can alleviate the adverse effects of NOM. This could be a problematic condition for the District in the event of a wildfire in the Fish Creek watershed.
• Results from a study suggest that, for general corrosion of lead and copper in most locations, there does not appear to be a significant difference in performance between zinc orthophosphate (ZOP) and non-zinc orthophosphate. Another, more recent study suggests that zinc orthophosphate performs better for lead corrosion control in higher CSMR waters.
• For systems using orthophosphate inhibitors, maintaining adequate disinfectant residuals in the distribution system, and applying the inhibitor at the pH range that is optimal for lead and copper control (7.3 to 7.8) is recommended. Orthophosphate inhibited particulate lead (PbO2) dissolution with its effects limited to near-neutral pH.
CORROSION CONTROL STUDY | MOUNT WERNER WATER AND SANITATION DISTRICT/CITY OF STEAMBOAT SPRINGS
FINAL | DECEMBER 2020 | 3
• Orthophosphate (with few exceptions) had benefits for limiting lead and copper release. Hexametaphosphate produced higher levels of lead than systems without an inhibitor.
• One of the most important lessons learned from the WRF research conducted on lead and copper corrosion is that every utility's lead and copper corrosion challenges are unique to that utility's source water quality, treatment processes, distribution system configuration, and materials. There is no standard recipe for lead and copper corrosion control that every utility can apply for corrosion control strategies or distribution system management.
2.2 Lead and Copper Rule
The LCR was developed in 1991 to limit lead and copper exposure and to reduce potential health risks to drinking water customers. The main source of lead and copper in drinking water systems is from corrosion of older fixtures or solders connecting pipes.
The LCR established action levels for lead and copper as 0.015 mg/L and 1.3 mg/L, respectively. Exceeding the action level is not considered a violation. However, if more than 10 percent of sampled taps exceed the action level, the utility must comply with requirements for additional water quality monitoring, implementing optimized corrosion control treatment, public education, and lead service line (LSL) replacement.
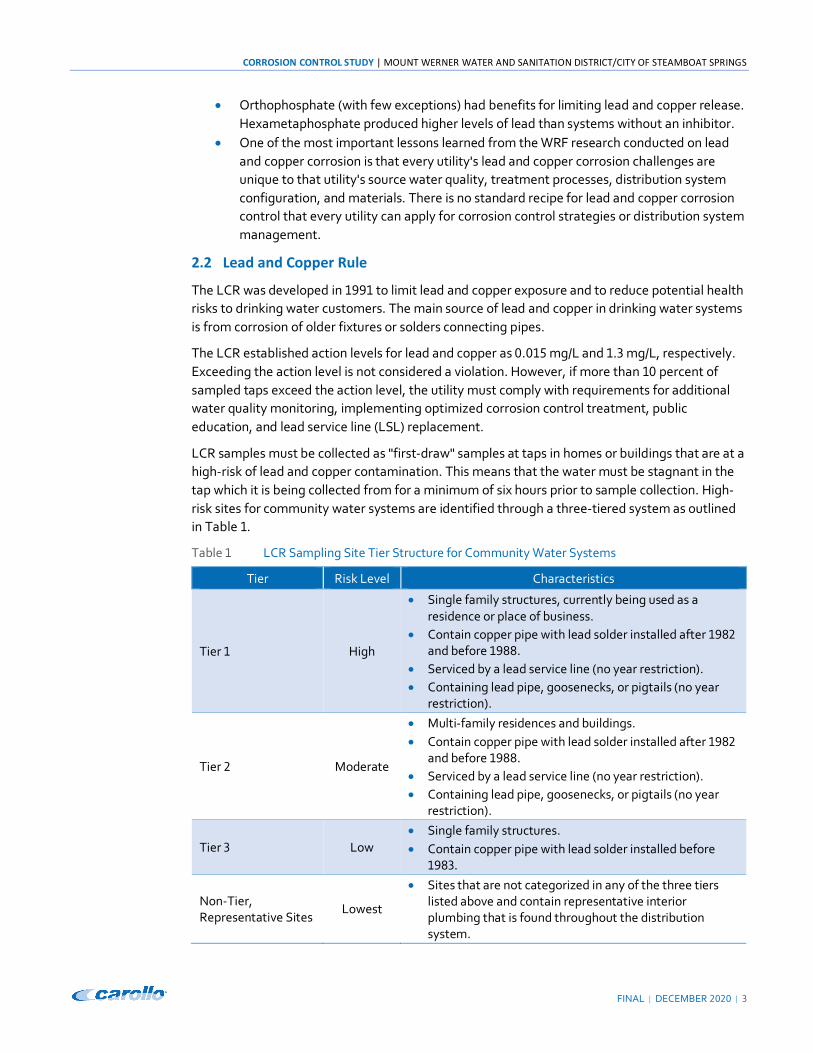
LCR samples must be collected as "first-draw" samples at taps in homes or buildings that are at a high-risk of lead and copper contamination. This means that the water must be stagnant in the tap which it is being collected from for a minimum of six hours prior to sample collection. High-risk sites for community water systems are identified through a three-tiered system as outlined in Table 1.
Table 1 LCR Sampling Site Tier Structure for Community Water Systems
Tier Risk Level Characteristics
Tier 1 High
• Single family structures, currently being used as a residence or place of business.
• Contain copper pipe with lead solder installed after 1982 and before 1988.
• Serviced by a lead service line (no year restriction). • Containing lead pipe, goosenecks, or pigtails (no year
restriction).
Tier 2 Moderate
• Multi-family residences and buildings. • Contain copper pipe with lead solder installed after 1982
and before 1988. • Serviced by a lead service line (no year restriction). • Containing lead pipe, goosenecks, or pigtails (no year
restriction).
Tier 3 Low • Single family structures. • Contain copper pipe with lead solder installed before
1983.
Non-Tier, Representative Sites
Lowest
• Sites that are not categorized in any of the three tiers listed above and contain representative interior plumbing that is found throughout the distribution system.
MOUNT WERNER WATER AND SANITATION DISTRICT/CITY OF STEAMBOAT SPRINGS | CORROSION CONTROL STUDY
4 | DECEMBER 2020 | FINAL
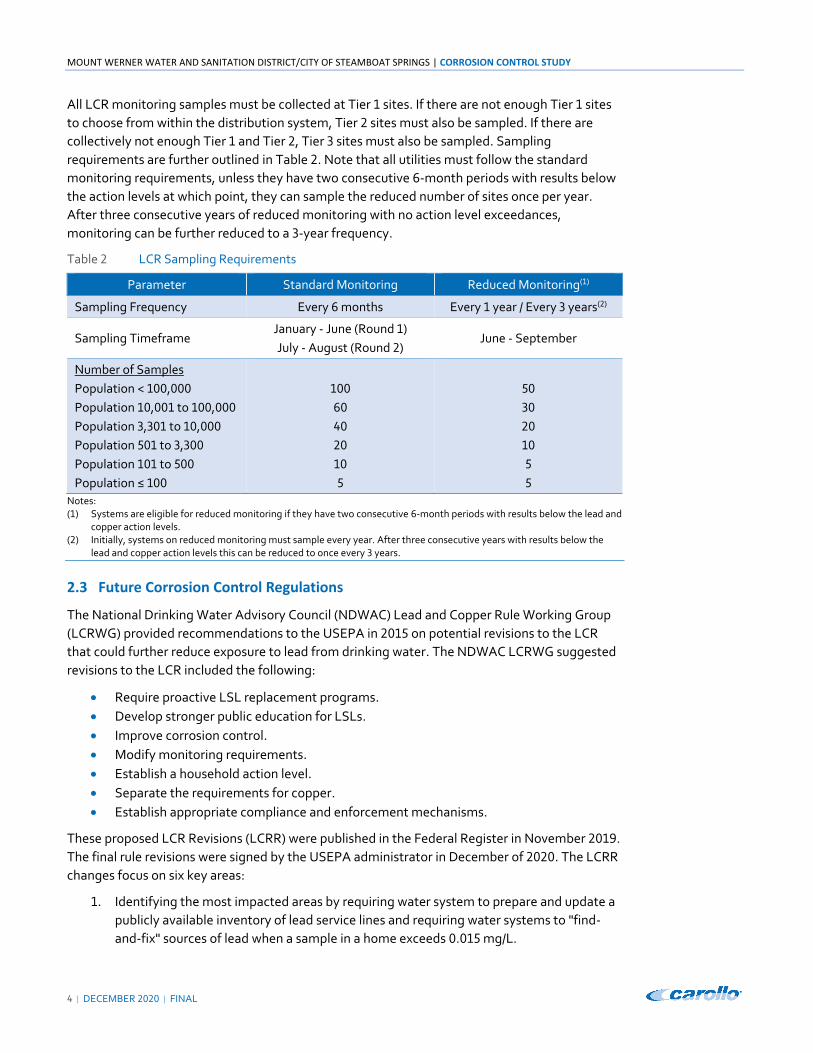
All LCR monitoring samples must be collected at Tier 1 sites. If there are not enough Tier 1 sites
to choose from within the distribution system, Tier 2 sites must also be sampled. If there are
collectively not enough Tier 1 and Tier 2, Tier 3 sites must also be sampled. Sampling
requirements are further outlined in Table 2. Note that all utilities must follow the standard
monitoring requirements, unless they have two consecutive 6-month periods with results below
the action levels at which point, they can sample the reduced number of sites once per year.
After three consecutive years of reduced monitoring with no action level exceedances,
monitoring can be further reduced to a 3-year frequency.
Table 2 LCR Sampling Requirements
Parameter Standard Monitoring Reduced Monitoring(1)
Sampling Frequency Every 6 months Every 1 year / Every 3 years(2)
Sampling Timeframe January - June (Round 1)
July - August (Round 2) June - September
Number of Samples
Population < 100,000
Population 10,001 to 100,000
Population 3,301 to 10,000
Population 501 to 3,300
Population 101 to 500
Population ≤ 100
100
60
40
20
10
5
50
30
20
10
5
5
Notes: (1) Systems are eligible for reduced monitoring if they have two consecutive 6-month periods with results below the lead and
copper action levels. (2) Initially, systems on reduced monitoring must sample every year. After three consecutive years with results below the
lead and copper action levels this can be reduced to once every 3 years.
2.3 Future Corrosion Control Regulations
The National Drinking Water Advisory Council (NDWAC) Lead and Copper Rule Working Group
(LCRWG) provided recommendations to the USEPA in 2015 on potential revisions to the LCR
that could further reduce exposure to lead from drinking water. The NDWAC LCRWG suggested
revisions to the LCR included the following:
• Require proactive LSL replacement programs.
• Develop stronger public education for LSLs.
• Improve corrosion control.
• Modify monitoring requirements.
• Establish a household action level.
• Separate the requirements for copper.
• Establish appropriate compliance and enforcement mechanisms.
These proposed LCR Revisions (LCRR) were published in the Federal Register in November 2019.
The final rule revisions were signed by the USEPA administrator in December of 2020. The LCRR
changes focus on six key areas:
1. Identifying the most impacted areas by requiring water system to prepare and update a
publicly available inventory of lead service lines and requiring water systems to "find-
and-fix" sources of lead when a sample in a home exceeds 0.015 mg/L.
CORROSION CONTROL STUDY | MOUNT WERNER WATER AND SANITATION DISTRICT/CITY OF STEAMBOAT SPRINGS
FINAL | DECEMBER 2020 | 5
2. Strengthening treatment requirements by requiring corrosion control treatment based on tap sampling results and establishing a new lead trigger level of 0.010 mg/L.
3. Replacing lead service lines by requiring water systems to replace the water system-owned portion of an LSL when a customer chooses to replace their portion of the line. Additionally, depending on their level above the trigger level, systems would be required to take LSL replacement actions.
4. Increasing drinking water sampling reliability by requiring water systems to follow new, improved sampling procedures and adjust sampling sites to better target locations with higher lead levels.
5. Improving risk communication to customers by requiring water systems to notify customers within 24 hours if a sample collected in their home is above 0.015 mg/L. Water systems will also be required to conduct regular outreach to homeowners with LSLs. Better protecting children in schools and child-care facilities by requiring water systems to take drinking water samples from the schools and child-care facilities served by the system.
Note that under the new "trigger level" requirement of these revisions, if the 0.010 mg/L threshold is exceeded for the 90th percentile lead concentrations, utilities which use corrosion control techniques would be required to re-optimize their existing treatment. Utilities which do not have corrosion control treatment would be required to conduct corrosion control studies.
Section 3
WATER SYSTEM INFORMATION
3.1 Treatment Plant Overview
Potable water for both the District and the City is supplied by two water treatment plants which are jointly owned by the two entities under a partnership structure wherein they both own a portion of the treatment infrastructure and the District is responsible for the operation and maintenance of both facilities. Brief overviews of the two treatment plants are presented below. Details on their source water quality and finished water quality are presented in Section 4.
3.1.1 Fish Creek Filtration Plant
The FCFP is a conventional filtration plant with a treatment capacity of 7.5 million gallons per day (mgd). Raw water from nearby Fish Creek is first sent to a pre-sedimentation basin to remove heavier suspended material. From there, flow is sent to a Parshall flume for flow measurement and a stilling well where alum and cationic polymer are added. Currently alum is dosed based on a streaming current setpoint - typical alum doses range from approximately 9 to 20 mg/L as alum (Al2(SO4)3), depending on raw water quality. Cationic polymer doses usually range from 1 to 2 mg/L as product but are occasionally higher.
Downstream of the stilling well there are a series of 10 filter bays. Each filter bay consists of a flocculation tank, a sedimentation tank, and a filter tank, which operate in series as 10 independent trains. Non-ionic polymer is fed at the inlet to each filter; the typical dose is around 0.06 mg/L.

MOUNT WERNER WATER AND SANITATION DISTRICT/CITY OF STEAMBOAT SPRINGS | CORROSION CONTROL STUDY
6 | DECEMBER 2020 | FINAL
Filter effluent is collected in the 70,000-gallon clearwell located below the filter gallery. Sodium hypochlorite, soda ash, and fluoride are added in the clearwell and this tank also provides backwash supply for the filters. Water from the clearwell is sent to a 2-million-gallon (MG) tank onsite. Finished water from the 2-MG tank enters the distribution system directly by gravity or is pumped to the nearby Skyline Tank.
Figure 1 illustrates the FCFP treatment process.
The finished water pH from the FCFP ranges between 6.8 to 7.4 and alkalinity ranges from approximately 9 mg/L as CaCO₃ in the winter up to 26 mg/L as CaCO₃ during spring runoff.
3.1.2 Yampa River Well Filtration Plant
The YRWFP serves as a secondary treatment plant for the District and City. The YRWFP has a treatment capacity of 3.5 mgd; however, the current alluvial well supply is limited to 1.8 mgd. Additional well capacity will be added to the facility in the next 1 to 2 years to supply the full treatment capacity of the YRWFP.
Raw water is pumped to the facility from a series of wells and infiltration galleries along the banks of the Yampa River, south of the facility. The YRWFP treatment process was upgraded in 2018 to include greensand filtration with UV and free chlorine disinfection. Fluoride is added at the chlorine contact basins outlet weir into the clearwell from which water is pumped to the distribution system.
Figure 2 illustrates the YRWFP treatment process.
YRWFP finished water has a more consistent finished water pH than the FCFP, with typical values ranging from 7.1 to 7.3 and alkalinity ranges from approximately 40 mg/L as CaCO₃ up to 130 mg/L as CaCO₃.

CORROSION CONTROL STUDY | MOUNT WERNER WATER AND SANITATION DISTRICT/CITY OF STEAMBOAT SPRINGS
FINAL | DECEMBER 2020 | 7
Figure 1 FCFP Treatment Process Overview

MOUNT WERNER WATER AND SANITATION DISTRICT/CITY OF STEAMBOAT SPRINGS | CORROSION CONTROL STUDY
8 | DECEMBER 2020 | FINAL
Figure 2 YRWFP Treatment Process Overview
CORROSION CONTROL STUDY | MOUNT WERNER WATER AND SANITATION DISTRICT/CITY OF STEAMBOAT SPRINGS
FINAL | DECEMBER 2020 | 9
3.2 Distribution System Information
Finished water from the FCFP and YRWFP supplies both the District and City distribution systems which are independently owned and operated by the two entities. For this reason, CDPHE considers them as two separate public water systems (PWS), both of which must meet the requirements of the Colorado Primary Drinking Water Regulations (which are consistent with the USEPA's National Primary Drinking Water Regulations). The District's distribution system PWS identification number (PWSID) is CO0154524 and the City's distribution system PWSID is CO0154725.
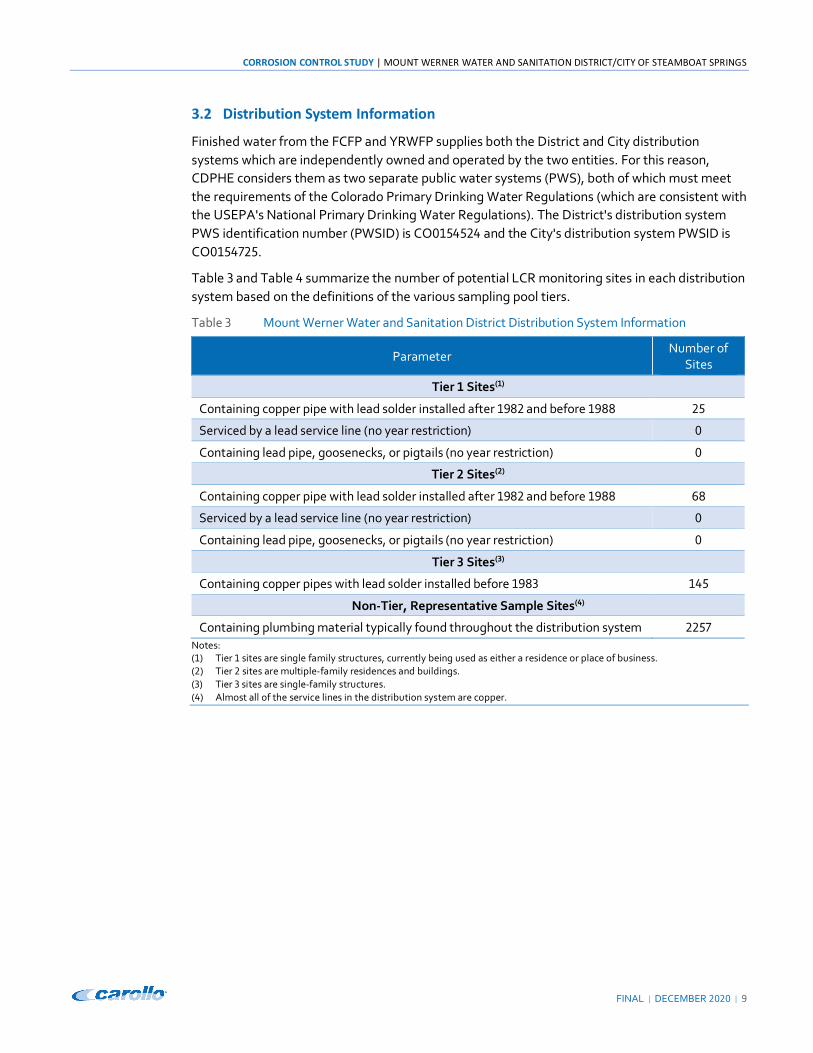
Table 3 and Table 4 summarize the number of potential LCR monitoring sites in each distribution system based on the definitions of the various sampling pool tiers.
Table 3 Mount Werner Water and Sanitation District Distribution System Information
Parameter Number of
Sites
Tier 1 Sites(1)
Containing copper pipe with lead solder installed after 1982 and before 1988 25
Serviced by a lead service line (no year restriction) 0
Containing lead pipe, goosenecks, or pigtails (no year restriction) 0
Tier 2 Sites(2)
Containing copper pipe with lead solder installed after 1982 and before 1988 68
Serviced by a lead service line (no year restriction) 0
Containing lead pipe, goosenecks, or pigtails (no year restriction) 0
Tier 3 Sites(3)
Containing copper pipes with lead solder installed before 1983 145
Non-Tier, Representative Sample Sites(4)
Containing plumbing material typically found throughout the distribution system 2257 Notes: (1) Tier 1 sites are single family structures, currently being used as either a residence or place of business. (2) Tier 2 sites are multiple-family residences and buildings. (3) Tier 3 sites are single-family structures. (4) Almost all of the service lines in the distribution system are copper.

MOUNT WERNER WATER AND SANITATION DISTRICT/CITY OF STEAMBOAT SPRINGS | CORROSION CONTROL STUDY
10 | DECEMBER 2020 | FINAL
Table 4 City of Steamboat Springs Distribution System Information
Parameter Number of
Sites
Tier 1 Sites(1)
Containing copper pipe with lead solder installed after 1982 and before 1988 45
Serviced by a lead service line (no year restriction) 0
Containing lead pipe, goosenecks, or pigtails (no year restriction) 0(5)
Tier 2 Sites(2)
Containing copper pipe with lead solder installed after 1982 and before 1988 0
Serviced by a lead service line (no year restriction) 0
Containing lead pipe, goosenecks, or pigtails (no year restriction) 0
Tier 3 Sites(3)
Containing copper pipes with lead solder installed before 1983 1,300
Non-Tier, Representative Sample Sites(4)
Containing plumbing material typically found throughout the distribution system 1,500 Notes: (1) Tier 1 sites are single family structures, currently being used as either a residence or place of business. (2) Tier 2 sites are multiple-family residences and buildings. (3) Tier 3 sites are single-family structures. (4) Almost all of the service lines in the distribution system are copper. (5) The City identified and removed all lead goosenecks from the distribution system.
Section 4
WATER QUALITY ANALYSIS
4.1 FCFP Finished Water Quality
The District conducted grab sampling (22 total) of the FCFP finished water from April 9, 2019 to May 22, 2020. The sampling results are summarized in Figure 3 and Table 5.

CORROSION CONTROL STUDY | MOUNT WERNER WATER AND SANITATION DISTRICT/CITY OF STEAMBOAT SPRINGS
FINAL | DECEMBER 2020 | 11
Figure 3 FCFP Finished Water Quality Data
Table 5 FCFP Finished Water Quality Data
Water Quality Data Calculated Range
Parameter Units Minimum Average Maximum
Temperature Celsius 2.0 6.0 14.0
pH S.U. 6.5 7.1 7.5
Alkalinity mg/L as CaCO₃ 8.8 17.8 26.5
Total Dissolved Solids (TDS) mg/L 23 36 67
Free Chlorine (Cl2) mg/L as Cl2 1.1 1.3 1.5
Chloride mg/L 4.4 5.9 9.2
Dissolved Oxygen mg/L 4.4 9.8 12.2
Sulfate mg/L 5.8 9.0 12.0
Calcium mg/L as CaCO₃ 4.2 9.6 15.6 Notes: (1) Sample dates range from 4/9/2019 to 5/22/2019. A total of 22 samples were collected during this period. S.U. Standard Unit

MOUNT WERNER WATER AND SANITATION DISTRICT/CITY OF STEAMBOAT SPRINGS | CORROSION CONTROL STUDY
12 | DECEMBER 2020 | FINAL
4.2 YRWFP Finished Water Quality
Grab sampling (11 total) of YRWFP finished water were collected from July 17, 2019 to May 22, 2020, 2020. The sampling results are summarized in Figure 4 and Table 6.
Figure 4 YRWFP Finished Water Quality Data
Table 6 YRWFP Finished Water Quality Data
Water Quality Data Calculated Range
Parameter Units Minimum Average Maximum
Temperature Celsius 8.4 11.0 12.8
pH S.U. 7.0 7.2 7.3
Alkalinity mg/L as CaCO₃ 37 91 131
TDS mg/L 125 155 280
Cl2 mg/L as Cl2 0.8 1.2 1.8
Chloride mg/L 13.6 19.6 29.9
Dissolved Oxygen mg/L 4.2 7.7 9.1
Sulfate mg/L 20 74 153
Calcium mg/L as CaCO₃ 9.7 11.7 15.7 Notes: (1) Sample dates range from 7/17/2019 to 5/22/2019. A total of 11 samples were collected during this period.
CORROSION CONTROL STUDY | MOUNT WERNER WATER AND SANITATION DISTRICT/CITY OF STEAMBOAT SPRINGS
FINAL | DECEMBER 2020 | 13
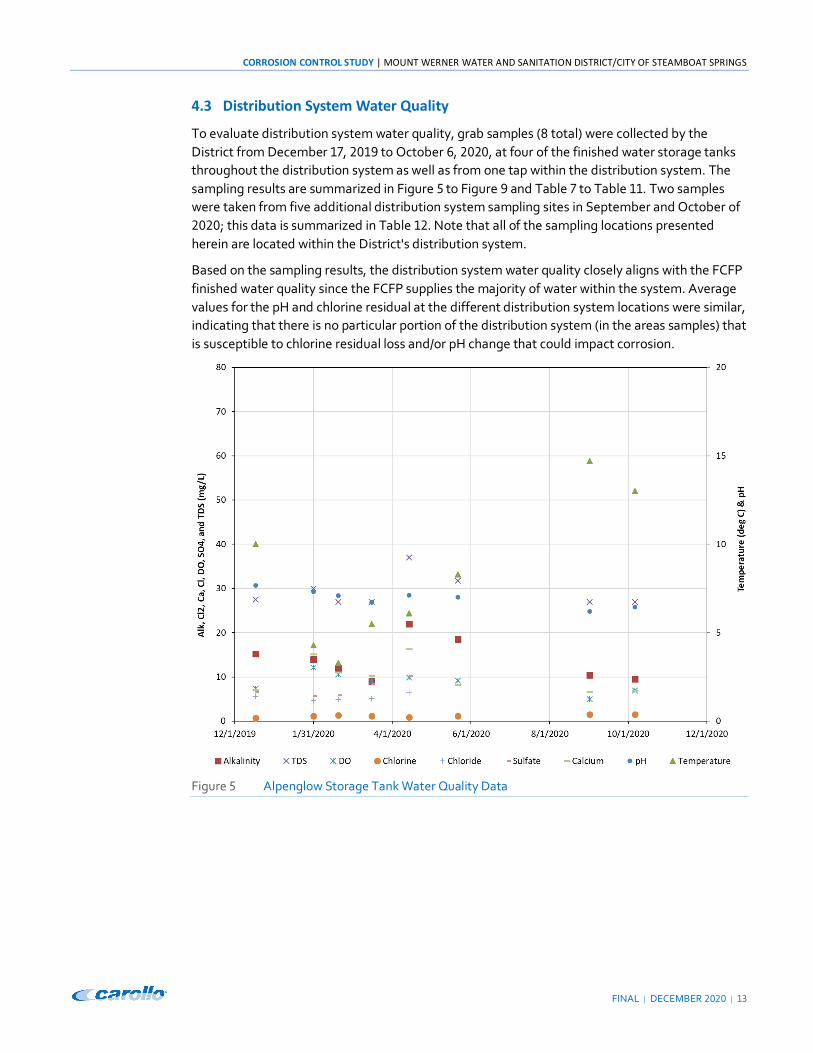
4.3 Distribution System Water Quality
To evaluate distribution system water quality, grab samples (8 total) were collected by the District from December 17, 2019 to October 6, 2020, at four of the finished water storage tanks throughout the distribution system as well as from one tap within the distribution system. The sampling results are summarized in Figure 5 to Figure 9 and Table 7 to Table 11. Two samples were taken from five additional distribution system sampling sites in September and October of 2020; this data is summarized in Table 12. Note that all of the sampling locations presented herein are located within the District's distribution system.
Based on the sampling results, the distribution system water quality closely aligns with the FCFP finished water quality since the FCFP supplies the majority of water within the system. Average values for the pH and chlorine residual at the different distribution system locations were similar, indicating that there is no particular portion of the distribution system (in the areas samples) that is susceptible to chlorine residual loss and/or pH change that could impact corrosion.
Figure 5 Alpenglow Storage Tank Water Quality Data

MOUNT WERNER WATER AND SANITATION DISTRICT/CITY OF STEAMBOAT SPRINGS | CORROSION CONTROL STUDY
14 | DECEMBER 2020 | FINAL
Table 7 Alpenglow Storage Tank Water Quality Data
Water Quality Data Calculated Range
Parameter Units Minimum Average Maximum
Temperature Celsius 3.3 8.2 14.7
pH S.U. 6.2 6.9 7.5
Alkalinity mg/L as CaCO₃ 9.0 14.0 22.0
TDS mg/L 27 29 37
Cl2 mg/L as Cl2 0.8 1.2 1.6
Chloride mg/L 4.6 5.3 6.4
Dissolved Oxygen mg/L 5.0 8.8 12.1
Sulfate mg/L 5.7 7.4 10.2
Calcium mg/L as CaCO₃ 6.7 10.2 16.3 Notes: (1) Sample dates range from 12/17/2019 to 10/6/2020. A total of 8 samples were collected during this period.
Figure 6 Burgess Creek Storage Tank Water Quality Data
CORROSION CONTROL STUDY | MOUNT WERNER WATER AND SANITATION DISTRICT/CITY OF STEAMBOAT SPRINGS
FINAL | DECEMBER 2020 | 15
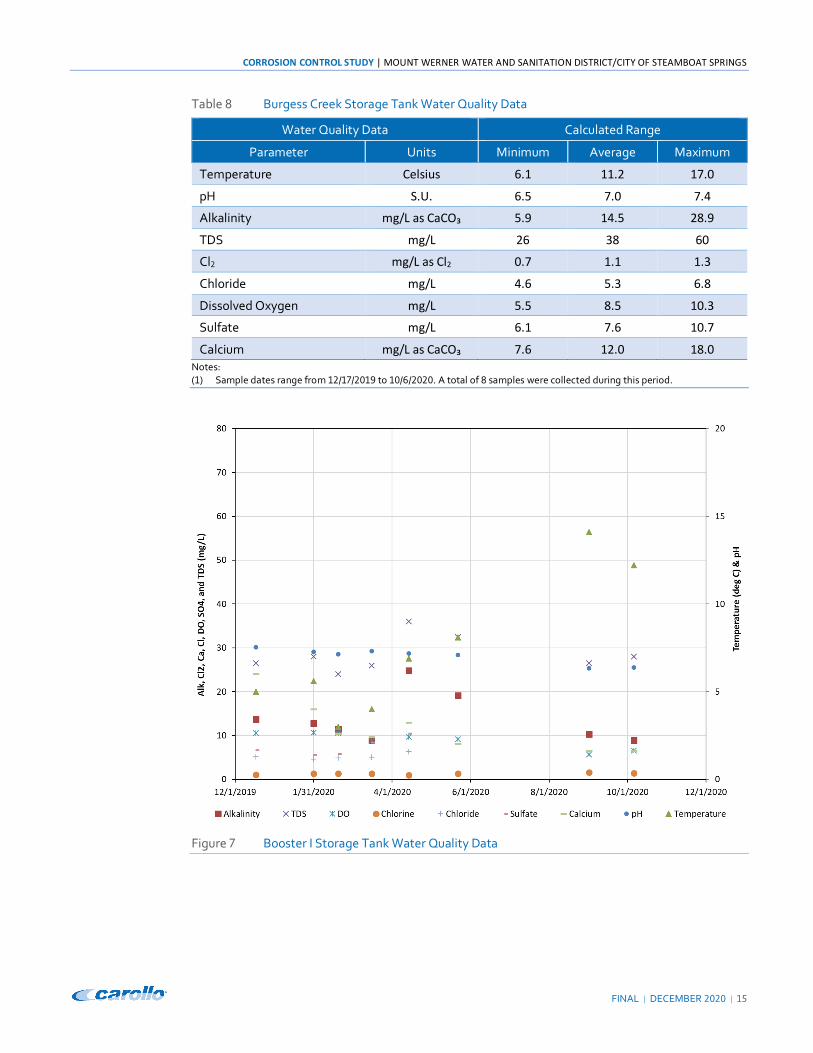
Table 8 Burgess Creek Storage Tank Water Quality Data
Water Quality Data Calculated Range
Parameter Units Minimum Average Maximum
Temperature Celsius 6.1 11.2 17.0
pH S.U. 6.5 7.0 7.4
Alkalinity mg/L as CaCO₃ 5.9 14.5 28.9
TDS mg/L 26 38 60
Cl2 mg/L as Cl2 0.7 1.1 1.3
Chloride mg/L 4.6 5.3 6.8
Dissolved Oxygen mg/L 5.5 8.5 10.3
Sulfate mg/L 6.1 7.6 10.7
Calcium mg/L as CaCO₃ 7.6 12.0 18.0 Notes: (1) Sample dates range from 12/17/2019 to 10/6/2020. A total of 8 samples were collected during this period.
Figure 7 Booster I Storage Tank Water Quality Data

MOUNT WERNER WATER AND SANITATION DISTRICT/CITY OF STEAMBOAT SPRINGS | CORROSION CONTROL STUDY
16 | DECEMBER 2020 | FINAL
Table 9 Booster I Storage Tank Water Quality Data
Water Quality Data Calculated Range
Parameter Units Minimum Average Maximum
Temperature Celsius 3.0 7.4 14.1
pH S.U. 6.4 7.0 7.5
Alkalinity mg/L as CaCO₃ 8.8 13.7 24.8
TDS mg/L 24 28 36
Cl2 mg/L as Cl2 1.0 1.3 1.7
Chloride mg/L 4.6 5.2 6.3
Dissolved Oxygen mg/L 5.7 9.0 10.7
Sulfate mg/L 5.6 7.4 10.5
Calcium mg/L as CaCO₃ 6.5 11.8 24.0 Notes: (1) Sample dates range from 12/17/2019 to 10/6/2020. A total of 8 samples were collected during this period.
Figure 8 Booster III Storage Tank Water Quality Data

CORROSION CONTROL STUDY | MOUNT WERNER WATER AND SANITATION DISTRICT/CITY OF STEAMBOAT SPRINGS
FINAL | DECEMBER 2020 | 17
Table 10 Booster III Storage Tank Water Quality Data
Water Quality Data Calculated Range
Parameter Units Minimum Average Maximum
Temperature Celsius 4.0 9.1 14.9
pH S.U. 6.4 6.9 7.5
Alkalinity mg/L as CaCO₃ 8.5 14.1 22.1
TDS mg/L 26 30 38
Cl2 mg/L as Cl2 1.1 1.2 1.4
Chloride mg/L 4.5 5.3 6.8
Dissolved Oxygen mg/L 3.9 7.6 9.4
Sulfate mg/L 5.9 7.5 9.6
Calcium mg/L as CaCO₃ 4.3 9.3 15.3 Notes: (1) Sample dates range from 12/17/2019 to 10/6/2020. A total of 8 samples were collected during this period.
Figure 9 MWW Equipment Shop Tap Water Quality Data

MOUNT WERNER WATER AND SANITATION DISTRICT/CITY OF STEAMBOAT SPRINGS | CORROSION CONTROL STUDY
18 | DECEMBER 2020 | FINAL
Table 11 District Equipment Shop Tap Water Quality Data
Water Quality Data Calculated Range
Parameter Units Minimum Average Maximum
Temperature Celsius 5.7 10.0 17.6
pH S.U. 6.4 6.9 7.5
Alkalinity mg/L as CaCO₃ 9.8 20.8 30.7
TDS mg/L 27.0 34.3 47.5
Cl2 mg/L as Cl2 0.8 1.1 1.8
Chloride mg/L 4.4 5.6 8.5
Dissolved Oxygen mg/L 4.6 8.1 11.0
Sulfate mg/L 5.7 7.8 10.5
Calcium mg/L as CaCO₃ 6.0 13.8 20.7 Notes: (1) Sample dates range from 12/17/2019 to 10/6/2020. A total of 8 samples were collected during this period.
Table 12 Additional Distribution Water Quality Samples
Water Quality Data Sample Sites
Parameter Units Inn at
Steamboat Forest Service
Steamboat Hotel
Chateau Chamonix
Holiday Inn
Temperature Celsius 17.4 / 18.1 18.0 / 16.4 15.2 / 14.4 18.8 / 18.6 17.4 / 18.1
pH S.U. 6.93 / 6.90 6.99 / 6.50 7.04 / 7.01 6.40 / 6.20 6.93 / 6.90
Alkalinity mg/L as CaCO₃
64.5 / 31.0 68.7 / 7.4 65.8 / 29.7 7.4 / 7.1 64.5 / 31.0
TDS mg/L 128 / 75 124 / 26 136 / 140 30 / 27 128 / 75
Cl2 mg/L as Cl2 2.1 / 1.0 2.0 / 1.1 2.2 / 1.2 1.15 / 0.9 2.1 / 1.0
Chloride mg/L 10.2 / 9.5 16.5 / 16.4 17.0 / 16.2 9.4 / 9.6 16.4 / 16.2
Dissolved Oxygen
mg/L 5.90 / 5.45 5.89 / 6.35 5.75 / 5.75 5.95 / 6.62 5.9
Sulfate mg/L 6.7 / 6.6 23.8 / 24.0 24.0 / 24.1 6.5 / 6.7 23.7 / 24.1
Calcium mg/L as CaCO₃
48.5 / 50.1 48.3 / 7.3 64.1 / 95.5 7.2 / 6.8 48.5 / 50.1
Notes: (1) Except for chloride and sulfate, all samples were collected on September 14, 2020 and October 20, 2020. (2) Chloride and sulfate samples were collected on December 14, 2020 and December 15, 2020.
4.4 Corrosion Index Calculations
Multiple corrosion indices have been developed as a mechanism to assess the corrosivity of
water to different pipe and plumbing materials. Descriptions of each corrosion index are
included in the subsequent sections and sample calculations are provided in Appendix A.
CORROSION CONTROL STUDY | MOUNT WERNER WATER AND SANITATION DISTRICT/CITY OF STEAMBOAT SPRINGS
FINAL | DECEMBER 2020 | 19
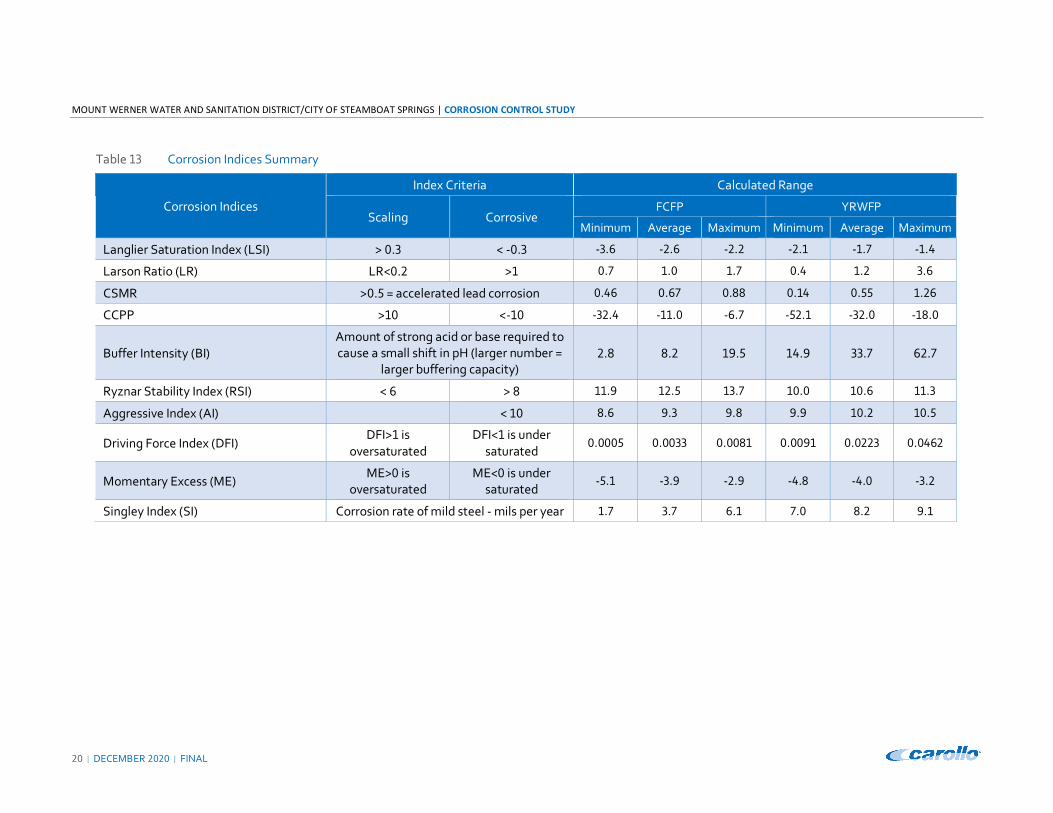
There are several corrosion indices that have been developed based on corrosion control through CaCO₃ saturation. There are other indices that focus on the role of anions in promoting corrosion. For this Study, the various corrosion indices were calculated with equations from the Carollo Corrosion Indices Calculator (with MathCAD) and using a Microsoft Excel based Calcium Carbonate Precipitation Potential (CCPP) calculator. Table 13 summarizes the calculated results, ranges of the corrosion indices, and indicates the variability of finished water quality for the FCFP and the YRWFP. Note that both plants have water which is considered corrosive by a majority of the indices, particularly the CaCO₃ solubility based indices.
The finished water from the YRWFP is slightly less corrosive than that of the FCFP, likely due to higher mineral content and alkalinity which leads to greater pH stability from the Yampa River.
MOUNT WERNER WATER AND SANITATION DISTRICT/CITY OF STEAMBOAT SPRINGS | CORROSION CONTROL STUDY
20 | DECEMBER 2020 | FINAL
Table 13 Corrosion Indices Summary
Corrosion Indices
Index Criteria Calculated Range
Scaling Corrosive FCFP YRWFP
Minimum Average Maximum Minimum Average Maximum
Langlier Saturation Index (LSI) > 0.3 < -0.3 -3.6 -2.6 -2.2 -2.1 -1.7 -1.4
Larson Ratio (LR) LR<0.2 >1 0.7 1.0 1.7 0.4 1.2 3.6
CSMR >0.5 = accelerated lead corrosion 0.46 0.67 0.88 0.14 0.55 1.26
CCPP >10 <-10 -32.4 -11.0 -6.7 -52.1 -32.0 -18.0
Buffer Intensity (BI) Amount of strong acid or base required to cause a small shift in pH (larger number =
larger buffering capacity) 2.8 8.2 19.5 14.9 33.7 62.7
Ryznar Stability Index (RSI) < 6 > 8 11.9 12.5 13.7 10.0 10.6 11.3
Aggressive Index (AI) < 10 8.6 9.3 9.8 9.9 10.2 10.5
Driving Force Index (DFI) DFI>1 is
oversaturated DFI<1 is under
saturated 0.0005 0.0033 0.0081 0.0091 0.0223 0.0462
Momentary Excess (ME) ME>0 is
oversaturated ME<0 is under
saturated -5.1 -3.9 -2.9 -4.8 -4.0 -3.2
Singley Index (SI) Corrosion rate of mild steel - mils per year 1.7 3.7 6.1 7.0 8.2 9.1
CORROSION CONTROL STUDY | MOUNT WERNER WATER AND SANITATION DISTRICT/CITY OF STEAMBOAT SPRINGS
FINAL | DECEMBER 2020 | 21
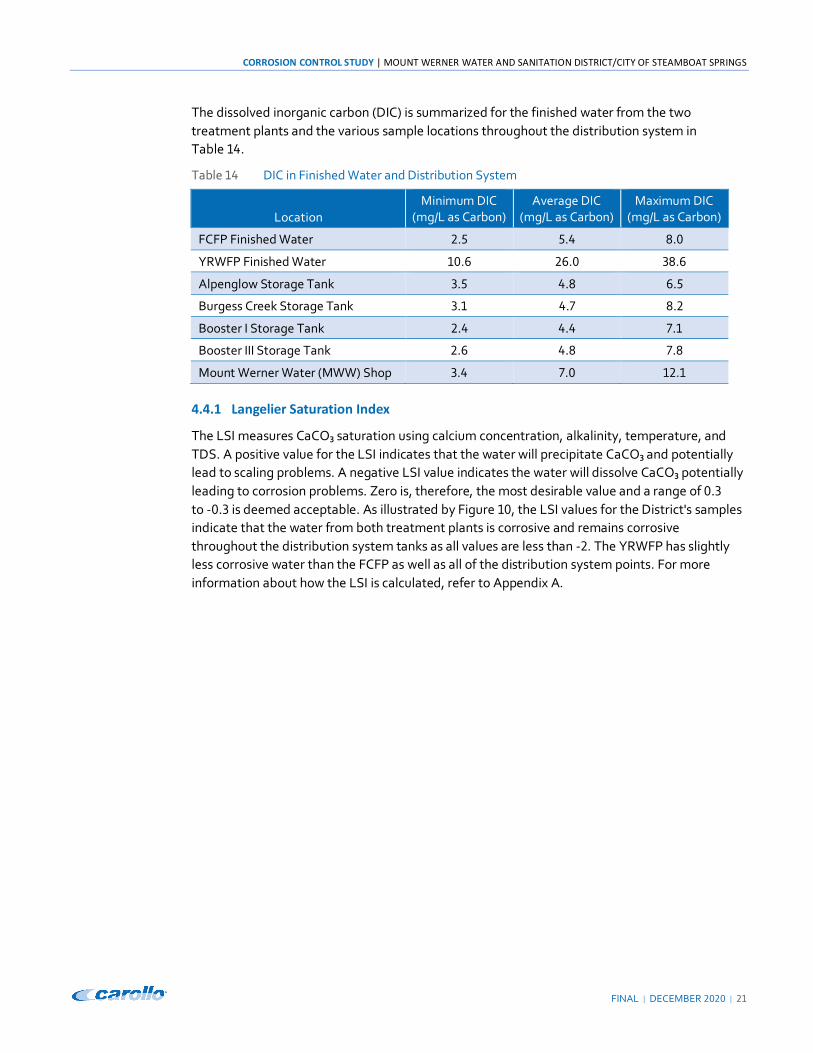
The dissolved inorganic carbon (DIC) is summarized for the finished water from the two treatment plants and the various sample locations throughout the distribution system in Table 14.
Table 14 DIC in Finished Water and Distribution System
Location Minimum DIC
(mg/L as Carbon) Average DIC
(mg/L as Carbon)
Maximum DIC (mg/L as Carbon)
FCFP Finished Water 2.5 5.4 8.0
YRWFP Finished Water 10.6 26.0 38.6
Alpenglow Storage Tank 3.5 4.8 6.5
Burgess Creek Storage Tank 3.1 4.7 8.2
Booster I Storage Tank 2.4 4.4 7.1
Booster III Storage Tank 2.6 4.8 7.8
Mount Werner Water (MWW) Shop 3.4 7.0 12.1
4.4.1 Langelier Saturation Index
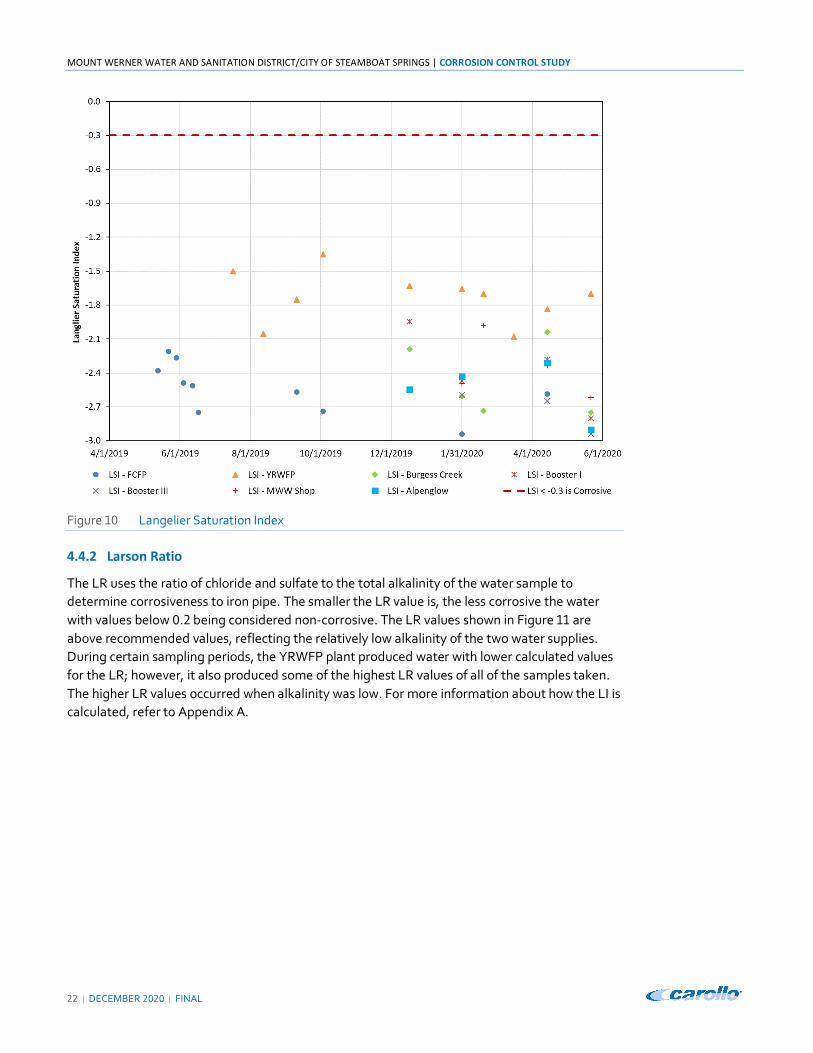
The LSI measures CaCO₃ saturation using calcium concentration, alkalinity, temperature, and TDS. A positive value for the LSI indicates that the water will precipitate CaCO₃ and potentially lead to scaling problems. A negative LSI value indicates the water will dissolve CaCO₃ potentially leading to corrosion problems. Zero is, therefore, the most desirable value and a range of 0.3 to -0.3 is deemed acceptable. As illustrated by Figure 10, the LSI values for the District's samples indicate that the water from both treatment plants is corrosive and remains corrosive throughout the distribution system tanks as all values are less than -2. The YRWFP has slightly less corrosive water than the FCFP as well as all of the distribution system points. For more information about how the LSI is calculated, refer to Appendix A.
MOUNT WERNER WATER AND SANITATION DISTRICT/CITY OF STEAMBOAT SPRINGS | CORROSION CONTROL STUDY
22 | DECEMBER 2020 | FINAL
Figure 10 Langelier Saturation Index
4.4.2 Larson Ratio
The LR uses the ratio of chloride and sulfate to the total alkalinity of the water sample to determine corrosiveness to iron pipe. The smaller the LR value is, the less corrosive the water with values below 0.2 being considered non-corrosive. The LR values shown in Figure 11 are above recommended values, reflecting the relatively low alkalinity of the two water supplies. During certain sampling periods, the YRWFP plant produced water with lower calculated values for the LR; however, it also produced some of the highest LR values of all of the samples taken. The higher LR values occurred when alkalinity was low. For more information about how the LI is calculated, refer to Appendix A.

CORROSION CONTROL STUDY | MOUNT WERNER WATER AND SANITATION DISTRICT/CITY OF STEAMBOAT SPRINGS
FINAL | DECEMBER 2020 | 23
Figure 11 Larson Ratio
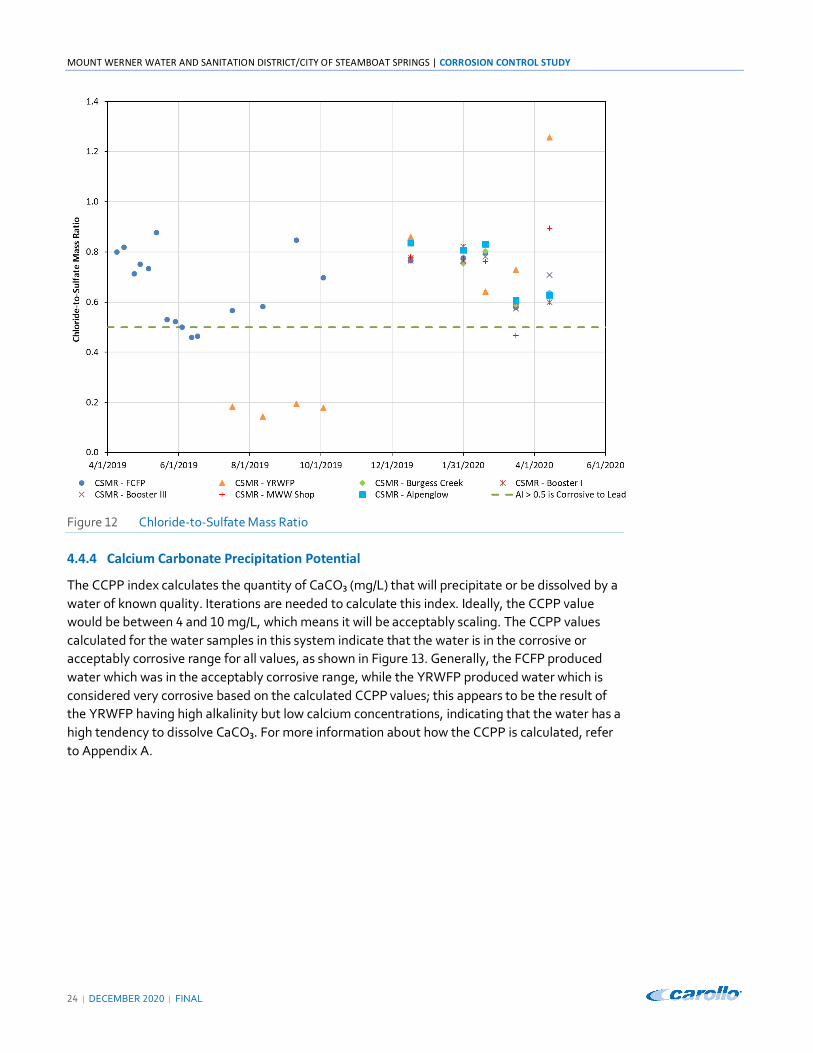
4.4.3 Chloride to Sulfate Mass Ratio
The CSMR can be used to monitor potential lead and copper leaching in water. An increase in CSMR can lead to an increase in galvanic corrosion, specifically in lead solder connected to copper pipe, which is commonly used in the District and City's distribution systems. A low CSMR represents a lower potential for corrosion with a target of <0.5. The CSMR values for all water samples are shown in Figure 12 demonstrate that the water is typically corrosive to lead; however, there was a particular period in the fall of 2019 where the YRWFP finished water was less than or equal to 0.5 (non-corrosive).
MOUNT WERNER WATER AND SANITATION DISTRICT/CITY OF STEAMBOAT SPRINGS | CORROSION CONTROL STUDY
24 | DECEMBER 2020 | FINAL
Figure 12 Chloride-to-Sulfate Mass Ratio
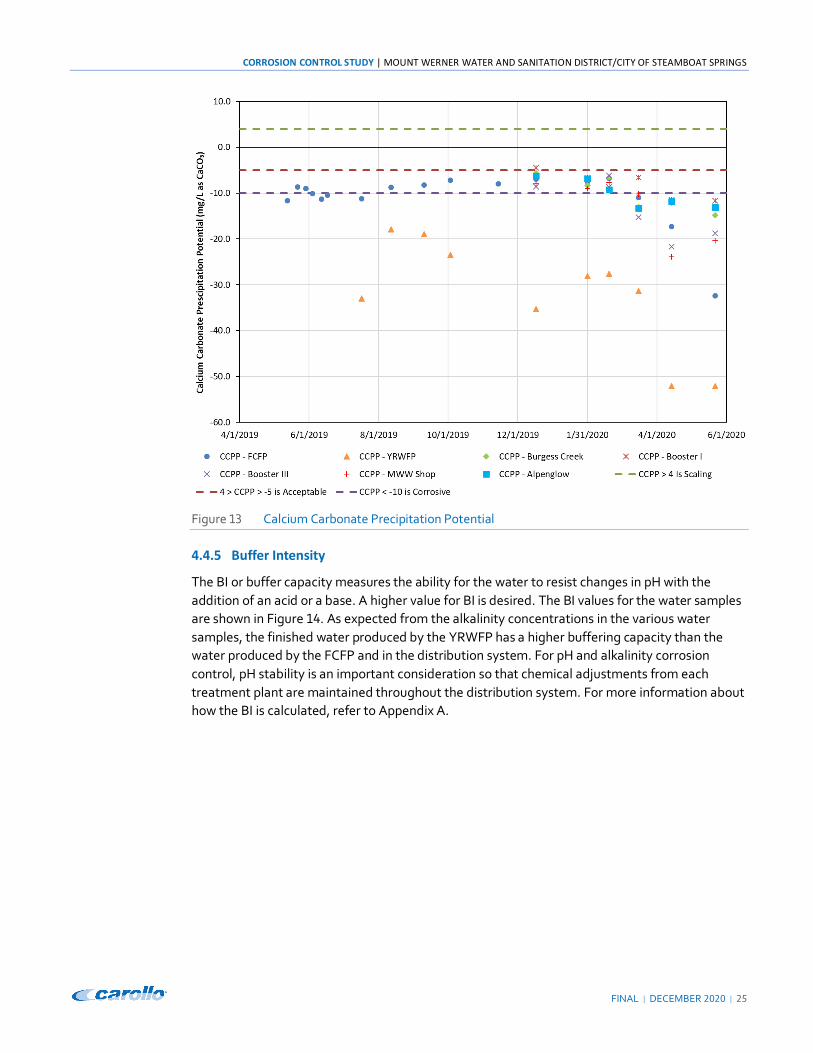
4.4.4 Calcium Carbonate Precipitation Potential
The CCPP index calculates the quantity of CaCO₃ (mg/L) that will precipitate or be dissolved by a water of known quality. Iterations are needed to calculate this index. Ideally, the CCPP value would be between 4 and 10 mg/L, which means it will be acceptably scaling. The CCPP values calculated for the water samples in this system indicate that the water is in the corrosive or acceptably corrosive range for all values, as shown in Figure 13. Generally, the FCFP produced water which was in the acceptably corrosive range, while the YRWFP produced water which is considered very corrosive based on the calculated CCPP values; this appears to be the result of the YRWFP having high alkalinity but low calcium concentrations, indicating that the water has a high tendency to dissolve CaCO₃. For more information about how the CCPP is calculated, refer to Appendix A.
CORROSION CONTROL STUDY | MOUNT WERNER WATER AND SANITATION DISTRICT/CITY OF STEAMBOAT SPRINGS
FINAL | DECEMBER 2020 | 25
Figure 13 Calcium Carbonate Precipitation Potential
4.4.5 Buffer Intensity
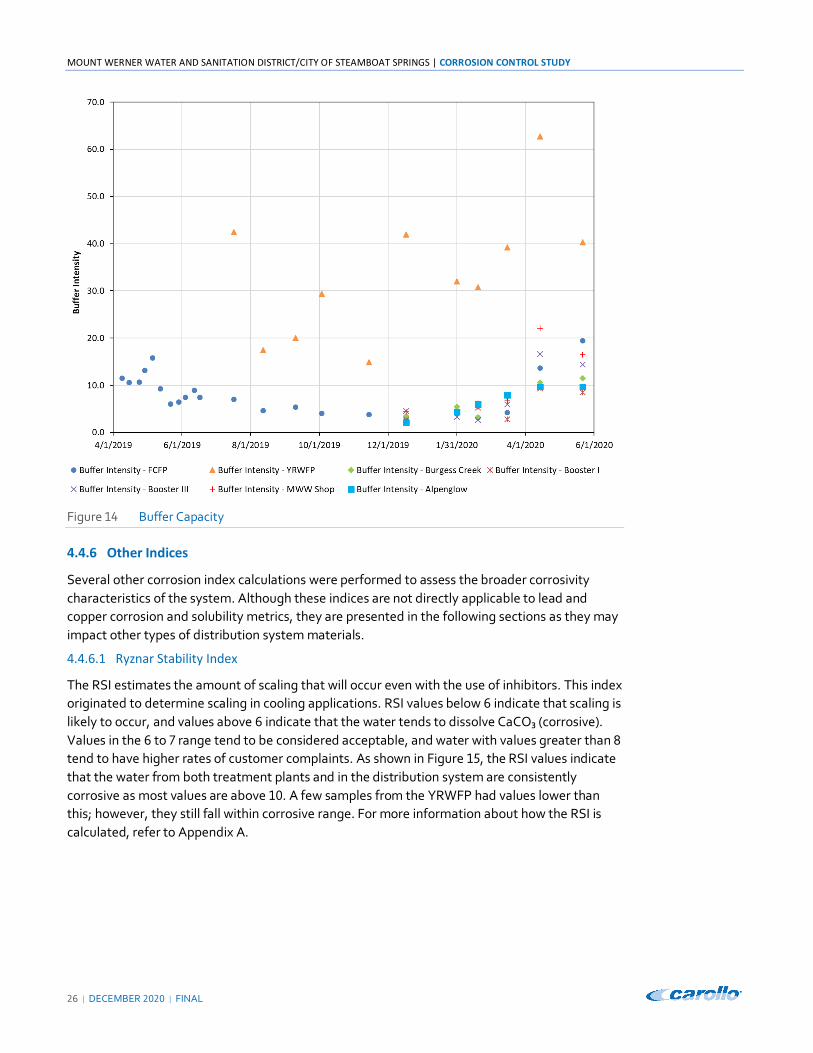
The BI or buffer capacity measures the ability for the water to resist changes in pH with the addition of an acid or a base. A higher value for BI is desired. The BI values for the water samples are shown in Figure 14. As expected from the alkalinity concentrations in the various water samples, the finished water produced by the YRWFP has a higher buffering capacity than the water produced by the FCFP and in the distribution system. For pH and alkalinity corrosion control, pH stability is an important consideration so that chemical adjustments from each treatment plant are maintained throughout the distribution system. For more information about how the BI is calculated, refer to Appendix A.
MOUNT WERNER WATER AND SANITATION DISTRICT/CITY OF STEAMBOAT SPRINGS | CORROSION CONTROL STUDY
26 | DECEMBER 2020 | FINAL
Figure 14 Buffer Capacity
4.4.6 Other Indices
Several other corrosion index calculations were performed to assess the broader corrosivity characteristics of the system. Although these indices are not directly applicable to lead and copper corrosion and solubility metrics, they are presented in the following sections as they may impact other types of distribution system materials.
4.4.6.1 Ryznar Stability Index
The RSI estimates the amount of scaling that will occur even with the use of inhibitors. This index originated to determine scaling in cooling applications. RSI values below 6 indicate that scaling is likely to occur, and values above 6 indicate that the water tends to dissolve CaCO₃ (corrosive). Values in the 6 to 7 range tend to be considered acceptable, and water with values greater than 8 tend to have higher rates of customer complaints. As shown in Figure 15, the RSI values indicate that the water from both treatment plants and in the distribution system are consistently corrosive as most values are above 10. A few samples from the YRWFP had values lower than this; however, they still fall within corrosive range. For more information about how the RSI is calculated, refer to Appendix A.

CORROSION CONTROL STUDY | MOUNT WERNER WATER AND SANITATION DISTRICT/CITY OF STEAMBOAT SPRINGS
FINAL | DECEMBER 2020 | 27
Figure 15 Ryznar Stability Index
4.4.6.2 Aggressive Index
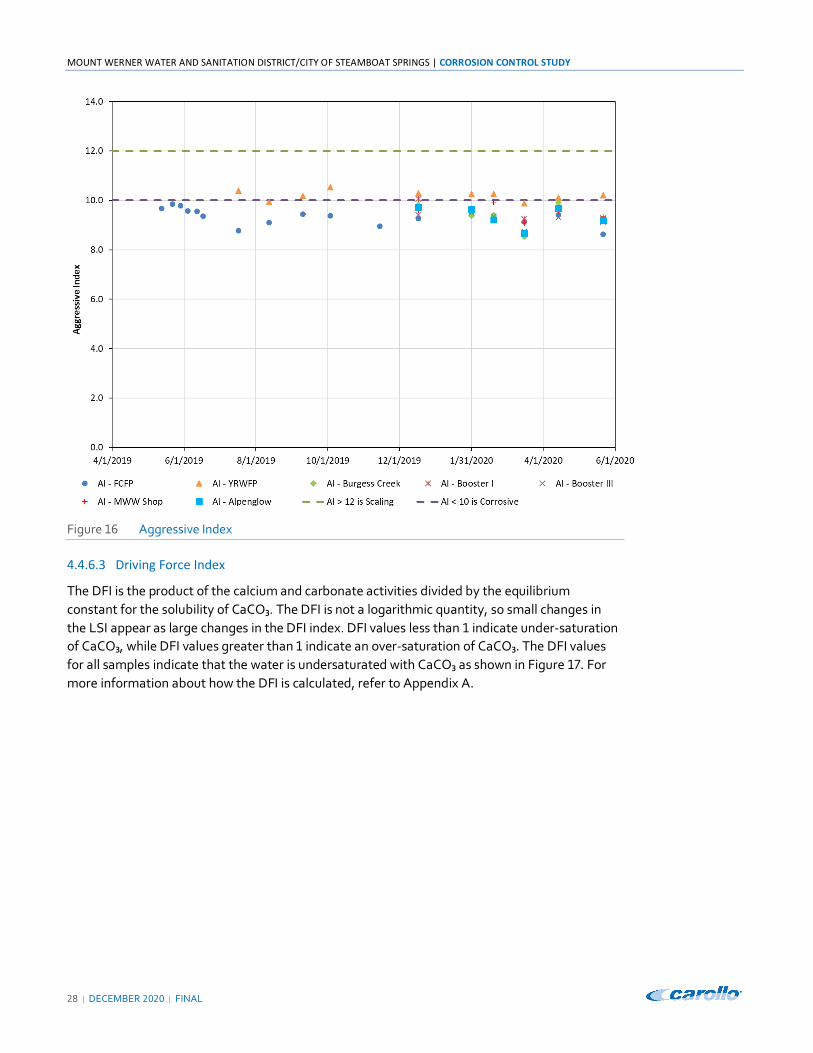
The AI indicates water's corrosiveness in asbestos-cement pipes. Water with an AI value less than 10 is considered to be aggressive or corrosive to asbestos-cement pipes and water with a value greater than 12 is considered to be non-aggressive. Although neither the District nor the City have this pipe material in the distribution system, the AI values for the FCFP finished water and many of the distribution system samples are considered to be aggressive toward asbestos-cement pipe, as shown in Figure 16. Almost all of the samples collected from the YRWFP and a single set of distribution system samples would be considered non-corrosive by this measure. For more information about how the AI is calculated, refer to Appendix A.
MOUNT WERNER WATER AND SANITATION DISTRICT/CITY OF STEAMBOAT SPRINGS | CORROSION CONTROL STUDY
28 | DECEMBER 2020 | FINAL
Figure 16 Aggressive Index
4.4.6.3 Driving Force Index
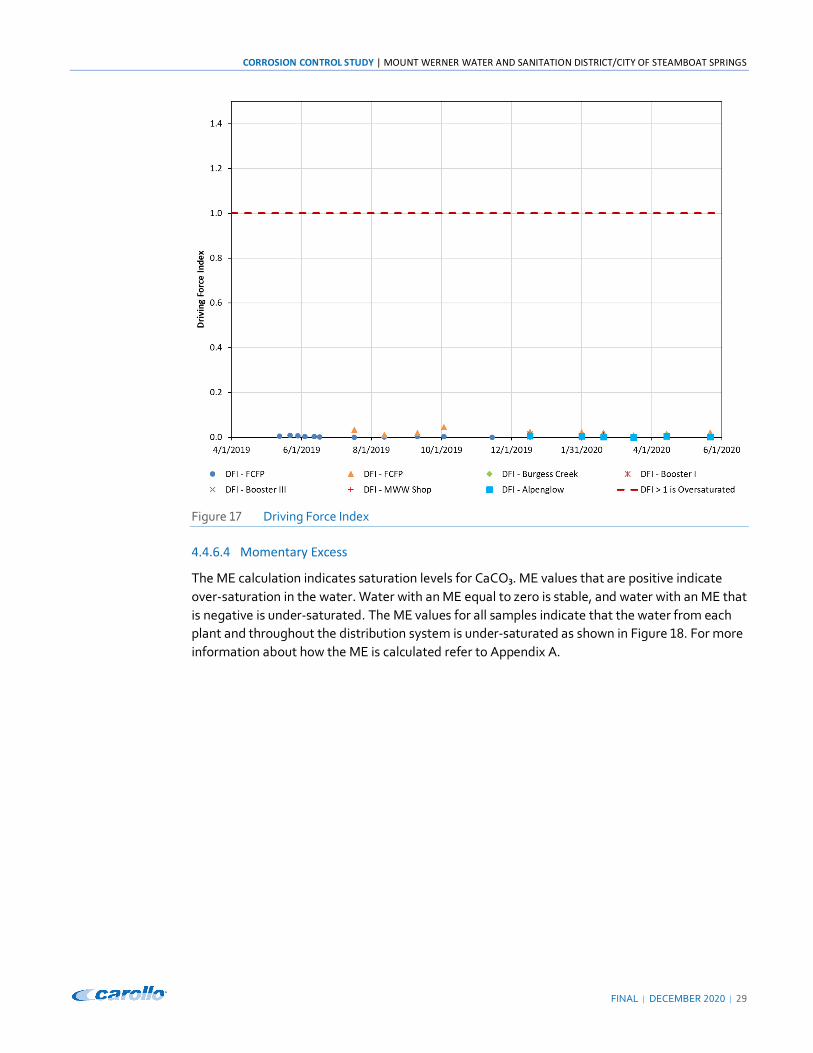
The DFI is the product of the calcium and carbonate activities divided by the equilibrium constant for the solubility of CaCO₃. The DFI is not a logarithmic quantity, so small changes in the LSI appear as large changes in the DFI index. DFI values less than 1 indicate under-saturation of CaCO₃, while DFI values greater than 1 indicate an over-saturation of CaCO₃. The DFI values for all samples indicate that the water is undersaturated with CaCO₃ as shown in Figure 17. For more information about how the DFI is calculated, refer to Appendix A.
CORROSION CONTROL STUDY | MOUNT WERNER WATER AND SANITATION DISTRICT/CITY OF STEAMBOAT SPRINGS
FINAL | DECEMBER 2020 | 29
Figure 17 Driving Force Index
4.4.6.4 Momentary Excess
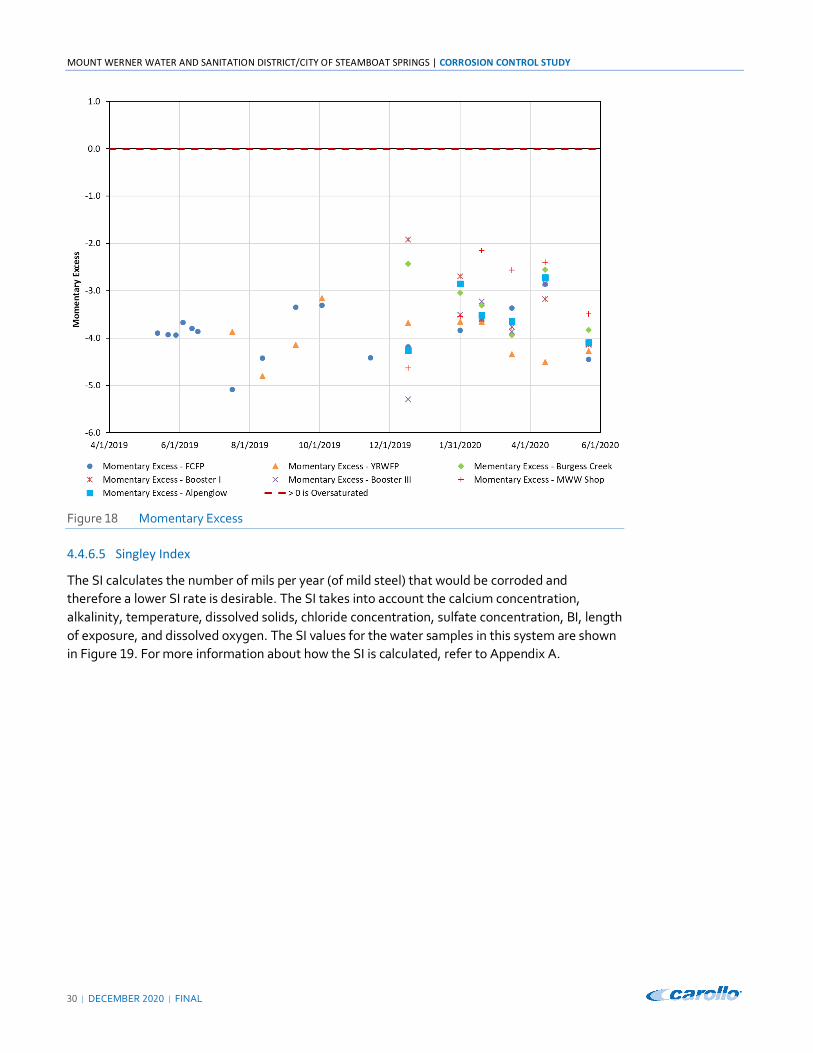
The ME calculation indicates saturation levels for CaCO₃. ME values that are positive indicate over-saturation in the water. Water with an ME equal to zero is stable, and water with an ME that is negative is under-saturated. The ME values for all samples indicate that the water from each plant and throughout the distribution system is under-saturated as shown in Figure 18. For more information about how the ME is calculated refer to Appendix A.
MOUNT WERNER WATER AND SANITATION DISTRICT/CITY OF STEAMBOAT SPRINGS | CORROSION CONTROL STUDY
30 | DECEMBER 2020 | FINAL
Figure 18 Momentary Excess
4.4.6.5 Singley Index
The SI calculates the number of mils per year (of mild steel) that would be corroded and therefore a lower SI rate is desirable. The SI takes into account the calcium concentration, alkalinity, temperature, dissolved solids, chloride concentration, sulfate concentration, BI, length of exposure, and dissolved oxygen. The SI values for the water samples in this system are shown in Figure 19. For more information about how the SI is calculated, refer to Appendix A.

CORROSION CONTROL STUDY | MOUNT WERNER WATER AND SANITATION DISTRICT/CITY OF STEAMBOAT SPRINGS
FINAL | DECEMBER 2020 | 31
Figure 19 Singley Index
4.4.7 Summary of Corrosion Index Calculations
Each corrosion index is developed from several factors important to specific elements or aspects of corrosion. Descriptions of each corrosion index are included in the preceding sections, and sample calculation are provided in Appendix A. All of the indices indicate that the finished water from both the FCFP and the YRWFP is corrosive. Generally, the YRWFP could be considered slightly less corrosive. The corrosivity of the finished water produced by the treatment plants is reflected in the corrosion index calculations for the District's distribution system samples. Low concentrations of minerals, particularly calcium as well as alkalinity in Fish Creek appear to be the root cause of the corrosive properties of the water. The following summarizes the various corrosion indices as they relate to the FCFP and YRWFP finished water. The distribution system generally matches the characteristics of the FCFP finished water.
Metrics which are relevant to lead and copper include:
• LSI – Both the FCFP and YRWFP produce water with negative LSI values, a measure of CaCO₃ saturation, indicating these sources are corrosive to concrete and will dissolve rather than precipitate CaCO₃.
• LR – is a measure of water corrosivity related to the chloride and sulfate concentrations and alkalinity. FCFP has values indicating the water is moderately to highly corrosive. YRWFP water has low values generally indicating a relatively low corrosivity; however, this facility also has occasionally exhibited very high LR values (greater than 2) indicating there are periods where the water is highly corrosive.
MOUNT WERNER WATER AND SANITATION DISTRICT/CITY OF STEAMBOAT SPRINGS | CORROSION CONTROL STUDY
32 | DECEMBER 2020 | FINAL
• CSMR – is a measure of potential lead and copper leaching in water. Most FCFP values
indicate the water is corrosive to lead and copper. The YRWFP had very low CSMR
values in the summer of 2019; however, in the spring of 2020 these values rose above
the recommended 0.5 threshold for CSMR.
• CCPP – is a measure of the amount (in mg/L) of CaCO₃ that will precipitate or be
dissolved. The FCFP finished water has CCPP values which indicate the water will
dissolve CaCO₃. The YRWFP water has CCPP value which are extremely low (-20 to -40)
indicating that the water is very calcium starved and will be very corrosive to CaCO₃.
• BI – is a measure of the ability for water to resist changes in pH. The FCFP has relatively
low BI values. The YRWFP has much higher BI values, indicating that water is more pH
stable. The extent of pH swings in the distribution system resulting from low BI depend
on whether biological or chemical reactions are occurring which affect water chemistry.
Other metrics which are not relevant for lead and copper but do provide information on potential
corrosion of other distribution system materials include:
• RSI – is a measure of the amount of CaCO₃ scaling that will occur. The FCFP water has
RSI values indicating a strong corrosivity while the YRWFP water has lower RSI values
indicating it is corrosive, but less so than that of the FCFP.
• AI – is a measure of corrosiveness in asbestos-cement pipes. FCFP water is corrosive
according to this calculation while the YRWFP water AI values generally fall in the range
that is neither corrosive nor scaling.
• DI – is a measure of CaCO₃ saturation. Both the FCFP and YRWFP have very low DI
values, indicating these waters will dissolve CaCO₃.
• ME – is also a measure of CaCO₃ saturation. With all values below 0, both the FCFP and
YRWFP waters are corrosive to CaCO₃.
• SI – is a measure of the number of mils per year of mild steel that would corrode. Both
the FCFP and YRWFP have SI values that indicate relatively high rates of corrosion.
4.5 Lead and Copper Rule Monitoring Data
Even though the District and City's distribution systems are considered independent systems, they
are interconnected and thus they both regularly collect LCR monitoring data within their respective
systems. The following sections summarize recent LCR monitoring results for each entity.
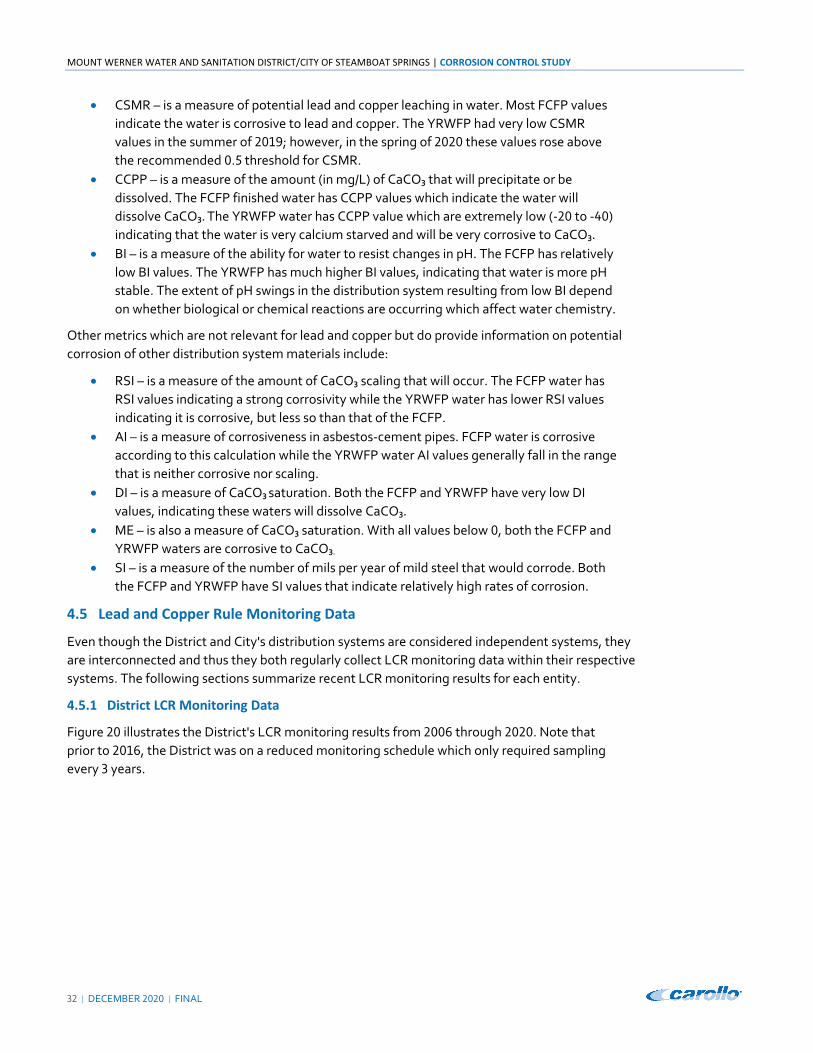
4.5.1 District LCR Monitoring Data
Figure 20 illustrates the District's LCR monitoring results from 2006 through 2020. Note that
prior to 2016, the District was on a reduced monitoring schedule which only required sampling
every 3 years.
CORROSION CONTROL STUDY | MOUNT WERNER WATER AND SANITATION DISTRICT/CITY OF STEAMBOAT SPRINGS
FINAL | DECEMBER 2020 | 33
Figure 20 District LCR Monitoring Results (2006-2020 Round 1)
As shown in Figure 20, lead and copper levels in the District's distribution system have generally
been low. However, in 2006, 2010, and 2018 lead levels were above the new LCRR trigger level.
Since this trigger level is not yet in effect, no subsequent actions were required based on the
results prior to 2020.
During the first half of 2020, the lead concentration exceeded the action level with a
90th percentile value of 0.016 mg/L. As a result of this exceedance, the District is required by
CDPHE to: 1) perform public education and outreach on the effects of lead and copper; 2) collect
additional lead and copper samples at consumer taps; 3) monitor several water quality
parameters at each entry point to the distribution system and at 10 distribution system taps;
4) monitor lead and copper at the entry point to the distribution system; 5) submit an optimized
corrosion control treatment OCCT recommendation. The District is actively addressing these
requirements and this report specifically addresses the OCCT recommendation.
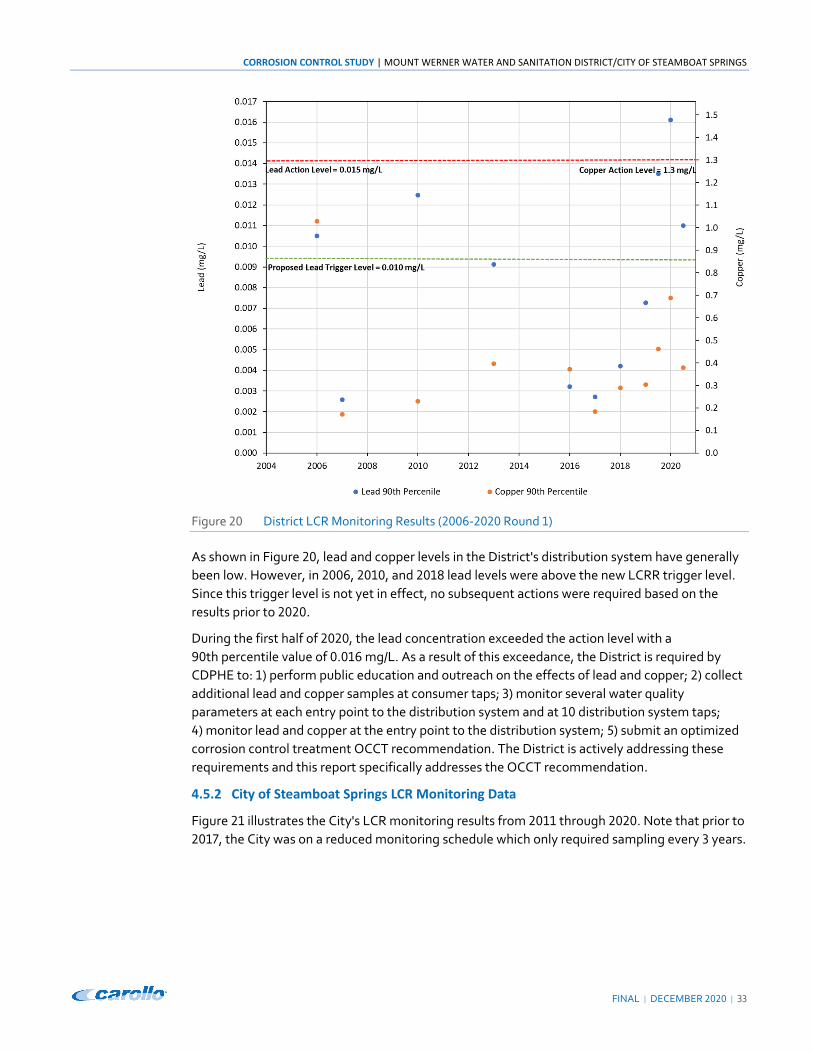
4.5.2 City of Steamboat Springs LCR Monitoring Data
Figure 21 illustrates the City's LCR monitoring results from 2011 through 2020. Note that prior to
2017, the City was on a reduced monitoring schedule which only required sampling every 3 years.
MOUNT WERNER WATER AND SANITATION DISTRICT/CITY OF STEAMBOAT SPRINGS | CORROSION CONTROL STUDY
Figure 21 City of Steamboat Springs LCR Monitoring Results (2006-2020 Round 1)
Similar to the District's LCR results, lead and copper in the City's distribution system have generally been low. However, since 2018 higher lead concentrations have been measured, with several of the 90th percentile values exceeding the LCRR trigger level of 0.010 mg/L.
Section 5
PIPE LOOP TESTING
5.1 Overview
In response to the recent lead action level exceedance in the District's distribution systems and the need to develop OCCT, pipe loop testing was conducted to compare alternative corrosion control treatment options. Because the FCFP produces a majority of the potable water used by the District and the City and has more corrosive finished water characteristics than the YRWFP, pipe loop testing was only done at that treatment plant. It was assumed that whatever OCCT is recommended for the FCFP would be implemented at the YRWFP for distribution system stability.
The two primary methods of corrosion control in potable water systems are to add a corrosion control inhibitor, or to stabilize the water by adjusting the pH or alkalinity so it is less corrosive. Both types of treatment were analyzed during the pipe loop testing performed for this Study.
34 | DECEMBER 2020 | FINAL
CORROSION CONTROL STUDY | MOUNT WERNER WATER AND SANITATION DISTRICT/CITY OF STEAMBOAT SPRINGS
FINAL | DECEMBER 2020 | 35
5.1.1 Addition of Corrosion Inhibitor
Chemicals can be added to the finished water to act as a corrosion inhibitor. Corrosion inhibitors prevent the corrosion of metal pipes and also control the release of lead and copper by forming a thin protective layer within the pipes. The most common corrosion inhibitors are phosphate-based, though there are some silicate-based options that are less frequently used. The three phosphate-based inhibitor approaches are orthophosphate, polyphosphate, or a blend of both. Polyphosphates are generally most effective for sequestering iron and manganese and must be blended with orthophosphates to mitigate the release of lead and copper. Under some conditions, especially warmer water, polyphosphates break down to orthophosphates in the distribution system helping to distribute the orthophosphates further from the treatment plant.
5.1.2 Chemical Stabilization
Another approach to corrosion control is via adjustment of the pH, alkalinity, calcium, and concentration of DIC of the finished water. Chemical stabilization is generally recommended when the following criteria are met:
• pH less than 7.2. • DIC less than 10 mg/L as carbon. • Calcium concentrations less than 20 mg/L as CaCO₃.
Based on the finished water samples collected for this Study, the FCFP meets these criteria. The YRWFP generally meets the pH criteria but has higher values for DIC and calcium. Since the shared distribution system water quality predominantly matches the FCFP, the OCCT should primarily address the corrosivity factors from the FCFP while maintaining feasibility and effectiveness for the YRWFP. Adjusting these parameters can be achieved using aeration, chemical feed, or a CaCO₃ contactor. Carbon dioxide (CO2) addition in conjunction with other chemicals (e.g., caustic soda [NaOH]) may be needed if a combination of pH and alkalinity addition is recommended for corrosion control.
Aeration promotes CO2 removal, which increases the pH. However, aeration does not increase alkalinity and would not as effectively raise the pH of the FCFP finished water to improve corrosion characteristics. Therefore, this treatment technology is not recommended for this system.
Adding chemicals such as lime, NaOH, or soda ash (Na2CO3) can increase alkalinity in combination with pH. Increasing the alkalinity will increase the buffering capacity of the water. Due to the currently low alkalinity of the water and sometimes flashy raw water quality (particularly during spring runoff conditions), addition of CO2 coupled with caustic soda or soda ash was also considered as a tool to achieve a higher carbonate alkalinity concentration for a given pH.
5.2 Methods
5.2.1 Pipe Harvesting and Pipe Loop Construction
Pipe loop panels were fabricated for this project and included a recirculation tank (approximately 5 gallons), a recirculation pump, PVC piping and tubing, isolation valves, and sample ports. A general schematic of the pipe loop system is provided in Figure 22.

MOUNT WERNER WATER AND SANITATION DISTRICT/CITY OF STEAMBOAT SPRINGS | CORROSION CONTROL STUDY
36 | DECEMBER 2020 | FINAL
Figure 22 Pipe Loop Schematic
Since neither system includes lead service lines, only copper pipe segments were collected from one Tier 1 sampling site in the District's and City's distribution systems. These pipes were capped after harvesting and filled with water to preserve the interior scaling. Figure 23 shows an example of this scaling.

CORROSION CONTROL STUDY | MOUNT WERNER WATER AND SANITATION DISTRICT/CITY OF STEAMBOAT SPRINGS
FINAL | DECEMBER 2020 | 37
Figure 23 Harvested Pipe Segment Interior Scaling
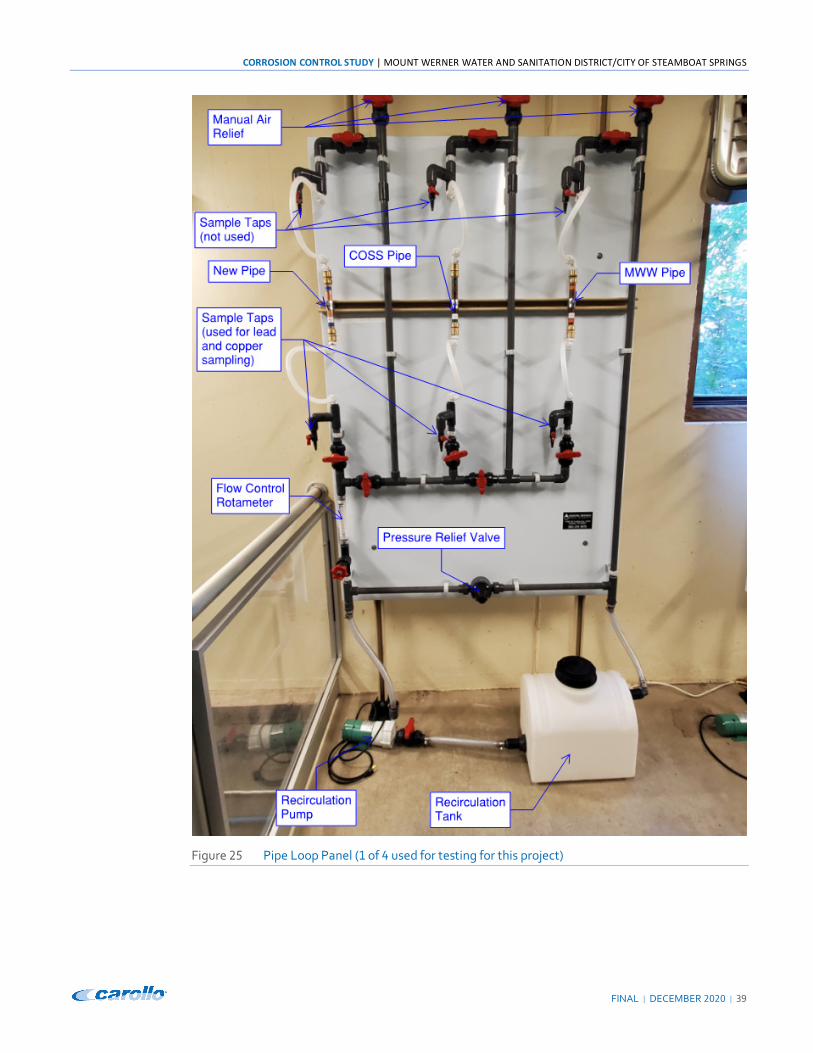
There were four testing panels, each designated for a specific OCCT and included three pipe segments (new pipe, harvested MWW pipe, and harvested City of Steamboat Springs [COSS] pipe). The harvested pipe segments were cut into four equal lengths and installed in each panel so that the original direction of flow was maintained. The new copper pipe (specifically purchased for the project and not harvested from either distribution system) was also cut into segments and installed on each panel. Figure 24 shows the pipe loop testing panels installed at the FCFP. Figure 25 shows details of the pipe loop panel construction.

MOUNT WERNER WATER AND SANITATION DISTRICT/CITY OF STEAMBOAT SPRINGS | CORROSION CONTROL STUDY
38 | DECEMBER 2020 | FINAL
Figure 24 Pipe Loop Panel Area
CORROSION CONTROL STUDY | MOUNT WERNER WATER AND SANITATION DISTRICT/CITY OF STEAMBOAT SPRINGS
FINAL | DECEMBER 2020 | 39
Figure 25 Pipe Loop Panel (1 of 4 used for testing for this project)

MOUNT WERNER WATER AND SANITATION DISTRICT/CITY OF STEAMBOAT SPRINGS | CORROSION CONTROL STUDY
40 | DECEMBER 2020 | FINAL
5.2.2 Corrosion Control Alternatives
Three OCCT alternatives were evaluated in the pipe loop panels tested at the FCFP. Two of the panels tested chemical stabilization alternatives to reduce water corrosivity, and the third approach was to add orthophosphate (phosphoric acid) as a corrosion inhibitor. Table 15 outlines the treatment used in each panel.
Table 15 Pipe Loop Panel Summary
Panel Treatment
Panel 1 Baseline panel with FCFP finished water. No corrosion control treatment.
Panel 2 Caustic Soda for alkalinity addition and CO2 for pH trimming.
Panel 3 Calcium carbonate contacting and CO2 for pH trimming.
Panel 4 Orthophosphate addition (with phosphoric acid) and caustic soda for pH trimming.
On a weekly basis, FCFP finished water was collected for testing in each panel. The chemistry was adjusted for the various panels and each was operated in both recirculation and stagnation regimes.
5.2.2.1 Caustic Soda and Carbon Dioxide
Panel 2 tested chemical stabilization with sodium hydroxide (also known as caustic soda) to increase finished water pH and alkalinity. For pipe loop batching, the recirculation tank was filled with a known volume of FCFP finished water. A 50 percent by weight caustic soda solution was then added to achieve the target pH, depending on the testing period. The addition of caustic soda resulted in elevated pH values above 10, so CO2 was also used to bring the final pH back down to the target level before testing. The CO2 was added through a commercially available bubble diffuser (designed for pH adjustment in fish tanks).
5.2.2.2 Calcium Carbonate Contactor
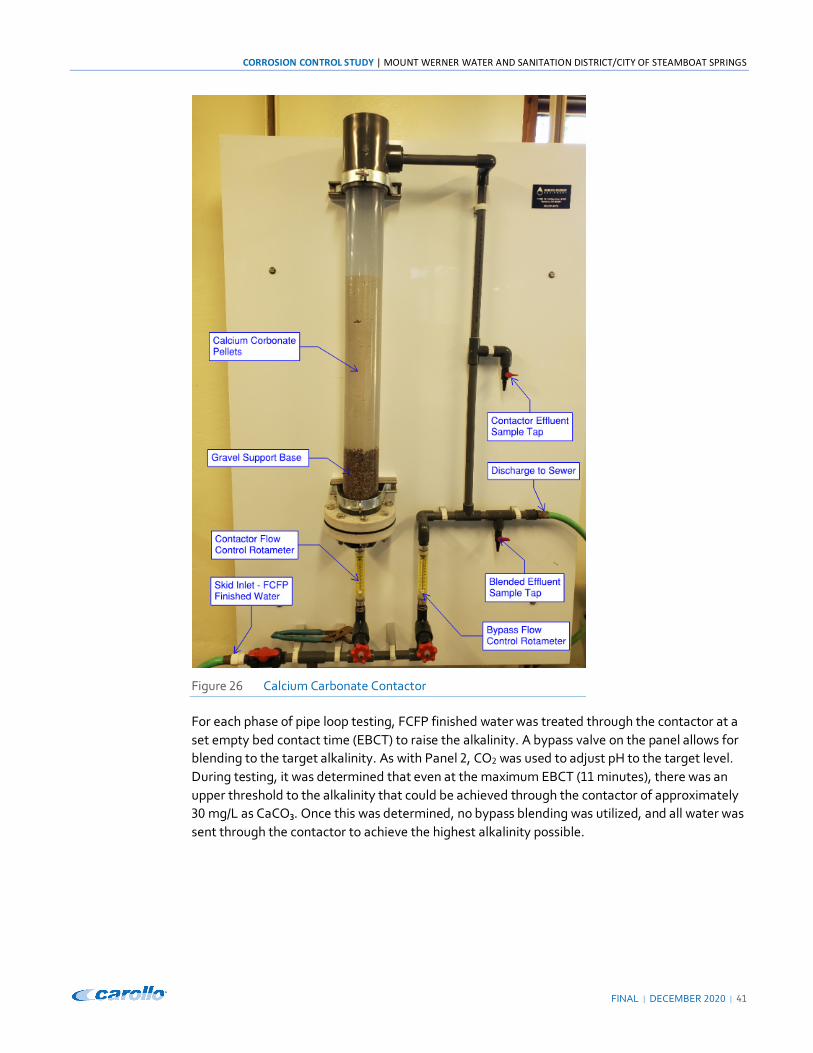
Panel 3 tested a chemical stabilization approach with a calcium carbonate (i.e., calcite) contactor. For this panel, the FCFP finished water was first run through the calcium contactor pilot shown in Figure 26.
CORROSION CONTROL STUDY | MOUNT WERNER WATER AND SANITATION DISTRICT/CITY OF STEAMBOAT SPRINGS
FINAL | DECEMBER 2020 | 41
Figure 26 Calcium Carbonate Contactor
For each phase of pipe loop testing, FCFP finished water was treated through the contactor at a set empty bed contact time (EBCT) to raise the alkalinity. A bypass valve on the panel allows for blending to the target alkalinity. As with Panel 2, CO2 was used to adjust pH to the target level. During testing, it was determined that even at the maximum EBCT (11 minutes), there was an upper threshold to the alkalinity that could be achieved through the contactor of approximately 30 mg/L as CaCO₃. Once this was determined, no bypass blending was utilized, and all water was sent through the contactor to achieve the highest alkalinity possible.

MOUNT WERNER WATER AND SANITATION DISTRICT/CITY OF STEAMBOAT SPRINGS | CORROSION CONTROL STUDY
42 | DECEMBER 2020 | FINAL
5.2.2.3 Orthophosphate Addition
Panel 4 tested the phosphate-based corrosion control alternative. A 10 percent by weight phosphoric acid solution was added to FCFP finished water at set doses. Since orthophosphate is most effective at pH values between 7.2 and 7.8, caustic soda was added to bring the pH back up to a target of 7.5. The dose of orthophosphate was incrementally increased in each phase of testing.
5.2.3 Testing Plan and Sampling Protocol
Pipe loop testing was split into five phases as outlined in Table 16.
Table 16 Pipe Loop Testing
Testing Phase Week
Panel 1 Baseline
Panel 2(1)
Caustic Soda and CO2
Panel 3(1)
CaCO₃ Contactor and CO2
Panel 4 Orthophosphate
1
1 Potable Water Potable Water Potable Water Potable Water
2 Potable Water Potable Water Potable Water Potable Water
3 Potable Water Potable Water Potable Water Potable Water
Chemical Adjustment for OCCT pH Alkalinity (mg/L as CaCO₃)(3)
pH Alkalinity (mg/L as CaCO₃)(3)
pH PO4 Dose (mg/L as
PO4)
2
4 Potable Water 8.5 14.7 8.5 17.5 7.5 1.0
5 Potable Water 8.5 15.0 8.5 13.0 7.5 1.0
6(2) Potable Water 8.5 18.2 8.5 25.1 7.5 1.0
3
7 Potable Water 8.5 30 8.5 35.0 7.5 1.0
8 Potable Water 8.5 60 8.5 25.0 7.5 1.0
9 Potable Water 8.5 50 8.5 22.5 7.5 1.0
10 Potable Water 8.5 72.5 8.5 30.0 7.5 1.0
4 11 Potable Water 8.8 60.0 8.8 30.0 7.5 2.0
12 Potable Water 8.8 70.0 8.8 20.0 7.5 2.0
5
13 Potable Water 8.8 90.0 8.8 35.0 7.5 3.0
14 Potable Water 8.8 100 8.8 30.0 7.5 3.0
15 Potable Water 8.8 105 8.8 25 7.5 3.0 Notes: (1) For Phase 2, no CO2 was added to Panel 2 or Panel 3 for pH adjustment. The caustic soda dose or calcite contactor was set
to achieve a pH of 8.5 with no target alkalinity. (2) No lead or copper sampling was done during testing Week 6 because some troubleshooting issues with Panel 2 and
Panel 3 were being resolved. (3) Measured alkalinity.
For Phase 1 FCFP finished water was recirculated in all panels with no corrosion control treatment to establish the baseline water quality parameters for each panel. Panel 1 continued to be tested with only potable water through all phases of testing to serve as a control with no corrosion control treatment.
For Phase 2, the water for Panel 2 and Panel 3 were adjusted to achieve the target pH of 8.5. This was done by only using caustic soda (Panel 2) and operating the calcite contactor with bypass blending (Panel 3). No CO2 was added to either panel during this period, which resulted in
CORROSION CONTROL STUDY | MOUNT WERNER WATER AND SANITATION DISTRICT/CITY OF STEAMBOAT SPRINGS
FINAL | DECEMBER 2020 | 43
minimal increase in alkalinity (below the initial target of 30 mg/L as CaCO₃) and significant pH stability challenges. Based on these initial results, it was determined that higher alkalinities were required to maintain pH stability at the target pH values between 8.5 and 8.8 in these panels.
Based on the results of the preliminary testing, the approach was changed for Phase 3 to focus on a target alkalinity in Panels 2 and 3 with CO2 addition to bring the pH back down to the target of 8.5. As noted above, the maximum alkalinity which could be achieved through the calcium carbonate contactor with no bypass blending was approximately 30 mg/L as CaCO₃. Thus, for Phase 3, Panel 3 was batched with all flow treated through the calcite contactor (no bypass blending) and CO2 was used to adjust the pH to 8.5. For Phase 4 and Phase 5, a similar approach was taken for Panel 2 and Panel 3, with the target pH at 8.8.
For Panel 4, the orthophosphate target dose was 1 mg/L as phosphorus for Phase 2 and Phase 3. This was raised to 2 mg/L as phosphorus for Phase 4 and 3 mg/L as P for Phase 5. Through all testing phases (with the exception of baseline testing in Phase 1), caustic soda was used to adjust the pH up to 7.5 after phosphoric acid addition.
The typical pipe loop operation for a given week was to drain the tanks and panels and create new batches of water for each panel. The recirculation pumps would operate for a full day and water quality parameters in the tanks would be monitored. Then the pumps would be turned off and the panels would remain stagnant for a full day before the lead and copper samples were collected from the sample port for each pipe segment and sent to the lab for analysis. After sampling the pumps were turned on and water quality parameters (i.e., pH and alkalinity) were monitored for the remainder of the week.
5.3 Pipe Loop Testing Results
5.3.1 pH Stability and Alkalinity
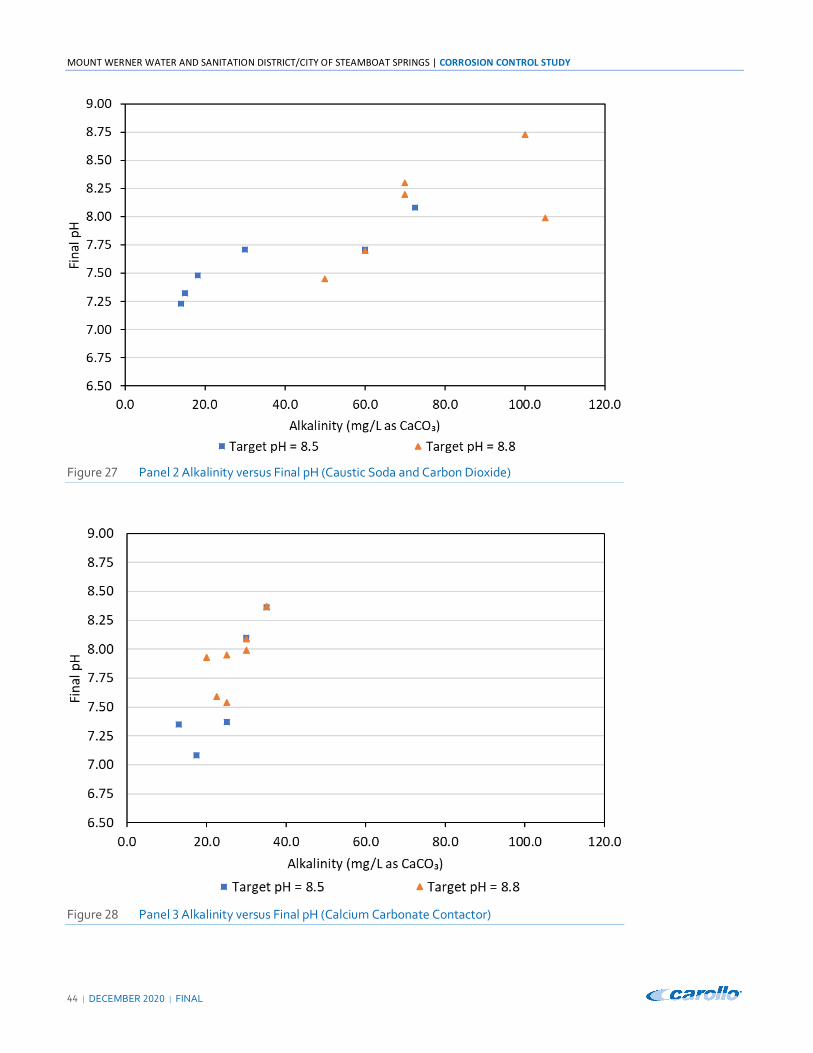
As observed in the historic water quality data, pH stability has been a challenge throughout the distribution system. In Phase 2, Panel 2 and Panel 3 were not able to maintain the target pH of 8.5 as the day after batching the pH would be back down to approximately 7.3 - 7.7. For subsequent testing phases the alkalinity targets were the initial adjustment approach with CO2 pH trim. Increasing alkalinity above 30 mg/L as CaCO₃ was necessary in Phase 3 through Phase 5 to maintain the target pH values. Figures 27 and 28 show how alkalinity impacted final pH. It did not appear that changing the starting pH from 8.5 to 8.8 had any impact on the final pH for either of these panels. For Panel 2, in order to maintain a pH above 8, the alkalinity needed to be at least 50 mg/L as CaCO₃.Although the maximum alkalinity which could be achieved in the calcium contactor for Panel 3 was approximately 30 mg/L as CaCO₃, maintaining the final pH above 8 was achievable, likely due to the increase in DIC (carbonate addition).
MOUNT WERNER WATER AND SANITATION DISTRICT/CITY OF STEAMBOAT SPRINGS | CORROSION CONTROL STUDY
44 | DECEMBER 2020 | FINAL
Figure 27 Panel 2 Alkalinity versus Final pH (Caustic Soda and Carbon Dioxide)
Figure 28 Panel 3 Alkalinity versus Final pH (Calcium Carbonate Contactor)

CORROSION CONTROL STUDY | MOUNT WERNER WATER AND SANITATION DISTRICT/CITY OF STEAMBOAT SPRINGS
FINAL | DECEMBER 2020 | 45
The pH of Panel 4 also dropped from the starting value of 7.5 during every week of testing. The range of final pH values for this panel was 7.00 to 7.45. Very little alkalinity was added when caustic soda was added to raise the pH to 7.5, as shown by Figure 29. In this case, slight addition of alkalinity did not seem to impact the final pH for this panel.
Figure 29 Panel 4 Alkalinity versus Final pH (Orthophosphate Addition with Caustic Soda pH Trim)
5.3.2 Lead and Copper Sampling
Weekly lead and copper samples were taken from each of the three pipes on each panel throughout testing. One round of sampling was done during Phase 1 to establish the baseline lead and copper concentrations for each panel. Also, no lead or copper samples were taken during the final week of Phase 2 because other issues with Panel 2 and Panel 3 were being resolved during that time. The following sections present the results of the lead and copper data.
5.3.2.1 Copper Sampling and Analysis
Figure 30, Figure 31, and Figure 32 show the total copper concentration results for the new pipe, COSS pipe, and MWW pipe in each panel.

MOUNT WERNER WATER AND SANITATION DISTRICT/CITY OF STEAMBOAT SPRINGS | CORROSION CONTROL STUDY
46 | DECEMBER 2020 | FINAL
Figure 30 New Pipe Total Copper Sampling Results
Figure 31 COSS Pipe Total Copper Sampling Results

CORROSION CONTROL STUDY | MOUNT WERNER WATER AND SANITATION DISTRICT/CITY OF STEAMBOAT SPRINGS
FINAL | DECEMBER 2020 | 47
Figure 32 MWW Pipe Total Copper Sampling Results
These results illustrate that the copper concentration of the baseline (Panel 1) fluctuated some throughout pipe loop testing. Based on the testing results, all three of the OCCT options were effective at reducing the total copper concentrations in all three pipe segments compared to the current (baseline) conditions. The addition of caustic soda (Panel 2) or orthophosphate (Panel 4) were the most effective treatment approaches based on results from the harvested pipes from the City and District systems. The calcium carbonate contactor treatment also reduced the total copper concentration; however, this appears to be most effective in Phase 4 and Phase 5 when the target pH was set at 8.8. In general, the reduction of total copper produced by each the of alternative treatments was more apparent in the pipe segments harvested from the distribution system than in the new pipe segment.
As shown by Figures 33, 34, and 35, the results for dissolved copper were very similar to those of total copper. All of the copper samples taken in this Study were significantly below the LCR action level concentration of 1,300 micrograms per liter (µg/L).

MOUNT WERNER WATER AND SANITATION DISTRICT/CITY OF STEAMBOAT SPRINGS | CORROSION CONTROL STUDY
48 | DECEMBER 2020 | FINAL
Figure 33 New Pipe Dissolved Copper Sampling Results
Figure 34 COSS Pipe Dissolved Copper Sampling Results
CORROSION CONTROL STUDY | MOUNT WERNER WATER AND SANITATION DISTRICT/CITY OF STEAMBOAT SPRINGS
FINAL | DECEMBER 2020 | 49
Figure 35 MWW Pipe Dissolved Copper Sampling Results
5.3.2.2 Lead Sampling and Analysis
Figures 36, 37, and 38 show the total lead concentration results for the new pipe, COSS pipe, and MWW pipe in each panel.
Figure 36 New Pipe Total Lead Sampling Results
MOUNT WERNER WATER AND SANITATION DISTRICT/CITY OF STEAMBOAT SPRINGS | CORROSION CONTROL STUDY
50 | DECEMBER 2020 | FINAL
Figure 37 COSS Pipe Total Lead Sampling Results
Figure 38 MWW Pipe Total Lead Sampling Results
In general, baseline lead concentrations were low so the impact of treatment on lead reduction was less pronounced than that of copper. Nevertheless, all three OCCT alternatives demonstrated the ability to maintain low lead levels even when the baseline lead levels spiked. Of these alternatives, caustic soda addition (Panel 2) appears to be the most effective approach to consistently produce low (or non-detect) lead levels. The calcium carbonate contactor (Panel 3) was also effective; however, the results of that treatment are more volatile and inconsistent. Orthophosphate addition was also effective; however, it does not appear to be as effective as caustic and CO2 addition and occasionally produced higher lead concentrations than
CORROSION CONTROL STUDY | MOUNT WERNER WATER AND SANITATION DISTRICT/CITY OF STEAMBOAT SPRINGS
FINAL | DECEMBER 2020 | 51
the baseline control, even when applied at higher doses – this is particularly evident in the COSS pipe results shown in Figure 37 (in some September and October samples).
As shown by Figures 39, 40, and 41, the results for dissolved lead were very similar to those of total lead.
Figure 39 New Pipe Dissolved Lead Sampling Results
Figure 40 COSS Pipe Dissolved Lead Sampling Results

MOUNT WERNER WATER AND SANITATION DISTRICT/CITY OF STEAMBOAT SPRINGS | CORROSION CONTROL STUDY
52 | DECEMBER 2020 | FINAL
Figure 41 MWW Pipe Dissolved Lead Sampling Results
None of the lead samples taken in this Study were above the LCR action level concentration of 15 µg/L, nor were there any concentrations higher than the LCRR trigger level of 10 µg/L. Occasional spikes were observed with each of the treatment alternatives; however, these generally never went higher than 4 to 5 µg/L.
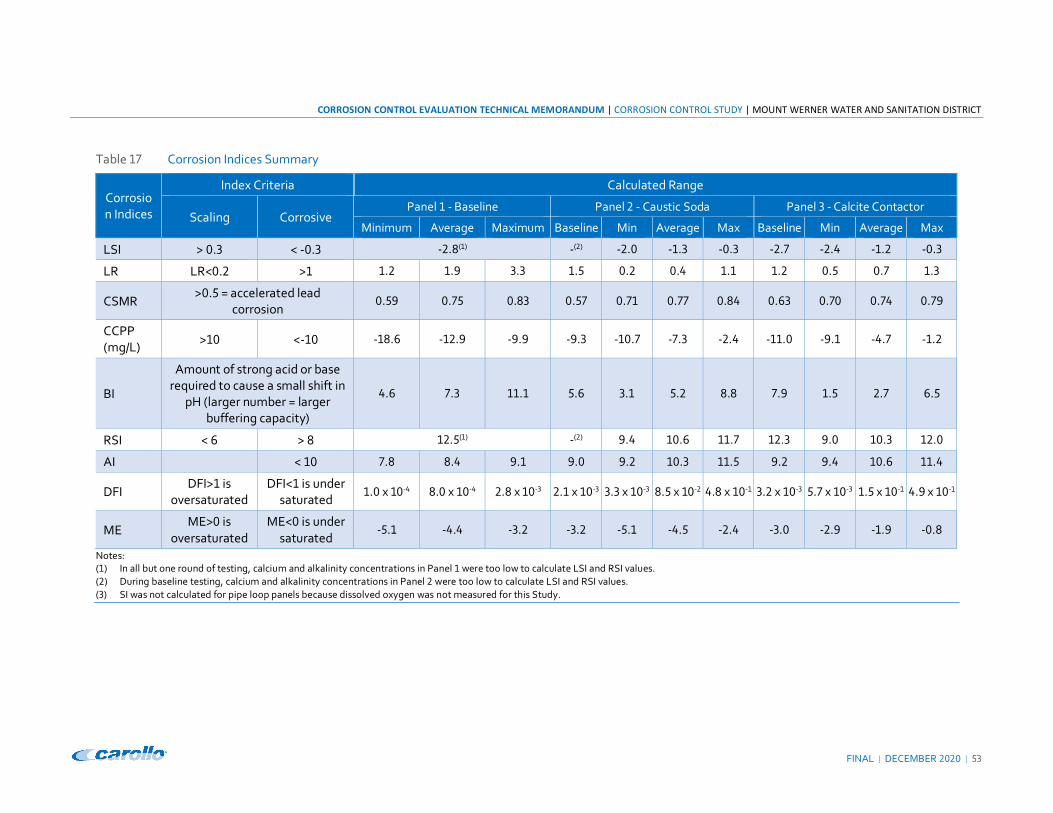
5.3.3 Corrosion Indices
Water quality data measured from the pipe loop panels was used to calculate the various corrosion indices previously described in this report. Table 17 outlines the results of this analysis.
CORROSION CONTROL EVALUATION TECHNICAL MEMORANDUM | CORROSION CONTROL STUDY | MOUNT WERNER WATER AND SANITATION DISTRICT
FINAL | DECEMBER 2020 | 53
Table 17 Corrosion Indices Summary
Corrosion Indices
Index Criteria Calculated Range
Scaling Corrosive Panel 1 - Baseline Panel 2 - Caustic Soda Panel 3 - Calcite Contactor
Minimum Average Maximum Baseline Min Average Max Baseline Min Average Max
LSI > 0.3 < -0.3 -2.8(1) -(2) -2.0 -1.3 -0.3 -2.7 -2.4 -1.2 -0.3
LR LR<0.2 >1 1.2 1.9 3.3 1.5 0.2 0.4 1.1 1.2 0.5 0.7 1.3
CSMR >0.5 = accelerated lead
corrosion 0.59 0.75 0.83 0.57 0.71 0.77 0.84 0.63 0.70 0.74 0.79
CCPP (mg/L) >10 <-10 -18.6 -12.9 -9.9 -9.3 -10.7 -7.3 -2.4 -11.0 -9.1 -4.7 -1.2
BI
Amount of strong acid or base required to cause a small shift in
pH (larger number = larger buffering capacity)
4.6 7.3 11.1 5.6 3.1 5.2 8.8 7.9 1.5 2.7 6.5
RSI < 6 > 8 12.5(1) -(2) 9.4 10.6 11.7 12.3 9.0 10.3 12.0
AI < 10 7.8 8.4 9.1 9.0 9.2 10.3 11.5 9.2 9.4 10.6 11.4
DFI DFI>1 is
oversaturated DFI<1 is under
saturated 1.0 x 10⁻⁴ 8.0 x 10⁻⁴ 2.8 x 10⁻³ 2.1 x 10⁻³ 3.3 x 10⁻³ 8.5 x 10⁻² 4.8 x 10⁻¹ 3.2 x 10⁻³ 5.7 x 10⁻³ 1.5 x 10⁻¹ 4.9 x 10⁻¹
ME ME>0 is
oversaturated ME<0 is under
saturated -5.1 -4.4 -3.2 -3.2 -5.1 -4.5 -2.4 -3.0 -2.9 -1.9 -0.8
Notes: (1) In all but one round of testing, calcium and alkalinity concentrations in Panel 1 were too low to calculate LSI and RSI values. (2) During baseline testing, calcium and alkalinity concentrations in Panel 2 were too low to calculate LSI and RSI values. (3) SI was not calculated for pipe loop panels because dissolved oxygen was not measured for this Study.
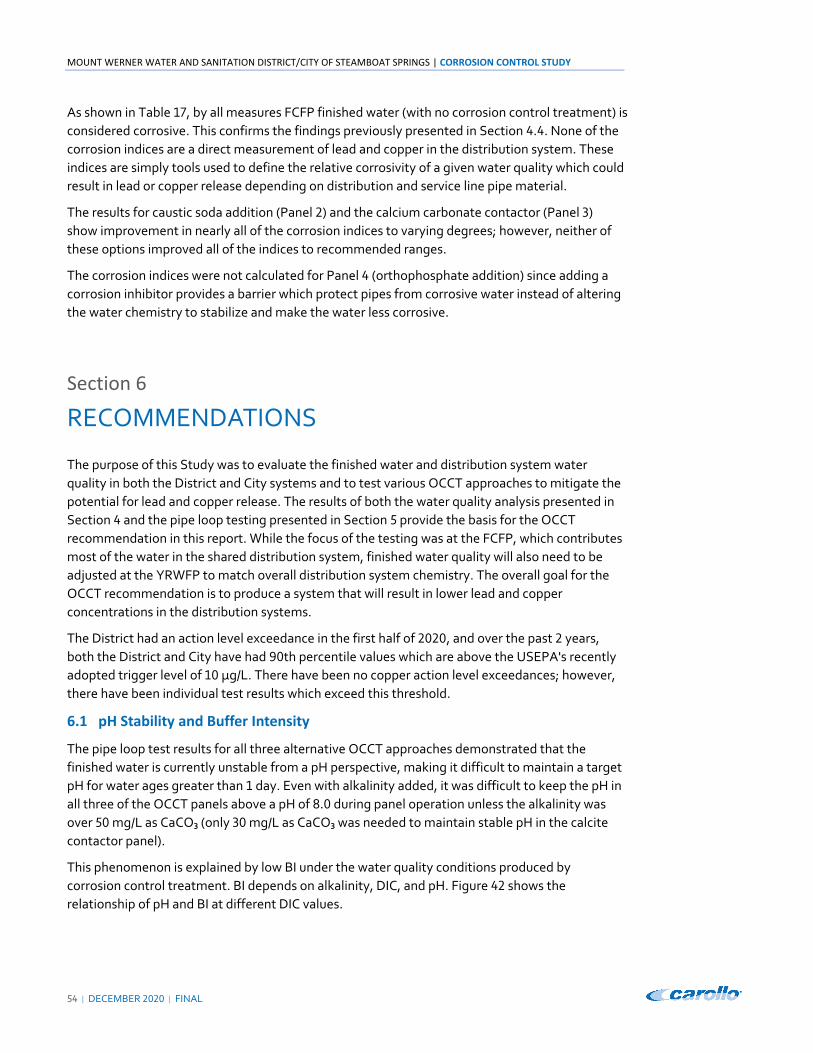
MOUNT WERNER WATER AND SANITATION DISTRICT/CITY OF STEAMBOAT SPRINGS | CORROSION CONTROL STUDY
54 | DECEMBER 2020 | FINAL
As shown in Table 17, by all measures FCFP finished water (with no corrosion control treatment) is
considered corrosive. This confirms the findings previously presented in Section 4.4. None of the
corrosion indices are a direct measurement of lead and copper in the distribution system. These
indices are simply tools used to define the relative corrosivity of a given water quality which could
result in lead or copper release depending on distribution and service line pipe material.
The results for caustic soda addition (Panel 2) and the calcium carbonate contactor (Panel 3)
show improvement in nearly all of the corrosion indices to varying degrees; however, neither of
these options improved all of the indices to recommended ranges.
The corrosion indices were not calculated for Panel 4 (orthophosphate addition) since adding a
corrosion inhibitor provides a barrier which protect pipes from corrosive water instead of altering
the water chemistry to stabilize and make the water less corrosive.
Section 6
RECOMMENDATIONS
The purpose of this Study was to evaluate the finished water and distribution system water
quality in both the District and City systems and to test various OCCT approaches to mitigate the
potential for lead and copper release. The results of both the water quality analysis presented in
Section 4 and the pipe loop testing presented in Section 5 provide the basis for the OCCT
recommendation in this report. While the focus of the testing was at the FCFP, which contributes
most of the water in the shared distribution system, finished water quality will also need to be
adjusted at the YRWFP to match overall distribution system chemistry. The overall goal for the
OCCT recommendation is to produce a system that will result in lower lead and copper
concentrations in the distribution systems.
The District had an action level exceedance in the first half of 2020, and over the past 2 years,
both the District and City have had 90th percentile values which are above the USEPA's recently
adopted trigger level of 10 µg/L. There have been no copper action level exceedances; however,
there have been individual test results which exceed this threshold.
6.1 pH Stability and Buffer Intensity
The pipe loop test results for all three alternative OCCT approaches demonstrated that the
finished water is currently unstable from a pH perspective, making it difficult to maintain a target
pH for water ages greater than 1 day. Even with alkalinity added, it was difficult to keep the pH in
all three of the OCCT panels above a pH of 8.0 during panel operation unless the alkalinity was
over 50 mg/L as CaCO₃ (only 30 mg/L as CaCO₃ was needed to maintain stable pH in the calcite
contactor panel).
This phenomenon is explained by low BI under the water quality conditions produced by
corrosion control treatment. BI depends on alkalinity, DIC, and pH. Figure 42 shows the
relationship of pH and BI at different DIC values.
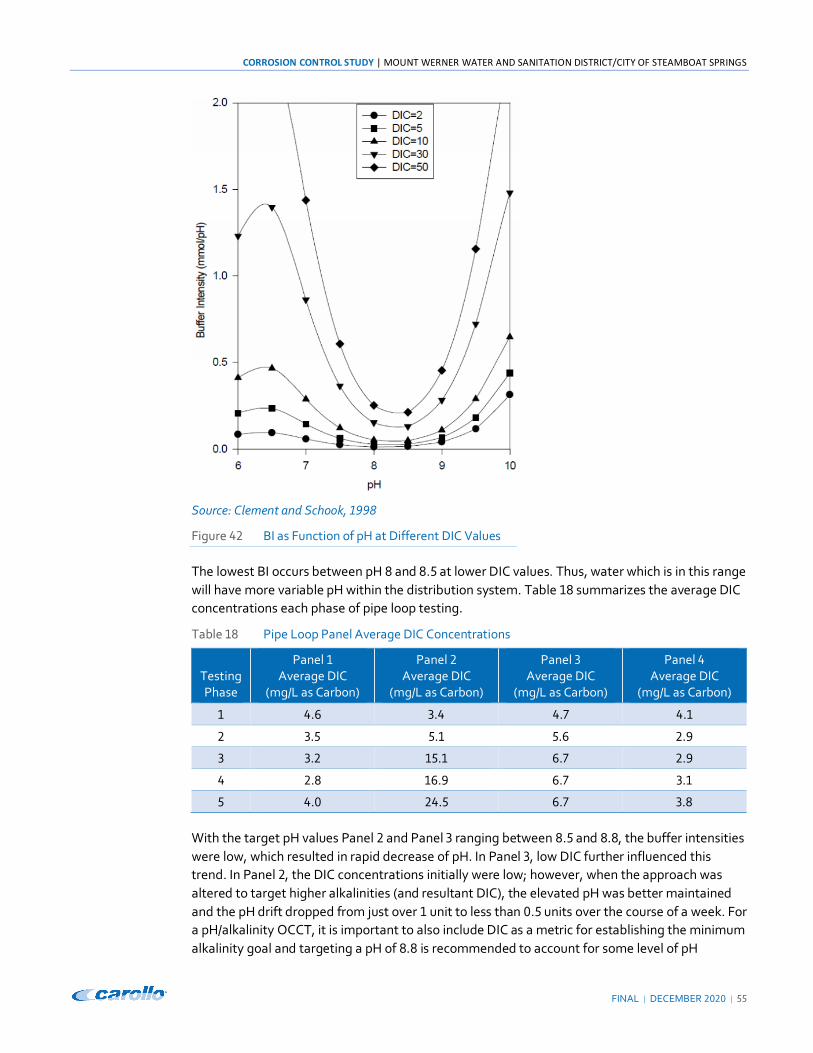
CORROSION CONTROL STUDY | MOUNT WERNER WATER AND SANITATION DISTRICT/CITY OF STEAMBOAT SPRINGS
FINAL | DECEMBER 2020 | 55
Source: Clement and Schook, 1998
Figure 42 BI as Function of pH at Different DIC Values
The lowest BI occurs between pH 8 and 8.5 at lower DIC values. Thus, water which is in this range will have more variable pH within the distribution system. Table 18 summarizes the average DIC concentrations each phase of pipe loop testing.
Table 18 Pipe Loop Panel Average DIC Concentrations
Testing Phase
Panel 1 Average DIC
(mg/L as Carbon)
Panel 2 Average DIC
(mg/L as Carbon)
Panel 3 Average DIC
(mg/L as Carbon)
Panel 4 Average DIC
(mg/L as Carbon)
1 4.6 3.4 4.7 4.1
2 3.5 5.1 5.6 2.9
3 3.2 15.1 6.7 2.9
4 2.8 16.9 6.7 3.1
5 4.0 24.5 6.7 3.8
With the target pH values Panel 2 and Panel 3 ranging between 8.5 and 8.8, the buffer intensities were low, which resulted in rapid decrease of pH. In Panel 3, low DIC further influenced this trend. In Panel 2, the DIC concentrations initially were low; however, when the approach was altered to target higher alkalinities (and resultant DIC), the elevated pH was better maintained and the pH drift dropped from just over 1 unit to less than 0.5 units over the course of a week. For a pH/alkalinity OCCT, it is important to also include DIC as a metric for establishing the minimum alkalinity goal and targeting a pH of 8.8 is recommended to account for some level of pH

MOUNT WERNER WATER AND SANITATION DISTRICT/CITY OF STEAMBOAT SPRINGS | CORROSION CONTROL STUDY
56 | DECEMBER 2020 | FINAL
decrease throughout the distribution system. Lead and copper concentrations from the pipe loop panels remained low and stable throughout the testing, suggesting that increasing the pH/alkalinity/DIC from the baseline (current) water quality was important, but significantly increasing the DIC above 10 mg/L as carbon is not necessary to achieve the goal of the OCCT which is to reduce lead and copper dissolution.
In order to maintain a stable pH in the distribution system and mitigate corrosivity, the recommended corrosion control treatment is to increase alkalinity to 50 mg/L as CaCO₃ in order to maintain a minimum DIC of 10 mg/L as carbon. Of the approaches evaluated in this Study caustic soda coupled with CO2 addition was the most effective treatment approach to achieve these water quality parameters while maintaining low lead and copper concentrations.
6.2 Corrosion Control Treatment
The USEPA OCCT Evaluation Technical Recommendations (USEPA, 2016) includes decision flowcharts for selecting the optimal corrosion control treatment approach. Figure 43 illustrates the decision flow based on the existing finished water quality in the District and City distribution systems (Flowchart 1a) which is applicable to water with pH less than 7.2.
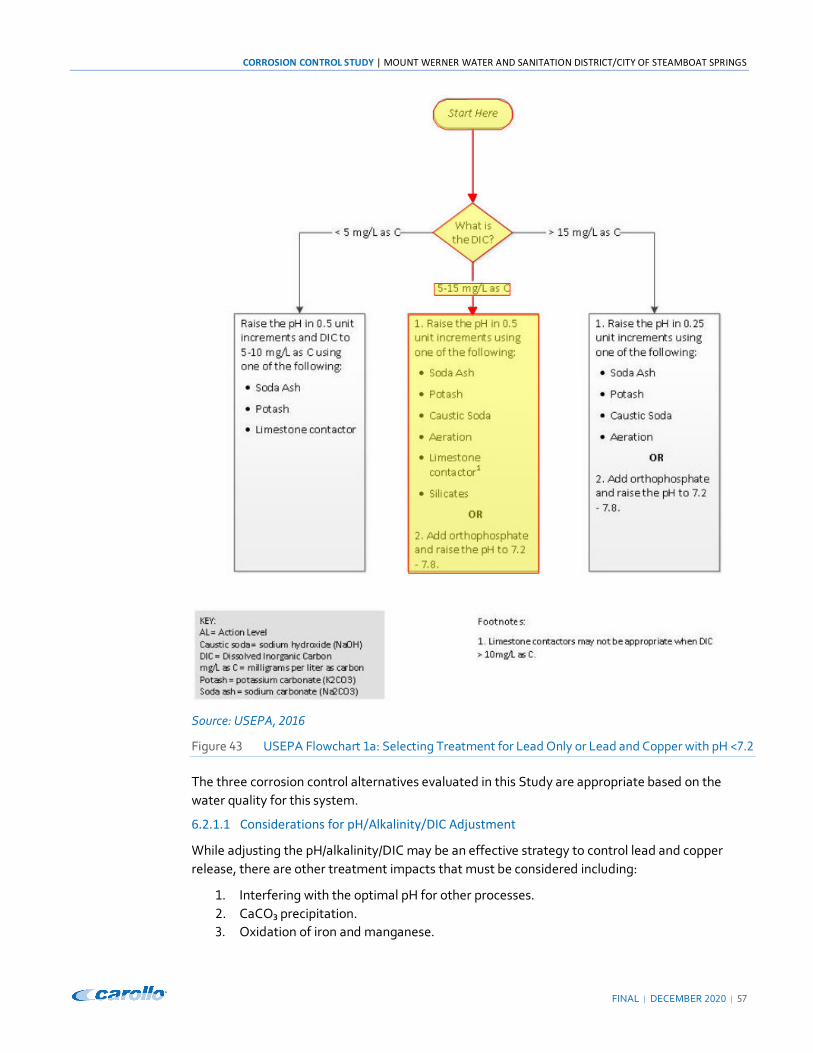
CORROSION CONTROL STUDY | MOUNT WERNER WATER AND SANITATION DISTRICT/CITY OF STEAMBOAT SPRINGS
FINAL | DECEMBER 2020 | 57
Source: USEPA, 2016
Figure 43 USEPA Flowchart 1a: Selecting Treatment for Lead Only or Lead and Copper with pH <7.2
The three corrosion control alternatives evaluated in this Study are appropriate based on the water quality for this system.
6.2.1.1 Considerations for pH/Alkalinity/DIC Adjustment
While adjusting the pH/alkalinity/DIC may be an effective strategy to control lead and copper release, there are other treatment impacts that must be considered including:
1. Interfering with the optimal pH for other processes. 2. CaCO₃ precipitation. 3. Oxidation of iron and manganese.
MOUNT WERNER WATER AND SANITATION DISTRICT/CITY OF STEAMBOAT SPRINGS | CORROSION CONTROL STUDY
58 | DECEMBER 2020 | FINAL
Optimal pH for Other Processes
Optimal pH ranges for processes such as coagulation and disinfection impact the location of pH and alkalinity adjustment. Alum coagulation is used at the FCFP and low raw water alkalinity results in coagulation challenges. A pH/alkalinity OCCT would be most efficiently implemented by adding caustic soda and CO2 prior to alum addition. Caustic soda would be added to achieve the alkalinity target (e.g., 45 mg/L as CaCO₃) followed by pH adjustment with CO2 to achieve the optimal alum coagulation range of 6 to 7. Additional caustic soda would be added to the finished water to reach the target finished water pH (e.g., 8.8) and would also contribute additional alkalinity to reach the finished water target of 50 mg/L as CaCO₃.
The location of finished water pH adjustment must also consider how contact time (CT) is achieved for Giardia and virus inactivation with free chlorine. At both the FCFP and YRWFP, the ideal location for caustic soda addition would be downstream of disinfection because Giardia inactivation requires significantly more CT at higher pH.
Because the YRWFP has higher alkalinity (greater than 40 mg/L as CaCO₃) compared to the FCFP, calculations show that only caustic soda is needed to increase finished water pH to match the FCFP target while maintaining the alkalinity/DIC target. Thus, no CO2 addition would be required at this facility to trim pH. The YRWFP uses a combination of UV disinfection (for Giardia inactivation) and free chlorine for virus, there are several options for where caustic soda could be added to achieve the target pH. The initial recommendation is to add caustic soda in the finished water pump station clearwell, downstream of the chlorine contact tank.
While increasing the finished water pH could also have impacts on the distribution system, trihalomethanes (THM) are currently low in both the District and City distribution systems and it is not anticipated that increased pH would create any disinfection byproduct (DBP) issues. Higher pH can help to maintain the disinfectant residual as it slows the reaction rate with metals released. Changes in pH can also impact the formation of DBPs as THM formation tends to increase at elevated pH while haloacetic acid (HAA) formation tends to decrease. Significant changes to the system should be implemented gradually to monitor and mitigate unintended impacts to water quality.
Calcium Carbonate Precipitation
In waters with high hardness (specifically calcium hardness) raising the pH and DIC can cause CaCO₃ to precipitate in the distribution system and cause issues with scaling on plumbing fixtures. The LSI, CCPP, and therefore hardness of the FCFP and YRWFP finished water are extremely low and have been calculated to be below a concentration which could present issues with scaling. Based on the data analyzed for this Study, raising the pH will not result in CaCO₃ scaling in the distribution system.
Oxidation of Iron and Manganese
Iron and manganese are not present at high levels in the finished water or distribution system so oxidation of iron and manganese in distribution system piping is not anticipated for this system.
6.2.1.2 Limitations of Phosphate-Based Corrosion Inhibitors
Two factors which could impact the ability for corrosion inhibitors to be used are: 1) reactions with aluminum, and 2) impacts on wastewater.

CORROSION CONTROL STUDY | MOUNT WERNER WATER AND SANITATION DISTRICT/CITY OF STEAMBOAT SPRINGS
FINAL | DECEMBER 2020 | 59
Reactions with Aluminum
Although aluminum carryover from the alum used in the coagulation process is not considered a concern as low doses are used at the FCFP based on the relatively high-quality raw water treated at this facility. The YRWFP is a greensand treatment process that does not include alum addition or coagulation. Because aluminum concentrations in the system are low, aluminum phosphate precipitation is not expected to be an issue.
Impacts on Wastewater Treatment
The use of orthophosphate-based corrosion inhibitors in the drinking water system will increase phosphorus loading as the City and District both feed the Steamboat Springs Wastewater Treatment Plant. The facility does not currently have a phosphorus discharge limit; however, it is anticipated to be added as part of the next permit renewal cycle in accordance with Regulation 31. The current treatment process is capable of removing some phosphorus in the system (approximately 50 percent); however, the current process may be challenged to meet future effluent limits and does not have the capacity to accommodate additional phosphorus loading without additional treatment. As nutrient regulations become more stringent for receiving waters throughout the state, additional phosphorus treatment (either biological or chemical) would be required as a result of an orthophosphate based OCCT.
6.3 Optimal Corrosion Control Treatment Recommendation
The pH instability observed during the pipe loop testing can be attributed to the low DIC of the water, and is believed to be the primary factor leading to the overall corrosive nature of the water in the system. It is recommended that the OCCT goal for this system should be to maintain a DIC of at least 10 mg/L as carbon. Since DIC is not a straight-forward parameter for treatment plant control, a combination of pH and alkalinity adjustment are recommended as the OCCT water quality parameters for the District and City systems. Specifically, the system should operate as follows:
• Target a minimum alkalinity of 50 mg/L as CaCO₃ to maintain the DIC at or above 10 mg/L as carbon.
• Target pH of the finished water leaving the two treatment plants of 8.8.
To achieve the finished water quality targets for the recommended OCCT, the addition of a caustic soda and a CO2 system at the FCFP is recommended. At the YRWFP, finished water meets the minimum alkalinity target of 50 mg/L as CaCO₃ most of the time and the DIC is always greater than 10 mg/L as carbon, so only finished water pH adjustment to 8.8 is recommended. The pH adjustment at the YRWFP can be achieved with either the addition of caustic soda or a calcite contactor for pH adjustment. With either pH adjustment alternative, a CO2 system is not necessary at the YRWFP.
As demonstrated in the pipe loop testing, the pH/alkalinity OCCT approach has the ability to reduce lead and copper concentrations when compared to the current system. Although the orthophosphate OCCT also demonstrated improved lead and copper results compared to the current system, the pH/alkalinity produced better results during all phases of testing. In addition to lower lead and copper concentration, the implications for additional treatment required at the Steamboat Springs Wastewater Treatment Plant as well as the overall potential to increase phosphorus in the environment through an orthophosphate OCCT are reasons why the pH/alkalinity OCCT is recommended as a holistic approach to address lead and copper concerns for the District and City.
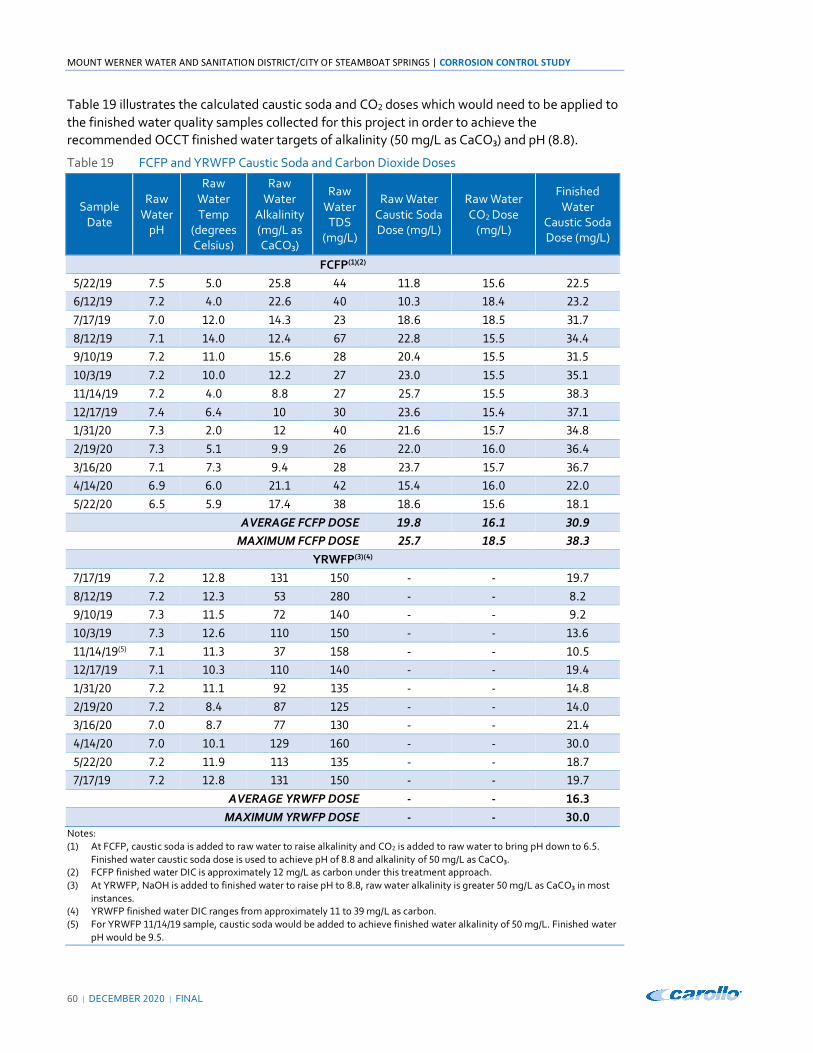
MOUNT WERNER WATER AND SANITATION DISTRICT/CITY OF STEAMBOAT SPRINGS | CORROSION CONTROL STUDY
60 | DECEMBER 2020 | FINAL
Table 19 illustrates the calculated caustic soda and CO2 doses which would need to be applied to the finished water quality samples collected for this project in order to achieve the recommended OCCT finished water targets of alkalinity (50 mg/L as CaCO₃) and pH (8.8).
Table 19 FCFP and YRWFP Caustic Soda and Carbon Dioxide Doses
Sample Date
Raw Water
pH
Raw Water Temp
(degrees Celsius)
Raw Water
Alkalinity (mg/L as CaCO₃)
Raw Water
TDS (mg/L)
Raw Water Caustic Soda Dose (mg/L)
Raw Water CO2 Dose
(mg/L)
Finished Water
Caustic Soda Dose (mg/L)
FCFP(1)(2) 5/22/19 7.5 5.0 25.8 44 11.8 15.6 22.5 6/12/19 7.2 4.0 22.6 40 10.3 18.4 23.2 7/17/19 7.0 12.0 14.3 23 18.6 18.5 31.7 8/12/19 7.1 14.0 12.4 67 22.8 15.5 34.4 9/10/19 7.2 11.0 15.6 28 20.4 15.5 31.5 10/3/19 7.2 10.0 12.2 27 23.0 15.5 35.1 11/14/19 7.2 4.0 8.8 27 25.7 15.5 38.3 12/17/19 7.4 6.4 10 30 23.6 15.4 37.1 1/31/20 7.3 2.0 12 40 21.6 15.7 34.8 2/19/20 7.3 5.1 9.9 26 22.0 16.0 36.4 3/16/20 7.1 7.3 9.4 28 23.7 15.7 36.7 4/14/20 6.9 6.0 21.1 42 15.4 16.0 22.0 5/22/20 6.5 5.9 17.4 38 18.6 15.6 18.1
AVERAGE FCFP DOSE 19.8 16.1 30.9 MAXIMUM FCFP DOSE 25.7 18.5 38.3
YRWFP(3)(4) 7/17/19 7.2 12.8 131 150 - - 19.7 8/12/19 7.2 12.3 53 280 - - 8.2 9/10/19 7.3 11.5 72 140 - - 9.2 10/3/19 7.3 12.6 110 150 - - 13.6 11/14/19(5) 7.1 11.3 37 158 - - 10.5 12/17/19 7.1 10.3 110 140 - - 19.4 1/31/20 7.2 11.1 92 135 - - 14.8 2/19/20 7.2 8.4 87 125 - - 14.0 3/16/20 7.0 8.7 77 130 - - 21.4 4/14/20 7.0 10.1 129 160 - - 30.0 5/22/20 7.2 11.9 113 135 - - 18.7 7/17/19 7.2 12.8 131 150 - - 19.7
AVERAGE YRWFP DOSE - - 16.3 MAXIMUM YRWFP DOSE - - 30.0
Notes: (1) At FCFP, caustic soda is added to raw water to raise alkalinity and CO2 is added to raw water to bring pH down to 6.5.
Finished water caustic soda dose is used to achieve pH of 8.8 and alkalinity of 50 mg/L as CaCO₃. (2) FCFP finished water DIC is approximately 12 mg/L as carbon under this treatment approach. (3) At YRWFP, NaOH is added to finished water to raise pH to 8.8, raw water alkalinity is greater 50 mg/L as CaCO₃ in most
instances. (4) YRWFP finished water DIC ranges from approximately 11 to 39 mg/L as carbon. (5) For YRWFP 11/14/19 sample, caustic soda would be added to achieve finished water alkalinity of 50 mg/L. Finished water
pH would be 9.5.
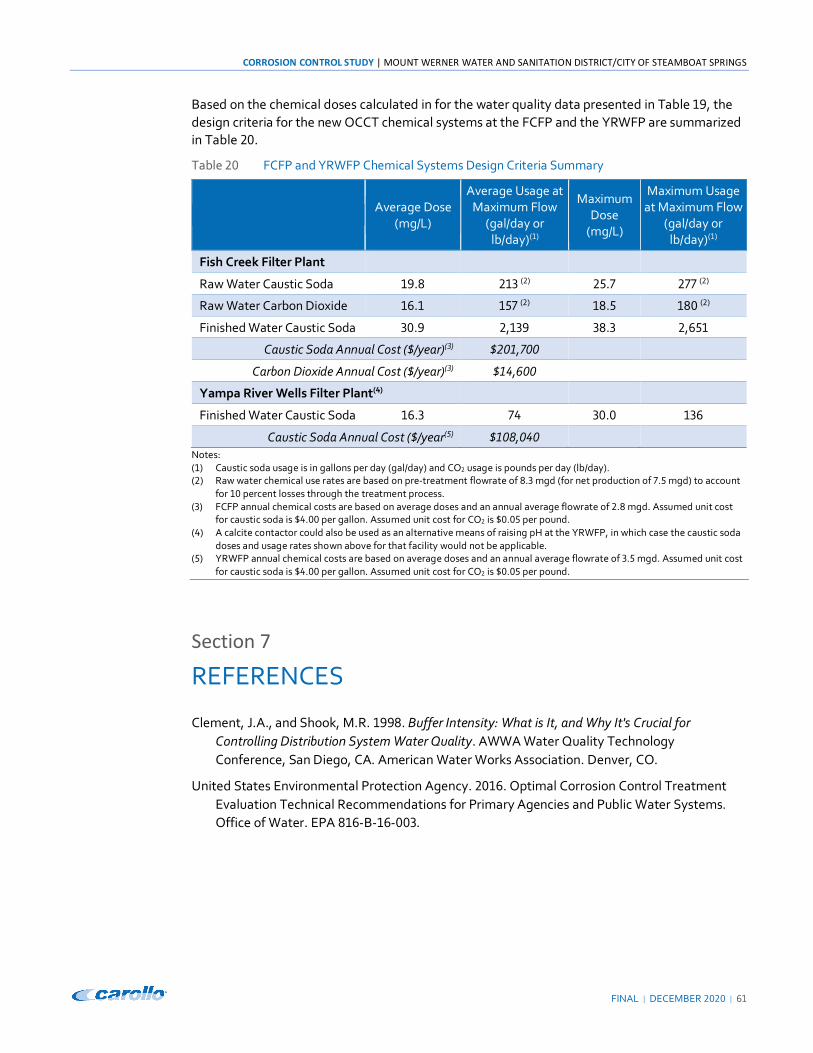
CORROSION CONTROL STUDY | MOUNT WERNER WATER AND SANITATION DISTRICT/CITY OF STEAMBOAT SPRINGS
FINAL | DECEMBER 2020 | 61
Based on the chemical doses calculated in for the water quality data presented in Table 19, the design criteria for the new OCCT chemical systems at the FCFP and the YRWFP are summarized in Table 20.
Table 20 FCFP and YRWFP Chemical Systems Design Criteria Summary
Average Dose
(mg/L)
Average Usage at Maximum Flow
(gal/day or lb/day)(1)
Maximum Dose
(mg/L)
Maximum Usage at Maximum Flow
(gal/day or lb/day)(1)
Fish Creek Filter Plant
Raw Water Caustic Soda 19.8 213 (2) 25.7 277 (2)
Raw Water Carbon Dioxide 16.1 157 (2) 18.5 180 (2)
Finished Water Caustic Soda 30.9 2,139 38.3 2,651
Caustic Soda Annual Cost ($/year)(3) $201,700
Carbon Dioxide Annual Cost ($/year)(3) $14,600
Yampa River Wells Filter Plant(4)
Finished Water Caustic Soda 16.3 74 30.0 136
Caustic Soda Annual Cost ($/year(5) $108,040 Notes: (1) Caustic soda usage is in gallons per day (gal/day) and CO2 usage is pounds per day (lb/day). (2) Raw water chemical use rates are based on pre-treatment flowrate of 8.3 mgd (for net production of 7.5 mgd) to account
for 10 percent losses through the treatment process. (3) FCFP annual chemical costs are based on average doses and an annual average flowrate of 2.8 mgd. Assumed unit cost
for caustic soda is $4.00 per gallon. Assumed unit cost for CO2 is $0.05 per pound. (4) A calcite contactor could also be used as an alternative means of raising pH at the YRWFP, in which case the caustic soda
doses and usage rates shown above for that facility would not be applicable. (5) YRWFP annual chemical costs are based on average doses and an annual average flowrate of 3.5 mgd. Assumed unit cost
for caustic soda is $4.00 per gallon. Assumed unit cost for CO2 is $0.05 per pound.
Section 7
REFERENCES
Clement, J.A., and Shook, M.R. 1998. Buffer Intensity: What is It, and Why It's Crucial for Controlling Distribution System Water Quality. AWWA Water Quality Technology Conference, San Diego, CA. American Water Works Association. Denver, CO.
United States Environmental Protection Agency. 2016. Optimal Corrosion Control Treatment Evaluation Technical Recommendations for Primary Agencies and Public Water Systems. Office of Water. EPA 816-B-16-003.

MOUNT WERNER WATER AND SANITATION DISTRICT/CITY OF STEAMBOAT SPRINGS | CORROSION CONTROL STUDY
62 | DECEMBER 2020 | FINAL
- This Page Intentionally Left Blank-

CORROSION CONTROL STUDY | MOUNT WERNER WATER AND SANITATION DISTRICT/CITY OF STEAMBOAT SPRINGS
FINAL | DECEMBER 2020
Appendix A REPRESENTATIVE CORROSION CONTROL INDICES CALCULATIONS


ENGINEERING CALCULATIONS
CORROSION INDICES
Project Name:
Client:
Prepared By:
Reviewed By:
Subject:
Distribution:
MWWD Corrosion Control Study
Carollo Engineers
Madison Marshall
Jason Assouline
Corrosion Indices
File
Date:
Project No.:
Revision No.:
7/10/2019
11272B.00
5
SPEED Guides and MathCAD calculations are considered confidential trade secrets. Users will hold in
confidence and not disclose to others outside of the Company, without Partner approval, this secret, confidential,
and proprietary information. Unauthorized disclosure of trade secrets is a violation of Federal and State law and
subject the employee to injunction, civil damages and liability for attorney’s fees.
This worksheet calculates the indices for estimating corrosive and scale tendencies of a water. The indices
include the following (with hyperlinks):
- Langelier Saturation Index
- Ryznar Index
- Driving Force Index
- Aggressiveness Index
- Momentary Excess
- Buffer Intensity
- Larson Index
- Singley Index
- Calcium Carbonate Precipitation Potential
- Summary
Water Quality
MeasuredpH 7.41:=
Temperature 5:= degrees C
This value is terms of mg/L of calcium carbonateCalcium 9.5
mg
L:=
Alkalinity 25.2mg
L:= This value is terms of mg/L of calcium carbonate
DissolvedSolids 42mg
L:=
Chloride 4.8mg
L:=
Sulfate 9.2mg
L:=
C:\Users\mrmarshall\OneDrive - Carollo Engineers\Desktop\Appendix
1 7/10/2019
Appendix A-1
ENGINEERING CALCULATIONS
CORROSION INDICES
DissolvedOxygen 10.9mg
L:=
C:\Users\mrmarshall\OneDrive - Carollo Engineers\Desktop\Appendix
2 7/10/2019
Appendix A-2
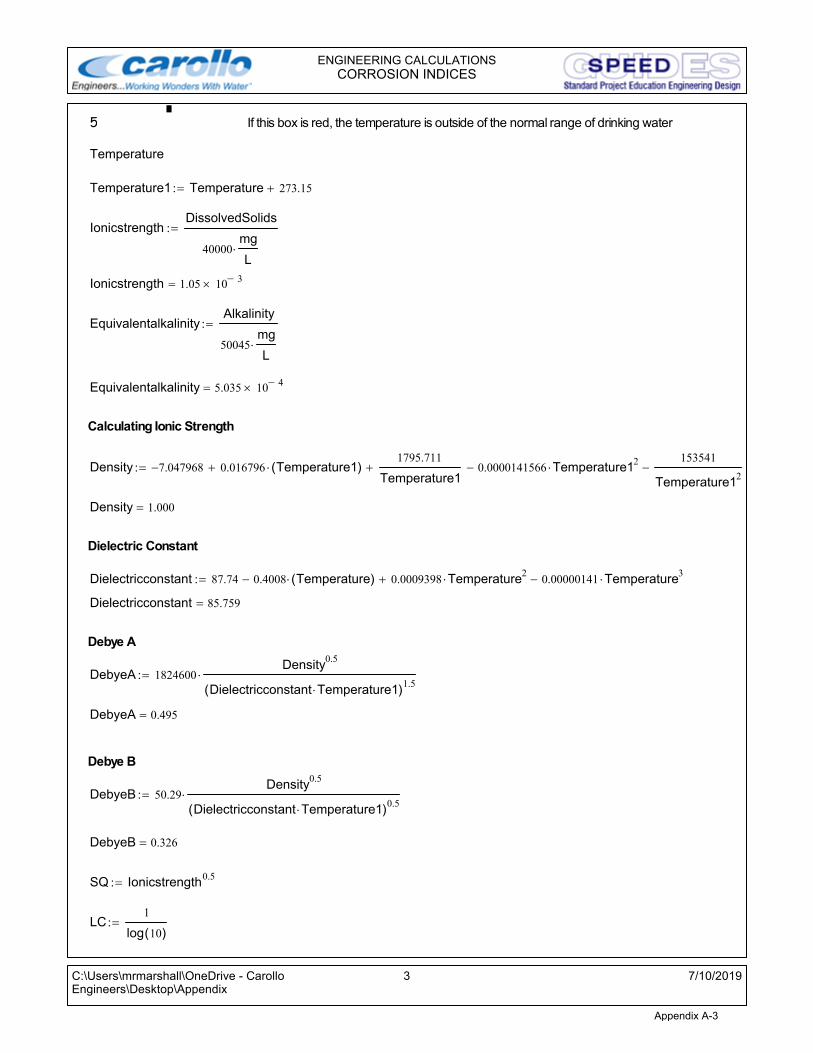
ENGINEERING CALCULATIONS
CORROSION INDICES
5
Temperature
If this box is red, the temperature is outside of the normal range of drinking water
Temperature1 Temperature 273.15+:=
IonicstrengthDissolvedSolids
40000mg
L
:=
Ionicstrength 1.05 103-=
EquivalentalkalinityAlkalinity
50045mg
L
:=
Equivalentalkalinity 5.035 104-=
Calculating Ionic Strength
Density 7.047968- 0.016796 Temperature1( )+1795.711
Temperature1+ 0.0000141566 Temperature1
2-153541
Temperature12
-:=
Density 1.000=
Dielectric Constant
Dielectricconstant 87.74 0.4008 Temperature( )- 0.0009398 Temperature2+ 0.00000141 Temperature
3-:=
Dielectricconstant 85.759=
Debye A
DebyeA 1824600Density
0.5
Dielectricconstant Temperature1( )1.5
:=
DebyeA 0.495=
Debye B
DebyeB 50.29Density
0.5
Dielectricconstant Temperature1( )0.5
:=
DebyeB 0.326=
SQ Ionicstrength0.5:=
LC1
log 10( ):=
C:\Users\mrmarshall\OneDrive - Carollo Engineers\Desktop\Appendix
3 7/10/2019
Appendix A-3
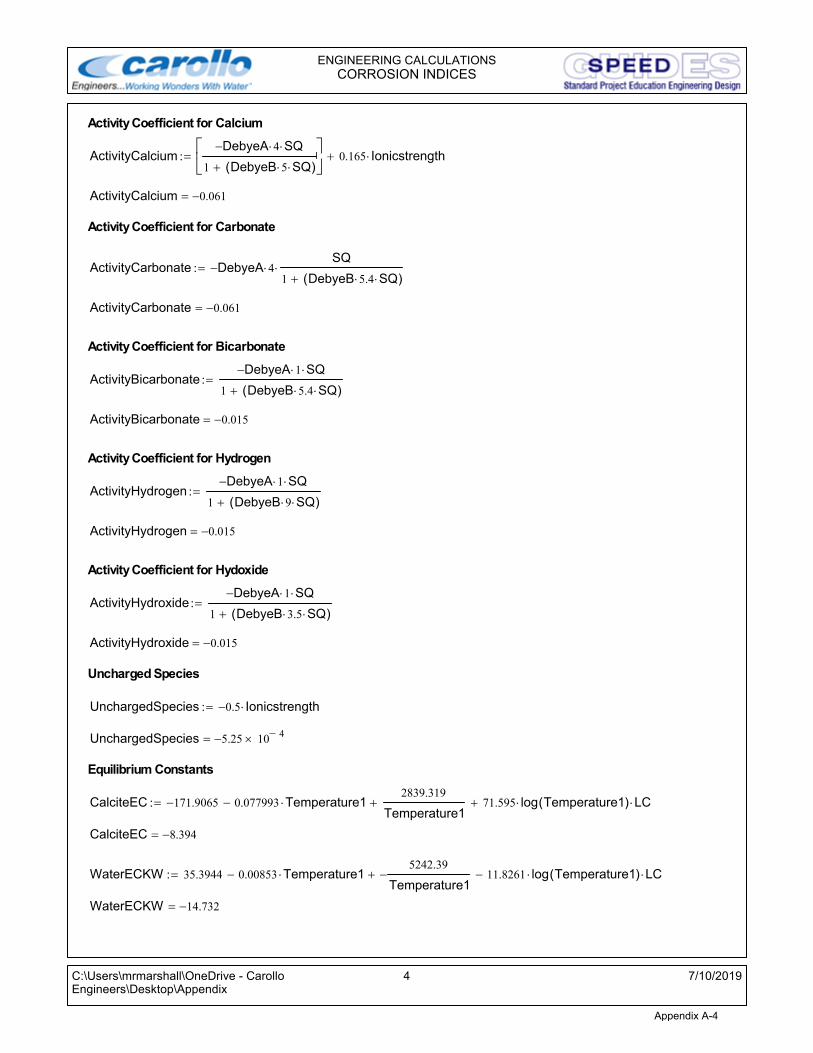
ENGINEERING CALCULATIONS
CORROSION INDICES
Activity Coefficient for Calcium
ActivityCalciumDebyeA- 4 SQ
1 DebyeB 5 SQ( )+
0.165 Ionicstrength+:=
ActivityCalcium 0.061-=
Activity Coefficient for Carbonate
ActivityCarbonate DebyeA- 4SQ
1 DebyeB 5.4 SQ( )+:=
ActivityCarbonate 0.061-=
Activity Coefficient for Bicarbonate
ActivityBicarbonateDebyeA- 1 SQ
1 DebyeB 5.4 SQ( )+:=
ActivityBicarbonate 0.015-=
Activity Coefficient for Hydrogen
ActivityHydrogenDebyeA- 1 SQ
1 DebyeB 9 SQ( )+:=
ActivityHydrogen 0.015-=
Activity Coefficient for Hydoxide
ActivityHydroxideDebyeA- 1 SQ
1 DebyeB 3.5 SQ( )+:=
ActivityHydroxide 0.015-=
Uncharged Species
UnchargedSpecies 0.5- Ionicstrength:=
UnchargedSpecies 5.25- 104-=
Equilibrium Constants
CalciteEC 171.9065- 0.077993 Temperature1-2839.319
Temperature1+ 71.595 log Temperature1( ) LC+:=
CalciteEC 8.394-=
WaterECKW 35.3944 0.00853 Temperature1-5242.39
Temperature1-+ 11.8261 log Temperature1( ) LC-:=
WaterECKW 14.732-=
C:\Users\mrmarshall\OneDrive - Carollo Engineers\Desktop\Appendix
4 7/10/2019
Appendix A-4
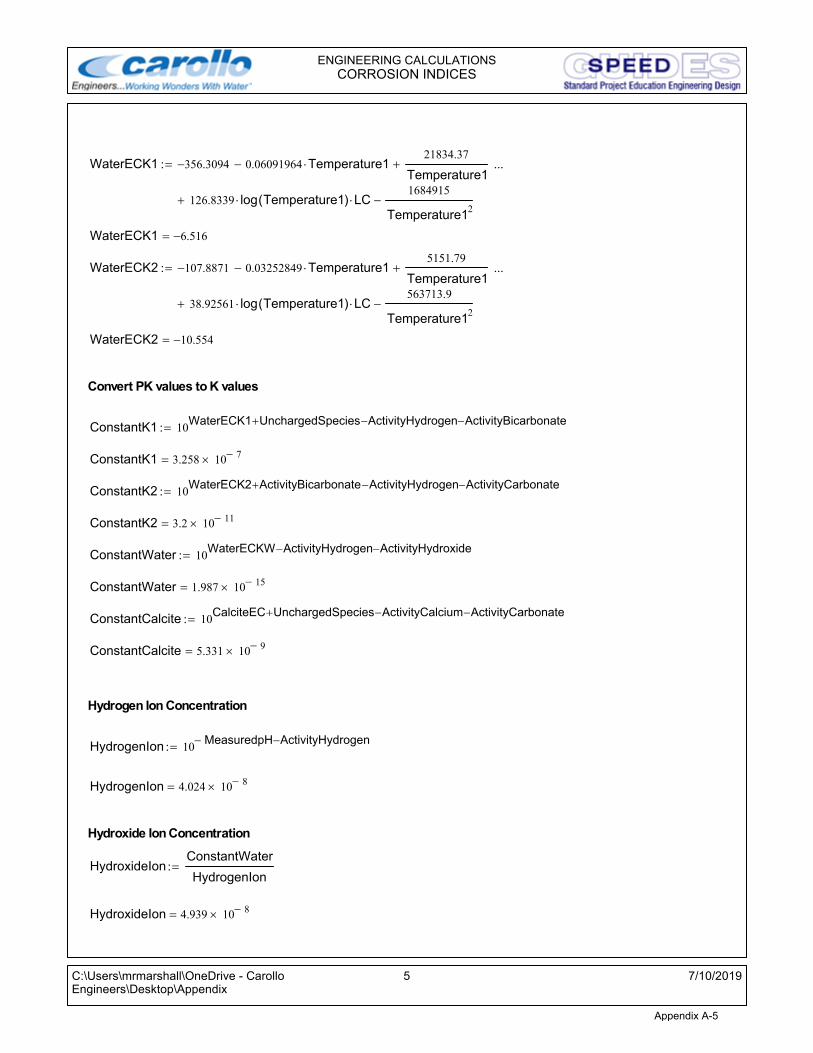
ENGINEERING CALCULATIONS
CORROSION INDICES
WaterECK1 356.3094- 0.06091964 Temperature1-21834.37
Temperature1+
126.8339 log Temperature1( ) LC1684915
Temperature12
-+
...:=
WaterECK1 6.516-=
WaterECK2 107.8871- 0.03252849 Temperature1-5151.79
Temperature1+
38.92561 log Temperature1( ) LC563713.9
Temperature12
-+
...:=
WaterECK2 10.554-=
Convert PK values to K values
ConstantK1 10WaterECK1 UnchargedSpecies ActivityHydrogen-+ ActivityBicarbonate-:=
ConstantK1 3.258 107-=
ConstantK2 10WaterECK2 ActivityBicarbonate+ ActivityHydrogen- ActivityCarbonate-:=
ConstantK2 3.2 1011-=
ConstantWater 10WaterECKW ActivityHydrogen- ActivityHydroxide-:=
ConstantWater 1.987 1015-=
ConstantCalcite 10CalciteEC UnchargedSpecies+ ActivityCalcium- ActivityCarbonate-:=
ConstantCalcite 5.331 109-=
Hydrogen Ion Concentration
HydrogenIon 10MeasuredpH- ActivityHydrogen-:=
HydrogenIon 4.024 108-=
Hydroxide Ion Concentration
HydroxideIonConstantWater
HydrogenIon:=
HydroxideIon 4.939 108-=
C:\Users\mrmarshall\OneDrive - Carollo Engineers\Desktop\Appendix
5 7/10/2019
Appendix A-5
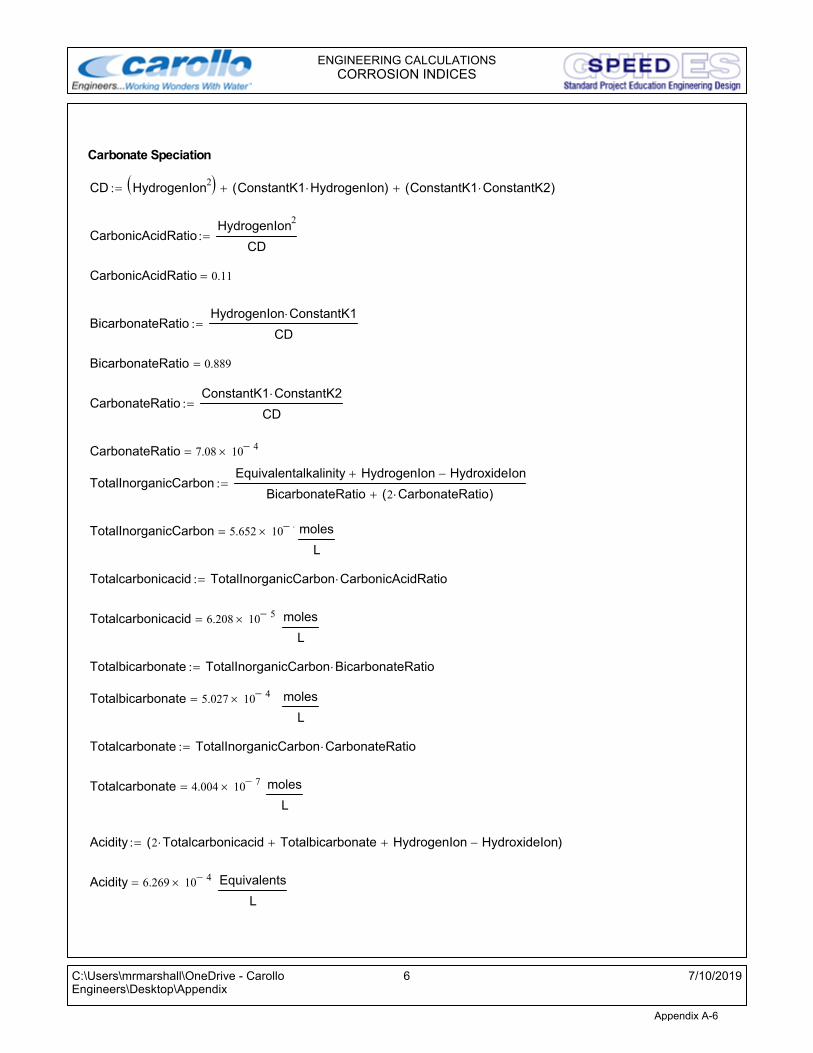
ENGINEERING CALCULATIONS
CORROSION INDICES
Carbonate Speciation
CD HydrogenIon2( ) ConstantK1 HydrogenIon( )+ ConstantK1 ConstantK2( )+:=
CarbonicAcidRatioHydrogenIon
2
CD:=
CarbonicAcidRatio 0.11=
BicarbonateRatioHydrogenIon ConstantK1
CD:=
BicarbonateRatio 0.889=
CarbonateRatioConstantK1 ConstantK2
CD:=
CarbonateRatio 7.08 104-=
TotalInorganicCarbonEquivalentalkalinity HydrogenIon+ HydroxideIon-
BicarbonateRatio 2 CarbonateRatio( )+:=
TotalInorganicCarbon 5.652 104-= moles
L
Totalcarbonicacid TotalInorganicCarbon CarbonicAcidRatio:=
Totalcarbonicacid 6.208 105-= moles
L
Totalbicarbonate TotalInorganicCarbon BicarbonateRatio:=
Totalbicarbonate 5.027 104-= moles
L
Totalcarbonate TotalInorganicCarbon CarbonateRatio:=
Totalcarbonate 4.004 107-= moles
L
Acidity 2 Totalcarbonicacid Totalbicarbonate+ HydrogenIon+ HydroxideIon-( ):=
Acidity 6.269 104-= Equivalents
L
C:\Users\mrmarshall\OneDrive - Carollo Engineers\Desktop\Appendix
6 7/10/2019
Appendix A-6

ENGINEERING CALCULATIONS
CORROSION INDICES
Langelier Index (hyperlink to TOC)
The Langelier Saturation Index is a Calcium Carbonate Saturation Index. The variables needed to
use the Langelier Index are: Calcium concentration (as CaCO3) , Total Alkalinity (as CaCO3),
Temperature and Dissolved Solids. This index is the most accepted and misused index in the water
field. The pH of Calcium Carbonate stabilization is calculated. This is the pH where the water has
neither a tendency to dissolve or precipitate Calcium Carbonate. A positive value for the Langelier
Index indicates that the water will precipitate Calcium Carbonate and a negative value indicates that
the water would dissolve Calcium Carbonate and may cause corrosion problems in a distribution
system. This method of analysis does not take into account ion pairs (such as CaHCO3+) and their
effect on the Calcium concentration. Other scale besides Calcium Carbonate have been shown to
also be protective against corrosion. In the presence of scale inhibitors this index is not appropriate.
The Langelier index does not yield any information about the degree of scaling and corrosion.
Some problems with the Langelier index are:
- CaCO3 is assumed to exist in the Calcite form. Some other forms of Calcium Carbonate exist
(Aragonite) which have higher solubility.
- Deposited Calcium Carbonate does not always aid in preventing corrosion.
- Waters with negative values of the Langelier index have been known to deposit Calcium
Carbonate due to localized high pH due to corrosion.
CalciummolarCalcium
100089mg
L
:=
Calciummolar 9.492 105-=
A 1 CalciummolarConstantK2
ConstantCalcite-:=
A 1=
B ConstantK2 2 CalciummolarEquivalentalkalinity
ConstantCalcite
-
:=
B 2.232- 1010-=
C ConstantWater ConstantK2Calciummolar
ConstantCalcite:=
C 0=
QQ B2
4 A C-:=
QQ 0=
C:\Users\mrmarshall\OneDrive - Carollo Engineers\Desktop\Appendix
7 7/10/2019
Appendix A-7

ENGINEERING CALCULATIONS
CORROSION INDICES
S1B- QQ+
2A:=
S1 218.038E-012=
4.37106809370885E-08If this value is red then the Langelier Index has no real value
S1Final log S1 10ActivityHydrogen( )- LC:=
LangelierIndex MeasuredpH S1Final-( ):=
LangelierIndex 2.27-=
Larson Index (hyperlink to TOC)
The Larson index uses the relative ratio of the Chloride and Sulfate concentrations to the total
alkalinity. The smaller the value the less corrosive the water. A water with a value of below 0.2 is
considered non-corrosive.
LarsonIndex0.0282 Chloride 0.0208 Sulfate+( )
0.02 Alkalinity
:=
LarsonIndex 0.65=
Ryznar Index (hyperlink to TOC)
The Ryznar index is an empirical index that estimates that amount of scaling that will form and is still
even used in when inhibitors have been added to water in cooling applications. The index yields a
value of below 6 if scaling has a tendency to occur. If the value for the Ryznar index is above 6 then
the water has the tendency to dissolve Calcium Carbonate. The figure below taken from Control of
Scale and Corrosion in Building Water Systems shows the Ryznar Index versus scale results. From
the Ryznar Index different formulas can be used to calculate the amount of scale that will form. Some
formulas are presence which will calculate the amount of scale formed when polyphosphate are used
in conjunction with the Ryznar index. Hammond, Illinois uses the Ryznar index to gauge to the
corrosion potential of their water. When the Ryznar index was 6-7 no complaints occurred. Under
different conditions the Ryznar index was 7-8 corrosion occurred in hot water tanks. When the value
of the Ryznar index exceeded 8 custom complaints occurred in large numbers.
RyznarIndex 2 S1Final( ) MeasuredpH-:=
C:\Users\mrmarshall\OneDrive - Carollo Engineers\Desktop\Appendix
8 7/10/2019
Appendix A-8

ENGINEERING CALCULATIONS
CORROSION INDICES
RyznarIndex 11.9=
HEAVY SCALE IN HOT WATER HEATERS
HEAVY SCALE IN HEATERS AND COILS
SCALE IN HEATERS
SCALE IN HEATERS
SCALE IN HEATERS
SCALE IN HEATER COILS
SOME SCALE AT 60 oF
SCALE IN HEATER UNLESS POLYPHOSPHATE IS ADDED
SLIGHT SCALE – CORROSION HIGH TEMP (POLYPHOSPHATE PRESENT)
NO DIFFICULTIES EXPERIENCED
COMPLAINTS NEGLIGIBLE
NO SCALE OR CORROSION
PRACTICALLY NO RED WATER COMPLAINTS
ONLY SLIGHT CORROSION AT 150 oF
SCALE IN MAINS
PRACTICALLY NO COMPLAINTS
CORROSION
QUITE CORROSIVE AT 150 oF
CORROSION IN HOT WATER HEATERS
CORROSION IN COLD WATER LINES
SEVERE CORROSION – RED WATER
SOME CORROSION IN COLD WATER MAINS
32 RED WATER COMPLAINTS IN ONE YEAR
CORROSION IN COLD WATER MAINS
CORROSION IN COLD WATER MAINS
NUMEROUS COMPLAINTS OF RED WATER
RED WATER
SERIOUS CORROSION AT 140 oF
234 RED WATER COMPLAINTS IN ONE YEAR
VERY CORROSIVE AT 150 oF
SEVERE CORROSION – RED WATER
CORROSIVE AT 60 oF
CORROSIVE TO COLD WATER MAINS
VERY CORROSIVE AT 60 oF AND 150 oFCORROSIVE IN ENTIRE SYSTEM
Scale Reported
Complaints Negligible
Corrosion
HEAVY SCALE AT 150 oF
HEAVE SCALE AT 60 oF
VERY HEAVY SCALE
ST
AB
ILIT
Y I
ND
EX
INCRUSTATION3
4
5
6
7
8
9
10
11
12
HEAVY SCALE IN HOT WATER HEATERS
HEAVY SCALE IN HEATERS AND COILS
SCALE IN HEATERS
SCALE IN HEATERS
SCALE IN HEATERS
SCALE IN HEATER COILS
SOME SCALE AT 60 oF
SCALE IN HEATER UNLESS POLYPHOSPHATE IS ADDED
SLIGHT SCALE – CORROSION HIGH TEMP (POLYPHOSPHATE PRESENT)
NO DIFFICULTIES EXPERIENCED
COMPLAINTS NEGLIGIBLE
NO SCALE OR CORROSION
PRACTICALLY NO RED WATER COMPLAINTS
ONLY SLIGHT CORROSION AT 150 oF
SCALE IN MAINS
PRACTICALLY NO COMPLAINTS
CORROSION
QUITE CORROSIVE AT 150 oF
CORROSION IN HOT WATER HEATERS
CORROSION IN COLD WATER LINES
SEVERE CORROSION – RED WATER
SOME CORROSION IN COLD WATER MAINS
32 RED WATER COMPLAINTS IN ONE YEAR
CORROSION IN COLD WATER MAINS
CORROSION IN COLD WATER MAINS
NUMEROUS COMPLAINTS OF RED WATER
RED WATER
SERIOUS CORROSION AT 140 oF
234 RED WATER COMPLAINTS IN ONE YEAR
VERY CORROSIVE AT 150 oF
SEVERE CORROSION – RED WATER
CORROSIVE AT 60 oF
CORROSIVE TO COLD WATER MAINS
VERY CORROSIVE AT 60 oF AND 150 oFCORROSIVE IN ENTIRE SYSTEM
Scale Reported
Complaints Negligible
Corrosion
Scale Reported
Complaints Negligible
Corrosion
HEAVY SCALE AT 150 oF
HEAVE SCALE AT 60 oF
VERY HEAVY SCALE
ST
AB
ILIT
Y I
ND
EX
INCRUSTATION3
4
5
6
7
8
9
10
11
12
C:\Users\mrmarshall\OneDrive - Carollo Engineers\Desktop\Appendix
9 7/10/2019
Appendix A-9

ENGINEERING CALCULATIONS
CORROSION INDICES
Ryznar Index vs Scale Results (Nalco Chemical Co., Chicago, IL)
This figure shows the scale results/corrosion based on the Ryznar Index values.
Aggressive Index (hyperlink to TOC)
The aggressive index is an indicator of whether a water is aggressive towards asbestos-cement pipe.
Water with a value less than 10 is aggressive. A value greater than 12 indicates that the water is
nonaggressive. The aggressive index has been criticized by many researchers as extremely simplistic.
Fort Collins uses the Aggressive index as a corrosion control index even though some of their system
is not asbestos-cement.
AggressiveIndex MeasuredpH logAlkalinity
mg
L
Calcium
mg
L
LC+:=
AggressiveIndex 9.8=
Snoeyink Index
SI1 EquivalentalkalinityConstantWater
HydrogenIon
- HydrogenIon+:=
SI2ConstantK2
ConstantCalcite
HydrogenIon
2 ConstantK2( ) HydrogenIon+
:=
HS Calciummolar SI1 SI2:=
S2 log HS 10ActivityHydrogen( )- LC:=
SnoeyinkIndex MeasuredpH S2-( ):=
SnoeyinkIndex 2.147-=
Driving Force Index (hyperlink to TOC)
The Driving Force Index (DFI) is the product of the calcium and carbonate activities divided by the
equilibrium constant, Ks for the solubility of calcium carbonate. The Driving Force Index is not a
logarithmic quantity so small changes in the Langelier index appear as large changes in the DFI index.
Johnson County Water District #1 uses the DFI to determine the operating conditions of the water plant
with respect to corrosion. The value that Johnson County uses as a goal is 15 - 20.
DrivingForceIndexCalciummolar Totalcarbonate
ConstantCalcite:=
C:\Users\mrmarshall\OneDrive - Carollo Engineers\Desktop\Appendix
10 7/10/2019
Appendix A-10
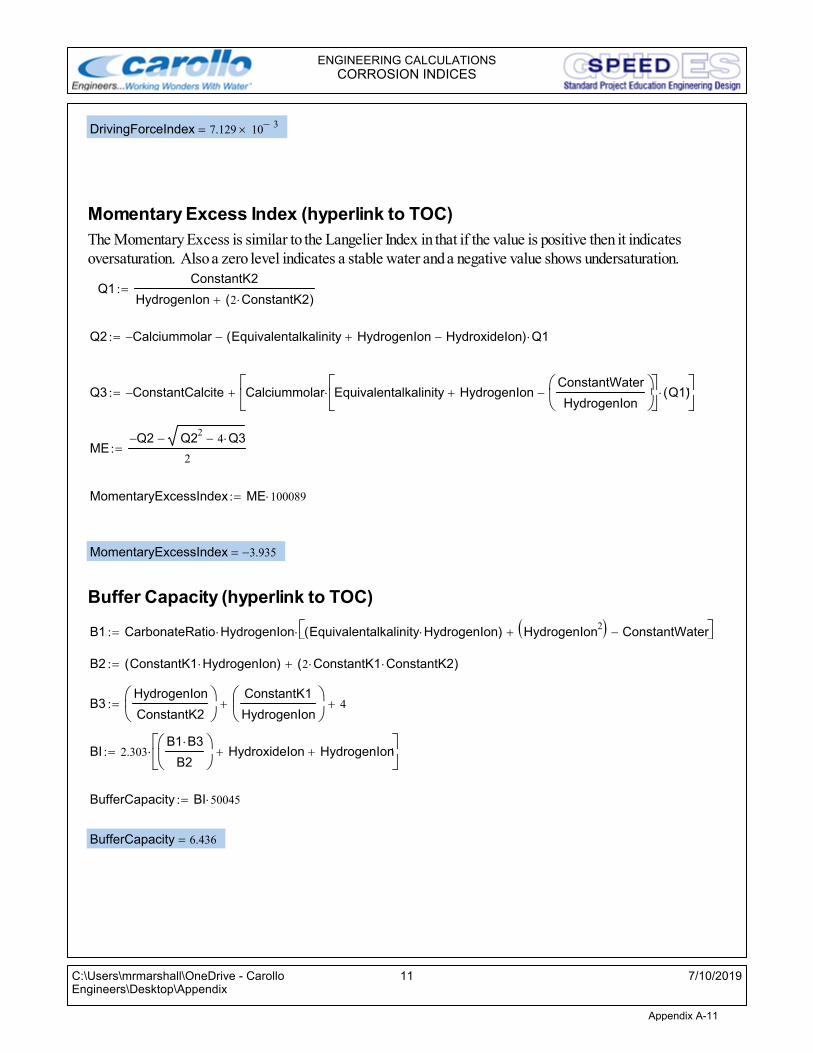
ENGINEERING CALCULATIONS
CORROSION INDICES
DrivingForceIndex 7.129 103-=
Momentary Excess Index (hyperlink to TOC)
The Momentary Excess is similar to the Langelier Index in that if the value is positive then it indicates
oversaturation. Also a zero level indicates a stable water and a negative value shows undersaturation.
Q1ConstantK2
HydrogenIon 2 ConstantK2( )+:=
Q2 Calciummolar- Equivalentalkalinity HydrogenIon+ HydroxideIon-( ) Q1-:=
Q3 ConstantCalcite- Calciummolar Equivalentalkalinity HydrogenIon+ConstantWater
HydrogenIon
-
Q1( )
+:=
MEQ2- Q2
24 Q3--
2:=
MomentaryExcessIndex ME 100089:=
MomentaryExcessIndex 3.935-=
Buffer Capacity (hyperlink to TOC)
B1 CarbonateRatio HydrogenIon Equivalentalkalinity HydrogenIon( ) HydrogenIon2( )+ ConstantWater- :=
B2 ConstantK1 HydrogenIon( ) 2 ConstantK1 ConstantK2( )+:=
B3HydrogenIon
ConstantK2
ConstantK1
HydrogenIon
+ 4+:=
BI 2.303B1 B3
B2
HydroxideIon+ HydrogenIon+
:=
BufferCapacity BI 50045:=
BufferCapacity 6.436=
C:\Users\mrmarshall\OneDrive - Carollo Engineers\Desktop\Appendix
11 7/10/2019
Appendix A-11

ENGINEERING CALCULATIONS
CORROSION INDICES
Singley Index (hyperlink to TOC)
The Singley index takes into account the Calcium concentration, Alkalinity, Temperature and Dissolved
Solids as well as Chlorides, Sulfate, Buffer intensity, length of exposure time and Dissolved Oxygen.
The Singley index will produce the number of mils per year that are corroded if the water is corrosive.
JSChloride
mg
L
0.509Sulfate
mg
L
0.0249
Alkalinity
mg
L
0.423
DissolvedOxygen
mg
L
0.78
:=
RP 0.4Calcium
mg
L
0.676
BufferCapacity0.0304( ) 10
LangelierIndex( )0.107
9.4675:=
SingleyIndexJS
RP:=
SingleyIndex 4.192= Corrosion Rate of Mild Steel (mpy)
Calcium Carbonate Precipitation Potential (hyperlink to TOC)
The Calcium Carbonate Precipitation Potential (CCPP) index is an quantitative index that
calculates the quantity of Calcium Carbonate that will precipitate or be dissolved by a water of a
known quality. Iterations are needed for this method.
Iterative process to calculate CCPP
Let x = amount precipitated (mmole)
Guess
H HydrogenIon:= x 0.1:= σCO2 σCO2 H1( ):= α2 α2 H1( ):= ∆ ∆ H1( ):= (starting values)
H 4.024 108-= σCO2 0.891= α2 7.084 10
4-= ∆ 9.148 106-=
C:\Users\mrmarshall\OneDrive - Carollo Engineers\Desktop\Appendix
12 7/10/2019
Appendix A-12

ENGINEERING CALCULATIONS
CORROSION INDICES
Given
σCO2H K1 2 K1 K2+
H H H K1+ K1 K2+= α2
K1 K2
H H K1 H+ K1 K2+=
∆
Kw
HH-
1000=
Alk 2x- CCO2 x-( ) σCO2 ∆+=
0 Ca x-( ) CCO2 x-( ) α2 Kso 106-=
H
x
σCO2
α2
∆
Find H x, σCO2, α2, ∆, ( ):= pH 1- log H( ):=
pH 9.152= x 0.092-= σCO2 1.041= α2 0.04342= ∆ 0.00282=
Precipitate x 100:= New_CCO2 4.48 x-( ):=
New_Ca Ca x-( ) 100:= Carbonate 60 New_CCO2 α2 H( ):=
New_Alk Alk 2x-( ) 50:= Bicarbonate 61 New_CCO2 α1 H( ):=
Precipitate 9.17-= (as mg/L) α1 H( ) 0.955= (% bicarbonate)
New_Ca 18.67= (as mg/L as CaCO3) α2 H( ) 0.043= (% carbonate)
New_Alk 34.37= (as mg/L as CaCO3) Carbonate 11.91= (as mg/L)
New_CCO2 4.57= (as mmole/L) Bicarbonate 266.19= (as mg/L)
C:\Users\mrmarshall\OneDrive - Carollo Engineers\Desktop\Appendix
13 7/10/2019
Appendix A-13

ENGINEERING CALCULATIONS
CORROSION INDICES
Alkalinity 25.2mg
L=
Calcium 9.5mg
L=
Summary of Water Quality and Indices (hyperlink to TOC)
Initial Water Quality Corrosion Indices
MeasuredpH 7.41= LangelierIndex 2.266-=
Temperature 5= LarsonIndex 0.648=
RyznarIndex 11.942=
AggressiveIndex 9.789=
SnoeyinkIndex 2.147-=
DrivingForceIndex 7.129 103-=
MomentaryExcessIndex 3.935-=DissolvedSolids 42
mg
L=
BufferCapacity 6.436=
SingleyIndex 4.192=Chloride 4.8
mg
L=
Calcium Carbonate Precipitation PotentialSulfate 9.2
mg
L=
Precipitate 9.174-= New_Ca 18.7=
DissolvedOxygen 10.9mg
L=
pH 9.152= New_Alk 34.4=
C:\Users\mrmarshall\OneDrive - Carollo Engineers\Desktop\Appendix
14 7/10/2019
Appendix A-14
Related Documents