CORROSION AND FRACTURE BEHAVIOUR OF API-5L X65 AND MICRO-ALLOYED STEELS IN FUEL ETHANOL ENVIRONMENTS BY JOSEPH, OLUFUNMILAYO OLUWABUKOLA (B.Eng (Akure); M.Eng (Akure)) (Matric No: CUGP110375) A THESIS SUBMITTED TO THE SCHOOL OF POSTGRADUATE STUDIES OF COVENANT UNIVERSITY, OTA, IN PARTIAL FULFILLMENT OF THE REQUIREMENTS FOR THE AWARD OF DOCTOR OF PHILOSOPHY IN MECHANICAL ENGINEERING Supervisors: Prof. C.A. Loto Department of Mechanical Engineering, College of Engineering, Covenant University, Ota, Ogun State Prof. John Ade Ajayi Department of Metallurgical & Materials Engineering, Federal University of Technology, Akure, Ondo State & Dr. S. Sivaprasad Fatigue and Fracture Group, CSIR-National Metallurgical Laboratory, Jamshedpur, Jharkhand, India JUNE 2016

Welcome message from author
This document is posted to help you gain knowledge. Please leave a comment to let me know what you think about it! Share it to your friends and learn new things together.
Transcript

CORROSION AND FRACTURE BEHAVIOUR OF API-5L X65 AND
MICRO-ALLOYED STEELS IN FUEL ETHANOL ENVIRONMENTS
BY
JOSEPH, OLUFUNMILAYO OLUWABUKOLA (B.Eng (Akure); M.Eng (Akure))
(Matric No: CUGP110375)
A THESIS SUBMITTED TO THE SCHOOL OF POSTGRADUATE
STUDIES OF COVENANT UNIVERSITY, OTA, IN PARTIAL
FULFILLMENT OF THE REQUIREMENTS FOR THE AWARD OF
DOCTOR OF PHILOSOPHY IN MECHANICAL ENGINEERING
Supervisors:
Prof. C.A. Loto Department of Mechanical Engineering, College of Engineering, Covenant University, Ota,
Ogun State
Prof. John Ade Ajayi Department of Metallurgical & Materials Engineering, Federal University of Technology,
Akure, Ondo State
&
Dr. S. Sivaprasad Fatigue and Fracture Group, CSIR-National Metallurgical Laboratory, Jamshedpur,
Jharkhand, India
JUNE 2016


iv
DEDICATION
This work is dedicated to God Almighty, my Source and Inspiration for His faithfulness and
love towards me.
v
ACKNOWLEDGEMENTS
I am grateful to the Almighty God, the Author and Finisher of my faith, for granting me
access to His incessant revelation, wisdom and goodwill that saw me through my doctoral
studies. My sincere appreciation goes to the Chancellor, Dr. David Oyedepo for the vision
and mission of the University. Many thanks go to the Management of Covenant University
for their commitment and drive for excellence and sound academic scholarship. My
appreciation also goes to the Council of Scientific and Industrial Research (CSIR) and Third
World Academy of Sciences (TWAS) for granting me the opportunity to carry out the entire
laboratory work in CSIR-National Metallurgical Laboratory, Jamshedpur, India under the
2013 CSIR-TWAS Sandwich Postgraduate Fellowship Scheme (FR No. 3240275047).
My special thanks go to my supervisor and former Dean, College of Engineering, Prof.
Cleophas A. Loto for his guidance, encouragement and support which enabled the successful
completion of this thesis. I also heartily appreciate my co-supervisor, Prof. John Ade Ajayi
for his good counsel, motivation, support and useful suggestions in ensuring the success and
speedy completion of this work. Then, to my able second co-supervisor, Dr. S. Sivaprasad, I
would like to say thank you for being a teacher and a mentor and for making my stay in India
a memorable one. My appreciation also goes to the Fatigue and Fracture Group Head, Dr. S.
Tarafder for his help and guidance throughout the entire period. Thanks a lot to Dr. Raghuvir
Singh in corrosion division for his assistance in the corrosion tests. Thanks to Dr. I. Chattoraj,
Dr. H. N. Bar, and Dr. Swapna De for the help they also rendered. I would not forget to
appreciate all the other scientists in the Fatigue and Fracture Group as well as in other groups
in CSIR-NML who have contributed in various ways to making this work a success.
I sincerely appreciate the entire Department of Mechanical Engineering, Covenant
University, Ota, Nigeria, my Head of Department, Dr. O. O. Ajayi, Prof. A. O. Inegbenebor,
Prof. F. A. Oyawale, Prof. C. A. Bolu, Prof. I. S. Dunmade, Dr. S. O. Oyedepo, Dr. O.
Kilanko, Dr. I. S. O. Fayomi, Dr. R. T. Loto, Dr. P. O. Babalola, Dr. O. S. Ohunakin, Dr. J.
O. Okeniyi, Dr. A. Onawumi, Engr. O. A. Omotosho, Engr. R. O. Leramo, Engr. C. O. Ajayi,
Mrs. F. Ademuyiwa, Mr. David Olugboye, Mr. T. Babarinde, Mr. Damola Adelekan, Mr. O.
Adeoye, Mr. Gbolahan Odewole and Mr. O. Adeyemi for their support and frequent
encouragements during the course of this work. Furthermore, it is my pleasure to thank Prof.
K. O. Ajanaku and Dr. T. O. Siyanbola in the Department of Chemistry, Covenant
University, Ota, Nigeria, for their guidance and support in getting the research facilities for
this work. I acknowledge the efforts of Rima Dey and Anindya Das for being great friends at

vi
NML, India; they were very helpful to me in the laboratory. Thanks to the security personnel
in CSIR-NML for helping in securing the fatigue and fracture section of the laboratory,
throughout the duration of experimentation, since the test environment was highly
flammable.
I wish to appreciate the following people: my parents, Mr. and Mrs. Olorunleke Gabriel for
their prayers and support in the course of this study; my siblings, Mr. Olubunmi, Mrs.
Abiodun Komolafe, Mrs. Feyi Oni, Mrs. Titi Akerele, Toyin, Tola and Faith, for their support
and encouragement; my in-laws especially, Mrs. Adenike Ajayi, Mr. and Mrs. Olaniyi Joseph
for their incessant prayers and encouragement.
My appreciation would not be complete if I fail to say thank you to my husband, Engr.
Olaleye Joseph and my children: Daniel, Joshua and Enoch for being there for me. Without
their patience, love and help, I would not have been able to make it.
vii
ABSTRACT
One of the issues for the development of fuel ethanol worldwide is the concern about global climate change which is primarily caused by burning fossil fuels; substantial scientific evidence abounds pointing to greenhouse gas (GHG) emissions as the cause of accelerating global warming. Regardless of the great potentials posed by fuel ethanol in comparison to gasoline fuels, stress corrosion cracking (SCC) in the presence of fuel ethanol has recently been recognized and identified as a phenomenon in end-user storage and blending facilities. Because of this failure, there is concern about the ability of pipelines to safely transport ethanol to and from blending terminals. Predictions on the performance of pipeline steels in fuel ethanol environments, are therefore, needed in solving the ethanol SCC problem. This study determined the influence of sodium chloride and ethanol concentrations on the corrosion rate and polarization behaviours, J-R curves, fracture toughness, blunting slope and tearing modulus of micro-alloyed and API-5L X65 steels in simulated fuel ethanol environment. It also determined the failure modes and morphological changes in the steels when exposed to the fuel ethanol environment through fractography and microscopic techniques. This was with a view to predicting the performance of pipeline steels in fuel ethanol towards solving the stress corrosion cracking problems of steels. Furthermore, the uniqueness of this work lies in the prediction of fracture toughness (Ji, J0.2, KJ0.2), and tearing modulus (TR) of the two pipeline steels in E20 and E80 fuel ethanol environments. E20, E40 and E80 blends were used for corrosion studies, while fracture studies were carried out in E20 and E80 blends. The influence of chloride concentration on the corrosion parameters revealed that mass loss of MAS increased with increase in chloride from 32 mg/l to 64 mg/l, while for API-5L X65 steel, adsorption of chloride ions up to 64 mg/l initiated a larger strength field which slowed down anodic dissolution and subsequently, corrosion rate in E20 and E40. Morphological examination of MAS and API-5L X65 steel after immersion tests revealed increase in pitting tendencies with increase in chloride concentration. With respect to fracture resistance, chloride enhanced crack tip blunting of API-5L X65 steel in both E20 and E80 environments, thereby increasing fracture toughness but then, the degrading effect of chloride was obvious in causing quasi-cleavage fracture. On the other hand, chloride resulted in decrease in crack tip blunting of MAS and reduction in fracture toughness. Both steels exhibited ductile fracture as failure modes in air, while in E20 environment, MAS exhibited transgranular fracture and API-5L X65 steel, ductile fracture. In E80 test environment, chloride resulted in increased resistance to ductile tearing for both steels, leading to transgranular fracture. Corrosion rates and fracture resistance of MAS and API-5L X65 steel were found to depend on changes in ethanol concentration regardless of the chloride content. Both materials displayed better compatibility with E20 environment. MAS was found to be more compatible with both E20 and E80 environments in comparison with API-5L X65 steel based on its Ji, J0.2, and TR values. MAS displayed less susceptibility to corrosion in E20, E40 and E80 fuel ethanol environments based on its mass loss, icorr-estimate and Ecorr values. The results of this study have significant contribution to pipeline engineering and the automobile fuel lines in recommending MAS as more compatible with E20, E40 and E80 fuel ethanol environments than API-5L X65 steel.
viii
TABLE OF CONTENTS
DECLARATION………………………………………………………………………… ii
CERTIFICATION……………………………………………………………………….. iii
DEDICATION……………………………………………………………………………. iv
ACKNOWLEDGEMENT ……………………………………………………………... v
ABSTRACT……………………………………………………………………………..... vii
TABLE OF CONTENTS……………………………………………………………….... viii
LIST OF FIGURES……………………………………………………………………… xii
LIST OF TABLES……………………………………………………………………….. xvi
LIST OF PLATES……………………………………………………………………….. xvii
APPENDIX……………………………………………………………………………….. xxi
LIST OF ABBREVIATIONS ……………………………………………………………xxii
LIST OF SYMBOLS …………………………………………………………………….xxiii
CHAPTER ONE: INTRODUCTION………………………………………………... 1
1.1 Background Information…………………………………………………………… 1
1.2 Statement of the Problem…………………………………………………………... 3
1.3 Aim and Objectives of the Study………………………………………………….. 5
1.4 Scope of the Study………………………………………………………………… 6
1.5 Justification of the Study…………………………………………………………... 7
1.6 Limitations of the Study …………………………………………………………....7
1.7 Thesis Organization ……………………………………………………………...... 7
CHAPTER TWO: LITERATURE REVIEW……………………………………….. 9
2.1 Introduction………………………………………………………………………… 9
2.2 Metallic Corrosion…………………………………………………………………. 9
2.2.1 Corrosion Potential ……………………………………………………………... 10
2.2.2 Passive Films…………………………………………………………………… 12
2.2.3 Breakdown of Passive Films by Chloride ions…………………………………… 15
2.2.4 Corrosion Forms………………………………………………………………… 17
2.2.5 Alcoholic Corrosion Environments ……………………………………………... 20
2.3 Stress Corrosion Cracking in Fuel Ethanol Environments………………………… 26
2.3.1 Supply Chain of Fuel Ethanol………………………………………………….. 26
2.3.2 Documented Cases of SCC in Fuel Ethanol ……………………………………... 28
ix
2.3.3 Previous Research on Corrosion in Fuel Ethanol Environments………………… 32
2.4 Fracture Mechanics………………………………………………………………… 38
2.4.1 Fracture Mechanics Approach to Design……………………………………….. 42
2.4.2 Linear Elastic Fracture Mechanics ……………………………………………... 45
2.4.3 Elastic-Plastic Fracture Mechanics……………………………………………… 47
2.4.4 Laboratory Measurement of J…………………………………………………… 53
2.4.5 Stretch Zone Width ……………………………………………………………... 56
CHAPTER THREE: MATERIALS AND METHODS……………………………….. 58
3.1 Materials and Test Environments………………………………………………….. 58
3.1.1 Materials and Sample Design…………………………………………………… 58
3.1.2 Test Environments……………………………………………………………… 63
3.2 Methods …………………………………………………………………………… 63
3.2.1 Microstructural Examination………………………………………………….. 63
3.2.2 Tensile Test……………………………………………………………………. 65
3.2.3 Hardness Test………………………………………………………………….. 65
3.2.4 Electrochemical Measurements……………………………………………….. 65
3.2.5 Immersion Tests……………………………………………………………….. 68
3.2.6 Monotonic J Testing…………………………………………………………... 71 3.2.6.1 Specimen precracking…………………………………………………......... 71
3.2.6.2 Monotonic J tests…………………………………………………………… 74
3.2.6.3 Optical crack size measurement…………………………………………… 75
3.2.6.4 Fractography………………………………………………………………… 82
3.2.7 J-Test Data Analysis…………………………………………………………... 82 3.2.7.1 Load-displacement plot…………………………………………………….. 82
3.2.7.2 Calculation of crack size…………………………………………………… 82
3. 2.7.3 Calculation of K……………………………………………………………… 82
3. 2.7.4 Calculation of J……………………………………………………………….83
3.2.8 XRD Analysis ……………………………………………………………... 84
3.2.9 Raman Spectroscopy………………………………………………………….. 86
CHAPTER FOUR: RESULTS AND DISCUSSION…………………………………. 88
4.1 Introduction………………………………………………………………………… 88
4.2 PART A: Corrosion Behaviour of MAS and API-5L X65 steel in Simulated E20,
E40 and E80 Environments………………………………………………………... 89
x
4.2.1 Long-term Immersion Tests……………………………………………………. 89
4.2.1.1 Effect of chloride concentration on corrosion rate of MAS………………… 89
4.2.1.2 Effect of chloride concentration on corrosion rate of API-5L X65 Steel ……... 91
4.2.1.3 Effect of ethanol concentration on corrosion rate of MAS……………………… 93
4.2.1.4 Effect of ethanol concentration on corrosion rate of API-5L X65……………… 93
4.2.1.5 Visual examination and microscopy ………………………………………..96
4.2.2 Cyclic Potentiodynamic Polarization Tests………………………………………. 107
4.2.2.1 Effect of ethanol concentration on anodic polarization of MAS ……………... 107
4.2.2.2 Effect of ethanol concentration on anodic polarization of API-5L X65………… 107
4.2.2.3 Post-corrosion optical microscopic examination …………………………..112 4.2.3 Characterization of the Oxide Layers Growing on MAS and API-5L X65 Steel
Exposed E20, E40 and E80 ……………………………………………………... 121
4.2.4 Summary……………………………………………………………………….. 124
4.3 PART B: Fracture Behaviour of MAS and API-5L X65 steel in Simulated E20
and E80 Environments……………………………………………………………... 125
4.3.1 Tensile Behaviour ……………………………………………………………... 125
4.3.2 J-R Curve Determination………………………………………………………… 127
4.3.2.1 Adjustment of 𝑎𝑎𝑜𝑜𝑜𝑜…………………………………………………………… 127
4.3.2.2 Calculation of an interim J0.2………………………………………………… 130
4.3.3 Effect of Chloride on Fracture Behaviour in E20 Environment……………………. 130
4.3.3.1 Effect of chloride on the load-displacement plots in E20 ……………………... 131
4.3.3.2 Effect of chloride on J-R curves in E20 ……………………………………... 134
4.3.3.3 Effect of chloride on fracture toughness in E20…………………………….. 141
4.3.3.4 Effect of chloride on KJ0.2 in E20 ………………………………………147
4.3.3.5 Effect of chloride on blunting slope in E20…………………………………. 150
4.3.3.6 Effect of chloride on dimensionless tearing modulus in E20…………………… 150
4.3.3.7 Fractographic study of MAS tested in air and E20 environment ………… 154
4.3.3.8 Fractographic study of API-5L X65 steel tested in air and E20
environment ……………………………………………………………….. 161
4.3.3.9 Summary……………………………………………………………………. 165
4.3.4 Effect of Chloride on Fracture Behaviour in E80 Environment……………………. 166
4.3.4.1 Effect of chloride on the load-displacement plots in E80…………………… 166
4.3.4.2 Effect of chloride on J-R Curves in E80 ………………………………………169
4.3.4.3 Effect of chloride on fracture toughness in E80 ………………………………171
xi
4.3.4.4 Effect of chloride on KJ0.2 in E80 ………………………………………179
4.3.4.5 Effect of chloride on blunting slope in E80…………………………………. 182
4.3.4.6 Effect of chloride on dimensionless tearing modulus in E80…………………… 182
4.3.4.7 Fractographic study of MAS tested in air and E80 environment ………… 185
4.3.4.8 Fractographic study of API-5L X65 steel tested in air and E80
environment ……………………………………………………………….. 189
4.3.4.9 Summary……………………………………………………………………. 192 4.3.5 Effect of Ethanol Concentration on the Fracture Behaviour of API-5L X65 and
Micro-alloyed Steels in Simulated Fuel Ethanol Environment…………………… 193
4.3.5.1 Effect of ethanol on the J-R curves …………………………………………... 193
4.3.5.2 Effect of ethanol on fracture toughness ………………………………………. 196
4.3.5.3 Effect of ethanol on blunting slope …………………………………………... 200
4.3.5.4 Effect of ethanol on dimensionless tearing modulus …………………………... 202
4.3.5.5 Summary…………………………………………………………………… 205
4.4 Width of Stretch Zones on Fracture Toughness Specimens……………………….. 206
4.4.1 Summary……………………………………………………………………….. 232
CHAPTER FIVE: CONCLUSION AND RECOMMENDATION ………………… 233
5.1 Introduction ……………………………………………………………………….. 233
5.2 Conclusion on Corrosion and Morphological Behaviour …………………………. 233
5.3 Conclusion on Fracture behaviour and Failure Modes ……………………………. 234
5.4 Contributions to Knowledge ………………………………………………………. 235
5.5 Recommendations for Future Work ……………………………………………….. 236
REFERENCES ……………………………………………………………………………. 237
List of Publications ………………………………………………………………………... 252
APPENDIX ……………………………………………………………………………….. 253
xii
LIST OF FIGURES
Figure 2.1: Conceptual potential-current curves of anodic and cathodic reactions
for metallic corrosion (Sato, 2012) 11
Figure 2.2: Passivation of metals and its stability (Sato, 2012) 13
Figure 2.3: Schematic potential-current curves for metallic passivation (Sato, 2012) 16
Figure 2.4: Component failure frequencies (Baldev et al., 2009) 27
Figure 2.5: The three modes of loading that can be applied to a crack
(Anderson, 1995) 41
Figure 2.6: The strength of materials approach (Anderson, 1995) 43
Figure 2.7: Typical fracture mechanics approach (Anderson, 1995) 44
Figure 2.8: Simplified family tree of fracture mechanics (Anderson, 1995) 46
Figure 2.9: Crack tip opening displacement (CTOD) (Anderson, 1995) 49
Figure 2.10: Schematic comparison of the stress-strain behaviour of
elastic-plastic and nonlinear elastic materials (Anderson, 1995) 51
Figure 2.11: Arbitrary contour around the tip of a crack (Anderson, 1995) 52
Figure 2.12a: 𝐽𝐽 vs ∆𝑎𝑎 curve for establishing 𝐽𝐽𝐼𝐼𝐼𝐼 (Dieter, 1988) 55
Figure 2.12b: Sketch of a specimen fracture surface showing how ∆𝑎𝑎 is determined 55
Figure 3.1: Tensile test specimens design for (a) API-5L X65 steel, and
(b) Micro-alloyed steel 61
Figure 3.2: Specimen dimension and configuration for three-point bend test
(all dimensions in mm) 62
Figure 3.3: Typical envelope of fatigue crack and starter notch 73
Figure 3.4: Loading/unloading/reloading sequence for J test 78
Figure 4.1: Effect of chloride on the corrosion rate of MAS in simulated
E20, E40 and E80 fuel ethanol environments 90
Figure 4.2: Effect of chloride on the corrosion rate of API-5L X65 in simulated
E20, E40 and E80 fuel ethanol environments 92
Figure 4.3: Effect of ethanol concentration on corrosion rate of MAS in simulated
fuel ethanol with 0, 32 and 64 mg/l NaCl 94
Figure 4.4: Effect of ethanol concentration on corrosion rate of API-5L X65 in
simulated fuel ethanol with 0, 32 and 64 mg/l NaCl 95
Figure 4.5: Anodic polarization curves for MAS in simulated fuel ethanol
(a) without NaCl, (b) with 32 mg/l NaCl, and (c) with 64 mg/l NaCl 108
xiii
Figure 4.6: Anodic polarization curves for API-5L X65 in simulated fuel
ethanol (a) without NaCl, (b) with 32 mg/l NaCl, and
(c) with 64 mg/l NaCl 110
Figure 4.7: XRD analyses of corrosion products from MAS and API-5L X65 in
simulated fuel ethanol showing the presence of lepidocrocite, hematite
and iron (II) acetate 122
Figure 4.8: Raman shift of corrosion products from MAS and API-5L X65
in simulated fuel ethanol showing the presence of iron hydroxide,
maghemite and goethite 123
Figure 4.9: Stress-Strain curves of MAS and API-5L X65 steel after tensile tests 126
Figure 4.10: Comparison of typical load versus load-line displacement plots for
(a) MAS and (b) API-5L X65 steel in air and E20 environment 132
Figure 4.11: Comparison of Pmax versus load-line displacement plots for (a) MAS
and (b) API-5L X65 steel in air and in E20 environment 133
Figure 4.12: Comparison of J-R Curves for MAS and API-5L X65 in air 135
Figure 4.13: J-R curves obtained from (a) MAS specimens, (b) API-5L X65 specimens
in air and E20 environment 136
Figure 4.14: Identification of J0.2 on the J-R curve obtained from (a) MAS, and
(b) API-5L X65 specimens in air 138
Figure 4.15: Identification of J0.2 on the J-R curve obtained from (a) MAS, and
(b) API-5L X65 specimens in E20 without chloride 139
Figure 4.16: Identification of J0.2 on the J-R curve obtained from (a) MAS, and
(b) API-5L X65 specimens in E20 with 32 mg/l NaCl 140
Figure 4.17: Variation of fracture toughness J0.2 with test environment 142
Figure 4.18: Variation of initiation toughness Ji with test environment 144
Figure 4.19: Variation of KJ0.2 with test environment for (a) MAS and
(b) API-5L X65 steel 148
Figure 4.20: Comparison of KJ0.2 for MAS and API-5L X65 steel in E20 with
respect to Air 149
Figure 4.21: Variation of blunting slope, M with test environment 151
Figure 4.22: Variation of dimensionless tearing modulus, TR with test environment
for (a) MAS and (b) API-5L X65 steel 152
Figure 4.23: Comparison of TR for MAS and API-5L X65 steel in E20 with
respect to air 153
xiv
Figure 4.24: Comparison of load versus load-line displacement plots for (a) MAS
and (b) API-5L X65 steel in air and E80 environment 167
Figure 4.25: Comparison of Pmax versus load-line displacement plots for (a) MAS
and (b) API-5L X65 steel in air and in E80 environment 168
Figure 4.26: J-R curves obtained from (a) MAS specimens, and (b) API-5L X65
specimens 171
Figure 4.27: Identification of J0.2 on the J-R curve obtained from (a) MAS and
(b) API-5L X65 specimens in E80 without chloride 172
Figure 4.28: Identification of J0.2 on the J-R curve obtained from (a) MAS and
(b) API-5L X65 specimens in E80 + 32 mg/l NaCl 173
Figure 4.29: Variation of critical fracture toughness J0.2 with test environment 174
Figure 4.30: Variation of initiation fracture toughness Ji with test environment 176
Figure 4.31: Variation of KJ0.2 with test environment for (a) MAS and
(b) API-5L X65 steel 180
Figure 4.32: Comparison of KJ0.2 for MAS and API-5L X65 steel in E80 with
respect to air 181
Figure 4.33: Variation of blunting slope, M with test environment 183
Figure 4.34: Variation of tearing modulus, TR with test environment for (a) MAS and
(b) API-5L X65 steel 184
Figure 4.35: Comparison of TR for MAS and API-5L X65 steel 186
Figure 4.36: J-R curves obtained from (a) MAS and (b) API-5L X65 specimens in
the absence of chloride and with respect to air 194
Figure 4.37: J-R curves obtained from (a) MAS and (b) API-5L X65 specimens in
the presence of 32 mg/l NaCl and with respect to air 195
Figure 4.38: Variation of critical fracture toughness J0.2 with test environment (a) in the
absence of NaCl, (b) in 32 mg/l NaCl, with respect to air 197
Figure 4.39: Variation of initiation fracture toughness Ji with test environment (a) in the
absence of NaCl, (b) in 32 mg/l NaCl, with respect to air 198
Figure 4.40: Variation of fracture toughness J0.2 with test environment (a) in the
absence of NaCl, (b) in 32 mg/l NaCl, with respect to air 199
Figure 4.41: Variation of blunting slope with test environment (a) in the absence of
NaCl, (b) in 32 mg/l NaCl, with respect to air 201
Figure 4.42: Variation of TR with test environment (a) in the absence of NaCl,
(b) in 32 mg/l NaCl, with respect to air 203
xv
Figure 4.43: Comparison of TR for MAS and API-5L X65 steel with respect to
ethanol concentration and (a) 0 mg/l NaCl, (b) 32 mg/l NaCl 204
Figure 4.44: Typical J-R curve showing the estimation of Jstr from SZW 229
Figure 4.45: Variation of Ji and Jstr of MAS specimens with (a) E20 and,
(b) E80 test environment 230
Figure 4.46: Variation of Ji and Jstr of API-5L X65 specimens with (a) E20 and,
(b) E80 test environment 231
xvi
LIST OF TABLES
Table 2.1: Metal/environment combination exhibiting SCC (Zuhair, 2013) 21
Table 2.2: Parameters of fuel ethanol in comparison with petrol
(Paul and Kemnitz, 2006) 22
Table 2.3: Illustration of integrity threats for pipelines and storage tanks arising from
Biofuels transportation in addition to other known threats
(Sridhar et al., 2010) 25
Table 2.4: Quality specification of fuel ethanol per ASTM D4806
(API Bulletin 939E, 2008) 33
Table 3.1: Chemical composition of MAS and API-5L X65 steels
in as-received condition 59
Table 3.2: Mechanical properties of MAS and API-5L X65 steels
in as-received condition 60
Table 3.3: Composition of simulated fuel ethanol based on ASTM D 4806 64
Table 4.1: Anodic polarization data for MAS in E20, E40 and E80 environments 109
Table 4.2: Anodic polarization data for API-5L X65 in E20, E40 and E80
environments 111
Table 4.3: Qualifying criteria for fracture toughness JIC in the case of MAS 145
Table 4.4: Qualifying criteria for fracture toughness JIC in the case of
API-5L X65 steel 146
Table 4.5: Qualifying criteria for fracture toughness JIC in the case of MAS 177
Table 4.6: Qualifying criteria for fracture toughness JIC in the case of
API-5L X65 steel 178
Table 4.7: Stretch zone width of Micro-alloyed steel tested in air 210
Table 4.8 Stretch zone width of Micro-alloyed steel tested in E20+0 mg/l NaCl 212
Table 4.9 Stretch zone width of Micro-alloyed steel tested in E20+32 mg/l NaCl 214
Table 4.10 Stretch zone width of Micro-alloyed steel tested in E80+0 mg/l NaCl 216
Table 4.11 Stretch zone width of Micro-alloyed steel tested in E80+32 mg/l NaCl 218
Table 4.12 Stretch zone width of API-5L X65 steel tested in air 220
Table 4.13 Stretch zone width of API-5L X65 steel tested in E20+0 mg/l NaCl 222
Table 4.14 Stretch zone width of API-5L X65 steel tested in E20+32 mg/l NaCl 224
Table 4.15 Stretch zone width of API-5L X65 steel tested in E80+0 mg/l NaCl 226
Table 4.16 Stretch zone width of API-5L X65 steel tested in E80+32 mg/l NaCl 228
xvii
LIST OF PLATES
Plate 2.1: Locations of Ethanol SCC near Fillet Welds Used to Make the
Branch Connections to the Piping (API Technical Report 939-D, 2013) 29
Plate 2.2: Photograph of Cracked Steel Elbow Welded to the Flange
(API Technical Report 939-D, 2013) 30
Plate 2.3: SCC Failures showing a) SCC in Steel Tank Bottom, b) SCC in
Steel Air Eliminator Vessel, c) Leak in Piping Resulting from a
crack Adjacent to the Weld, d) Multiple Crack Initiations and
Through-thickness propagation in Piping (API Bulletin 939E, 2013) 31
Plate 3.1: Electrochemical test setup containing a) E80 test solution and b) E40
test solution 66
Plate 3.2: Mounted samples for electrochemical tests showing a) before testing and b)
after testing 67
Plate 3.3: The test solution a) before electrochemical test and b) after
electrochemical test 69
Plate 3.4: Immersion test setup showing samples suspended in E20 and E80 test
Environments 70
Plate 3.5: Fatigue precracking test setup showing a) the INSTRON 8501
servohydraulic universal testing machine, and b) the sample loaded in
three-point bending 72
Plate 3.6: Three-point bend test set-up with environmental chamber for
test solution 76
Plate 3.7: Test set-up showing (a) the covering of the tank to minimize evaporation
and (b) the sample loaded in three-point bending and the test solution 77
Plate 3.8: Typical appearance of API-5L X65 (a) before and (b) after J integral test 79
Plate 3.9: Typical appearances of MAS (a) before and (b) after the J integral test 80
Plate 3.10: Typical fracture surface of (a) API-5L X65 steel and (b) MAS after
exposure to fuel ethanol environment showing the thumbnail shape
ahead of the fatigue crack 81
Plate 3.11: Bruker D8 Discover X-ray diffractometer 85
Plate 3.12: Nicolet Almega XR Dispersive Raman Spectrometer (530nm laser power) 87
Plate 4.1: SEM images showing the microstructures of a) MAS and b) API-5L X65
steel at 2000x in as-received condition 97
xviii
Plate 4.2: Visual appearance of MAS exposed to ethanol fuels at 27oC after 60
days. (A) E20 + 0 mg/l NaCl, (B) E40 + 0 mg/l NaCl, (C) E80 + 0 mg/l
NaCl, (D) E20 + 32 mg/l NaCl, (E) E40 + 32 mg/l NaCl, (F) E80 + 32 mg/l
NaCl 98
Plate 4.3: Post-corrosion SEM images of MAS at 1000x after 60 days
immersion in a) E20, b) E40 and c) E80 in the absence of NaCl 99
Plate 4.4: Post-corrosion SEM images of MAS at 1000x after 60 days
immersion in a) E40 and b) E80 with additions of 32 mg/l NaCl 100
Plate 4.5: Post-corrosion SEM images of MAS at 1000x after 60 days
immersion in a) E20, b) E40 and C) E80 with additions of 64 mg/l NaCl 101
Plate 4.6: Visual appearance of API-5L X65 exposed to ethanol fuels at 27oC after
45 days. (A) E20 + 0 mg/l NaCl, (B) E40 + 0 mg/l NaCl, (C) E80 + 0 mg/l
NaCl, (D) E20 + 32 mg/l NaCl, (E) E40 + 32 mg/l NaCl, (F) E80 + 32 mg/l
NaCl 103
Plate 4.7: Post-corrosion SEM images of API-5L X65 at 1000x after 45 days
immersion in a) E20, b) E40 and c) E80 without NaCl 104
Plate 4.8: Post-corrosion SEM images of API-5L X65 at 1000x after 45 days
immersion. (a) E20, (b) E40 with additions of 32 mg/l NaCl, (c) EDX of
corrosion products on E40 showing presence of iron oxides 105
Plate 4.9: Post-corrosion SEM images of API-5L X65 at 1000x after 45 days
immersion in a) E20 and b) E40 with additions of 64 mg/l NaCl 106
Plate 4.10: Optical image showing corrosion of MAS at magnifications
of a) 20x and b) 50x after anodic polarization in E20 + 0 mg/l NaCl 113
Plate 4.11: Optical image showing corrosion of MAS at magnifications
of a) 20x and b) 50x after anodic polarization in E40 + 0 mg/l NaCl 114
Plate 4.12: Optical image showing corrosion of MAS at magnifications
of a) 20x and b) 50x after anodic polarization in E80 + 0 mg/l NaCl 115
Plate 4.13: Optical image showing corrosion of MAS at magnifications
of a) 20x and b) 50x after anodic polarization in E40 + 32 mg/l NaCl 116
Plate 4.14: Optical image showing corrosion of MAS at magnifications
of a) 20x and b) 50x after anodic polarization in E80 + 32 mg/l NaCl 117
Plate 4.15: Optical image showing corrosion of MAS at magnifications of a) 20x
and b) 50x after anodic polarization in E20 + 64 mg/l NaCl 118
Plate 4.16: Optical image showing corrosion of MAS at magnifications
xix
of a) 20x and b) 50x after anodic polarization in E40 + 64 mg/l NaCl 119
Plate 4.17: Optical image showing corrosion of MAS at magnifications
of a) 20x and b) 50x after anodic polarization in E80 + 64 mg/l NaCl 120
Plate 4.18: Fractographs of MAS tensile specimen 128
Plate 4.19: Fractographs of API-5L X65 tensile specimen 129
Plate 4.20: Fracture surface of MAS in air at magnification of 13x 155
Plate 4.21: Fracture surface of MAS in air at magnification of a) 500x showing
microvoid coalescence and b) 1000x showing microvoid coalescence
and facets at regions spanned within the arrows 156
Plate 4.22: Fracture surface of MAS in E20 without NaCl at magnification of 67x
showing the crack extension area 157
Plate 4.23: Fracture surface of MAS in E20 without NaCl at magnification of 2000x
showing quasi-cleavage fracture (a) within the crack extension area and
(b) at onset of crack extension 158
Plate 4.24: Fracture surface of MAS in E20 + 32 mg/l NaCl at magnification of 67x
showing the crack extension area 159
Plate 4.25: Fracture surface of MAS in E20 + 32 mg/l NaCl at magnification of
a) 1000x showing quasi-cleavage fracture; b) 2000x showing remaining
ferrite phases after selective dissolution of pearlite 160
Plate 4.26: Fracture surface of API-5L X65 in air at magnification of a) 100x showing
the crack extension region spanned by the red lines, and b) 1000x
showing ductile fracture 162
Plate 4.27: Fracture surface of API-5L X65 in E20 with zero chloride at magnification
of 500x showing ductile fracture and presence of corrosion products 163
Plate 4.28: Fracture surface of API-5L X65 in E20 with 32 mg/l NaCl at magnification
of a) 67x showing the crack extension region spanned by the red lines, and
b) 1000x showing cracks and quasi cleavage fracture 164
Plate 4.29: Fracture surface of MAS in E80 without chloride 187
Plate 4.30: Fracture surface of MAS in E80 with 32 mg/l NaCl 188
Plate 4.31: Fracture surface of API-5L X65 in E80 with 0 mg/l NaCl 190
Plate 4.32: Fracture surface of API-5L X65 in E80 with 32 mg/l NaCl 191
Plate 4.33: SEM fractograph of J-integral tested MAS specimen in air
showing (a) SZ and void coalescence ahead of fatigue
precrack, (b) delineation of SZW for measurement 209
xx
Plate 4.34: SEM fractograph of J-integral tested MAS specimen in E20 without
chloride showing (a) SZ and void coalescence ahead of fatigue precrack,
(b) delineation of SZW for measurement 211
Plate 4.35: SEM fractograph of J-integral tested MAS specimen in E20 with
32 mg/l NaCl showing (a) SZ and void coalescence ahead of fatigue
precrack, (b) delineation of SZW for measurement 213
Plate 4.36: SEM fractograph of J-integral tested MAS in E80 without NaCl showing
(a) SZ and void coalescence ahead of fatigue precrack, (b) delineation of
SZW for measurement 215
Plate 4.37: SEM fractograph of J-integral tested MAS in E80 with 32 mg/l NaCl
showing (a) SZ and void coalescence ahead of fatigue precrack,
(b) delineation of SZW for measurement 217
Plate 4.38: SEM fractograph of J-integral tested API-5L X65 steel in air showing
(a) SZ and void coalescence ahead of fatigue precrack, (b) delineation of
SZW for measurement 219
Plate 4.39: SEM fractograph of J-integral tested API-5L X65 steel in E20
without chloride showing (a) SZ and void coalescence ahead of
fatigue precrack, (b) delineation of SZW for measurement 221
Plate 4.40: SEM fractograph of J-integral tested API-5L X65 steel in E20 with
32 mg/l NaCl showing (a) SZ and void coalescence ahead of fatigue
precrack, (b) delineation of SZW for measurement 223
Plate 4.41: SEM fractograph of J-integral tested API-5L X65 steel in E80
without chloride showing (a) SZ and void coalescence ahead of
fatigue precrack, (b) delineation of SZW for measurement 225
Plate 4.42: SEM fractograph of J-integral tested API-5L X65 steel in E80 with
32 mg/l NaCl showing (a) SZ and void coalescence ahead of fatigue
precrack, (b) delineation of SZW for measurement 227

xxi
APPENDIX
A Typical FEG-SEM for Microstructural and Fractographic Examinations 258
B Typical Universal Hardness Tester (UH-3) 259
xxii
LIST OF ABBREVIATIONS
a.u Arbitrary unit
API American Petroleum Institute
ASTM American Standard for Testing Materials
CO Carbon monoxide
DNV Det Norske Veritas
DSHP Direct synthesis hydrogen peroxide
EDS Energy dispersive spectrometer
EDTA Ethylenediaminetetraacetic acid
ETBE Ethyl tertiary butyl ether
FGE Fuel grade ethanol
GDP Gross domestic product
GHG Greenhouse gas
MAS Micro-alloyed steel
Mpy Mils per year
NaCl Sodium chloride
N-SSR Notched- slow strain rate
OCP Open circuit potential
PPO Pure plant oil
RFA Renewable fuels association
SCC Stress corrosion cracking
SEM Scanning electron microscope
SFGE Simulated fuel ethanol environment
SSR Slow strain rate
SSRT Slow strain rate testing
US United States
XRD X-ray diffraction
xxiii
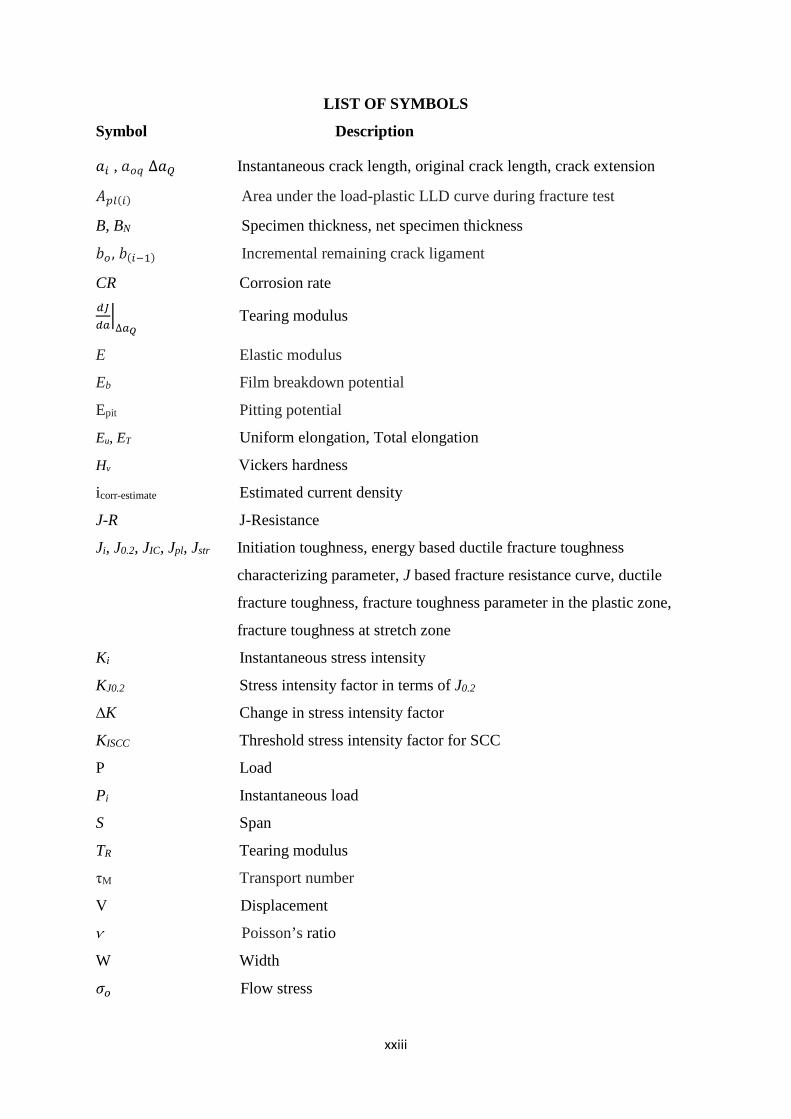
LIST OF SYMBOLS
Symbol Description
𝑎𝑎𝑖𝑖 , 𝑎𝑎𝑜𝑜𝑜𝑜 ∆𝑎𝑎𝑄𝑄 Instantaneous crack length, original crack length, crack extension
𝐴𝐴𝑝𝑝𝑝𝑝(𝑖𝑖) Area under the load-plastic LLD curve during fracture test
B, BN Specimen thickness, net specimen thickness
𝑏𝑏𝑜𝑜 , 𝑏𝑏(𝑖𝑖−1) Incremental remaining crack ligament
CR Corrosion rate 𝑑𝑑𝑑𝑑𝑑𝑑𝑑𝑑�∆𝑑𝑑𝑄𝑄
Tearing modulus
E Elastic modulus
Eb Film breakdown potential
Epit Pitting potential
Eu, ET Uniform elongation, Total elongation
Hv Vickers hardness
icorr-estimate Estimated current density
J-R J-Resistance
Ji, J0.2, JIC, Jpl, Jstr Initiation toughness, energy based ductile fracture toughness
characterizing parameter, J based fracture resistance curve, ductile
fracture toughness, fracture toughness parameter in the plastic zone,
fracture toughness at stretch zone
Ki Instantaneous stress intensity
KJ0.2 Stress intensity factor in terms of J0.2
∆K Change in stress intensity factor
KISCC Threshold stress intensity factor for SCC
P Load
Pi Instantaneous load
S Span
TR Tearing modulus
τM Transport number
V Displacement
ѵ Poisson’s ratio
W Width
𝜎𝜎𝑜𝑜 Flow stress

xxiv
ρ Notch root radius
% Percent
n Strain hardening exponent
σUTS Ultimate tensile stress
σYS Yield stress
~ Approximate
< Less than
1
CHAPTER ONE
INTRODUCTION
1.1 Background Information
Corrosion of metals has been an unavoidable part of human experience since a large
proportion of the world population live in close proximity to water and humid air. Due to
increased complication and multiplicity of material classifications (such as composites,
ceramics, polymers and metallic materials), the effect of corrosion on civilization and the
accompanying material degradation are far reaching (National Research Council, 2011).
Recent definitions have described corrosion as material degradation and its related loss of
function due to environmental effects (National Research Council, 2011). The major forms of
corrosion include uniform corrosion, pitting corrosion, crevice related corrosion,
intergranular corrosion, high-temperature corrosion, dealloying, galvanic corrosion, corrosion
fatigue and stress-corrosion cracking (SCC).
Stress corrosion cracking (SCC), being the focus of this research, is a brittle cracking process
arising from the synergistic action of a tensile stress in addition to a specific corrosive
environment. The tensile stress may be residual (arising from welding or fabrication
processes) or applied. SCC always initiates at stress raisers such as notches and sharp corners
present in the material. Three components of SCC can be summarized as: tensile stress,
specific corrosive environment and material susceptibility. Removing any of these, SCC will
be practically impossible. Ammonia damage to copper alloys, Chloride induced cracking of
stainless steels and caustic cracking of plain carbon steels are representative instances of this
problem.
According to Savell, Scott, Maurizio, Jim, Craig and Bill (2011), SCC is thought to be
nucleated at pitting damage sites and thereafter progresses as a highly branched network of
fine cracks, under the action of confined tensile stresses. SCC is hazardous because it can
cause sudden failure, often with disastrous consequences, which include loss of life. Alloys
are more susceptible to SCC than pure metals. A number of industries suffer this failure and
studies (Zuhair, 2013) have shown that one-third of all corrosion failures in chemical
industries were due to SCC. These include petroleum industries, stainless steel tubes of
nuclear power plants and aircraft industries.
Stress corrosion cracks are featured as highly branched intergranular or transgranular cracks.
Cracking occurs by initiation from stable pits in an alloy-environment system and growth,
2
penetrating further into the susceptible material leading to eventual fracture. Mechanical or
electrochemical means are often utilized to conduct SCC tests. Moreover, either method can
promote localized corrosion to facilitate determination of the inherent susceptibility of the
material. Among such methods are fracture mechanics, cyclic slow strain rate, slow strain
rate and electrochemical potential control.
Nowadays, the use of liquid fuels is prevalent in the transport sector due to ease of storage
(Micic and Jotanovic, 2015). The use of gaseous fuels for transportation is insignificant in
comparison with liquid fuels. Nevertheless, apart from the phase of matter, there are two
different fuel types namely, fuels obtained from fossil resources and biofuels made from
renewable resources (Micic and Jotanovic, 2015). It is important to note that biofuels being
renewable and sustainable energy sources are toxic-free and for this reason more
environmentally friendly than conventional petroleum-based fuels (Highina, Bugaje and
Umar, 2012; Munoz, Moreno and Morea, 2004). Furthermore, the inadvertent spill of
biofuels is of no significance with respect to environmental threats since biofuels are
biodegradable. Typical biofuels in use include Pure Plant Oil (PPO), Biodiesel, Ethyl Tertiary
Butyl Ether (ETBE), Biobutanol and Fuel ethanol. A study carried out by Dominic and
Rainer (2007) has shown that fuel ethanol can substitute petrol (Micic and Jotanovic, 2015).
Ethanol has many favourable properties, which makes it preferred for fuel than its fossil
counterpart (Micic and Jotanovic, 2015). The anti-knocking property of the fuel is influenced
by the octane number while its energy yield is about one third lower than petrol (Micic and
Jotanovic, 2015). In addition, ethanol can be blended with gasoline at any ratio depending on
the circumstances and the desired fuel. Typical fuel ethanol blends in use are: E5, E10, E20,
E25, E70, E85, E95 and E100 (Micic and Jotanovic, 2015). Remarkably, there have been
evidences of stress corrosion cracking of steel storage tanks and associated piping used in
fuel ethanol service during the past decade. Though SCC has not been extensive, it has
caused several failures in a number of user facilities (Kane, Maldonado and Klein, 2004).
Whilst most engineers and researchers are more acquainted with corrosion chemistry of
aqueous solutions (Kane et al., 2004), there are also completely different environments such
as non-aqueous and high-temperature environments. Fuel ethanol is an example of non-
aqueous environments. Nevertheless, during the past four years, a substantial testing effort on
the corrosion and stress corrosion cracking (SCC) of metallic and non-metallic materials in
fuel ethanol has been undertaken by various organizations. Various factors have been
3
associated with ethanol SCC of carbon steels which include conditions that promote crack
initiation and growth, dissolved oxygen concentration levels, chloride concentration,
corrosion potential, water content, and the chemical species of the ethanol itself.
There have been a substantial number of notched slow-strain rate (N-SSR) tests conducted
with the aim of studying stress corrosion crack initiation (SCCI) and propagation mechanisms
in fuel ethanol (Venkatesh, Chambers, Kane and Kirkham, 2010). It is worth noting that
significant concerns currently exist regarding the stress corrosion cracking (SCC) behaviour
of pipeline steels as well as terminal facilities used to handle fuel ethanol. There is currently
sparse literature on studies relating to investigating the fracture toughness of steels in fuel
ethanol environment. Providentially, some of the impending dangers posed by growing
technological complexity since World War II have been offset with the aid of advances in the
field of fracture mechanics (Gupta and Pachauri, 2012). Consequently, the field of fracture
mechanics has undeniably prevented a number of structural failures (Anderson, 1995). This
research is therefore, centered on investigating the corrosion and fracture behaviour of
pipeline steels such as API-5L X65 and Micro-Alloyed steels in simulated fuel ethanol
environments. The principle of Elastic-Plastic Fracture Mechanics was employed for the
fracture study.
1.2 Statement of the Problem
This research work addresses the importance of failure analysis and prevention with focus on
identifying critical failure modes in fuel ethanol environments, establishing the corrosion
rates, fracture toughness, critical crack sizes and tearing resistance of selected steels in the
environment of consideration. This will in turn aid material selection for fuel ethanol
applications. The research problems are highlighted below:
1. Degradation Effects of Corrosion and Stress Corrosion Cracking
The effects of corrosion on society are equally direct and indirect. Direct with regards to
corrosion effects on the valuable service lives of properties and belongings which include
outdoor furniture and metal tools, automobile body panels, and charcoal grills. The indirect
effect of corrosion on human lives is reflected by the cost incurred by manufacturers and
suppliers of merchandises and amenities, which are passed on to the users (Baldev, Kamachi
and Rangarajan, 2009).
4
The effects of corrosion are frequently described in economic expressions. In various studies,
financial losses have been evaluated and the conclusion that was drawn indicated that the
costs incurred due to premature materials degradation in industrialized nations is
approximately 3 percent of their gross domestic product (GDP). A recent update of findings
of the 1978 study on the topic: “Economic Effects of Metallic Corrosion in the United States”
reveals that an estimate of $2 - 4 trillion is lost to corrosion (the cost of repairing the
infrastructure damage inclusive) each decade in the United States (National Research
Council, 2011; Baldev et al., 2009). Capital costs are affected by corrosion as well as
additional operating costs.
Furthermore, majority of the failures in refining and petrochemical plants have been
discovered to be caused by corrosion, with the highest percentage due to SCC (Baldev et al.,
2009). Stress-corrosion failures can affect public health as in pollution due to escaping
product from corroded equipment or due to the corrosion product itself. Sudden failure could
result into explosion, fire, release of toxic products besides construction failure and global
sustainability in ways that cannot be reckoned solely in terms of GDP loss (Baldev et al.,
2009).
2. Fuel Ethanol in the Oil Industry and its associated problems
Significant scientific evidence abounds pointing to Greenhouse Gas (GHG) emissions as the
cause of increasing global warming (Micic and Jotanovic, 2015; Dominic and Rainer, 2007;
Highina et al., 2012). Consequently, measures to mitigate global warming have led to the
development of biofuels worldwide. Biofuels are renewable and sustainable energy sources
which are toxic-free and so more environmentally friendly than conventional petroleum-
based fuels (Micic and Jotanovic, 2015). Furthermore, reduction in the accumulation of CO
in the atmosphere is facilitated by use of biofuels. Although, PPO and biodiesel are suitable
for diesel engines, fuel ethanol has been found to be suitable for substituting petrol (Micic
and Jotanovic, 2015; Dominic and Rainer, 2007).
Regardless of the great potentials posed by fuel ethanol in comparison to gasoline fuels,
recently SCC in the presence of fuel ethanol has been recognized and identified as a
phenomenon in end-user storage and blending facilities. Because of this failure, there is
apprehension regarding the ability of pipelines to safely transport ethanol to and from
blending terminals (Sridhar, Gui, Beavers and James, 2010). Furthermore, with respect to
fuel transportation, pipelines form the major transport mode for petroleum fuels whereas rail,

5
truck and barges currently serve as the main transport system for ethanol (Sridhar et al.,
2010). Studies have shown that the rail, truck and barge transport modes are more expensive
and less efficient than pipeline transport for long distances (Sridhar et al., 2010).
It is worth noting that inspite of the substantial number of notched slow-strain rate (N-SSR)
test conducted so far to study stress corrosion cracking initiation and propagation
mechanisms in fuel ethanol, there are still growing concerns about the SCC behaviour of
pipelines used to handle fuel ethanol, and there is dearth of information on studies relating to
investigation of fracture toughness of steels in fuel ethanol environment. It is with a view to
extending knowledge in this area of study that this research seeks to center its investigation
on the corrosion characterization and fracture study of some pipeline steels in simulated fuel
ethanol environment.
1.3 Aim and Objectives of the Study
The aim of this study is to investigate the corrosion and fracture behaviour of API-5L X65
and Micro-alloyed steels in simulated fuel ethanol environments with a view to establishing
the suitability of the steels for fuel ethanol application.
The specific objectives of the study are to:
a. investigate the influence of sodium chloride and ethanol concentrations on corrosion
rate and polarization behaviour of API-5L X65 steel and MAS in simulated fuel
ethanol environments;
b. investigate the influence of sodium chloride and ethanol concentrations on J-R curves,
fracture toughness, blunting slope and tearing modulus of API-5L X65 steel and MAS
in simulated fuel ethanol environments; and
c. determine the failure modes and morphological changes through Fractography and
Microscopy.
1.4 Scope of the Study
This study involves the use of the following materials, methods and analysis to investigate
the corrosion and fracture behaviour of API-5L X65 and micro-alloyed steels in fuel ethanol
environments;
a. Material procurement
6
b. Material design and fabrication for corrosion and fracture tests.
c. Preparation of test environments using analytical grade reagents.
d. Characterization of as-received materials to determine the microstructure, tensile
properties, hardness and chemical compositions.
e. Immersion tests for mass loss determination.
f. Anodic polarization tests for determination of passivation behaviour.
g. Specimen precracking for J-integral tests.
h. Monotonic J-integral tests using Instron software for fracture mechanics tests.
i. Optical crack size measurements after J tests.
j. Data analysis and J-R curve determination.
k. Establishment of fracture toughness and critical crack sizes.
l. Microscopy and fractography.
m. Analysis of corrosion products.
1.5 Justification of the Study
1. Application of fracture mechanics principles in the fracture based environmental tests
using fuel ethanol environment is expected to provide data for evaluation of critical
loads and the remaining lives of pre-cracked specimens. Although researchers have
investigated the corrosion as well as stress corrosion cracking behaviour of some
steels in fuel ethanol, most of the tests carried out were achieved using SSR
techniques and fracture mechanics treatment of the data to determine KISCC without
evaluating fracture toughness (J0.2), tearing modulus (TR) and fracture toughness
(KJ0.2). This method (establishing these fracture parameters of steels in fuel ethanol
environments) is hitherto unique considering attempts at solving the ethanol SCC
problem.
2. Corrosion and stress corrosion cracking of numerous materials in fuel ethanol
environments have been investigated by researchers. Existing pipeline steels range
from X42 to recently developed X100 (Goodman and Singh, 2012). Since pipelines
are typically constructed from low carbon steels having high strength and toughness,
the micro-alloyed steel meets these requirements and is therefore suitable for use in
7
the pipeline industry. Investigation on the behaviour of micro-alloyed steels in fuel
ethanol is unique in this respect.
1.6 Limitations of the Study
The limitations of this study are presented in this section.
1. The results presented in this work are based on corrosion and fracture tests carried out
in simulated fuel grade ethanol. Commercial fuel grade ethanol was not used.
2. The fuel ethanol used was prepared with 195 proof ethanol. The use of 200 proof
ethanol is frequently reported in literature.
3. Electrochemical tests were carried out with saturated calomel electrode; hence the
influence of solution resistivity was not considered.
4. The investigations carried out on the influence of chloride are limited to 0, 32 and 64
mg/l NaCl concentrations.
1.7 Thesis Organization
The rest of the thesis is organized as follows: Chapter 2 deals with a review of metallic
corrosion with emphasis on corrosion potential and chloride breakdown of passive films,
forms of corrosion, alcoholic corrosion environments, stress corrosion cracking and fracture
mechanics principles. Chapter 3 describes the experimental methods, materials and testing
conditions used in the study. In Chapter 4, the results of experimentation are presented and
discussed in the following order:
a) Corrosion tests results, which encompasses the effect of NaCl concentration and
ethanol concentration on corrosion behaviour of MAS and API-5L X65 steel in E20
and E80 fuel ethanol environments, respectively;
b) A comparison of the corrosion behaviour of both MAS and API-5L X65 steel in the
fuel ethanol environments;
c) J-integral tests results, which entail the effect of NaCl concentration and ethanol
concentration on fracture parameters determined from the J tests; and
d) Measurement of stretch zone widths on fracture specimens.

8
Chapter 5 completes the thesis by summarizing the presented results in conclusions and
giving a global picture of the corrosion and fracture behaviour of MAS and API-5L X65
steels in E20 and E80 environments. The contributions of the research to knowledge are
highlighted with emphasis on its implications for the fuel industry and recommendations
for future study are also provided.
9
CHAPTER TWO
LITERATURE REVIEW
2.1 Introduction
In order to solve the problem of global warming in the world today, biofuels are currently
being used as an alternative to fossil fuels. Generally, biofuels such as ethanol offers great
advantages due to their chemical as well as physical characteristics, low production costs,
raw materials availability and environmental friendly effects, amongst several others (Baena,
Gomez and Calderon, 2012). Conversely, ethanol has certain drawbacks as regards material
compatibility. When ethanol is present in fuel, the fuel’s chemical composition may cause
corrosion on some parts of the automotive engine. As a result, materials which normally
would not corrode in gasoline may be damaged by the presence of ethanol. This chapter gives
a review of electrochemical aspects of metallic corrosion with emphasis on corrosion
potential and passive films. Previous investigations on the corrosion and stress corrosion
cracking behaviour of ethanol-gasoline blends are also reviewed in this chapter. In addition,
an explanation of the theoretical concepts of fracture mechanics is also presented with a view
to understanding the vital role played by this tool in corrosion failure analysis and prevention.
2.2 Metallic Corrosion
Metallic corrosion entails corrosion of metallic materials. In practice, metallic materials are
usually prone to corrosion in both aqueous and atmospheric environments. One of the major
problems frequently encountered in our industrialized society is metallic corrosion; thus,
corrosion is being studied extensively since the industrial revolution of the late eighteenth
century (Sharma, 2011; Sato, 2011). In the early twentieth century, modern corrosion science
started out through Evans’ model for local cell and the corrosion potential model shown by
Wagner and Traud (1938) (Sharma, 2011). In addition, the dual models which describe
metallic corrosion as a combined electrochemical reaction entailing anodic metal oxidation
and cathodic oxidant reduction, have united into the contemporary electrochemical concept of
corrosion. The electrochemical principle is relevant not merely to wet corrosion of metal at
normal temperature but likewise to dry corrosion of metal at elevated temperature (Sharma,
2011; Sato, 2011).

10
It is important to state that the elementary practice of metallic corrosion, which takes place in
aqueous solution comprises of metal anodic dissolution and oxidant cathodic reduction
processes (Sharma, 2011; Sato, 2011):
Where, is the base metal, is the hydrated metal ion in aqueous solution,
is the
electron in the metal, is an oxidant, is a reductant, and
is the
redox electron in the reductant (Sharma, 2011; Sato, 2011). The general corrosion reaction is
then written as follows:
The above reactions are charge-transfer procedures that transpire through the crossing point
in the middle of the aqueous solution and the metal, and are therefore, reliant on the
interfacial potential corresponding to the metal’s electrode potential as described in
electrochemistry (Sharma, 2011).
In practice, the processes involved for cathodic reactions in aqueous solutions include the
reduction of oxygen molecules and hydrogen ions during normal metallic corrosion. These
two cathodic reductions processes involve electron transfer occurring through the metal–
solution boundary, while a route for ion transfer through the interface is anodic metal
dissolution (Sato, 2011).
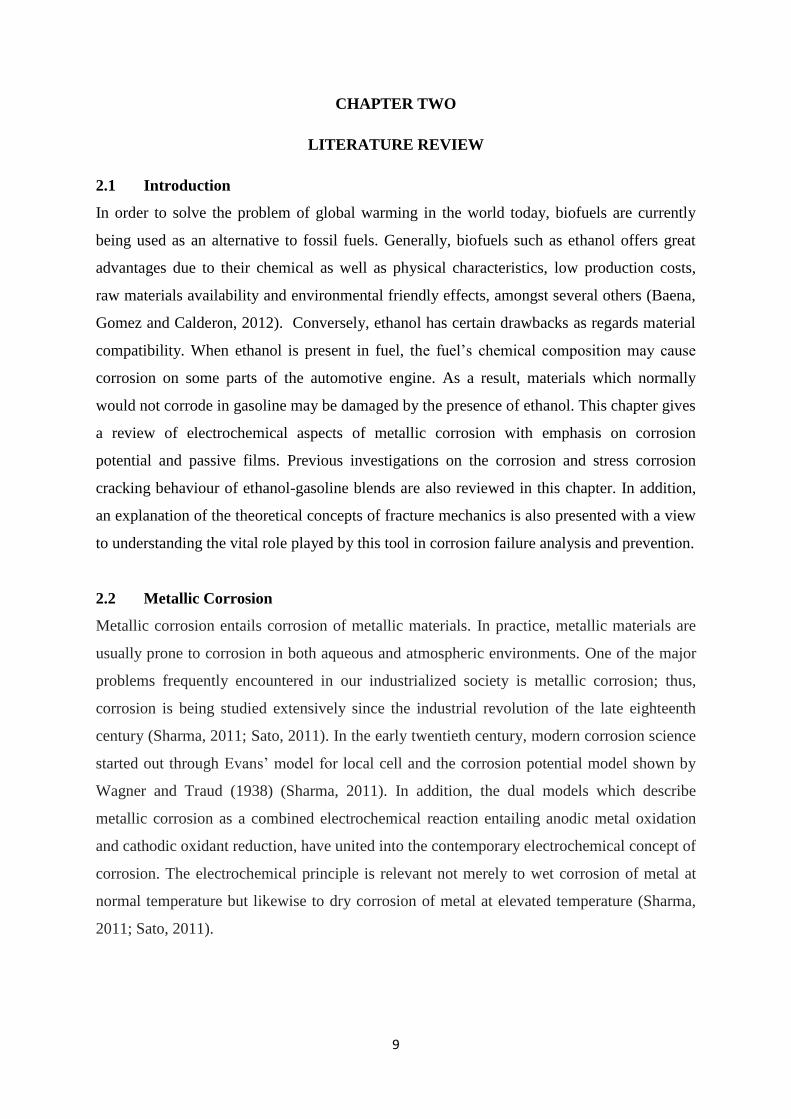
2.2.1 Corrosion Potential
The term, corrosion potential refers to the electrode potential possessed by a metal electrode
when it corrodes in an aqueous solution (Sharma, 2011). This corrosion potential is usually
anywhere in the range amid the equilibrium potential of the oxidant cathodic reduction and
the metal anodic dissolution. The corrosion kinetics of both anodic and cathodic reactions
shown in Figure 2.1 are defined by electrode potential versus reaction current curves also
known by electrochemists as the polarization curves of corrosion reactions (Sato, 2011). In
Figure 2.1, ia, ic, icorr, Ea, Ec and Ecorr represents the anodic reaction current, the cathodic
reaction current, the corrosion currents, the equilibrium potential of the anodic reaction, the
equilibrium potential of cathodic reaction and the corrosion potential, respectively.
11
Figure 2.1: Conceptual potential-current curves of anodic and cathodic reactions for metallic corrosion (Sharma,
2011).
Ea
icorr
Ecorr
Ec
ic
Po
ten
tia
l E
Current, i

12
The corrosion current and the corrosion potential represent the intersecting point of the
cathodic and anodic polarization curves, respectively (Sharma, 2011). Either the anodic or the
cathodic reaction helms corrosion rate in metals. Generally, cathodic hydrogen ion reduction
controls the degree of metallic corrosion in acidic solution, while cathodic oxygen reduction
specially controls corrosion rate in neutral solution (Sato, 2011).
Corrosion rate is controlled by cathodic reaction if the corrosion potential is far-off from the
cathodic reaction’s equilibrium potential. Furthermore, metallic corrosion is often measured
by oxygen diffusion in the direction of the oxidizing metal exterior in practice (Sharma,
2011). In such conditions, the oxygen equilibrium potential is less negative when compared
to the corrosion potential.
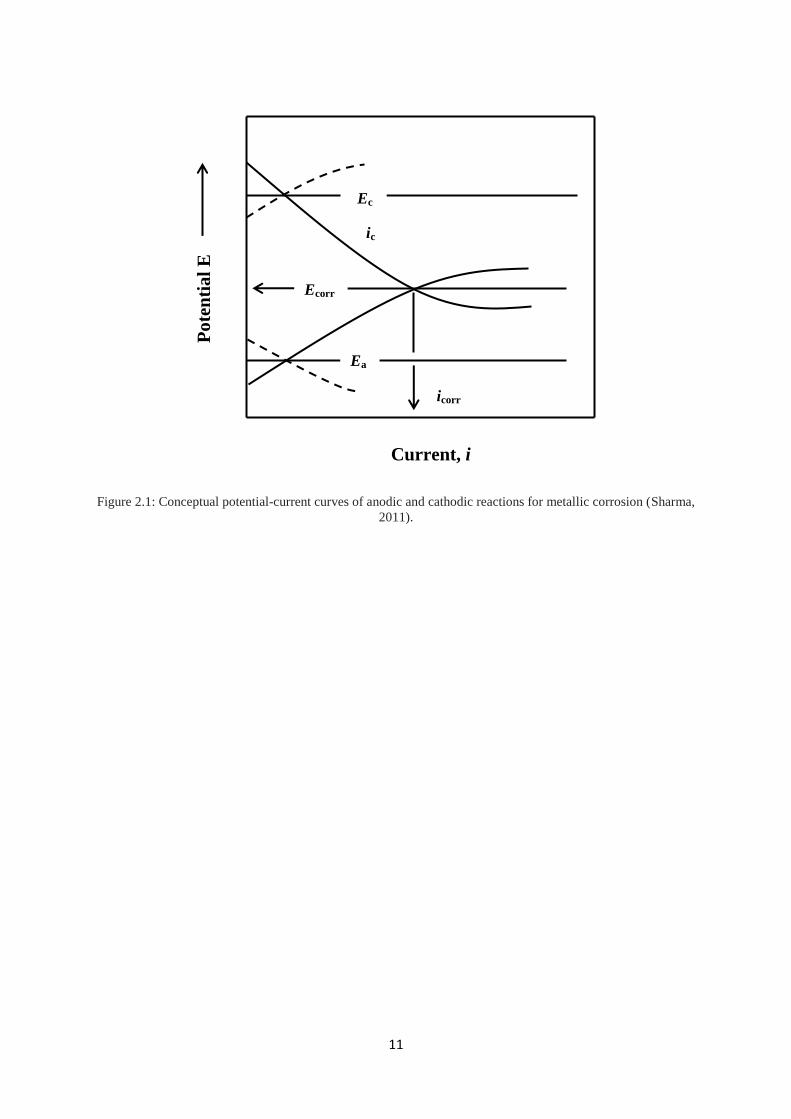
2.2.2 Passive Films
If the corrosion potential of a metallic electrode is held in the passive range, the electrode
could be made passive. As stated earlier, the corrosion potential is determined by both the
dissolution current of the anodic metal and reduction current of the cathodic oxidant (Sharma,
2011; Sato, 2011). Given that the maximum current at which a metal undergoes anodic
dissolution is greater than the cathodic current, the corrosion potential stays in the active state
(see Figure 2.2) (Sharma, 2011). On the other hand, when the anodic dissolution current is
surpassed by the cathodic current, the corrosion potential moves to the passive range
(Sharma, 2011). However, if the cathodic potential–current curve crosses the anodic
potential–current curve at two potentials, an unstable passive state arises, one in the active
state and the other in the passive state (Sharma, 2011). It has been shown that a metallic
electrode never repassivates in the unstable passive state, once its passivity breaks down,
since there is insufficient magnitude of cathodic current for clearing the anodic dissolution
current peak of the activated metal (Sharma, 2011; Sato, 2011).
On metals, the passive oxide film is very thin, of the order of a few nanometres, and
therefore, subtle to the surroundings wherein it is formed (Sharma, 2011). In the development
and growing processes of the film, the oxide ions form an inner oxide layer by migrating
from the solution through the film to the metal–oxide interface. The metal ions act in
response to solute anions and adsorbed water molecules, thereby, creating an external oxide
film by migrating from the metal to the oxide–solution interface (Sharma, 2011; Sato, 2011).
13
Figure 2.2: Passivation of metals and its stability. a) Active corrosion, b) unstable passivity, c) stable passivity
(Sharma, 2011).
𝒂 𝒃
ia
ic ic
ic
ia
ia
Po
ten
tial
E
𝐋𝐨𝐠 𝒊 𝐋𝐨𝐠 𝒊 𝐋𝐨𝐠 𝒊
𝒄
14
Occasionally, anions other than oxide ions are incorporated into the passive film and such
process occurs only once the adsorbed anions react with the migrating metal ions (Sharma,
2011).
The transport number, τM, of metal ion movement in the course of the film growth is
expressed by the ratio of the thickness of the outer anion-integrating film to the total layer.
For an anodic oxide film formed on aluminium in phosphate solution, which is 65 nm thick,
the transport number was found to be τM= 0.7–0.8 (Sharma, 2011; Sato, 2011). Passive film is
mostly amorphous; however, it may turn to be crystalline as the film grows thicker. It appears
to change from amorphous to crystalline at the anodic potential of approximately 8 V in the
case of passivity of metallic titanium in sulphuric acid solution, probably because of the
internal stress created in the film (Ohtsuka, Masuda and Sato, 1985; Sharma, 2011).
Passive films can be either semiconductors or insulators (Sharma, 2011). It is an n-type
semiconductor with donors in high concentration for metallic iron, titanium, tin, niobium, and
tungsten (Sharma, 2011). The passive film is made a p-type semiconductor oxide by metals
such as chromium, metallic nickel, and copper, while insulator oxides are the passive films on
metallic tantalum, aluminium, as well as hafnium (Sharma, 2011). Passive oxide films are
categorized into two: the network modifier and the network former (glass former) (Barr,
1979; Sharma, 2011; Sato, 2011). The latter, which includes aluminium, molybdenum,
titanium, silicon, and zirconium, usually creates a single-layered oxide film (Sharma, 2011).
In contrast, the network modifier, which comprises nickel, iron, copper, and cobalt, have a
tendency to form a multi-layered oxide film, for instance a cobalt oxide film, entailing an
inner divalent oxide layer and an outer trivalent oxide layer (Co/CoO/Co2O3) (Sharma, 2011;
Sato, 2011). Low-valence metal oxides usually seem to be less corrosion resistant than high-
valence metal oxides.
The anodic formation of network-forming oxides will probably produce a dehydrated
compact film containing no foreign anions other than oxide ions, since it is most likely
carried through the inward oxide ion migration to the metal–oxide interface. However,
network-modifying oxides forming a more or less defective film occasionally containing
foreign anions appear to grow through the outward metal ion migration to the oxide–solution
interface (Sharma, 2011; Sato, 2011). As the passive film is thus very thin, it is worth
observing that regardless of whether the passive film is a semiconductor or an insulator,
electrons readily moves through the film by means of the quantum mechanical electron

15
tunnelling mechanism (Sharma, 2011; Sato, 2011). However, by contrast, no ionic tunnelling
is allowed to occur across the passive film which constitutes a barrier layer to ion transfer but
not to electron transfer (Sharma, 2011). Therefore, just similar to the metal surface devoid of
any film, redox electron transfer reaction is permitted to ensue on the passive film-concealed
metal surface (Sharma, 2011).
2.2.3 Breakdown of Passive Films by Chloride ions
When there is existence of aggressive ions, for instance chloride ions in solution, the passive
film on metals may break down, and the resulting breakdown site may possibly cause
localized corrosion of the primary metals (Sharma, 2011; Sato, 2011). Beyond a definite
potential, called the film breakdown potential, Eb, breakdown of passive films due to chloride
generally occurs. As shown in Figure 2.3, either pitting corrosion or repassivation at the
juncture of film breakdown follows (Sharma, 2011).
Pitting corrosion is categorized using a threshold potential, called the pitting potential, Epit,
below which pitting ceases to occur and above which pitting grows (Sharma, 2011). Chloride
and hydrogen ions in solution are influenced by the two potentials, Eb and Epit. There is a
marginal concentration of chloride beneath which no film collapse occurs (Sharma, 2011;
Sato, 2011).
The concentration of chloride ions essential for film collapse is influenced by film defects,
film thickness, solution pH and the electric field intensity in the film, for chloride-breakdown
of passive film on metallic iron, (Sharma, 2011; Fushimi and Seo, 2001). It is also found that
before the underlying metal begins pitting at the film breakdown site, the passive film locally
dissolves and thins down (Fushimi and Seo, 2001; Heusler and Fisher, 1976; Sharma, 2011).
It is therefore, possible that film breakdown is from a localized mode of film dissolution and
not from mechanical rupture due to the adsorption of chloride ions. However, there is
frequent preferential break down of passive film at locations of crystal grain boundaries,
flaws on the metal surface and non-metallic inclusions (Sharma, 2011).
The passivity breakdown and pit initiation for stainless steels probably takes place at the
position of non-metallic MnS inclusions. Generally, it has been observed that localized
phenomena could be in some way stochastic and nondeterministic (Sharma, 2011). On
stainless steels, chloride-breakdown of passive films was found to be in agreement with a
stochastic distribution (Shibata, 1990; Sharma, 2011).
16
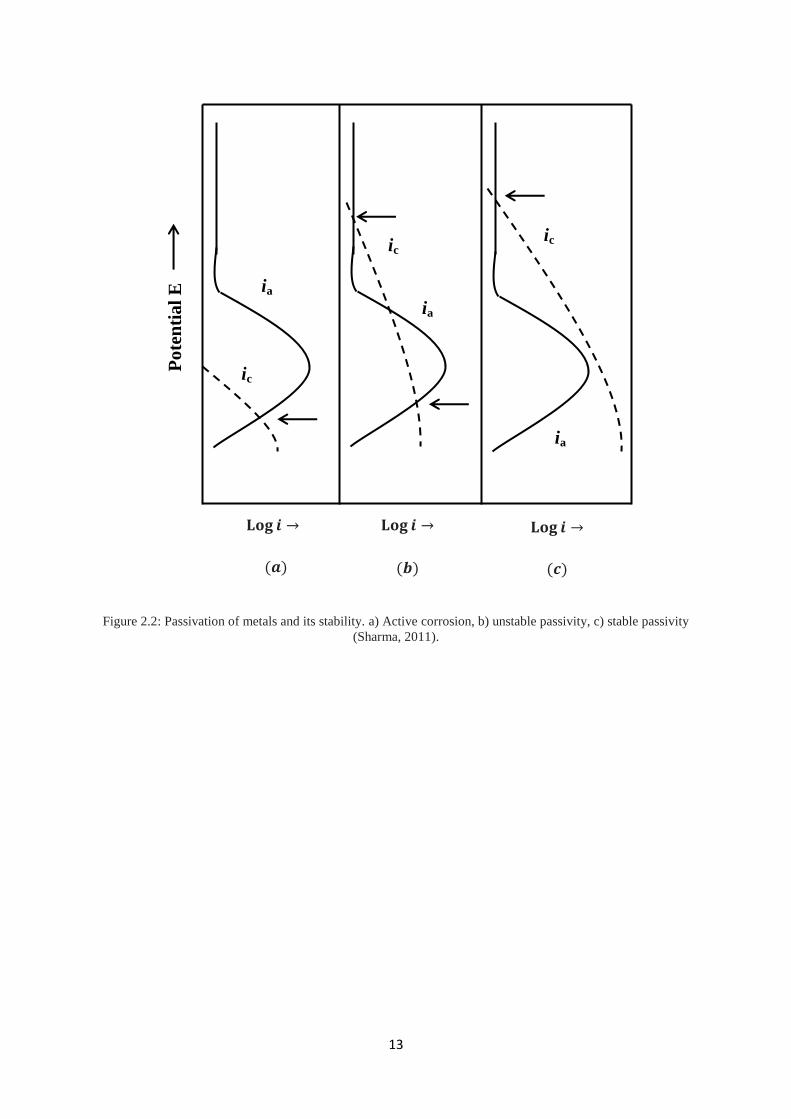
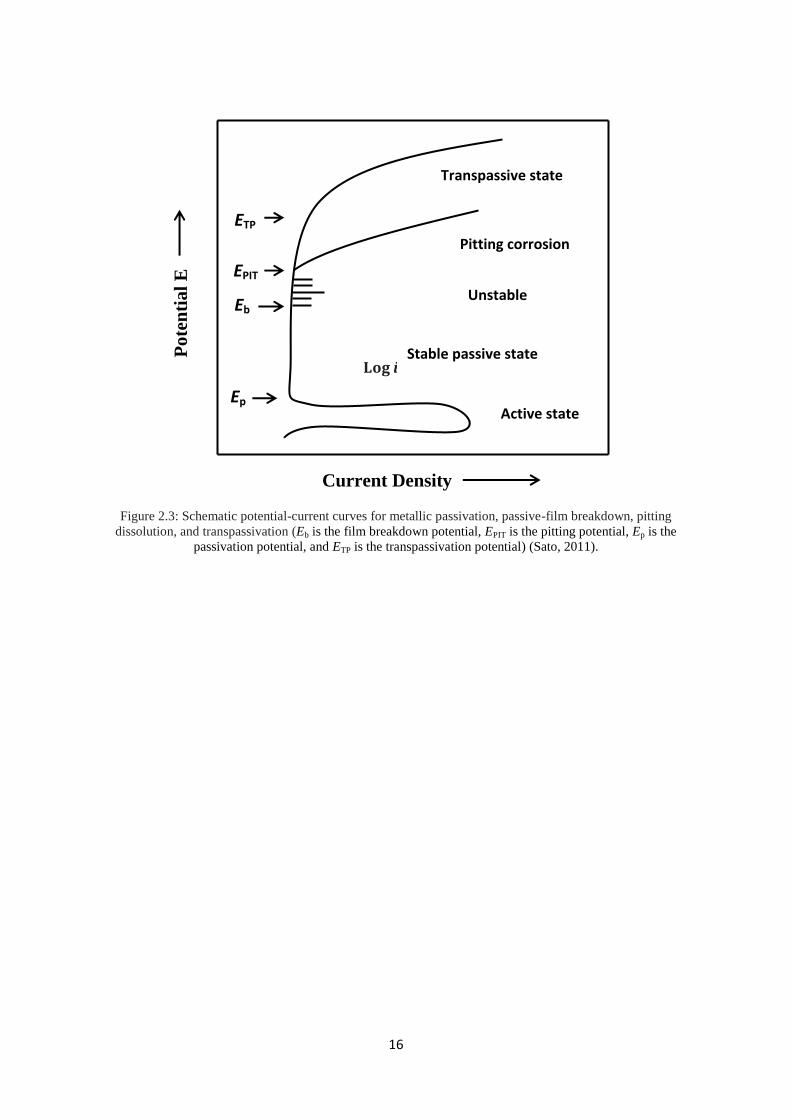
Figure 2.3: Schematic potential-current curves for metallic passivation, passive-film breakdown, pitting
dissolution, and transpassivation (Eb is the film breakdown potential, EPIT is the pitting potential, Ep is the
passivation potential, and ETP is the transpassivation potential) (Sato, 2011).
Transpassive state
Pitting corrosion
Unstable
pitting
Stable passive state
Active state
Po
ten
tial
E
ETP
EPIT
Eb
Ep
Current Density
17
At a potential either less positive (more cathodic) or more positive (more anodic) than the
film breakdown potential, Eb, the pitting potential, Epit, at which pitting begins to develop,
arises. The breakdown site repassivates as soon as the film breakdown potential is less-
positive than the pitting potential, as was observed in acid solution for some stainless steels
(Sharma, 2011; Sato, 2011).
Conversely, pitting corrosion trails film breakdown as observed for metallic iron in acid
solution, once the film breakdown potential appears more positive than the pitting potential
(Sharma, 2011).
One of the currently prevailing models for the mechanism of chloride-breakdown of passive
films is the ionic point defect model where addition of metal ion vacancies into the passive
film at the adsorption site of chloride ions is assumed (Sharma, 2011). The ionic point defects
finally creates a void nearby to breakdown the film after migrating to and accumulating next
to the metal–film boundary (Macdonald, 1992; Sharma, 2011).
2.2.4 Corrosion Forms
In discussing corrosion, it is convenient to classify the reaction according to the form in
which it appears.
1. Uniform Corrosion
As the name suggests, uniform corrosion, takes place over the bulk of a metal exterior at a
stable and frequently anticipated rate (Nimmo and Hinds, 2003). Its predictability enables
easy control although it is unsightly, the most basic technique increase the thickness of the
material so as to enable the component function for its service life.
2. Localised Corrosion
Generally, since localised corrosion occurs without warning and after a remarkably short
duration of exposure or use, the consequences can be a lot more severe than uniform
corrosion (Nimmo and Hinds, 2003).
a) Galvanic Corrosion: Such phenomenon takes place when two dissimilar metals are
positioned in connection with each other. Besides, it is also caused by the greater
inclination of one metal to relinquish electrons than the other (Nimmo and Hinds,
2003). For corrosion to occur, three unusual features of this mechanism should work:
i. The metals should remain in contact electrically.
18
ii. One metal ought to be considerably enhanced at giving up electrons than
the other.
iii. An extra route for ion plus electron movement is essential (Nimmo and
Hinds, 2003).
b) Pitting Corrosion: This type of corrosion transpires in materials when a coating breaks
down or when there is a protecting film for instance, a corrosion product. Electrons
are given up easily by the exposed metal and tiny pits when localised chemistry are
initiated, hence, supporting rapid attack. Pits can be crack initiators in components
with residual stresses resulting from forming operations or in externally stressed
components (Samusawa and Shiotani, 2015; Nimmo and Hinds, 2003). This can bring
about stress corrosion cracking.
c) Selective Attack: This occurs in alloys for instance brass, while one phase or
component is further prone to attacks than another and preferentially corrodes leaving
a permeable material that disintegrates (Nimmo and Hinds, 2003).
d) Stray Current Corrosion: When flow of electrons supports corrosion as a result of a
direct current flowing through an accidental path (Nimmo and Hinds, 2003). This can
occur in stationary or flowing fluids and in soils.
e) Microbial Corrosion: entails material degradation by bacteria, fungi and moulds or
their side-effects (Nimmo and Hinds, 2003). Also, it can take place by a variety of
actions.
f) Intergranular Corrosion: This is the preferential attack of the crystal grain boundaries
of the metal. It is caused by both the physical and chemical dissimilarities between
the midpoints and boundaries of the grain (Newman, 2008; Nimmo and Hinds, 2003).
g) Crevice Corrosion: occurs in a restricted area when there is set up of a differential
aeration cell as a result of lack of oxygen. Several mechanisms have been proposed
for crevice attack, amongst which is the passive dissolution mechanism.
3. Thermogalvanic Corrosion
Changes in temperature can adjust the corrosion rate of a material and a worthy rule of thumb
is that corrosion rate is doubled by 10oC rise (Nimmo and Hinds, 2003). The change in
corrosion rate is emphasized by thermal gradient provided one fragment of component is
hotter than another. Therefore, in a region between the minimum and maximum
temperatures, local attack occurs. To design out the thermal gradient or supply a coolant to
even out the difference is the best method of prevention (Nimmo and Hinds, 2003).

19
4. Corrosion Caused by Combined Action
This type of corrosion is hastened by the action of fluid movement and occasionally by the
added force of abrasive particles present in the stream (Nimmo and Hinds, 2003). Fresh metal
is exposed to corrosion since corrosion products of the metal and the protective layers are
removed continually.
5. Corrosion Fatigue
This phenomenon is the combined action of cyclic stresses and a corrosive environment,
which reduces the life of components lower than that anticipated by the sole action of fatigue
(Nimmo and Hinds, 2003).
6. Fretting Corrosion
This is the breakdown of protective films or welding of the contact areas, thereby allowing
other corrosion mechanisms to operate. It is caused by relative motion between two surfaces
in contact through a stick-slip action (Nimmo and Hinds, 2003).
7. Hydrogen Damage
An astonishing detail is that hydrogen atoms are very small and hydrogen ions even smaller,
and this enables it to infiltrate most metals. By various mechanisms, Hydrogen embrittles a
metal particularly in parts of high hardness producing cracking or blistering especially in the
presence of tensile stresses (Nimmo and Hinds, 2003).
8. Stress Corrosion Cracking
Stress Corrosion Cracking (SCC) is the combined action of a static tensile stress and a
corrosive environment which forms cracks and ultimately catastrophic failure of the
component (Zuhair, 2013; Nimmo and Hinds, 2003). It is a brittle cracking process arising
from the synergistic action of a tensile stress and a particular corrosive environment (Zuhair,
2013). The stress may be residual (arising from welding or fabrication processes) or applied.
SCC always initiates at stress raisers such as notches and sharp corners present in the
material. Three components of SCC can be summarized as:
i. Tensile stress
ii. Specific corrosive environment
iii. Material susceptibility.
Removing any of these, SCC will be practically impossible. Chloride induced cracking of
stainless steels, caustic cracking of plain carbon steels and ammonia damage to copper alloys
20
are typical examples of this problem (Swathi, 2006). Table 2.1 shows metal/environment
combination exhibiting SCC.
2.2.5 Alcoholic Corrosion Environments
There is often a great deal of corrosion data on a number of engineered materials. However,
much of the available data is clustered in a limited number of environments, full immersion
environments in particular. The report of the National Research Council in US (National
Research Council, 2011) revealed that the limited number of environments for corrosion
research has resulted in inability to create a meaningful national database of corrosion data
useful to industry, government and academia. Aside from the issue of full immersion,
atmospheric and alternate immersion aqueous environments, there are also completely
different environments such as non-aqueous and high-temperature environments. Ethanol is
an example of non-aqueous environments for which a better ability to predict its influence on
various engineering materials is paramount due to its planned widespread use.
Nowadays, applications in the transport sector rely on the use of liquid fuels which are easy
to store (Micic and Jotanovic, 2015). The use of gaseous fuels for transport is minor in
comparison with liquid fuels. However, apart from the phase of matter, two basic different
types of fuels exist namely, fuels made from fossil resources and biofuels made from
renewable resources (Micic and Jotanovic, 2015). One of the key drivers for the development
of biofuels globally is the concern about universal climate change, which is mainly instigated
by combustion of fossil fuels. Considerable scientific evidence abounds indicating
Greenhouse Gas (GHG) emissions as the reason for accelerating global warming. Biofuels
are not only renewable and viable energy sources but are toxic-free and so more
environmentally friendly than conventional petroleum-based fuels (Highina, Bugaje and
Umar, 2012; Munoz, Moreno and Morea, 2004). Biofuels are also biodegradable and
therefore their inadvertent spillage is of no significant environmental hazard (Highina, Bugaje
and Umar, 2012; Munoz, Moreno and Morea, 2004). Biofuels in use include Pure Plant Oil
(PPO), Biodiesel, Ethyl Tertiary Butyl Ether (ETBE), Biobutanol and Fuel ethanol. While
biodiesel and PPO are appropriate for diesel engines, fuel ethanol can replace petrol
(Dominic and Rainer, 2007). The properties of fuel ethanol are shown in Table 2.2 and
compared with the properties of fossil petrol (Micic and Jotanovic, 2015).
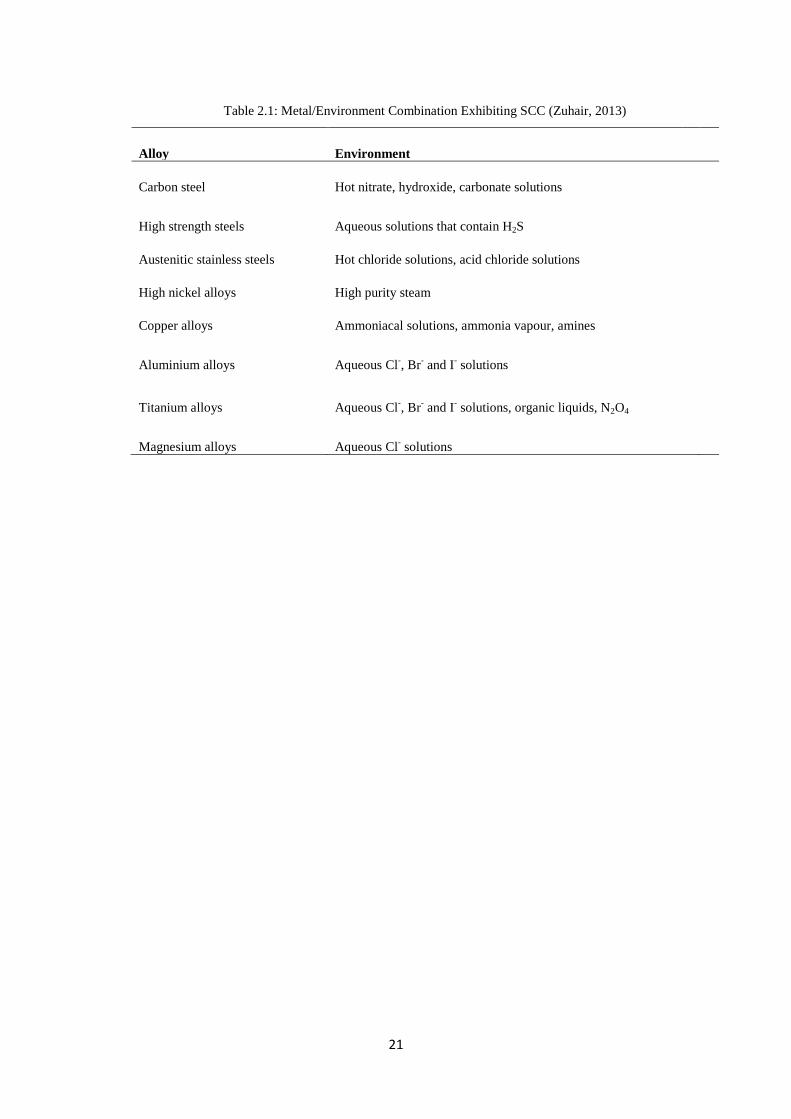
21
Table 2.1: Metal/Environment Combination Exhibiting SCC (Zuhair, 2013)
Alloy Environment
Carbon steel Hot nitrate, hydroxide, carbonate solutions
High strength steels Aqueous solutions that contain H2S
Austenitic stainless steels Hot chloride solutions, acid chloride solutions
High nickel alloys High purity steam
Copper alloys Ammoniacal solutions, ammonia vapour, amines
Aluminium alloys Aqueous Cl-, Br
- and I
- solutions
Titanium alloys Aqueous Cl-, Br
- and I
- solutions, organic liquids, N2O4
Magnesium alloys Aqueous Cl- solutions
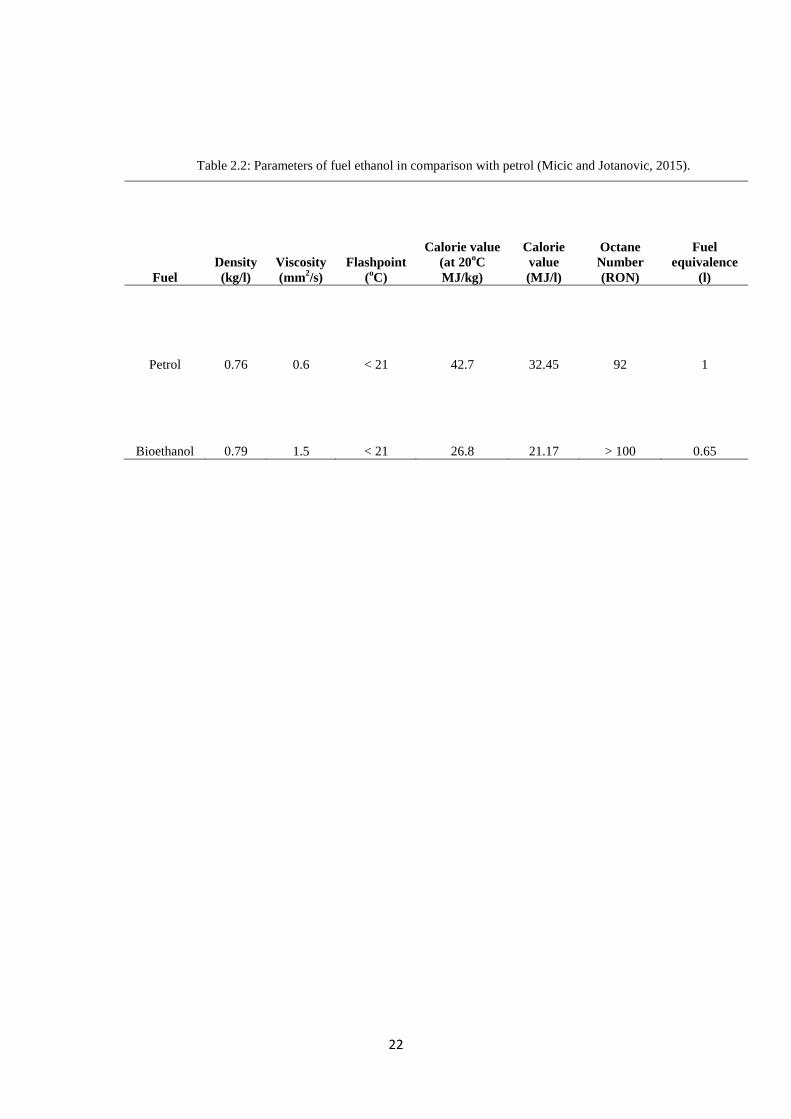
22
Table 2.2: Parameters of fuel ethanol in comparison with petrol (Micic and Jotanovic, 2015).
Fuel
Density
(kg/l)
Viscosity
(mm2/s)
Flashpoint
(oC)
Calorie value
(at 20oC
MJ/kg)
Calorie
value
(MJ/l)
Octane
Number
(RON)
Fuel
equivalence
(l)
Petrol 0.76 0.6 < 21 42.7 32.45 92 1
Bioethanol 0.79 1.5 < 21 26.8 21.17 > 100 0.65
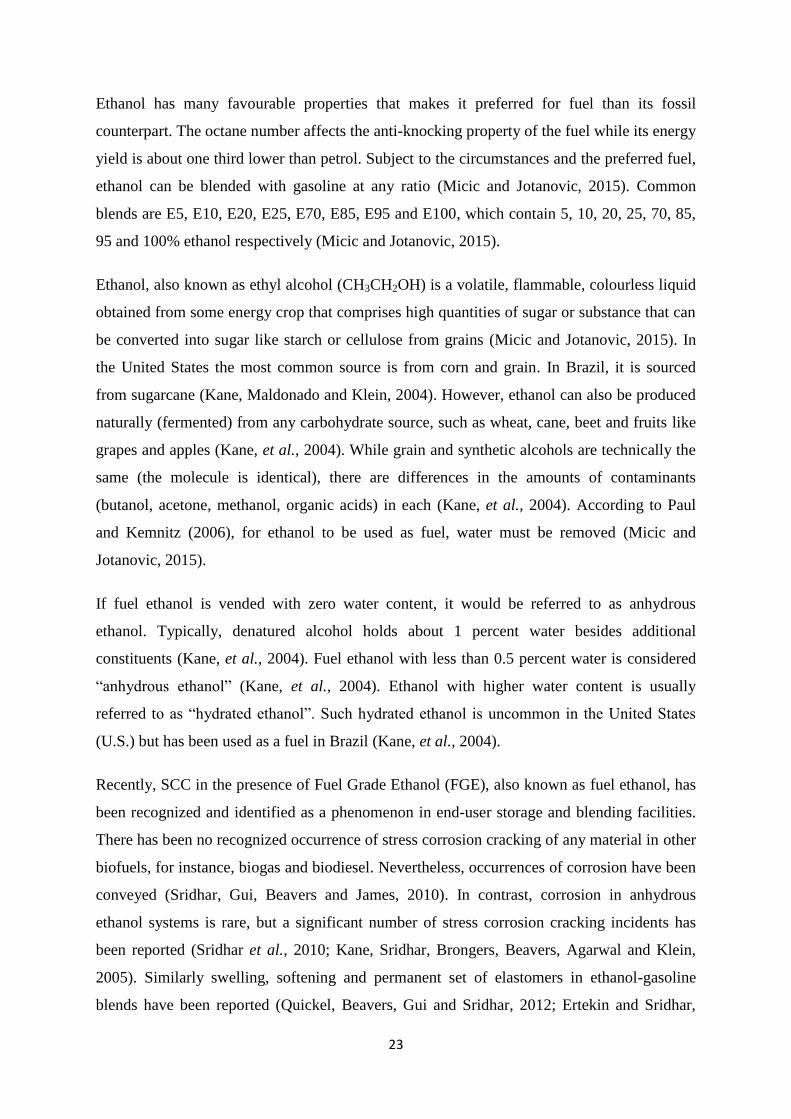
23
Ethanol has many favourable properties that makes it preferred for fuel than its fossil
counterpart. The octane number affects the anti-knocking property of the fuel while its energy
yield is about one third lower than petrol. Subject to the circumstances and the preferred fuel,
ethanol can be blended with gasoline at any ratio (Micic and Jotanovic, 2015). Common
blends are E5, E10, E20, E25, E70, E85, E95 and E100, which contain 5, 10, 20, 25, 70, 85,
95 and 100% ethanol respectively (Micic and Jotanovic, 2015).
Ethanol, also known as ethyl alcohol (CH3CH2OH) is a volatile, flammable, colourless liquid
obtained from some energy crop that comprises high quantities of sugar or substance that can
be converted into sugar like starch or cellulose from grains (Micic and Jotanovic, 2015). In
the United States the most common source is from corn and grain. In Brazil, it is sourced
from sugarcane (Kane, Maldonado and Klein, 2004). However, ethanol can also be produced
naturally (fermented) from any carbohydrate source, such as wheat, cane, beet and fruits like
grapes and apples (Kane, et al., 2004). While grain and synthetic alcohols are technically the
same (the molecule is identical), there are differences in the amounts of contaminants
(butanol, acetone, methanol, organic acids) in each (Kane, et al., 2004). According to Paul
and Kemnitz (2006), for ethanol to be used as fuel, water must be removed (Micic and
Jotanovic, 2015).
If fuel ethanol is vended with zero water content, it would be referred to as anhydrous
ethanol. Typically, denatured alcohol holds about 1 percent water besides additional
constituents (Kane, et al., 2004). Fuel ethanol with less than 0.5 percent water is considered
“anhydrous ethanol” (Kane, et al., 2004). Ethanol with higher water content is usually
referred to as “hydrated ethanol”. Such hydrated ethanol is uncommon in the United States
(U.S.) but has been used as a fuel in Brazil (Kane, et al., 2004).
Recently, SCC in the presence of Fuel Grade Ethanol (FGE), also known as fuel ethanol, has
been recognized and identified as a phenomenon in end-user storage and blending facilities.
There has been no recognized occurrence of stress corrosion cracking of any material in other
biofuels, for instance, biogas and biodiesel. Nevertheless, occurrences of corrosion have been
conveyed (Sridhar, Gui, Beavers and James, 2010). In contrast, corrosion in anhydrous
ethanol systems is rare, but a significant number of stress corrosion cracking incidents has
been reported (Sridhar et al., 2010; Kane, Sridhar, Brongers, Beavers, Agarwal and Klein,
2005). Similarly swelling, softening and permanent set of elastomers in ethanol-gasoline
blends have been reported (Quickel, Beavers, Gui and Sridhar, 2012; Ertekin and Sridhar,

24
2010), whereas for biobutanol, incidences of stress corrosion cracking and corrosion are
sparse.
There is significant variation in the material integrity issues for the different biofuels types.
Besides the well-known threats posed for pipelines (e.g. vandalizing, coating damage, etc.),
biofuel transportation conveys added integrity threats, which should of necessity be well
thought-out in a whole risk management process (Sridhar et al., 2010). An illustration of
pipelines and storage tanks threats is shown in Table 2.3.
25
Table 2.3: Illustration of integrity threats for pipelines and storage tanks arising from biofuels transportation in
addition to other known threats (Sridhar et al., 2010).
Added Integrity
Threats
Ethanol Butanol Biodiesel Biogas
Corrosion
Stress corrosion
cracking
Delamination
Swelling
Softening
Permanent set
Soap formation
Effect on product
quality
Permeation
Known Threat
Possible Threat
Unlikely
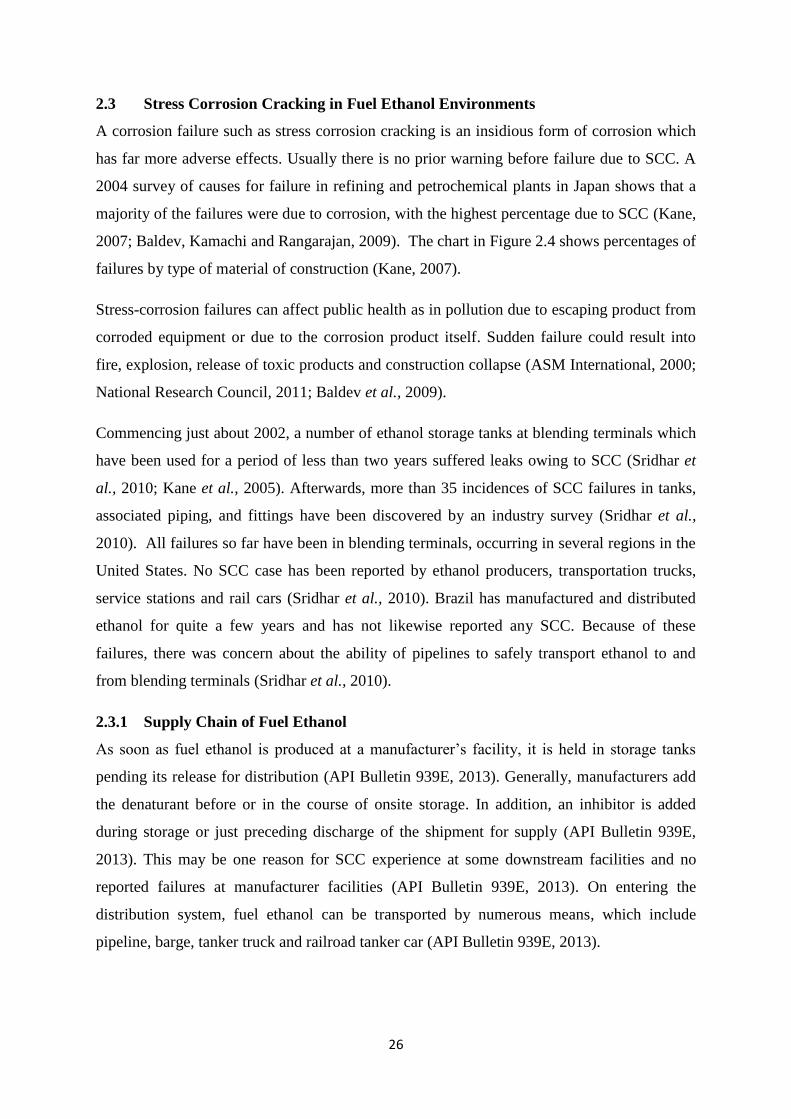
26
2.3 Stress Corrosion Cracking in Fuel Ethanol Environments
A corrosion failure such as stress corrosion cracking is an insidious form of corrosion which
has far more adverse effects. Usually there is no prior warning before failure due to SCC. A
2004 survey of causes for failure in refining and petrochemical plants in Japan shows that a
majority of the failures were due to corrosion, with the highest percentage due to SCC (Kane,
2007; Baldev, Kamachi and Rangarajan, 2009). The chart in Figure 2.4 shows percentages of
failures by type of material of construction (Kane, 2007).
Stress-corrosion failures can affect public health as in pollution due to escaping product from
corroded equipment or due to the corrosion product itself. Sudden failure could result into
fire, explosion, release of toxic products and construction collapse (ASM International, 2000;
National Research Council, 2011; Baldev et al., 2009).
Commencing just about 2002, a number of ethanol storage tanks at blending terminals which
have been used for a period of less than two years suffered leaks owing to SCC (Sridhar et
al., 2010; Kane et al., 2005). Afterwards, more than 35 incidences of SCC failures in tanks,
associated piping, and fittings have been discovered by an industry survey (Sridhar et al.,
2010). All failures so far have been in blending terminals, occurring in several regions in the
United States. No SCC case has been reported by ethanol producers, transportation trucks,
service stations and rail cars (Sridhar et al., 2010). Brazil has manufactured and distributed
ethanol for quite a few years and has not likewise reported any SCC. Because of these
failures, there was concern about the ability of pipelines to safely transport ethanol to and
from blending terminals (Sridhar et al., 2010).
2.3.1 Supply Chain of Fuel Ethanol
As soon as fuel ethanol is produced at a manufacturer’s facility, it is held in storage tanks
pending its release for distribution (API Bulletin 939E, 2013). Generally, manufacturers add
the denaturant before or in the course of onsite storage. In addition, an inhibitor is added
during storage or just preceding discharge of the shipment for supply (API Bulletin 939E,
2013). This may be one reason for SCC experience at some downstream facilities and no
reported failures at manufacturer facilities (API Bulletin 939E, 2013). On entering the
distribution system, fuel ethanol can be transported by numerous means, which include
pipeline, barge, tanker truck and railroad tanker car (API Bulletin 939E, 2013).
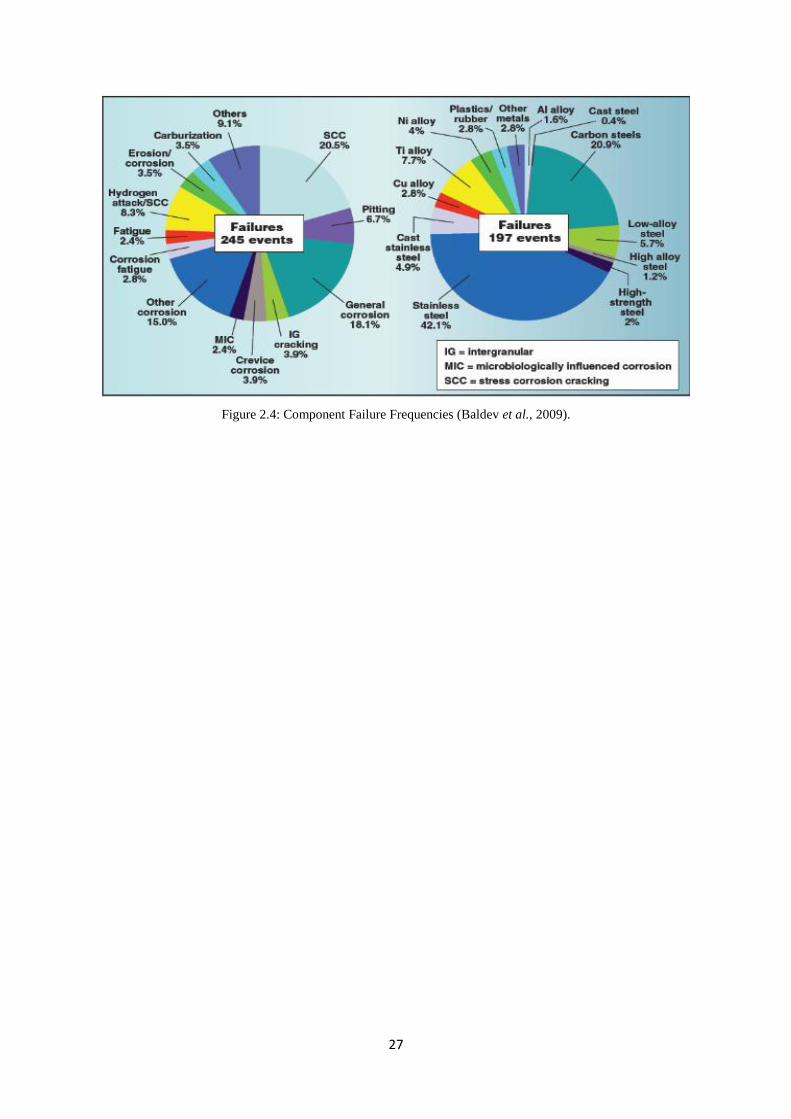
27
Figure 2.4: Component Failure Frequencies (Baldev et al., 2009).
28
The duration that fuel ethanol spends in the sequence can fluctuate significantly from days to
months subject to several factors: the obtainability of intermediate distribution storage, the
site of the manufacturing facility, the transportation mode used, and the location of gasoline
blending terminals (API Bulletin 939E, 2013). Fuel ethanol is held in storage tanks as soon as
it comes into a gasoline blending facility (API Bulletin 939E, 2013). Contingent on usage and
traffic requirements, the residence period in these tanks also differs. In certain cases, it can be
held for months in the course of a period of dormancy (API Bulletin 939E, 2013).
However, in certain instances, at gasoline blending facilities, the residence period in the
storage tank is relatively short as incoming ethanol supplies and outgoing shipments of
blended gasoline are a proximate frequent process (API Bulletin 939E, 2013). Nevertheless,
observations of SCC has been restricted to the lot of the supply chain encompassing the
intermediate liquids storage through the gasoline blending facility and possibly will be linked
to circumstances that develop in the distribution system or variations that transpire in the fuel
ethanol (API Bulletin 939E, 2013).
2.3.2 Documented Cases of SCC in Fuel Ethanol
Research carried out by the American Petroleum Institute has shown that SCC of steel in fuel
ethanol environment is a subject matter where awareness of the issue is growing dynamically
as a result of documentation of experiences and research works in progress (API Bulletin
939E, 2013). Findings by API point out that documented catastrophes of ethanol process
equipment dates back to no less than the early 1990s (API Bulletin 939E, 2013).
Establishments undergoing what they contemplate as cases of SCC in fuel ethanol have been
stimulated to confirm these issues through appraisal and documentation of service conditions,
along with metallurgical examination of the failed or cracked components (API Bulletin
939E, 2013).
The appearance of cracks caused by other cracking environments is similar to SCC cracks of
steel in fuel ethanol (API Bulletin 939E, 2013). Instances of SCC in steel equipment exposed
to fuel ethanol are presented in Plates 2.1-2.3. The cracks are characteristically branched and
may possibly be transgranular, intergranular or mixed mode (API Bulletin 939E, 2013).
29
Plate 2.1: Locations of Ethanol SCC near Fillet Welds Used to Make the Branch Connections to the Piping (API
Technical Report 939-D, 2013).
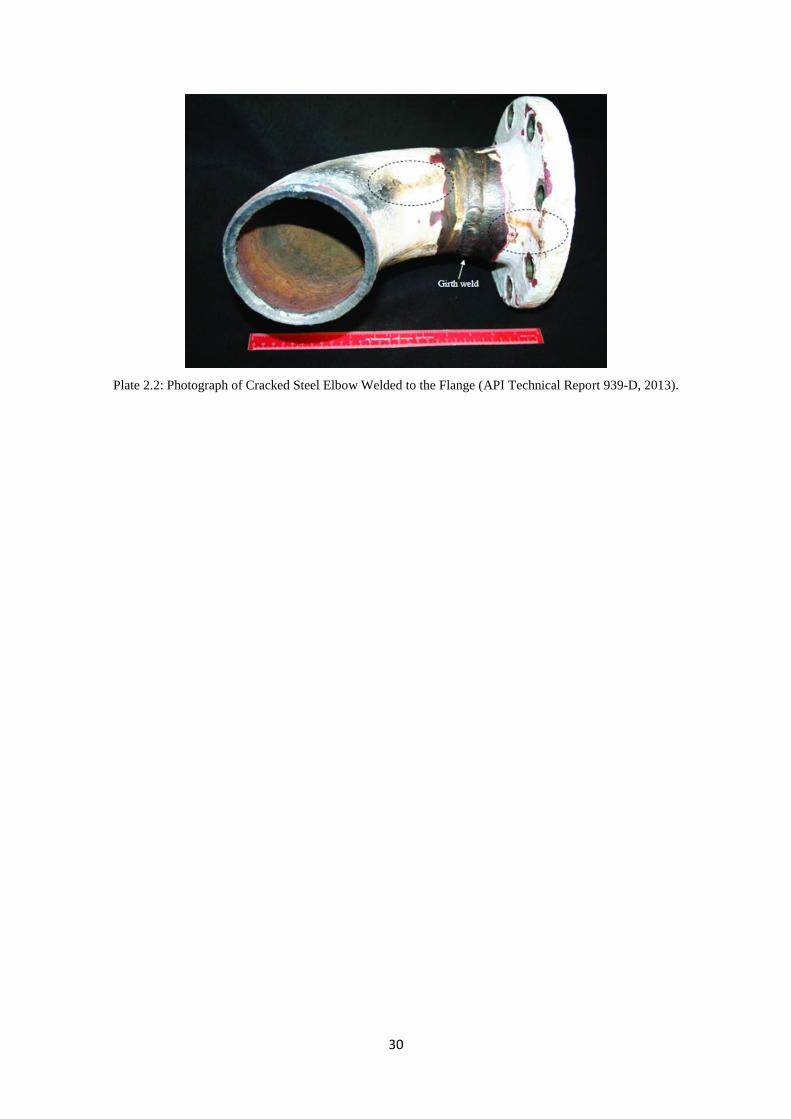
30
Plate 2.2: Photograph of Cracked Steel Elbow Welded to the Flange (API Technical Report 939-D, 2013).
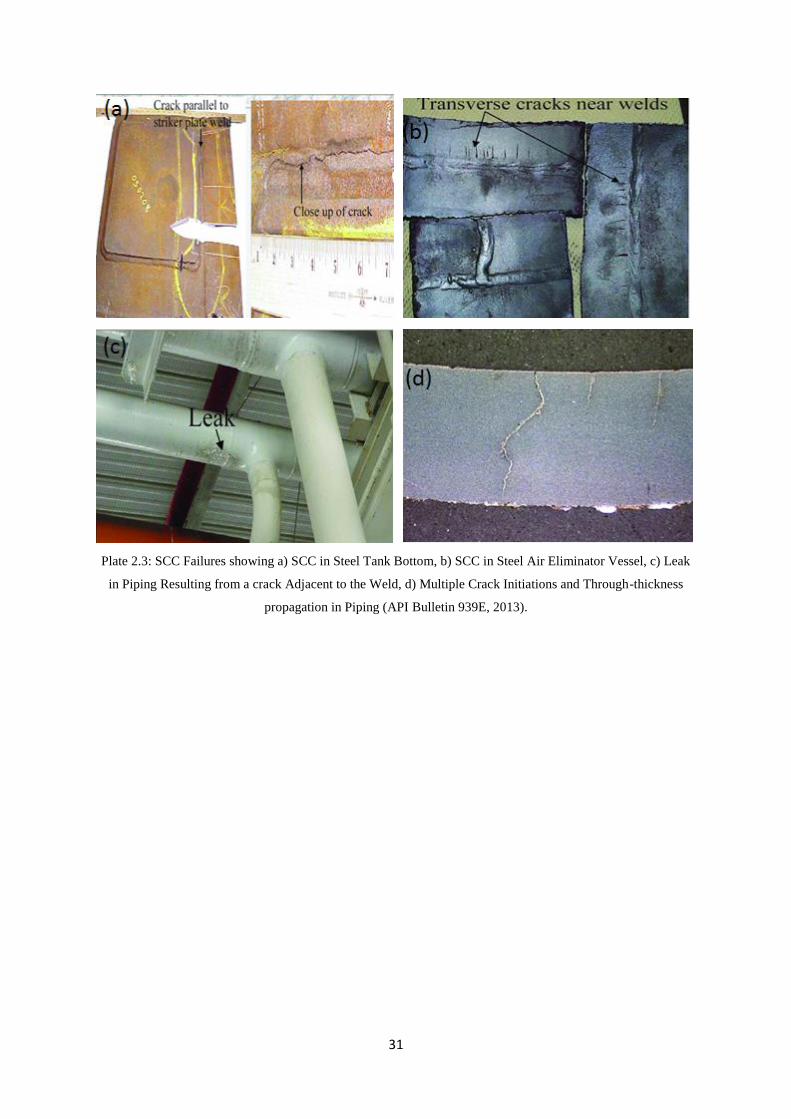
31
Plate 2.3: SCC Failures showing a) SCC in Steel Tank Bottom, b) SCC in Steel Air Eliminator Vessel, c) Leak
in Piping Resulting from a crack Adjacent to the Weld, d) Multiple Crack Initiations and Through-thickness
propagation in Piping (API Bulletin 939E, 2013).

32
Both transgranular and intergranular cracking may well occur in laboratory testing subject to
the composition of ethanol (API Bulletin 939E, 2013). However, greater number of cracks
documented from field failures display intergranular cracking (API Bulletin 939E, 2013).
While analysing a field catastrophe, intergranular cracking suggests ethanol SCC, but
transgranular or mixed mode cracking might likewise be present (API Bulletin 939E, 2013).
Instances of SCC of steel components in fuel ethanol have been conveyed in the following
kinds of equipment in gasoline blending facilities and fuel ethanol distribution (API Bulletin
939E, 2013):
a) Welds and adjacent metal in tank bottoms, detached roofs besides related seal
components;
b) Fittings, facility rack piping, and accompanying equipment (for example, air
eliminators);
c) Nozzle welds and vertical seam in lower tank shells situated off bottom; and
d) Pipeline used to convey fuel ethanol from terminal to end user facility (API Bulletin
939E, 2013).
The blend of low cost and strength brands carbon steel as the principal material of
construction for equipment used in the conveyance, handling and storage of fuel ethanol (API
Bulletin 939E, 2013). Generally, carbon steel is thought as compatible with fuel ethanol from
the perspective of corrosion since its corrosion rates are characteristically low (API Bulletin
939E, 2013). On the other hand, the corrosion rate can occasionally escalate with agitation,
the presence of contaminants, and the level of dissolved oxygen content of the ethanol. In the
API program, the field corrosion rate measurements in fuel ethanol point out that the
corrosion rates of carbon steel were typically very low (API Bulletin 939E, 2013).
2.3.3 Previous Research on Corrosion and Stress Corrosion Cracking in Fuel Ethanol
Environments
Investigation of the corrosion and stress corrosion cracking (SCC) mechanism of steel in fuel
ethanol is still in the early stages and several countries are considering increasing biofuel
production as an approach to secure future energy supplies and mitigate global warming
(Sridhar et al., 2010). When these come to the market, the infrastructure will play a key role
in ensuring safe, reliable, and efficient distribution of these fuels to the end users (Sridhar et
al., 2010). Pipeline is the most effective transportation method in meeting these requirements
(Sridhar et al., 2010). Hence, there is dire need of evaluating and predicting the influence of
fuel ethanol on various steel grades which can be used for such pipelines.
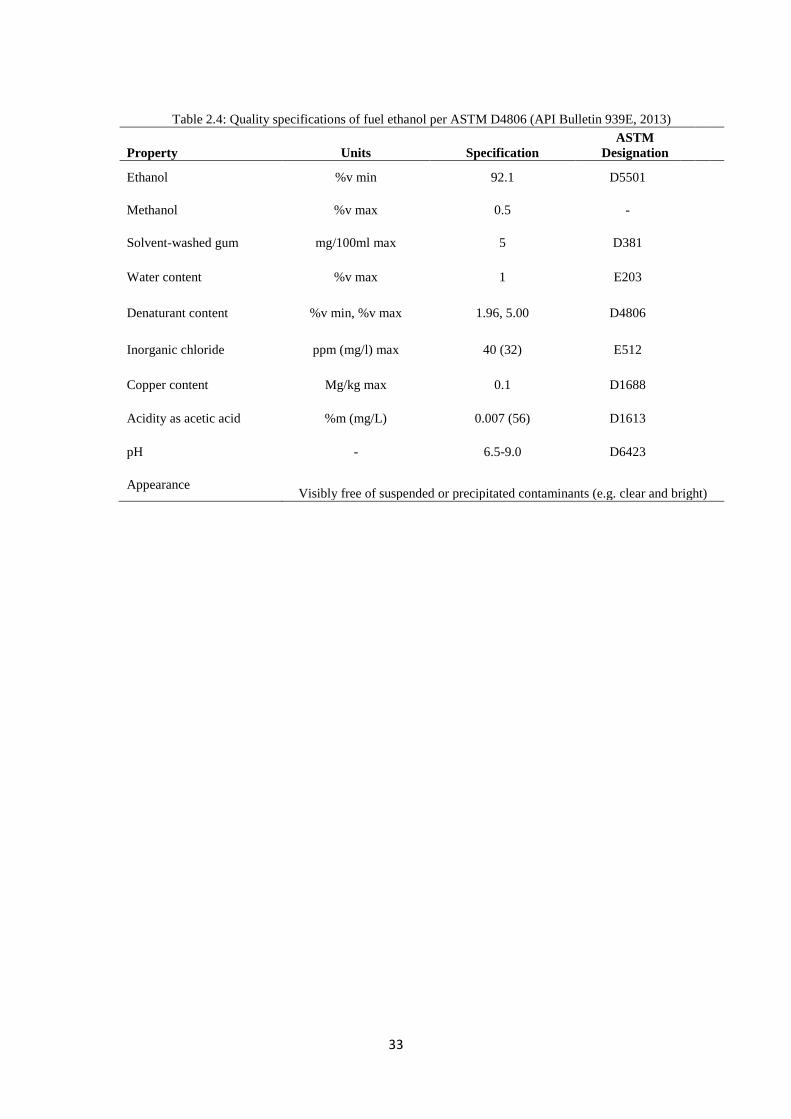
33
Table 2.4: Quality specifications of fuel ethanol per ASTM D4806 (API Bulletin 939E, 2013)
Property Units Specification
ASTM
Designation
Ethanol %v min 92.1 D5501
Methanol %v max 0.5 -
Solvent-washed gum mg/100ml max 5 D381
Water content %v max 1 E203
Denaturant content %v min, %v max 1.96, 5.00 D4806
Inorganic chloride ppm (mg/l) max 40 (32) E512
Copper content Mg/kg max 0.1 D1688
Acidity as acetic acid %m (mg/L) 0.007 (56) D1613
pH - 6.5-9.0 D6423
Appearance
Visibly free of suspended or precipitated contaminants (e.g. clear and bright)
34
A most recent study (API Technical Report 939-D, 2007), jointly funded by API and
Renewable Fuels Association (RFA), using the Slow Strain Rate Test method (SSRT), found
that SCC of steel can take place in fuel ethanol meeting the ASTM D4806 (see Table 2.3)
specification. From the study, the inhibitor, Octel DC1-11 was discovered to lower the
corrosion rate of steel in ethanol but had no effect on SCC. In addition, the team found that in
addition to water, the most important factor that caused SCC in fuel ethanol appeared to be
dissolved oxygen. When dissolved oxygen was minimized through nitrogen purging, no SCC
occurred in the presence of all other species at their maximum levels. But on introducing
oxygen, the reverse occurred. Furthermore, corrosion potential was used to monitor the
potential for SCC of steel exposed to ethanol. One short coming of the study was that the
results obtained are limited to fuel ethanol of ASTM D4806 standard and the study of the
effect of stress level on SCC was left out. Hence, parameters for estimating risk of SCC from
known defects in the studied environment were not obtained.
Other studies include those of Beavers, Brongers, Agrawal and Tallarida (2008) and Lou,
Yang and Singh (2009). The study by Beavers et al., (2008) examined pitting corrosion in
SFGE solutions on carbon steel while Lou et al., (2009) examined the addition of chemical
additives to SFGE to provide scavenging of oxygen in solution or inhibition of SCC in FGE
using SSR techniques. The latter study found a dependence of ethanol SCC on
electrochemical potential that was consistent with observations from previous API studies
(i.e. increased susceptibility to SCC with increasing corrosion potential). Based on this study,
three active techniques of non-chemical deaeration were recognized. Altogether, the three
methods reduced the corrosion potential below -100 mV Ag/AgCl EtOH and alleviated SCC.
Also, Beavers and Gui (2010) summarized the results of research studies involving factors
affecting ethanol SCC of carbon steel as water content, level of aeration, aging during
storage, blend ratio with gasoline, steel type and welding. In addition, Gui, Sridhar, Beavers,
Trillo and Singh (2010) carried out studies on the influence of ethanol composition on SCC
susceptibility of carbon steel by evaluating ethanol SCC in field FGE samples and correlating
the results in terms of SCC severity to compositional differences in the FGE samples. Carbon
steel was found to be susceptible in all FGE samples conducted in two laboratories but with a
varied degree of susceptibility in one FGE sample compared with the others.
Furthermore, Venkatesh, Chambers, Kane and Kirkham (2010) evaluated the SCC behaviour
of pipeline steel in multiple ethanol environments. The program used N-SSR testing and field
35
samples of FGE obtained from Brazilian sources. Severity of cracking was assessed based on
crack growth rates determined from N-SSR testing and KISCC values based on a fracture
mechanics treatment of the N-SSR test data. Lou, Yang, Goodman and Singh (2010) studied
the effects of inorganic chloride in ethanolic solutions on the SCC behaviour of carbon steels
by varying the inorganic chloride concentrations between 0 - 70 mg/l using additions of NaCl
to SFGE. The results indicated that both crack density and crack growth rate increased with
chloride concentration. Two laboratory testing programs were used to evaluate the SCC
behaviour of steel in fuel ethanol and butanol (McIntyre, Kane and Venkatesh, 2009). The
first part of the program revealed that cracking of API 5LX42 carbon steel compact tension
specimens in FGE solutions (client supplied and synthetically prepared) required high K
values to initiate cracks. Highest crack growth rates were observed in SSR tests and in tests
conducted in SFGE and under aerated conditions. Fracture mechanics tests and tests
involving an actual field sample of FGE resulted in lower crack growth rates.
The second part of the program evaluated ASTM A36 carbon steel for SCC in the reagent
grade butanol and anhydrous butanol solutions using SSR testing. The tests showed no
evidence of SCC. Likewise, Cao (2012) studied the corrosion and stress corrosion cracking of
carbon steel in simulated fuel grade ethanol using SSR techniques and accurately controlled
fracture mechanics conditions. Goodman and Singh (2009) evaluated the influences of
chemical composition of ethanol fuel on carbon steel pipelines using SSR testing on carbon
steel samples in five FGE environments. SCC was discovered in two of the as-received FGE
environments and in FGE environments to which NaCl was added.
Furthermore, substantial information has been gathered from reviews, reports and summaries
of studies investigating the compatibility of fuel ethanol with metallic materials (QINETIQ,
2010). Nevertheless, care must be taken in interpretation of the information (QINETIQ,
2010). Examples are:
a) a Concawe (2008) report recommending carbon steel and aluminium for
ethanol/petrol handling situations (QINETIQ, 2010); and
b) a laboratory study conducted by Minnesota Pollution Control Agency (2008)
evaluated 19 metallic species, including four types of aluminium alloy and brass in
E10 and E20 blends, three aluminium alloys were adjudged as satisfactory as was
brass (QINETIQ, 2010).
Unfortunately it is known from field experience that E10 blends can severely corrode
aluminium components, leading to catastrophic failure (QINETIQ, 2010; Minnesota Centre

36
for Automotive Research, 2008). Also, carbon steel can suffer severe corrosive attack if the
fuel contains water (QINETIQ, 2010; Kuri, Monteiro, and Ambrozin, 2010). Likewise, brass
components in carburetors are known to corrode when exposed to E10 (QINETIQ, 2010).
The carburetor manufacturer who reported this, conducted compatibility testing of its
products with petrol/ethanol blends and has identified corrosion of metallic components as an
issue, requiring replacement of brass components with more resistant, but more expensive,
alloys (QINETIQ, 2010).
Argarwal reports the Brazilian experience with ethanol blends (QINETIQ, 2010; Hugh,
1962). According to QINETIQ (2010), in order to make vehicles more durable when
employing ethanol blends, various fuel system components require modifications amongst
which are:
a) zinc steel alloy fuel lines changed to cadmium brass;
b) tin and lead coatings (terne plate) of fuel tanks changed to pure tin; and
c) cast iron valve housings changed to iron cobalt alloy (QINETIQ, 2010).
Beavers, Brongers, Agarwal and Tallarida (2008) carried out a recent research that was
funded by the Pipeline Research Council, in which methods for prevention of internal SCC in
ethanol pipelines were evaluated. The methods assessed include the addition of inhibitors and
oxygen scavengers to ethanol and other ways and means of deaeration. On the other hand,
Beavers, Gui and Sridhar (2011) studied the effects of ethanol-gasoline blends, metallurgical
variables, inhibitors and dissolved oxygen on the stress-corrosion cracking of carbon steel in
ethanol. Slow strain rate (SSR) and fatigue precracked compact tension (CT) tests were
employed to characterize the influence of environmental and metallurgical variables on SCC.
Metallurgical factors, including steel grade within a range of pipeline grades, welds, and
heat-affected zone, do not seem to have a noteworthy effect on the degree or frequency
of SCC. In terms of environmental factors, it was observed that SCC does not take place
even in a completely aerated state, if the ethanol-gasoline blends contain below
approximately 15 vol.% ethanol; susceptibility to SCC and crack growth rate are greater
in 50 vol.% ethanol gasoline blend (E-50) than in either lower or higher ethanol
concentration blends; oxygen scavenging can be an effective method to inhibit SCC;
water content exceeding 4.5 wt.% prevents SCC in ethanol; and fatigue precracked CT
tests display comparable inclinations to SCC susceptibility as SSR tests.
Maldonado and Kane (2008) studied the stress corrosion cracking of carbon steel in fuel
ethanol service and postulated that the hygroscopic nature of ethanol is an important aspect
37
with potential relevance to its corrosivity. Also, ethanol possesses high potential for oxygen
solubility; therefore, the availability of oxygen for involvement in the corrosion reaction is
anticipated to be largely greater.
A recent study (Abel and Virtanen, 2015) investigated the corrosion of martensitic stainless
steel in ethanol-containing gasoline mixture as a function of water, chloride and acetic acid
concentrations. The results obtained showed that, water and Cl- are the primary corrosion
causing factors in EtOH/gasoline mixtures; critical water content depends on EtOH/gasoline-
ratio; pitting corrosion occurred at tremendously low chloride concentrations; increasing
chloride concentration enhanced pit propagation, with slight influence on pit densities and
higher concentrations of acetic acid lead to a greater attacked area, with negligible impact on
the depth of pit propagation.
Another study (Samusawa and Shiotani, 2015) investigated the influence and role of minor
constituents (organic acids, water and chloride) of fuel grade ethanol on corrosion behaviour
of carbon steel using X-ray photoelectron spectroscopy (XPS), auger electron spectroscopy
(AES) and electrochemical experiments. The results showed that iron (II) acetate is generated
on oxide film due to its high solubility in FGE environments. Chloride stimulated anodic
dissolution at those sites where iron (II) acetate occurred.
All of the findings point to the fact that SCC of metals do occur in FGE environment,
whether simulated or field FGE due to several factors which have been mentioned. Most of
the SCC tests were carried out using SSR techniques without using fracture mechanics
method to assess the fracture toughness of the materials in fuel ethanol environment.
Similarly, several corrosion and stress corrosion cracking studies in aqueous environments
have been carried out around the world (Hugh, 1962; Johnson and Willner, 1965; Uhlig and
Cook, 1969; Fessler and Barlo, 1984; Naval Research Laboratory, 1986; Cottis and Loto,
1986; Loto and Cottis, 1987; Loto and Cottis, 1989; Cottis and Loto, 1990; Dayal and
Parvathavarthini, 2003; Rokuro and Yasuaki, 2004; Uh Chul, Kyung and Eun, 2005; Dong,
2008; Newman, 2008; Nageh, Allam and Ashour, 2009; Dong-Jin, Hyuk, Hyun, Seong and
Hong, 2011; Dezhi, Rui, Zhi, Liyun, Guoping, Gang and Taihe, 2012; Loto, 2012; Zhenyu,
Lingjie, Guoan, Yubing and Xingpeng, 2013; Loto, Joseph and Loto, 2013; Oki, Oki, Otaigbe
and Otikor, 2013; Oki and Anawe, 2015; Okeniyi, Popoola, Loto, Omotosho, Okpala and
Ambrose, 2015; Loto, Joseph, Loto and Popoola, 2015; Loto, Loto, Popoola and Fedetova,
2016; Akanji, Loto, Popoola, Abdulwahab and Kolesnikov, 2016, amongst others). It should
38
be pointed out that not many of the SCC studies employed fracture mechanics techniques to
study the crack initiation and propagation processes. Application of fracture mechanics
concepts in fuel ethanol environment would enable characterization of crack initiation and
growth from flaws. Furthermore, the use of pre-cracked specimens associated with the
fracture mechanics concept will avoid the problem of separating the environmental influence
on both crack initiation and growth (Dietzel, 2001). Fracture mechanics based SCC tests in
fuel ethanol environment will provide data for evaluation of critical crack sizes and the
remaining lifetimes of pre-cracked components (Dietzel, 2001).
This work aims at predicting the amount of energy required to produce the critical crack size
at which failure can occur in API-5L X65 and micro-alloyed steels when used as pipeline
steels and storage materials in fuel ethanol applications.
2.4 Fracture Mechanics
Fracture is a problem that the world has faced for as long as there have been man-made
structures (Gupta and Pachauri, 2012). Providentially, advances in the field of fracture
mechanics have aided to offset some of the impending dangers posed by increasing
technological complexity since World War II (Gupta and Pachauri, 2012). Much remains to
be learned, however, and existing knowledge of fracture mechanics is not always applied
when appropriate. While catastrophic failures provide income for attorneys and consulting
engineers, such events are damaging to the economy as a whole (Anderson, 2004).
An economic study estimated the cost of fracture in the United States in 1978 at $119 billion,
about 4% of the gross national product (Anderson, 2004). Furthermore, this study estimated
that the annual cost could be reduced by $35 billion if current technology were applied, and
that further fracture mechanics research could reduce this figure by an additional $28 billion
(Anderson, 2004). During the past few decades, the field of fracture mechanics has
undoubtedly prevented a number of structural failures. We will never know how many lives
have been saved or how much property damage has been avoided by applying this technology
because it is impossible to quantify disasters that don’t happen (Anderson, 1995).
Amongst the roughly 2700 liberty ships built during the World War II, approximately 400
sustained fractures, 90 were serious. In 20 ships, failure was total; about half broke
completely into two (Gupta and Pachauri, 2012). Failure was due to:
a) the welds containing crack-like flaws (semi-skilled work force);
39
b) fractures initiated at square hatch corners (local stress concentration); and
c) poor toughness of steel, as measured by charpy tests.
Weld quality control standards and structural steels with vastly improved toughness were
developed. The field of fracture mechanics was born by a group of researchers at the Naval
Research Laboratory, Washington DC during the decade following the war (Gupta and
Pachauri, 2012). The first milestone was set in 1920 by Griffith’s criterion (Gupta and
Pachauri, 2012) which states that a crack will propagate as soon as the reduction in elastic
strain energy is in any case equivalent to the energy necessary to generate a fresh crack
surface (Equation 2.4).
(
)
⁄
Where
E is Young’s modulus in GPa
is surface energy in Jm-2
Griffith’s theory was modified by Orowan (Equation 2.5) (Gupta and Pachauri, 2012) to
allow for the degree of plasticity always present in the brittle fracture of metals.
(
)
⁄
Where
E is Young’s modulus in MPa
a is the crack size in mm
is the plastic work required to extend the crack wall for a crack length of 2a in Jm-2
.
For ductile materials, the milestone came when Irwin developed the concept of the strain
energy release rate in 1956 (Gupta and Pachauri, 2012). Irwin modified Equation 2.5 to
replace the hard to measure by G. Therefore, two alternative approaches to fracture
analysis were developed:
i. The Energy criterion
ii. The Stress Intensity approach
i. The Energy Criterion
States that crack extension (i.e. fracture) occurs when the energy available for crack growth is
sufficient to overcome the resistance of the material.
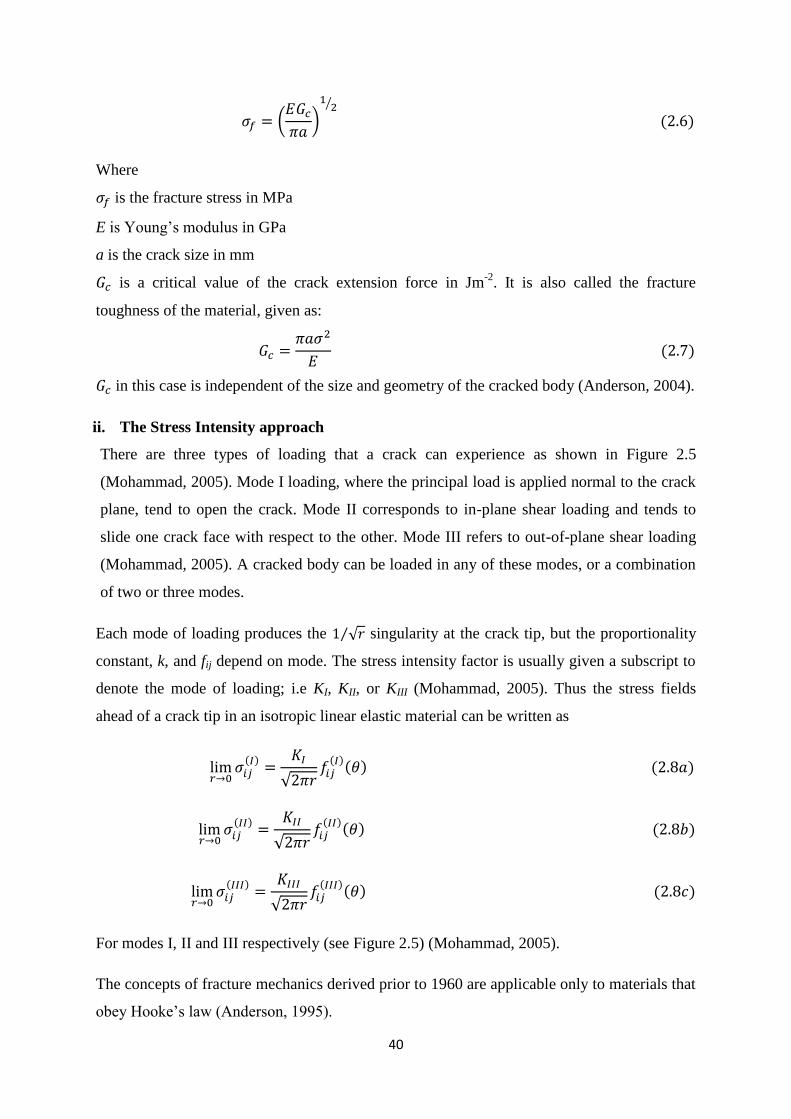
40
(
)
⁄
Where
is the fracture stress in MPa
E is Young’s modulus in GPa
a is the crack size in mm
is a critical value of the crack extension force in Jm-2
. It is also called the fracture
toughness of the material, given as:
in this case is independent of the size and geometry of the cracked body (Anderson, 2004).
ii. The Stress Intensity approach
There are three types of loading that a crack can experience as shown in Figure 2.5
(Mohammad, 2005). Mode I loading, where the principal load is applied normal to the crack
plane, tend to open the crack. Mode II corresponds to in-plane shear loading and tends to
slide one crack face with respect to the other. Mode III refers to out-of-plane shear loading
(Mohammad, 2005). A cracked body can be loaded in any of these modes, or a combination
of two or three modes.
Each mode of loading produces the √ ⁄ singularity at the crack tip, but the proportionality
constant, k, and fij depend on mode. The stress intensity factor is usually given a subscript to
denote the mode of loading; i.e KI, KII, or KIII (Mohammad, 2005). Thus the stress fields
ahead of a crack tip in an isotropic linear elastic material can be written as
√
√
√
For modes I, II and III respectively (see Figure 2.5) (Mohammad, 2005).
The concepts of fracture mechanics derived prior to 1960 are applicable only to materials that
obey Hooke’s law (Anderson, 1995).

41
Figure 2.5: Three modes of loading that can be applied to a crack (Anderson, 1995).
(b) Mode II
(In-Plane Shear) (a) Mode I
(Opening)
(c) Mode III
(Out-of-Plane Shear)
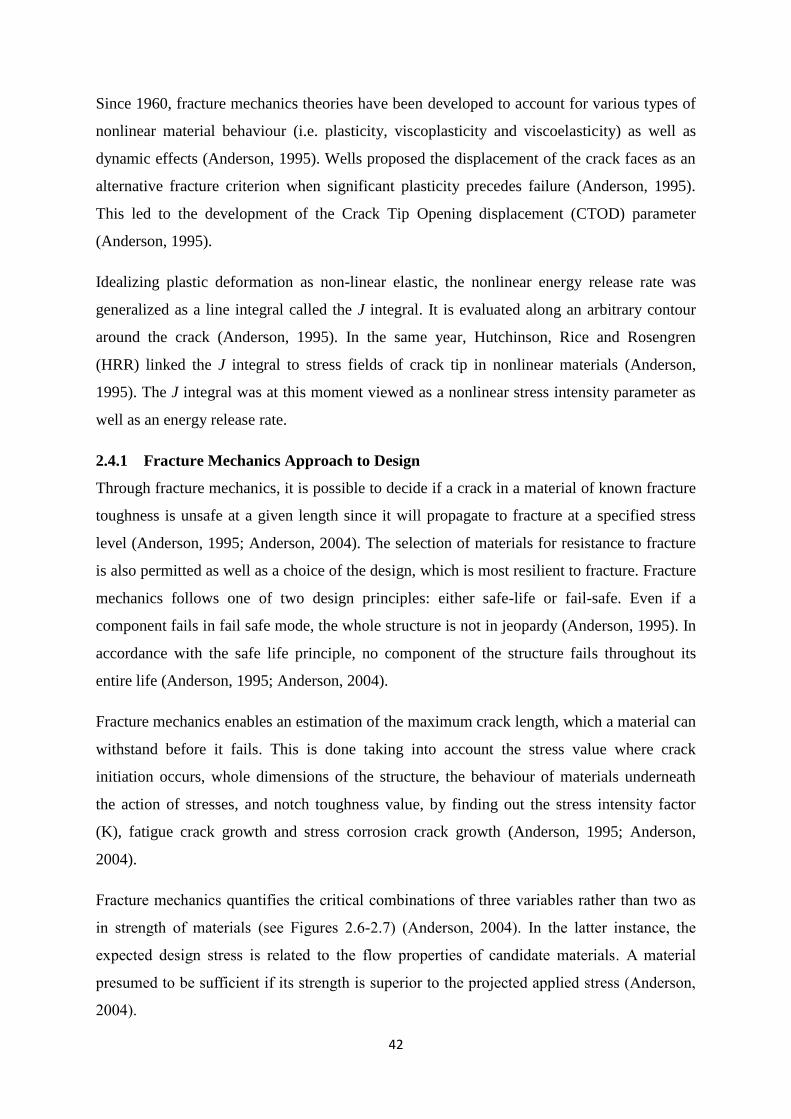
42
Since 1960, fracture mechanics theories have been developed to account for various types of
nonlinear material behaviour (i.e. plasticity, viscoplasticity and viscoelasticity) as well as
dynamic effects (Anderson, 1995). Wells proposed the displacement of the crack faces as an
alternative fracture criterion when significant plasticity precedes failure (Anderson, 1995).
This led to the development of the Crack Tip Opening displacement (CTOD) parameter
(Anderson, 1995).
Idealizing plastic deformation as non-linear elastic, the nonlinear energy release rate was
generalized as a line integral called the J integral. It is evaluated along an arbitrary contour
around the crack (Anderson, 1995). In the same year, Hutchinson, Rice and Rosengren
(HRR) linked the J integral to stress fields of crack tip in nonlinear materials (Anderson,
1995). The J integral was at this moment viewed as a nonlinear stress intensity parameter as
well as an energy release rate.
2.4.1 Fracture Mechanics Approach to Design
Through fracture mechanics, it is possible to decide if a crack in a material of known fracture
toughness is unsafe at a given length since it will propagate to fracture at a specified stress
level (Anderson, 1995; Anderson, 2004). The selection of materials for resistance to fracture
is also permitted as well as a choice of the design, which is most resilient to fracture. Fracture
mechanics follows one of two design principles: either safe-life or fail-safe. Even if a
component fails in fail safe mode, the whole structure is not in jeopardy (Anderson, 1995). In
accordance with the safe life principle, no component of the structure fails throughout its
entire life (Anderson, 1995; Anderson, 2004).
Fracture mechanics enables an estimation of the maximum crack length, which a material can
withstand before it fails. This is done taking into account the stress value where crack
initiation occurs, whole dimensions of the structure, the behaviour of materials underneath
the action of stresses, and notch toughness value, by finding out the stress intensity factor
(K), fatigue crack growth and stress corrosion crack growth (Anderson, 1995; Anderson,
2004).
Fracture mechanics quantifies the critical combinations of three variables rather than two as
in strength of materials (see Figures 2.6-2.7) (Anderson, 2004). In the latter instance, the
expected design stress is related to the flow properties of candidate materials. A material
presumed to be sufficient if its strength is superior to the projected applied stress (Anderson,
2004).
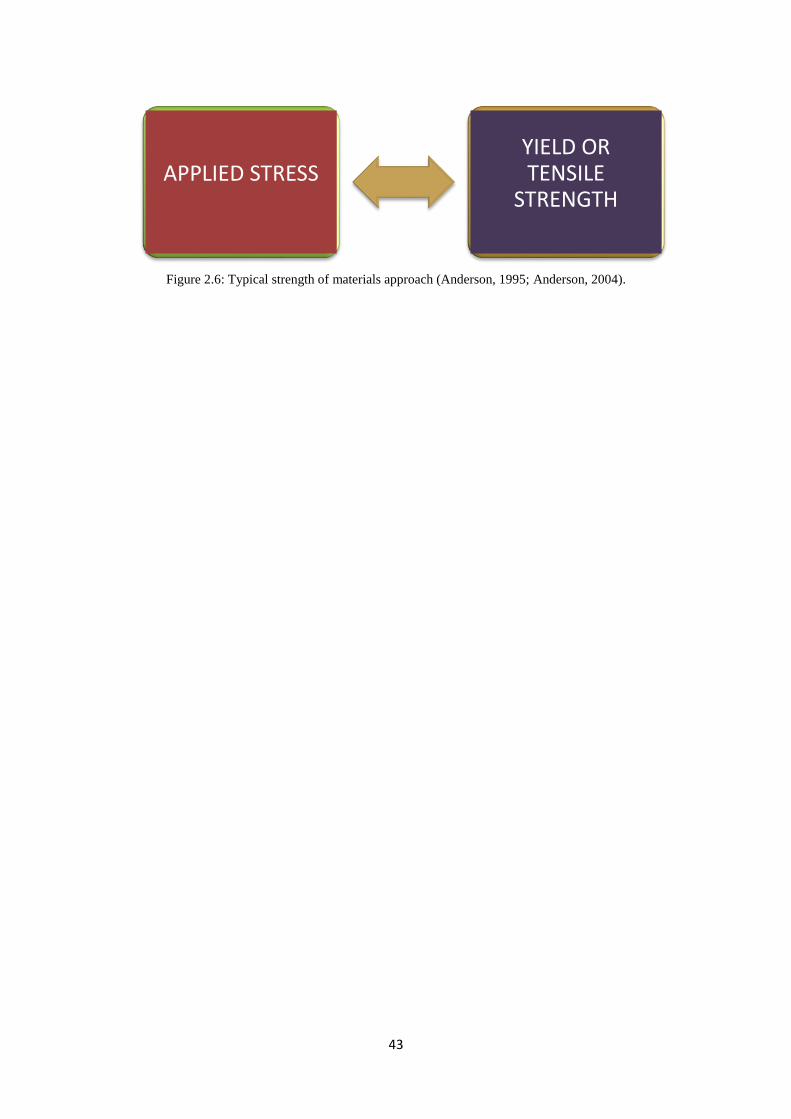
43
Figure 2.6: Typical strength of materials approach (Anderson, 1995; Anderson, 2004).
YIELD OR TENSILE
STRENGTH
APPLIED STRESS
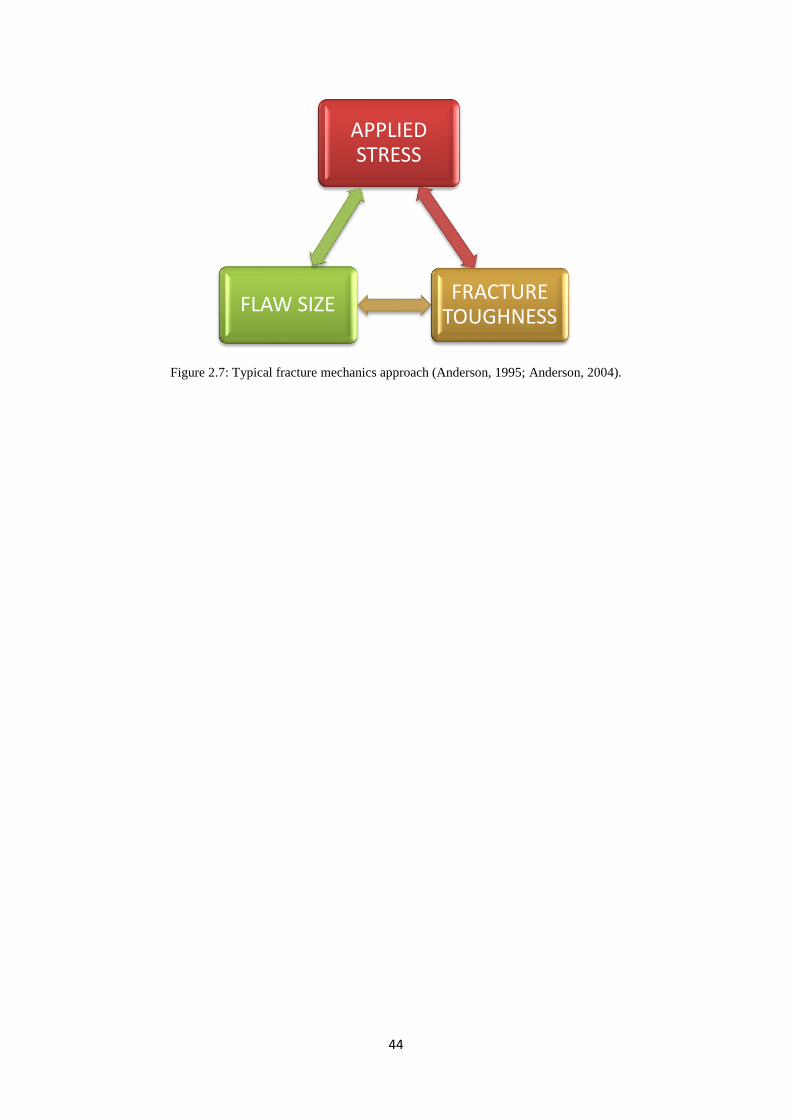
44
Figure 2.7: Typical fracture mechanics approach (Anderson, 1995; Anderson, 2004).
APPLIED STRESS
FRACTURE TOUGHNESS
FLAW SIZE
45
Such a method might endeavor to guard against brittle fracture by imposing a safety factor on
stress, joint with minimum tensile elongation requirements on the material. An additional
structural variable in the fracture mechanics approach is the flaw size (Anderson, 2004).
Also, fracture toughness substitutes strength as the pertinent material property. The branch of
fracture mechanics, which should be applied to a particular problem, is dependent on material
behaviour (Anderson, 2004). Most of the early works were relevant merely to linear elastic
materials below quasistatic circumstances. However, succeeding developments in fracture
research integrated other types of material behaviour (Anderson, 2004). Plastic deformation
is considered in elastic-plastic fracture mechanics under quasistatic conditions, while
viscoplastic, viscoelastic, and dynamic fracture mechanics consist of time as a variable as
shown in Figure 2.8 (Anderson, 2004). A line is drawn between linear elastic and dynamic
fracture mechanics because some early research considered dynamic linear elastic behaviour.
Viscoplastic, viscoelastic, and elastic-plastic fracture behaviour are occasionally contained
within the broader title of nonlinear fracture mechanics (Anderson, 2004; Anderson, 1995).
2.4.2 Linear Elastic Fracture Mechanics (LEFM)
The elastic stress field near a crack tip can be defined by the stress intensity factor K. The
extent of K hinges on the geometry of the solid containing the crack, the magnitude and site
of the crack, and the magnitude and circulation of the loads imposed on the solid. It must be
noted that as the crack-tip stresses can be defined by the stress intensity factor K, a critical
value of K called KIC can be used to define the conditions for brittle failure. The plane-strain
fracture toughness is a material property which describes the intrinsic resistance of the
material to failure in the occurrence of a crack-like flaw.
The relation is
√
Where
is a parameter which is subject to specimen and crack geometry
is applied stress in MPa
is the critical crack length in mm
is the fracture toughness in MPa m1/2
.
There has been so much research activity and rapid development (ASTM Committee E24,
1965; ASTM Spec. Tech., 1966; William, 1970) in the field of fracture toughness testing that
in a period of about 10 years, it has evolved from a research activity to a standardized
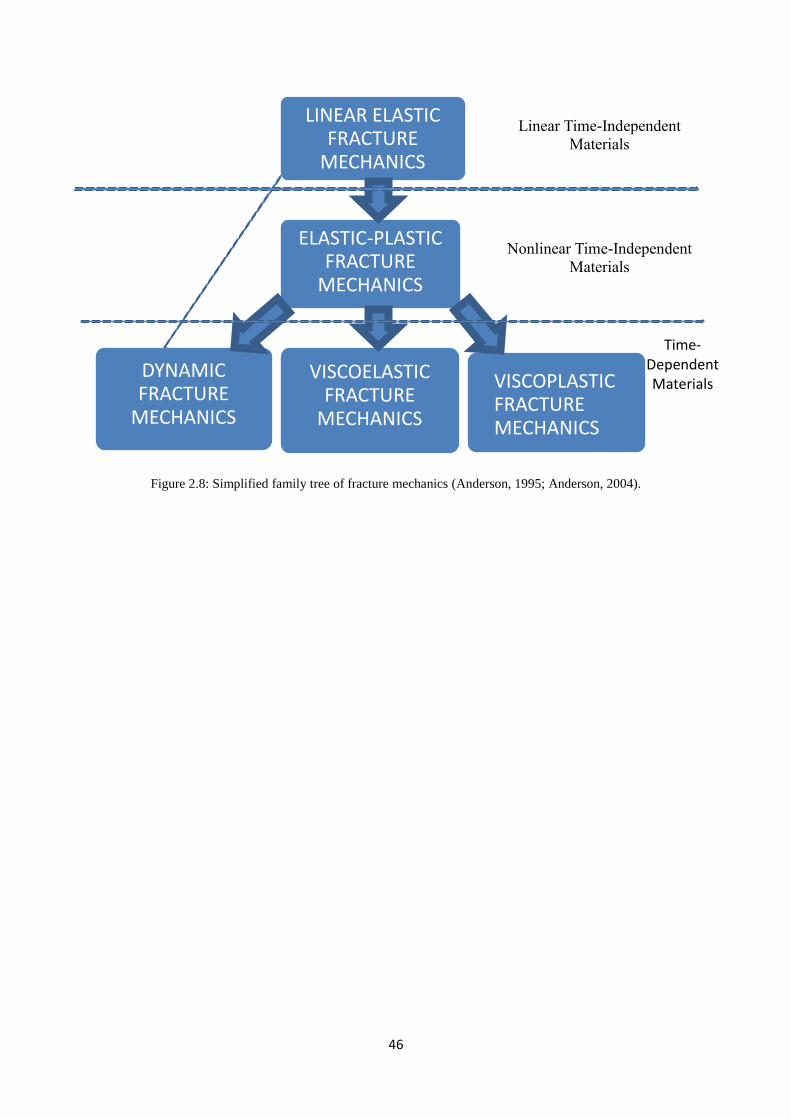
46
Figure 2.8: Simplified family tree of fracture mechanics (Anderson, 1995; Anderson, 2004).
LINEAR ELASTIC FRACTURE
MECHANICS
ELASTIC-PLASTIC FRACTURE
MECHANICS
VISCOELASTIC FRACTURE
MECHANICS
DYNAMIC FRACTURE
MECHANICS
VISCOPLASTIC FRACTURE MECHANICS
Linear Time-Independent
Materials
Nonlinear Time-Independent
Materials
Time-Dependent Materials
47
procedure (Kobayashi, 1973). According to Dieter (1988), the smallest thickness to realize
plane-strain conditions in addition to valid measurements is
(
)
Where
is the 0.2 percent offset yield strength in MPa
is the fracture toughness in MPam1/2
is the specimen thickness in mm.
Equation (2.10) will be used with an estimate of the expected KIC to determine the specimen
thickness.
In linear elastic fracture mechanics (LEFM), the existence of a crack is presumed, and
quantitative relations amid the crack length, the stress at which the crack propagates at
elevated speed to result into structural failure, and the material’s intrinsic resistance to crack
growth are used to compute the maximum permissible crack length at the working stress
(Anderson, 1995; Anderson, 2004). In order to insure against failure, cracks must be detected
before they reach this permissible size. Fracture mechanics experiment will yield apparent
plane-strain fracture toughness ( values and effective plane-strain fracture toughness
( values meant for the materials (Anderson, 1995; Anderson, 2004).
2.4.3 Elastic-Plastic Fracture Mechanics
Linear elastic fracture mechanics (LEFM) is effective only provided that nonlinear material
deformation is confined to a small region surrounding the crack tip (Anderson, 1995; Umit,
2006). In many materials, it is virtually impossible to characterize the fracture behaviour with
LEFM (Anderson, 1995; Umit, 2006). Elastic-plastic fracture mechanics (EPFM) applies to
materials that exhibit time-independent nonlinear (i.e. plastic) deformation (Anderson, 1995;
Umit, 2006). There are two elastic-plastic parameters: the crack tip opening displacement
(CTOD) and the J contour integral. Both parameters describe crack tip conditions in elastic-
plastic materials and each can be used as a fracture criterion (Anderson, 1995; Umit, 2006).
Critical values of CTOD or J give nearly size-independent measures of fracture toughness,
even for relatively large amounts of crack tip plasticity (Anderson, 1995; Mohammad, 2005).

48
a) Crack Tip Opening Displacement (CTOD)
When Wells attempted to measure KIc values in a number of structural steels, he found that
these materials were too tough to be characterized by LEFM. While examining fractured test
specimens, Wells noticed that the crack faces had moved apart prior to fracture and plastic
deformation blunted an initially sharp crack as shown in Figure 2.9 (Anderson and Anderson,
2005). The degree of crack blunting increased in proportion to the toughness of the material.
This observation led Wells to propose the opening at the crack tip as a measure of fracture
toughness (Anderson and Anderson, 2005). Currently, this parameter is known as crack tip
opening displacement (CTOD) given as:
Where
KI is fracture toughness in MPa√m
is the yield stress in MPa
is elastic modulus in GPa
is CTOD in mm.
In the limit of small scale yielding, CTOD is related to G and . The actual relationship
between CTOD and and G depends on stress state and strain hardening (Mohammad,
2005). The more general form of this relationship can be expressed as follows (Anderson,
1995; Umit, 2006):
Where is a dimensionless constant that is approximately 1.0 for plane stress and 2.0 for
plane strain (Anderson, 1995; Umit, 2006).
b) The J Contour Integral
By idealizing elastic-plastic deformation as nonlinear elastic, Rice (1968) provided the
foundation for lengthening fracture mechanics methodology well outside the validity limits of
LEFM (Anderson, 1995; Anderson, 2005). The uniaxial stress-strain behaviour of elastic-
plastic and nonlinear elastic material differs at the stage of unloading. The loading behaviour
of the two materials is identical but the material responses differ when each is unloaded.
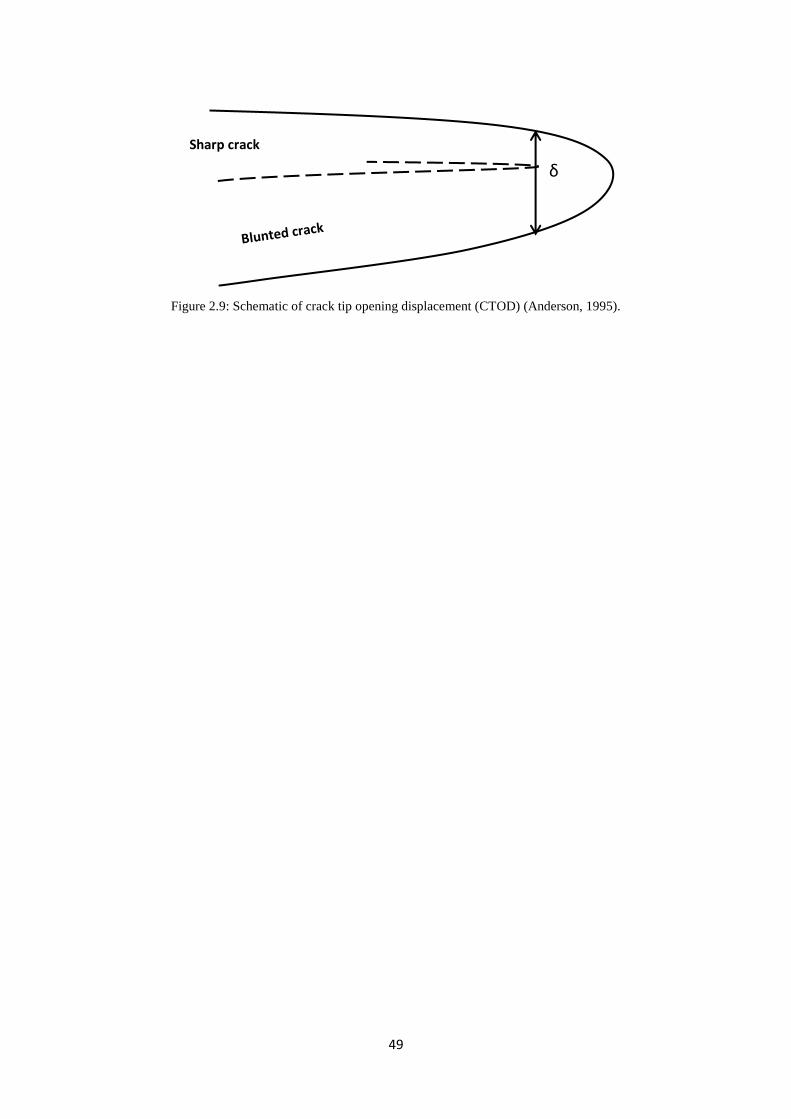
49
Figure 2.9: Schematic of crack tip opening displacement (CTOD) (Anderson, 1995).
δ
Sharp crack
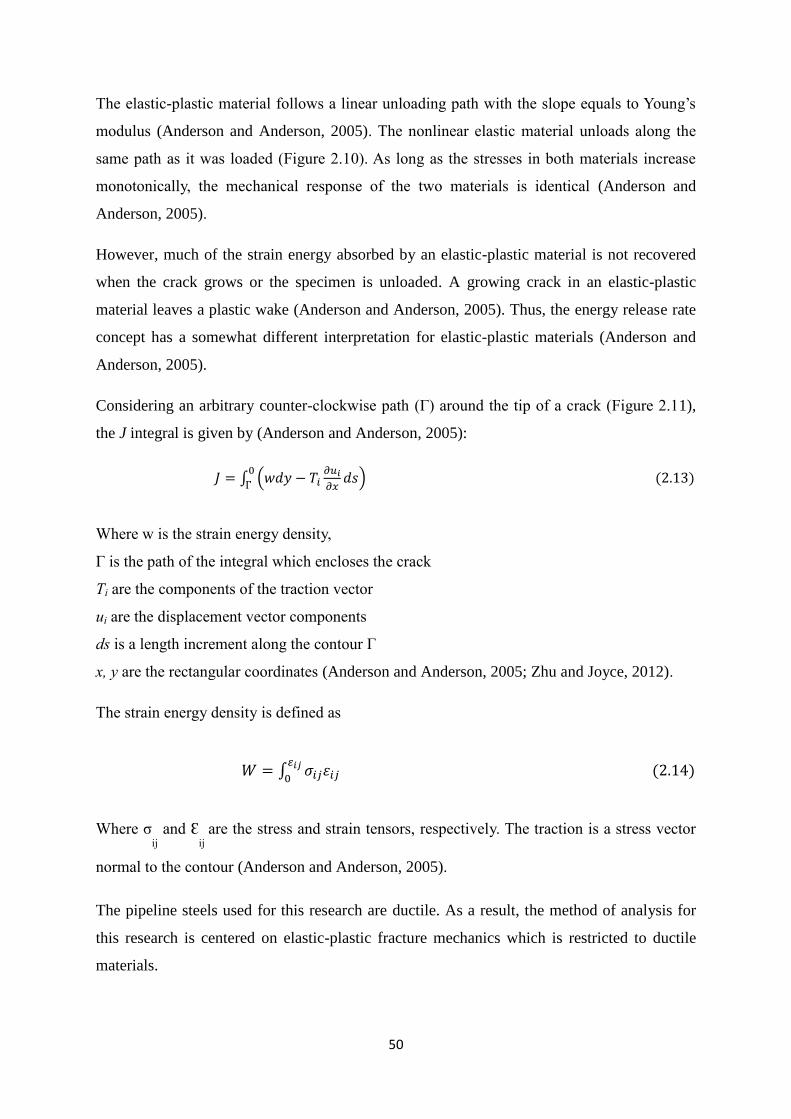
50
The elastic-plastic material follows a linear unloading path with the slope equals to Young’s
modulus (Anderson and Anderson, 2005). The nonlinear elastic material unloads along the
same path as it was loaded (Figure 2.10). As long as the stresses in both materials increase
monotonically, the mechanical response of the two materials is identical (Anderson and
Anderson, 2005).
However, much of the strain energy absorbed by an elastic-plastic material is not recovered
when the crack grows or the specimen is unloaded. A growing crack in an elastic-plastic
material leaves a plastic wake (Anderson and Anderson, 2005). Thus, the energy release rate
concept has a somewhat different interpretation for elastic-plastic materials (Anderson and
Anderson, 2005).
Considering an arbitrary counter-clockwise path (Г) around the tip of a crack (Figure 2.11),
the J integral is given by (Anderson and Anderson, 2005):
∫ (
)
Where w is the strain energy density,
Г is the path of the integral which encloses the crack
Ti are the components of the traction vector
ui are the displacement vector components
ds is a length increment along the contour Г
x, y are the rectangular coordinates (Anderson and Anderson, 2005; Zhu and Joyce, 2012).
The strain energy density is defined as
𝑊 ∫ 𝜀
Where σij
and Ԑij
are the stress and strain tensors, respectively. The traction is a stress vector
normal to the contour (Anderson and Anderson, 2005).
The pipeline steels used for this research are ductile. As a result, the method of analysis for
this research is centered on elastic-plastic fracture mechanics which is restricted to ductile
materials.
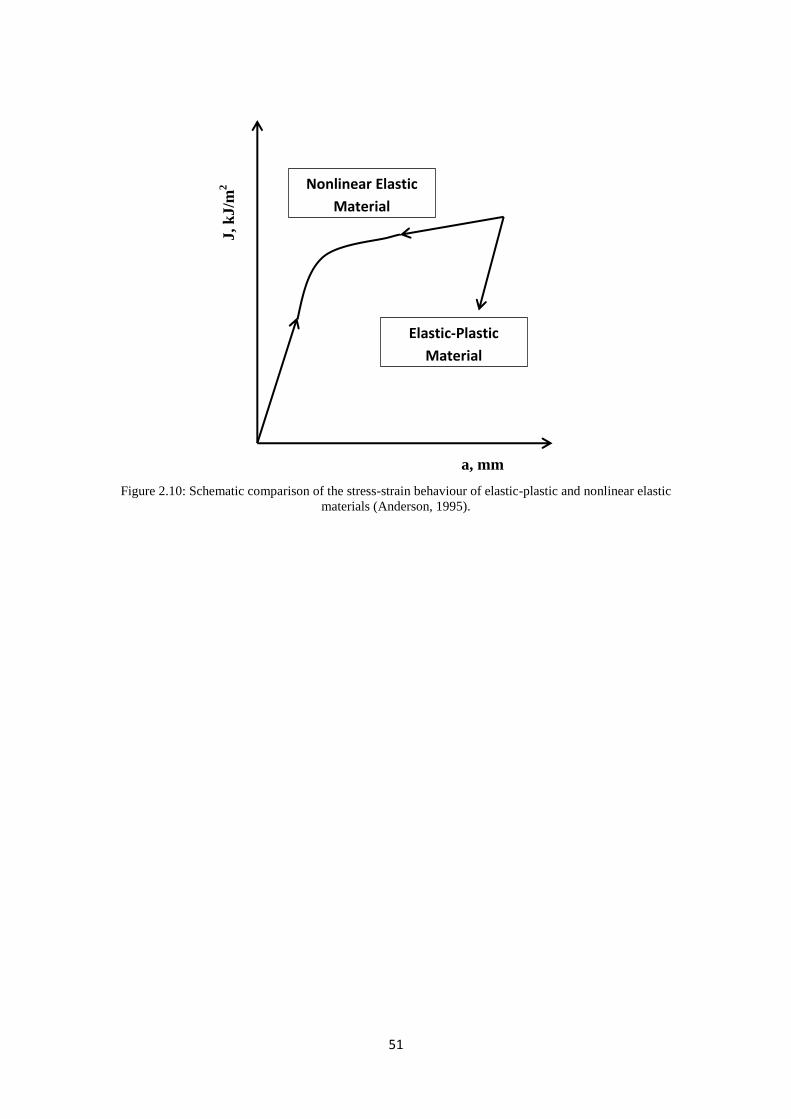
51
Figure 2.10: Schematic comparison of the stress-strain behaviour of elastic-plastic and nonlinear elastic
materials (Anderson, 1995).
Nonlinear Elastic
Material
Elastic-Plastic
Material
J, k
J/m
2
a, mm
52
Figure 2.11: Arbitrary contour around the tip of a crack (Anderson, 1995).
x
y
ds
Г
53
2.4.4 Laboratory Measurement of J
When the material behaviour is linear elastic, calculation of the J integral in a test specimen
or structure is relatively straight forward because , and is uniquely related to the
stress intensity factor (Anderson, 1995). The latter quantity can be calculated from the load as
well as crack size, assuming K solution for that particular geometry is available. Studies have
shown that Read (1982) has measured the J integral in test panels by attaching an
arrangement of strain gages in a contour round the crack tip. Since J is path independent and
the choice of contour is arbitrary, he selected a contour in such a way as to simplify the
calculation of J as much as possible. The contour method for determining J is impractical in
most cases. However, the instrumentation required for experimental measurements of the
contour integral is highly cumbersome, and the contour method is also not very attractive in
numerical analysis.
The J integral can be interpreted as the potential energy difference between two identically
loaded specimens having slightly different crack lengths (Dieter, 1988).
Where (plane stress)
⁄ (Plane strain)
J is the amount of energy absorbed by the specimens (Dieter, 1988).
Equation 2.15 is at the heart of the J-integral approach. It says that the value of J (obtained
under elastic-plastic conditions) is numerically equal to the strain-energy release rate
(obtained under elastic conditions) (Dieter, 1988). This equivalence has been demonstrated
by measuring from small fully plastic specimens and from immense elastic specimens
satisfying the plane-strain conditions of LEFM (Dieter, 1988). Thus, can be used as a
fracture criterion in the same way as and .
The underlying assumption of the J-integral approach is that material deformation can be
described by the deformation theory of plasticity, where and 𝜀 are functions only of point
of measurement and not the path taken to get to that point (Dieter, 1988). Three point bend or
compact tension (C-T) specimens are generally used for the determination of fracture
toughness of ductile materials with the J-integral method (Dieter, 1988). By means of a
chain of identical specimens (called the multispecimen method) or a single test specimen

54
with an independent method of monitoring crack growth, values of J are determined at
different amounts of crack extension (Dieter, 1988; Mohammad, 2005).
The J integral is evaluated from the following:
For the three-point bend specimen,
Where
𝑊
Mohammad, 2005
For the compact tension specimen,
[
]
Where [(
)
(
) ]
⁄
(
)
The data are plotted as a crack-resistance curve, J vs. (Figure 2.12a) (Mohammad, 2005).
The value of is established by extrapolating the linear portion of the plot to its
intersection with the blunting line (Mohammad, 2005). For to be utilized as a geometry-
independent parameter to describe crack extension the region ahead of the crack tip that is
enclosed by the integral must be large compared to the microstructural deformation and
fracture events which are involved (Mohammad, 2005). Unlike the LEFM case, these size
limitations can vary markedly for different specimen geometries.
For the edge-cracked bend specimen (Ritchie and Thompson, 1985),
⁄
For the center-cracked tension specimen (Ritchie and Thompson, 1985),
⁄
However, for the compact tension specimen or three-point bend specimen, the J-integral
approach requires a thickness not more than that essential to determine a valid in a ductile
material.
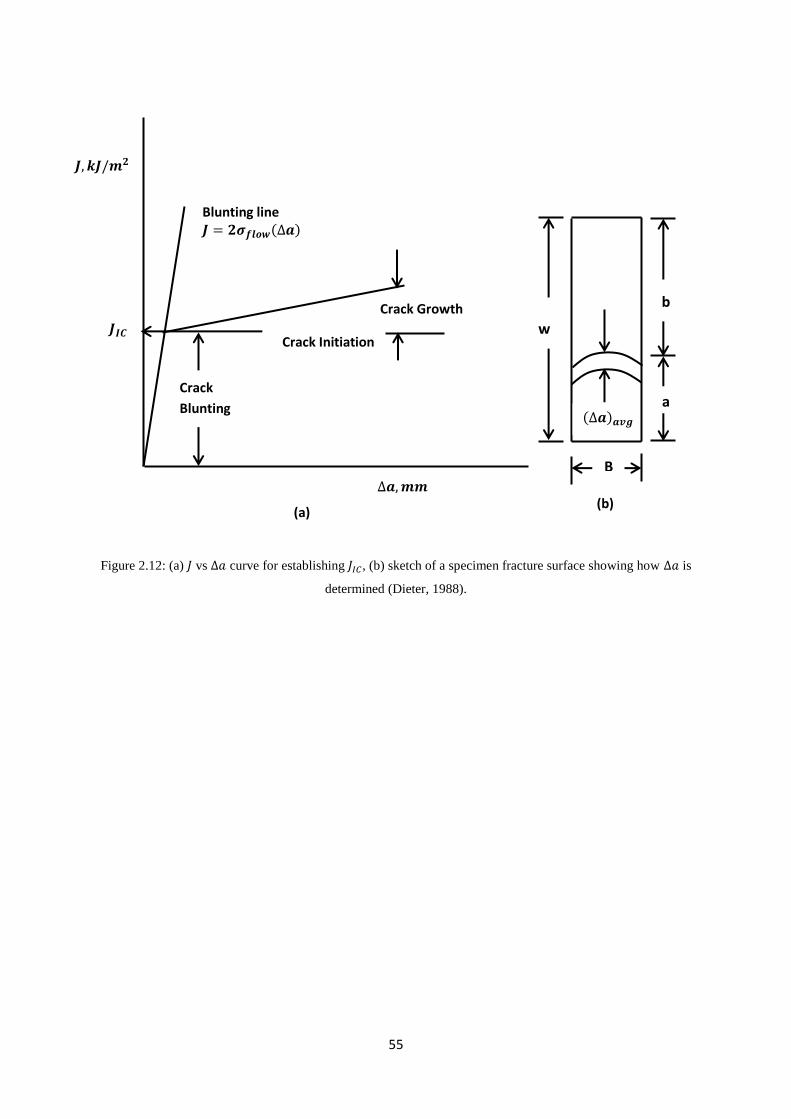
55
Figure 2.12: (a) vs curve for establishing , (b) sketch of a specimen fracture surface showing how is
determined (Dieter, 1988).
(a)
𝒂,𝒎𝒎
𝑱 𝟐𝝈𝒇𝒍𝒐𝒘 𝒂 Blunting line
Crack Growth
Crack Initiation
Crack
Blunting
𝑱,𝒌𝑱/𝒎𝟐
𝑱𝑰𝑪 w
b
a
B
𝒂 𝒂𝒗𝒈
(b)

56
2.4.5 Stretch Zone Width
The stretch zone width (SZW) is in identical plane as the fatigue precrack and denotes an
extension further than the original crack size. Fracture behaviour of ductile materials is
usually characterized by elastic-plastic fracture parameters such as the J-integral, stretch zone
width, crack tip opening displacement, amongst others (Narasaiah, Sivaprasad,
Chattopadhyay, Kushwaha, Roos and Tarafder, 2010). In ductile materials, blunting of the
fatigue precrack is due to the application of load to put up plastic strains arising out of the
local deformation processes at the crack tip (Narasaiah et al., 2010). On continuous loading,
crack tip blunting increases and reaches a limiting size which is governed by the deformation
capacity of the material (Narasaiah et al., 2010). Eventually, a fresh crack is initiated at the
crack tip.
On ductile fracture surfaces, crack tip blunting is displayed as a featureless region known as
the stretch zone (Narasaiah et al., 2010). The stretch zone thus formed can be thought of as a
frozen imprint of the state of deformation at the instant of the critical event of ductile crack
extension (Narasaiah et al., 2010). More so, its extent can be used as a pointer to indicate the
corresponding fracture toughness parameter from the experimental resistance curve
(Narasaiah, Tarafder and Sivaprasad, 2010; Aravind, 2009; Roy et al., 2009). There is a close
relationship between the fracture behaviour of materials and the magnitude of plasticity that
occurs at the crack tip (Tarafder, Dey, Sivaprasad and Tarafder, 2006, Bassim, 1995).
However, there is experimental substantiation that this crack-tip plasticity reveals itself as a
stretch zone ahead of the crack, the extent of which has been correlated with fracture
toughness (Tarafder et al., 2006).
Amongst the fracture toughness parameters used currently, the J-integral signifies the
strength of crack-tip distinctiveness in elastic-plastic bodies, its value being independent of
geometry (Bassim, 1995; Aravind, 2009). The procedure for using scanning electron
microscopy for observation of the stretch zone is well documented (Bassim, 1995; Aravind,
2009; Das, Sivaprasad, Das, Chatterjee and Tarafder, 2006). The stretch zone method has
been shown to be valuable in characterizing the fracture toughness of materials for which
compliance measurements and the detection of the onset of crack growth are difficult to
achieve and where an enduring record that can be substantiated autonomously in a number of
laboratories is required (Tarafder et al., 2006). Furthermore, the stretch zone obtained during
elastic-plastic fracture tests can be correlated rationally with the critical crack-tip opening
57
displacement (CTOD) (Tarafder et al., 2006). A review of numerous fracture studies that
have been carried out by using stretch zone measurements are presented in this section.
Cao and Lu (1984) described an experimental investigation into the relationship between
geometrical parameters of deformed crack tip (stretch zone width, SZW and stretch zone
depth, SZD) derived from micro-fractography and fracture mechanics parameters (JIC and
crack tip opening displacement, CTOD) determined by mechanics tests. It was proved that
SZD instead of SZW is equivalent to CTOD. Another study (Saxena, Ramakrishnan and
Dutta, 2009) involved finite element analyses of compact tension test, using tensile test data
to numerically determine SZW and its critical value. The proposed method predicted the
trend and magnitude of SZW and its critical value accurately. It also compared well with
experimental values. In addition, Saxena, Dutta and Sasikala (2016) established a method for
numerical assessment of stretch zone width under mixed mode I/III fracture. Three-
dimensional non-linear finite element method (FEM) simulations were carried out to
correlate numerical parameters with experimentally determined critical SZW and initiation
fracture toughness.
Chowdhury, Sivaprasad, Bar, Tarafder and Bandyopadhyay (2015) examined stretch zone
formation during cyclic fracture tests on nuclear pressure vessel steel using various load
ratios and incremental plastic displacements. The mean stretch zone width was found to
decrease with R ratio and increase with incremental plastic displacement.
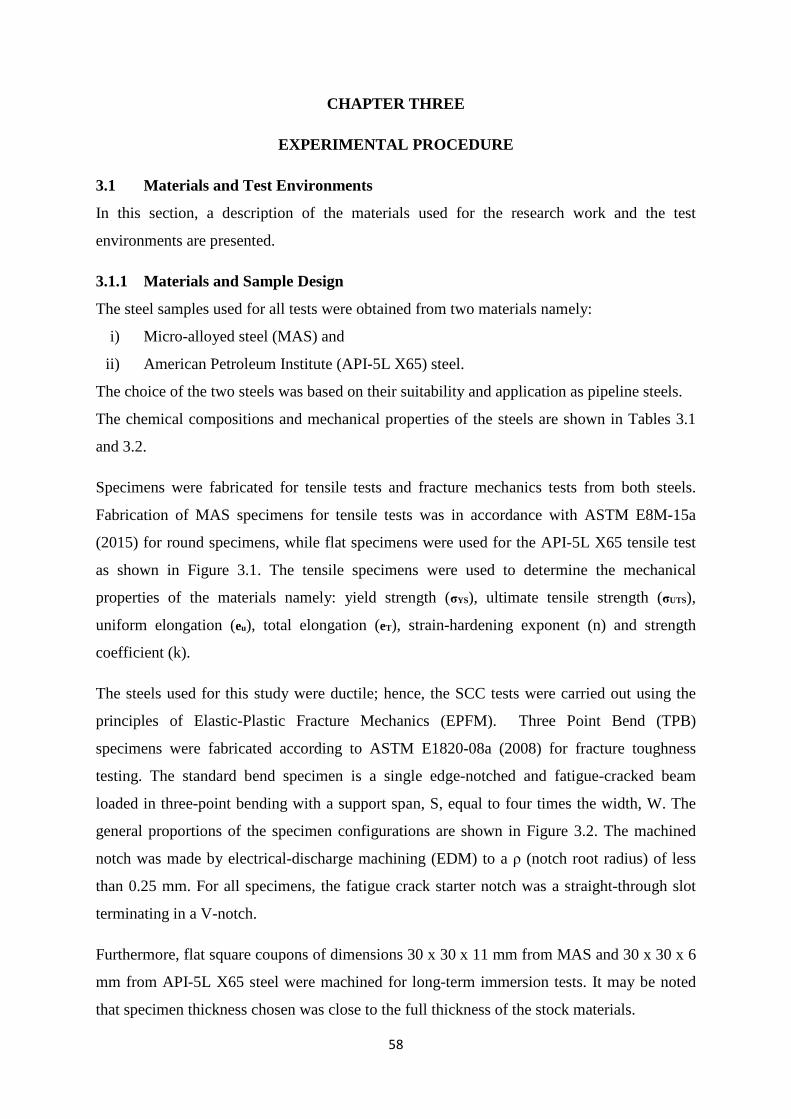
58
CHAPTER THREE
EXPERIMENTAL PROCEDURE
3.1 Materials and Test Environments
In this section, a description of the materials used for the research work and the test
environments are presented.
3.1.1 Materials and Sample Design
The steel samples used for all tests were obtained from two materials namely:
i) Micro-alloyed steel (MAS) and
ii) American Petroleum Institute (API-5L X65) steel.
The choice of the two steels was based on their suitability and application as pipeline steels.
The chemical compositions and mechanical properties of the steels are shown in Tables 3.1
and 3.2.
Specimens were fabricated for tensile tests and fracture mechanics tests from both steels.
Fabrication of MAS specimens for tensile tests was in accordance with ASTM E8M-15a
(2015) for round specimens, while flat specimens were used for the API-5L X65 tensile test
as shown in Figure 3.1. The tensile specimens were used to determine the mechanical
properties of the materials namely: yield strength (σYS), ultimate tensile strength (σUTS),
uniform elongation (eu), total elongation (eT), strain-hardening exponent (n) and strength
coefficient (k).
The steels used for this study were ductile; hence, the SCC tests were carried out using the
principles of Elastic-Plastic Fracture Mechanics (EPFM). Three Point Bend (TPB)
specimens were fabricated according to ASTM E1820-08a (2008) for fracture toughness
testing. The standard bend specimen is a single edge-notched and fatigue-cracked beam
loaded in three-point bending with a support span, S, equal to four times the width, W. The
general proportions of the specimen configurations are shown in Figure 3.2. The machined
notch was made by electrical-discharge machining (EDM) to a ρ (notch root radius) of less
than 0.25 mm. For all specimens, the fatigue crack starter notch was a straight-through slot
terminating in a V-notch.
Furthermore, flat square coupons of dimensions 30 x 30 x 11 mm from MAS and 30 x 30 x 6
mm from API-5L X65 steel were machined for long-term immersion tests. It may be noted
that specimen thickness chosen was close to the full thickness of the stock materials.
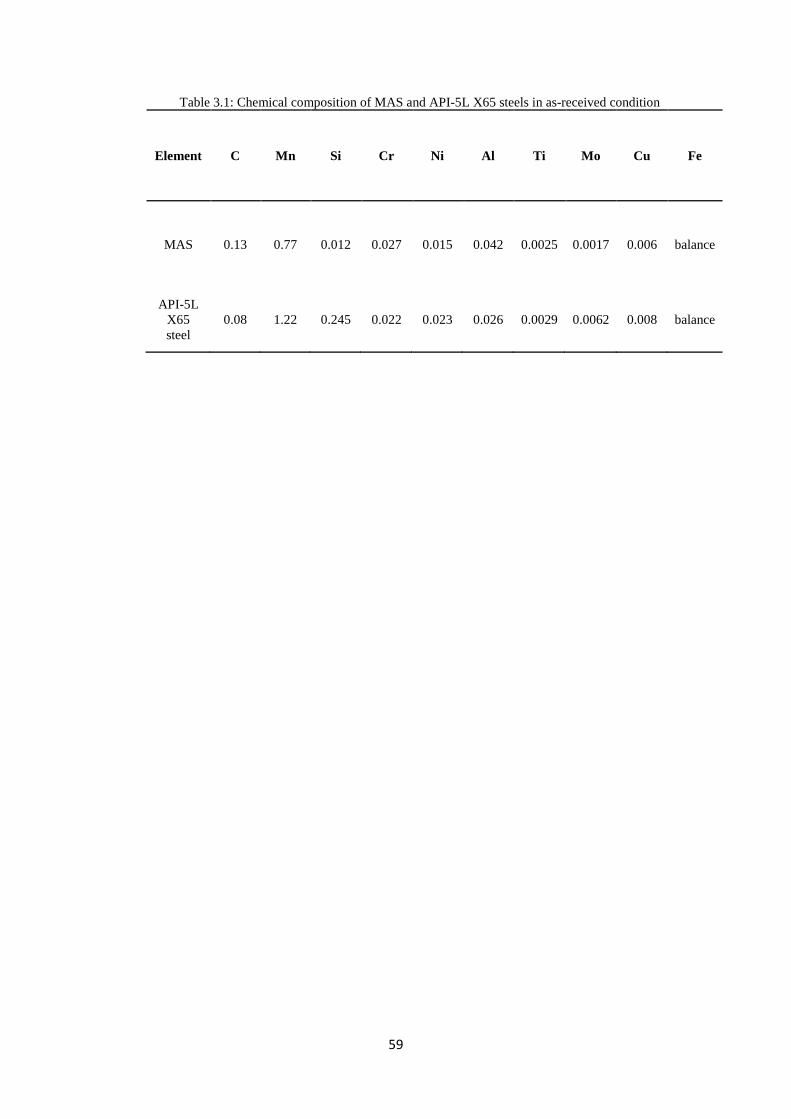
59
Table 3.1: Chemical composition of MAS and API-5L X65 steels in as-received condition
Element C Mn Si Cr Ni Al Ti Mo Cu Fe
MAS 0.13 0.77 0.012 0.027 0.015 0.042 0.0025 0.0017 0.006 balance
API-5L X65 steel
0.08 1.22 0.245 0.022 0.023 0.026 0.0029 0.0062 0.008 balance
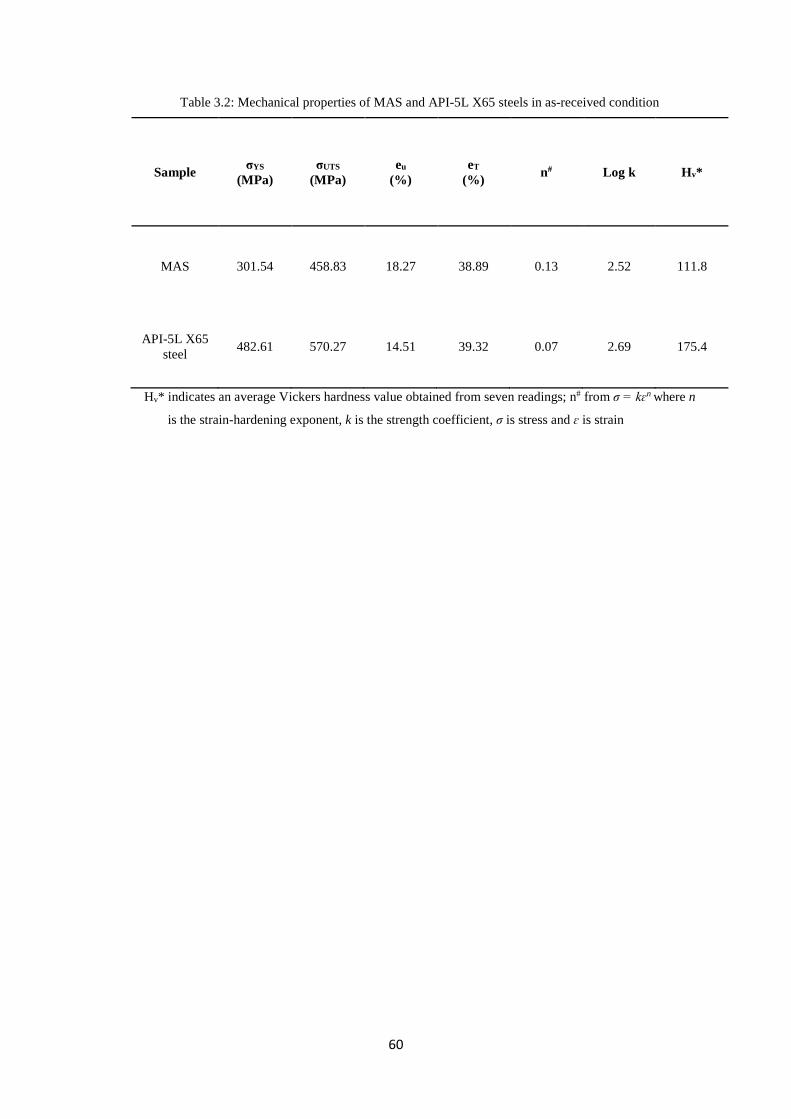
60
Table 3.2: Mechanical properties of MAS and API-5L X65 steels in as-received condition
Sample σYS (MPa)
σUTS (MPa)
eu (%)
eT (%) n# Log k Hv*
MAS 301.54 458.83 18.27 38.89 0.13 2.52 111.8
API-5L X65 steel 482.61 570.27 14.51 39.32 0.07 2.69 175.4
Hv* indicates an average Vickers hardness value obtained from seven readings; n# from σ = kɛn where n
is the strain-hardening exponent, k is the strength coefficient, σ is stress and ɛ is strain
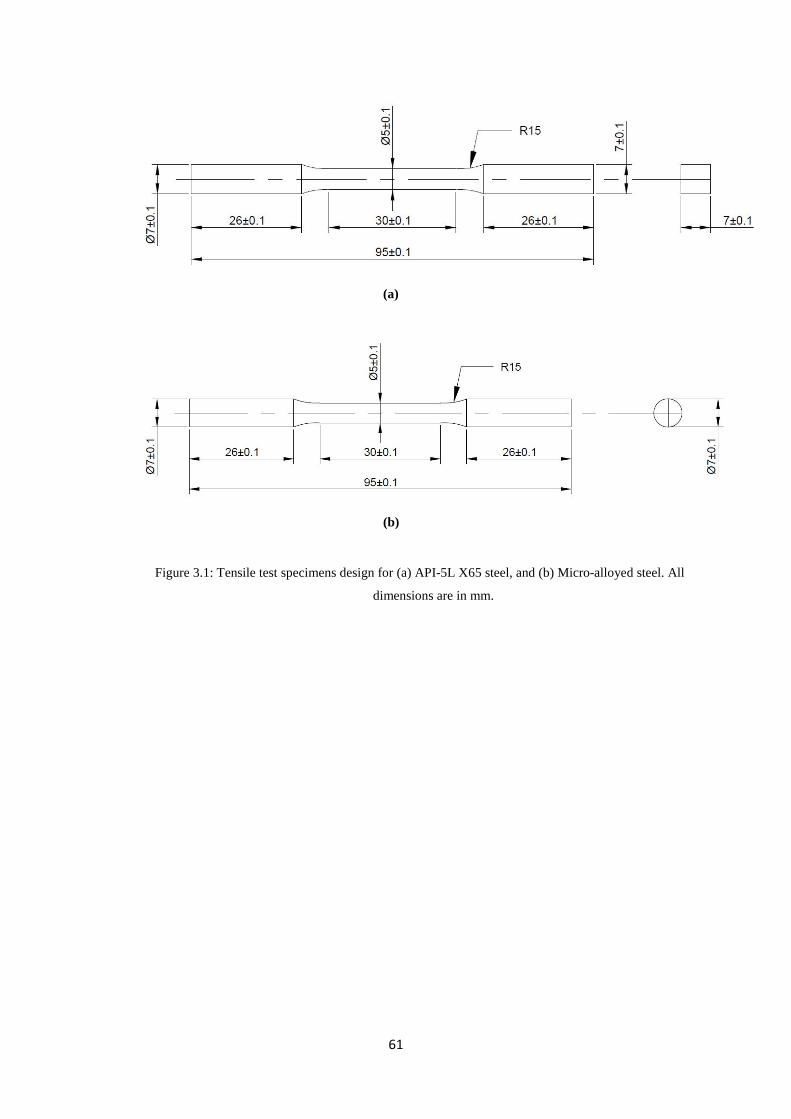
61
(a)
(b)
Figure 3.1: Tensile test specimens design for (a) API-5L X65 steel, and (b) Micro-alloyed steel. All
dimensions are in mm.

62
Figure 3.2: Specimen dimension and configuration for three-point bend test (all dimensions in mm).
63
Flat rectangular specimens (14 x 10 mm) were also machined for electrochemical tests from
both steels. All specimens for both immersion and electrochemical tests were dry-abraded up
to 2000 grit, degreased with acetone, dried and used immediately for testing.
3.1.2 Test Environments
The test solutions were prepared in accordance with ASTM D-4806-01a (2001) for fuel grade
ethanol. All reagents used conformed to the standard, ethanol being the exception. Due to the
unavailability of 200 proof ethanol in the study domain, 195 proof ethanol was used for the
study. Other reagents added include: pure methanol, glacial acetic acid, ultra-pure water (~18
MΩ/cm) and pure sodium chloride (NaCl) with purity ˃99%. NaCl was first dissolved in
water, and then added to ethanol to reach the specified NaCl and water concentrations
respectively. The baseline composition for the simulated fuel-grade ethanol used in this study
is shown in Table 3.3. The ethanol composition was adjusted to simulate various test
conditions. All reagents used were of analytical grade.
The denaturant used was unleaded gasoline. Three ethanol concentrations (E20, E40 and
E80) were used for the tests. For each ethanol concentration, two sodium chloride (NaCl)
concentrations (0 mg/l and 32 mg/l) were used to investigate the effect of chloride on the
fracture behaviour of the steels. Control corrosion tests were carried out at room temperature
(27oC) in the absence of chloride (0 mg/l NaCl). All ethanol-based fracture tests were
likewise carried out at 27oC and interpreted with respect to a reference test conducted in air.
3.2 Methods
In this section, the methods used for both corrosion and fracture studies are described.
Characterization of the as-received materials involved microstructural examination, hardness
tests for determination of Vickers hardness and tensile tests for determination of mechanical
properties. Corrosion behaviour was studied using long-term immersion tests and
electrochemical measurements. Fracture behaviour was determined through monotonic J
integral tests using the principles of elastic-plastic fracture mechanics. The experimental
procedures are explained in the following sub-sections.
3.2.1 Microstructural Examination
From the as-received steels, test specimens, approximately 10 x 10 x 10 mm were cut and dry
polished up to 2000 μm. Wet polishing was carried out using 0.5 μm alumina and colloidal
silica on Presi Mecapol P 262 rotary polishing machine. The samples were thereafter etched
with 4% Nital and observed under a Leica optical microscope.

64
Table 3.3: Composition of simulated fuel ethanol based on ASTM D 4806 (2001).
Ethanol (vol. %)
Methanol (vol. %)
Water (vol. %)
NaCl (mg/l)
Acetic Acid (mg/l)
98.5 0.5 1 32 56

65
Microstructural images were also taken at magnification range of 200x - 4000x using a FEI-
430 NOVA NANO FEG-SEM.
3.2.2 Tensile Test
Samples were fabricated according to ASTM standard E8 in replicate for tensile tests from
the as-received API-5L X65 steel and micro-alloyed steel. Due to the geometry of the as-
received materials, round tensile specimens were prepared from micro-alloyed steel while flat
specimens were prepared from API-5L X65 steel. The designs of the specimens are shown in
Figure 3.1. The tests were carried out with INSTRON 8862 servo hydraulic universal testing
system with a load cell capacity of 100 kN and a crosshead velocity of 0.003 mm/s. The
software was supplied by INSTRON and it has provision for adjusting the test conditions like
displacement rate and data acquisition. The strain was measured through an extensometer of
25 mm gauge length, attached to the middle of the specimen. About 2500-3000 data points of
engineering stress, percentage strain and displacement was acquired in each test for post
processing.
3.2.3 Hardness Test
The Vickers hardness value of the as-received materials was evaluated using a Universal
Hardness Tester, model number UH-3. Specimens of approximately 30 x 30 x 10 mm were
machined and polished to remove scales and pits. They were also cleaned with acetone. A
load of 20 kg was used for the indentation. Seven indentations were taken at different points
on each specimen and the average value computed.
3.2.4 Electrochemical Measurements
A Gamry reference 600 Potentiostat/Galvanostat/ZRA was used for open circuit potential
(OCP) and anodic polarization measurements. The test setup consists of a three electrode
glass cell with saturated calomel electrode (SCE) as the reference electrode and platinum
electrode as a counter electrode (Plate 3.1). The platinum electrode was constructed using
vitri glass from Princeton glassware. Each experiment was carried out in replicate in order to
ascertain the reproducibility of the experiments. Samples were mounted with Bakelite,
thereby minimising contact area. The mounted samples were threaded to a carbon steel rod
and suspended in solution. A teflon tape was used to insulate the steel rod from the test
solution. The setup was designed as to maintain constant distance between the electrodes for
all tests. The appearance of the mounted samples before and after the electrochemical tests is
shown in Plate 3.2.
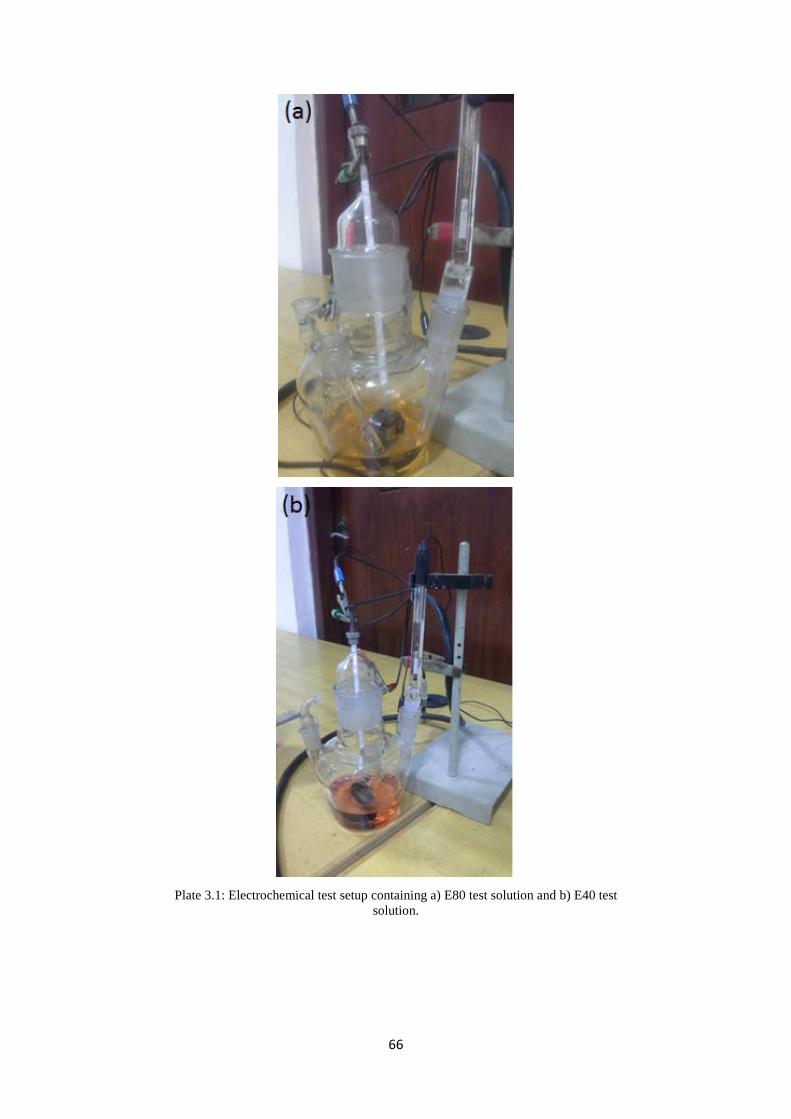
66
Plate 3.1: Electrochemical test setup containing a) E80 test solution and b) E40 test
solution.

67
Plate 3.2: Mounted samples for electrochemical tests showing a) before testing and b)
after testing.
(a)
(b)
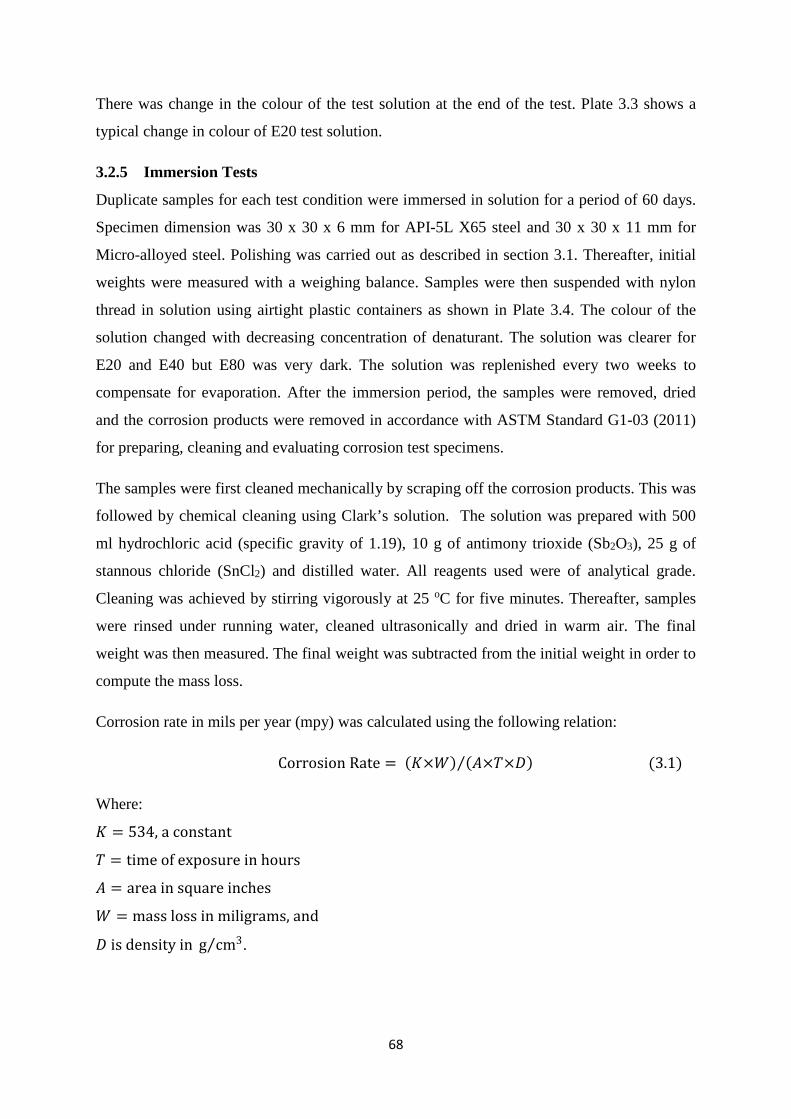
68
There was change in the colour of the test solution at the end of the test. Plate 3.3 shows a
typical change in colour of E20 test solution.
3.2.5 Immersion Tests
Duplicate samples for each test condition were immersed in solution for a period of 60 days.
Specimen dimension was 30 x 30 x 6 mm for API-5L X65 steel and 30 x 30 x 11 mm for
Micro-alloyed steel. Polishing was carried out as described in section 3.1. Thereafter, initial
weights were measured with a weighing balance. Samples were then suspended with nylon
thread in solution using airtight plastic containers as shown in Plate 3.4. The colour of the
solution changed with decreasing concentration of denaturant. The solution was clearer for
E20 and E40 but E80 was very dark. The solution was replenished every two weeks to
compensate for evaporation. After the immersion period, the samples were removed, dried
and the corrosion products were removed in accordance with ASTM Standard G1-03 (2011)
for preparing, cleaning and evaluating corrosion test specimens.
The samples were first cleaned mechanically by scraping off the corrosion products. This was
followed by chemical cleaning using Clark’s solution. The solution was prepared with 500
ml hydrochloric acid (specific gravity of 1.19), 10 g of antimony trioxide (Sb2O3), 25 g of
stannous chloride (SnCl2) and distilled water. All reagents used were of analytical grade.
Cleaning was achieved by stirring vigorously at 25 oC for five minutes. Thereafter, samples
were rinsed under running water, cleaned ultrasonically and dried in warm air. The final
weight was then measured. The final weight was subtracted from the initial weight in order to
compute the mass loss.
Corrosion rate in mils per year (mpy) was calculated using the following relation:
Corrosion Rate = (𝐾𝐾×𝑊𝑊) (𝐴𝐴×𝑇𝑇×𝐷𝐷)⁄ (3.1)
Where:
𝐾𝐾 = 534, a constant
𝑇𝑇 = time of exposure in hours
𝐴𝐴 = area in square inches
𝑊𝑊 = mass loss in miligrams, and
𝐷𝐷 is density in g cm3⁄ .
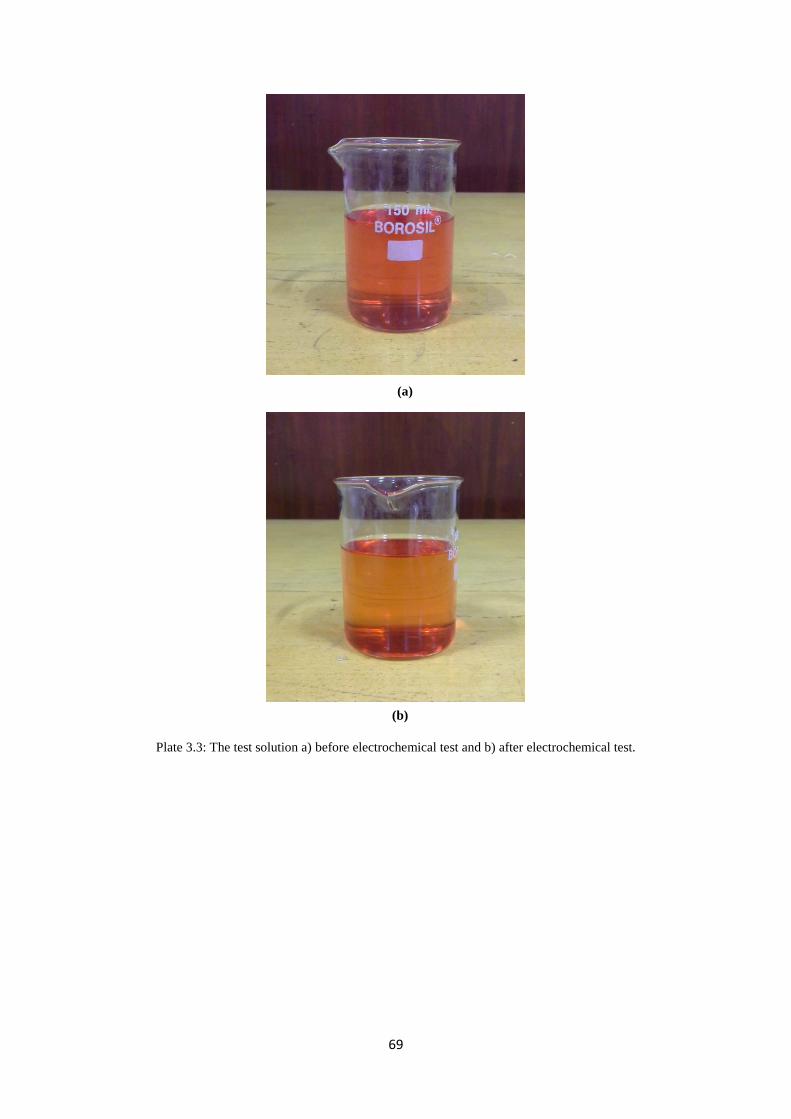
69
Plate 3.3: The test solution a) before electrochemical test and b) after electrochemical test.
(a)
(b)
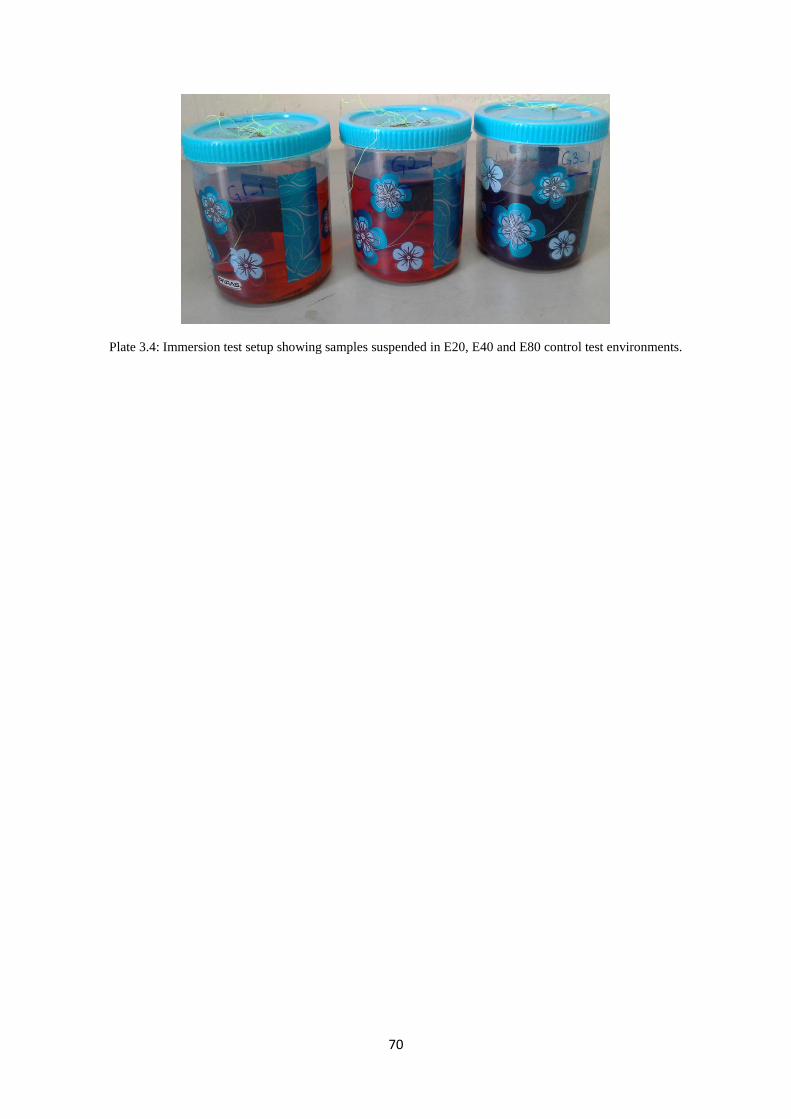
70
Plate 3.4: Immersion test setup showing samples suspended in E20, E40 and E80 control test environments.
71
3.2.6 Monotonic J Testing
Elastic-plastic Fracture Mechanics (EPFM) tests were carried out using the monotonic J-
integral test method. Monotonic here implies tension/compression forces. The experiments
were carried out according to the procedures and guidelines for the determination of fracture
toughness of metallic materials in ASTM E1820. The fracture toughness determined with this
test method was for the opening mode (Mode I) of loading. Three-point bend (TPB) or
compact tension (CT) specimens are generally used for the determination of fracture
toughness of ductile materials with the J-integral method and without electrochemical
potential measurements.
For the three-point bend specimen,
𝐽𝐽 =2𝐴𝐴𝐵𝐵𝐵𝐵
(3.2)
Where J is the fracture toughness in kJ/m2
A is area under the load-displacement curve in mm2
B is the specimen thickness in mm
b is the unbroken ligament given by (W-a) in mm
W is the specimen width in mm
a is the crack length in mm.
The procedures for the test are described in further detail in sub-sections 3.2.6.1 – 3.2.6.4.
3.2.6.1 Specimen Precracking
All specimens were precracked in fatigue following ASTM standard E647-03 (2003). The
importance was to provide a sharpened crack of adequate size and straightness. The
equipment used for fatigue precracking was Instron 8501 servohydraulic universal testing
machine. The notch length, thickness, width and span of each specimen was measured with a
Vernier caliper and recorded. The test frame was properly aligned and the force cell properly
calibrated. Each specimen was loaded such that the stress distribution was symmetrical about
the plane of the prospective crack. The test setup is shown in Plate 3.5. This was to prevent
the crack from deviating from that plane, thereby affecting the result obtained. The fixtures
used for precracking were the same used for the J testing. The combination of starter notch
and fatigue precrack are as shown in Figure 3.3.
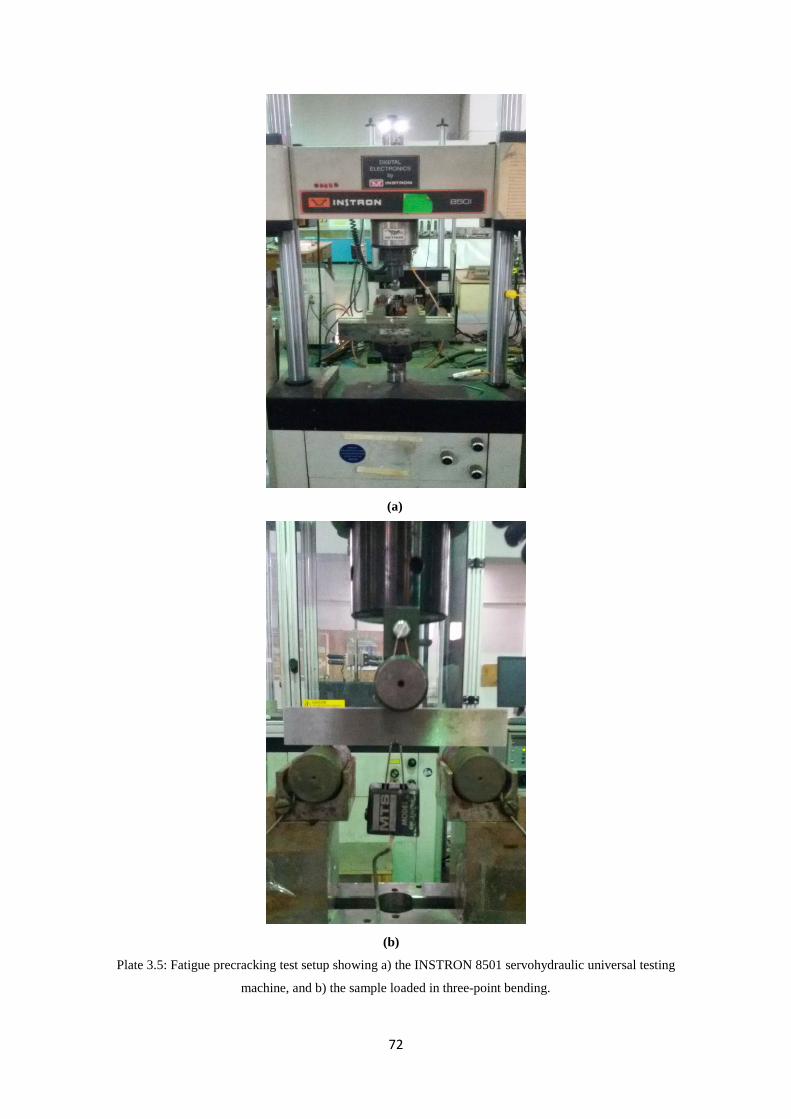
72
(a)
(b)
Plate 3.5: Fatigue precracking test setup showing a) the INSTRON 8501 servohydraulic universal testing
machine, and b) the sample loaded in three-point bending.
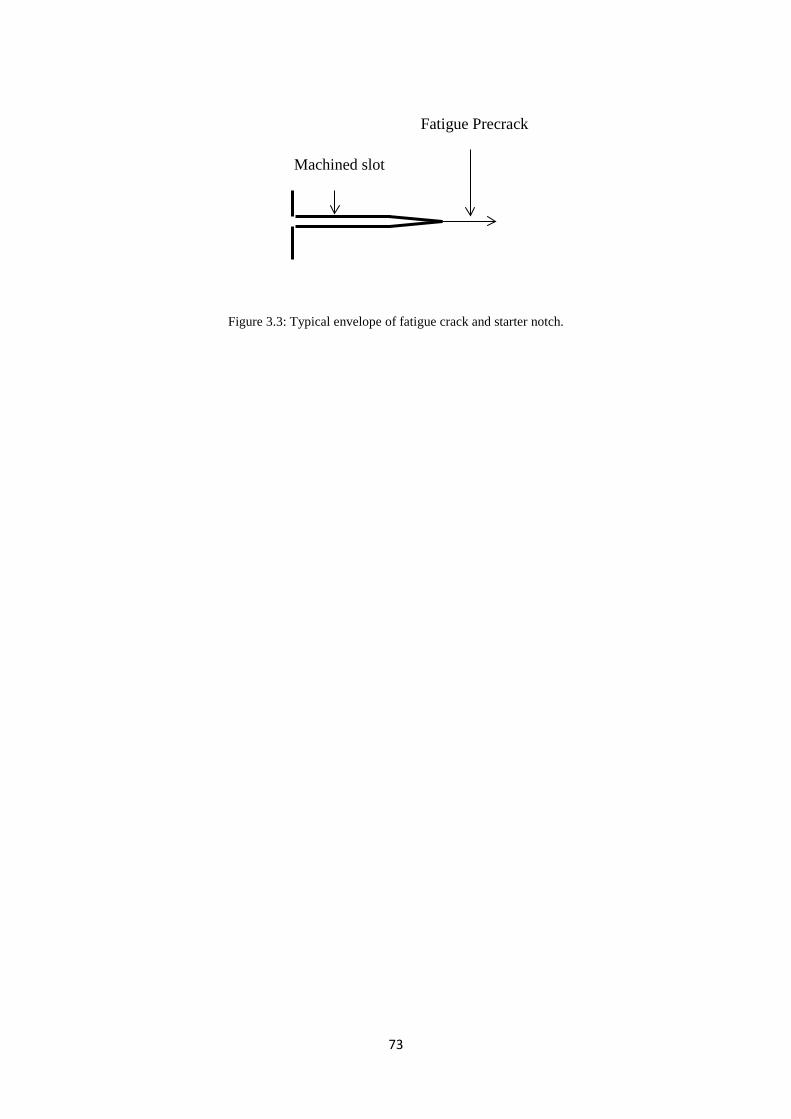
73
Figure 3.3: Typical envelope of fatigue crack and starter notch.
Fatigue Precrack
Machined slot
74
In choosing the appropriate mode of K-control, the application of the test data is important. A
constant ∆K value was used for precracking. Initial frequency of 5 Hz and ∆K value of 15
MPa√m was used to start the test. Samples were set to precrack up to 10 mm using a 5 mm
COD gage with a travel of 2 mm. Fatigue cycling began with a sinusoidal waveform. ∆K
was increased to 18 MPa√m and the frequency gradually increased to 15 Hz. To promote
early crack initiation, the specimen was statically preloaded in such a way that the notch tip
was compressed in a direction normal to the intended crack plane (to a force not exceeding
0.2 kN). Fatigue precracking was conducted under displacement control. Precracking was
accomplished in two steps. For the first step, the maximum stress intensity applied to the
specimen was limited by:
𝐾𝐾𝑀𝑀𝑀𝑀𝑀𝑀 = �𝜎𝜎𝑌𝑌𝑌𝑌𝑓𝑓
𝜎𝜎𝑌𝑌𝑌𝑌𝑇𝑇� �0.063𝜎𝜎𝑌𝑌𝑌𝑌
𝑓𝑓 𝑀𝑀𝑀𝑀𝑀𝑀√𝑚𝑚� (3.3)
Where:
𝜎𝜎𝑌𝑌𝑌𝑌𝑓𝑓 and 𝜎𝜎𝑌𝑌𝑌𝑌𝑇𝑇 = the material yield stresses at the fatigue precrack and test temperatures
respectively.
The second precracking step includes the final 50 percent (%) of the fatigue precrack. The
specimen was carefully monitored until crack initiation was observed. The fatigue precrack
was produced by cyclically loading the notched specimens for a number of cycles between
the range of 104 and 106. The length of the fatigue precrack was not less than 0.5 W, where W
is the specimen width in millimeters.
3.2.6.2 Monotonic J Tests
The overall objective of the test was to develop a load (P)-displacement (V) record which can
be used to evaluate fracture toughness (J) and crack growth rate of the steels in the test
environments. The resistance curve procedure, which utilizes an elastic unloading technique
to obtain a J-resistance (J-R) curve from a single specimen test, was used following the
ASTM standard E1820-08a (2008). A total of fourteen (14) specimens were used for the test,
seven from Micro-alloyed steel and the other seven from API-5L X65 steel. The dimensions,
B, W, and S of the specimens were measured. The equipment used for the J tests is the
INSTRON 8862 servo-electric universal testing machine. The bend test fixture was set so that
the line of action of the applied force passes midway between the support roll centers within
±1% of the distance between the centers. The specimens were loaded so that the crack tip
75
was midway between the rolls to within 1% of the span. All specimens were loaded under
displacement gage and in position control. The test setup is shown in Plates 3.6-3.7. The tests
were performed in a stainless steel test cell with a total volume of 7 litres; 5 litres of solution
was filled and the vapour space was 2 litres.
The time to perform an unload/reload sequence was such as needed to accurately estimate the
crack size. The loading/unloading/reloading steps are shown in Figure 3.4. The ramp rate
was 10-04 mm/s for loading, 10-02 mm/s for unloading and 10-02 mm/s for reloading. The
difference in the loading and unloading displacement was to ensure that the tensile stress
required for SCC to occur was not removed for duration longer than was necessary. Loading
was carried out very slowly at the ramp rate of 10-04 mm/s in each sequence in order to
enhance SCC effect if any. The data acquisition rate was set at 5 Hz. After setting the test
parameters, the solution was poured carefully into the stainless steel tank, up to the mark
indicating the region of fatigue precrack. The test specimen was statically preloaded with an
initial load of 0.2 kN before running. Test was stopped at 20-30 % load drop. Each test lasted
for a minimum period of 48 hours. After the final unloading cycle, the load was returned to
zero without additional crosshead displacement.
At the end of the test, the specimen was unloaded, immediately rinsed in water and cleaned
with acetone. Thereafter, it was dried and stored in the desiccator. Same procedure was
repeated for all samples tested. Plates 3.8-3.9 show the appearances of API-5L X65 steel and
MAS before and after the J tests.
3.2.6.3 Optical Crack Size Measurement
The unloaded specimen was cooled in liquid nitrogen to ensure brittle behaviour. Thereafter,
the specimen was immediately broken to expose the crack with the aid of a vice and hammer.
The beginning of stable crack extension was marked by the thumbnail shape ahead of the flat
fatigue precracked area, while the end of the crack extension is marked by the beginning of
the second flat fatigue area. Typical fracture surfaces of tested samples are shown in Plate
3.10. The length of the original crack and the final physical crack length were measured at
nine equally spaced points centred about the specimen centreline using a Vernier calliper.
The two near-surface measurements were averaged and combined with the remaining seven
crack length measurements and the average determined. The physical crack extension was
further calculated. Data analyses were carried out as described in ASTM standard E1820 and
are presented in chapter four of this work.
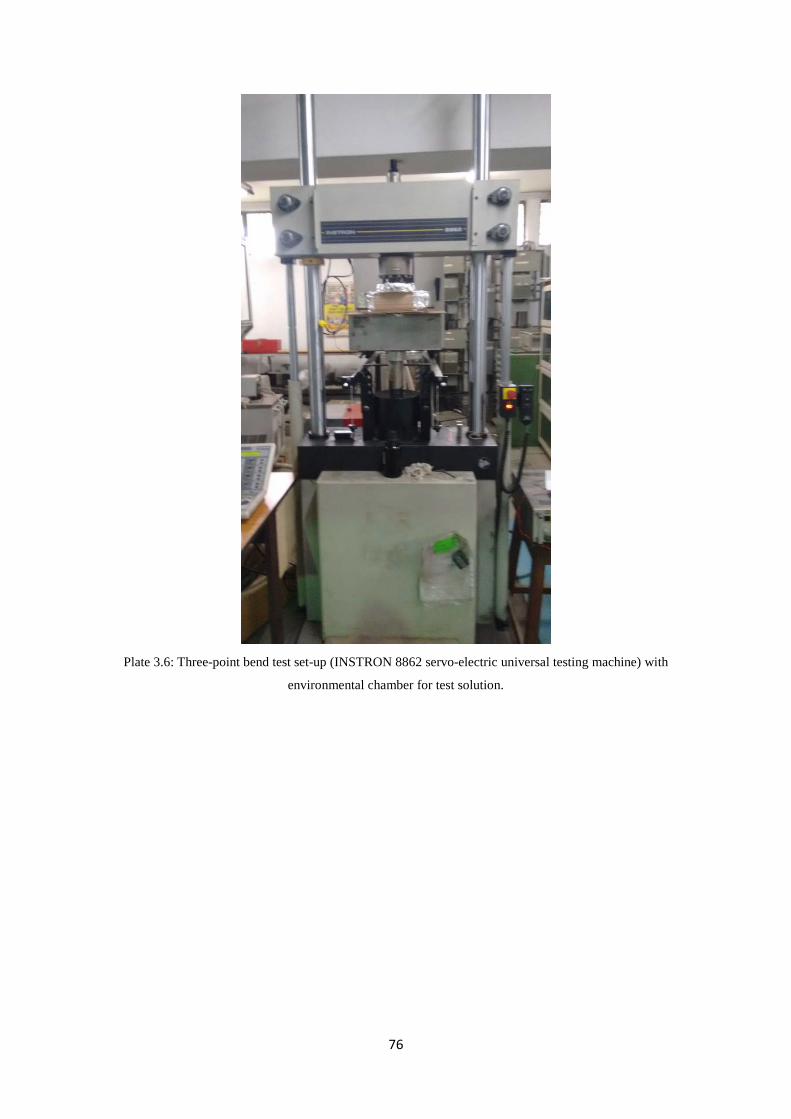
76
Plate 3.6: Three-point bend test set-up (INSTRON 8862 servo-electric universal testing machine) with
environmental chamber for test solution.
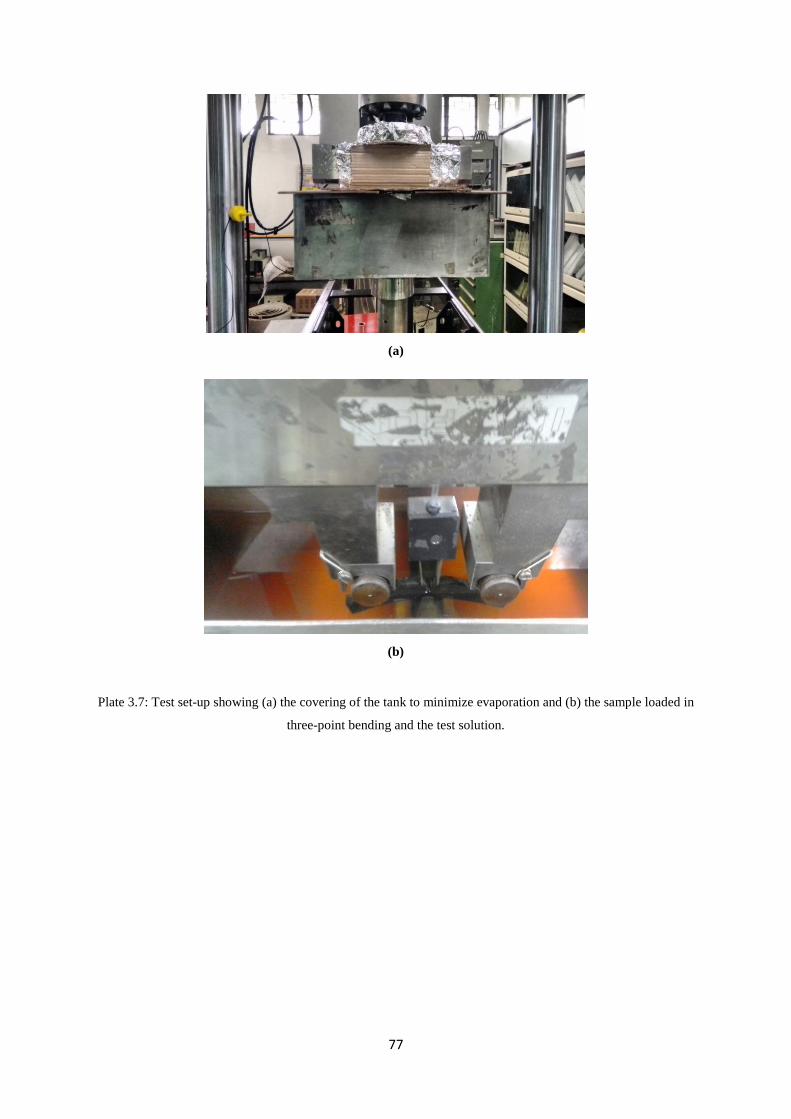
77
(a)
(b)
Plate 3.7: Test set-up showing (a) the covering of the tank to minimize evaporation and (b) the sample loaded in
three-point bending and the test solution.
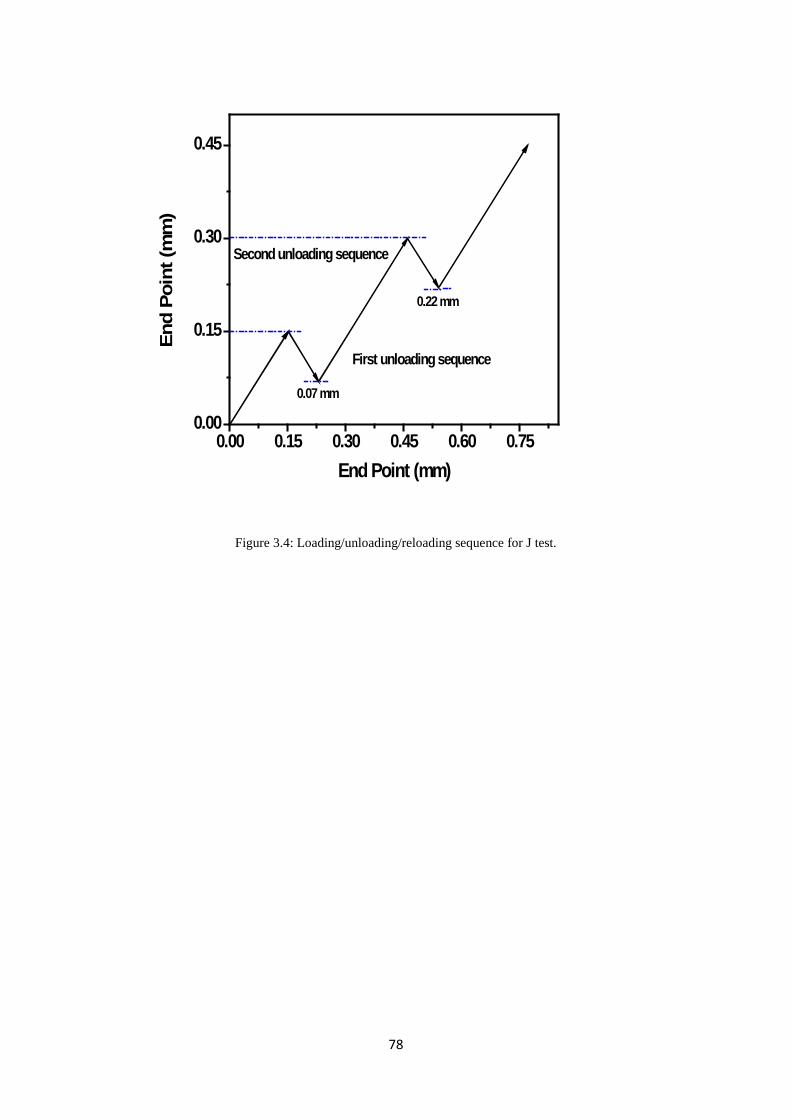
78
Figure 3.4: Loading/unloading/reloading sequence for J test.
0.00 0.15 0.30 0.45 0.60 0.750.00
0.15
0.30
0.45En
d Po
int (
mm
)
End Point (mm)
0.07 mm
0.22 mm
First unloading sequence
Second unloading sequence
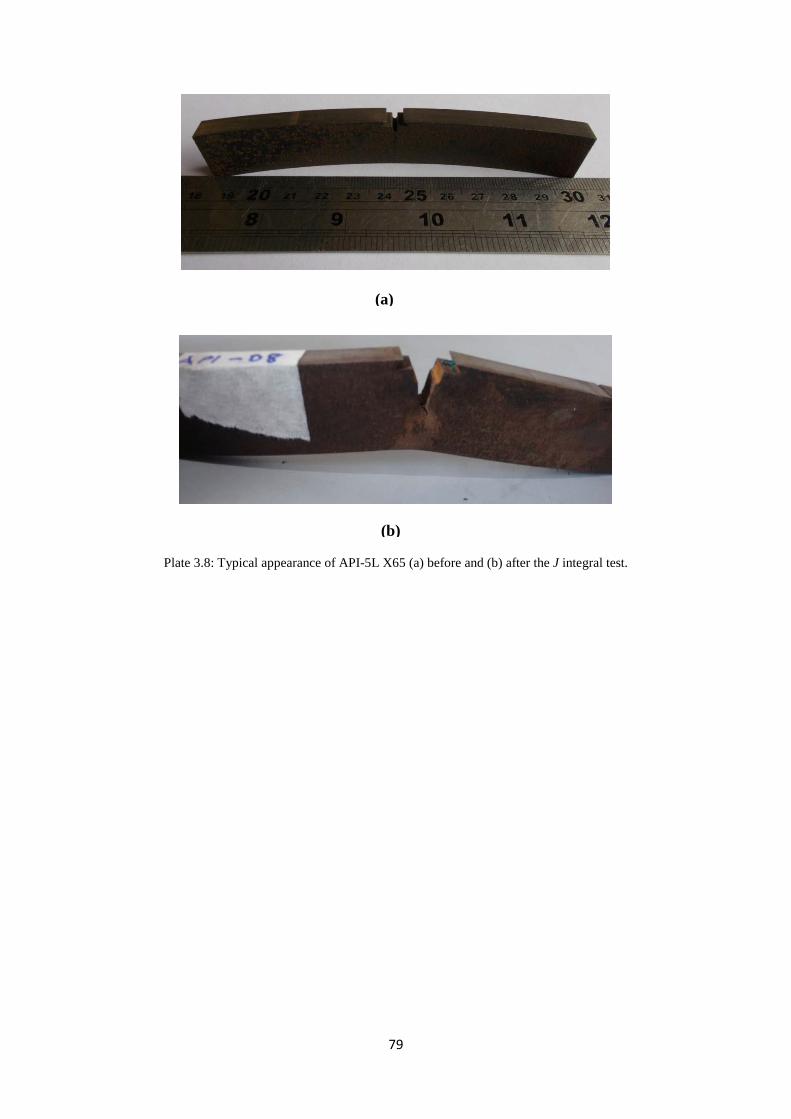
79
Plate 3.8: Typical appearance of API-5L X65 (a) before and (b) after the J integral test.
(a)
(b)
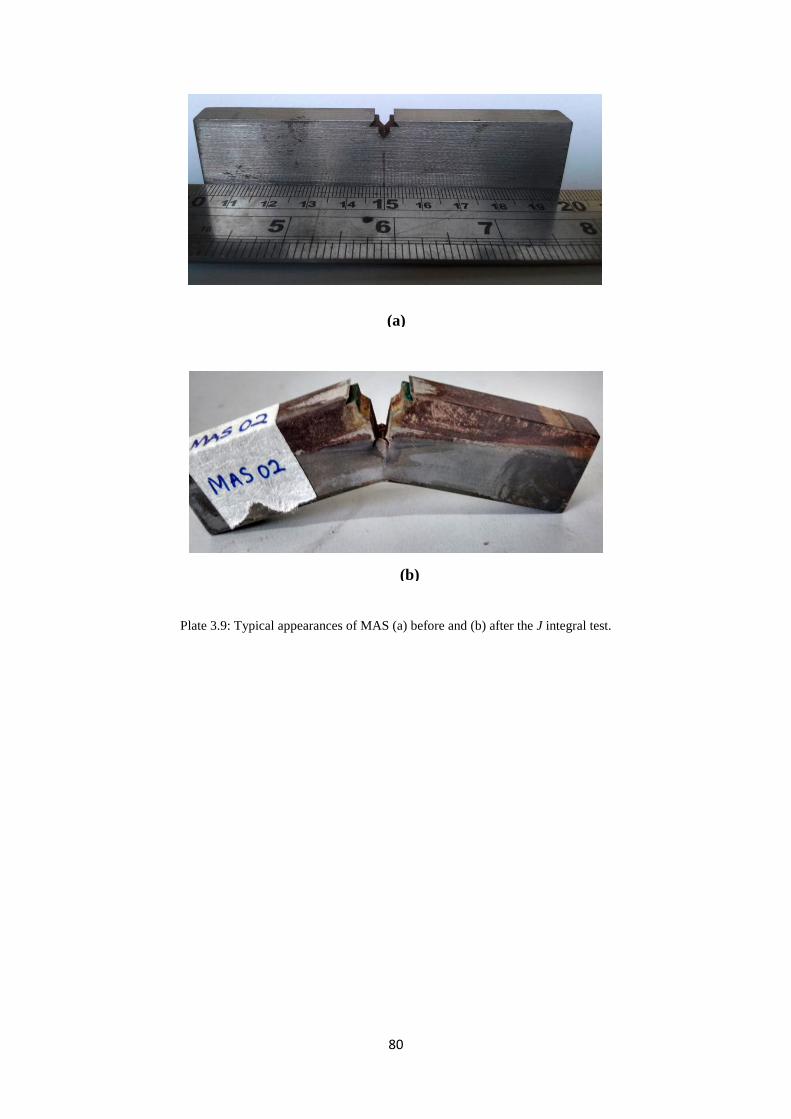
80
Plate 3.9: Typical appearances of MAS (a) before and (b) after the J integral test.
(a)
(b)

81
(a)
(b)
Plate 3.10: Typical fracture surface of (a) API-5L X65 steel and (b) MAS after exposure to fuel ethanol
environment showing the thumbnail shape ahead of the fatigue crack.
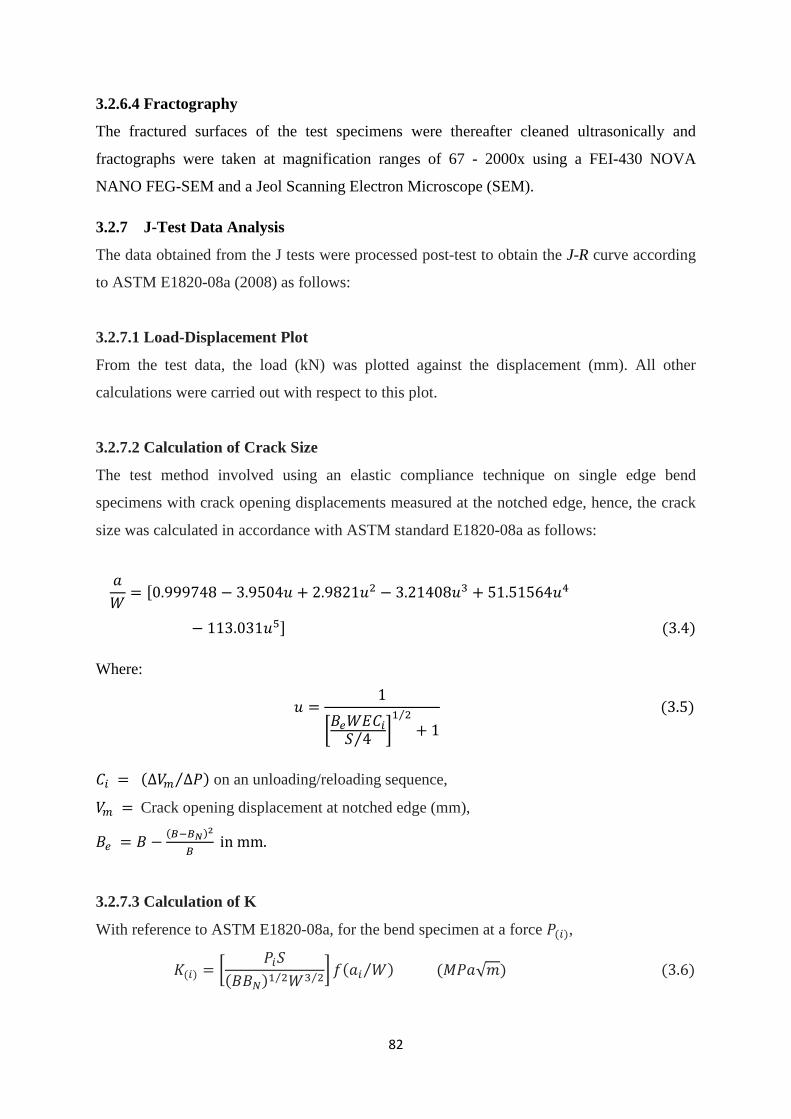
82
3.2.6.4 Fractography
The fractured surfaces of the test specimens were thereafter cleaned ultrasonically and
fractographs were taken at magnification ranges of 67 - 2000x using a FEI-430 NOVA
NANO FEG-SEM and a Jeol Scanning Electron Microscope (SEM).
3.2.7 J-Test Data Analysis
The data obtained from the J tests were processed post-test to obtain the J-R curve according
to ASTM E1820-08a (2008) as follows:
3.2.7.1 Load-Displacement Plot
From the test data, the load (kN) was plotted against the displacement (mm). All other
calculations were carried out with respect to this plot.
3.2.7.2 Calculation of Crack Size
The test method involved using an elastic compliance technique on single edge bend
specimens with crack opening displacements measured at the notched edge, hence, the crack
size was calculated in accordance with ASTM standard E1820-08a as follows:
𝑀𝑀𝑊𝑊
= [0.999748 − 3.9504𝑢𝑢 + 2.9821𝑢𝑢2 − 3.21408𝑢𝑢3 + 51.51564𝑢𝑢4
− 113.031𝑢𝑢5] (3.4)
Where:
𝑢𝑢 =1
�𝐵𝐵𝑒𝑒𝑊𝑊𝑊𝑊𝐶𝐶𝑖𝑖𝑆𝑆 4⁄ �
1 2⁄+ 1
(3.5)
𝐶𝐶𝑖𝑖 = (∆𝑉𝑉𝑚𝑚 ∆𝑀𝑀⁄ ) on an unloading/reloading sequence,
𝑉𝑉𝑚𝑚 = Crack opening displacement at notched edge (mm),
𝐵𝐵𝑒𝑒 = 𝐵𝐵 − (𝐵𝐵−𝐵𝐵𝑁𝑁)2
𝐵𝐵 in mm.
3.2.7.3 Calculation of K
With reference to ASTM E1820-08a, for the bend specimen at a force 𝑀𝑀(𝑖𝑖),
𝐾𝐾(𝑖𝑖) = �𝑀𝑀𝑖𝑖𝑆𝑆
(𝐵𝐵𝐵𝐵𝑁𝑁)1 2⁄ 𝑊𝑊3 2⁄ � 𝑓𝑓(𝑀𝑀𝑖𝑖 𝑊𝑊⁄ ) (𝑀𝑀𝑀𝑀𝑀𝑀√𝑚𝑚) (3.6)
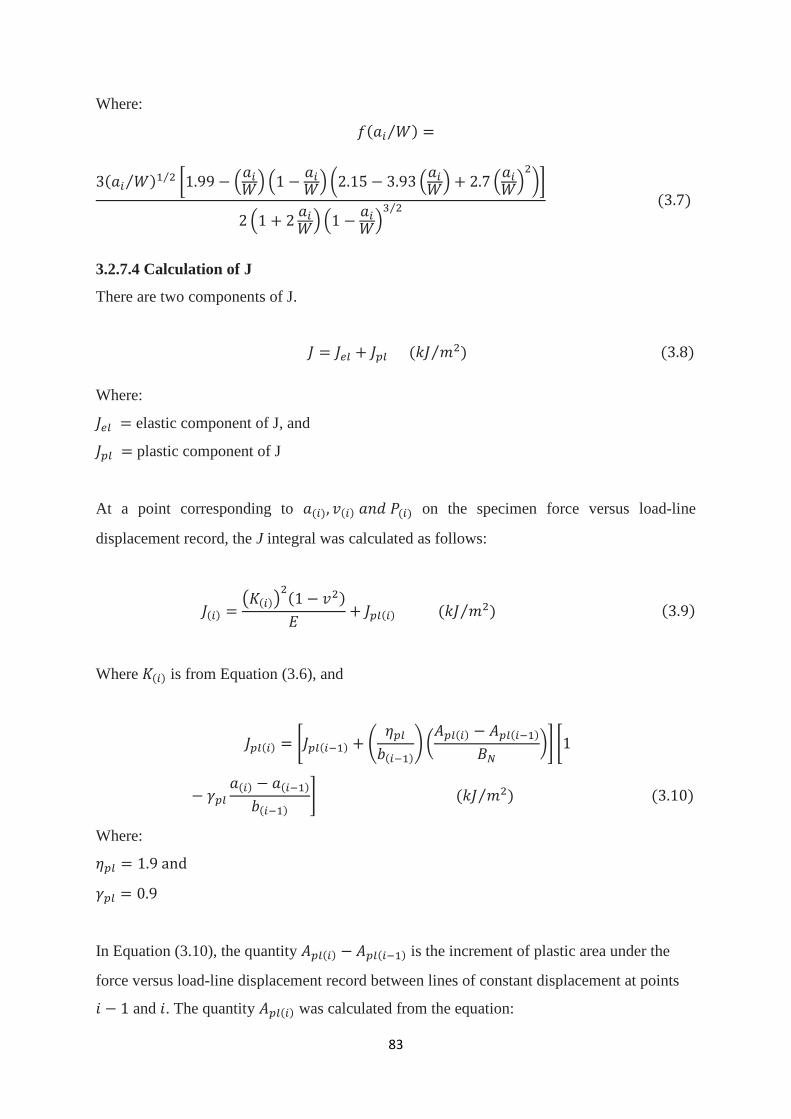
83
Where:
𝑓𝑓(𝑀𝑀𝑖𝑖 𝑊𝑊⁄ ) =
3(𝑀𝑀𝑖𝑖 𝑊𝑊⁄ )1 2⁄ �1.99 − �𝑀𝑀𝑖𝑖𝑊𝑊� �1 − 𝑀𝑀𝑖𝑖𝑊𝑊��2.15 − 3.93 �𝑀𝑀𝑖𝑖𝑊𝑊� + 2.7 �𝑀𝑀𝑖𝑖𝑊𝑊�
2��
2 �1 + 2 𝑀𝑀𝑖𝑖𝑊𝑊��1 − 𝑀𝑀𝑖𝑖𝑊𝑊�
3 2⁄ (3.7)
3.2.7.4 Calculation of J
There are two components of J.
𝐽𝐽 = 𝐽𝐽𝑒𝑒𝑒𝑒 + 𝐽𝐽𝑝𝑝𝑒𝑒 (𝑘𝑘𝐽𝐽 𝑚𝑚2⁄ ) (3.8)
Where:
𝐽𝐽𝑒𝑒𝑒𝑒 = elastic component of J, and
𝐽𝐽𝑝𝑝𝑒𝑒 = plastic component of J
At a point corresponding to 𝑀𝑀(𝑖𝑖), 𝑣𝑣(𝑖𝑖) 𝑀𝑀𝑎𝑎𝑎𝑎 𝑀𝑀(𝑖𝑖) on the specimen force versus load-line
displacement record, the J integral was calculated as follows:
𝐽𝐽(𝑖𝑖) =�𝐾𝐾(𝑖𝑖)�
2(1 − 𝑣𝑣2)𝑊𝑊
+ 𝐽𝐽𝑝𝑝𝑒𝑒(𝑖𝑖) (𝑘𝑘𝐽𝐽 𝑚𝑚2⁄ ) (3.9)
Where 𝐾𝐾(𝑖𝑖) is from Equation (3.6), and
𝐽𝐽𝑝𝑝𝑒𝑒(𝑖𝑖) = �𝐽𝐽𝑝𝑝𝑒𝑒(𝑖𝑖−1) + �𝜂𝜂𝑝𝑝𝑒𝑒𝐵𝐵(𝑖𝑖−1)
� �𝐴𝐴𝑝𝑝𝑒𝑒(𝑖𝑖) − 𝐴𝐴𝑝𝑝𝑒𝑒(𝑖𝑖−1)
𝐵𝐵𝑁𝑁�� �1
− 𝛾𝛾𝑝𝑝𝑒𝑒𝑀𝑀(𝑖𝑖) − 𝑀𝑀(𝑖𝑖−1)
𝐵𝐵(𝑖𝑖−1)� (𝑘𝑘𝐽𝐽 𝑚𝑚2⁄ ) (3.10)
Where:
𝜂𝜂𝑝𝑝𝑒𝑒 = 1.9 and
𝛾𝛾𝑝𝑝𝑒𝑒 = 0.9
In Equation (3.10), the quantity 𝐴𝐴𝑝𝑝𝑒𝑒(𝑖𝑖) − 𝐴𝐴𝑝𝑝𝑒𝑒(𝑖𝑖−1) is the increment of plastic area under the
force versus load-line displacement record between lines of constant displacement at points
𝑖𝑖 − 1 and 𝑖𝑖. The quantity 𝐴𝐴𝑝𝑝𝑒𝑒(𝑖𝑖) was calculated from the equation:
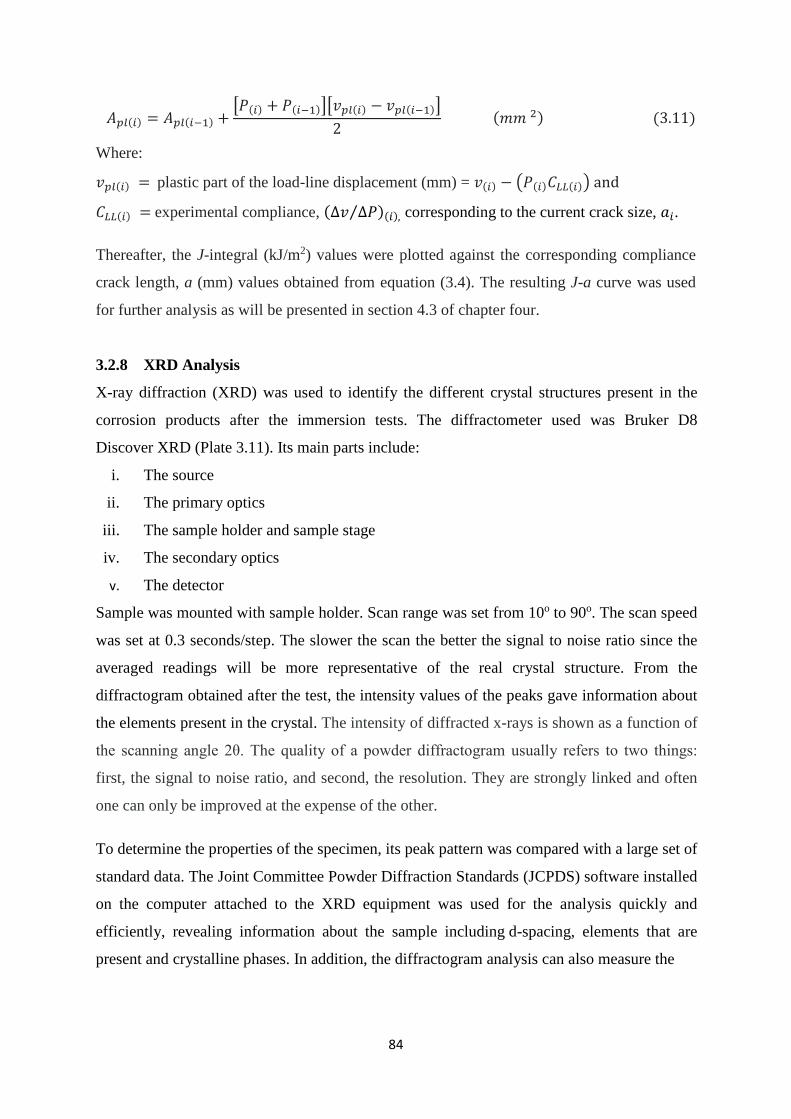
84
𝐴𝐴𝑝𝑝𝑒𝑒(𝑖𝑖) = 𝐴𝐴𝑝𝑝𝑒𝑒(𝑖𝑖−1) +�𝑀𝑀(𝑖𝑖) + 𝑀𝑀(𝑖𝑖−1)��𝑣𝑣𝑝𝑝𝑒𝑒(𝑖𝑖) − 𝑣𝑣𝑝𝑝𝑒𝑒(𝑖𝑖−1)�
2 (𝑚𝑚𝑚𝑚 2) (3.11)
Where:
𝑣𝑣𝑝𝑝𝑒𝑒(𝑖𝑖) = plastic part of the load-line displacement (mm) = 𝑣𝑣(𝑖𝑖) − �𝑀𝑀(𝑖𝑖)𝐶𝐶𝐿𝐿𝐿𝐿(𝑖𝑖)� and
𝐶𝐶𝐿𝐿𝐿𝐿(𝑖𝑖) = experimental compliance, (∆𝑣𝑣 ∆𝑀𝑀⁄ )(𝑖𝑖), corresponding to the current crack size, 𝑀𝑀𝑖𝑖.
Thereafter, the J-integral (kJ/m2) values were plotted against the corresponding compliance
crack length, a (mm) values obtained from equation (3.4). The resulting J-a curve was used
for further analysis as will be presented in section 4.3 of chapter four.
3.2.8 XRD Analysis
X-ray diffraction (XRD) was used to identify the different crystal structures present in the
corrosion products after the immersion tests. The diffractometer used was Bruker D8
Discover XRD (Plate 3.11). Its main parts include:
i. The source
ii. The primary optics
iii. The sample holder and sample stage
iv. The secondary optics
v. The detector
Sample was mounted with sample holder. Scan range was set from 10o to 90o. The scan speed
was set at 0.3 seconds/step. The slower the scan the better the signal to noise ratio since the
averaged readings will be more representative of the real crystal structure. From the
diffractogram obtained after the test, the intensity values of the peaks gave information about
the elements present in the crystal. The intensity of diffracted x-rays is shown as a function of
the scanning angle 2θ. The quality of a powder diffractogram usually refers to two things:
first, the signal to noise ratio, and second, the resolution. They are strongly linked and often
one can only be improved at the expense of the other.
To determine the properties of the specimen, its peak pattern was compared with a large set of
standard data. The Joint Committee Powder Diffraction Standards (JCPDS) software installed
on the computer attached to the XRD equipment was used for the analysis quickly and
efficiently, revealing information about the sample including d-spacing, elements that are
present and crystalline phases. In addition, the diffractogram analysis can also measure the
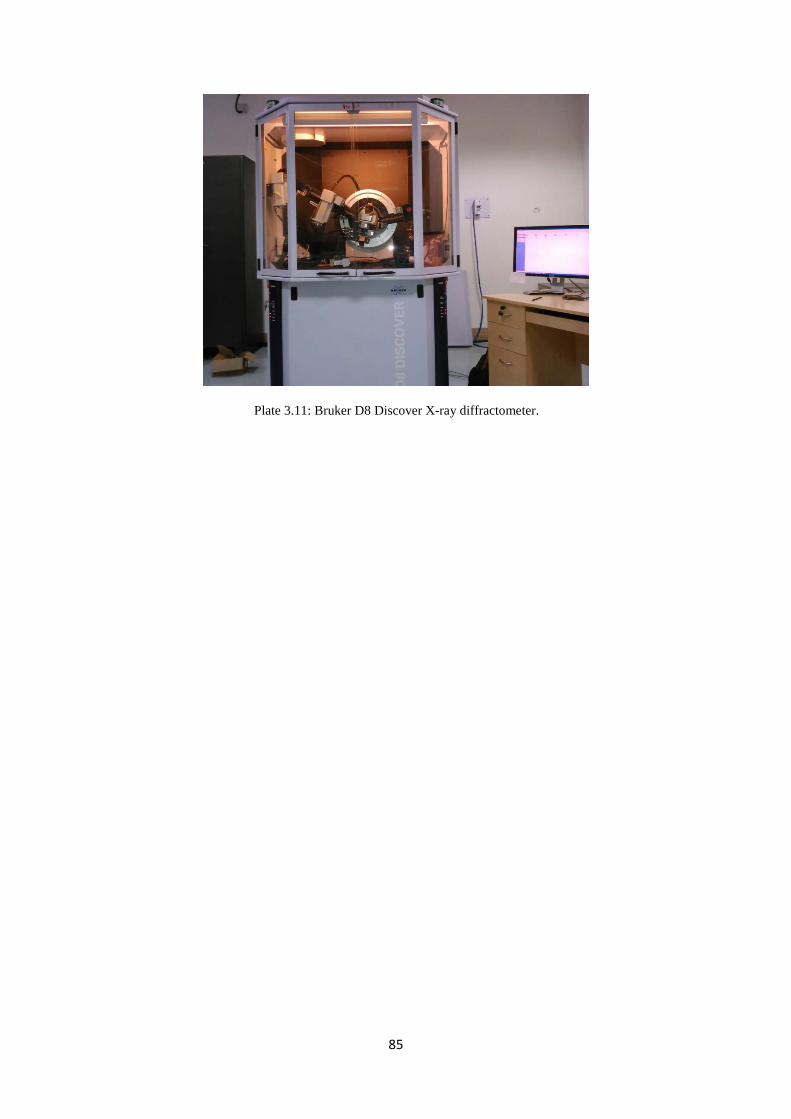
85
Plate 3.11: Bruker D8 Discover X-ray diffractometer.
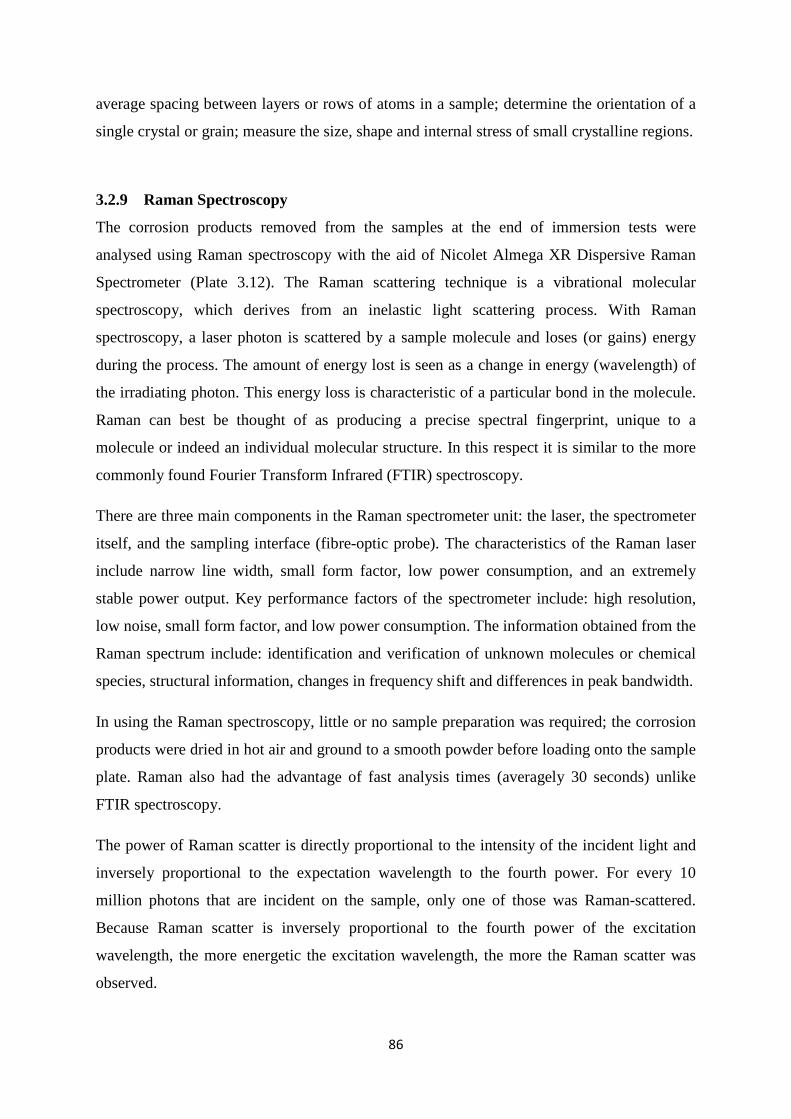
86
average spacing between layers or rows of atoms in a sample; determine the orientation of a
single crystal or grain; measure the size, shape and internal stress of small crystalline regions.
3.2.9 Raman Spectroscopy
The corrosion products removed from the samples at the end of immersion tests were
analysed using Raman spectroscopy with the aid of Nicolet Almega XR Dispersive Raman
Spectrometer (Plate 3.12). The Raman scattering technique is a vibrational molecular
spectroscopy, which derives from an inelastic light scattering process. With Raman
spectroscopy, a laser photon is scattered by a sample molecule and loses (or gains) energy
during the process. The amount of energy lost is seen as a change in energy (wavelength) of
the irradiating photon. This energy loss is characteristic of a particular bond in the molecule.
Raman can best be thought of as producing a precise spectral fingerprint, unique to a
molecule or indeed an individual molecular structure. In this respect it is similar to the more
commonly found Fourier Transform Infrared (FTIR) spectroscopy.
There are three main components in the Raman spectrometer unit: the laser, the spectrometer
itself, and the sampling interface (fibre-optic probe). The characteristics of the Raman laser
include narrow line width, small form factor, low power consumption, and an extremely
stable power output. Key performance factors of the spectrometer include: high resolution,
low noise, small form factor, and low power consumption. The information obtained from the
Raman spectrum include: identification and verification of unknown molecules or chemical
species, structural information, changes in frequency shift and differences in peak bandwidth.
In using the Raman spectroscopy, little or no sample preparation was required; the corrosion
products were dried in hot air and ground to a smooth powder before loading onto the sample
plate. Raman also had the advantage of fast analysis times (averagely 30 seconds) unlike
FTIR spectroscopy.
The power of Raman scatter is directly proportional to the intensity of the incident light and
inversely proportional to the expectation wavelength to the fourth power. For every 10
million photons that are incident on the sample, only one of those was Raman-scattered.
Because Raman scatter is inversely proportional to the fourth power of the excitation
wavelength, the more energetic the excitation wavelength, the more the Raman scatter was
observed.
87
Plate 3.12: Nicolet Almega XR Dispersive Raman Spectrometer (530 nm laser power).
88
CHAPTER FOUR
RESULTS AND DISCUSSION
4.1 Introduction
Presently, bio-fuels are evolving as a significant alternative to tackle the problem of global
warming in the world. E10 (10% bioethanol – 90% gasoline), which is one of the most
prevalent bio-fuel blends is used as a substitute for gasoline. Ethanol is one of the core
constituents of imminent reformulated fuels and suggests unlimited advantages due to its
physical and chemical characteristics, low production costs, raw materials availability and
valuable environmental effects, amongst many others (Baena et al., 2012). Conversely, it
also has some drawbacks as regards material compatibility. Materials that are customarily
compatible with gasoline may be damaged by the presence of ethanol in fuel because its
chemical composition can have a degrading effect on certain autoparts (Kane, Maldonado
and Klein, 2004; Kane et al., 2005; De Souza, Mattos, Sathler and Takenouti, 1987). Ethanol
stress corrosion cracking has turned out to be a widely recognized problem in piping
infrastructure and storage tanks associated with fuel ethanol usage. Ethanol-based corrosion
and stress corrosion cracking have been the subject of numerous recent evaluations (Kane et
al., 2005; Gui et al., 2010; Lou et al., 2010; Sridhar, Price, Buckingham and Dante, 2006;
Beavers, Gui and Sridhar, 2011; Lou and Singh, 2011; Newman, 2008). Since SCC failures
have been reported in end-user terminals and not at the production stage, contaminants may
have been a major cause of failure. The key factors, which influence corrosion susceptibility
in this environment, are water concentration, chlorides, sulphate and acidity (Lou et al.,
2010). This necessitated investigation on the effect of chloride and ethanol concentration on
the corrosion and SCC susceptibility of various materials used in fuel ethanol environments.
This chapter is divided into two parts: Part A and Part B. Part A deals with presentation of
results and discussion on investigations carried out regarding the corrosion susceptibility of
API-5L X65 and micro-alloyed steels in simulated E20, E40 and E80 fuel ethanol
environments. Long-term immersion tests and electrochemical polarization tests were used to
evaluate corrosion rates and polarization behaviour. On the other hand, in Part B,
investigations regarding the susceptibility of API-5L X65 and micro-alloyed steels to SCC in
E20 and E80 environments are presented. Elastic-Plastic fracture mechanics was used for
monotonic J-integral fracture tests.

89
4.2 PART A: Corrosion Behaviour of MAS and API-5L X65 steel in Simulated E20,
E40 and E80 Environments
Corrosion behaviour of API-5L X65 and micro-alloyed steels was determined through long-
term immersion tests and polarization measurements. For each ethanol concentration, the
effect of chloride was investigated via 32 and 64 mg/L NaCl and with respect to a reference
test in the absence of chloride. On the other hand, the effect of ethanol concentration was
examined with respect to a reference test in gasoline. The results are presented in the
following subsections:
4.2.1 Immersion Tests
The results of immersion tests for studying the corrosion behaviour of MAS and API-5L X65
steel in the presence and absence of chloride are presented in this section. The effect of
chloride on the corrosion rate of the two steels is presented and to also investigate the effect
of ethanol concentration, unleaded gasoline, E20, E40 and E80 were used for the study.
4.2.1.1 Effect of Chloride Concentration on Corrosion Rate of MAS
The effects of diverse fuel blends on materials over a period can lead to mass loss. This may
be used to project the life cycle of a material in the fuel blends. The effect of NaCl additions
on the corrosion behaviour of micro-alloyed steel is shown in Figure 4.1. The chloride ions
(Cl-) present in fuel ethanol are assumed to originate probably from the salt used to prepare
meals in the biofuel production process (Baena et al., 2012). MAS, when immersed in E20
without NaCl, reveals a corrosion rate of 8.17E-03 mils per year (mpy). It is evident that
there is increasing corrosion rate of MAS with increasing concentration of NaCl in E20
environment. At 32 mg/L NaCl, corrosion rate increased in E20 to 1.25E-02 mpy and upon
addition of 64 mg/L NaCl to E20, a higher corrosion rate of 1.96E-02 mpy is observed. This
implies that with increasing chloride, the material deteriorates in E20 with respect to the
reference test in the absence of chloride.
On the other hand, in E40 without chloride, corrosion rate is 1.62E-02 mpy. In the presence
of 32 mg/L NaCl, there is initial increase in corrosion rate with respect to the reference test
from 1.62E-02 to 2.21E-02 mpy, but thereafter in 64 mg/L NaCl, corrosion rate dropped to
2.01E-02 mpy. This behaviour is unexpected as chloride products formed are not expected to
improve corrosion behaviour (Brown and Baratta, 1992).
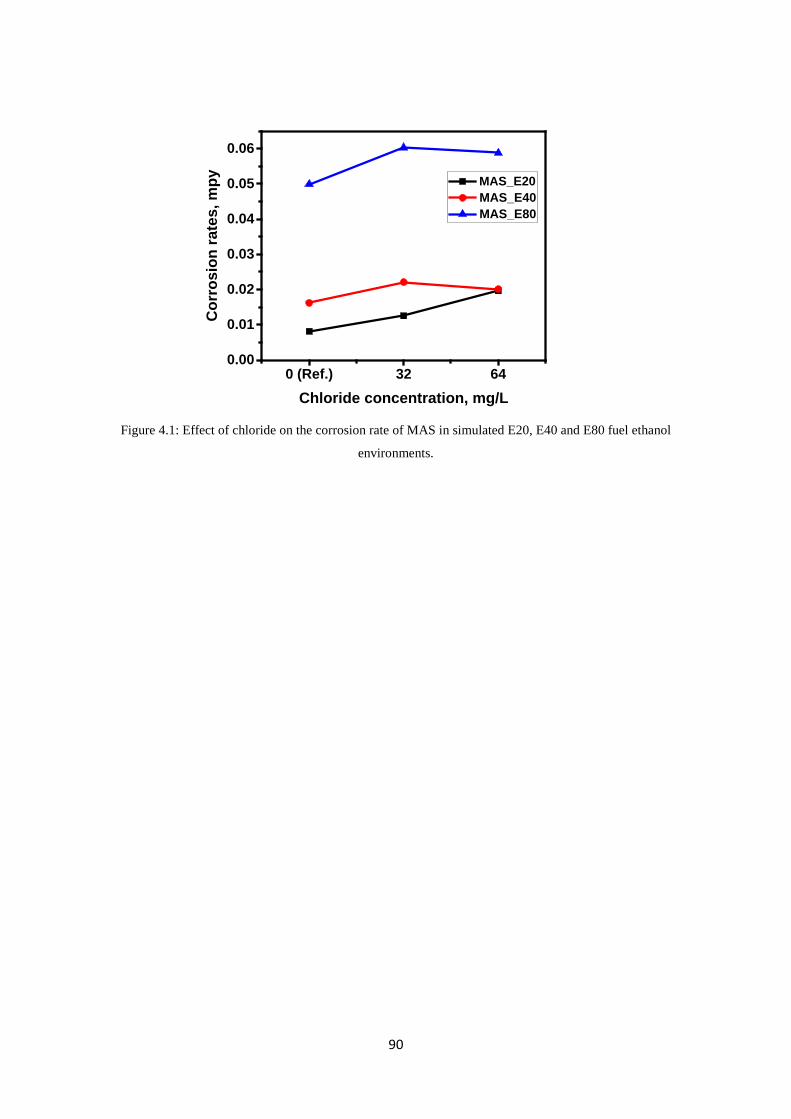
90
0 (Ref.) 32 640.00
0.01
0.02
0.03
0.04
0.05
0.06
Cor
rosi
on ra
tes,
mpy
Chloride concentration, mg/L
MAS_E20 MAS_E40 MAS_E80
Figure 4.1: Effect of chloride on the corrosion rate of MAS in simulated E20, E40 and E80 fuel ethanol
environments.
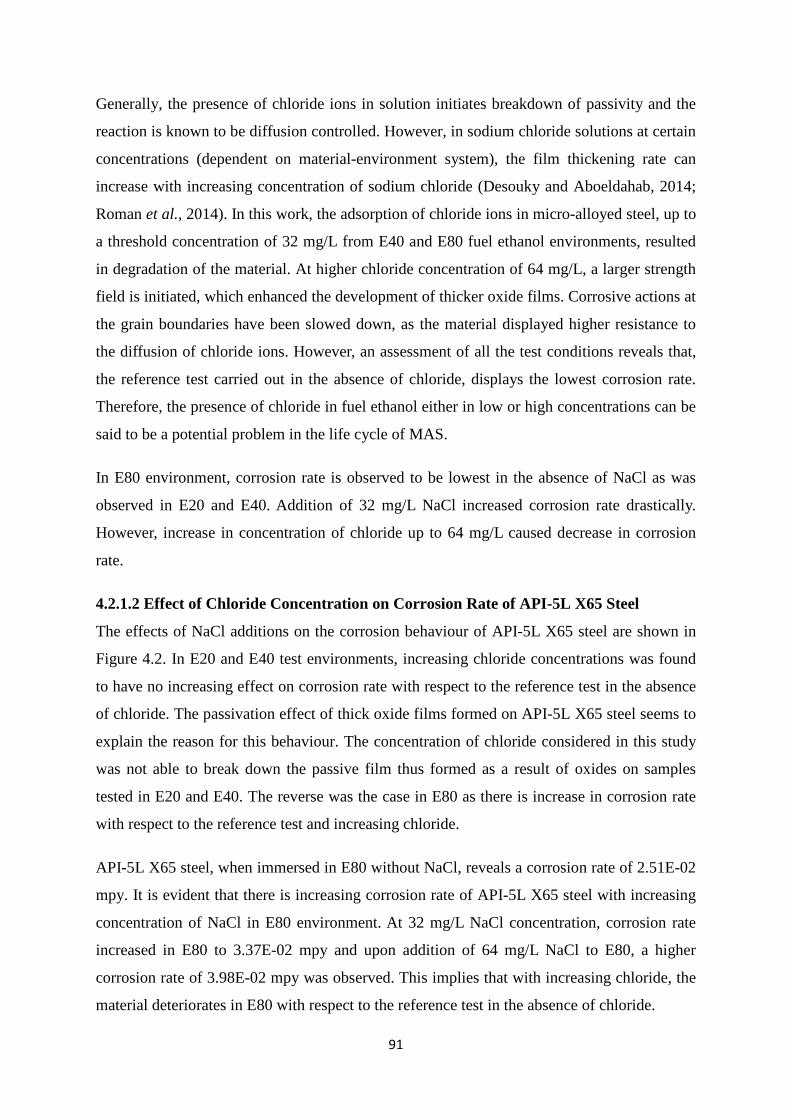
91
Generally, the presence of chloride ions in solution initiates breakdown of passivity and the
reaction is known to be diffusion controlled. However, in sodium chloride solutions at certain
concentrations (dependent on material-environment system), the film thickening rate can
increase with increasing concentration of sodium chloride (Desouky and Aboeldahab, 2014;
Roman et al., 2014). In this work, the adsorption of chloride ions in micro-alloyed steel, up to
a threshold concentration of 32 mg/L from E40 and E80 fuel ethanol environments, resulted
in degradation of the material. At higher chloride concentration of 64 mg/L, a larger strength
field is initiated, which enhanced the development of thicker oxide films. Corrosive actions at
the grain boundaries have been slowed down, as the material displayed higher resistance to
the diffusion of chloride ions. However, an assessment of all the test conditions reveals that,
the reference test carried out in the absence of chloride, displays the lowest corrosion rate.
Therefore, the presence of chloride in fuel ethanol either in low or high concentrations can be
said to be a potential problem in the life cycle of MAS.
In E80 environment, corrosion rate is observed to be lowest in the absence of NaCl as was
observed in E20 and E40. Addition of 32 mg/L NaCl increased corrosion rate drastically.
However, increase in concentration of chloride up to 64 mg/L caused decrease in corrosion
rate.
4.2.1.2 Effect of Chloride Concentration on Corrosion Rate of API-5L X65 Steel
The effects of NaCl additions on the corrosion behaviour of API-5L X65 steel are shown in
Figure 4.2. In E20 and E40 test environments, increasing chloride concentrations was found
to have no increasing effect on corrosion rate with respect to the reference test in the absence
of chloride. The passivation effect of thick oxide films formed on API-5L X65 steel seems to
explain the reason for this behaviour. The concentration of chloride considered in this study
was not able to break down the passive film thus formed as a result of oxides on samples
tested in E20 and E40. The reverse was the case in E80 as there is increase in corrosion rate
with respect to the reference test and increasing chloride.
API-5L X65 steel, when immersed in E80 without NaCl, reveals a corrosion rate of 2.51E-02
mpy. It is evident that there is increasing corrosion rate of API-5L X65 steel with increasing
concentration of NaCl in E80 environment. At 32 mg/L NaCl concentration, corrosion rate
increased in E80 to 3.37E-02 mpy and upon addition of 64 mg/L NaCl to E80, a higher
corrosion rate of 3.98E-02 mpy was observed. This implies that with increasing chloride, the
material deteriorates in E80 with respect to the reference test in the absence of chloride.

92
0 (Ref.) 32 640.010
0.015
0.020
0.025
0.030
0.035
0.040
Cor
rosi
on ra
tes.
mpy
Chloride concentration, mg/L
API-5L X65_E20 API-5L X65_E40 API-5L X65_E80
Figure 4.2: Effect of chloride on the corrosion rate of API-5L X65 in simulated E20, E40 and E80 fuel ethanol
environments.
93
It is interesting to note that similar trend of corrosion behaviour was observed for MAS in
E20 and API-5L X65 steel in E80.
4.2.1.3 Effect of Ethanol Concentration on Corrosion Rate of MAS
The effects of ethanol concentration on the corrosion behaviour of MAS are shown in Figure
4.3. Tests were carried out in unleaded gasoline, E20, E40 and E80. A close look at the
results profile reveals that there is highest corrosion rate in E80. For specimens immersed in
unleaded gasoline, there was no mass loss for the test duration. Since chloride concentration
is varied for each ethanol test condition, it is observed that MAS has least resistance to
corrosion in E80 irrespective of chloride content. The lowest corrosion rate overall of zero
was obtained in unleaded gasoline followed by 8.17E-03 mpy in E20 test condition in the
absence of chloride.
Furthermore, correlating this low corrosion rate in the absence of chloride with the
discussions on the effect of chloride in previous sections, it can be deduced that the presence
of chloride really affects the behaviour of MAS in fuel ethanol environments. E80 also tends
to be very corrosive. When ethanol concentration was increased up to E80, an increase in the
corrosion rate of MAS ensued. In E80, the highest corrosion rate of 6.03E-02 mpy was
obtained.
4.2.1.4 Effect of Ethanol Concentration on Corrosion Rate of API-5L X65
The effects of ethanol concentration on the corrosion behaviour of API-5L X65 steels are
shown in Figure 4.4. It is evident that there is increasing corrosion rate with increasing
ethanol concentration. In unleaded gasoline, there was no mass loss, hence corrosion rate was
zero. The lowest corrosion rate of 1.48E-02 mpy was obtained in E20 at 64 mg/L NaCl and
the highest value of 3.98E-02 mpy in E80 at 64 mg/L NaCl. Regardless of the shorter
exposure period, API-5L X65 steel had a higher corrosion rate (1.48E-02 mpy) than MAS
(8.17E-03 mpy) in E20. Thus, it is likely that MAS may have a higher corrosion resistance in
E20 than API-5L X65 steel if exposed for similar periods probably due to the presence of its
alloying elements. It is interesting to note that the corrosion behaviour of both API-5L X65
and micro-alloyed steels with respect to ethanol concentration are similar irrespective of the
different exposure times.

94
Gasoline (Ref.) E20 E40 E80
0.00
0.01
0.02
0.03
0.04
0.05
0.06
Cor
rosi
on ra
tes,
mpy
Ethanol concentration, %
MAS_0 mg/L NaCl MAS_32 mg/L NaCl MAS_64 mg/L NaCl
Figure 4.3: Effect of ethanol concentration on corrosion rate of MAS in simulated fuel ethanol with 0, 32 and 64
mg/L NaCl.
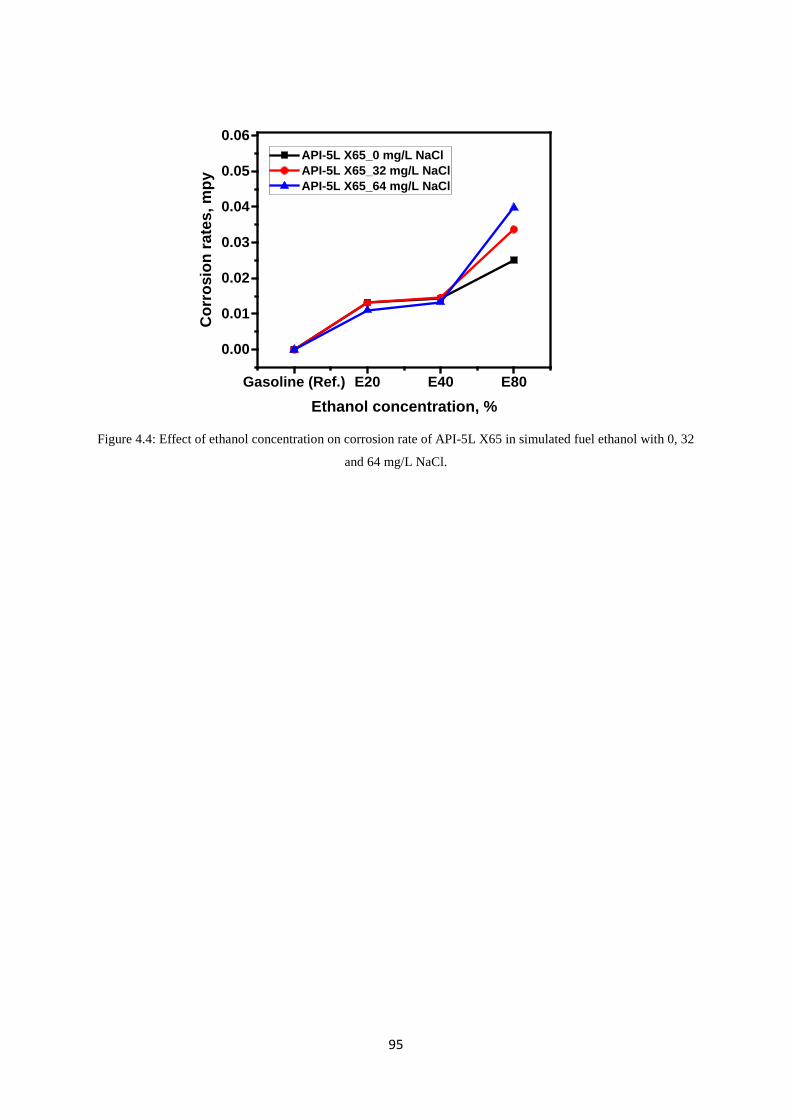
95
Gasoline (Ref.) E20 E40 E80
0.00
0.01
0.02
0.03
0.04
0.05
0.06
Cor
rosi
on ra
tes,
mpy
Ethanol concentration, %
API-5L X65_0 mg/L NaCl API-5L X65_32 mg/L NaCl API-5L X65_64 mg/L NaCl
Figure 4.4: Effect of ethanol concentration on corrosion rate of API-5L X65 in simulated fuel ethanol with 0, 32
and 64 mg/L NaCl.
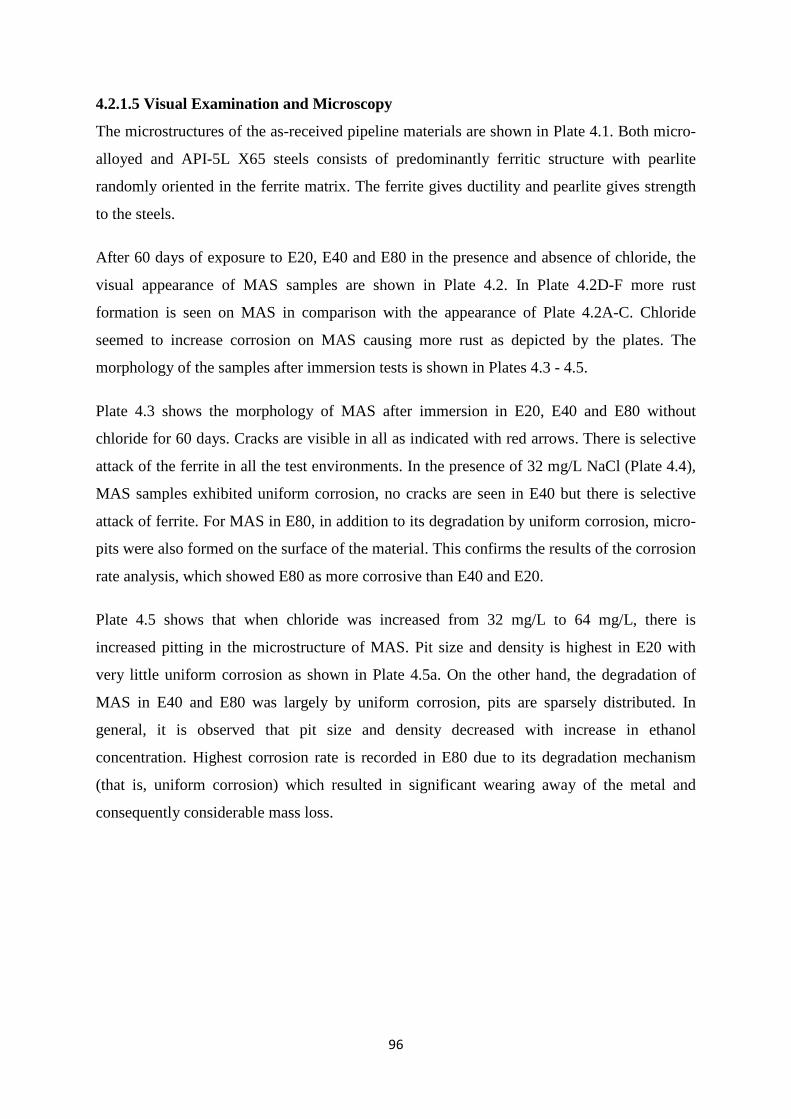
96
4.2.1.5 Visual Examination and Microscopy
The microstructures of the as-received pipeline materials are shown in Plate 4.1. Both micro-
alloyed and API-5L X65 steels consists of predominantly ferritic structure with pearlite
randomly oriented in the ferrite matrix. The ferrite gives ductility and pearlite gives strength
to the steels.
After 60 days of exposure to E20, E40 and E80 in the presence and absence of chloride, the
visual appearance of MAS samples are shown in Plate 4.2. In Plate 4.2D-F more rust
formation is seen on MAS in comparison with the appearance of Plate 4.2A-C. Chloride
seemed to increase corrosion on MAS causing more rust as depicted by the plates. The
morphology of the samples after immersion tests is shown in Plates 4.3 - 4.5.
Plate 4.3 shows the morphology of MAS after immersion in E20, E40 and E80 without
chloride for 60 days. Cracks are visible in all as indicated with red arrows. There is selective
attack of the ferrite in all the test environments. In the presence of 32 mg/L NaCl (Plate 4.4),
MAS samples exhibited uniform corrosion, no cracks are seen in E40 but there is selective
attack of ferrite. For MAS in E80, in addition to its degradation by uniform corrosion, micro-
pits were also formed on the surface of the material. This confirms the results of the corrosion
rate analysis, which showed E80 as more corrosive than E40 and E20.
Plate 4.5 shows that when chloride was increased from 32 mg/L to 64 mg/L, there is
increased pitting in the microstructure of MAS. Pit size and density is highest in E20 with
very little uniform corrosion as shown in Plate 4.5a. On the other hand, the degradation of
MAS in E40 and E80 was largely by uniform corrosion, pits are sparsely distributed. In
general, it is observed that pit size and density decreased with increase in ethanol
concentration. Highest corrosion rate is recorded in E80 due to its degradation mechanism
(that is, uniform corrosion) which resulted in significant wearing away of the metal and
consequently considerable mass loss.

97
(a)
(b) Plate 4.1: SEM images showing the microstructures of a) MAS and b) API-5L X65 steel at 2000x in as-received
condition. Dark areas represent ferrite phase while pearlite is represented by the white areas.
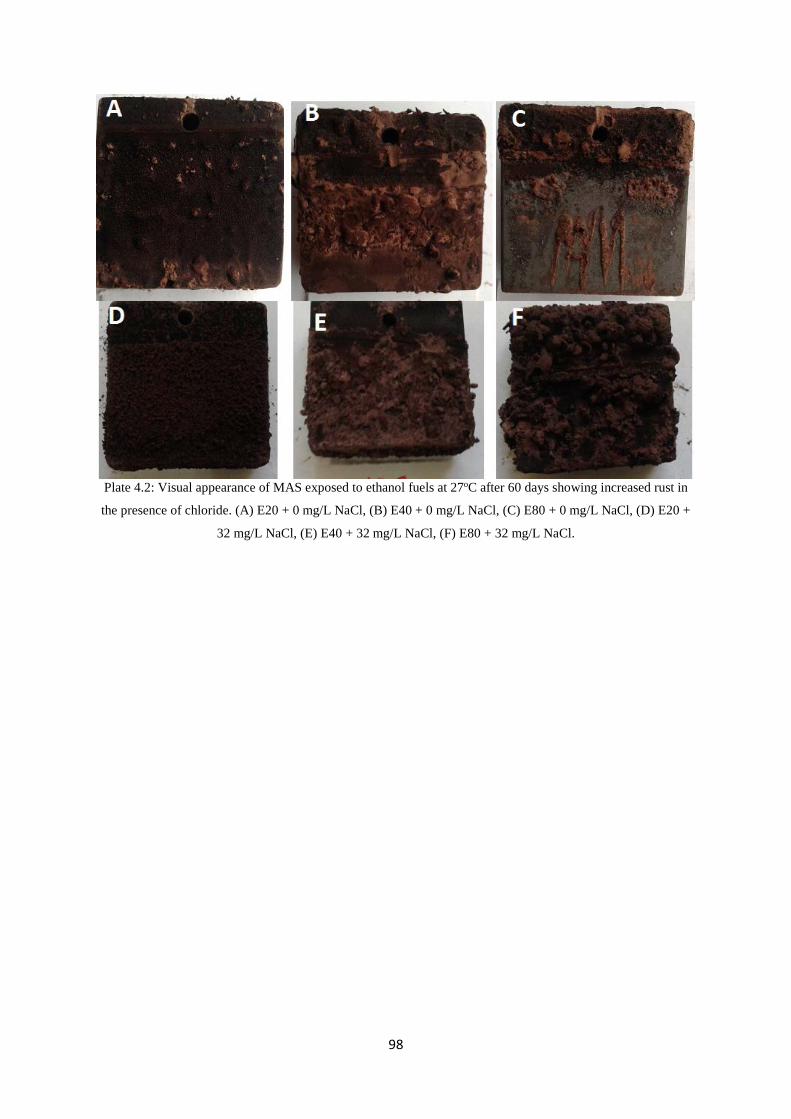
98
Plate 4.2: Visual appearance of MAS exposed to ethanol fuels at 27oC after 60 days showing increased rust in
the presence of chloride. (A) E20 + 0 mg/L NaCl, (B) E40 + 0 mg/L NaCl, (C) E80 + 0 mg/L NaCl, (D) E20 +
32 mg/L NaCl, (E) E40 + 32 mg/L NaCl, (F) E80 + 32 mg/L NaCl.

99
(a)
(b)
(c)
Plate 4.3: Post-corrosion SEM images of MAS at 1000x after 60 days immersion in a) E20, b) E40 and
c) E80 in the absence of NaCl (red arrows are indicative of crack locations in MAS).
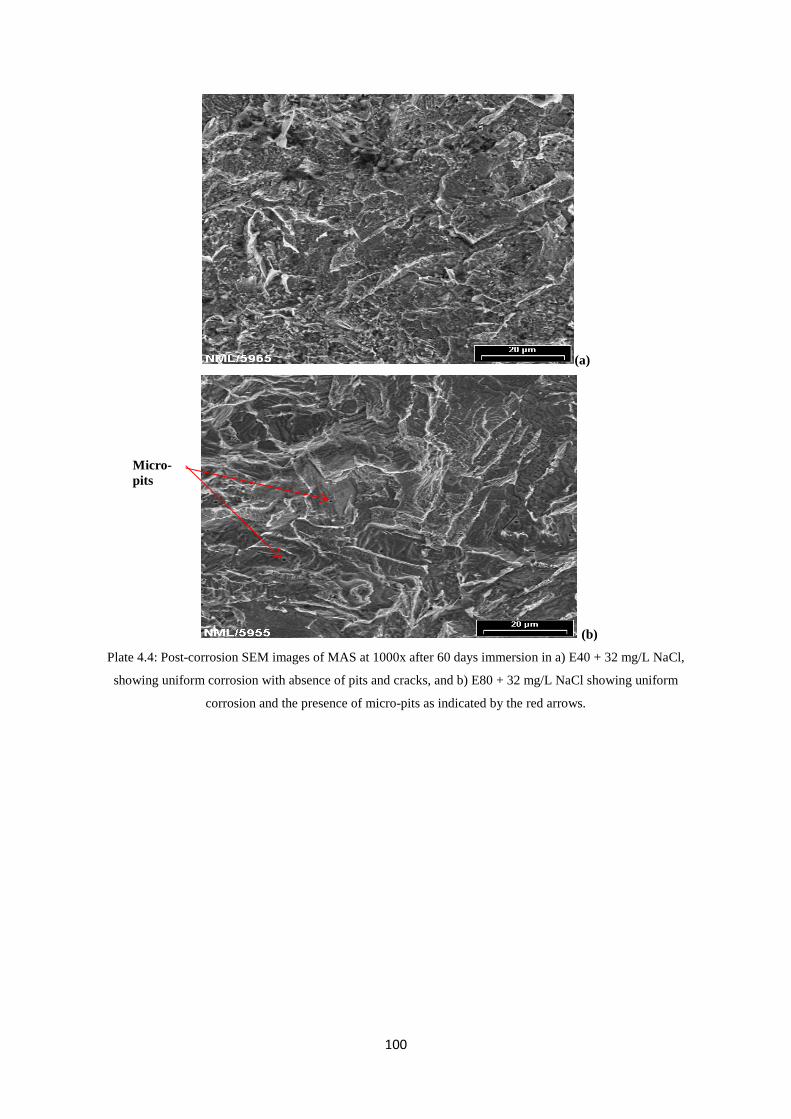
100
(a)
(b) Plate 4.4: Post-corrosion SEM images of MAS at 1000x after 60 days immersion in a) E40 + 32 mg/L NaCl,
showing uniform corrosion with absence of pits and cracks, and b) E80 + 32 mg/L NaCl showing uniform
corrosion and the presence of micro-pits as indicated by the red arrows.
Micro-pits
101
(a)
(b)
(c) Plate 4.5: Post-corrosion SEM images of MAS at 1000x after 60 days immersion in a) E20, b) E40 and C) E80
with additions of 64 mg/L NaCl showing decrease in pit size and density with increase in ethanol concentration
(red arrows are indicative of pit locations in MAS).
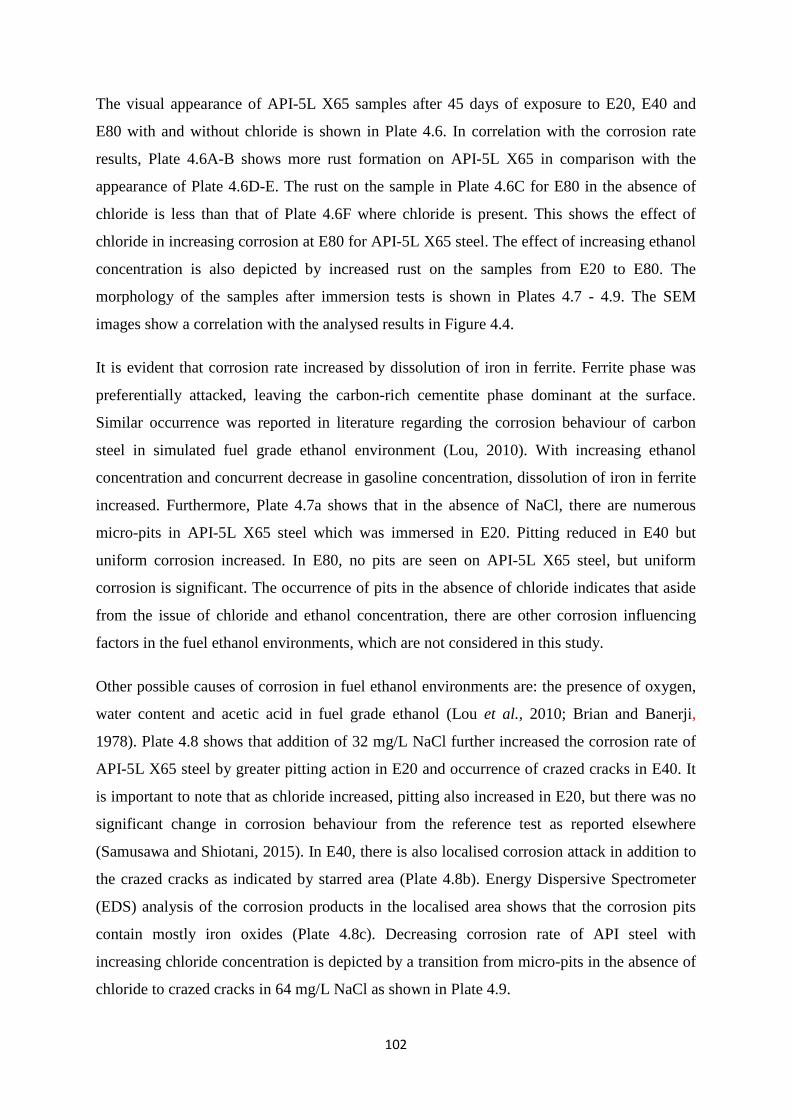
102
The visual appearance of API-5L X65 samples after 45 days of exposure to E20, E40 and
E80 with and without chloride is shown in Plate 4.6. In correlation with the corrosion rate
results, Plate 4.6A-B shows more rust formation on API-5L X65 in comparison with the
appearance of Plate 4.6D-E. The rust on the sample in Plate 4.6C for E80 in the absence of
chloride is less than that of Plate 4.6F where chloride is present. This shows the effect of
chloride in increasing corrosion at E80 for API-5L X65 steel. The effect of increasing ethanol
concentration is also depicted by increased rust on the samples from E20 to E80. The
morphology of the samples after immersion tests is shown in Plates 4.7 - 4.9. The SEM
images show a correlation with the analysed results in Figure 4.4.
It is evident that corrosion rate increased by dissolution of iron in ferrite. Ferrite phase was
preferentially attacked, leaving the carbon-rich cementite phase dominant at the surface.
Similar occurrence was reported in literature regarding the corrosion behaviour of carbon
steel in simulated fuel grade ethanol environment (Lou, 2010). With increasing ethanol
concentration and concurrent decrease in gasoline concentration, dissolution of iron in ferrite
increased. Furthermore, Plate 4.7a shows that in the absence of NaCl, there are numerous
micro-pits in API-5L X65 steel which was immersed in E20. Pitting reduced in E40 but
uniform corrosion increased. In E80, no pits are seen on API-5L X65 steel, but uniform
corrosion is significant. The occurrence of pits in the absence of chloride indicates that aside
from the issue of chloride and ethanol concentration, there are other corrosion influencing
factors in the fuel ethanol environments, which are not considered in this study.
Other possible causes of corrosion in fuel ethanol environments are: the presence of oxygen,
water content and acetic acid in fuel grade ethanol (Lou et al., 2010; Brian and Banerji,
1978). Plate 4.8 shows that addition of 32 mg/L NaCl further increased the corrosion rate of
API-5L X65 steel by greater pitting action in E20 and occurrence of crazed cracks in E40. It
is important to note that as chloride increased, pitting also increased in E20, but there was no
significant change in corrosion behaviour from the reference test as reported elsewhere
(Samusawa and Shiotani, 2015). In E40, there is also localised corrosion attack in addition to
the crazed cracks as indicated by starred area (Plate 4.8b). Energy Dispersive Spectrometer
(EDS) analysis of the corrosion products in the localised area shows that the corrosion pits
contain mostly iron oxides (Plate 4.8c). Decreasing corrosion rate of API steel with
increasing chloride concentration is depicted by a transition from micro-pits in the absence of
chloride to crazed cracks in 64 mg/L NaCl as shown in Plate 4.9.
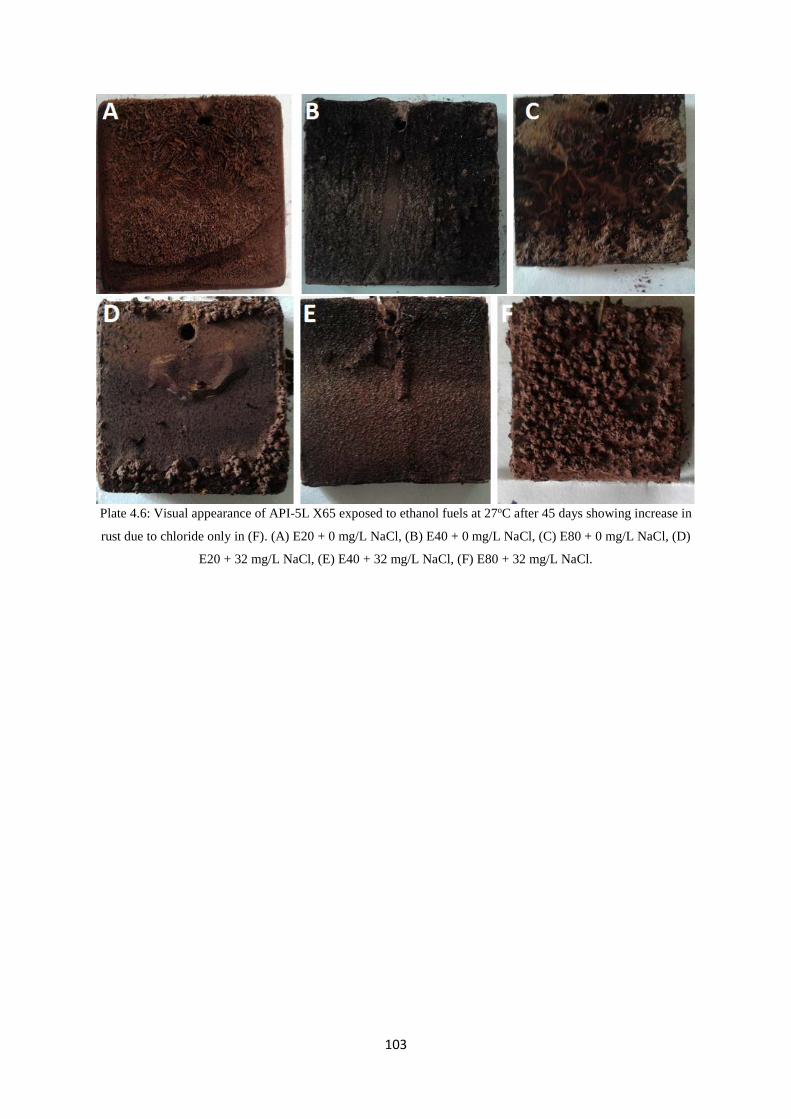
103
Plate 4.6: Visual appearance of API-5L X65 exposed to ethanol fuels at 27oC after 45 days showing increase in
rust due to chloride only in (F). (A) E20 + 0 mg/L NaCl, (B) E40 + 0 mg/L NaCl, (C) E80 + 0 mg/L NaCl, (D)
E20 + 32 mg/L NaCl, (E) E40 + 32 mg/L NaCl, (F) E80 + 32 mg/L NaCl.

104
(a)
(b)
(c) Plate 4.7: Post-corrosion SEM images of API-5L X65 at 1000x after 45 days immersion in a) E20, b) E40 and c)
E80 without NaCl. Red arrows indicate pits and micro-pits while green arrow indicates cracks.
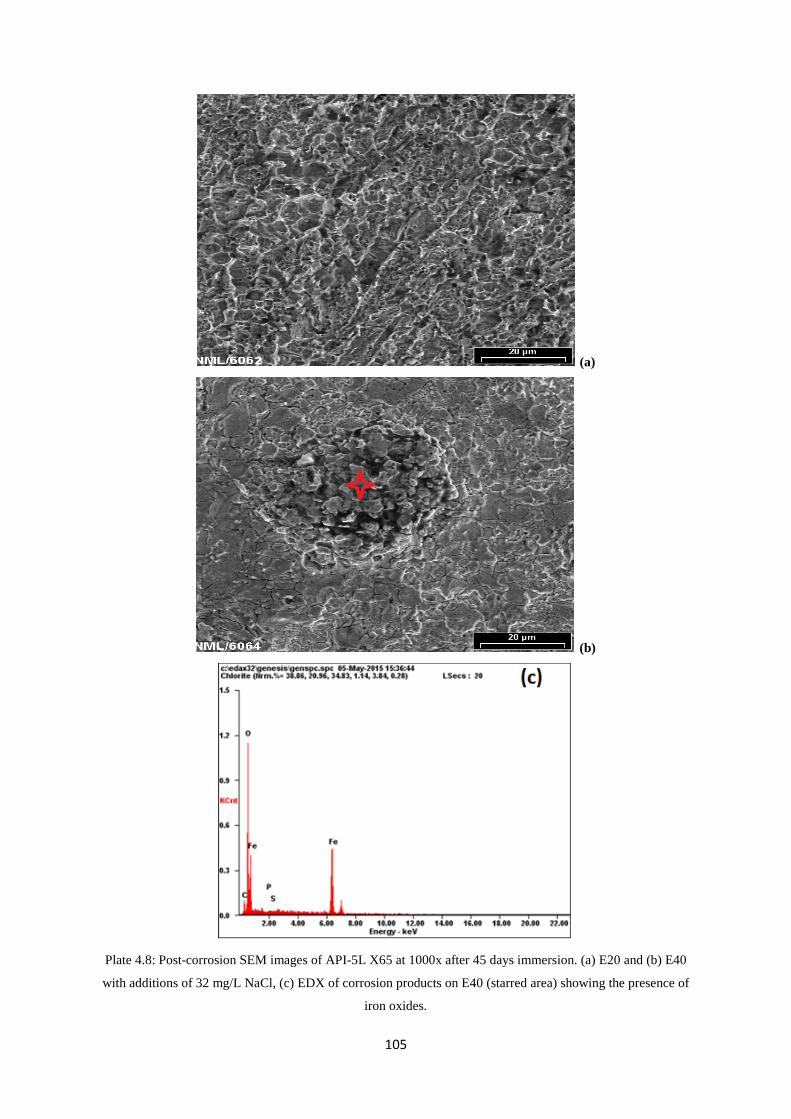
105
(a)
(b)
Plate 4.8: Post-corrosion SEM images of API-5L X65 at 1000x after 45 days immersion. (a) E20 and (b) E40
with additions of 32 mg/L NaCl, (c) EDX of corrosion products on E40 (starred area) showing the presence of
iron oxides.
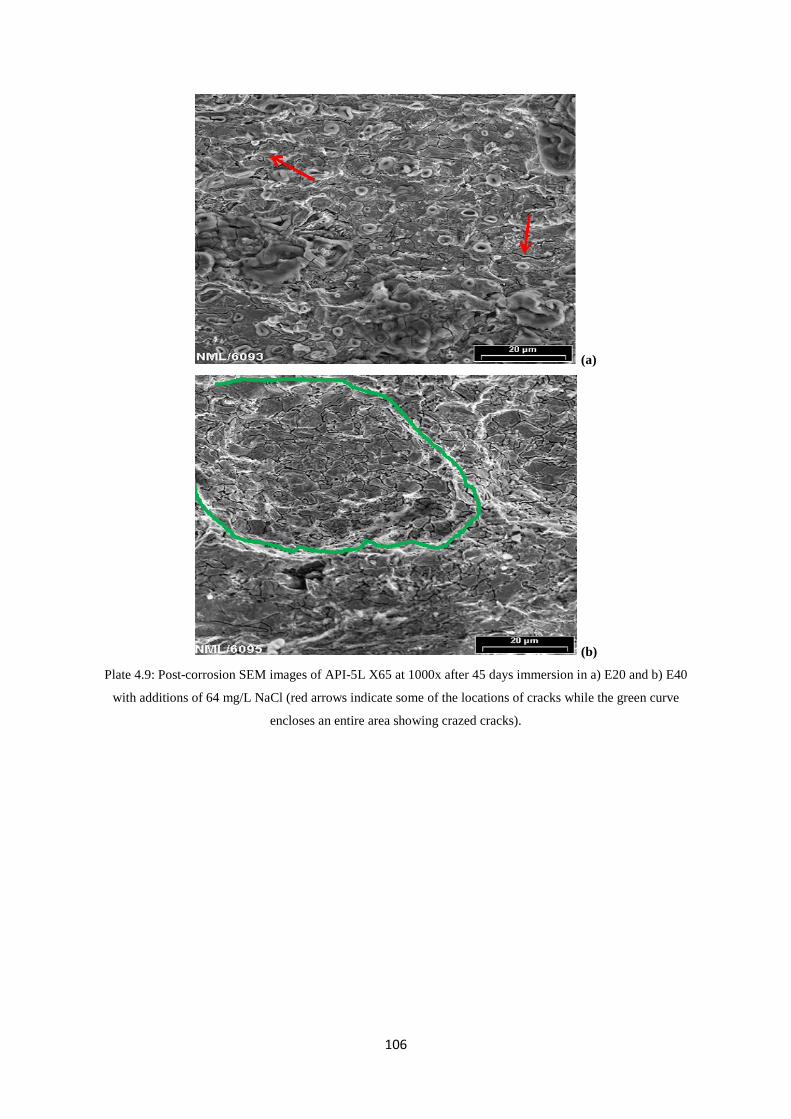
106
(a)
(b)
Plate 4.9: Post-corrosion SEM images of API-5L X65 at 1000x after 45 days immersion in a) E20 and b) E40
with additions of 64 mg/L NaCl (red arrows indicate some of the locations of cracks while the green curve
encloses an entire area showing crazed cracks).
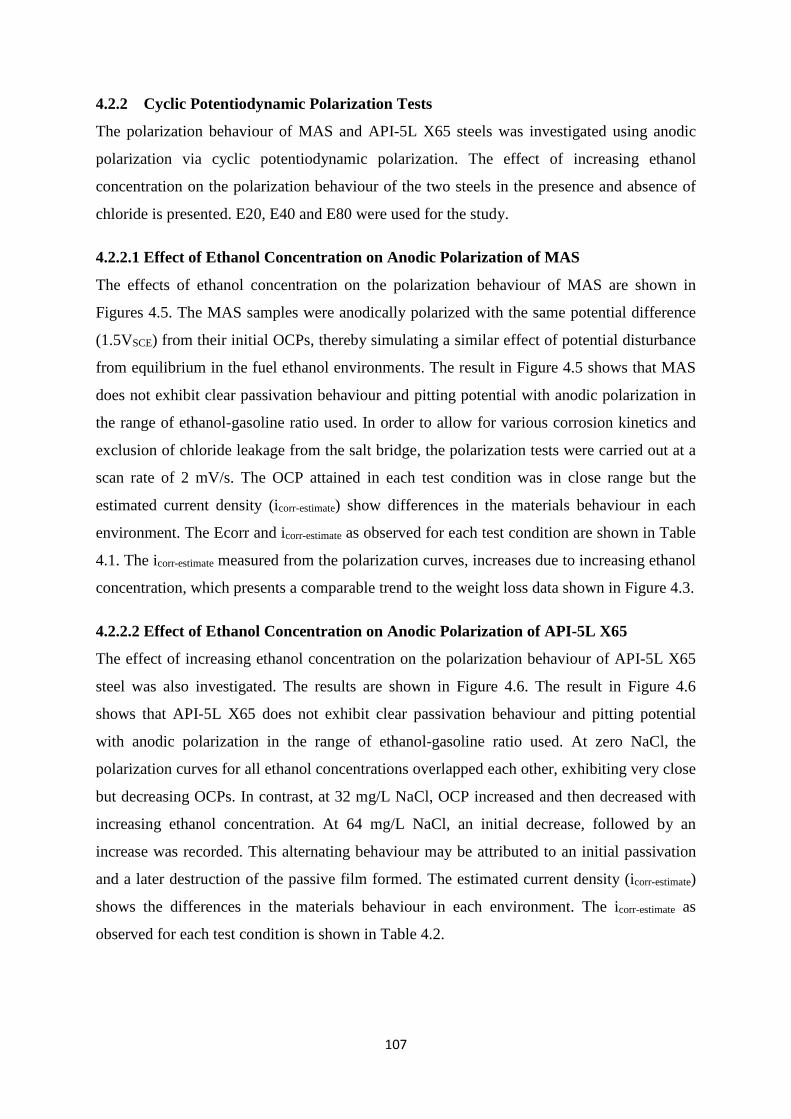
107
4.2.2 Cyclic Potentiodynamic Polarization Tests
The polarization behaviour of MAS and API-5L X65 steels was investigated using anodic
polarization via cyclic potentiodynamic polarization. The effect of increasing ethanol
concentration on the polarization behaviour of the two steels in the presence and absence of
chloride is presented. E20, E40 and E80 were used for the study.
4.2.2.1 Effect of Ethanol Concentration on Anodic Polarization of MAS
The effects of ethanol concentration on the polarization behaviour of MAS are shown in
Figures 4.5. The MAS samples were anodically polarized with the same potential difference
(1.5VSCE) from their initial OCPs, thereby simulating a similar effect of potential disturbance
from equilibrium in the fuel ethanol environments. The result in Figure 4.5 shows that MAS
does not exhibit clear passivation behaviour and pitting potential with anodic polarization in
the range of ethanol-gasoline ratio used. In order to allow for various corrosion kinetics and
exclusion of chloride leakage from the salt bridge, the polarization tests were carried out at a
scan rate of 2 mV/s. The OCP attained in each test condition was in close range but the
estimated current density (icorr-estimate) show differences in the materials behaviour in each
environment. The Ecorr and icorr-estimate as observed for each test condition are shown in Table
4.1. The icorr-estimate measured from the polarization curves, increases due to increasing ethanol
concentration, which presents a comparable trend to the weight loss data shown in Figure 4.3.
4.2.2.2 Effect of Ethanol Concentration on Anodic Polarization of API-5L X65 The effect of increasing ethanol concentration on the polarization behaviour of API-5L X65
steel was also investigated. The results are shown in Figure 4.6. The result in Figure 4.6
shows that API-5L X65 does not exhibit clear passivation behaviour and pitting potential
with anodic polarization in the range of ethanol-gasoline ratio used. At zero NaCl, the
polarization curves for all ethanol concentrations overlapped each other, exhibiting very close
but decreasing OCPs. In contrast, at 32 mg/L NaCl, OCP increased and then decreased with
increasing ethanol concentration. At 64 mg/L NaCl, an initial decrease, followed by an
increase was recorded. This alternating behaviour may be attributed to an initial passivation
and a later destruction of the passive film formed. The estimated current density (icorr-estimate)
shows the differences in the materials behaviour in each environment. The icorr-estimate as
observed for each test condition is shown in Table 4.2.
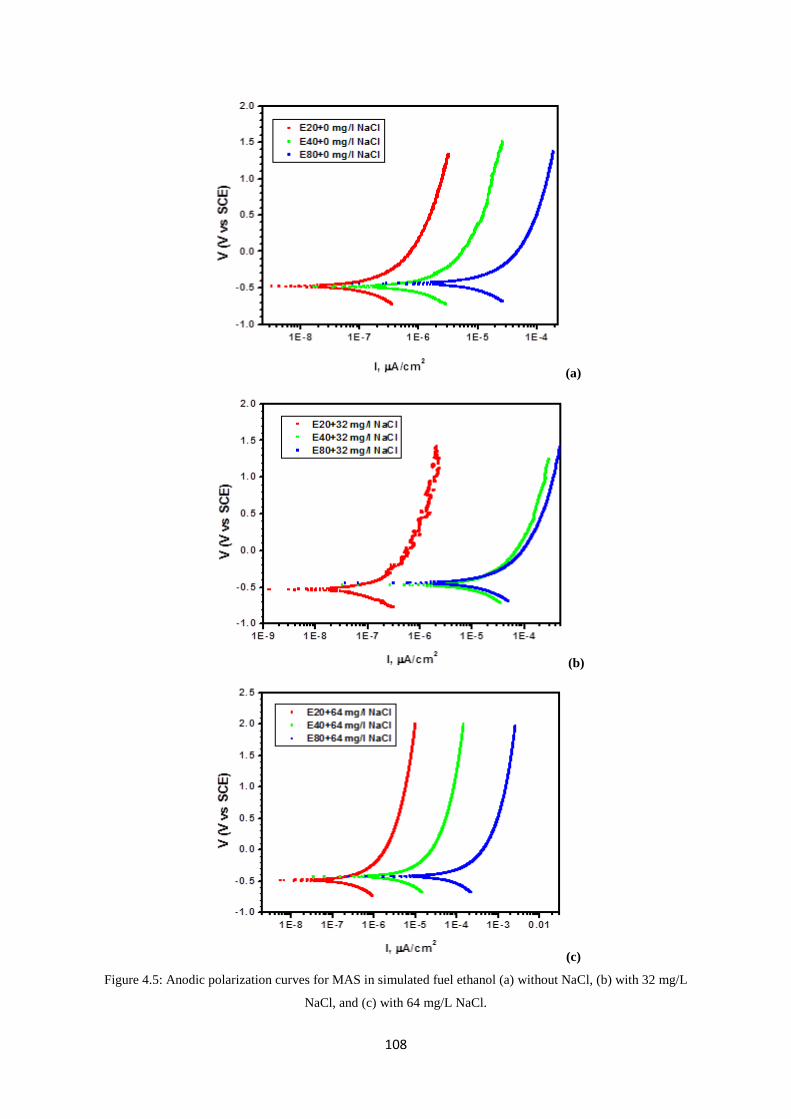
108
(a)
(b)
(c) Figure 4.5: Anodic polarization curves for MAS in simulated fuel ethanol (a) without NaCl, (b) with 32 mg/L
NaCl, and (c) with 64 mg/L NaCl.
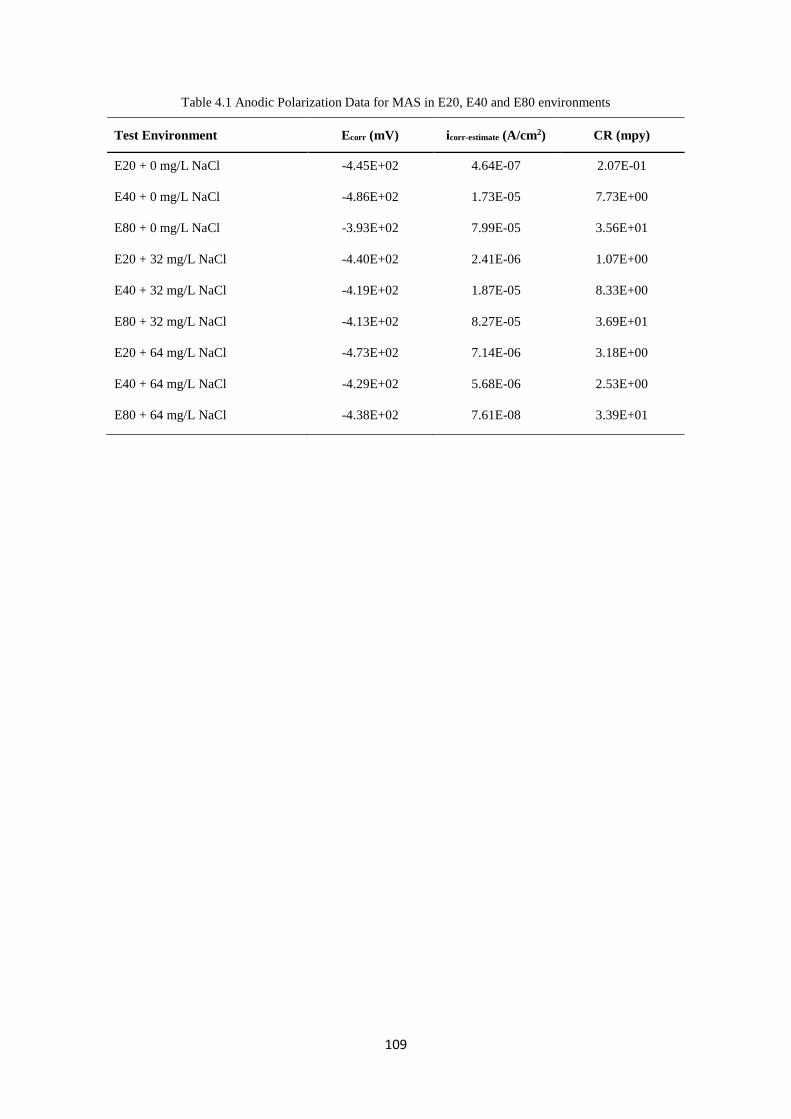
109
Table 4.1 Anodic Polarization Data for MAS in E20, E40 and E80 environments
Test Environment Ecorr (mV) icorr-estimate (A/cm2) CR (mpy)
E20 + 0 mg/L NaCl -4.45E+02 4.64E-07 2.07E-01
E40 + 0 mg/L NaCl -4.86E+02 1.73E-05 7.73E+00
E80 + 0 mg/L NaCl -3.93E+02 7.99E-05 3.56E+01
E20 + 32 mg/L NaCl -4.40E+02 2.41E-06 1.07E+00
E40 + 32 mg/L NaCl -4.19E+02 1.87E-05 8.33E+00
E80 + 32 mg/L NaCl -4.13E+02 8.27E-05 3.69E+01
E20 + 64 mg/L NaCl -4.73E+02 7.14E-06 3.18E+00
E40 + 64 mg/L NaCl -4.29E+02 5.68E-06 2.53E+00
E80 + 64 mg/L NaCl -4.38E+02 7.61E-08 3.39E+01
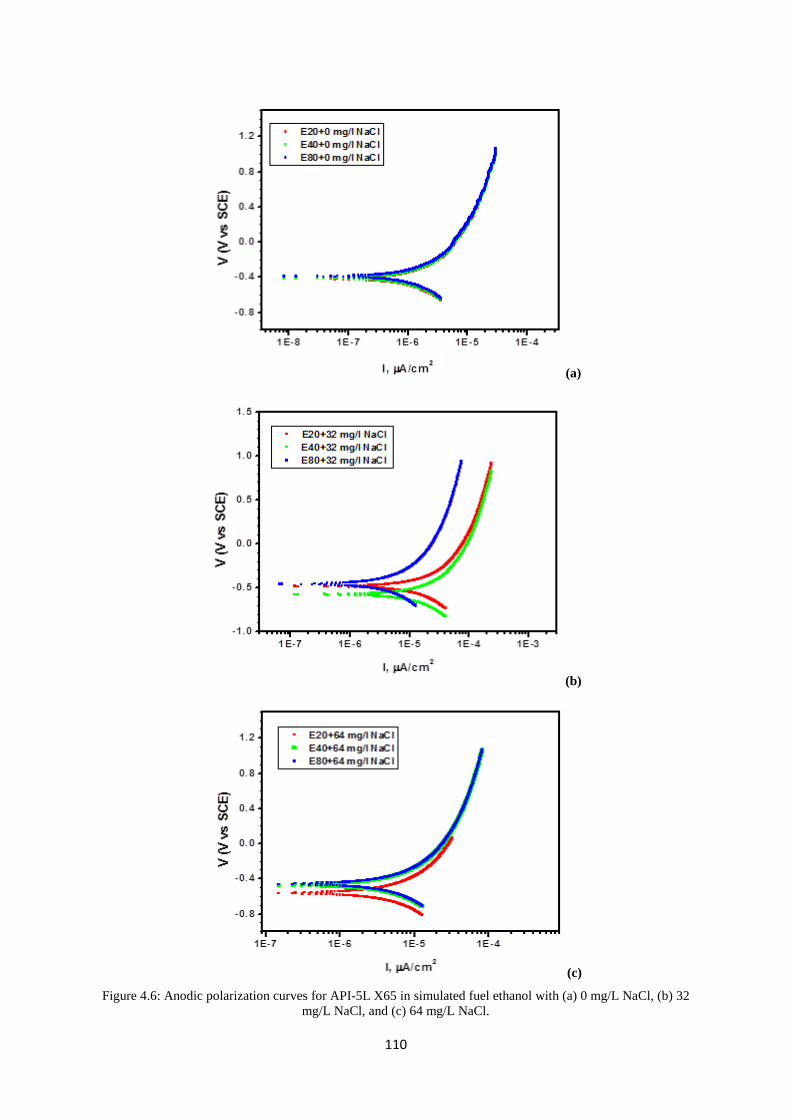
110
(a)
(b)
(c)
Figure 4.6: Anodic polarization curves for API-5L X65 in simulated fuel ethanol with (a) 0 mg/L NaCl, (b) 32 mg/L NaCl, and (c) 64 mg/L NaCl.

111
Table 4.2: Anodic Polarization Data for API-5L X65 in E20, E40 and E80 environments
Test Environment Ecorr (mV) icorr-estimate (A/cm2) CR (mpy)
E20 + 0 mg/L NaCl -414 5.80E-07 2.58E-01
E40 + 0 mg/L NaCl -413 1.75E-06 7.74E-01
E80 + 0 mg/L NaCl -393 7.99E-05 3.56E+01
E20 + 32 mg/L NaCl -492 2.18E-06 9.70E-01
E40 + 32 mg/L NaCl -581 6.36E-06 2.84E+00
E80 + 32 mg/L NaCl -454 7.06E-05 3.15E+01
E20 + 64 mg/L NaCl -620 2.41E-08 1.08E-02
E40 + 64 mg/L NaCl -470 8.47E-06 3.92E+00
E80 + 64 mg/L NaCl -473 7.39E-05 3.42E+01
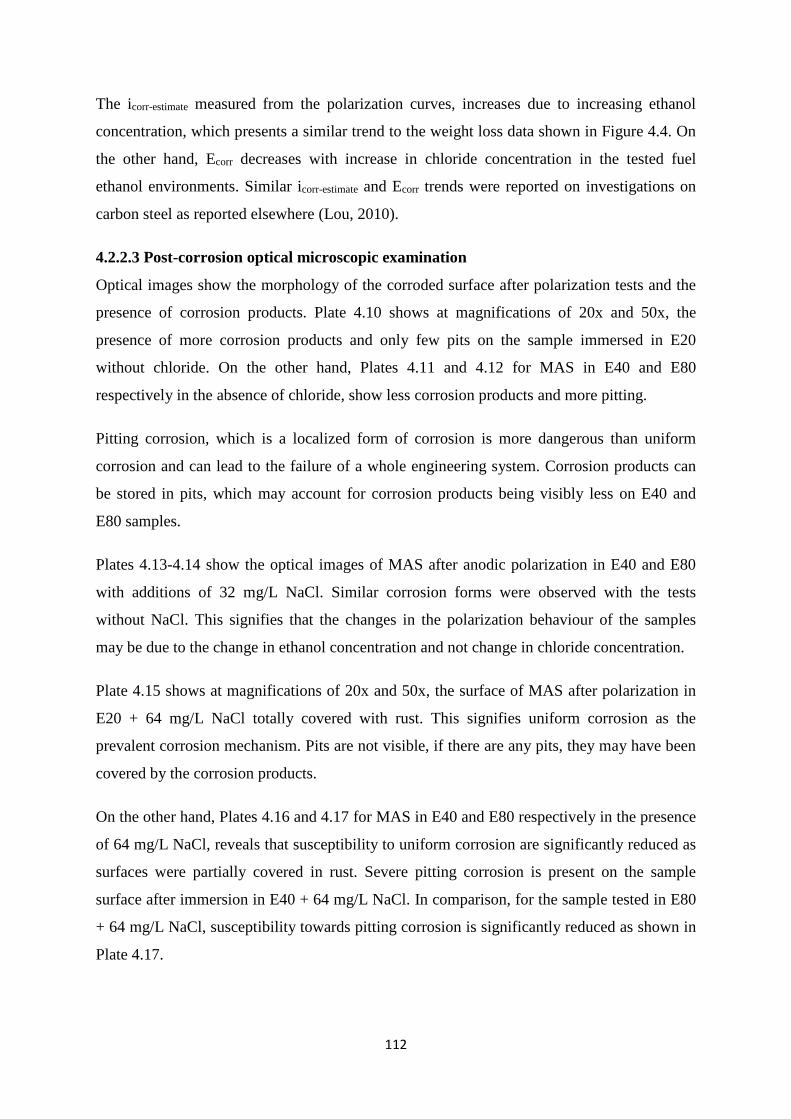
112
The icorr-estimate measured from the polarization curves, increases due to increasing ethanol
concentration, which presents a similar trend to the weight loss data shown in Figure 4.4. On
the other hand, Ecorr decreases with increase in chloride concentration in the tested fuel
ethanol environments. Similar icorr-estimate and Ecorr trends were reported on investigations on
carbon steel as reported elsewhere (Lou, 2010).
4.2.2.3 Post-corrosion optical microscopic examination Optical images show the morphology of the corroded surface after polarization tests and the
presence of corrosion products. Plate 4.10 shows at magnifications of 20x and 50x, the
presence of more corrosion products and only few pits on the sample immersed in E20
without chloride. On the other hand, Plates 4.11 and 4.12 for MAS in E40 and E80
respectively in the absence of chloride, show less corrosion products and more pitting.
Pitting corrosion, which is a localized form of corrosion is more dangerous than uniform
corrosion and can lead to the failure of a whole engineering system. Corrosion products can
be stored in pits, which may account for corrosion products being visibly less on E40 and
E80 samples.
Plates 4.13-4.14 show the optical images of MAS after anodic polarization in E40 and E80
with additions of 32 mg/L NaCl. Similar corrosion forms were observed with the tests
without NaCl. This signifies that the changes in the polarization behaviour of the samples
may be due to the change in ethanol concentration and not change in chloride concentration.
Plate 4.15 shows at magnifications of 20x and 50x, the surface of MAS after polarization in
E20 + 64 mg/L NaCl totally covered with rust. This signifies uniform corrosion as the
prevalent corrosion mechanism. Pits are not visible, if there are any pits, they may have been
covered by the corrosion products.
On the other hand, Plates 4.16 and 4.17 for MAS in E40 and E80 respectively in the presence
of 64 mg/L NaCl, reveals that susceptibility to uniform corrosion are significantly reduced as
surfaces were partially covered in rust. Severe pitting corrosion is present on the sample
surface after immersion in E40 + 64 mg/L NaCl. In comparison, for the sample tested in E80
+ 64 mg/L NaCl, susceptibility towards pitting corrosion is significantly reduced as shown in
Plate 4.17.

113
(a)
(b)
Plate 4.10: Optical image showing corrosion of MAS at magnifications of a) 20x and b) 50x after anodic
polarization in E20 + 0 mg/L NaCl showing sparse pitting and significant corrosion products.
Pit Corrosion products
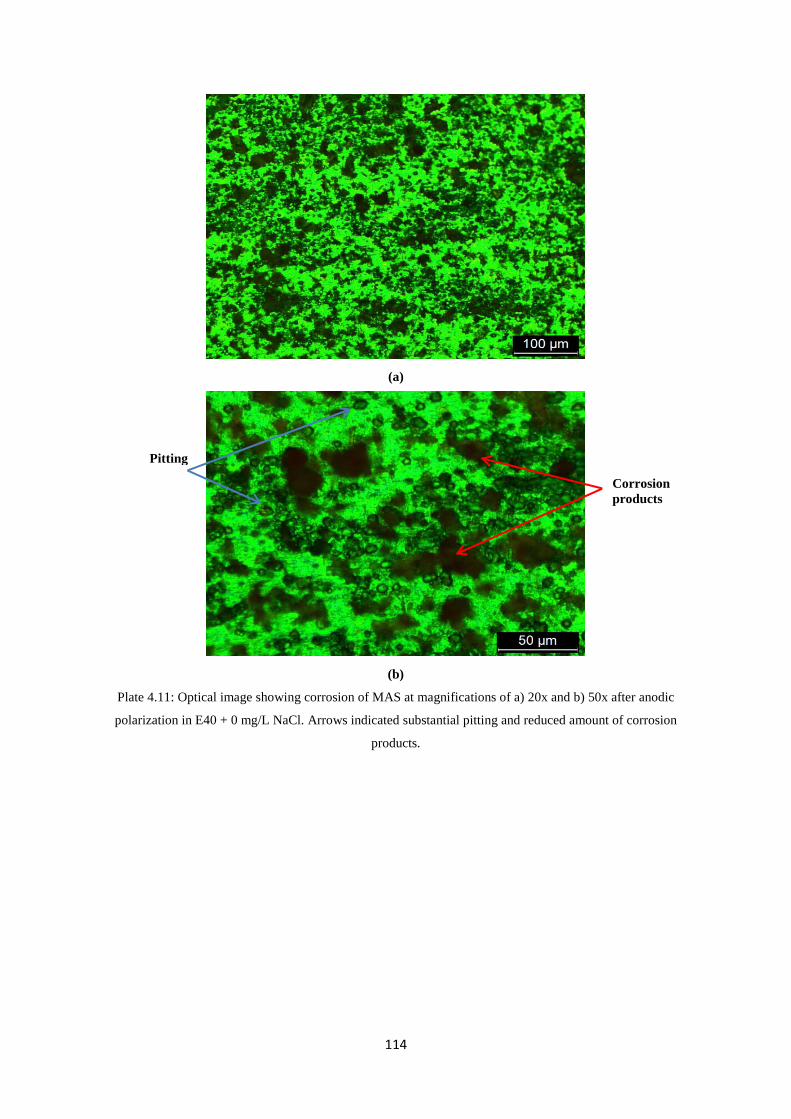
114
(a)
(b)
Plate 4.11: Optical image showing corrosion of MAS at magnifications of a) 20x and b) 50x after anodic
polarization in E40 + 0 mg/L NaCl. Arrows indicated substantial pitting and reduced amount of corrosion
products.
Pitting
Corrosion products
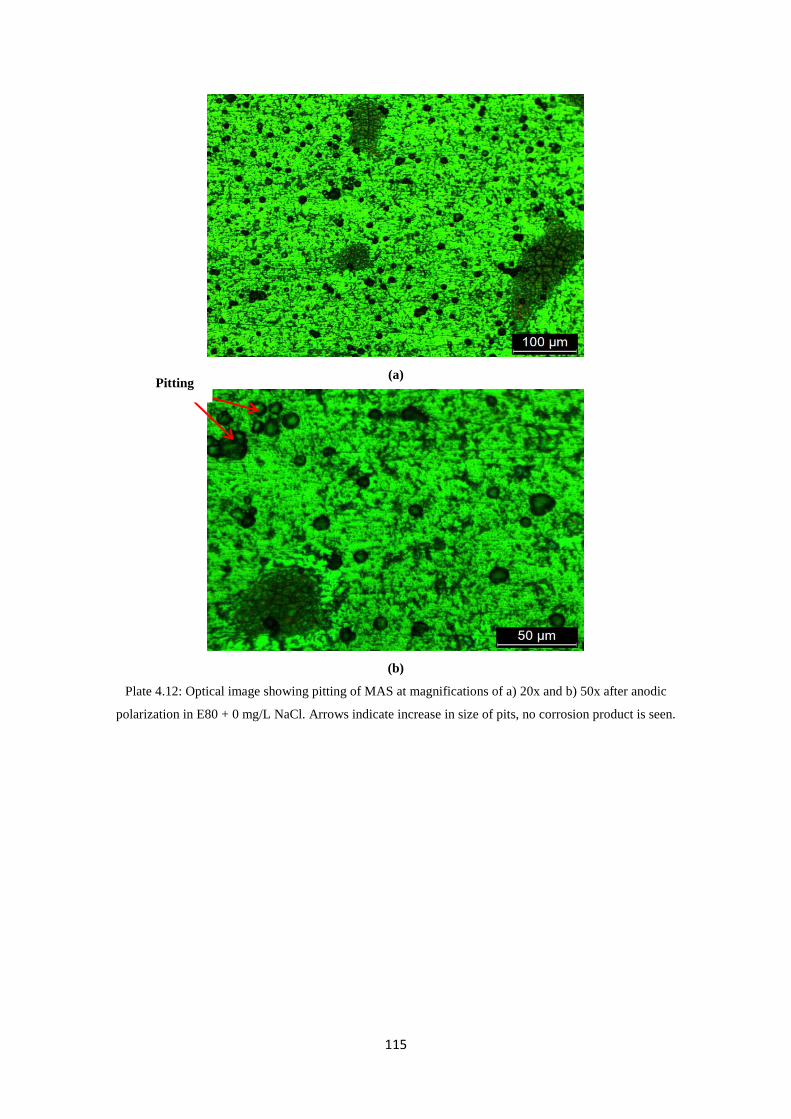
115
(a)
(b)
Plate 4.12: Optical image showing pitting of MAS at magnifications of a) 20x and b) 50x after anodic
polarization in E80 + 0 mg/L NaCl. Arrows indicate increase in size of pits, no corrosion product is seen.
Pitting
116
(a)
(b)
Plate 4.13: Optical image showing pitting (indicated by green arrows) and uniform corrosion (indicated by red
arrows) on MAS at magnifications of a) 20x and b) 50x after anodic polarization in E40 + 32 mg/L NaCl.
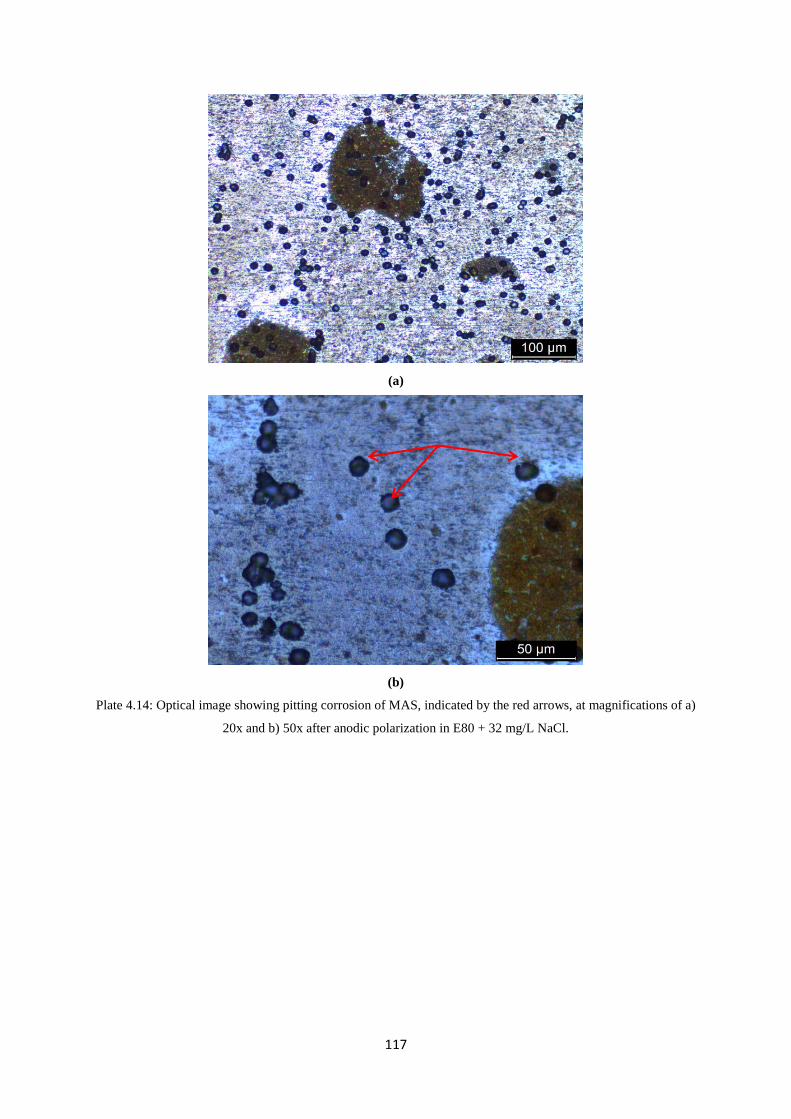
117
(a)
(b)
Plate 4.14: Optical image showing pitting corrosion of MAS, indicated by the red arrows, at magnifications of a)
20x and b) 50x after anodic polarization in E80 + 32 mg/L NaCl.
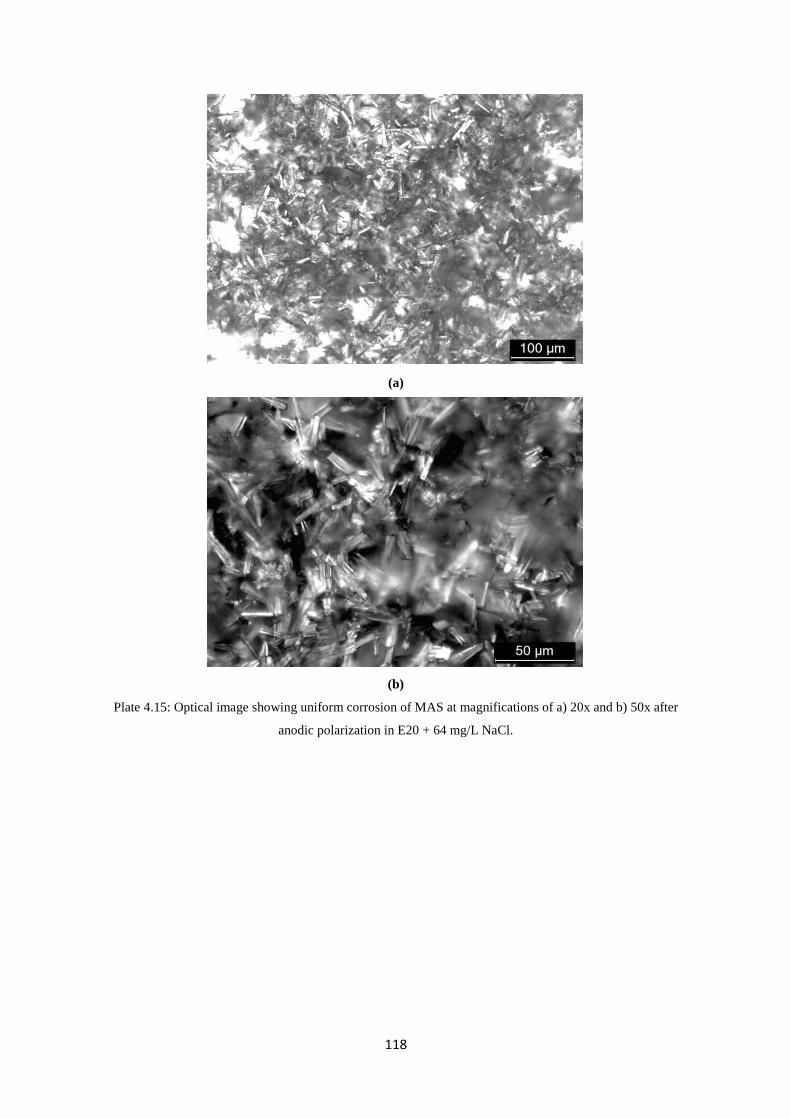
118
(a)
(b)
Plate 4.15: Optical image showing uniform corrosion of MAS at magnifications of a) 20x and b) 50x after
anodic polarization in E20 + 64 mg/L NaCl.
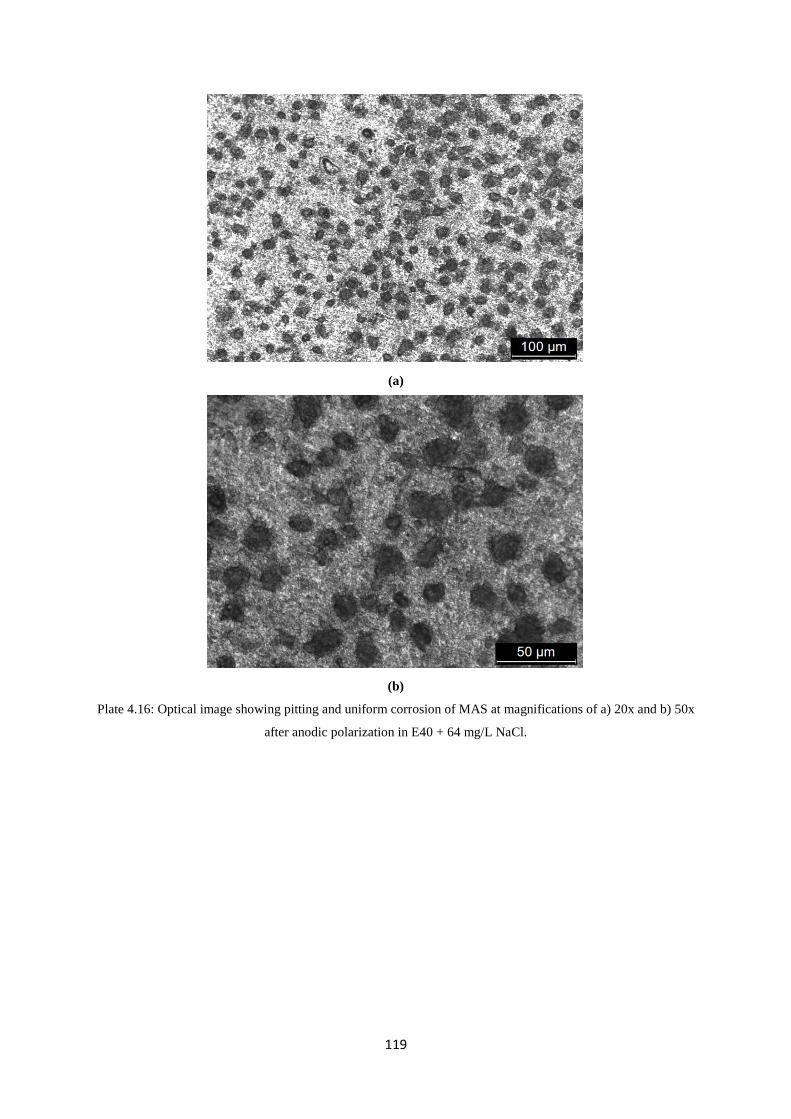
119
(a)
(b)
Plate 4.16: Optical image showing pitting and uniform corrosion of MAS at magnifications of a) 20x and b) 50x
after anodic polarization in E40 + 64 mg/L NaCl.
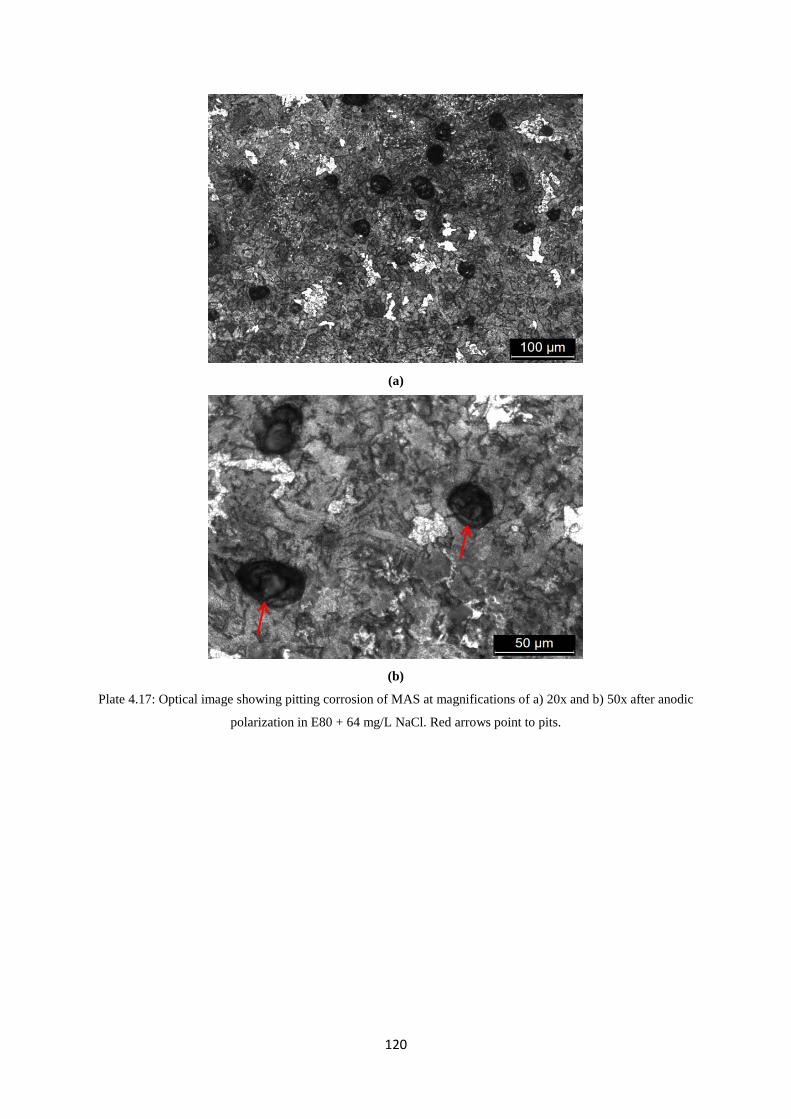
120
(a)
(b)
Plate 4.17: Optical image showing pitting corrosion of MAS at magnifications of a) 20x and b) 50x after anodic
polarization in E80 + 64 mg/L NaCl. Red arrows point to pits.

121
4.2.3 Characterization of the Oxide Layers Growing on MAS and API-5L X65 Steel
Exposed to E20, E40 and E80 Analyses of the corroded steels were carried out by Raman spectroscopy and X-ray
diffraction (XRD). Characterization by XRD revealed the presence of chloride products such
as 2-chloro-4-nitrobenzoic acid and 2, 3, 5, 6-tetramethylpyrazine in the oxide layers from
samples tested in the presence of NaCl. Other corrosion products namely 1, 3 Dimethyl-1H-
indole-2-carbonitrile, Iron formate hydrate and Iron nitroacetonate are also present in samples
tested with and without NaCl as shown in Figure 4.7. Iron (II) acetate has been reported to
show high solubility in fuel grade ethanol environments (Samusawa and Shiotani, 2015).
Raman spectroscopy of the corrosion products also reveal iron oxyhydroxides such as the
presence of maghemite [γ-Fe2O3], iron hydroxide [Fe(OH)2] and goethite [α-FeOOH] in test
conditions with NaCl (Sei, Cook and Townsend, 1998; Hanesch, 2009; Balasubramaniam,
Kumar and Dillmann, 2003; Samusawa and Shiotani, 2015). Figure 4.8 represents the Raman
spectrum for API-5L X65 and micro-alloyed steel samples after exposure to E20 at 27oC. A
strong band at 549 cm-1 is found indicating the presence of hematite. The presence of water in
the simulated fuel ethanol environments promotes the formation of iron hydroxide as reported
elsewhere (Lou and Singh, 2010). A broad and stronger band at 1423 cm-1 present in
corrosion products with and without chloride indicates the presence of maghemite. A strong
band of Goethite is also observed at 550 cm-1.

122
(a)
(b)
Figure 4.7: XRD analyses of corrosion products from MAS and API-5L X65 in simulated fuel ethanol, (a) with
NaCl showing the presence of chloride products and (b) without NaCl showing the presence of iron formate
hydrate and iron nitroacetonate.
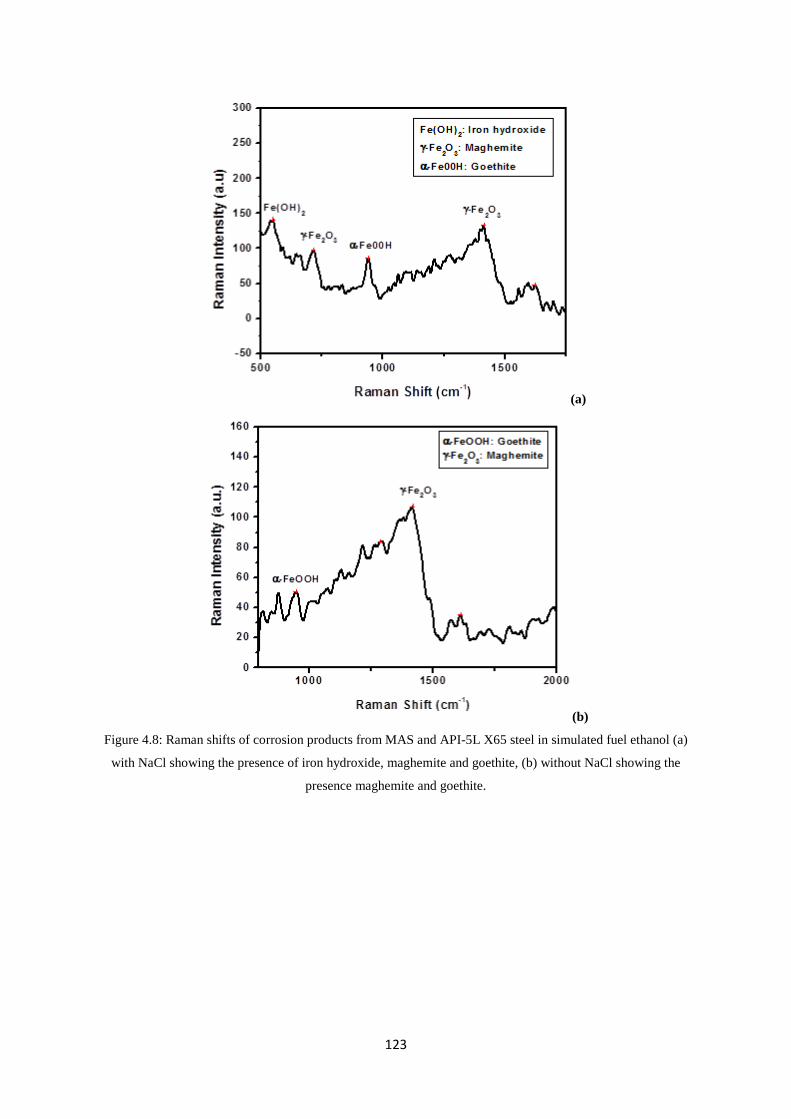
123
(a)
(b)
Figure 4.8: Raman shifts of corrosion products from MAS and API-5L X65 steel in simulated fuel ethanol (a)
with NaCl showing the presence of iron hydroxide, maghemite and goethite, (b) without NaCl showing the
presence maghemite and goethite.
124
4.2.4 Summary
Effects of chloride and ethanol concentration on the corrosion behaviour of API-5L X65 and
micro-alloyed steels have been studied using mass loss and electrochemical methods. The
conclusions include:
1) Corrosion rate of MAS and API-5L X65 is dependent on chloride concentration
within the tested range of 0 mg/L to 64 mg/L.
1a) Corrosion rate of MAS increased with increasing concentrations of NaCl in
E20, E40 and E80 environments with respect to the reference test at 0 mg/L
NaCl. Although corrosion rate decreased at 64 mg/L NaCl in E40 and E80,
corrosion rate in 0 mg/L NaCl was lower in all the instances.
1b) Chloride increased corrosion on MAS causing more rust as depicted by visual
examination. Chloride promotes pit initiation and growth. Selective dissolution of
ferrite was observed in all the test environments.
1c) Corrosion rate of API-5L X65 in E20 and E40 test environments decreased
with increasing chloride and with respect to the reference test (in the absence of
chloride). Thick oxide films developed due to the corrosive action of chloride
seemed to have a passivation effect on API-5L X65 in E20 and E40. In E80,
corrosion rate of API-5L X65 increased with respect to the reference test and
increasing concentration of NaCl.
2) Corrosion rate of MAS and API-5L X65 is dependent on ethanol concentration within
the tested range of 0 - 80 % ethanol.
2a) Corrosion rate increased with increasing ethanol concentration. In unleaded
gasoline, there was no mass loss, as a result, corrosion rate was zero.
2b) Corrosion rate of API-5L X65 increased by selective dissolution of ferrite.
With increasing ethanol concentration and concurrent decrease in gasoline
concentration, dissolution of ferrite increased.
3) Electrochemical measurements exhibited no clear passivation and pitting potential.
The icorr-estimate measured from the polarization curves, increased due to increasing
ethanol concentration, which presents a comparable trend to the mass loss results.
4) The formation of iron hydroxide film on the surface of tested specimens indicates the
likely effect of water in simulated fuel ethanol environments on the steels.
125
4.3 PART B: Fracture Behaviour of MAS and API-5L X65 steel in Simulated E20
and E80 Environments
Fracture mechanics makes it possible to determine whether a crack of given length in a
material of known fracture toughness is dangerous as it propagates to fracture at a given
stress level. In order to predict this behaviour for the API-5L X65 and the micro-alloyed
steels, the monotonic J test was applied on three-point bend specimens to evaluate the
fracture toughness and the materials’ resistance to fracture. In this section, the fracture
behaviour of API-5L X65 and micro-alloyed steels in E20 and E80 environments is
evaluated. The steps in determining the J-R curve, the influences of ethanol chemistry with
respect to chloride concentrations, the fracture toughness parameters (J0.2 and ∆a0.2) were
described and studied in detail. Other toughness parameters (such as the tearing modulus and
stretch zones) and the morphology of fracture surfaces obtained from the J tests were also
examined.
4.3.1 Tensile Behaviour
The yielding behaviour of the two steels is shown in Figure 4.9. From this Figure, API-5L
X65 steel is seen to exhibit an appreciable yield point elongation following a sharp yield
point in comparison to micro-alloyed steel. In the case of micro-alloyed steel, an elastic-
plastic transition is clearly visible but the sharp yield drop was inconsequential. A distinct
yield point can be associated with small amounts of interstitial or substitutional impurities.
These impurities cause solute atom interactions, which pinned down dislocations. A
breakaway stress is required to pull the dislocation line away from the line of solute atoms.
When the dislocation line is pulled away, slip can occur at a lower stress. Alternatively, new
dislocations must be generated to allow the flow stress to drop. This explains the origin of the
upper and lower yield stress. After the Luders band has propagated to cover the entire yield
section of the specimen, flow increased with strain in the usual manner (Dieter, 1988). The
difference in the yield point effect for both MAS and API-5L X65 steel is explained by the
fact that the magnitude of the yield point effect depends on the interaction energy and the
concentration of solute atoms at the dislocations. In addition, the difference in the tensile
behaviour of both steels can be attributed to the difference in the microstructures of the two
steels (Sivaprasad, Tarafder, Ranganath and Ray, 2000). A larger grain sized ferritic structure
as in the case of micro-alloyed steel is liable to have lower yield strength. API-5L X65
exhibits yield strength that is 60% higher than that of MAS.
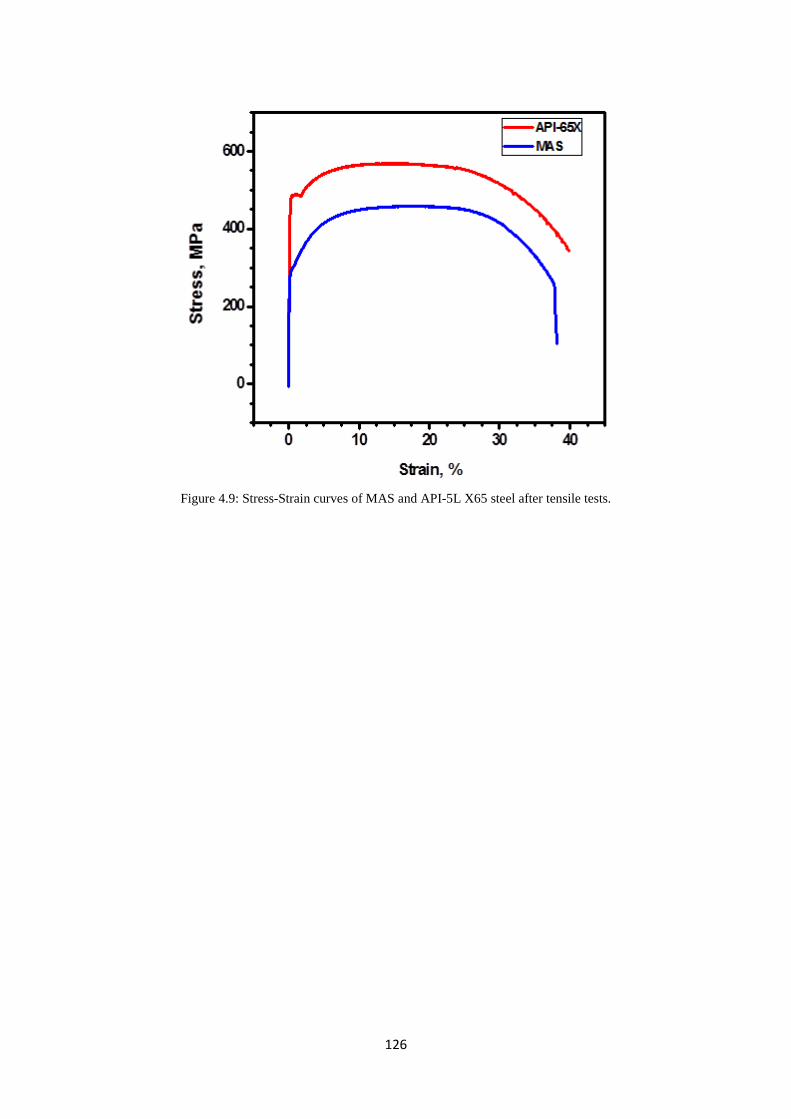
126
Figure 4.9: Stress-Strain curves of MAS and API-5L X65 steel after tensile tests.
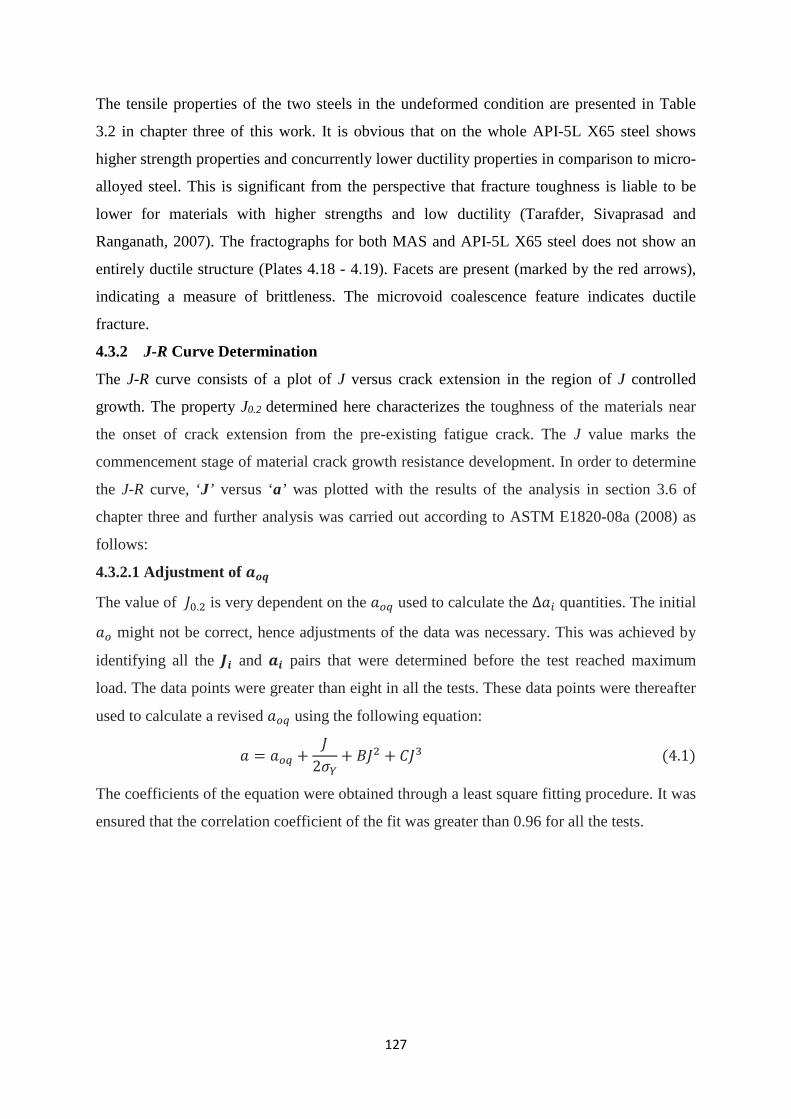
127
The tensile properties of the two steels in the undeformed condition are presented in Table
3.2 in chapter three of this work. It is obvious that on the whole API-5L X65 steel shows
higher strength properties and concurrently lower ductility properties in comparison to micro-
alloyed steel. This is significant from the perspective that fracture toughness is liable to be
lower for materials with higher strengths and low ductility (Tarafder, Sivaprasad and
Ranganath, 2007). The fractographs for both MAS and API-5L X65 steel does not show an
entirely ductile structure (Plates 4.18 - 4.19). Facets are present (marked by the red arrows),
indicating a measure of brittleness. The microvoid coalescence feature indicates ductile
fracture.
4.3.2 J-R Curve Determination
The J-R curve consists of a plot of J versus crack extension in the region of J controlled
growth. The property J0.2 determined here characterizes the toughness of the materials near
the onset of crack extension from the pre-existing fatigue crack. The J value marks the
commencement stage of material crack growth resistance development. In order to determine
the J-R curve, ‘J’ versus ‘a’ was plotted with the results of the analysis in section 3.6 of
chapter three and further analysis was carried out according to ASTM E1820-08a (2008) as
follows:
4.3.2.1 Adjustment of 𝒂𝒂𝒐𝒐𝒐𝒐
The value of 𝐽𝐽0.2 is very dependent on the 𝑎𝑎𝑜𝑜𝑜𝑜 used to calculate the ∆𝑎𝑎𝑖𝑖 quantities. The initial
𝑎𝑎𝑜𝑜 might not be correct, hence adjustments of the data was necessary. This was achieved by
identifying all the 𝑱𝑱𝒊𝒊 and 𝒂𝒂𝒊𝒊 pairs that were determined before the test reached maximum
load. The data points were greater than eight in all the tests. These data points were thereafter
used to calculate a revised 𝑎𝑎𝑜𝑜𝑜𝑜 using the following equation:
𝑎𝑎 = 𝑎𝑎𝑜𝑜𝑜𝑜 +𝐽𝐽
2𝜎𝜎𝑌𝑌+ 𝐵𝐵𝐽𝐽2 + 𝐶𝐶𝐽𝐽3 (4.1)
The coefficients of the equation were obtained through a least square fitting procedure. It was
ensured that the correlation coefficient of the fit was greater than 0.96 for all the tests.
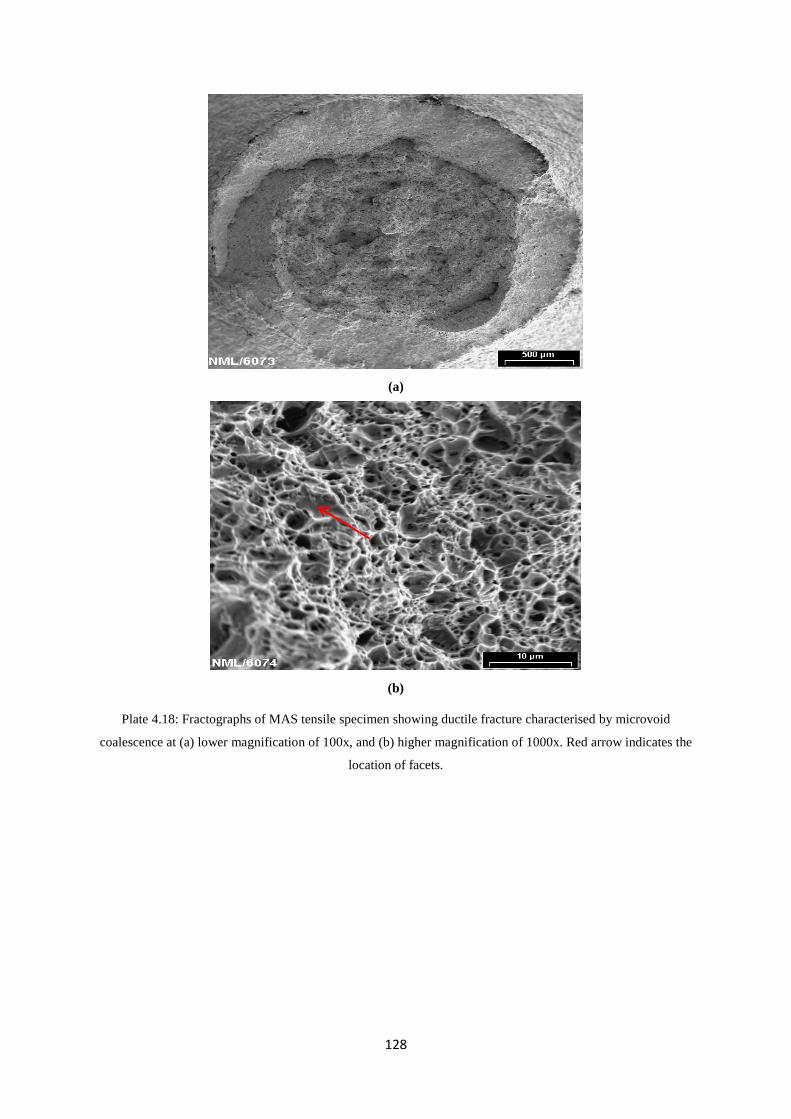
128
(a)
(b)
Plate 4.18: Fractographs of MAS tensile specimen showing ductile fracture characterised by microvoid
coalescence at (a) lower magnification of 100x, and (b) higher magnification of 1000x. Red arrow indicates the
location of facets.
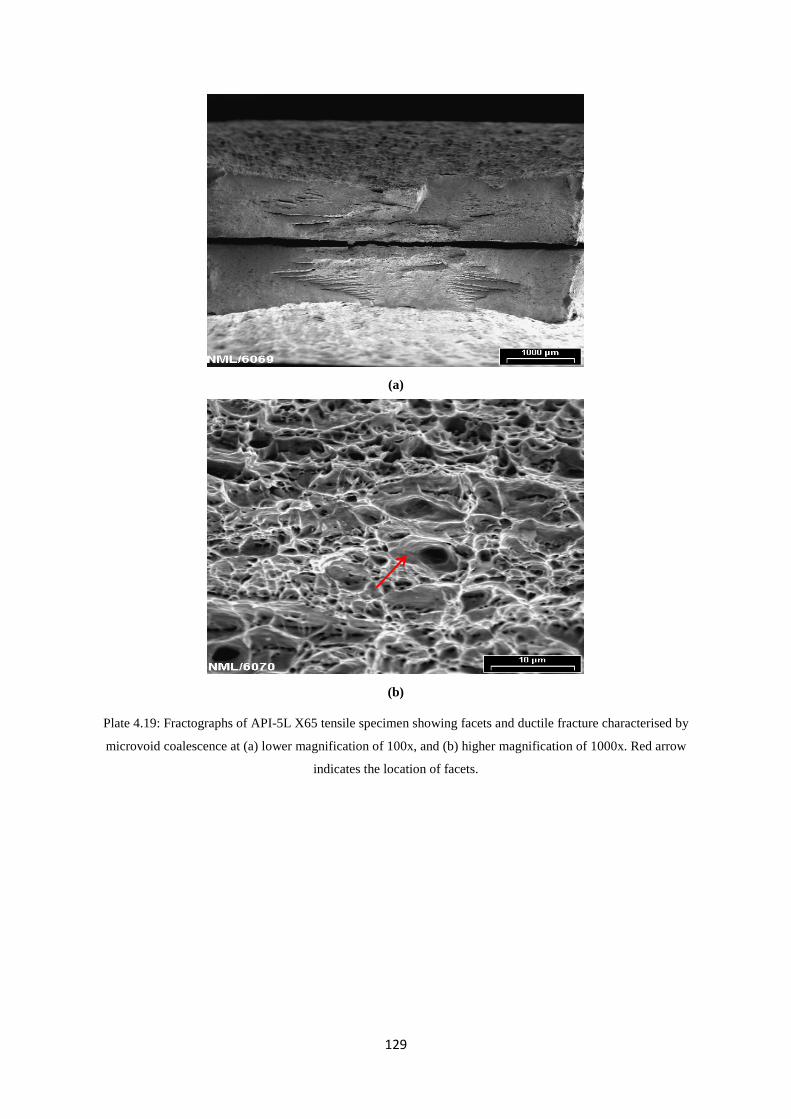
129
(a)
(b)
Plate 4.19: Fractographs of API-5L X65 tensile specimen showing facets and ductile fracture characterised by
microvoid coalescence at (a) lower magnification of 100x, and (b) higher magnification of 1000x. Red arrow
indicates the location of facets.
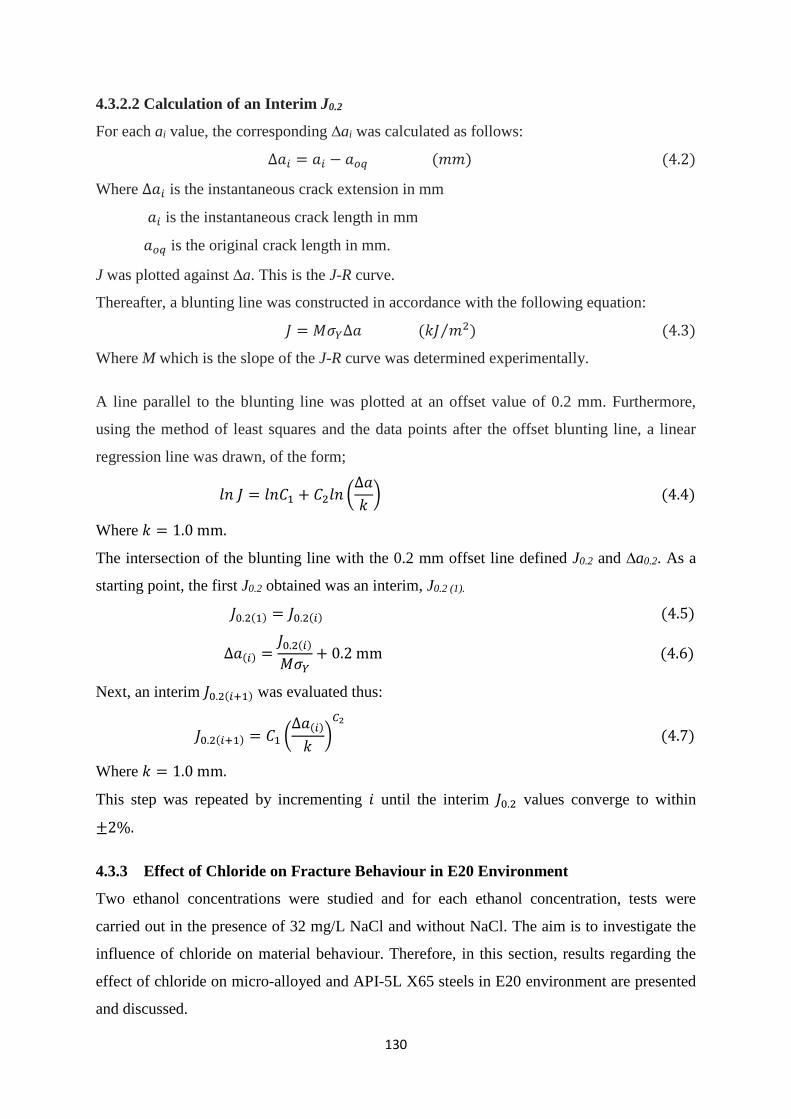
130
4.3.2.2 Calculation of an Interim J0.2
For each ai value, the corresponding ∆ai was calculated as follows:
∆𝑎𝑎𝑖𝑖 = 𝑎𝑎𝑖𝑖 − 𝑎𝑎𝑜𝑜𝑜𝑜 (𝑚𝑚𝑚𝑚) (4.2)
Where ∆𝑎𝑎𝑖𝑖 is the instantaneous crack extension in mm
𝑎𝑎𝑖𝑖 is the instantaneous crack length in mm
𝑎𝑎𝑜𝑜𝑜𝑜 is the original crack length in mm.
J was plotted against ∆a. This is the J-R curve.
Thereafter, a blunting line was constructed in accordance with the following equation:
𝐽𝐽 = 𝑀𝑀𝜎𝜎𝑌𝑌∆𝑎𝑎 (𝑘𝑘𝐽𝐽 𝑚𝑚2)⁄ (4.3)
Where M which is the slope of the J-R curve was determined experimentally.
A line parallel to the blunting line was plotted at an offset value of 0.2 mm. Furthermore,
using the method of least squares and the data points after the offset blunting line, a linear
regression line was drawn, of the form;
𝑙𝑙𝑙𝑙 𝐽𝐽 = 𝑙𝑙𝑙𝑙𝐶𝐶1 + 𝐶𝐶2𝑙𝑙𝑙𝑙 �∆𝑎𝑎𝑘𝑘� (4.4)
Where 𝑘𝑘 = 1.0 mm.
The intersection of the blunting line with the 0.2 mm offset line defined J0.2 and ∆a0.2. As a
starting point, the first J0.2 obtained was an interim, J0.2 (1).
𝐽𝐽0.2(1) = 𝐽𝐽0.2(𝑖𝑖) (4.5)
∆𝑎𝑎(𝑖𝑖) =𝐽𝐽0.2(𝑖𝑖)
𝑀𝑀𝜎𝜎𝑌𝑌+ 0.2 mm (4.6)
Next, an interim 𝐽𝐽0.2(𝑖𝑖+1) was evaluated thus:
𝐽𝐽0.2(𝑖𝑖+1) = 𝐶𝐶1 �∆𝑎𝑎(𝑖𝑖)
𝑘𝑘�𝐶𝐶2
(4.7)
Where 𝑘𝑘 = 1.0 mm.
This step was repeated by incrementing 𝑖𝑖 until the interim 𝐽𝐽0.2 values converge to within
±2%.
4.3.3 Effect of Chloride on Fracture Behaviour in E20 Environment
Two ethanol concentrations were studied and for each ethanol concentration, tests were
carried out in the presence of 32 mg/L NaCl and without NaCl. The aim is to investigate the
influence of chloride on material behaviour. Therefore, in this section, results regarding the
effect of chloride on micro-alloyed and API-5L X65 steels in E20 environment are presented
and discussed.
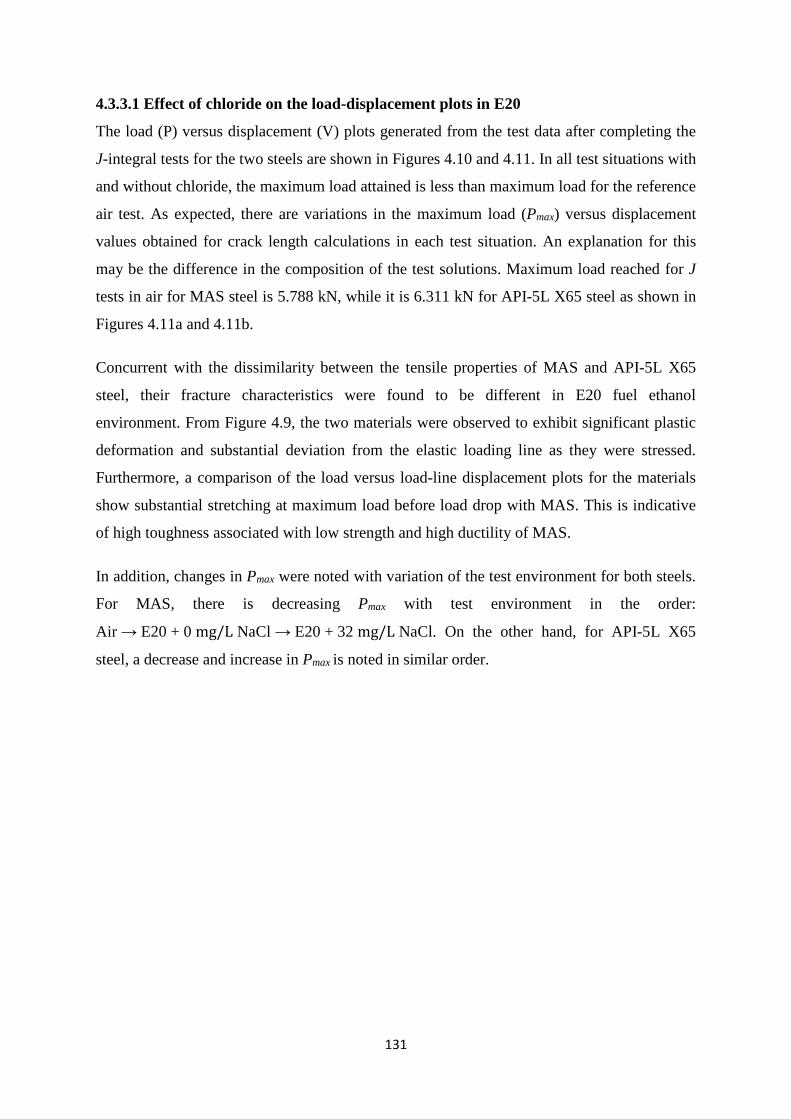
131
4.3.3.1 Effect of chloride on the load-displacement plots in E20
The load (P) versus displacement (V) plots generated from the test data after completing the
J-integral tests for the two steels are shown in Figures 4.10 and 4.11. In all test situations with
and without chloride, the maximum load attained is less than maximum load for the reference
air test. As expected, there are variations in the maximum load (Pmax) versus displacement
values obtained for crack length calculations in each test situation. An explanation for this
may be the difference in the composition of the test solutions. Maximum load reached for J
tests in air for MAS steel is 5.788 kN, while it is 6.311 kN for API-5L X65 steel as shown in
Figures 4.11a and 4.11b.
Concurrent with the dissimilarity between the tensile properties of MAS and API-5L X65
steel, their fracture characteristics were found to be different in E20 fuel ethanol
environment. From Figure 4.9, the two materials were observed to exhibit significant plastic
deformation and substantial deviation from the elastic loading line as they were stressed.
Furthermore, a comparison of the load versus load-line displacement plots for the materials
show substantial stretching at maximum load before load drop with MAS. This is indicative
of high toughness associated with low strength and high ductility of MAS.
In addition, changes in Pmax were noted with variation of the test environment for both steels.
For MAS, there is decreasing Pmax with test environment in the order:
Air → E20 + 0 mg/L NaCl → E20 + 32 mg/L NaCl. On the other hand, for API-5L X65
steel, a decrease and increase in Pmax is noted in similar order.
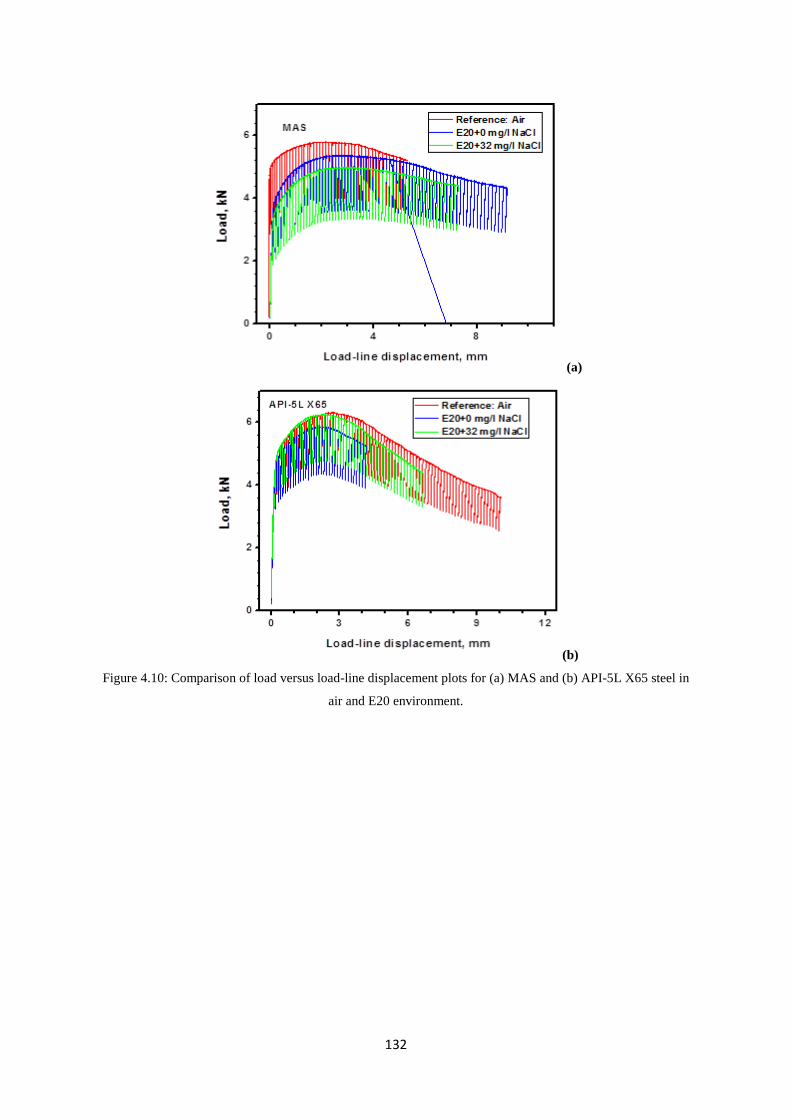
132
(a)
(b) Figure 4.10: Comparison of load versus load-line displacement plots for (a) MAS and (b) API-5L X65 steel in
air and E20 environment.
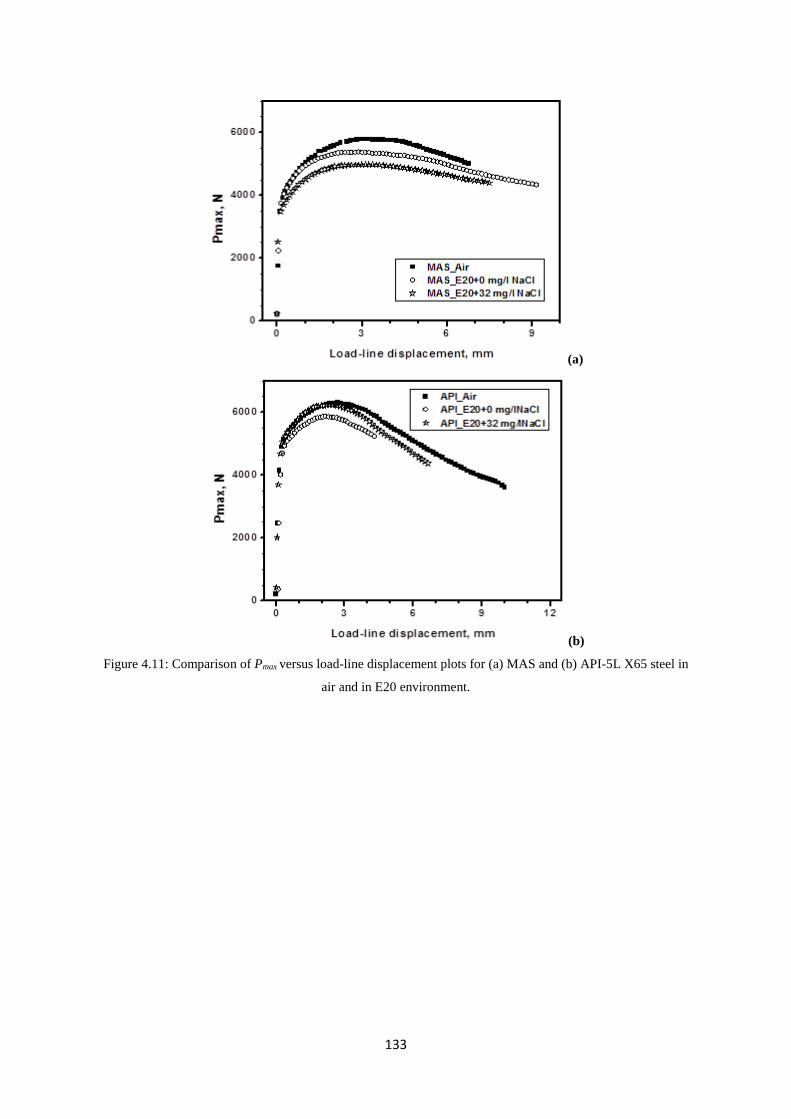
133
(a)
(b) Figure 4.11: Comparison of Pmax versus load-line displacement plots for (a) MAS and (b) API-5L X65 steel in
air and in E20 environment.
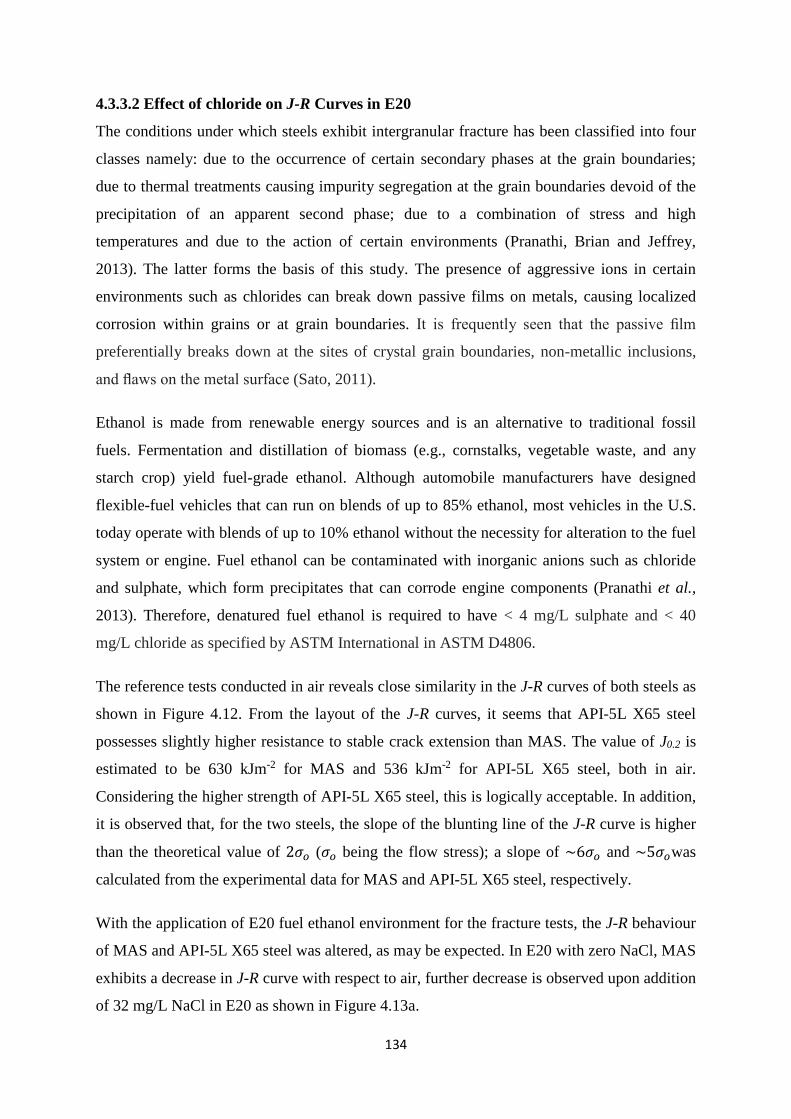
134
4.3.3.2 Effect of chloride on J-R Curves in E20
The conditions under which steels exhibit intergranular fracture has been classified into four
classes namely: due to the occurrence of certain secondary phases at the grain boundaries;
due to thermal treatments causing impurity segregation at the grain boundaries devoid of the
precipitation of an apparent second phase; due to a combination of stress and high
temperatures and due to the action of certain environments (Pranathi, Brian and Jeffrey,
2013). The latter forms the basis of this study. The presence of aggressive ions in certain
environments such as chlorides can break down passive films on metals, causing localized
corrosion within grains or at grain boundaries. It is frequently seen that the passive film
preferentially breaks down at the sites of crystal grain boundaries, non-metallic inclusions,
and flaws on the metal surface (Sato, 2011).
Ethanol is made from renewable energy sources and is an alternative to traditional fossil
fuels. Fermentation and distillation of biomass (e.g., cornstalks, vegetable waste, and any
starch crop) yield fuel-grade ethanol. Although automobile manufacturers have designed
flexible-fuel vehicles that can run on blends of up to 85% ethanol, most vehicles in the U.S.
today operate with blends of up to 10% ethanol without the necessity for alteration to the fuel
system or engine. Fuel ethanol can be contaminated with inorganic anions such as chloride
and sulphate, which form precipitates that can corrode engine components (Pranathi et al.,
2013). Therefore, denatured fuel ethanol is required to have < 4 mg/L sulphate and < 40
mg/L chloride as specified by ASTM International in ASTM D4806.
The reference tests conducted in air reveals close similarity in the J-R curves of both steels as
shown in Figure 4.12. From the layout of the J-R curves, it seems that API-5L X65 steel
possesses slightly higher resistance to stable crack extension than MAS. The value of J0.2 is
estimated to be 630 kJm-2 for MAS and 536 kJm-2 for API-5L X65 steel, both in air.
Considering the higher strength of API-5L X65 steel, this is logically acceptable. In addition,
it is observed that, for the two steels, the slope of the blunting line of the J-R curve is higher
than the theoretical value of 2𝜎𝜎𝑜𝑜 (𝜎𝜎𝑜𝑜 being the flow stress); a slope of ~6𝜎𝜎𝑜𝑜 and ~5𝜎𝜎𝑜𝑜was
calculated from the experimental data for MAS and API-5L X65 steel, respectively.
With the application of E20 fuel ethanol environment for the fracture tests, the J-R behaviour
of MAS and API-5L X65 steel was altered, as may be expected. In E20 with zero NaCl, MAS
exhibits a decrease in J-R curve with respect to air, further decrease is observed upon addition
of 32 mg/L NaCl in E20 as shown in Figure 4.13a.
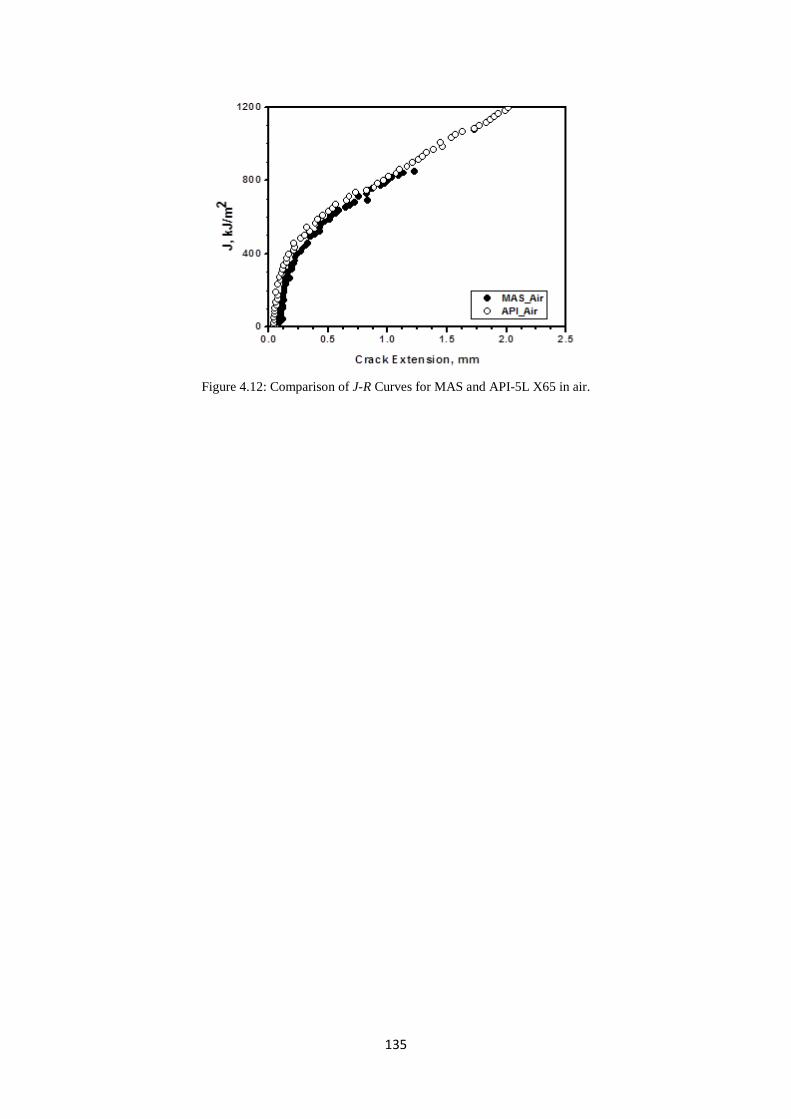
135
Figure 4.12: Comparison of J-R Curves for MAS and API-5L X65 in air.
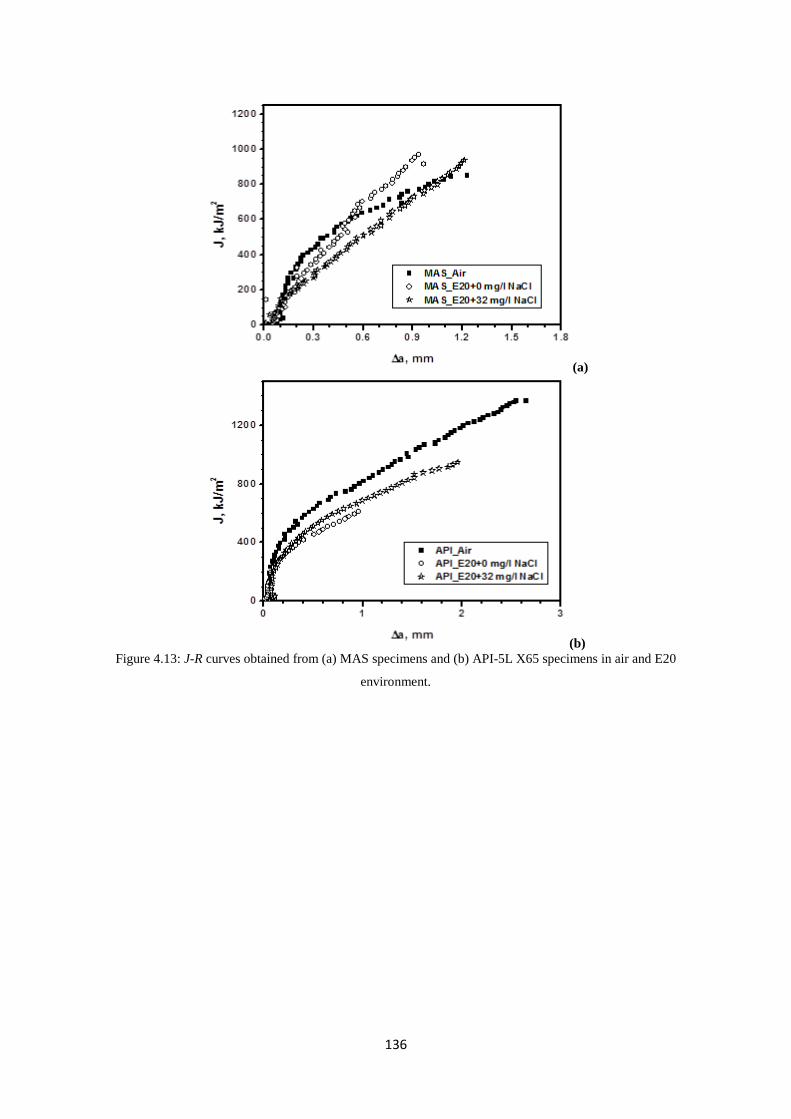
136
(a)
(b) Figure 4.13: J-R curves obtained from (a) MAS specimens and (b) API-5L X65 specimens in air and E20
environment.
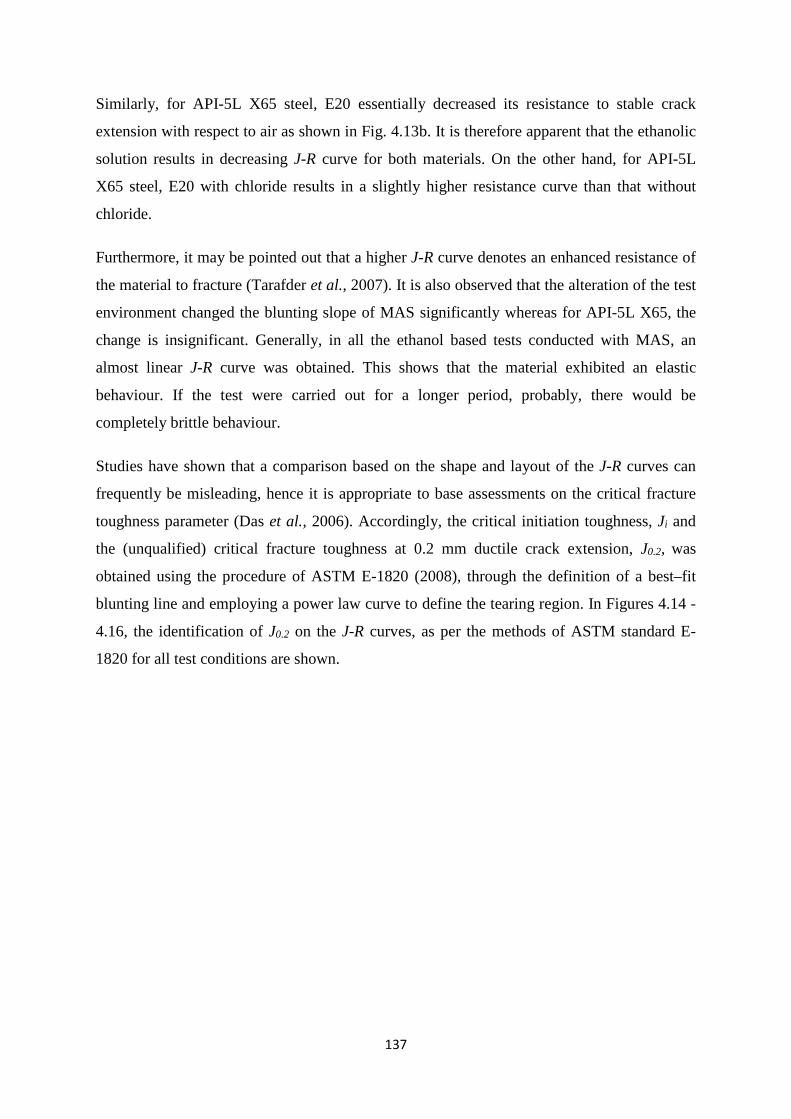
137
Similarly, for API-5L X65 steel, E20 essentially decreased its resistance to stable crack
extension with respect to air as shown in Fig. 4.13b. It is therefore apparent that the ethanolic
solution results in decreasing J-R curve for both materials. On the other hand, for API-5L
X65 steel, E20 with chloride results in a slightly higher resistance curve than that without
chloride.
Furthermore, it may be pointed out that a higher J-R curve denotes an enhanced resistance of
the material to fracture (Tarafder et al., 2007). It is also observed that the alteration of the test
environment changed the blunting slope of MAS significantly whereas for API-5L X65, the
change is insignificant. Generally, in all the ethanol based tests conducted with MAS, an
almost linear J-R curve was obtained. This shows that the material exhibited an elastic
behaviour. If the test were carried out for a longer period, probably, there would be
completely brittle behaviour.
Studies have shown that a comparison based on the shape and layout of the J-R curves can
frequently be misleading, hence it is appropriate to base assessments on the critical fracture
toughness parameter (Das et al., 2006). Accordingly, the critical initiation toughness, Ji and
the (unqualified) critical fracture toughness at 0.2 mm ductile crack extension, J0.2, was
obtained using the procedure of ASTM E-1820 (2008), through the definition of a best–fit
blunting line and employing a power law curve to define the tearing region. In Figures 4.14 -
4.16, the identification of J0.2 on the J-R curves, as per the methods of ASTM standard E-
1820 for all test conditions are shown.

138
(a)
(b)
Figure 4.14: Identification of J0.2 on the J-R curve obtained from (a) MAS and (b) API-5L X65 specimens in air.
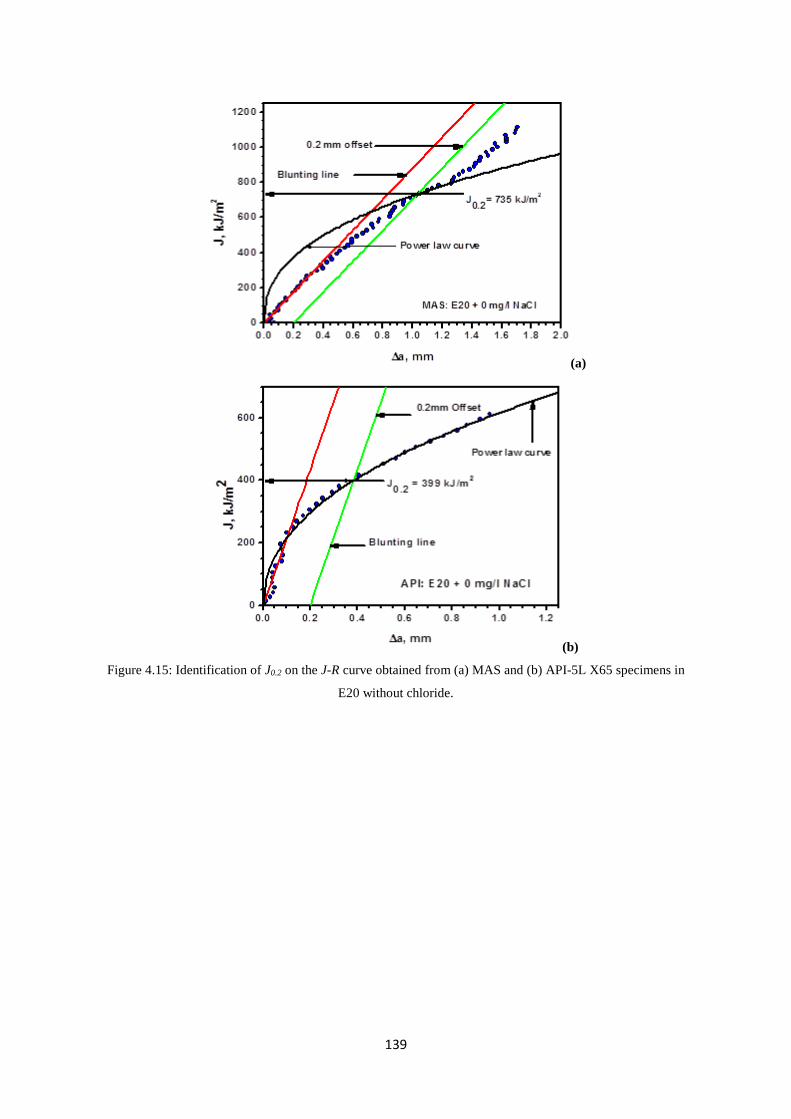
139
(a)
(b)
Figure 4.15: Identification of J0.2 on the J-R curve obtained from (a) MAS and (b) API-5L X65 specimens in
E20 without chloride.
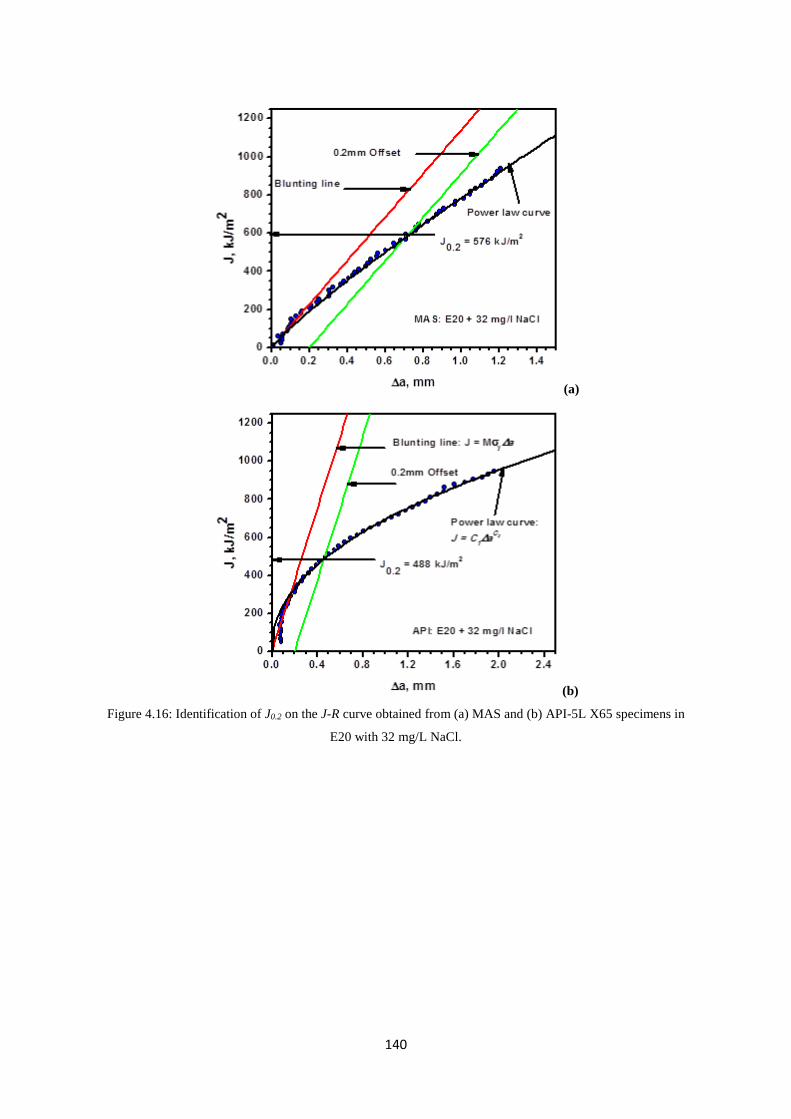
140
(a)
(b)
Figure 4.16: Identification of J0.2 on the J-R curve obtained from (a) MAS and (b) API-5L X65 specimens in
E20 with 32 mg/L NaCl.

141
4.3.3.3 Effect of chloride on fracture toughness in E20
Since the point at which Ji was measured is not sufficiently distinct in all tests, ASTM E1820
defines a 0.2 mm offset, which is used to establish a JQ or J0.2 value for qualification of
fracture toughness. The variation of fracture toughness J0.2 with the test environment for the
two steels is presented in Figure 4.17. It is evident that for MAS, fracture toughness increased
in E20 without chloride with respect to the air test. On the other hand, for API-5L X65 steel,
there is decrease in fracture toughness in E20 without chloride, suggesting the corrosive
action of fuel ethanol (even without chloride) in the degradation of the material properties.
In addition, it can be seen from Figure 4.17 that fracture toughness of MAS decreased from
the value in the air test to a lower level in E20 with 32 mg/L NaCl, similar to the pattern
displayed by the J-R curve. It must be pointed out that the action of certain environments has
been suggested as one of the conditions under which steels exhibit environmentally-assisted
fracture (Pranathi, Brian and Jeffrey, 2013). Furthermore, studies have shown that carbon
steels which are typically pipeline steels, when exposed to E20 have high susceptibility to
corrosion (Baena et al., 2012). In addition, local film breakdown is important for the
initiation of cracks in a simulated fuel ethanol environment and the competition between
active anodic dissolution and repassivation ahead of the crack tip controls the propagation of
these cracks (Baena et al., 2012). Electrochemical corrosion of MAS and API-5L X65 steel
(similar to corrosion in aqueous media) which occurred during the J-integral tests in E20,
may be the cause of decrease in the respective fracture toughness and J-R curves of both
steels.
It is important to note that the presence of chloride in E20 resulted in increase in fracture
toughness of API-5L X65 steel. It is unexpected that an increase would occur since any
product formed with chloride is not expected to improve fracture toughness (Brown and
Baratta, 1992). An explanation for this could be that chloride products formed due to
corrosion along the matrix grain boundaries inhibited decohesive rupturing by increasing the
stress intensity at the crack tip, thereby toughening the material. In other words, repassivation
is rapid relative to chloride in the environments, therefore anodic dissolution required to
propagate a crack does not occur at the crack tip. However, the fracture toughness obtained
for MAS in air and in E20 is significantly higher than that of API-5L X65 in similar test
conditions.
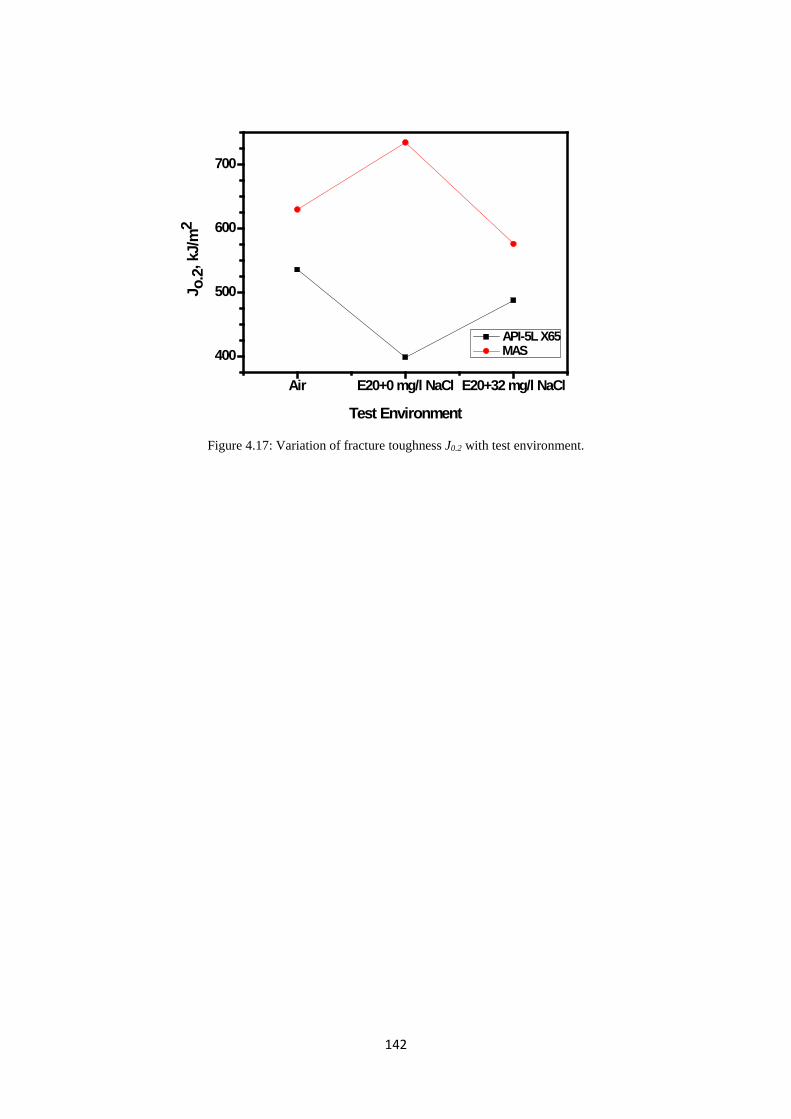
142
Air E20+0 mg/l NaCl E20+32 mg/l NaCl
400
500
600
700
J o.2
, kJ/
m2
Test Environment
API-5L X65 MAS
Figure 4.17: Variation of fracture toughness J0.2 with test environment.

143
Thus, it appears that the MAS material has a superior resistance to fracture than API-5L X65
steel in air and in E20. A reverse trend of increasing and decreasing fracture toughness (J0.2)
observed for MAS was noted for API-5L X65 steels. On the other hand, similar trend of
fracture toughness (J0.2) and initiation toughness (Ji) behaviour as shown in Figure 4.18 was
observed for both steels.
The initiation fracture toughness, Ji, was obtained from the experimental J-R curves at the
point of departure of the curve from the experimental blunting line. The experimental Ji
values exhibits a similar trend of variation as the experimental J0.2 with the presence of
chloride in E20 as shown in Figure 4.18. Ji denotes the critical J-value for onset of stable
crack growth. In air, MAS has a Ji value of 458 kJ/m2, while API-5L X65 has a Ji of 276
kJ/m2. The values are relatively far apart, which implies that MAS absorb significantly higher
amounts of energy before crack extension. It is important to note that the corresponding
predicted critical crack sizes are not relatively close. ∆ap for MAS is 0.28 mm while that for
API-5L X65 is 0.12 mm. Crack extension before initiation of a new crack surface is therefore
higher in MAS than API-5L X65.
In E20 without chloride, Ji increased for MAS, a similar behaviour was observed with J0.2.
However, there was drastic drop in Ji when 32 mg/L NaCl was added to E20. On the other
hand, Ji increased for API-5L X65 in E20 with chloride. This implies that fracture initiation
is rapid in the case of MAS.
To qualify J0.2 as the ductile fracture toughness JIc, the criteria in Equations 4.8 – 4.10 have to
be satisfied.
𝐵𝐵 > 10 𝐽𝐽0.2 𝜎𝜎𝑜𝑜⁄ (4.8)
𝑏𝑏𝑜𝑜 > 10 𝐽𝐽0.2 𝜎𝜎𝑜𝑜⁄ (4.9)
𝑑𝑑𝑑𝑑𝑑𝑑𝑑𝑑�∆𝑑𝑑0.2
< 𝜎𝜎𝑜𝑜 (4.10)
Where 𝜎𝜎𝑜𝑜 is the flow stress and ∆𝑎𝑎0.2 is the crack extension at J0.2. It was found that all the
values of J0.2 obtained for the API-5L X65 and MAS specimens are not qualified to be termed
as JIC as shown in Tables 4.3 and 4.4. This means that the fracture toughness values are size
dependent and therefore amenable to comparisons only with specimens of similar size.
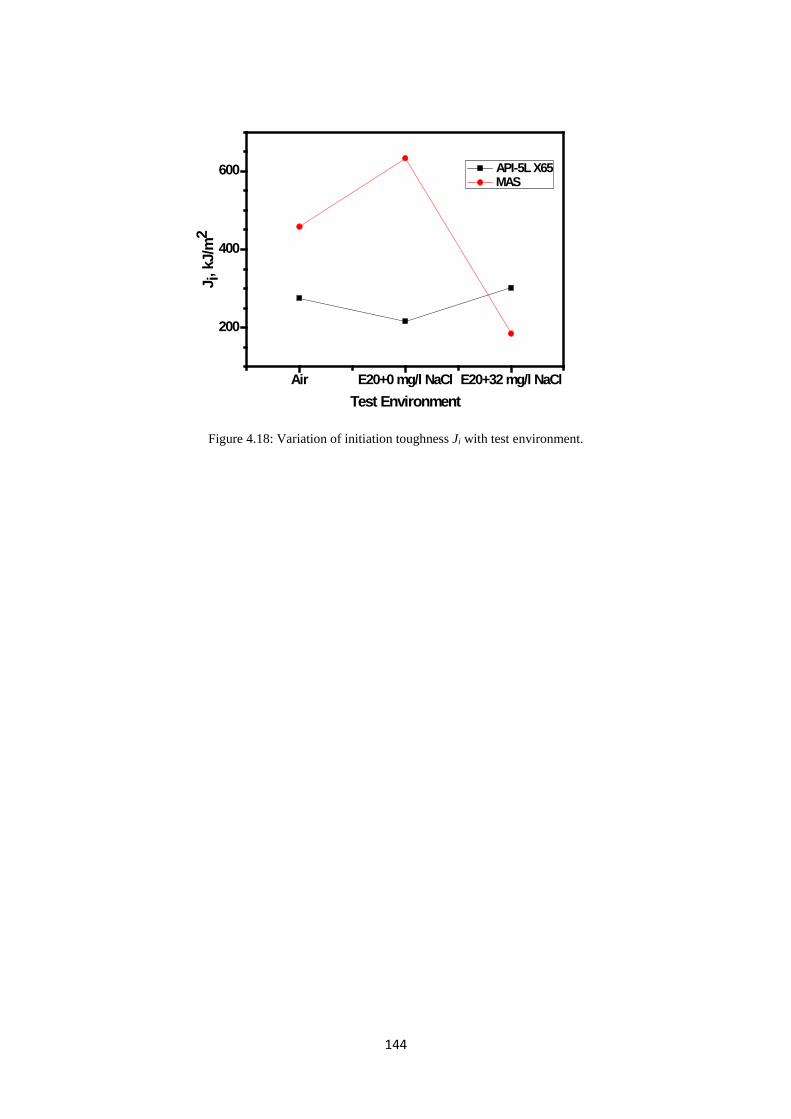
144
Air E20+0 mg/l NaCl E20+32 mg/l NaCl
200
400
600
J i, k
J/m
2
Test Environment
API-5L X65 MAS
Figure 4.18: Variation of initiation toughness Ji with test environment.
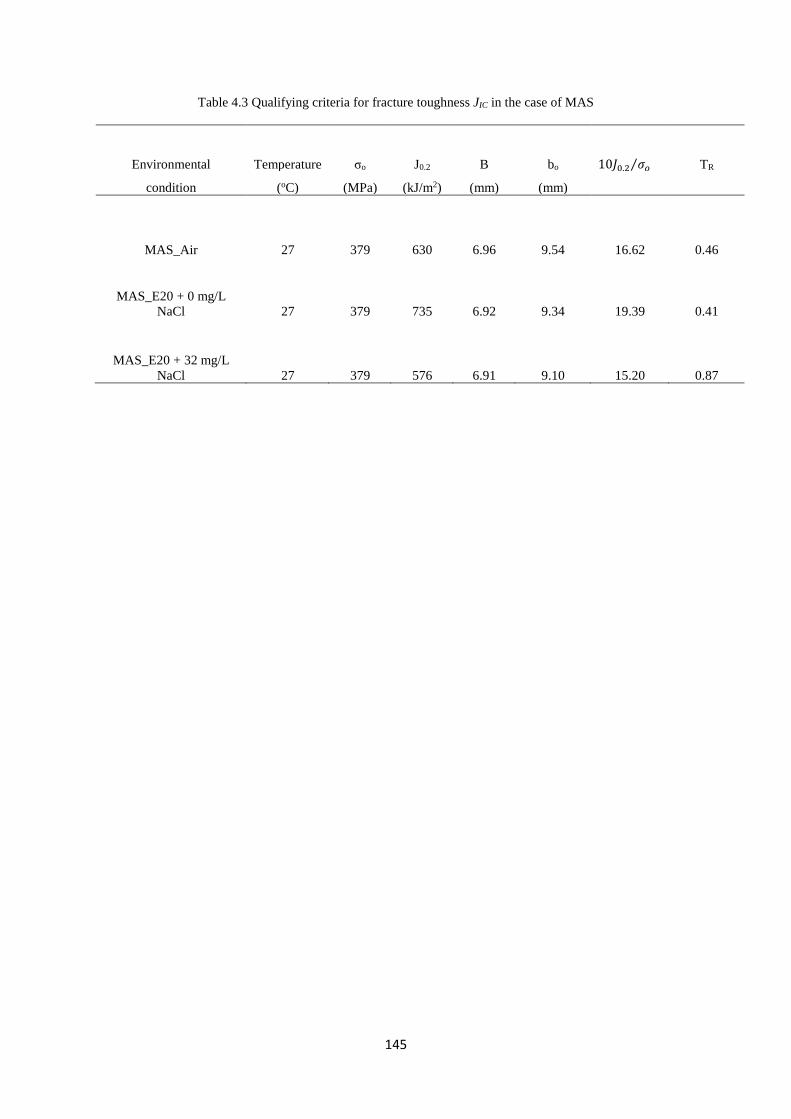
145
Table 4.3 Qualifying criteria for fracture toughness JIC in the case of MAS
Environmental Temperature σo J0.2 B
bo
10𝐽𝐽0.2 𝜎𝜎𝑜𝑜⁄
TR
condition (oC) (MPa) (kJ/m2) (mm) (mm)
MAS_Air 27 379 630 6.96 9.54 16.62 0.46
MAS_E20 + 0 mg/L NaCl 27 379 735 6.92 9.34 19.39 0.41
MAS_E20 + 32 mg/L NaCl 27 379 576 6.91 9.10 15.20 0.87
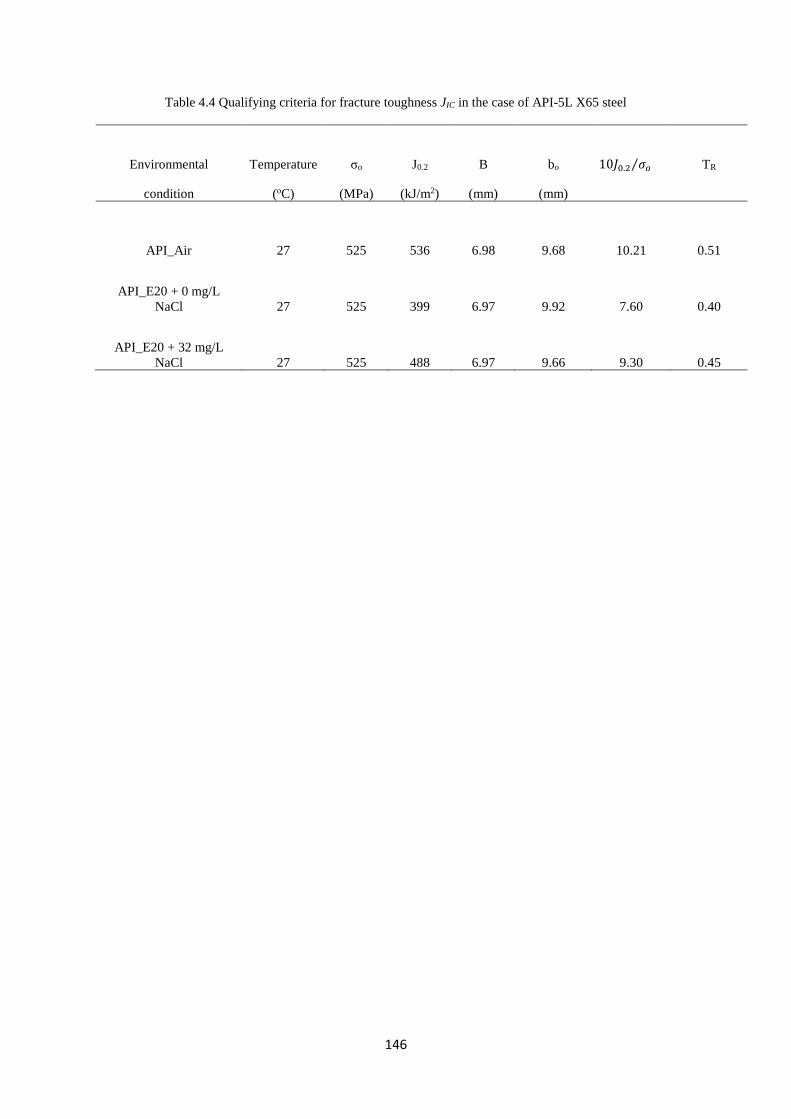
146
Table 4.4 Qualifying criteria for fracture toughness JIC in the case of API-5L X65 steel
Environmental Temperature σo J0.2 B
bo
10𝐽𝐽0.2 𝜎𝜎𝑜𝑜⁄
TR
condition (oC) (MPa) (kJ/m2) (mm) (mm)
API_Air 27 525 536 6.98 9.68 10.21 0.51
API_E20 + 0 mg/L NaCl 27 525 399 6.97 9.92 7.60 0.40
API_E20 + 32 mg/L NaCl 27 525 488 6.97 9.66 9.30 0.45
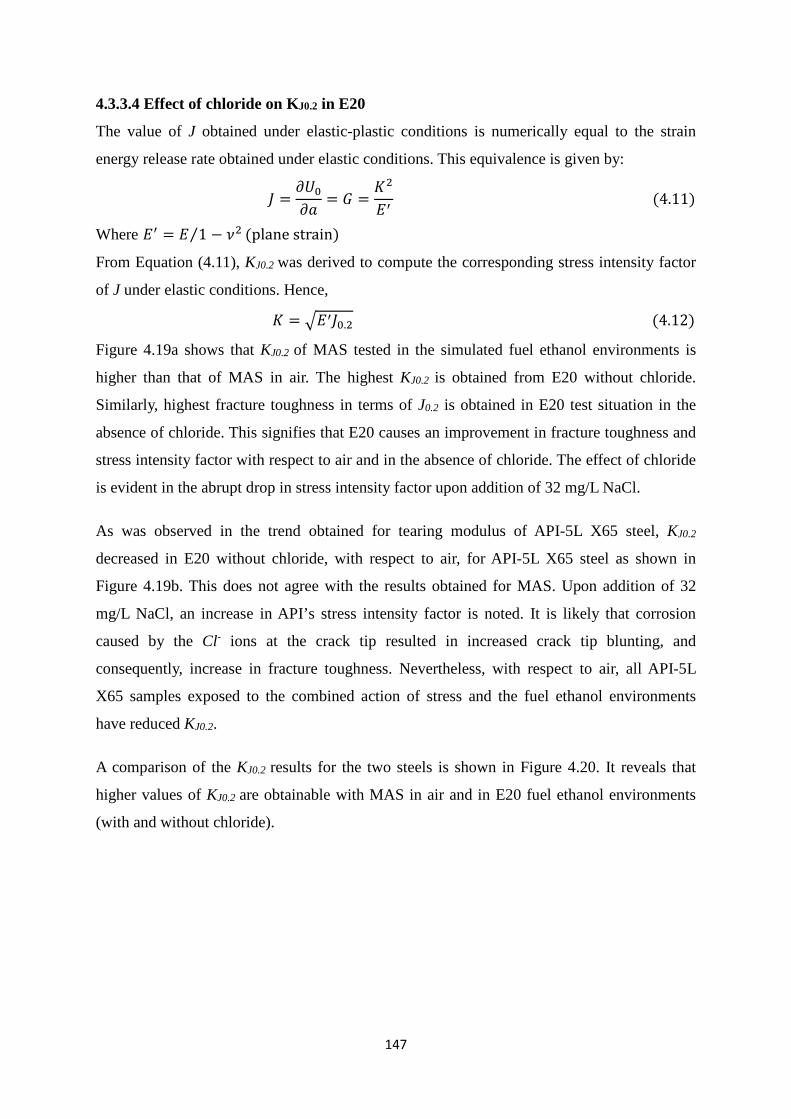
147
4.3.3.4 Effect of chloride on KJ0.2 in E20
The value of J obtained under elastic-plastic conditions is numerically equal to the strain
energy release rate obtained under elastic conditions. This equivalence is given by:
𝐽𝐽 =𝜕𝜕𝜕𝜕0𝜕𝜕𝑎𝑎
= 𝐺𝐺 =𝐾𝐾2
𝐸𝐸′ (4.11)
Where 𝐸𝐸′ = 𝐸𝐸 1 − 𝜈𝜈2⁄ (plane strain)
From Equation (4.11), KJ0.2 was derived to compute the corresponding stress intensity factor
of J under elastic conditions. Hence,
𝐾𝐾 = �𝐸𝐸′𝐽𝐽0.2 (4.12)
Figure 4.19a shows that KJ0.2 of MAS tested in the simulated fuel ethanol environments is
higher than that of MAS in air. The highest KJ0.2 is obtained from E20 without chloride.
Similarly, highest fracture toughness in terms of J0.2 is obtained in E20 test situation in the
absence of chloride. This signifies that E20 causes an improvement in fracture toughness and
stress intensity factor with respect to air and in the absence of chloride. The effect of chloride
is evident in the abrupt drop in stress intensity factor upon addition of 32 mg/L NaCl.
As was observed in the trend obtained for tearing modulus of API-5L X65 steel, KJ0.2
decreased in E20 without chloride, with respect to air, for API-5L X65 steel as shown in
Figure 4.19b. This does not agree with the results obtained for MAS. Upon addition of 32
mg/L NaCl, an increase in API’s stress intensity factor is noted. It is likely that corrosion
caused by the Cl- ions at the crack tip resulted in increased crack tip blunting, and
consequently, increase in fracture toughness. Nevertheless, with respect to air, all API-5L
X65 samples exposed to the combined action of stress and the fuel ethanol environments
have reduced KJ0.2.
A comparison of the KJ0.2 results for the two steels is shown in Figure 4.20. It reveals that
higher values of KJ0.2 are obtainable with MAS in air and in E20 fuel ethanol environments
(with and without chloride).
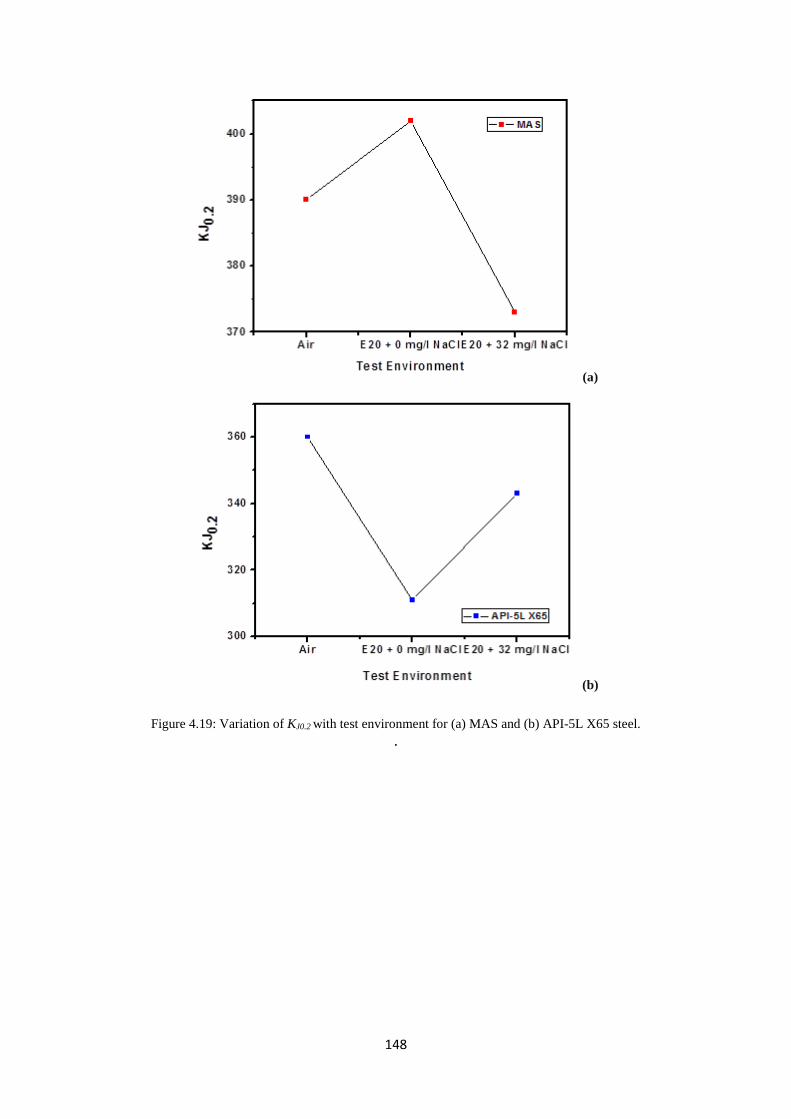
148
(a)
(b)
Figure 4.19: Variation of KJ0.2 with test environment for (a) MAS and (b) API-5L X65 steel. .
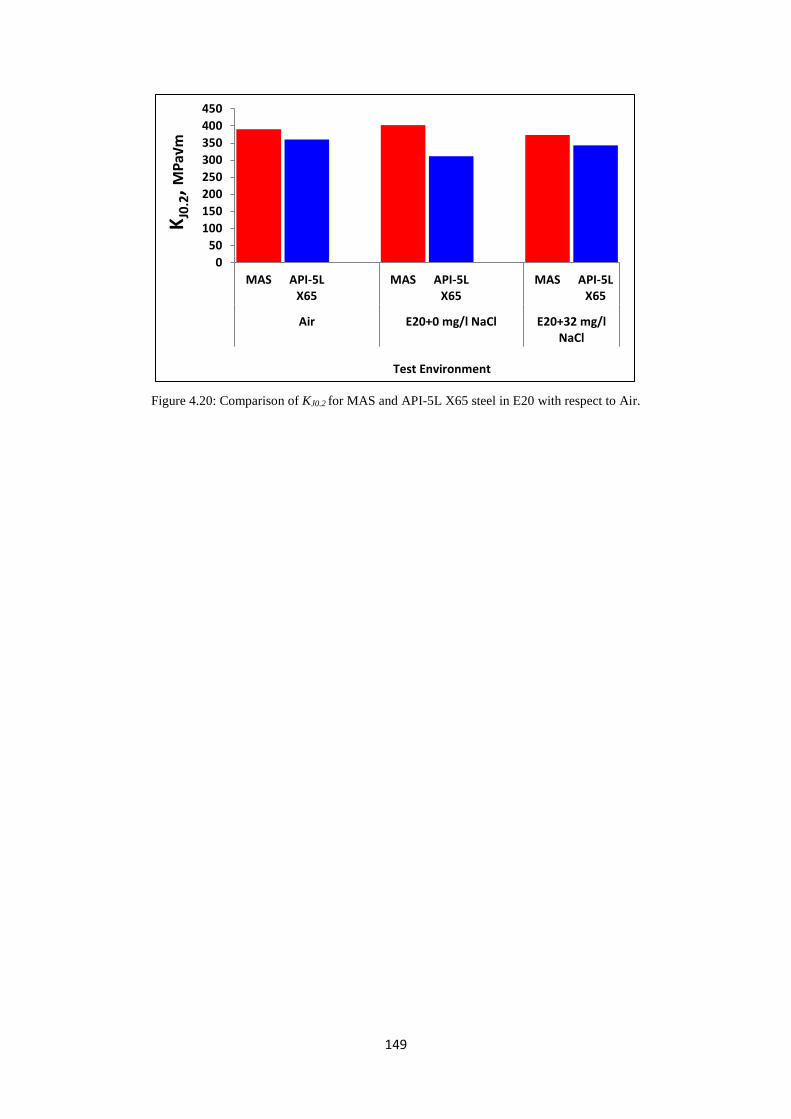
149
Figure 4.20: Comparison of KJ0.2 for MAS and API-5L X65 steel in E20 with respect to Air.
050
100150200250300350400450
MAS API-5LX65
MAS API-5LX65
MAS API-5LX65
Air E20+0 mg/l NaCl E20+32 mg/lNaCl
K J0.
2, MPa
√m
Test Environment
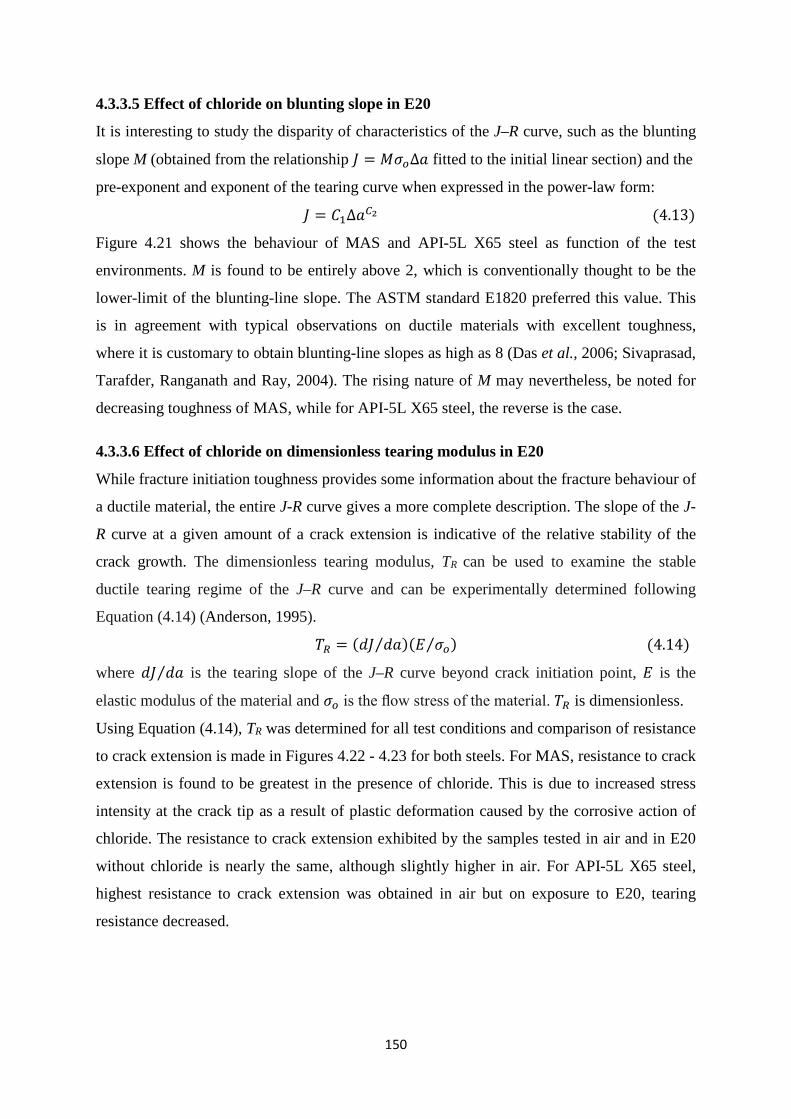
150
4.3.3.5 Effect of chloride on blunting slope in E20
It is interesting to study the disparity of characteristics of the J–R curve, such as the blunting
slope M (obtained from the relationship 𝐽𝐽 = 𝑀𝑀𝜎𝜎𝑜𝑜∆𝑎𝑎 fitted to the initial linear section) and the
pre-exponent and exponent of the tearing curve when expressed in the power-law form:
𝐽𝐽 = 𝐶𝐶1∆𝑎𝑎𝐶𝐶2 (4.13)
Figure 4.21 shows the behaviour of MAS and API-5L X65 steel as function of the test
environments. M is found to be entirely above 2, which is conventionally thought to be the
lower-limit of the blunting-line slope. The ASTM standard E1820 preferred this value. This
is in agreement with typical observations on ductile materials with excellent toughness,
where it is customary to obtain blunting-line slopes as high as 8 (Das et al., 2006; Sivaprasad,
Tarafder, Ranganath and Ray, 2004). The rising nature of M may nevertheless, be noted for
decreasing toughness of MAS, while for API-5L X65 steel, the reverse is the case.
4.3.3.6 Effect of chloride on dimensionless tearing modulus in E20
While fracture initiation toughness provides some information about the fracture behaviour of
a ductile material, the entire J-R curve gives a more complete description. The slope of the J-
R curve at a given amount of a crack extension is indicative of the relative stability of the
crack growth. The dimensionless tearing modulus, TR can be used to examine the stable
ductile tearing regime of the J–R curve and can be experimentally determined following
Equation (4.14) (Anderson, 1995).
𝑇𝑇𝑅𝑅 = (𝑑𝑑𝐽𝐽 𝑑𝑑𝑎𝑎⁄ )(𝐸𝐸 𝜎𝜎𝑜𝑜⁄ ) (4.14)
where 𝑑𝑑𝐽𝐽 𝑑𝑑𝑎𝑎⁄ is the tearing slope of the J–R curve beyond crack initiation point, 𝐸𝐸 is the
elastic modulus of the material and 𝜎𝜎𝑜𝑜 is the flow stress of the material. 𝑇𝑇𝑅𝑅 is dimensionless.
Using Equation (4.14), TR was determined for all test conditions and comparison of resistance
to crack extension is made in Figures 4.22 - 4.23 for both steels. For MAS, resistance to crack
extension is found to be greatest in the presence of chloride. This is due to increased stress
intensity at the crack tip as a result of plastic deformation caused by the corrosive action of
chloride. The resistance to crack extension exhibited by the samples tested in air and in E20
without chloride is nearly the same, although slightly higher in air. For API-5L X65 steel,
highest resistance to crack extension was obtained in air but on exposure to E20, tearing
resistance decreased.
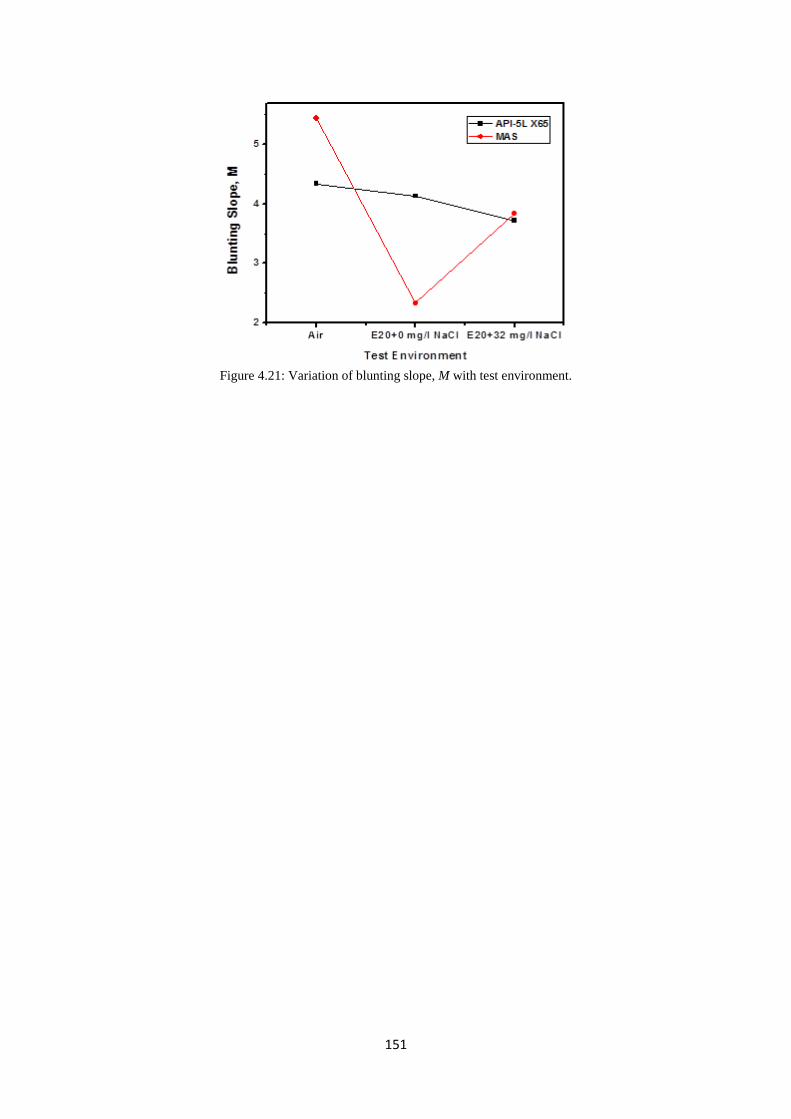
151
Figure 4.21: Variation of blunting slope, M with test environment.
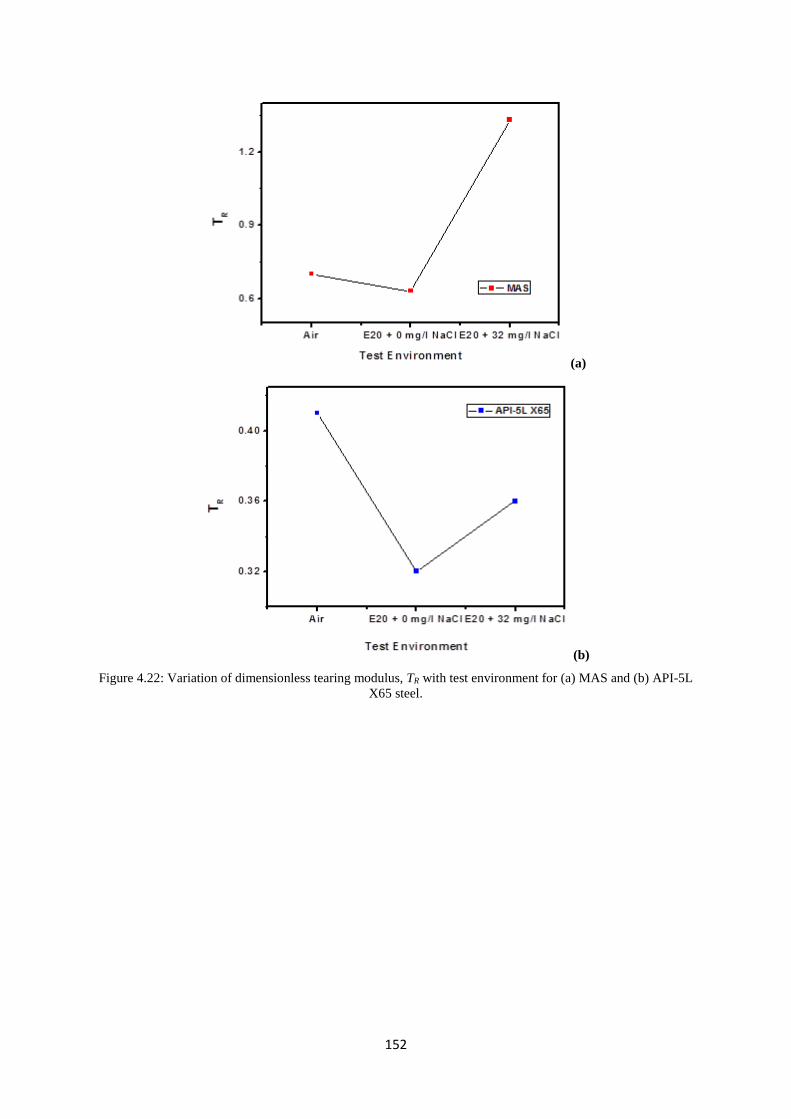
152
(a)
(b) Figure 4.22: Variation of dimensionless tearing modulus, TR with test environment for (a) MAS and (b) API-5L
X65 steel.
153
Figure 4.23: Comparison of TR for MAS and API-5L X65 steel in E20 with respect to air.
0
0.2
0.4
0.6
0.8
1
1.2
1.4
MAS API-5LX65
MAS API-5LX65
MAS API-5LX65
Air E20+0 mg/l NaCl E20+32 mg/l NaCl
Tear
ing
Mod
ulus
Test Environment
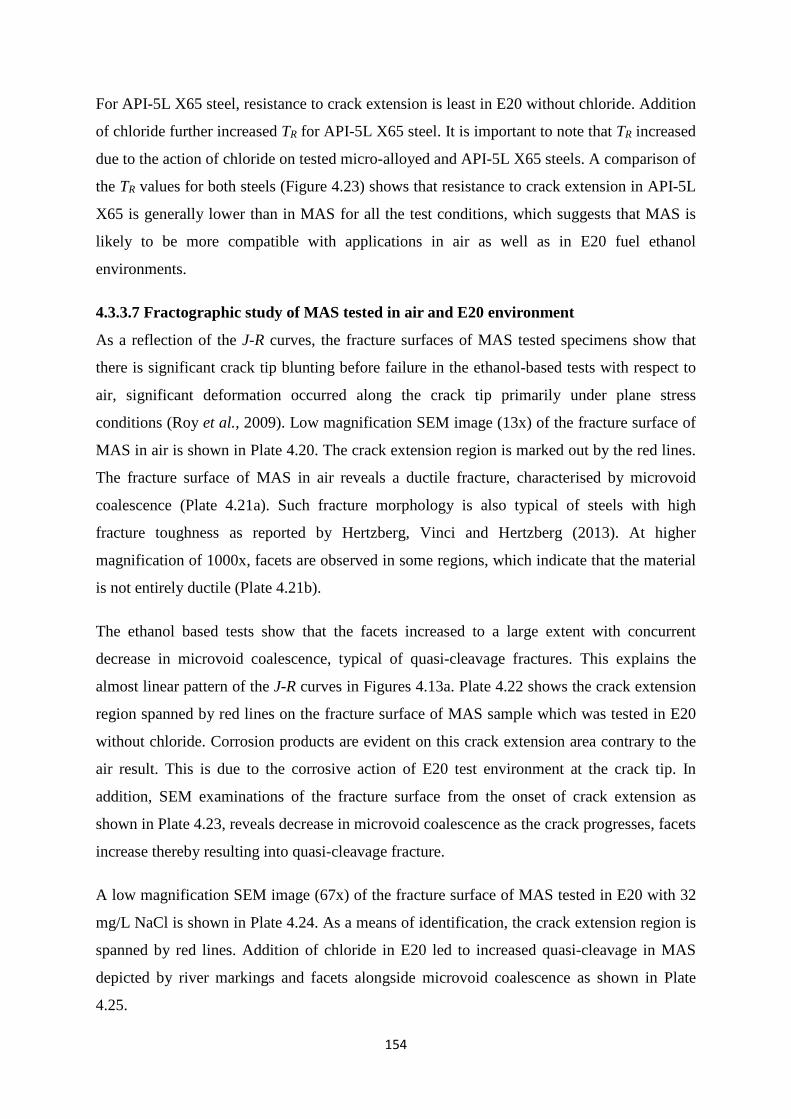
154
For API-5L X65 steel, resistance to crack extension is least in E20 without chloride. Addition
of chloride further increased TR for API-5L X65 steel. It is important to note that TR increased
due to the action of chloride on tested micro-alloyed and API-5L X65 steels. A comparison of
the TR values for both steels (Figure 4.23) shows that resistance to crack extension in API-5L
X65 is generally lower than in MAS for all the test conditions, which suggests that MAS is
likely to be more compatible with applications in air as well as in E20 fuel ethanol
environments.
4.3.3.7 Fractographic study of MAS tested in air and E20 environment
As a reflection of the J-R curves, the fracture surfaces of MAS tested specimens show that
there is significant crack tip blunting before failure in the ethanol-based tests with respect to
air, significant deformation occurred along the crack tip primarily under plane stress
conditions (Roy et al., 2009). Low magnification SEM image (13x) of the fracture surface of
MAS in air is shown in Plate 4.20. The crack extension region is marked out by the red lines.
The fracture surface of MAS in air reveals a ductile fracture, characterised by microvoid
coalescence (Plate 4.21a). Such fracture morphology is also typical of steels with high
fracture toughness as reported by Hertzberg, Vinci and Hertzberg (2013). At higher
magnification of 1000x, facets are observed in some regions, which indicate that the material
is not entirely ductile (Plate 4.21b).
The ethanol based tests show that the facets increased to a large extent with concurrent
decrease in microvoid coalescence, typical of quasi-cleavage fractures. This explains the
almost linear pattern of the J-R curves in Figures 4.13a. Plate 4.22 shows the crack extension
region spanned by red lines on the fracture surface of MAS sample which was tested in E20
without chloride. Corrosion products are evident on this crack extension area contrary to the
air result. This is due to the corrosive action of E20 test environment at the crack tip. In
addition, SEM examinations of the fracture surface from the onset of crack extension as
shown in Plate 4.23, reveals decrease in microvoid coalescence as the crack progresses, facets
increase thereby resulting into quasi-cleavage fracture.
A low magnification SEM image (67x) of the fracture surface of MAS tested in E20 with 32
mg/L NaCl is shown in Plate 4.24. As a means of identification, the crack extension region is
spanned by red lines. Addition of chloride in E20 led to increased quasi-cleavage in MAS
depicted by river markings and facets alongside microvoid coalescence as shown in Plate
4.25.
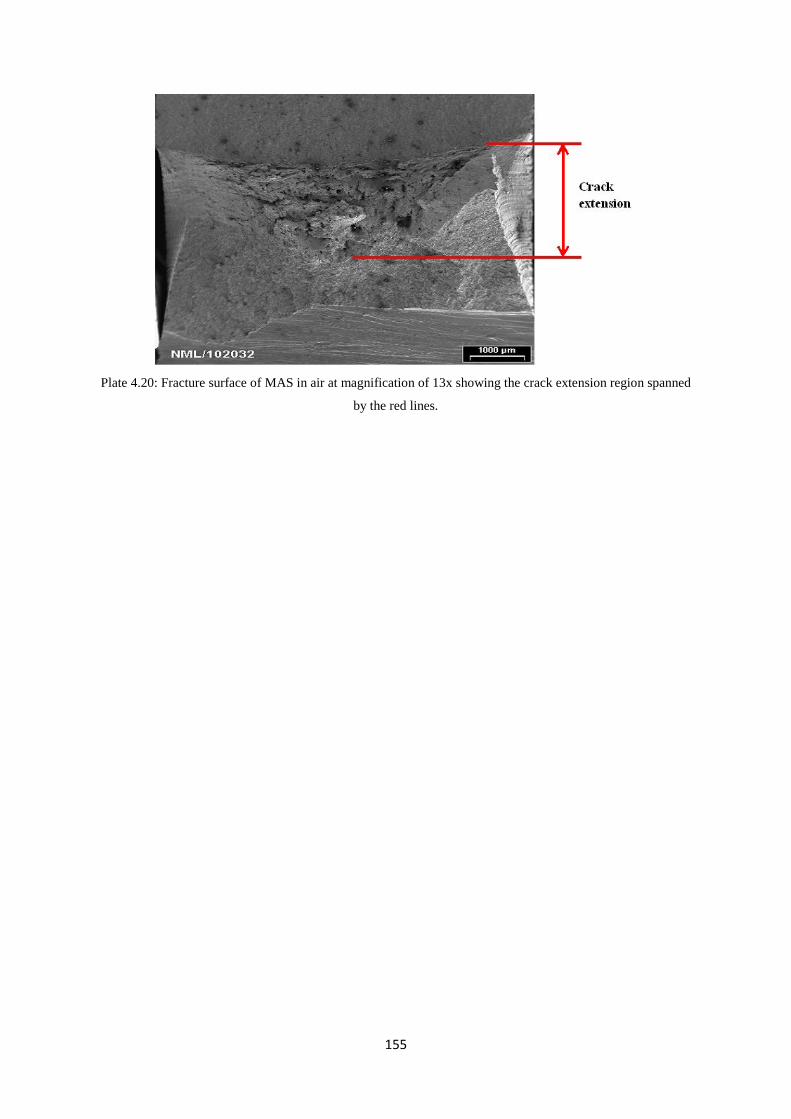
155
Plate 4.20: Fracture surface of MAS in air at magnification of 13x showing the crack extension region spanned
by the red lines.

156
(a)
(b)
Plate 4.21: Fracture surface of MAS in air at magnification of a) 500x showing microvoid coalescence and b)
1000x showing microvoid coalescence and facets at regions spanned within the arrows. Red arrow indicates
facets while blue arrow indicates microvoid coalescence.
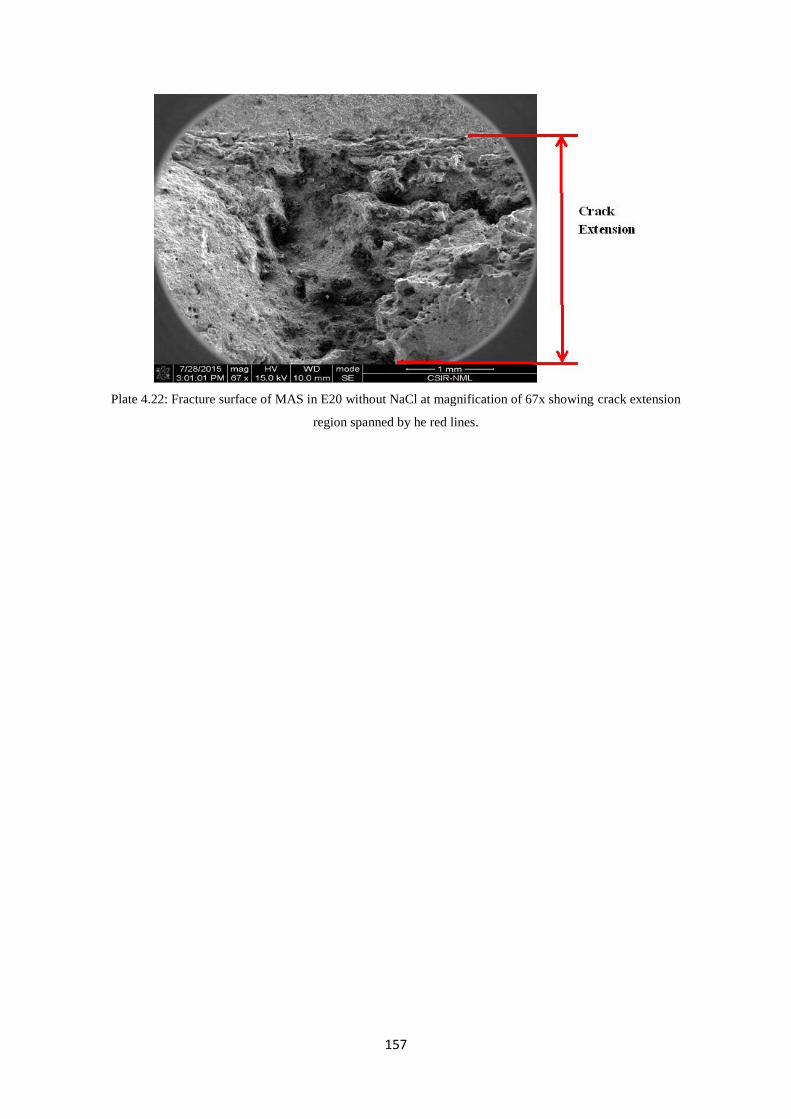
157
Plate 4.22: Fracture surface of MAS in E20 without NaCl at magnification of 67x showing crack extension
region spanned by he red lines.
158
(a)
(b)
Plate 4.23: Fracture surface of MAS in E20 without NaCl at magnification of 2000x showing quasi-cleavage
fracture from SEM images taken (a) at onset of crack extension and (b) within the crack extension area.
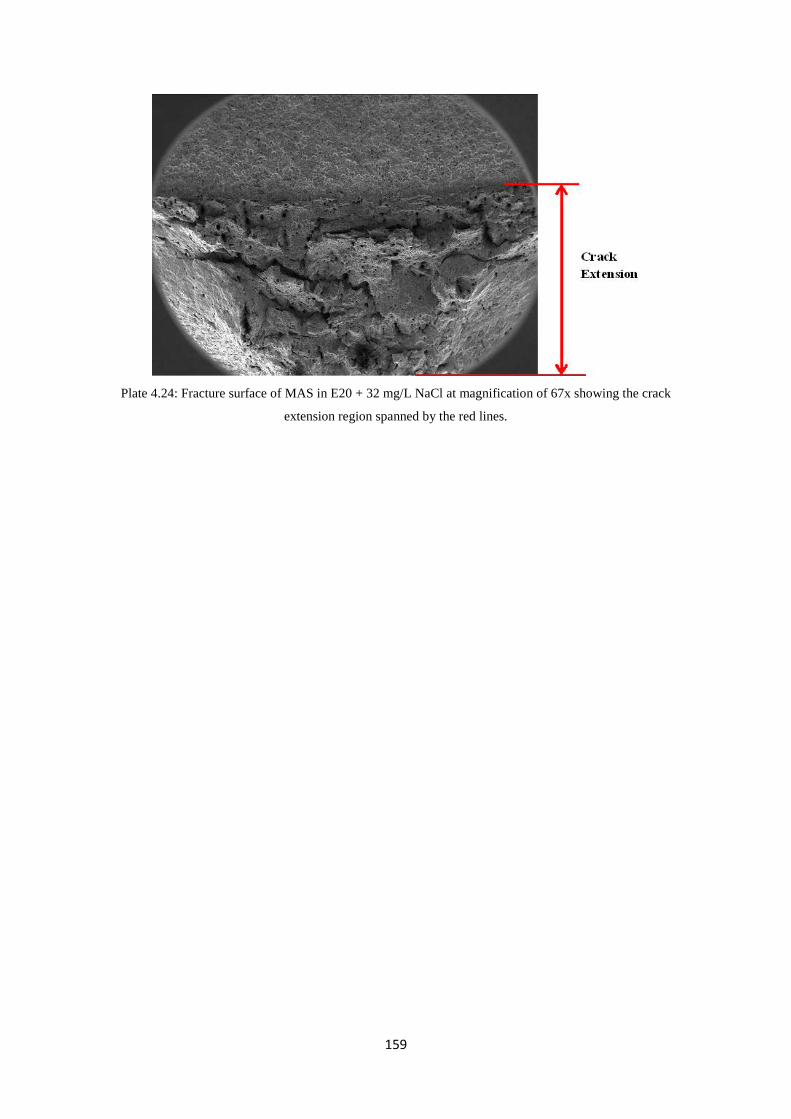
159
Plate 4.24: Fracture surface of MAS in E20 + 32 mg/L NaCl at magnification of 67x showing the crack
extension region spanned by the red lines.

160
(a)
(b)
Plate 4.25: Fracture surface of MAS in E20 + 32 mg/L NaCl at magnification of a) 1000x showing quasi-
cleavage fracture; b) 2000x showing some ferrite phases (indicated by red arrows), which signifies that there
was ferrite dissolution.
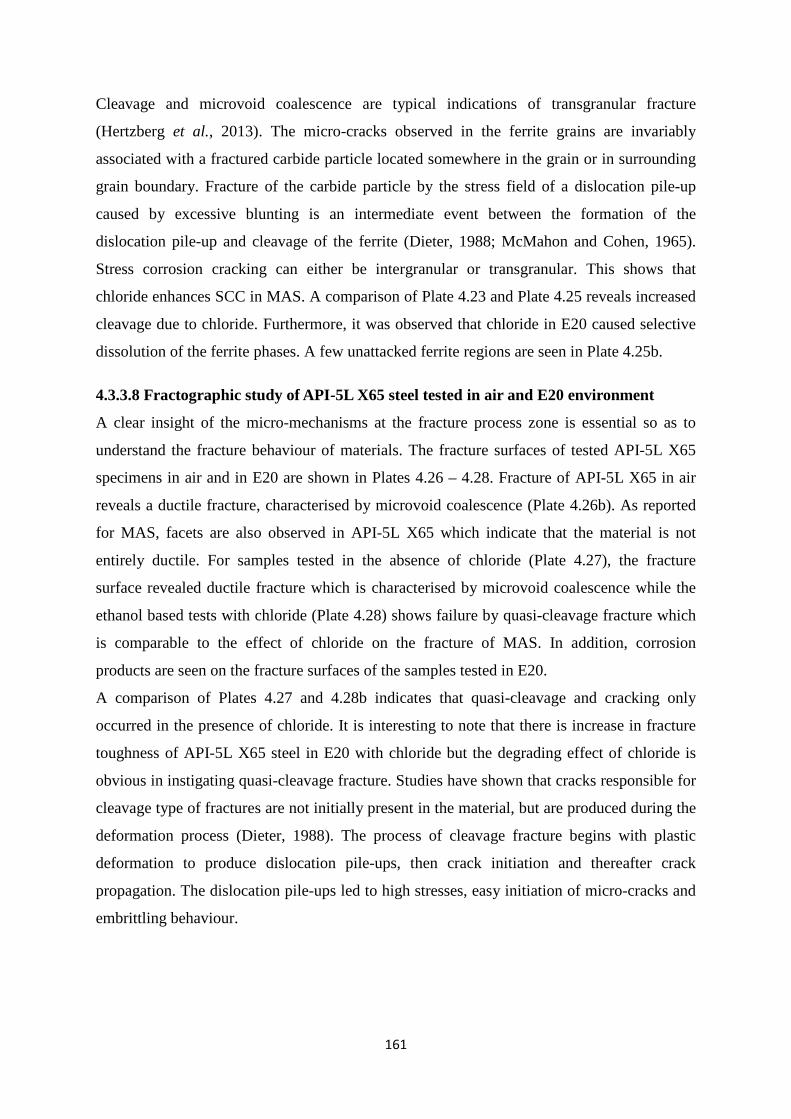
161
Cleavage and microvoid coalescence are typical indications of transgranular fracture
(Hertzberg et al., 2013). The micro-cracks observed in the ferrite grains are invariably
associated with a fractured carbide particle located somewhere in the grain or in surrounding
grain boundary. Fracture of the carbide particle by the stress field of a dislocation pile-up
caused by excessive blunting is an intermediate event between the formation of the
dislocation pile-up and cleavage of the ferrite (Dieter, 1988; McMahon and Cohen, 1965).
Stress corrosion cracking can either be intergranular or transgranular. This shows that
chloride enhances SCC in MAS. A comparison of Plate 4.23 and Plate 4.25 reveals increased
cleavage due to chloride. Furthermore, it was observed that chloride in E20 caused selective
dissolution of the ferrite phases. A few unattacked ferrite regions are seen in Plate 4.25b.
4.3.3.8 Fractographic study of API-5L X65 steel tested in air and E20 environment
A clear insight of the micro-mechanisms at the fracture process zone is essential so as to
understand the fracture behaviour of materials. The fracture surfaces of tested API-5L X65
specimens in air and in E20 are shown in Plates 4.26 – 4.28. Fracture of API-5L X65 in air
reveals a ductile fracture, characterised by microvoid coalescence (Plate 4.26b). As reported
for MAS, facets are also observed in API-5L X65 which indicate that the material is not
entirely ductile. For samples tested in the absence of chloride (Plate 4.27), the fracture
surface revealed ductile fracture which is characterised by microvoid coalescence while the
ethanol based tests with chloride (Plate 4.28) shows failure by quasi-cleavage fracture which
is comparable to the effect of chloride on the fracture of MAS. In addition, corrosion
products are seen on the fracture surfaces of the samples tested in E20.
A comparison of Plates 4.27 and 4.28b indicates that quasi-cleavage and cracking only
occurred in the presence of chloride. It is interesting to note that there is increase in fracture
toughness of API-5L X65 steel in E20 with chloride but the degrading effect of chloride is
obvious in instigating quasi-cleavage fracture. Studies have shown that cracks responsible for
cleavage type of fractures are not initially present in the material, but are produced during the
deformation process (Dieter, 1988). The process of cleavage fracture begins with plastic
deformation to produce dislocation pile-ups, then crack initiation and thereafter crack
propagation. The dislocation pile-ups led to high stresses, easy initiation of micro-cracks and
embrittling behaviour.
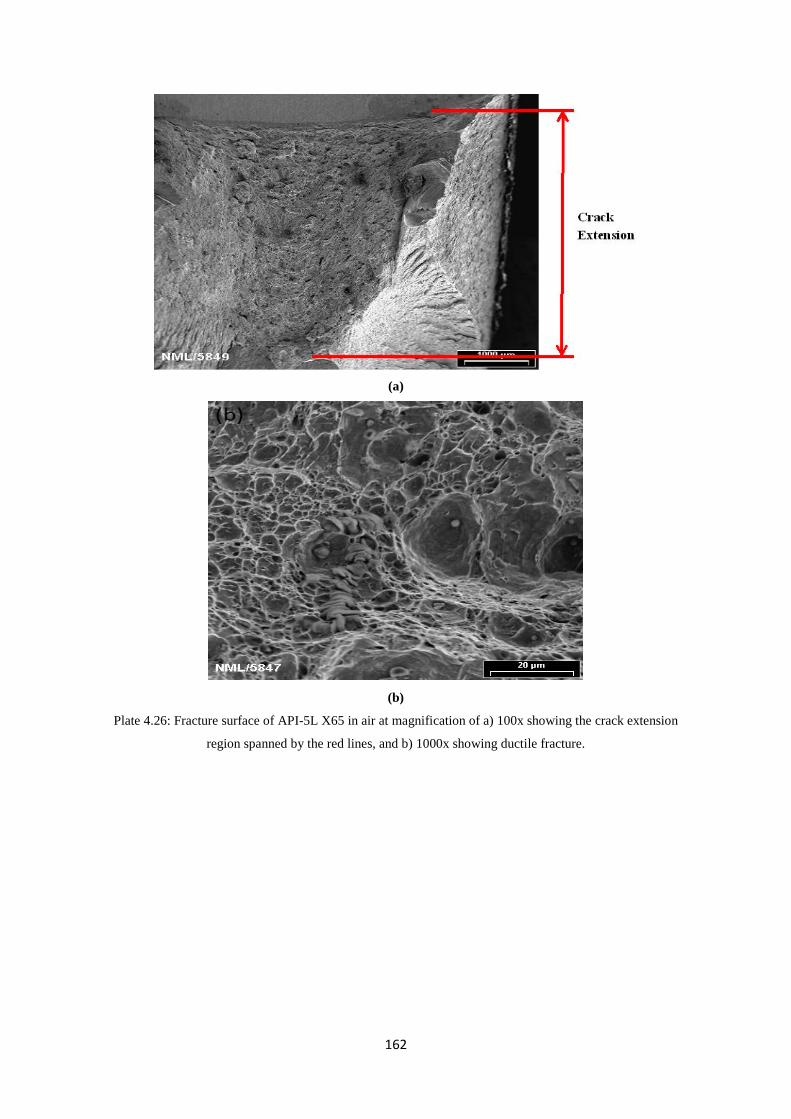
162
(a)
(b)
Plate 4.26: Fracture surface of API-5L X65 in air at magnification of a) 100x showing the crack extension
region spanned by the red lines, and b) 1000x showing ductile fracture.
163
Plate 4.27: Fracture surface of API-5L X65 in E20 with zero chloride at magnification of 500x showing ductile
fracture and presence of corrosion products.
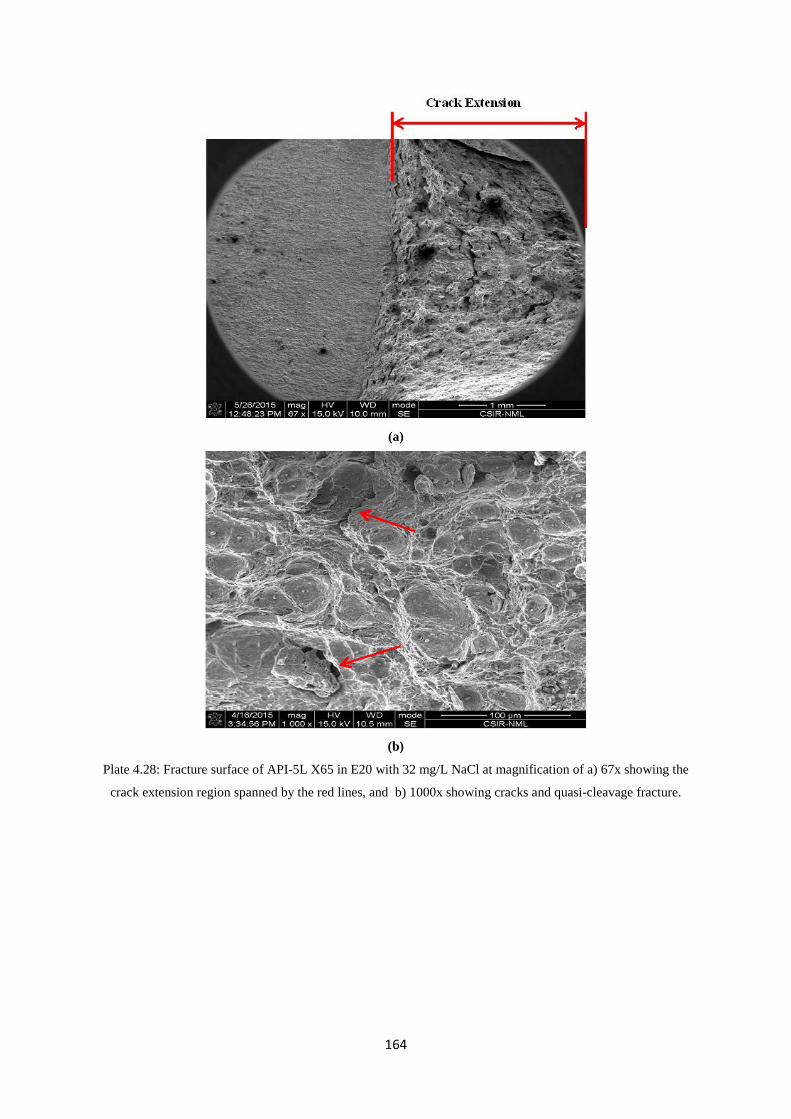
164
(a)
(b)
Plate 4.28: Fracture surface of API-5L X65 in E20 with 32 mg/L NaCl at magnification of a) 67x showing the
crack extension region spanned by the red lines, and b) 1000x showing cracks and quasi-cleavage fracture.
165
4.3.3.9 Summary
The significant results obtained from this investigation lead to the following major
conclusions:
1. The tensile properties of the two steels in the undeformed condition reveals that API-
5L X65 steel possesses higher strength properties and concurrently lower ductility
properties in comparison to micro-alloyed steel. API-5L X65 exhibits yield strength
that is 60% higher than that of MAS.
2. The two materials exhibited significant plastic deformation and substantial deviation
from the elastic loading line as they were stressed.
3. There is significant decrease in fracture resistance of both micro-alloyed and API-5L
X65 steels in E20 fuel ethanol environment compared to that in air. There is an
exception of improved fracture resistance in E20 compared to that in air for MAS in
E20 without chloride.
4. Fracture toughness (J0.2, Ji, and KJ0.2) of MAS decreased in the presence of NaCl but
increased for API steel. Chloride resulted in increased resistance to ductile tearing for
both steels leading to transgranular fracture.
5. Consideration of the selected specimen thickness and the estimated σo and J0.2 values
obtained for API-5L X65 and MAS specimens indicates that J0.2 is not qualified to be
termed as JIC. This means that the fracture toughness values are size dependent and
therefore amenable to comparisons only with specimens of similar size.
6. The rising nature of M was noted for decreasing toughness of MAS whereas for API-
5L X65 steel, the reverse was the case.
7. Failure mode of both micro-alloyed and API-5L X65 steels in air is ductile fracture
indicated by microvoid coalescence.
8. In E20 without chloride, the failure mode of MAS is transgranular fracture while that
of API-5L X65 steel is ductile fracture.
9. In E20 with 32 mg/L NaCl, the failure mode of MAS is transgranular fracture with
increased cleavage while API-5L X65 steel shows micro-cracks in addition to quasi-
cleavage.
166
4.3.4 Effect of Chloride on Fracture Behaviour in E80 Environment
Having investigated the effect of chloride concentration on MAS and API-5L X65 steel in
simulated E20, this section is focused on investigations pertaining to the effect of NaCl on the
fracture behaviour of micro-alloyed and API-5L X65 steels in E80 fuel ethanol environment.
The choice of the ethanol concentration is aimed at investigating two extreme cases of fuel
ethanol environment. Similar procedures used in E20 are also applied here. Tests were
carried out in air, E80 + 0 mg/L NaCl and E80 + 32 mg/L NaCl. The aim is to investigate the
influence of chloride on the materials’ behaviour with reference to air. Therefore, as in E20,
the effect of chloride on the load versus load-line displacements, the J-R curves, fracture
toughness, tearing modulus and KJ0.2 values in E80 are investigated with reference to air.
4.3.4.1 Effect of chloride on the load-displacement plots in E80
Monotonic J-R tests were carried out using single specimen technique according to the
guidelines of ASTM standard E-1820 (ASTM, 2008). Typical load (P) versus load line
displacement (V) plots generated from the test data after completing the J-integral tests for
the two steels are shown in Figures 4.24 and 4.25. In all test situations with and without
chloride, the maximum load attained is less than maximum load for the reference air test. As
expected, there are variations in the maximum load (Pmax) versus displacement values
obtained for crack length calculations in each test situation. An explanation for this is the
difference in the composition of the test solutions. Concurrent with the dissimilarity between
the tensile properties of MAS and API-5L X65 steel, their fracture characteristics were found
to be different in E80 fuel ethanol environment. In Figure 4.24, it is observed that the two
materials exhibited significant plastic deformation and substantial deviation from the elastic
loading line as they were stressed.
Furthermore, a comparison of the load versus load-line displacement plots for the materials
show substantial stretching at maximum load before load drop in the cases with MAS. This is
indicative of high toughness associated with low strength and high ductility of MAS.
Furthermore, it should be pointed out that the presence of chloride in E80 did not seem to
have any significant effect on the load-displacement plots of MAS since the curves are
superimposed on each other. Nevertheless a close look at the superimposed curves shows
MAS in E80 without chloride slightly higher than MAS in E80 with 32 mg/L NaCl. On the
other hand, for API-5L X65 steel, there is distinct decreasing Pmax with changes in the test
environment from: Air → E80 + 0 mg/L NaCl → E80 + 32 mg/L NaCl.
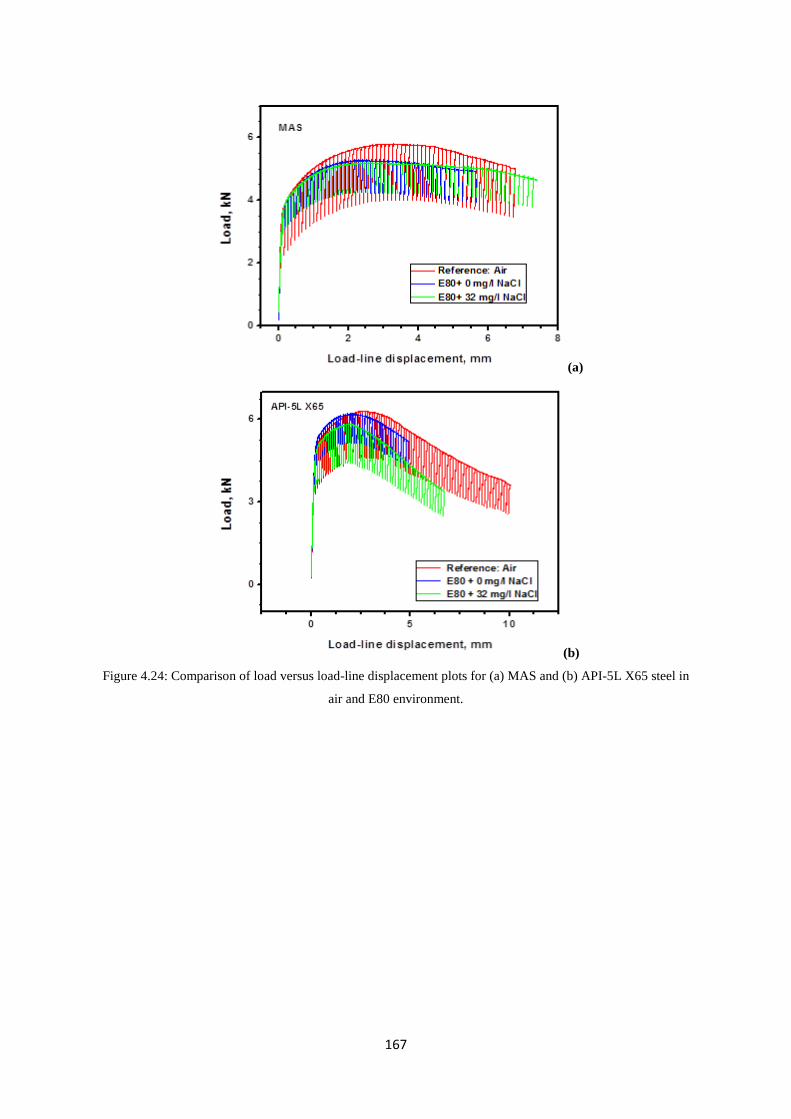
167
(a)
(b) Figure 4.24: Comparison of load versus load-line displacement plots for (a) MAS and (b) API-5L X65 steel in
air and E80 environment.
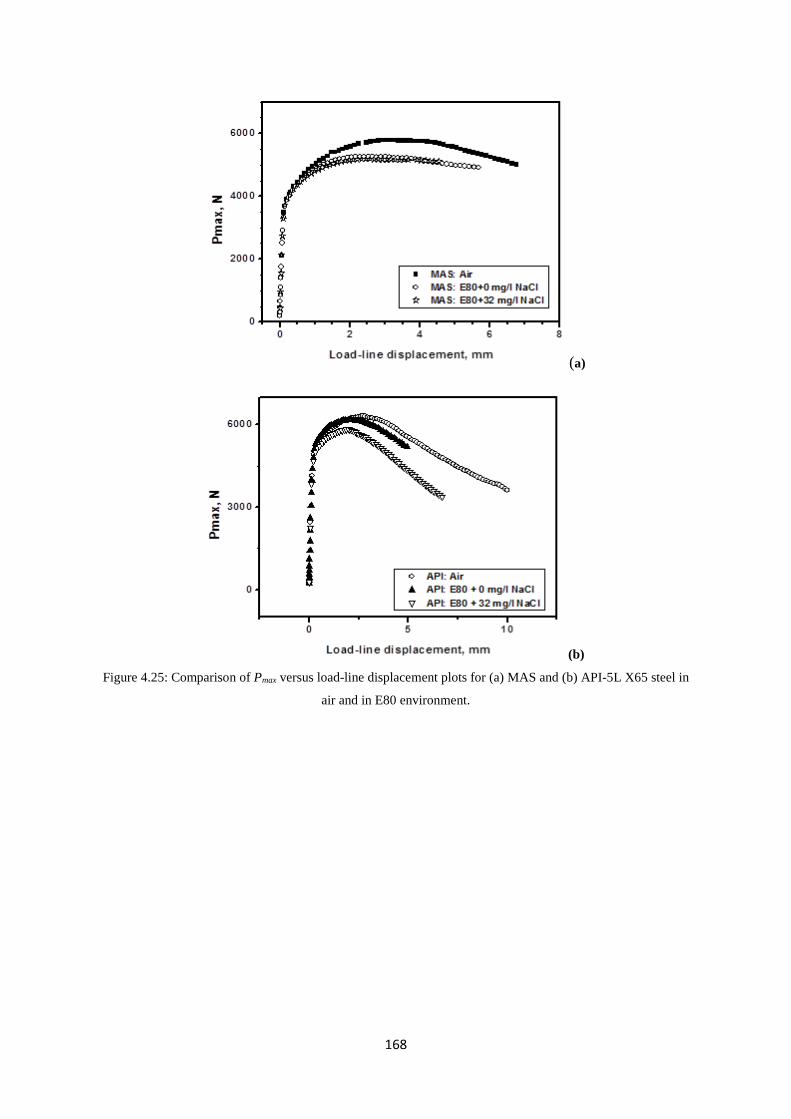
168
(a)
(b) Figure 4.25: Comparison of Pmax versus load-line displacement plots for (a) MAS and (b) API-5L X65 steel in
air and in E80 environment.
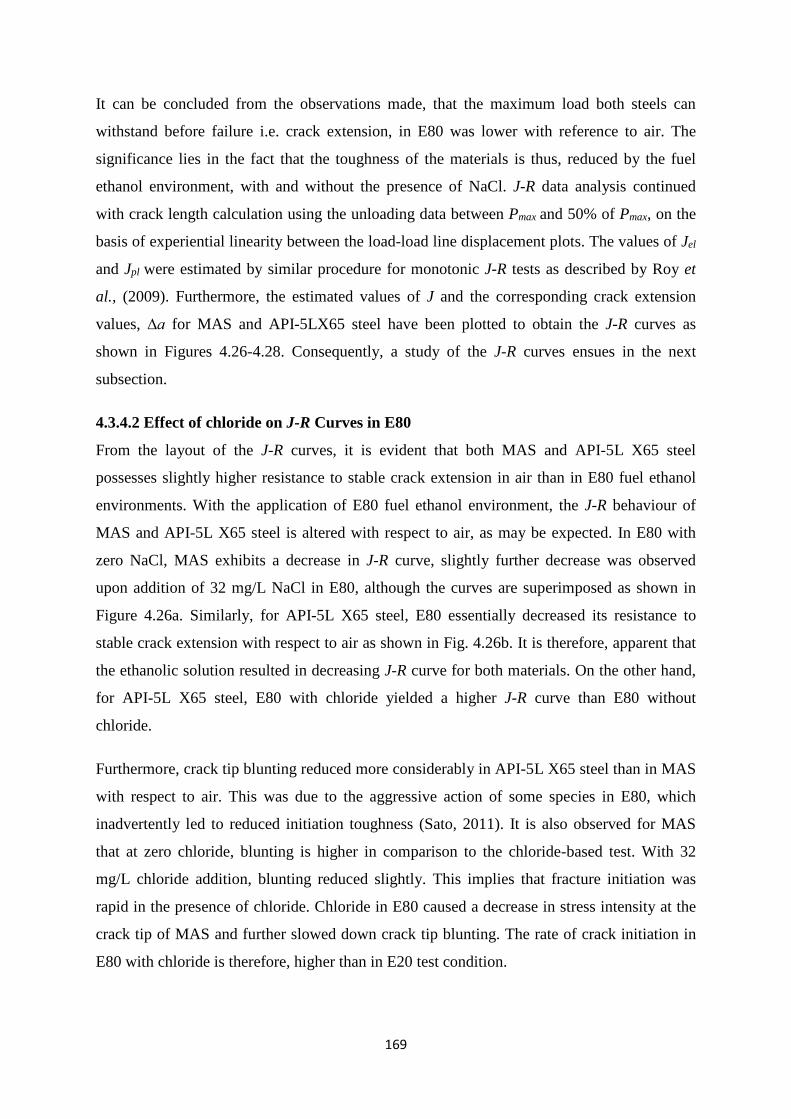
169
It can be concluded from the observations made, that the maximum load both steels can
withstand before failure i.e. crack extension, in E80 was lower with reference to air. The
significance lies in the fact that the toughness of the materials is thus, reduced by the fuel
ethanol environment, with and without the presence of NaCl. J-R data analysis continued
with crack length calculation using the unloading data between Pmax and 50% of Pmax, on the
basis of experiential linearity between the load-load line displacement plots. The values of Jel
and Jpl were estimated by similar procedure for monotonic J-R tests as described by Roy et
al., (2009). Furthermore, the estimated values of J and the corresponding crack extension
values, ∆a for MAS and API-5LX65 steel have been plotted to obtain the J-R curves as
shown in Figures 4.26-4.28. Consequently, a study of the J-R curves ensues in the next
subsection.
4.3.4.2 Effect of chloride on J-R Curves in E80
From the layout of the J-R curves, it is evident that both MAS and API-5L X65 steel
possesses slightly higher resistance to stable crack extension in air than in E80 fuel ethanol
environments. With the application of E80 fuel ethanol environment, the J-R behaviour of
MAS and API-5L X65 steel is altered with respect to air, as may be expected. In E80 with
zero NaCl, MAS exhibits a decrease in J-R curve, slightly further decrease was observed
upon addition of 32 mg/L NaCl in E80, although the curves are superimposed as shown in
Figure 4.26a. Similarly, for API-5L X65 steel, E80 essentially decreased its resistance to
stable crack extension with respect to air as shown in Fig. 4.26b. It is therefore, apparent that
the ethanolic solution resulted in decreasing J-R curve for both materials. On the other hand,
for API-5L X65 steel, E80 with chloride yielded a higher J-R curve than E80 without
chloride.
Furthermore, crack tip blunting reduced more considerably in API-5L X65 steel than in MAS
with respect to air. This was due to the aggressive action of some species in E80, which
inadvertently led to reduced initiation toughness (Sato, 2011). It is also observed for MAS
that at zero chloride, blunting is higher in comparison to the chloride-based test. With 32
mg/L chloride addition, blunting reduced slightly. This implies that fracture initiation was
rapid in the presence of chloride. Chloride in E80 caused a decrease in stress intensity at the
crack tip of MAS and further slowed down crack tip blunting. The rate of crack initiation in
E80 with chloride is therefore, higher than in E20 test condition.
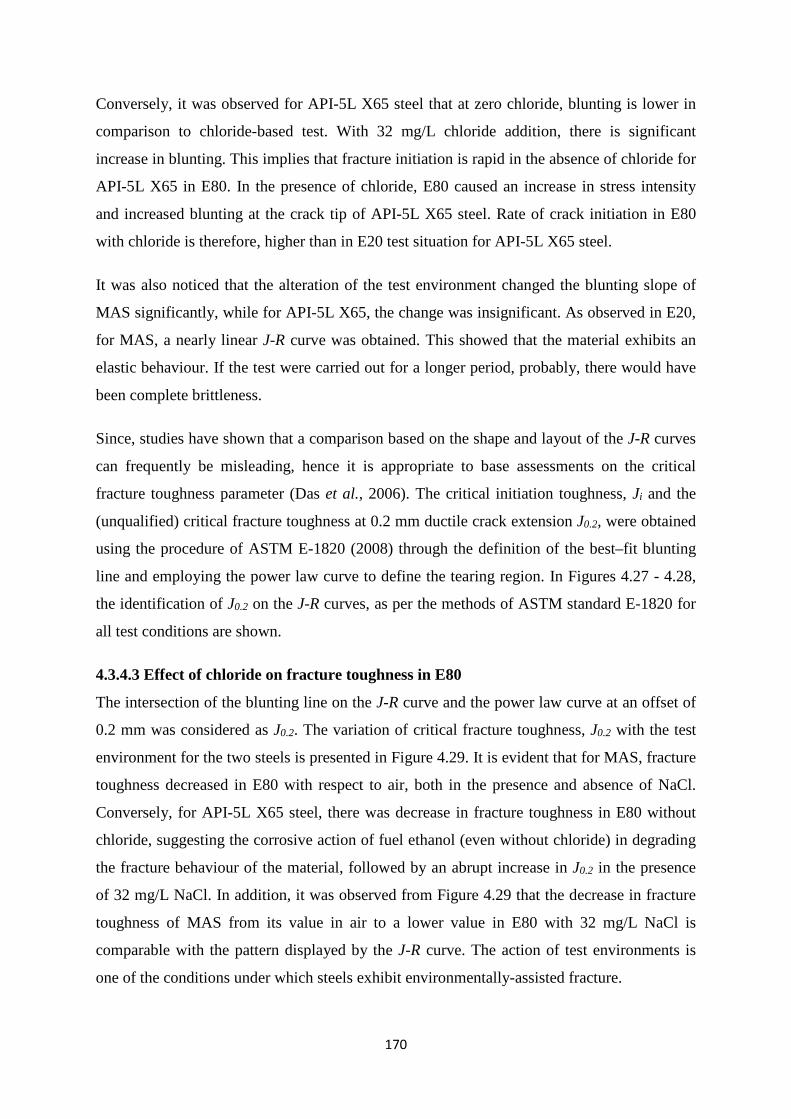
170
Conversely, it was observed for API-5L X65 steel that at zero chloride, blunting is lower in
comparison to chloride-based test. With 32 mg/L chloride addition, there is significant
increase in blunting. This implies that fracture initiation is rapid in the absence of chloride for
API-5L X65 in E80. In the presence of chloride, E80 caused an increase in stress intensity
and increased blunting at the crack tip of API-5L X65 steel. Rate of crack initiation in E80
with chloride is therefore, higher than in E20 test situation for API-5L X65 steel.
It was also noticed that the alteration of the test environment changed the blunting slope of
MAS significantly, while for API-5L X65, the change was insignificant. As observed in E20,
for MAS, a nearly linear J-R curve was obtained. This showed that the material exhibits an
elastic behaviour. If the test were carried out for a longer period, probably, there would have
been complete brittleness.
Since, studies have shown that a comparison based on the shape and layout of the J-R curves
can frequently be misleading, hence it is appropriate to base assessments on the critical
fracture toughness parameter (Das et al., 2006). The critical initiation toughness, Ji and the
(unqualified) critical fracture toughness at 0.2 mm ductile crack extension J0.2, were obtained
using the procedure of ASTM E-1820 (2008) through the definition of the best–fit blunting
line and employing the power law curve to define the tearing region. In Figures 4.27 - 4.28,
the identification of J0.2 on the J-R curves, as per the methods of ASTM standard E-1820 for
all test conditions are shown.
4.3.4.3 Effect of chloride on fracture toughness in E80
The intersection of the blunting line on the J-R curve and the power law curve at an offset of
0.2 mm was considered as J0.2. The variation of critical fracture toughness, J0.2 with the test
environment for the two steels is presented in Figure 4.29. It is evident that for MAS, fracture
toughness decreased in E80 with respect to air, both in the presence and absence of NaCl.
Conversely, for API-5L X65 steel, there was decrease in fracture toughness in E80 without
chloride, suggesting the corrosive action of fuel ethanol (even without chloride) in degrading
the fracture behaviour of the material, followed by an abrupt increase in J0.2 in the presence
of 32 mg/L NaCl. In addition, it was observed from Figure 4.29 that the decrease in fracture
toughness of MAS from its value in air to a lower value in E80 with 32 mg/L NaCl is
comparable with the pattern displayed by the J-R curve. The action of test environments is
one of the conditions under which steels exhibit environmentally-assisted fracture.
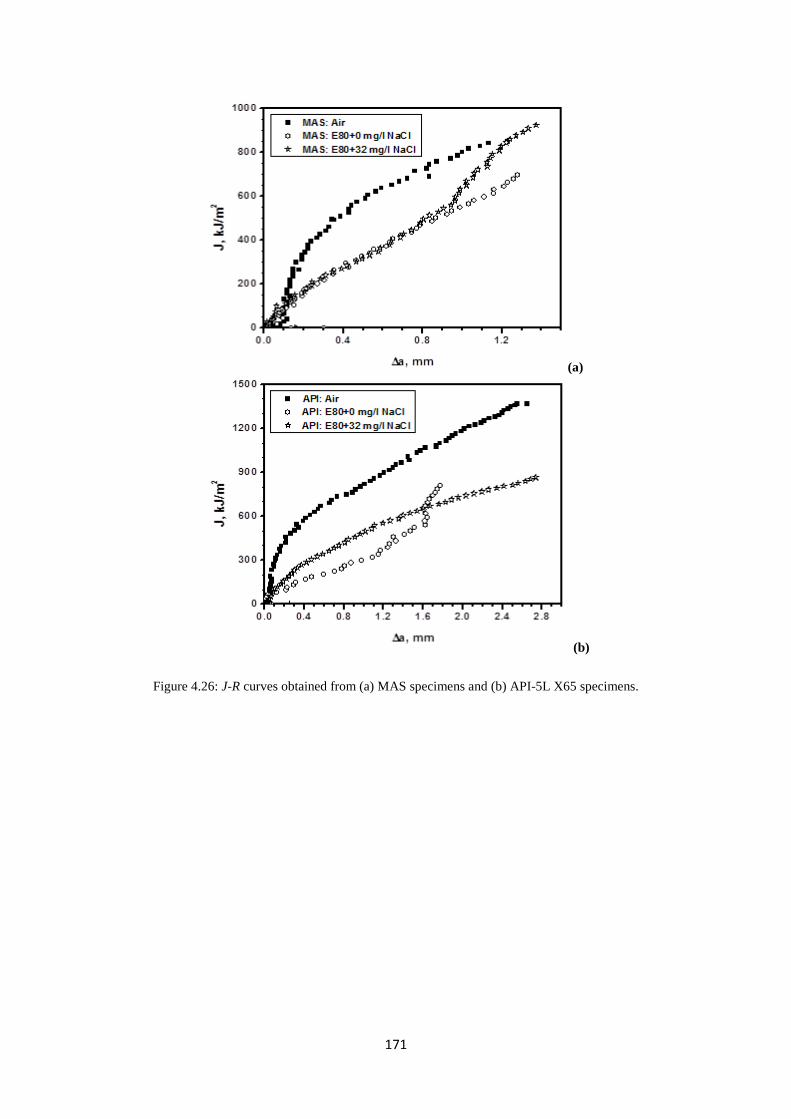
171
(a)
(b)
Figure 4.26: J-R curves obtained from (a) MAS specimens and (b) API-5L X65 specimens.
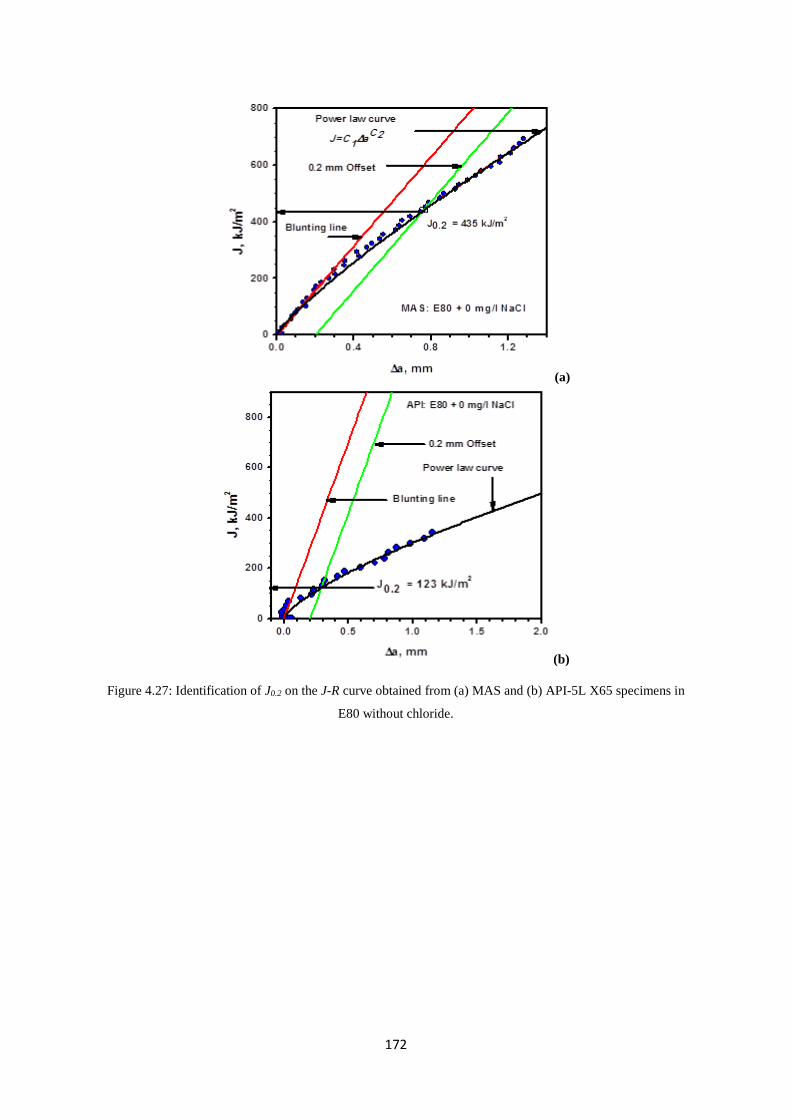
172
(a)
(b)
Figure 4.27: Identification of J0.2 on the J-R curve obtained from (a) MAS and (b) API-5L X65 specimens in
E80 without chloride.
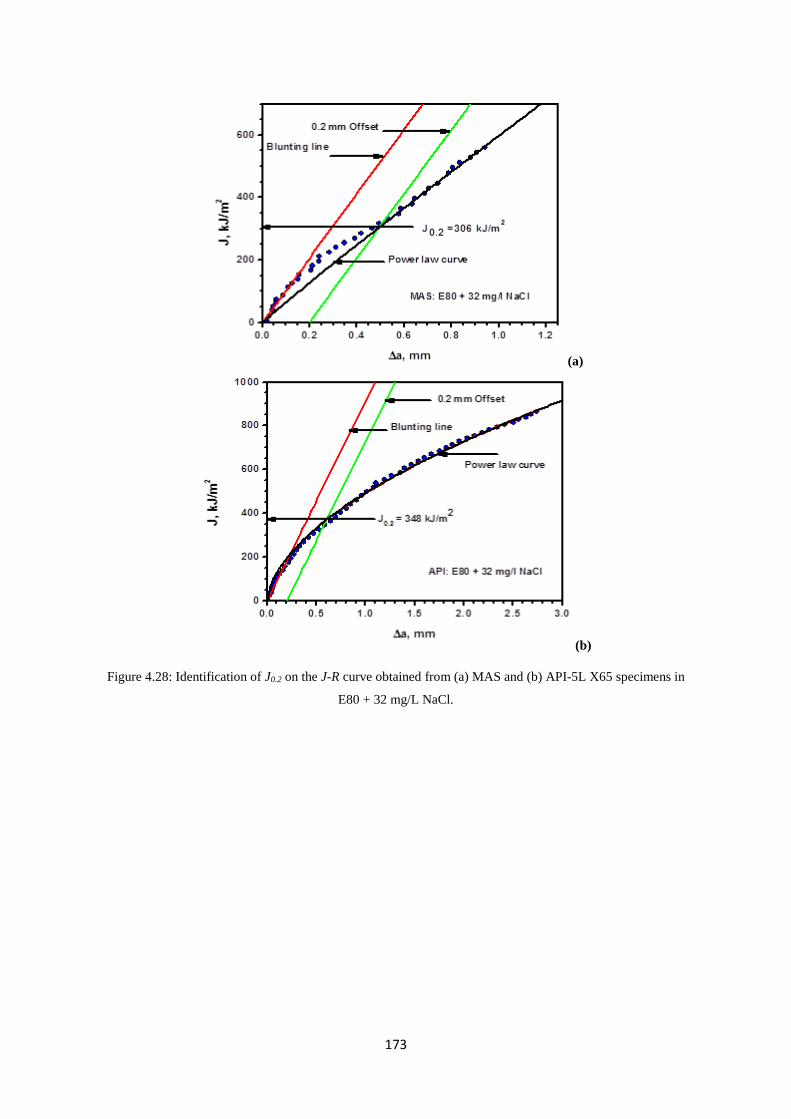
173
(a)
(b)
Figure 4.28: Identification of J0.2 on the J-R curve obtained from (a) MAS and (b) API-5L X65 specimens in
E80 + 32 mg/L NaCl.

174
Figure 4.29: Variation of critical fracture toughness J0.2 with test environment.
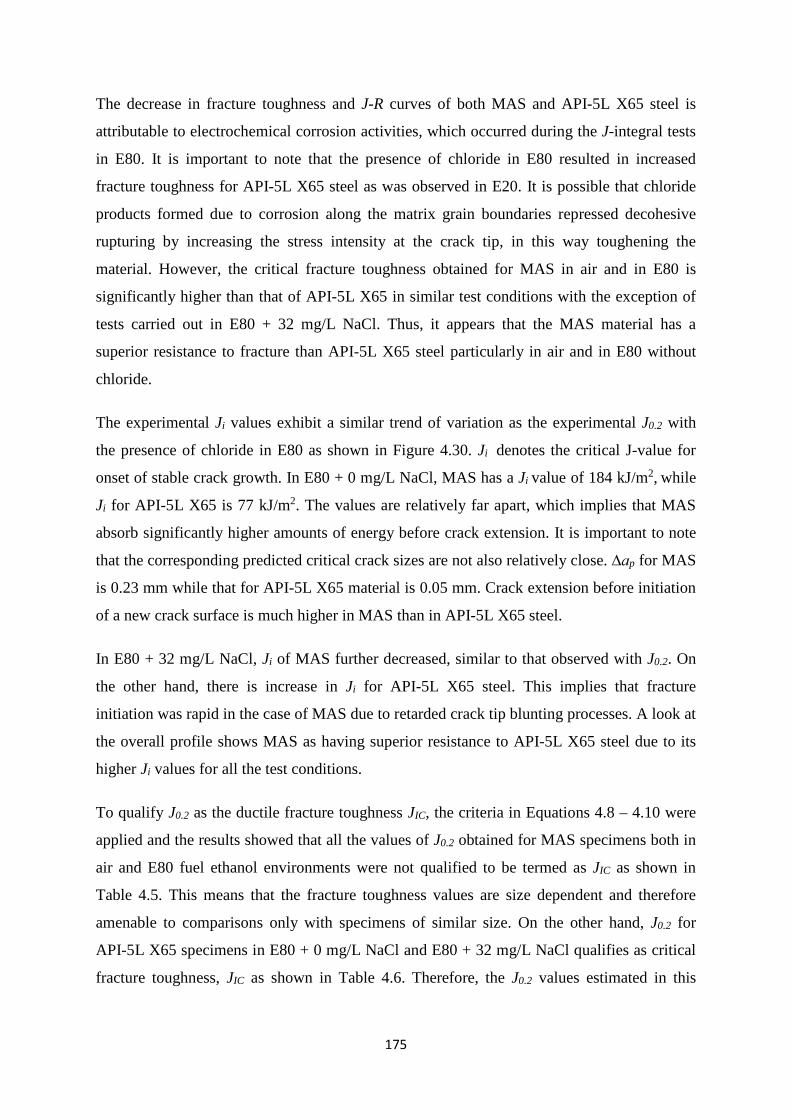
175
The decrease in fracture toughness and J-R curves of both MAS and API-5L X65 steel is
attributable to electrochemical corrosion activities, which occurred during the J-integral tests
in E80. It is important to note that the presence of chloride in E80 resulted in increased
fracture toughness for API-5L X65 steel as was observed in E20. It is possible that chloride
products formed due to corrosion along the matrix grain boundaries repressed decohesive
rupturing by increasing the stress intensity at the crack tip, in this way toughening the
material. However, the critical fracture toughness obtained for MAS in air and in E80 is
significantly higher than that of API-5L X65 in similar test conditions with the exception of
tests carried out in E80 + 32 mg/L NaCl. Thus, it appears that the MAS material has a
superior resistance to fracture than API-5L X65 steel particularly in air and in E80 without
chloride.
The experimental Ji values exhibit a similar trend of variation as the experimental J0.2 with
the presence of chloride in E80 as shown in Figure 4.30. Ji denotes the critical J-value for
onset of stable crack growth. In E80 + 0 mg/L NaCl, MAS has a Ji value of 184 kJ/m2, while
Ji for API-5L X65 is 77 kJ/m2. The values are relatively far apart, which implies that MAS
absorb significantly higher amounts of energy before crack extension. It is important to note
that the corresponding predicted critical crack sizes are not also relatively close. ∆ap for MAS
is 0.23 mm while that for API-5L X65 material is 0.05 mm. Crack extension before initiation
of a new crack surface is much higher in MAS than in API-5L X65 steel.
In E80 + 32 mg/L NaCl, Ji of MAS further decreased, similar to that observed with J0.2. On
the other hand, there is increase in Ji for API-5L X65 steel. This implies that fracture
initiation was rapid in the case of MAS due to retarded crack tip blunting processes. A look at
the overall profile shows MAS as having superior resistance to API-5L X65 steel due to its
higher Ji values for all the test conditions.
To qualify J0.2 as the ductile fracture toughness JIC, the criteria in Equations 4.8 – 4.10 were
applied and the results showed that all the values of J0.2 obtained for MAS specimens both in
air and E80 fuel ethanol environments were not qualified to be termed as JIC as shown in
Table 4.5. This means that the fracture toughness values are size dependent and therefore
amenable to comparisons only with specimens of similar size. On the other hand, J0.2 for
API-5L X65 specimens in E80 + 0 mg/L NaCl and E80 + 32 mg/L NaCl qualifies as critical
fracture toughness, JIC as shown in Table 4.6. Therefore, the J0.2 values estimated in this

176
investigation for API-5L X65 in E80 are considered as the critical fracture toughness
criterion of the material and are denoted as JIC in subsequent discussion.
Figure 4.30: Variation of initiation fracture toughness Ji with test environment.

177
Table 4.5: Qualifying criteria for fracture toughness JIC in the case of MAS
Environmental Temperature σo J0.2 B
bo
10𝐽𝐽0.2 𝜎𝜎𝑜𝑜⁄
TR
condition (oC) (MPa) (kJ/m2) (mm) (mm)
MAS_Air 27 379 630 6.96 9.54 16.62 0.46
MAS_E80 + 0 mg/L NaCl 27 379 435 6.94 9.14 11.48 0.85
MAS_E80 + 32 mg/L NaCl 27 379 306 7.00 9.06 8.07 0.97
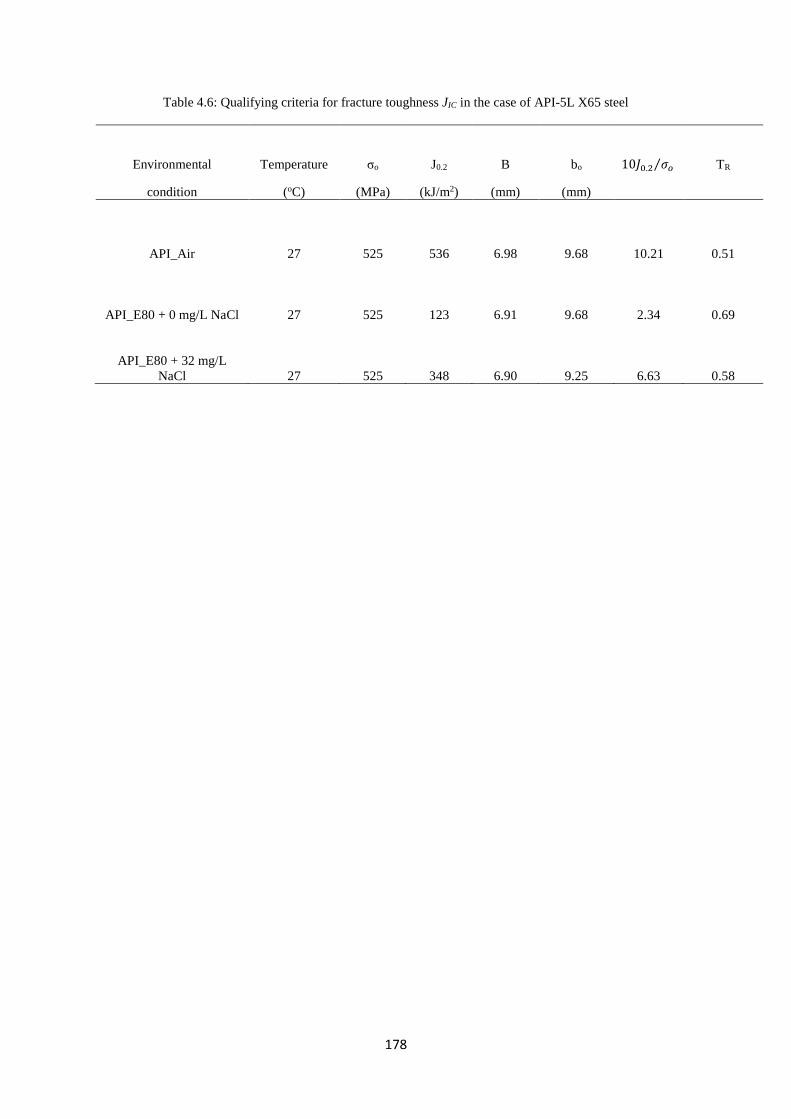
178
Table 4.6: Qualifying criteria for fracture toughness JIC in the case of API-5L X65 steel
Environmental Temperature σo J0.2 B
bo
10𝐽𝐽0.2 𝜎𝜎𝑜𝑜⁄
TR
condition (oC) (MPa) (kJ/m2) (mm) (mm)
API_Air 27 525 536 6.98 9.68 10.21 0.51
API_E80 + 0 mg/L NaCl 27 525 123 6.91 9.68 2.34 0.69
API_E80 + 32 mg/L NaCl 27 525 348 6.90 9.25 6.63 0.58
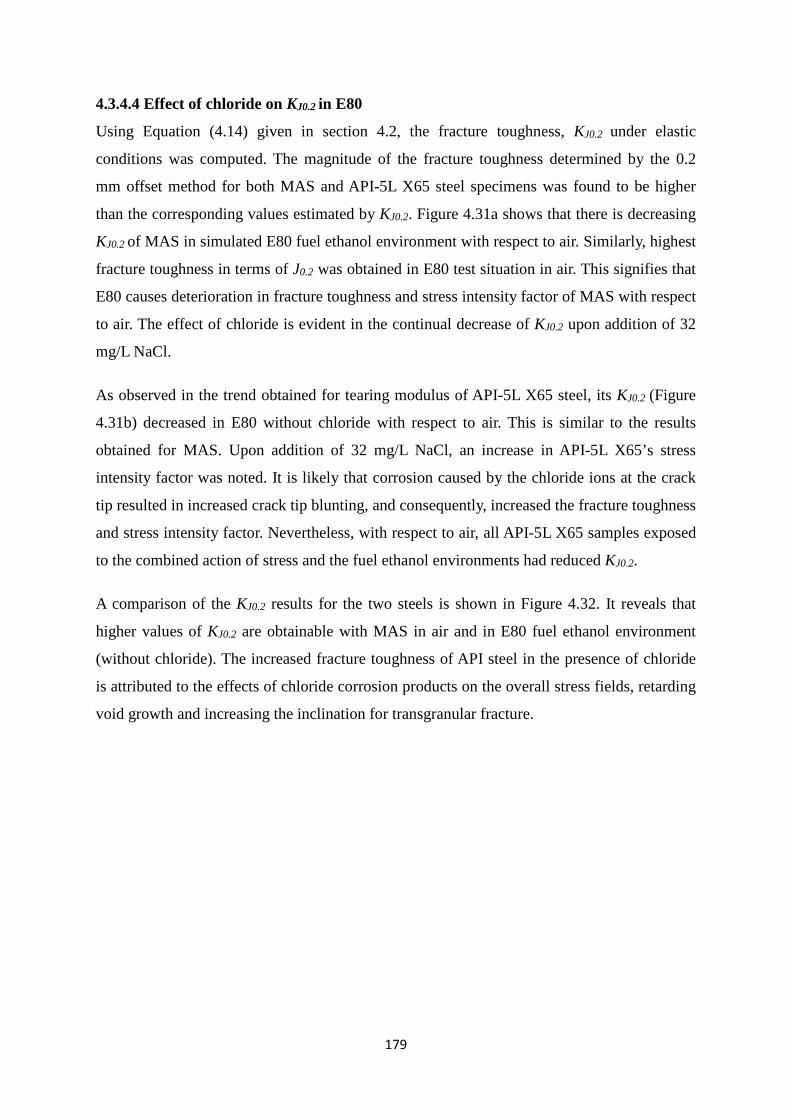
179
4.3.4.4 Effect of chloride on KJ0.2 in E80
Using Equation (4.14) given in section 4.2, the fracture toughness, KJ0.2 under elastic
conditions was computed. The magnitude of the fracture toughness determined by the 0.2
mm offset method for both MAS and API-5L X65 steel specimens was found to be higher
than the corresponding values estimated by KJ0.2. Figure 4.31a shows that there is decreasing
KJ0.2 of MAS in simulated E80 fuel ethanol environment with respect to air. Similarly, highest
fracture toughness in terms of J0.2 was obtained in E80 test situation in air. This signifies that
E80 causes deterioration in fracture toughness and stress intensity factor of MAS with respect
to air. The effect of chloride is evident in the continual decrease of KJ0.2 upon addition of 32
mg/L NaCl.
As observed in the trend obtained for tearing modulus of API-5L X65 steel, its KJ0.2 (Figure
4.31b) decreased in E80 without chloride with respect to air. This is similar to the results
obtained for MAS. Upon addition of 32 mg/L NaCl, an increase in API-5L X65’s stress
intensity factor was noted. It is likely that corrosion caused by the chloride ions at the crack
tip resulted in increased crack tip blunting, and consequently, increased the fracture toughness
and stress intensity factor. Nevertheless, with respect to air, all API-5L X65 samples exposed
to the combined action of stress and the fuel ethanol environments had reduced KJ0.2.
A comparison of the KJ0.2 results for the two steels is shown in Figure 4.32. It reveals that
higher values of KJ0.2 are obtainable with MAS in air and in E80 fuel ethanol environment
(without chloride). The increased fracture toughness of API steel in the presence of chloride
is attributed to the effects of chloride corrosion products on the overall stress fields, retarding
void growth and increasing the inclination for transgranular fracture.
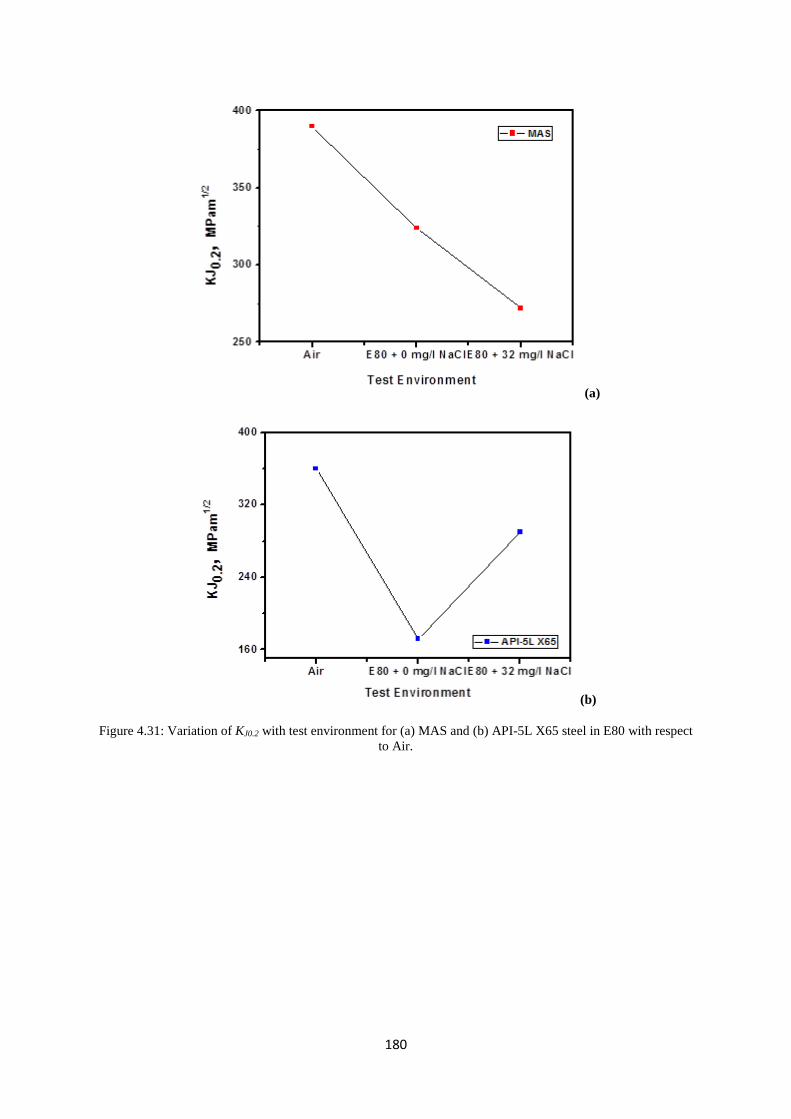
180
(a)
(b)
Figure 4.31: Variation of KJ0.2 with test environment for (a) MAS and (b) API-5L X65 steel in E80 with respect to Air.
181
Figure 4.32: Comparison of KJ0.2 for MAS and API-5L X65 steel in E80 with respect to Air.
050
100150200250300350400450
MAS API-5LX65
MAS API-5LX65
MAS API-5LX65
Air E80+0 mg/l NaCl E80+32 mg/lNaCl
K J0.
2, MPa
√m
Test Environment
182
4.3.4.5 Effect of chloride on blunting slope in E80
The disparity of characteristics of the J–R curve, such as the blunting slope M (obtained from
the relationship 𝐽𝐽 = 𝑀𝑀𝜎𝜎𝑜𝑜∆𝑎𝑎 fitted to the initial linear section) and the pre-exponent and
exponent of the tearing curve when expressed in the power-law form of Equation (4.13) were
also studied.
Figure 4.33 shows the behaviour of MAS and API-5L X65 steel as a function of E80 test
environment. M is found to be largely above 2, which is conventionally thought to be the
lower-limit of the blunting-line slope as preferred by the ASTM standard E1820. This is in
agreement with typical observations on ductile materials that show excellent toughness where
it is customary to obtain blunting-line slopes as high as 8 (Das et al., 2006; Sivaprasad et al.,
2004). Although it was noted that M is less than 2 for API steel in E80 with chloride, the
rising nature of M may nevertheless be distinguished for decreasing toughness for MAS,
while for API-5L X65 steel, the reverse is the case. The lower value of M for MAS in E80 +
0 mg/L NaCl signifies increased toughness of MAS in comparison with that of API steel. It is
important to note that similar M behaviour was observed in E20 for both steels. The blunting
slope M was determined experimentally from the linear part of the J-R curve. It is also
important to extend this fracture study to the non-linear part of the J-R curve, which could be
depicted as the flow region. Determination of the slope of this flow region is therefore,
necessary in order to understand the materials’ resistance to stable ductile tearing.
4.3.4.6 Effect of chloride on dimensionless tearing modulus in E80
The dimensionless tearing modulus, TR was used to examine the stable ductile tearing regime
of the J –R curve and was experimentally determined using Equation (4.14).
TR was determined for MAS and API-5L X65 steel in all test conditions and comparison of
resistance to crack extension is made in Figures 4.34 for both steels. For MAS, resistance to
crack extension was found to be highest in the presence of chloride. This is due to increased
stress intensity at the crack tip as a result of plastic deformation caused by the corrosive
action of chloride. The resistance to crack extension exhibited by MAS samples increased
with changing test environment from air to E80 + 32 mg/L NaCl. It is important to note that
whilst MAS exhibited decreasing Ji and J0.2 values, a contrary trend was observed for TR
values. The increase in ductile tearing resistance in E80 is attributed to the decline in
toughness property caused by the same.
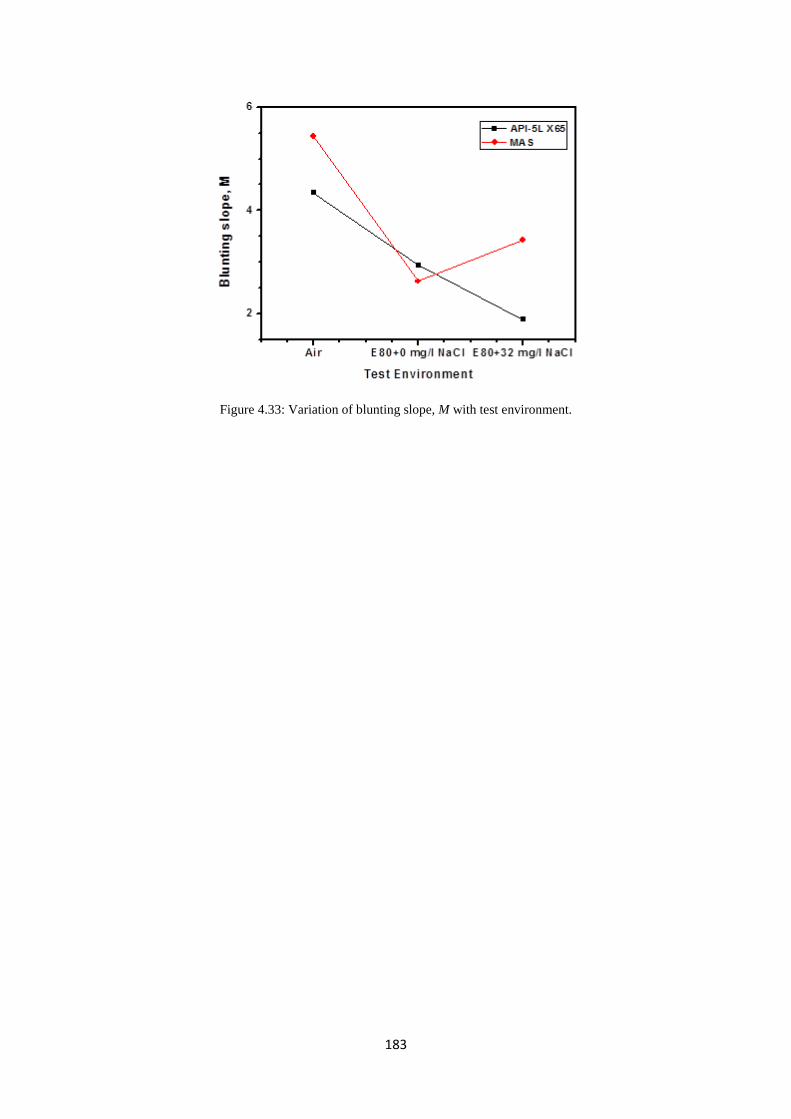
183
Figure 4.33: Variation of blunting slope, M with test environment.

184
(a)
(b)
Figure 4.34: Variation of dimensionless tearing modulus, TR with test environment for (a) MAS and (b) API-5L X65 steel.
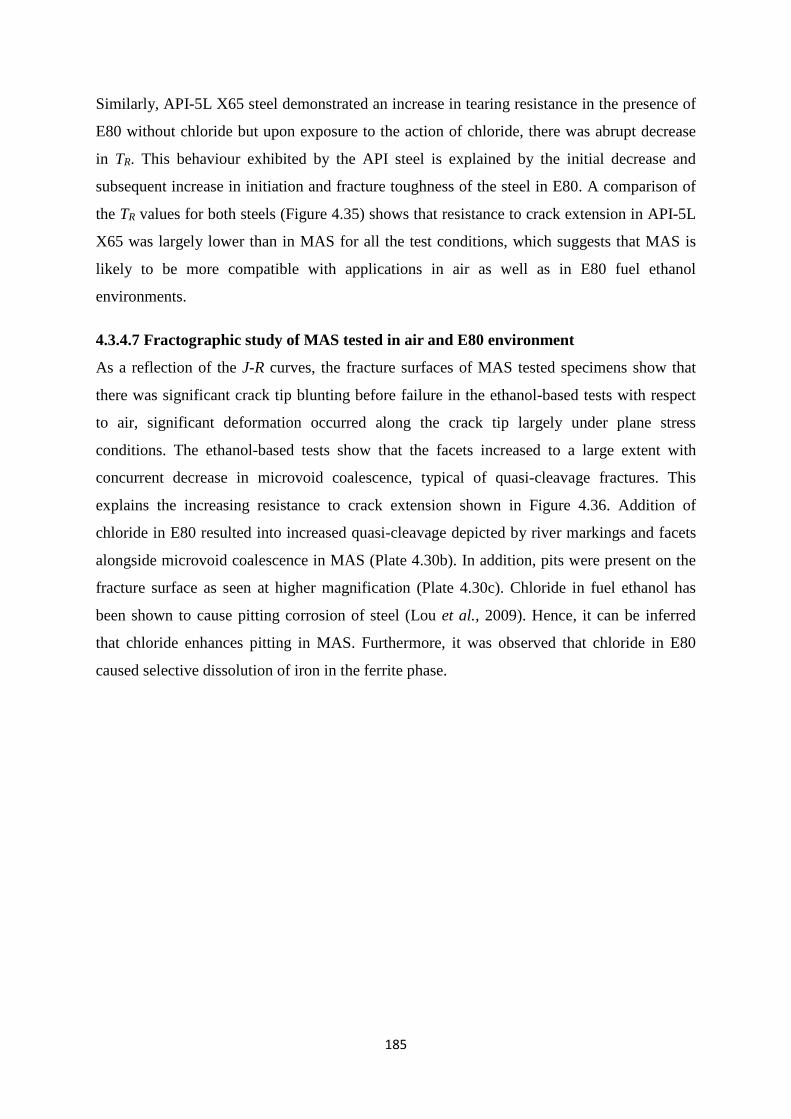
185
Similarly, API-5L X65 steel demonstrated an increase in tearing resistance in the presence of
E80 without chloride but upon exposure to the action of chloride, there was abrupt decrease
in TR. This behaviour exhibited by the API steel is explained by the initial decrease and
subsequent increase in initiation and fracture toughness of the steel in E80. A comparison of
the TR values for both steels (Figure 4.35) shows that resistance to crack extension in API-5L
X65 was largely lower than in MAS for all the test conditions, which suggests that MAS is
likely to be more compatible with applications in air as well as in E80 fuel ethanol
environments.
4.3.4.7 Fractographic study of MAS tested in air and E80 environment
As a reflection of the J-R curves, the fracture surfaces of MAS tested specimens show that
there was significant crack tip blunting before failure in the ethanol-based tests with respect
to air, significant deformation occurred along the crack tip largely under plane stress
conditions. The ethanol-based tests show that the facets increased to a large extent with
concurrent decrease in microvoid coalescence, typical of quasi-cleavage fractures. This
explains the increasing resistance to crack extension shown in Figure 4.36. Addition of
chloride in E80 resulted into increased quasi-cleavage depicted by river markings and facets
alongside microvoid coalescence in MAS (Plate 4.30b). In addition, pits were present on the
fracture surface as seen at higher magnification (Plate 4.30c). Chloride in fuel ethanol has
been shown to cause pitting corrosion of steel (Lou et al., 2009). Hence, it can be inferred
that chloride enhances pitting in MAS. Furthermore, it was observed that chloride in E80
caused selective dissolution of iron in the ferrite phase.
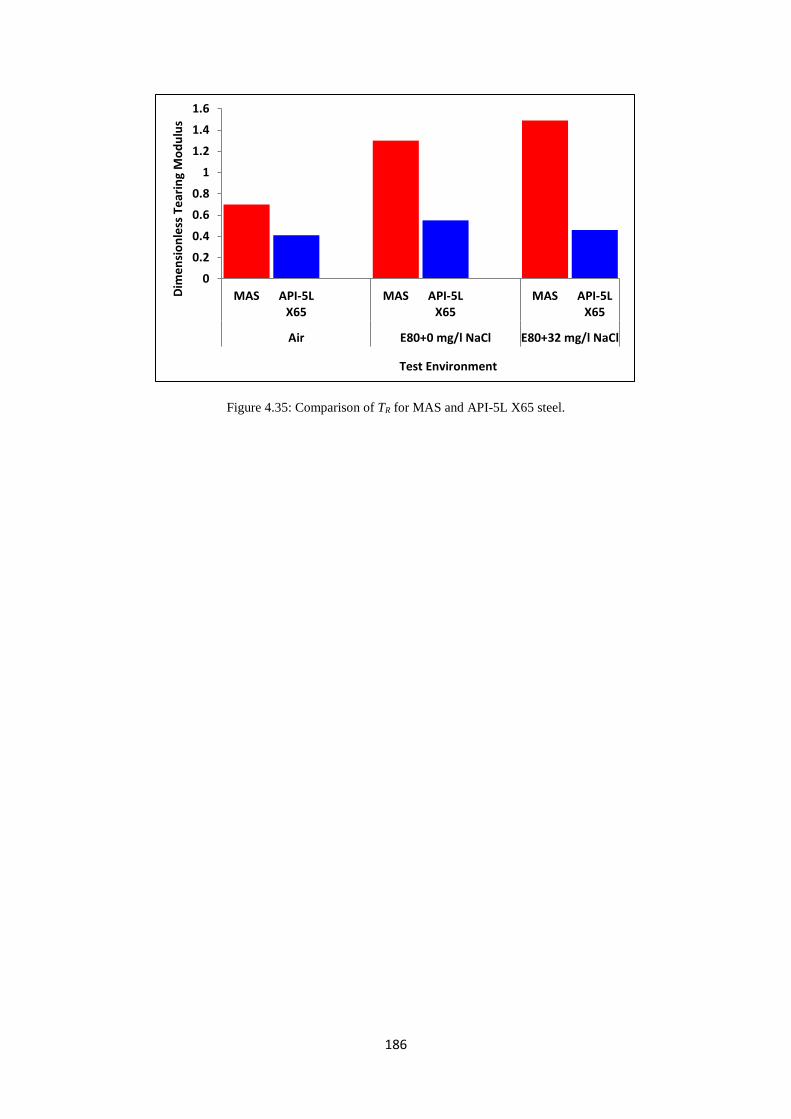
186
Figure 4.35: Comparison of TR for MAS and API-5L X65 steel.
0
0.2
0.4
0.6
0.8
1
1.2
1.4
1.6
MAS API-5LX65
MAS API-5LX65
MAS API-5LX65
Air E80+0 mg/l NaCl E80+32 mg/l NaCl
Dim
ensi
onle
ss T
earin
g M
odul
us
Test Environment
187
(a)
(b)
Plate 4.29: Fracture surface of MAS in E80 without chloride at magnification of a) 67x showing the crack extension region spanned by the red lines, and b) 1000x showing cracks and facets in the midst of a ductile
fracture.
Crack Extension
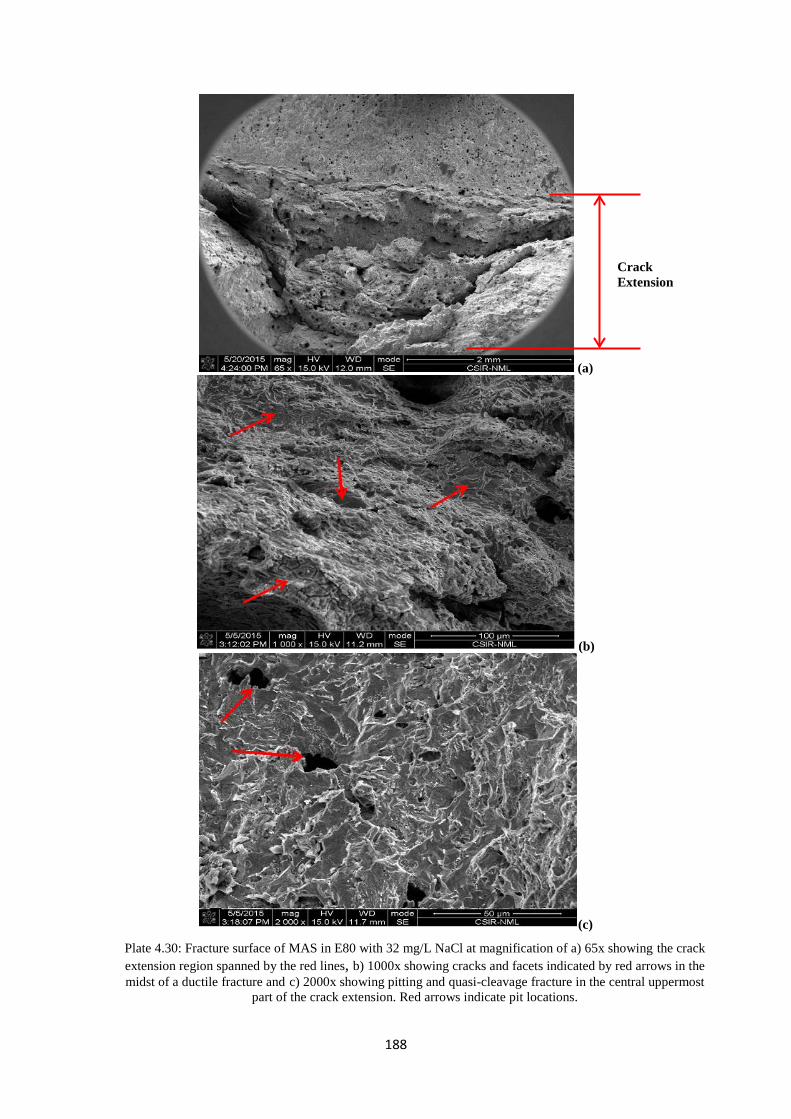
188
(a)
(b)
(c)
Plate 4.30: Fracture surface of MAS in E80 with 32 mg/L NaCl at magnification of a) 65x showing the crack extension region spanned by the red lines, b) 1000x showing cracks and facets indicated by red arrows in the midst of a ductile fracture and c) 2000x showing pitting and quasi-cleavage fracture in the central uppermost
part of the crack extension. Red arrows indicate pit locations.
Crack Extension
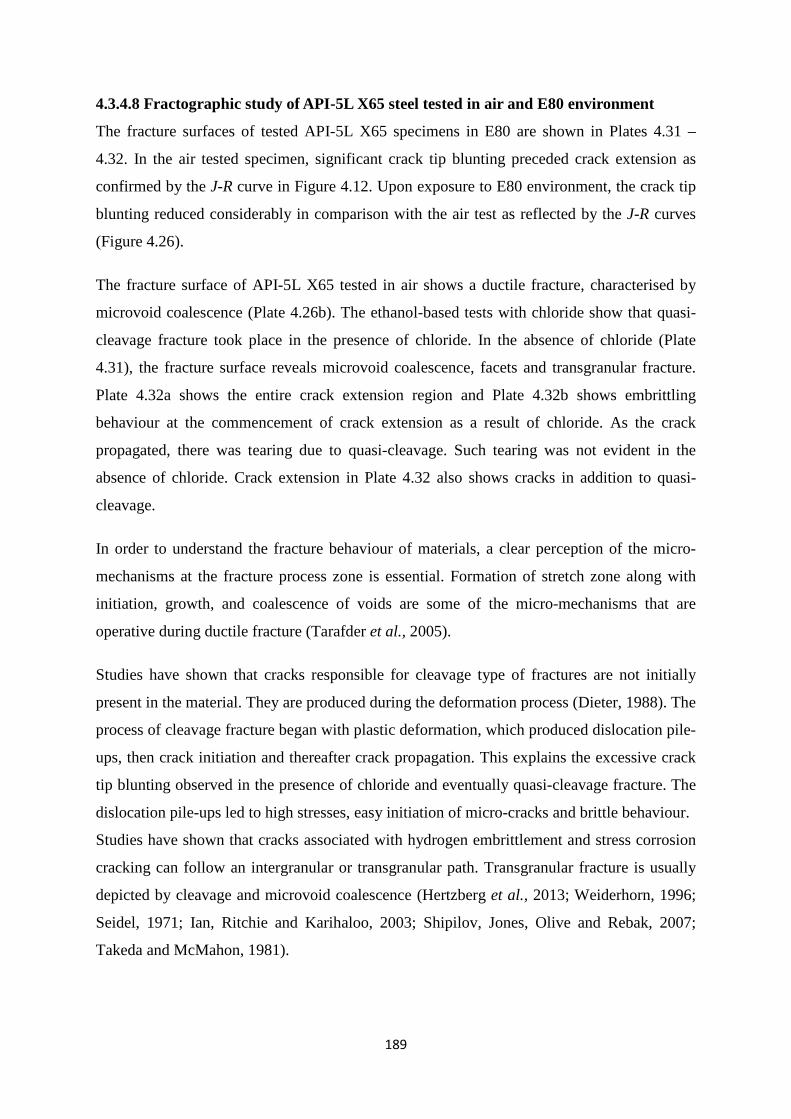
189
4.3.4.8 Fractographic study of API-5L X65 steel tested in air and E80 environment
The fracture surfaces of tested API-5L X65 specimens in E80 are shown in Plates 4.31 –
4.32. In the air tested specimen, significant crack tip blunting preceded crack extension as
confirmed by the J-R curve in Figure 4.12. Upon exposure to E80 environment, the crack tip
blunting reduced considerably in comparison with the air test as reflected by the J-R curves
(Figure 4.26).
The fracture surface of API-5L X65 tested in air shows a ductile fracture, characterised by
microvoid coalescence (Plate 4.26b). The ethanol-based tests with chloride show that quasi-
cleavage fracture took place in the presence of chloride. In the absence of chloride (Plate
4.31), the fracture surface reveals microvoid coalescence, facets and transgranular fracture.
Plate 4.32a shows the entire crack extension region and Plate 4.32b shows embrittling
behaviour at the commencement of crack extension as a result of chloride. As the crack
propagated, there was tearing due to quasi-cleavage. Such tearing was not evident in the
absence of chloride. Crack extension in Plate 4.32 also shows cracks in addition to quasi-
cleavage.
In order to understand the fracture behaviour of materials, a clear perception of the micro-
mechanisms at the fracture process zone is essential. Formation of stretch zone along with
initiation, growth, and coalescence of voids are some of the micro-mechanisms that are
operative during ductile fracture (Tarafder et al., 2005).
Studies have shown that cracks responsible for cleavage type of fractures are not initially
present in the material. They are produced during the deformation process (Dieter, 1988). The
process of cleavage fracture began with plastic deformation, which produced dislocation pile-
ups, then crack initiation and thereafter crack propagation. This explains the excessive crack
tip blunting observed in the presence of chloride and eventually quasi-cleavage fracture. The
dislocation pile-ups led to high stresses, easy initiation of micro-cracks and brittle behaviour.
Studies have shown that cracks associated with hydrogen embrittlement and stress corrosion
cracking can follow an intergranular or transgranular path. Transgranular fracture is usually
depicted by cleavage and microvoid coalescence (Hertzberg et al., 2013; Weiderhorn, 1996;
Seidel, 1971; Ian, Ritchie and Karihaloo, 2003; Shipilov, Jones, Olive and Rebak, 2007;
Takeda and McMahon, 1981).
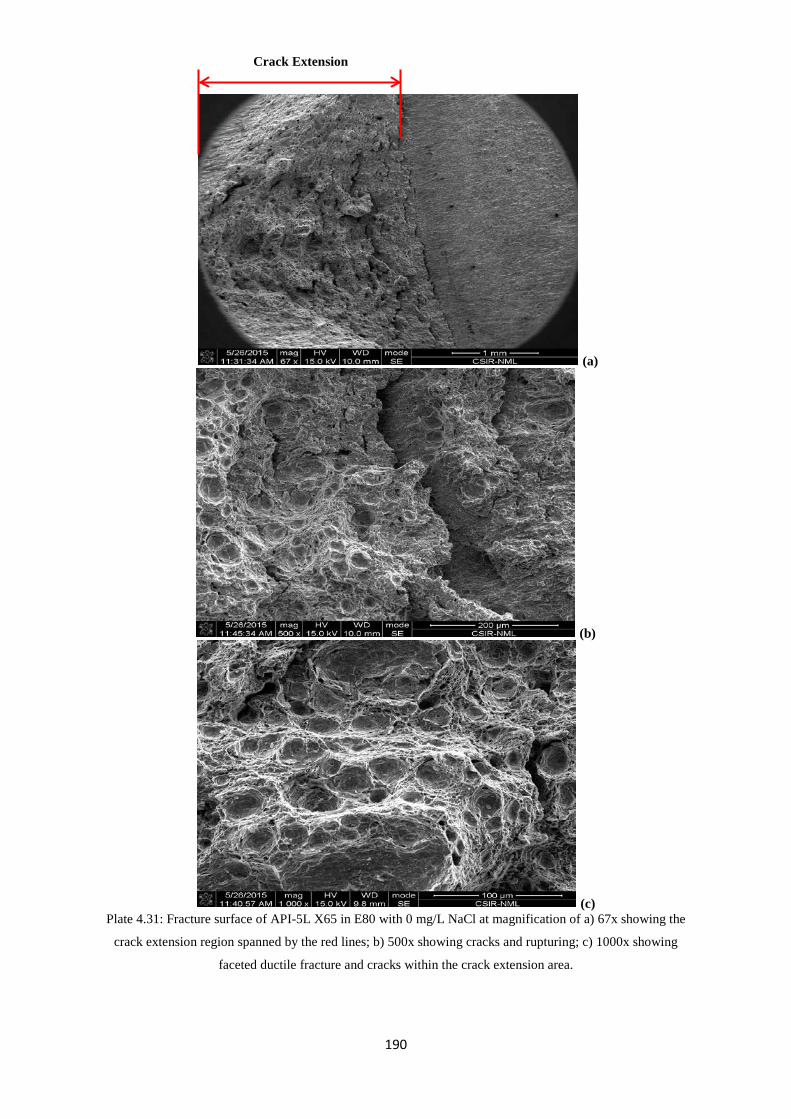
190
(a)
(b)
(c) Plate 4.31: Fracture surface of API-5L X65 in E80 with 0 mg/L NaCl at magnification of a) 67x showing the
crack extension region spanned by the red lines; b) 500x showing cracks and rupturing; c) 1000x showing
faceted ductile fracture and cracks within the crack extension area.
Crack Extension
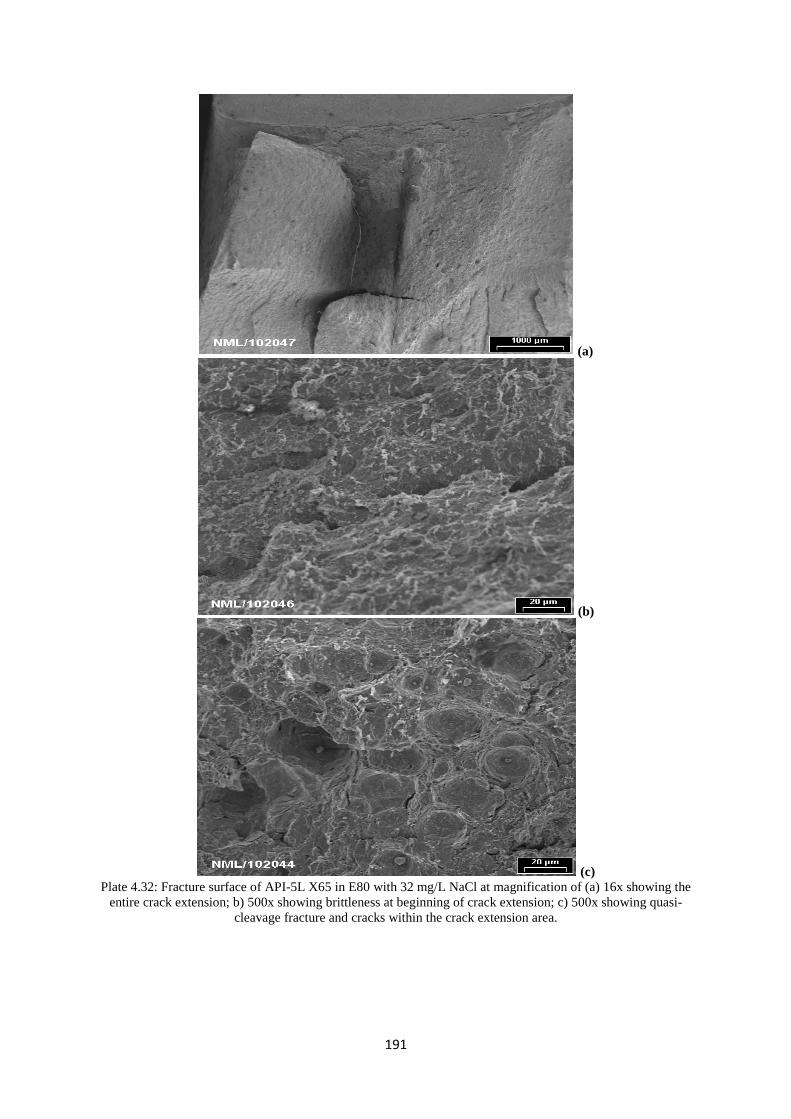
191
(a)
(b)
(c) Plate 4.32: Fracture surface of API-5L X65 in E80 with 32 mg/L NaCl at magnification of (a) 16x showing the
entire crack extension; b) 500x showing brittleness at beginning of crack extension; c) 500x showing quasi-cleavage fracture and cracks within the crack extension area.
192
4.3.4.9 Summary
The significant results obtained from this investigation lead to the following major
conclusions:
1. The two materials exhibited significant plastic deformation and substantial deviation
from the elastic loading line as they were stressed in E80.
2. In E80 fuel ethanol environment, there is significant decrease in fracture resistance of
both micro-alloyed and API-5L X65 steels compared to that in Air.
3. As obtained in E20, fracture toughness (J0.2, Ji, and KJ0.2) of MAS decreased in the
presence of NaCl, while that of API-5L X65 steel increased. Chloride resulted in
increased resistance to ductile tearing for both steels leading to transgranular fracture.
Fracture initiation toughness is much lower in E80 than in E20 for the two steels but
their tearing resistance is considerably higher in E80 than in E20.
4. Consideration of the selected specimen thickness and the estimated σo and J0.2 values
obtained for MAS specimens indicates that J0.2 was not qualified to be termed as JIC.
On the other hand, J0.2 for API-5L X65 specimens in E80 + 0 mg/L NaCl and E80 +
32 mg/L NaCl qualifies as critical fracture toughness JIC.
5. The rising nature of M was noted for decreasing toughness of MAS whereas for API-
5L X65 steel, the reverse was the case.
6. In E80 without chloride, MAS and API-5L X65 steel both displayed ductile fracture
with increased facets.
7. In E80 with 32 mg/L NaCl, the failure mode of MAS is pitting and quasi-cleavage
fracture while API-5L X65 steel shows cracks in addition to quasi-cleavage.
193
4.3.5 Effect of Ethanol Concentration on the Fracture Behaviour of API-5L X65 and
Micro-alloyed Steels in Simulated Fuel Ethanol Environment
The kinetics of fracture behaviour and crack growth depends on the material-environment
system. In the previous sections, the effect of chloride on the fracture behaviour of the two
steels used in this research was investigated. This section deals with the influence of
changing ethanol concentration on the kinetics of fracture and crack extension in MAS and
API-5L X65 steels. Depending on the situation and the desired fuel, ethanol can be blended
with gasoline at any ratio. Common blends are E5, E10, E20, E25, E70, E85, E95 and E100,
which contain 5, 10, 20, 25, 70, 85, 95 and 100% ethanol, respectively (Paul and Kemnitz,
2006). In this study, E20 and E80 were used with different chloride concentrations. The best
metal-environment combination for MAS and API-5L X65 steel is determined after the
study.
The effects of E20 and E80 on MAS and API-5L X65 steel in the absence of NaCl were
studied. The study encompasses the effect of ethanol concentration on the determined J-R
curves and fracture toughness values, as well as on tearing modulus and KJ0.2 values. Since
the tests were carried out in three environments: Air, 0 mg/L NaCl and 32 mg/L NaCl, the
effect of ethanol concentration on the two steels in each of these environments was
investigated.
4.3.5.1 Effect of Ethanol on the J-R curves
Figures 4.36 and 4.37 show that for the tests carried out on both MAS and API-5L X65 steel,
the J-R curve for air test was highest, followed by E20, then E80. In the absence of chloride,
both materials seem better suited for E20 application than for E80. Since corrosion rate was
found to be highest in E80, the lower J-R curves obtained for E80 is attributed to the
degradation effect of the environment. In the presence of 32 mg/L NaCl, the effects of E20
and E80 on MAS and API-5L X65 steels were also studied. As in the cases without chloride,
the study incorporated the effect of ethanol concentration on the determined J-R curves. It
was observed that for 32 mg/L NaCl, the J-R curves of both steels are higher in E20 than in
E80.

194
(a)
(b)
Figure 4.36: J-R curves obtained from (a) MAS and (b) API-5L X65 specimens in the absence of chloride and
with respect to air.
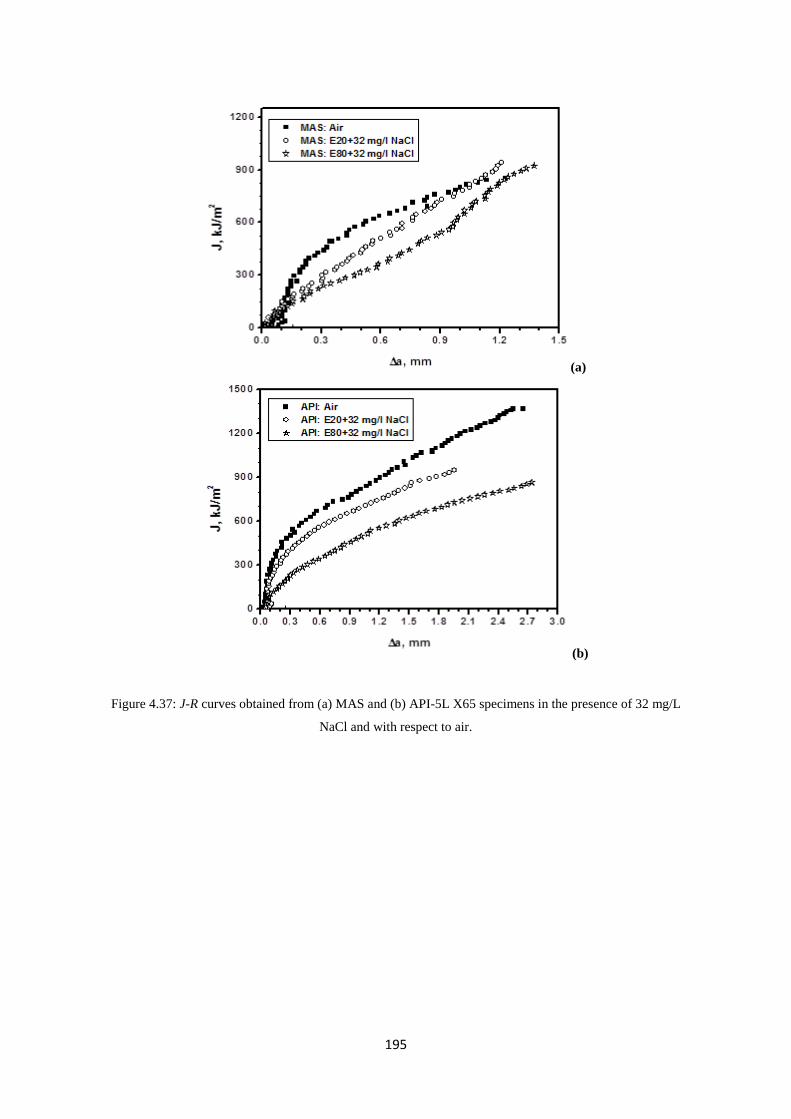
195
(a)
(b)
Figure 4.37: J-R curves obtained from (a) MAS and (b) API-5L X65 specimens in the presence of 32 mg/L
NaCl and with respect to air.
196
This implies that the significant lowering of the J-R curves in E80, which indicates a
deterioration of fracture resistance, is independent of chloride content. It is important to note
that the J-R curves obtained for the steels in all the fuel ethanol environments decreased with
respect to air. The margin of decrease was small in MAS compared to API-5L X65.
4.3.5.2 Effect of Ethanol on Fracture toughness
Figures 4.38 - 4.39 show decrease in J0.2 and Ji values for both MAS and API-5L X65 in the
fuel ethanol environments. E80, E85 and E95 are known to be corrosive (Ryden and
Sunnerstedt, 2005). For this reason, materials to be used for handling fuel ethanol must be
compatible with the fuel so as to prevent contaminants. E20 is seen to be less corrosive than
E80 even in the presence of 32 mg/L NaCl. Hence, it can be asserted that with addition of 32
mg/L NaCl, both MAS and API-5L X65 are more susceptible to corrosion and fracture in
E80 environment.
Furthermore, in all the test environments ranging from Air to E80, fracture toughness of the
MAS was largely higher than that of API-5L X65. In the absence of chloride, fracture
toughness J0.2 and Ji of API-5L X65 steel decreased with changing ethanol concentration,
while MAS exhibited an increase in E20 and a decrease in E80. The increased fracture
toughness of MAS in E20 is due to a depression of the crack tip stress field to below that
given by the Hutchinson, Roy and Rosengren (HRR) solution (Tarafder et al., 2007).
It was also observed that fracture toughness of the two steels decreased with changing ethanol
concentration in the presence of chloride and with respect to air. The deterioration of fracture
resistance is attributed to the action of chloride by increasing the triaxial stresses at the crack
tip. In addition, transgranular fracture occurs. In the presence of chloride, the initiation
toughness for MAS decreased from 185 kJ/m2 in E20 to 156 kJ/m2 in E80 with respect to 458
kJ/m2 for the air test. From these values, fracture initiation toughness of MAS is seen to have
approximately 60% decrease in E20 and 66% decrease in E80 from the air test. This
deviation is quite large, which means that fracture initiates early in MAS when stressed in the
fuel ethanol environments in comparison to its behaviour in air. In contrast, Ji of API-5L X65
steel increased in E20 with respect to air but decreased in E80. In general, fracture toughness
and initiation toughness of both MAS and API-5L X65 steel are higher in E20 than in E80. A
clearer picture of the variation of J0.2 with the test environments is shown in Figure 4.40. In
both (a) and (b), the lowest J0.2 is in E80 environment. In addition, a comparative assessment
of the two materials reveals higher fracture toughness values obtainable with MAS.
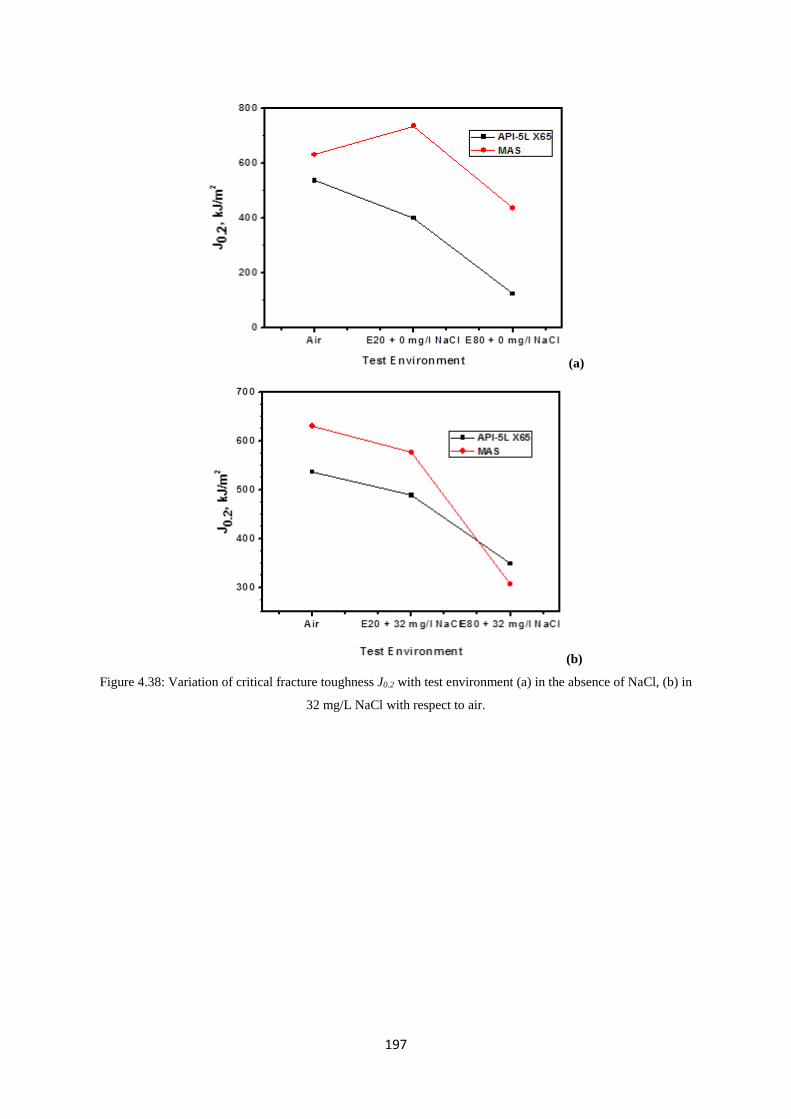
197
(a)
(b) Figure 4.38: Variation of critical fracture toughness J0.2 with test environment (a) in the absence of NaCl, (b) in
32 mg/L NaCl with respect to air.
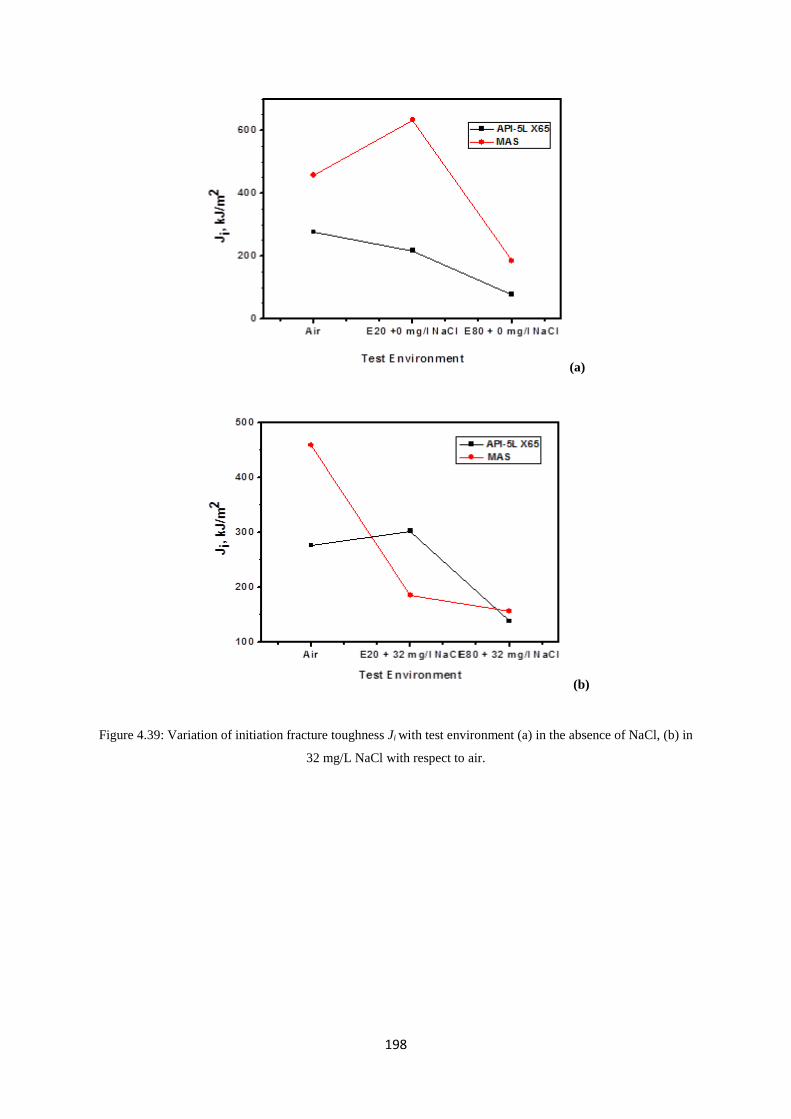
198
(a)
(b)
Figure 4.39: Variation of initiation fracture toughness Ji with test environment (a) in the absence of NaCl, (b) in
32 mg/L NaCl with respect to air.
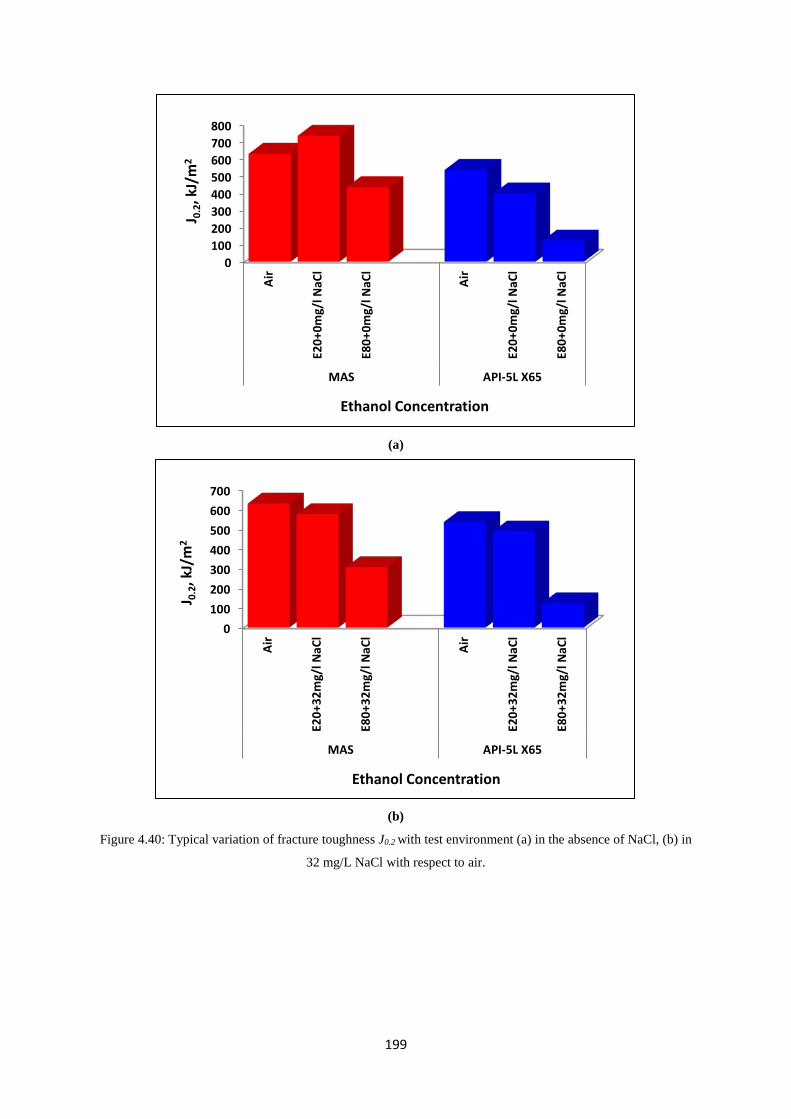
199
(a)
(b)
Figure 4.40: Typical variation of fracture toughness J0.2 with test environment (a) in the absence of NaCl, (b) in
32 mg/L NaCl with respect to air.
0100200300400500600700800
Air
E20+
0mg/
l NaC
l
E80+
0mg/
l NaC
l
Air
E20+
0mg/
l NaC
l
E80+
0mg/
l NaC
l
MAS API-5L X65
J 0.2
, kJ/
m2
Ethanol Concentration
0100200300400500600700
Air
E20+
32m
g/l N
aCl
E80+
32m
g/l N
aCl
Air
E20+
32m
g/l N
aCl
E80+
32m
g/l N
aCl
MAS API-5L X65
J 0.2
, kJ/
m2
Ethanol Concentration
200
4.3.5.3 Effect of Ethanol on Blunting Slope
The magnitude of the slopes for the experimental blunting line on the J-R curves have been
calculated as a function of the flow stress and are found to be 2.33 and 2.63 for MAS in E20
+ 0 mg/L NaCl and E80 + 0 mg/L NaCl, respectively as shown in Figure 4.41. The M values
thus obtained in the ethanolic environments are considerably lower than that in air (5.44).
Increase in ethanol concentration from E20 to E80 also increased the blunting slope. In the
presence of chloride, M decreased from 3.84 in E20 to 3.43 in E80. It is evident that M values
for MAS are higher in the presence of NaCl than those obtained when NaCl is absent. Thus,
the effect of ethanol concentration on M is dependent on the composition of the ethanolic
solution. When NaCl was absent, M increased as ethanol increased, but with NaCl, M
decreased as ethanol increased. In general, M decreased in all the test conditions with respect
to air.
Similarly, M for API-5L X65 steel decreased in all test conditions with respect to air. It was
noted that its behaviour was same in both cases with and without chloride. The effect of
increase in ethanol concentration is shown in the decreasing trend demonstrated by M for API
steel in the presence and in the absence of chloride. In addition, it must be pointed out that the
variation between M for E20 (4.13) and that for E80 (2.94) is large when compared with M
variation for MAS. This significant variation is evident in the presence and absence of
chloride. Another important observation made regarding blunting slope behaviour for API
steel is that M is dependent on change in ethanol concentration. In the presence and absence
of chloride, M decreased with increase in ethanol concentration. However, lower M values
are obtained in E80 when compared with that of E20.
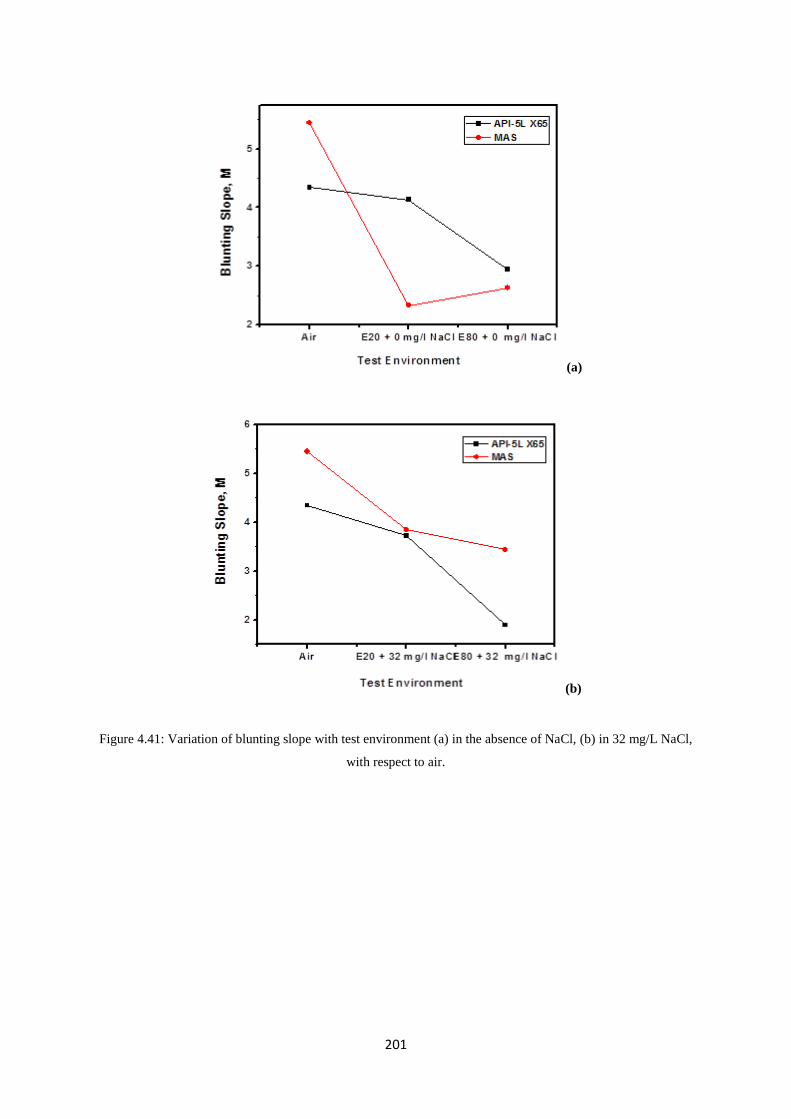
201
(a)
(b)
Figure 4.41: Variation of blunting slope with test environment (a) in the absence of NaCl, (b) in 32 mg/L NaCl,
with respect to air.
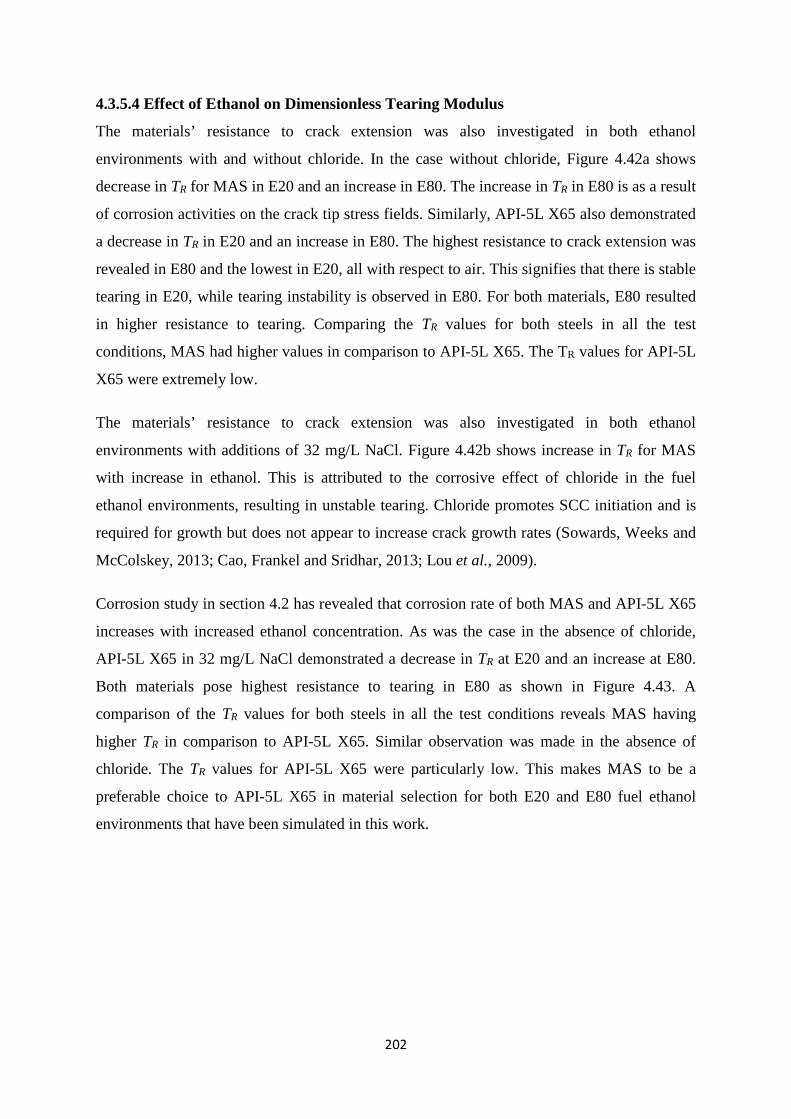
202
4.3.5.4 Effect of Ethanol on Dimensionless Tearing Modulus
The materials’ resistance to crack extension was also investigated in both ethanol
environments with and without chloride. In the case without chloride, Figure 4.42a shows
decrease in TR for MAS in E20 and an increase in E80. The increase in TR in E80 is as a result
of corrosion activities on the crack tip stress fields. Similarly, API-5L X65 also demonstrated
a decrease in TR in E20 and an increase in E80. The highest resistance to crack extension was
revealed in E80 and the lowest in E20, all with respect to air. This signifies that there is stable
tearing in E20, while tearing instability is observed in E80. For both materials, E80 resulted
in higher resistance to tearing. Comparing the TR values for both steels in all the test
conditions, MAS had higher values in comparison to API-5L X65. The TR values for API-5L
X65 were extremely low.
The materials’ resistance to crack extension was also investigated in both ethanol
environments with additions of 32 mg/L NaCl. Figure 4.42b shows increase in TR for MAS
with increase in ethanol. This is attributed to the corrosive effect of chloride in the fuel
ethanol environments, resulting in unstable tearing. Chloride promotes SCC initiation and is
required for growth but does not appear to increase crack growth rates (Sowards, Weeks and
McColskey, 2013; Cao, Frankel and Sridhar, 2013; Lou et al., 2009).
Corrosion study in section 4.2 has revealed that corrosion rate of both MAS and API-5L X65
increases with increased ethanol concentration. As was the case in the absence of chloride,
API-5L X65 in 32 mg/L NaCl demonstrated a decrease in TR at E20 and an increase at E80.
Both materials pose highest resistance to tearing in E80 as shown in Figure 4.43. A
comparison of the TR values for both steels in all the test conditions reveals MAS having
higher TR in comparison to API-5L X65. Similar observation was made in the absence of
chloride. The TR values for API-5L X65 were particularly low. This makes MAS to be a
preferable choice to API-5L X65 in material selection for both E20 and E80 fuel ethanol
environments that have been simulated in this work.

203
(a)
(b)
Figure 4.42: Variation of TR with test environment (a) in the absence of NaCl, (b) in 32 mg/L NaCl, with respect
to air.

204
(a)
(b)
Figure 4.43: Comparison of TR for MAS and API-5L X65 steel with respect to ethanol concentration and (a) 0
mg/L NaCl, (b) 32 mg/L NaCl
0
0.2
0.4
0.6
0.8
1
1.2
1.4
Air
E20+
0mg/
l NaC
l
E80+
0mg/
l NaC
l
Air
E20+
0mg/
l NaC
l
E80+
0mg/
l NaC
l
MAS API-5L X65
Dim
ensi
onle
ss Te
arin
g M
odul
us
Ethanol Concentration
00.20.40.60.8
11.21.41.6
Air
E20+
32m
g/l N
aCl
E80+
32m
g/l N
aCl
Air
E20+
32m
g/l N
aCl
E80+
32m
g/l N
aCl
MAS API-5L X65
Tear
ing
Mod
ulus
Ethanol Concentration
205
4.3.5.5 Summary
The major conclusions derived from the study of varying ethanol concentration in monotonic
J-integral testing of MAS and API-5L X65 steel samples, which involved examination of the
J-R curves, fracture toughness, blunting slopes and tearing resistance can be summarized as
follows:
1. There was significant lowering of the J-R curves in E80, much lower than in E20 for
both steels.
2. The micro-alloyed steel material exhibited superior fracture toughness in comparison
to the API-5L X65 steel material. In addition, fracture and initiation toughness of both
MAS and API-5L X65 steel is higher in E20 than in E80.
3. For most part of the tests, lower M values were obtained in E80 for both steels.
4. Both materials posed the highest resistance to tearing in E80. A comparison of the TR
values for both steels in all the test conditions reveals MAS having higher TR in
comparison to API-5L X65. Therefore, MAS is a more preferable choice to API-5L
X65 in material selection for both E20 and E80 fuel ethanol environments, which
have been simulated in this study.
206
4.4 Width of stretch zones on fracture toughness specimens
Formation of stretch zone along with initiation, growth, and coalescence of voids are some of
the micro-mechanisms that are operative during ductile fracture (Tarafder et al., 2005). Crack
extension by void coalescence is preceded by the expanse of stretch zone, which is a
featureless region immediately after the fatigue precrack region. The stretch zone essentially
forms to accommodate the plastic strains that are required for void growth ahead of the crack.
It is also described as an imprint of the initiation regime fracture of ductile materials, thus has
a correlation with the initiation fracture toughness of a material. The size of this stretch zone
is a characteristic of the material. When the process of crack extension through coalescence
of voids with the blunted crack tip is initiated, continual extension of the crack by similar
process is certain owing to the obtainability of matured voids further ahead (Tarafder et al.,
2007).
Numerous attempts have been made to measure stretch zone dimensions and acquire a
suitable correlation with ductile fracture toughness (Sivaprasad, Tarafder, Ranganath, Das
and Ray, 2001; Yin, Gerbrands and Hartevelt, 1983; Hopkins and Jolley, 1983; Ranganath,
Kumar and Pandey, 1991; Cao and Lu, 1984; Sreenivasan, Ray, Vaidyanathan and
Rodriguez, 1996; Bassim, Mattews and Hyatt, 1992; Pandey, Sundaram and Kumar, 1992;
Amouzouvi and Bassim, 1982). Customarily, in extremely ductile materials, stretch zone
would have two components viz., stretch zone width (SZW) and stretch zone depth (SZD).
Both SZW and SZD are closely related to fracture toughness. Nevertheless, there is no
agreement regarding which of these stretch zone measurements should be used for defining
critical fracture toughness. Some researchers have used SZW (Ranganath et al., 1991; Bassim
et al., 1992; Pandey et al., 1992; Amouzouvi and Bassim, 1982) while others have used SZD
(Cao and Lu, 1984; Sreenivasan et al., 1996) for obtaining ductile fracture toughness.
The values of Ji obtained in this investigation were compared with stretch zone width (SZW)
measurements. The fractured specimens were observed in SEM. A typical representative
photograph of the initial region of the ductile crack extension is shown in Plates 4.33 – 4.37
for MAS and Plates 4.38 – 4.42 for API-5L X65 steel. The fatigue pre-cracked region is
found to be followed by an expanse of stretch zone (SZ), which sequentially is followed by
ridges of ductile crack extension. The observed nature of the stretch zone is thus of
conventional type, and it is easy to estimate the width of the stretch zone and additional stable
crack initiation toughness.
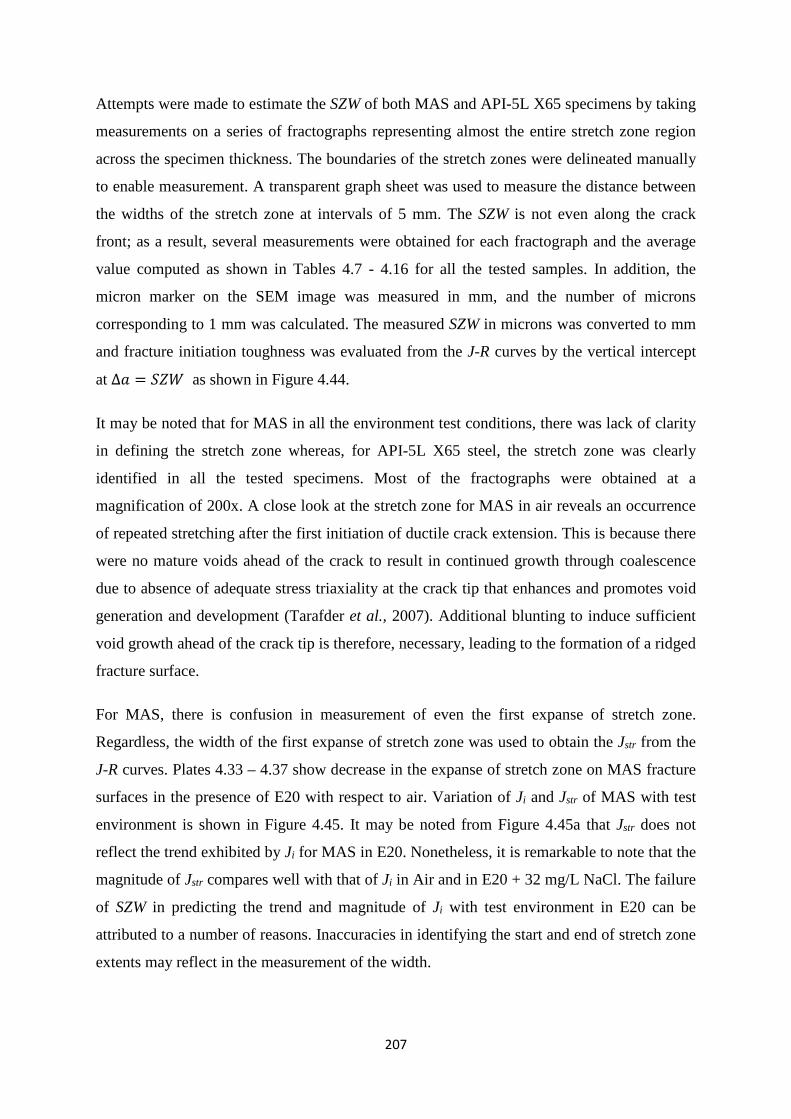
207
Attempts were made to estimate the SZW of both MAS and API-5L X65 specimens by taking
measurements on a series of fractographs representing almost the entire stretch zone region
across the specimen thickness. The boundaries of the stretch zones were delineated manually
to enable measurement. A transparent graph sheet was used to measure the distance between
the widths of the stretch zone at intervals of 5 mm. The SZW is not even along the crack
front; as a result, several measurements were obtained for each fractograph and the average
value computed as shown in Tables 4.7 - 4.16 for all the tested samples. In addition, the
micron marker on the SEM image was measured in mm, and the number of microns
corresponding to 1 mm was calculated. The measured SZW in microns was converted to mm
and fracture initiation toughness was evaluated from the J-R curves by the vertical intercept
at ∆𝑎𝑎 = 𝑆𝑆𝑆𝑆𝑆𝑆 as shown in Figure 4.44.
It may be noted that for MAS in all the environment test conditions, there was lack of clarity
in defining the stretch zone whereas, for API-5L X65 steel, the stretch zone was clearly
identified in all the tested specimens. Most of the fractographs were obtained at a
magnification of 200x. A close look at the stretch zone for MAS in air reveals an occurrence
of repeated stretching after the first initiation of ductile crack extension. This is because there
were no mature voids ahead of the crack to result in continued growth through coalescence
due to absence of adequate stress triaxiality at the crack tip that enhances and promotes void
generation and development (Tarafder et al., 2007). Additional blunting to induce sufficient
void growth ahead of the crack tip is therefore, necessary, leading to the formation of a ridged
fracture surface.
For MAS, there is confusion in measurement of even the first expanse of stretch zone.
Regardless, the width of the first expanse of stretch zone was used to obtain the Jstr from the
J-R curves. Plates 4.33 – 4.37 show decrease in the expanse of stretch zone on MAS fracture
surfaces in the presence of E20 with respect to air. Variation of Ji and Jstr of MAS with test
environment is shown in Figure 4.45. It may be noted from Figure 4.45a that Jstr does not
reflect the trend exhibited by Ji for MAS in E20. Nonetheless, it is remarkable to note that the
magnitude of Jstr compares well with that of Ji in Air and in E20 + 32 mg/L NaCl. The failure
of SZW in predicting the trend and magnitude of Ji with test environment in E20 can be
attributed to a number of reasons. Inaccuracies in identifying the start and end of stretch zone
extents may reflect in the measurement of the width.
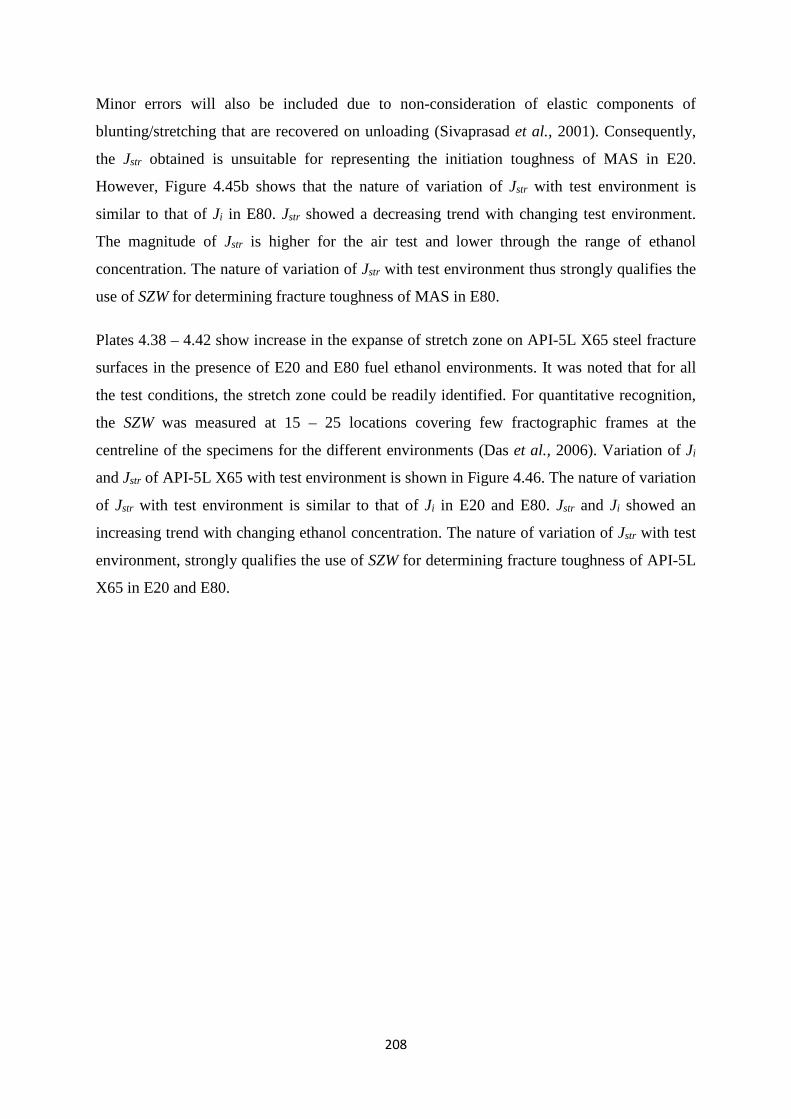
208
Minor errors will also be included due to non-consideration of elastic components of
blunting/stretching that are recovered on unloading (Sivaprasad et al., 2001). Consequently,
the Jstr obtained is unsuitable for representing the initiation toughness of MAS in E20.
However, Figure 4.45b shows that the nature of variation of Jstr with test environment is
similar to that of Ji in E80. Jstr showed a decreasing trend with changing test environment.
The magnitude of Jstr is higher for the air test and lower through the range of ethanol
concentration. The nature of variation of Jstr with test environment thus strongly qualifies the
use of SZW for determining fracture toughness of MAS in E80.
Plates 4.38 – 4.42 show increase in the expanse of stretch zone on API-5L X65 steel fracture
surfaces in the presence of E20 and E80 fuel ethanol environments. It was noted that for all
the test conditions, the stretch zone could be readily identified. For quantitative recognition,
the SZW was measured at 15 – 25 locations covering few fractographic frames at the
centreline of the specimens for the different environments (Das et al., 2006). Variation of Ji
and Jstr of API-5L X65 with test environment is shown in Figure 4.46. The nature of variation
of Jstr with test environment is similar to that of Ji in E20 and E80. Jstr and Ji showed an
increasing trend with changing ethanol concentration. The nature of variation of Jstr with test
environment, strongly qualifies the use of SZW for determining fracture toughness of API-5L
X65 in E20 and E80.
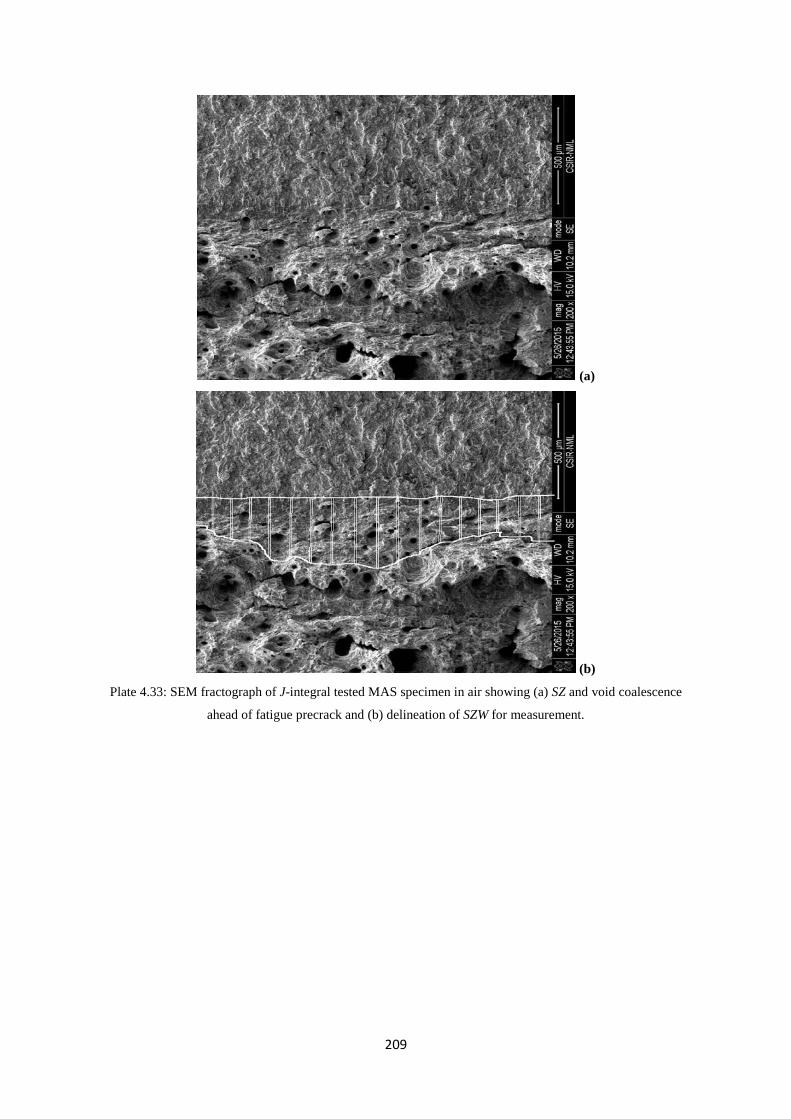
209
(a)
(b) Plate 4.33: SEM fractograph of J-integral tested MAS specimen in air showing (a) SZ and void coalescence
ahead of fatigue precrack and (b) delineation of SZW for measurement.
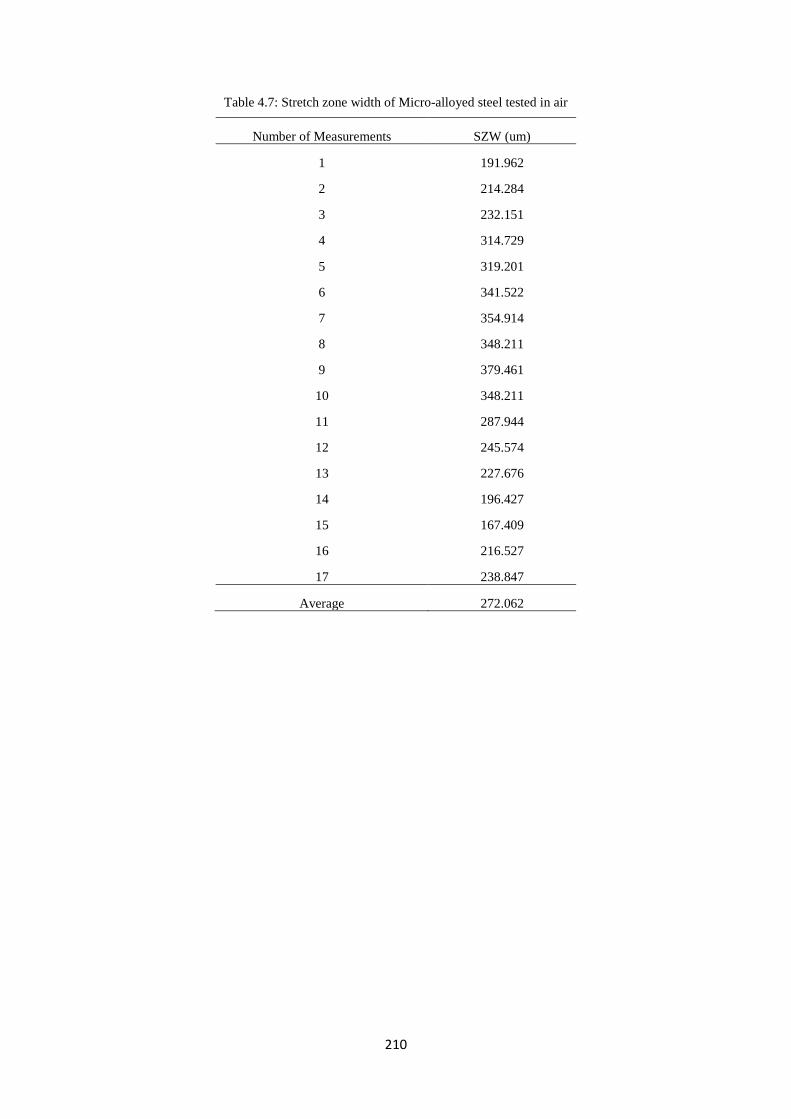
210
Table 4.7: Stretch zone width of Micro-alloyed steel tested in air
Number of Measurements SZW (um)
1 191.962
2 214.284
3 232.151
4 314.729
5 319.201
6 341.522
7 354.914
8 348.211
9 379.461
10 348.211
11 287.944
12 245.574
13 227.676
14 196.427
15 167.409
16 216.527
17 238.847
Average 272.062

211
(a)
(b)
Plate 4.34: SEM fractograph of J-integral tested MAS specimen in E20 without chloride showing (a) SZ and
void coalescence ahead of fatigue precrack and (b) delineation of SZW for measurement.
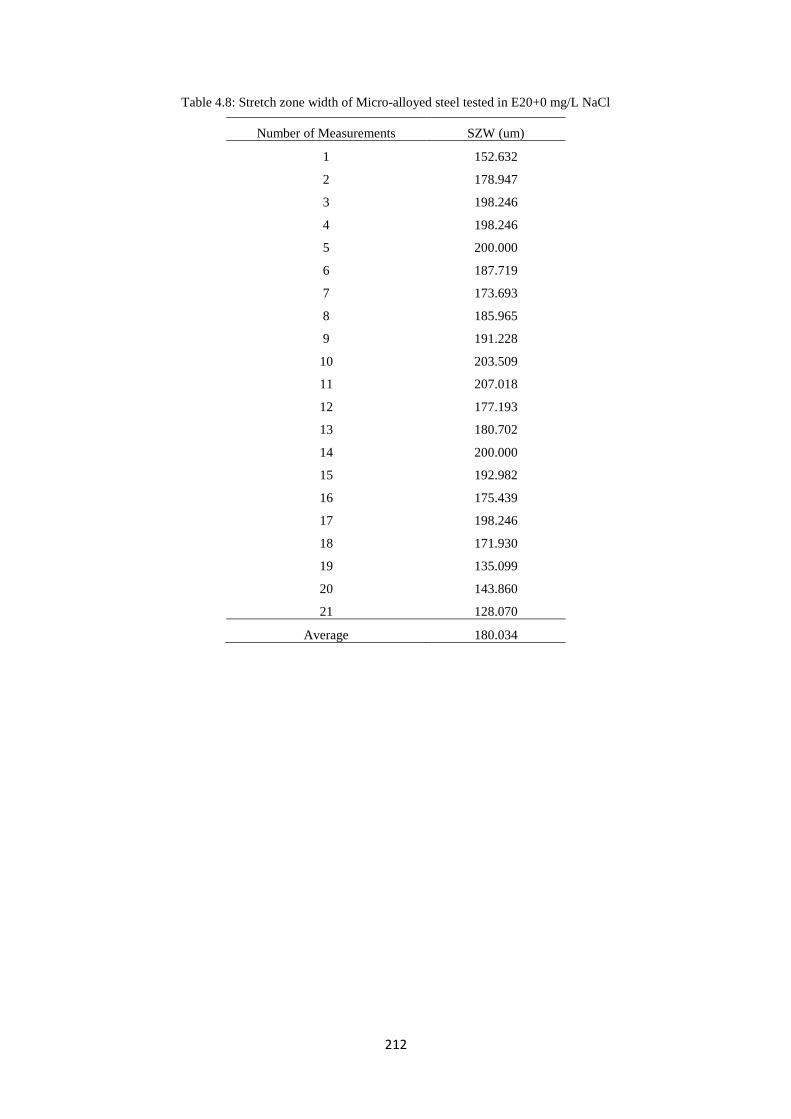
212
Table 4.8: Stretch zone width of Micro-alloyed steel tested in E20+0 mg/L NaCl
Number of Measurements SZW (um)
1 152.632
2 178.947
3 198.246
4 198.246
5 200.000
6 187.719
7 173.693
8 185.965
9 191.228
10 203.509
11 207.018
12 177.193
13 180.702
14 200.000
15 192.982
16 175.439
17 198.246
18 171.930
19 135.099
20 143.860
21 128.070
Average 180.034

213
(a)
(b)
Plate 4.35: SEM fractograph of J-integral tested MAS specimen in E20 with 32 mg/L NaCl showing (a) SZ and
void coalescence ahead of fatigue precrack and (b) delineation of SZW for measurement.

214
Table 4.9: Stretch zone width of Micro-alloyed steel tested in E20+32 mg/L NaCl
Number of Measurements SZW (μm)
1 241.275
2 226.740
3 223.833
4 220.926
5 180.230
6 188.950
7 180.230
8 177.323
9 139.533
10 136.626
11 148.253
12 156.974
13 159.881
14 174.416
15 188.950
16 194.764
17 177.323
18 232.554
19 252.903
20 235.461
21 281.972
Average 196.148
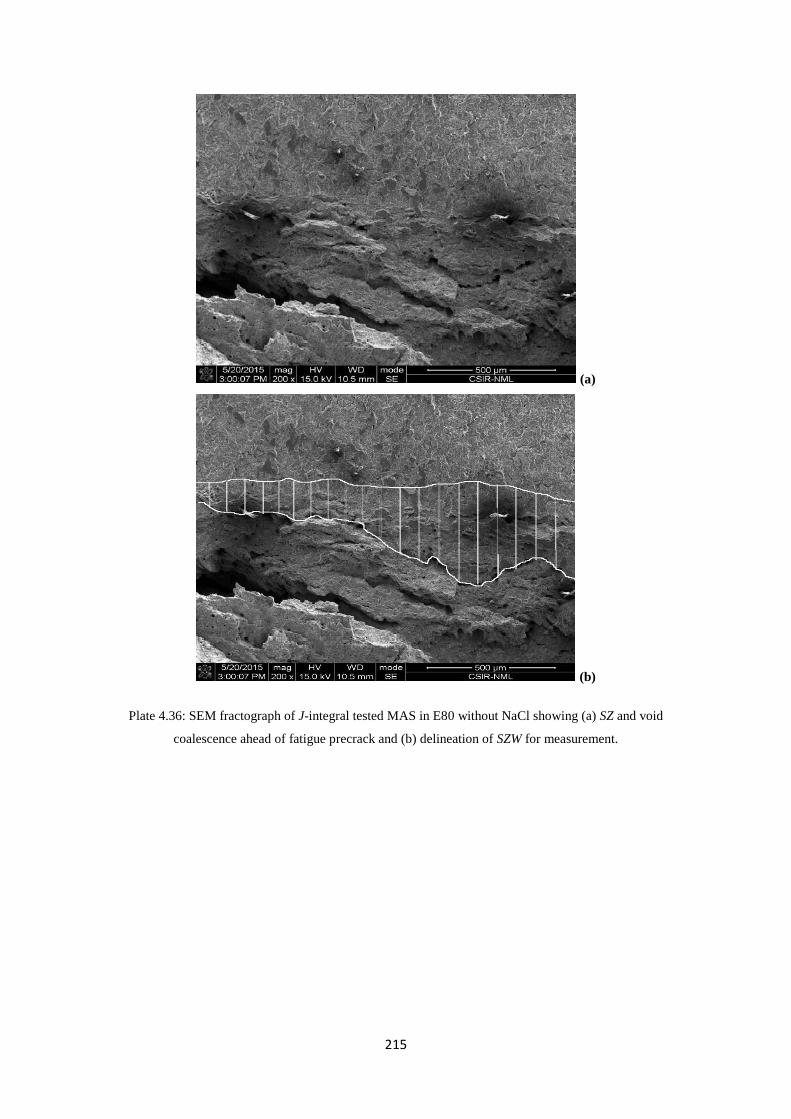
215
(a)
(b)
Plate 4.36: SEM fractograph of J-integral tested MAS in E80 without NaCl showing (a) SZ and void
coalescence ahead of fatigue precrack and (b) delineation of SZW for measurement.

216
Table 4.10: Stretch zone width of Micro-alloyed steel tested in E80+0 mg/L NaCl
Number of Measurements SZW
1 116.994
2 140.348
3 157.892
4 149.120
5 154.968
6 184.207
7 172.512
8 192.979
9 187.131
10 181.283
11 242.686
12 318.708
13 353.795
14 365.491
15 473.676
16 488.296
17 444.446
18 388.882
19 315.784
20 336.264
Average 268.273
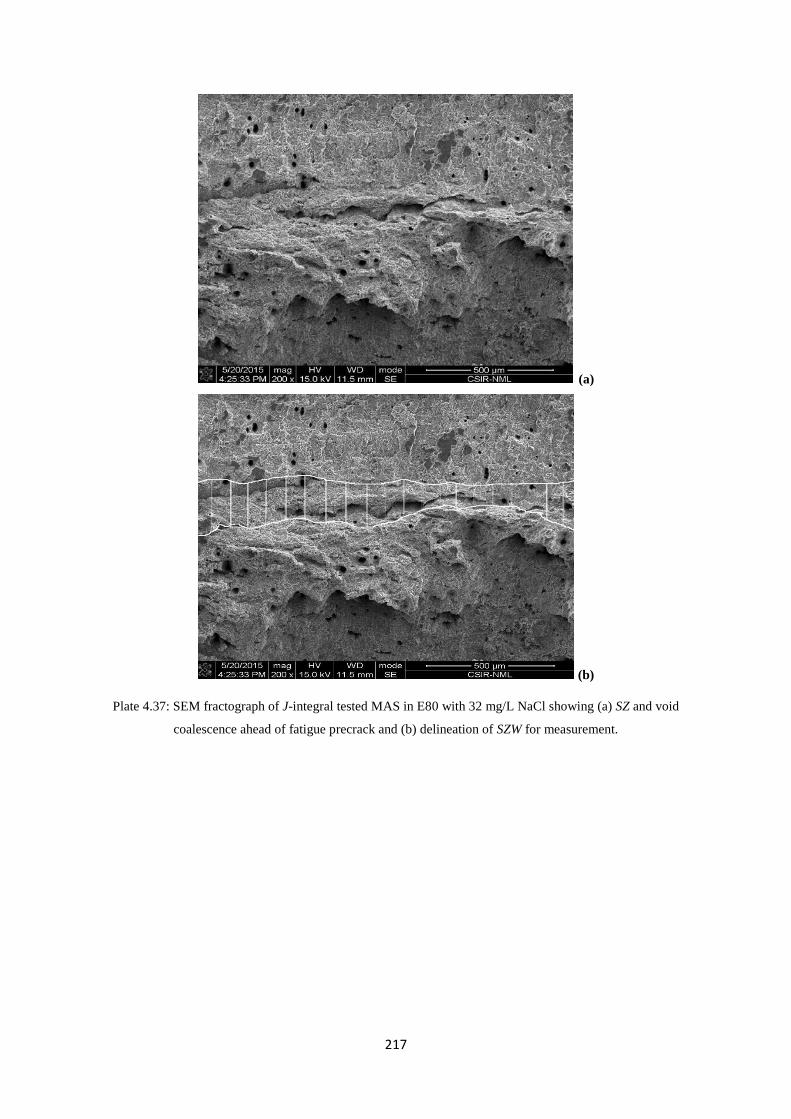
217
(a)
(b)
Plate 4.37: SEM fractograph of J-integral tested MAS in E80 with 32 mg/L NaCl showing (a) SZ and void
coalescence ahead of fatigue precrack and (b) delineation of SZW for measurement.
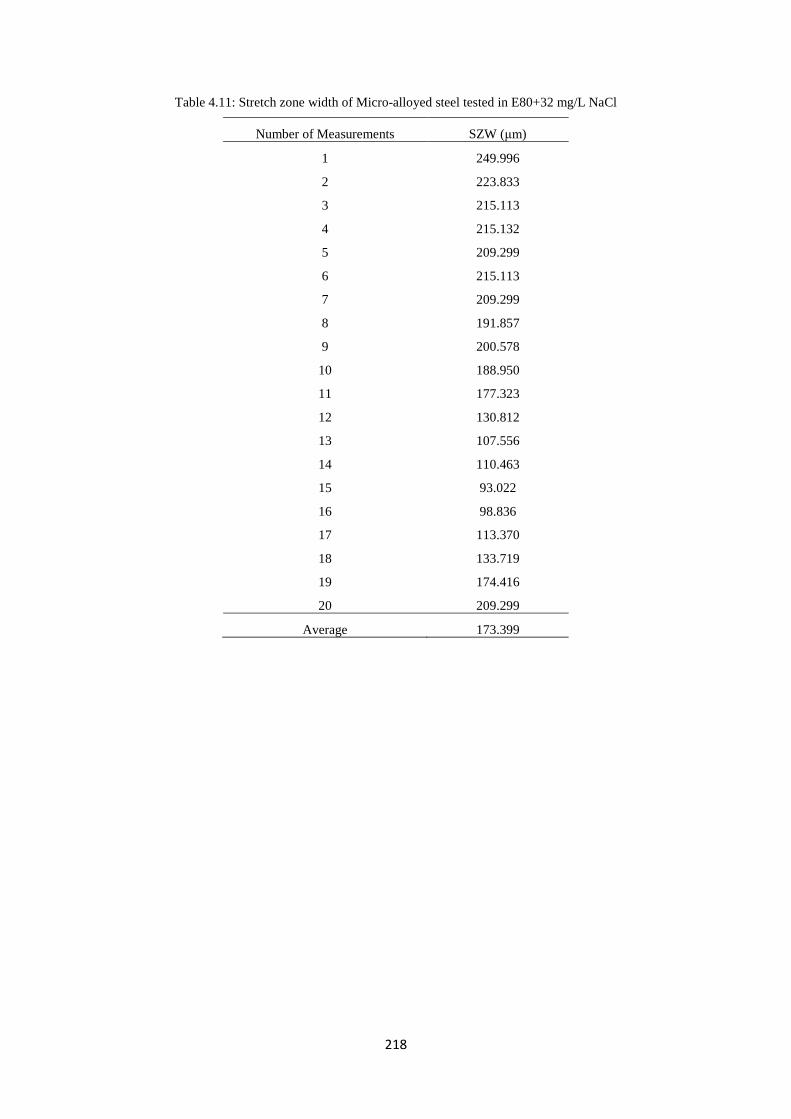
218
Table 4.11: Stretch zone width of Micro-alloyed steel tested in E80+32 mg/L NaCl
Number of Measurements SZW (μm)
1 249.996
2 223.833
3 215.113
4 215.132
5 209.299
6 215.113
7 209.299
8 191.857
9 200.578
10 188.950
11 177.323
12 130.812
13 107.556
14 110.463
15 93.022
16 98.836
17 113.370
18 133.719
19 174.416
20 209.299
Average 173.399
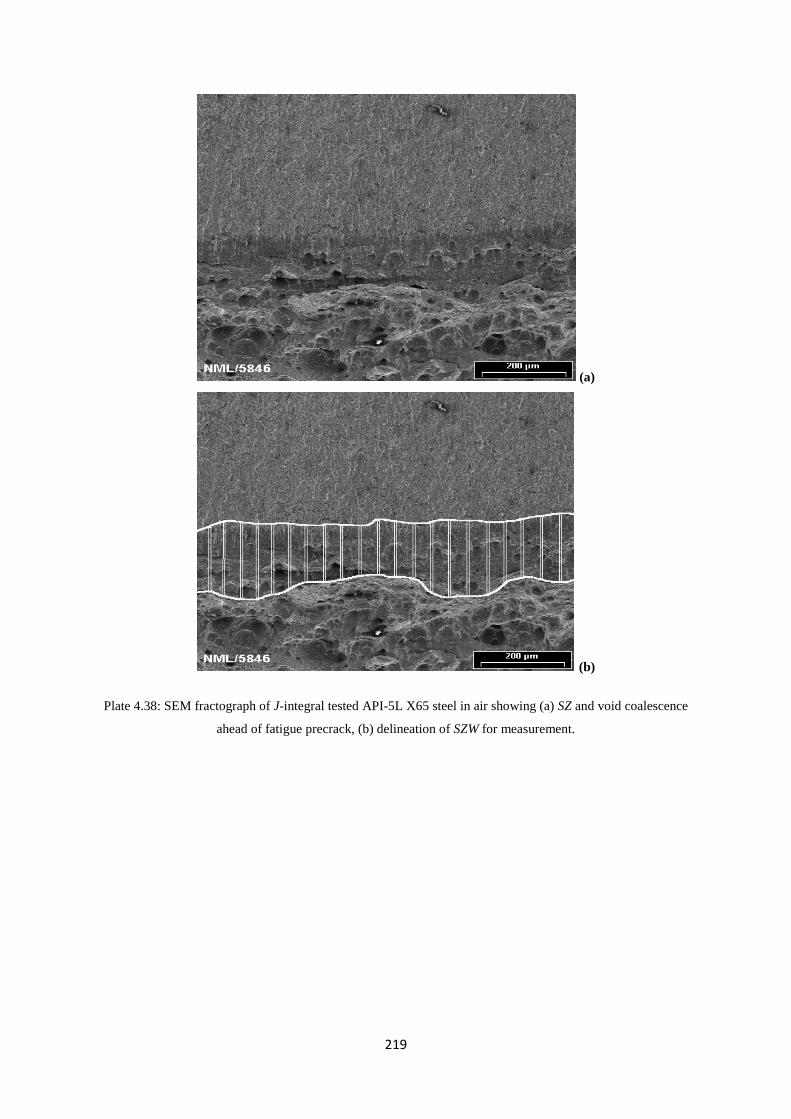
219
(a)
(b)
Plate 4.38: SEM fractograph of J-integral tested API-5L X65 steel in air showing (a) SZ and void coalescence
ahead of fatigue precrack, (b) delineation of SZW for measurement.
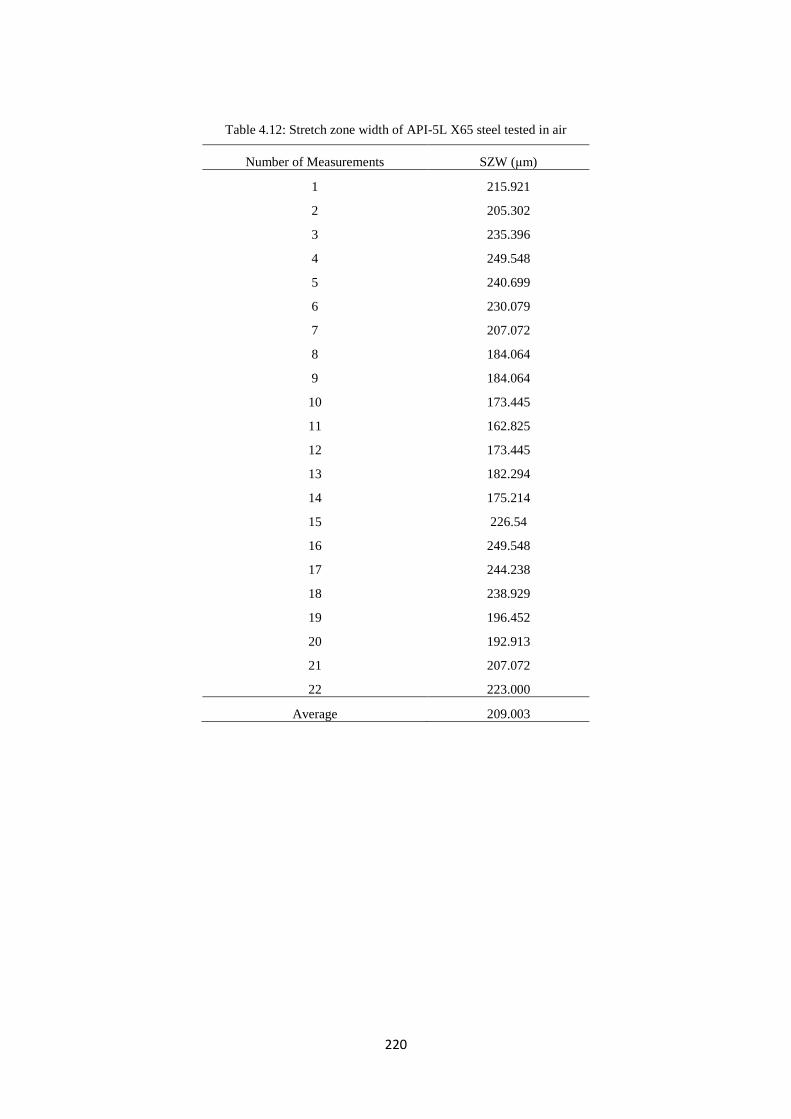
220
Table 4.12: Stretch zone width of API-5L X65 steel tested in air
Number of Measurements SZW (μm)
1 215.921
2 205.302
3 235.396
4 249.548
5 240.699
6 230.079
7 207.072
8 184.064
9 184.064
10 173.445
11 162.825
12 173.445
13 182.294
14 175.214
15 226.54
16 249.548
17 244.238
18 238.929
19 196.452
20 192.913
21 207.072
22 223.000
Average 209.003
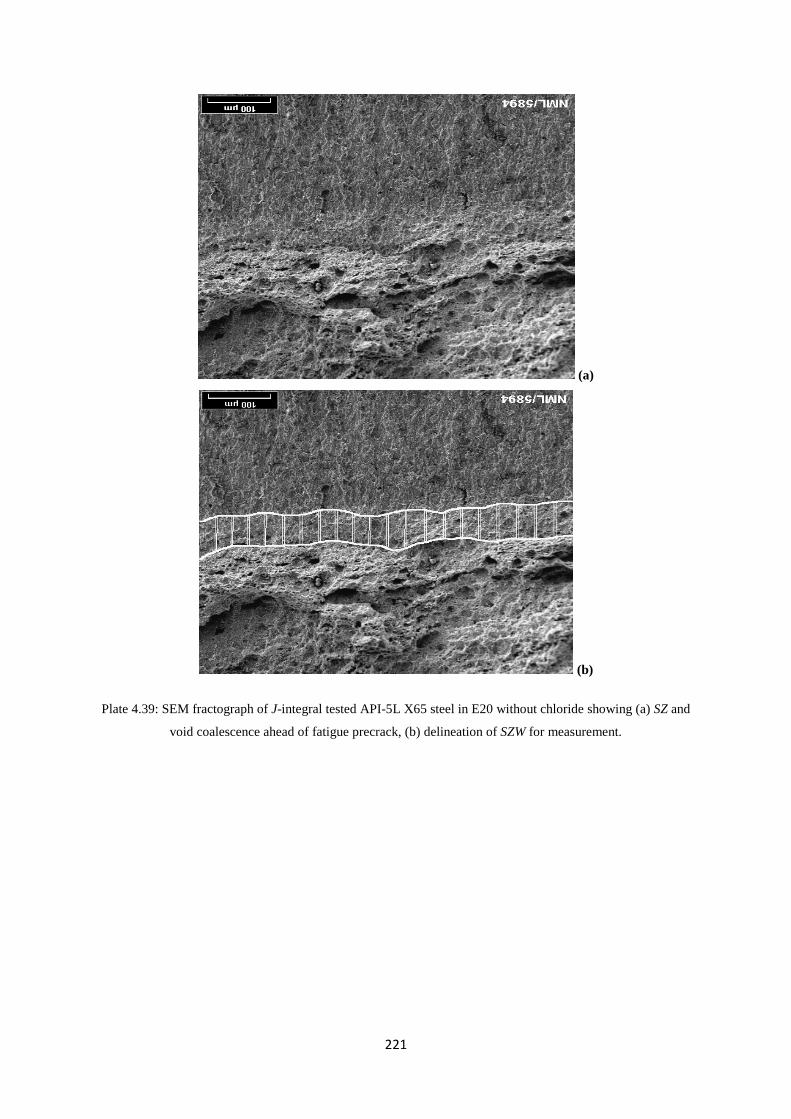
221
(a)
(b)
Plate 4.39: SEM fractograph of J-integral tested API-5L X65 steel in E20 without chloride showing (a) SZ and
void coalescence ahead of fatigue precrack, (b) delineation of SZW for measurement.

222
Table 4.13: Stretch zone width of API-5L X65 steel tested in E20+0 mg/L NaCl
Number of Measurements SZW (μm)
1 67.826
2 58.632
3 65.517
4 67.826
5 59.770
6 62.069
7 65.517
8 66.667
9 58.621
10 58.632
11 67.816
12 80.468
13 64.368
14 55.172
15 63.218
16 65.517
17 81.609
18 68.966
19 72.414
20 73.563
Average 66.209
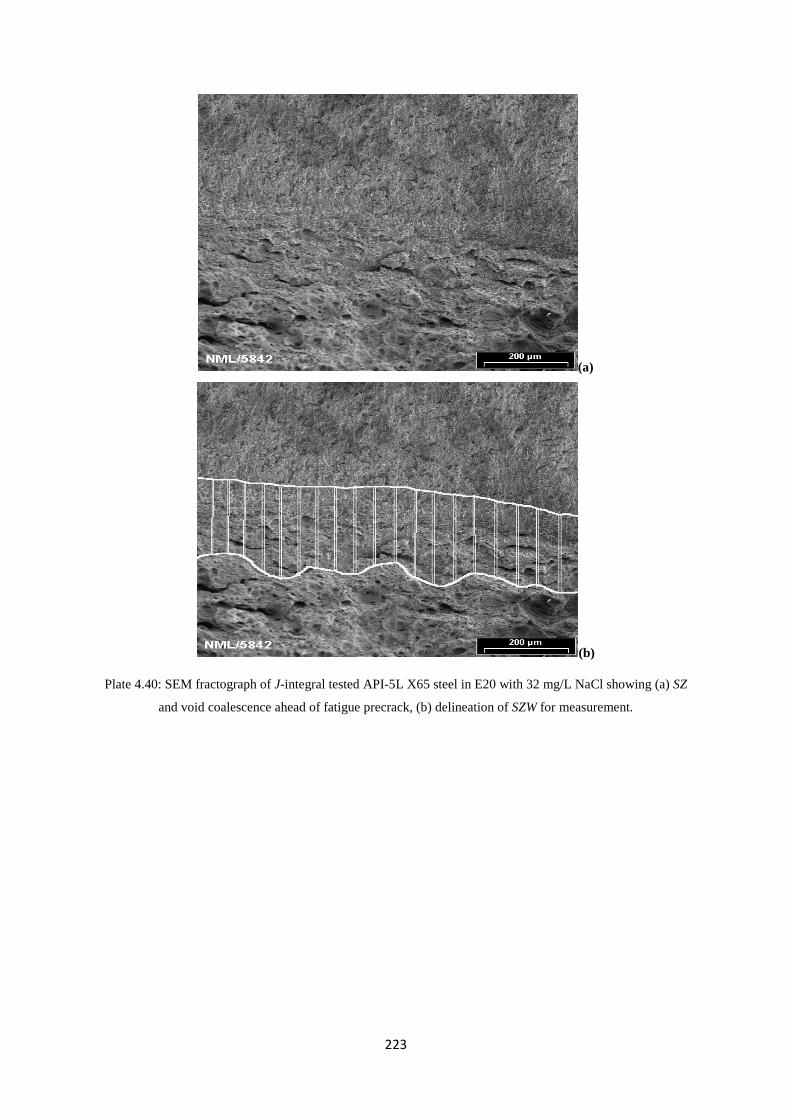
223
(a)
(b)
Plate 4.40: SEM fractograph of J-integral tested API-5L X65 steel in E20 with 32 mg/L NaCl showing (a) SZ
and void coalescence ahead of fatigue precrack, (b) delineation of SZW for measurement.
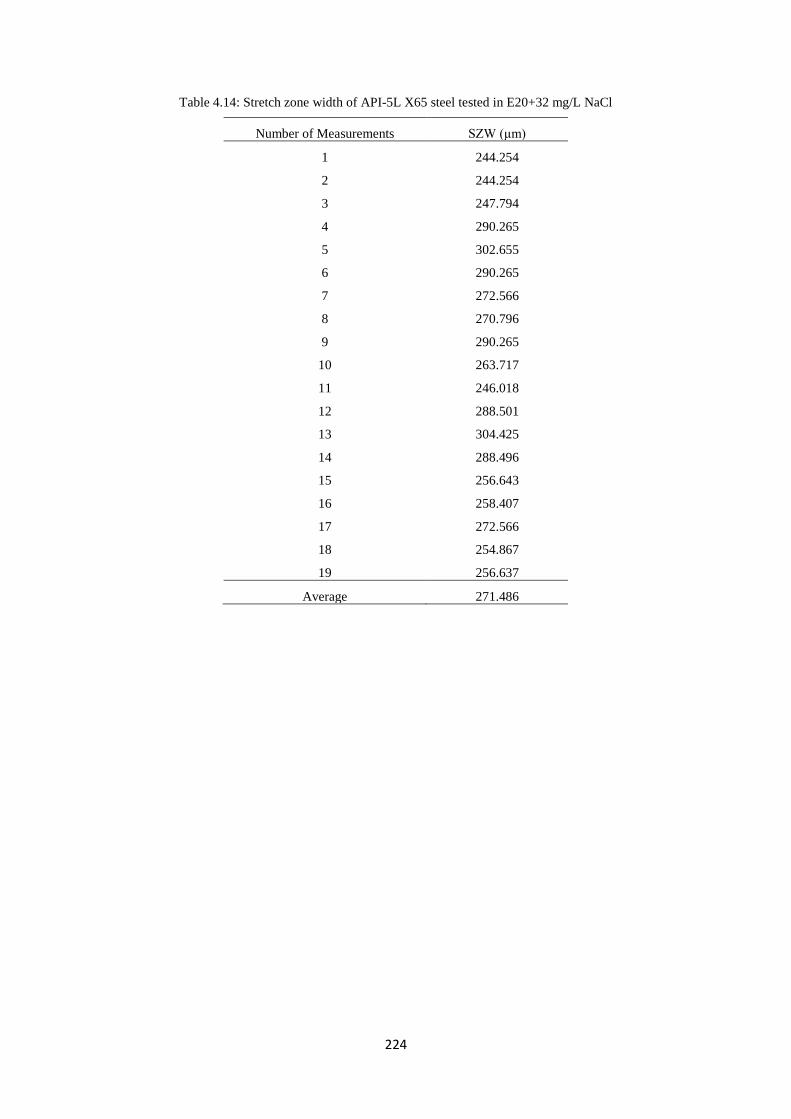
224
Table 4.14: Stretch zone width of API-5L X65 steel tested in E20+32 mg/L NaCl
Number of Measurements SZW (μm)
1 244.254
2 244.254
3 247.794
4 290.265
5 302.655
6 290.265
7 272.566
8 270.796
9 290.265
10 263.717
11 246.018
12 288.501
13 304.425
14 288.496
15 256.643
16 258.407
17 272.566
18 254.867
19 256.637
Average 271.486
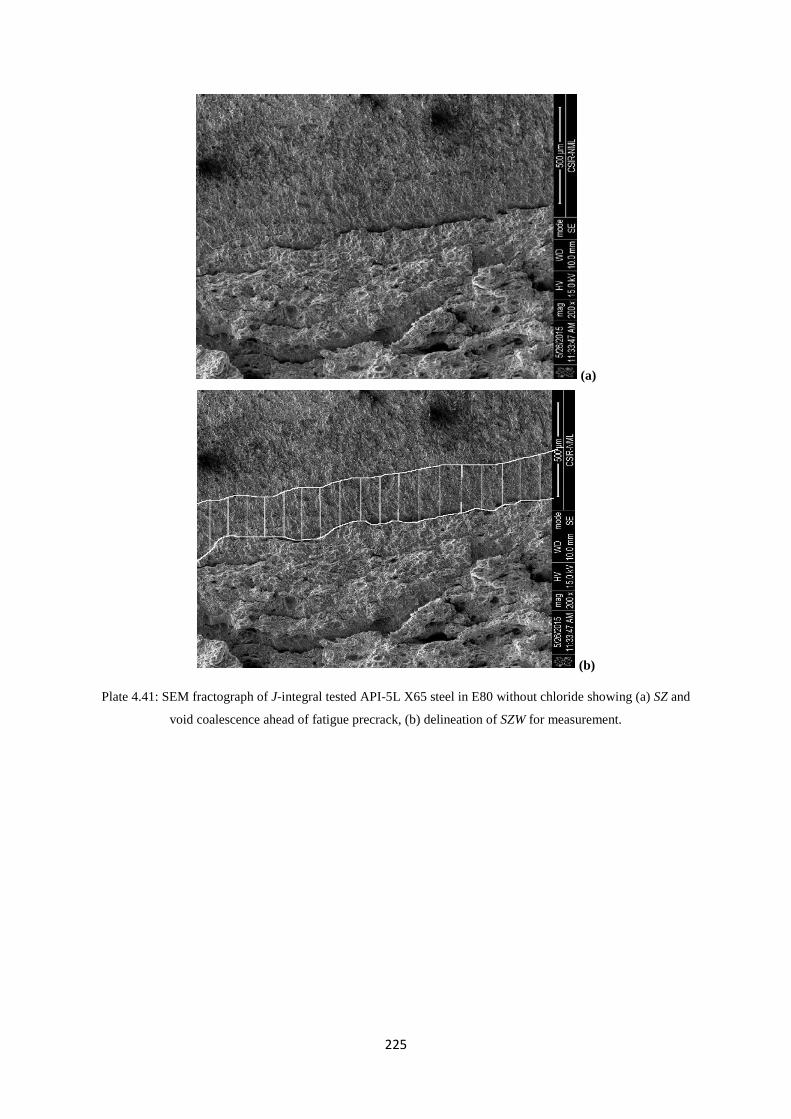
225
(a)
(b)
Plate 4.41: SEM fractograph of J-integral tested API-5L X65 steel in E80 without chloride showing (a) SZ and
void coalescence ahead of fatigue precrack, (b) delineation of SZW for measurement.
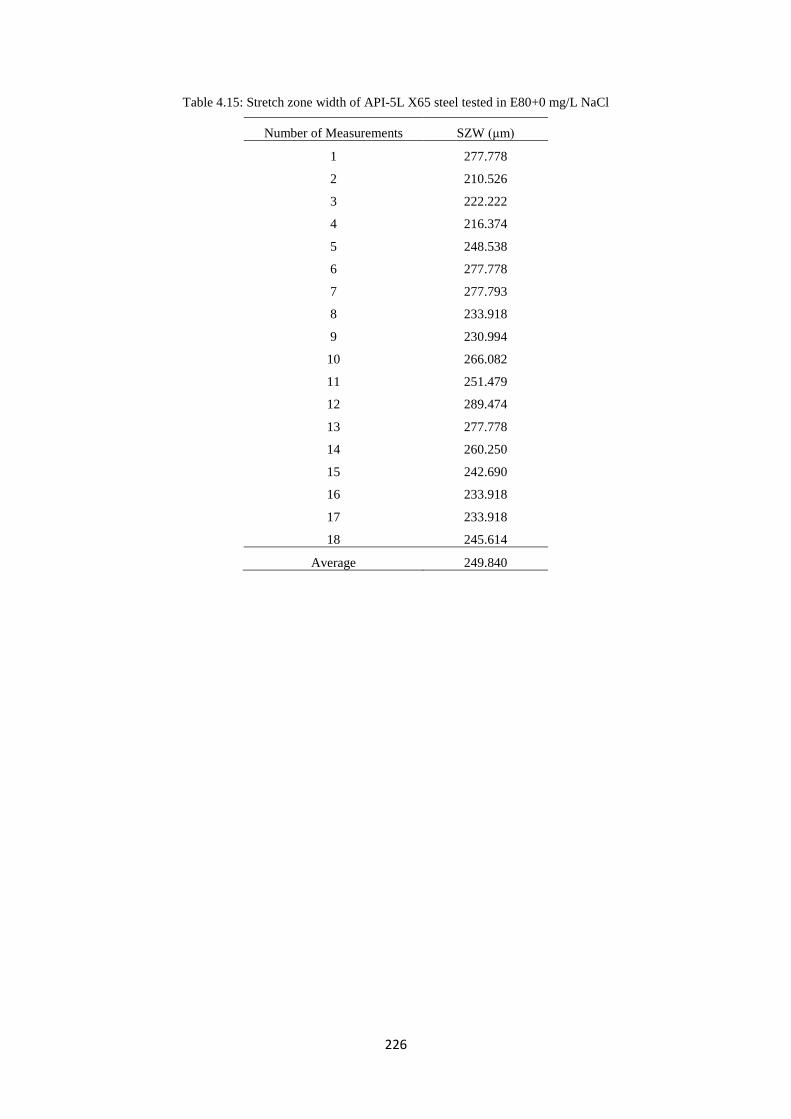
226
Table 4.15: Stretch zone width of API-5L X65 steel tested in E80+0 mg/L NaCl
Number of Measurements SZW (μm)
1 277.778
2 210.526
3 222.222
4 216.374
5 248.538
6 277.778
7 277.793
8 233.918
9 230.994
10 266.082
11 251.479
12 289.474
13 277.778
14 260.250
15 242.690
16 233.918
17 233.918
18 245.614
Average 249.840
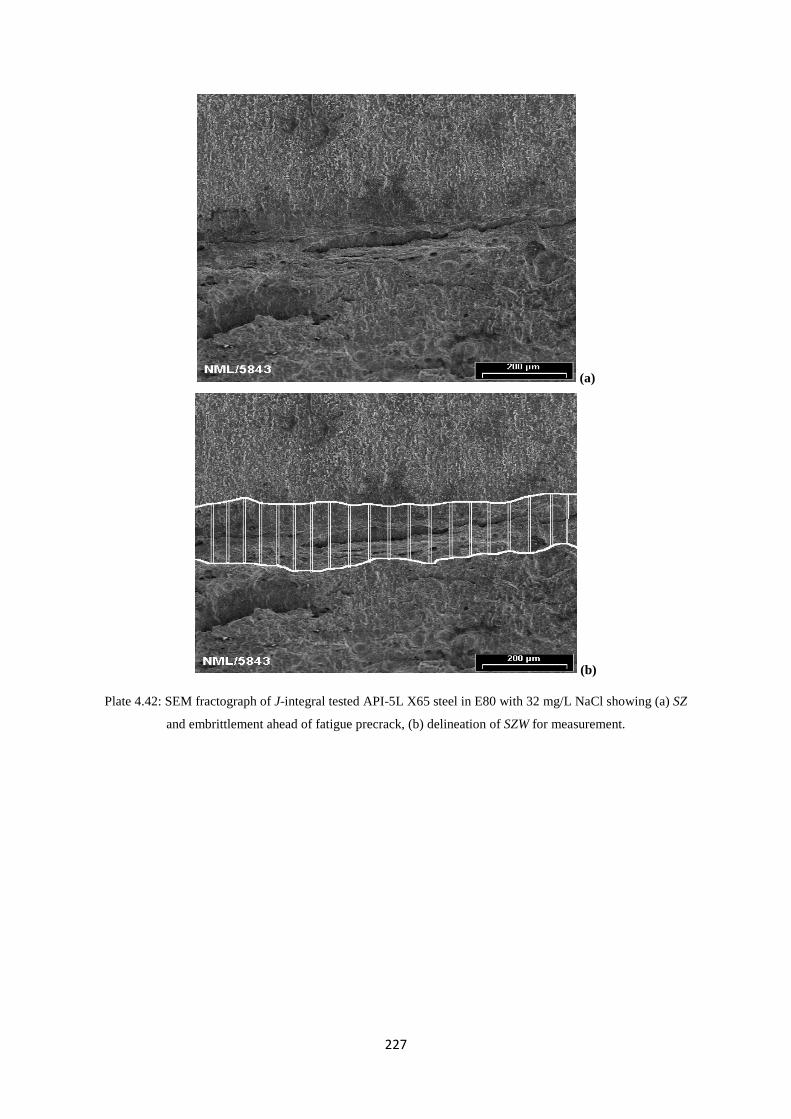
227
(a)
(b)
Plate 4.42: SEM fractograph of J-integral tested API-5L X65 steel in E80 with 32 mg/L NaCl showing (a) SZ
and embrittlement ahead of fatigue precrack, (b) delineation of SZW for measurement.
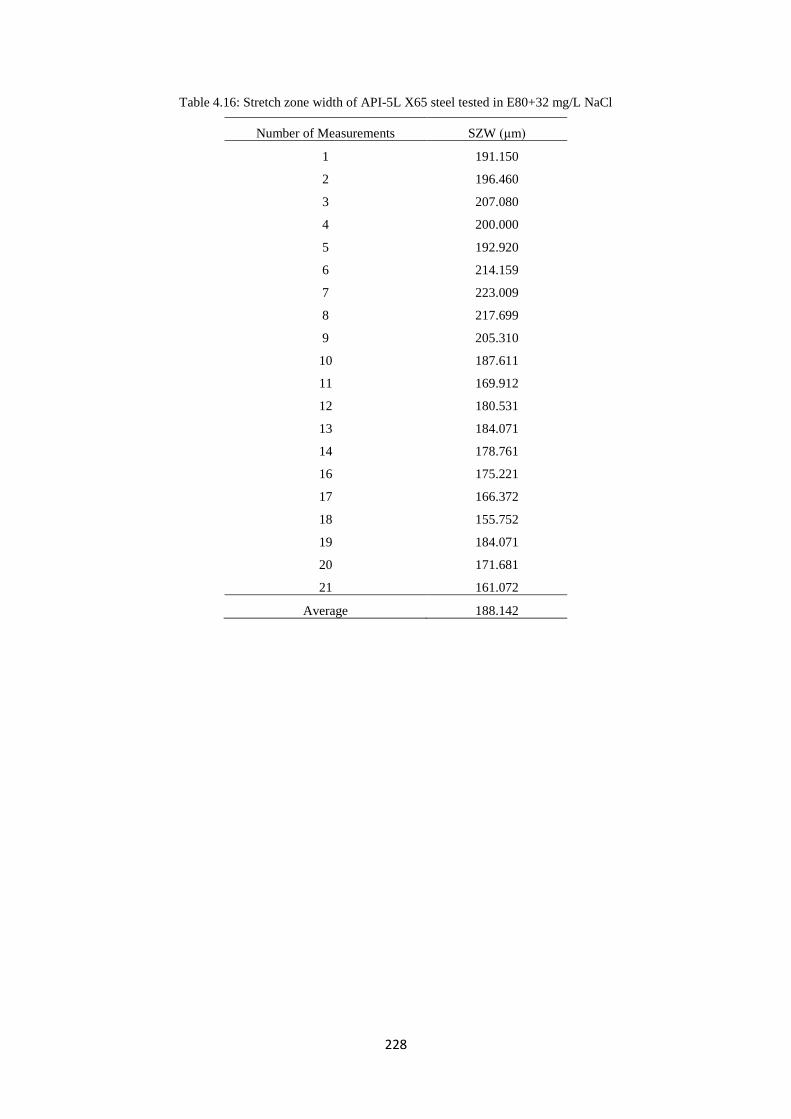
228
Table 4.16: Stretch zone width of API-5L X65 steel tested in E80+32 mg/L NaCl
Number of Measurements SZW (μm)
1 191.150
2 196.460
3 207.080
4 200.000
5 192.920
6 214.159
7 223.009
8 217.699
9 205.310
10 187.611
11 169.912
12 180.531
13 184.071
14 178.761
16 175.221
17 166.372
18 155.752
19 184.071
20 171.681
21 161.072
Average 188.142
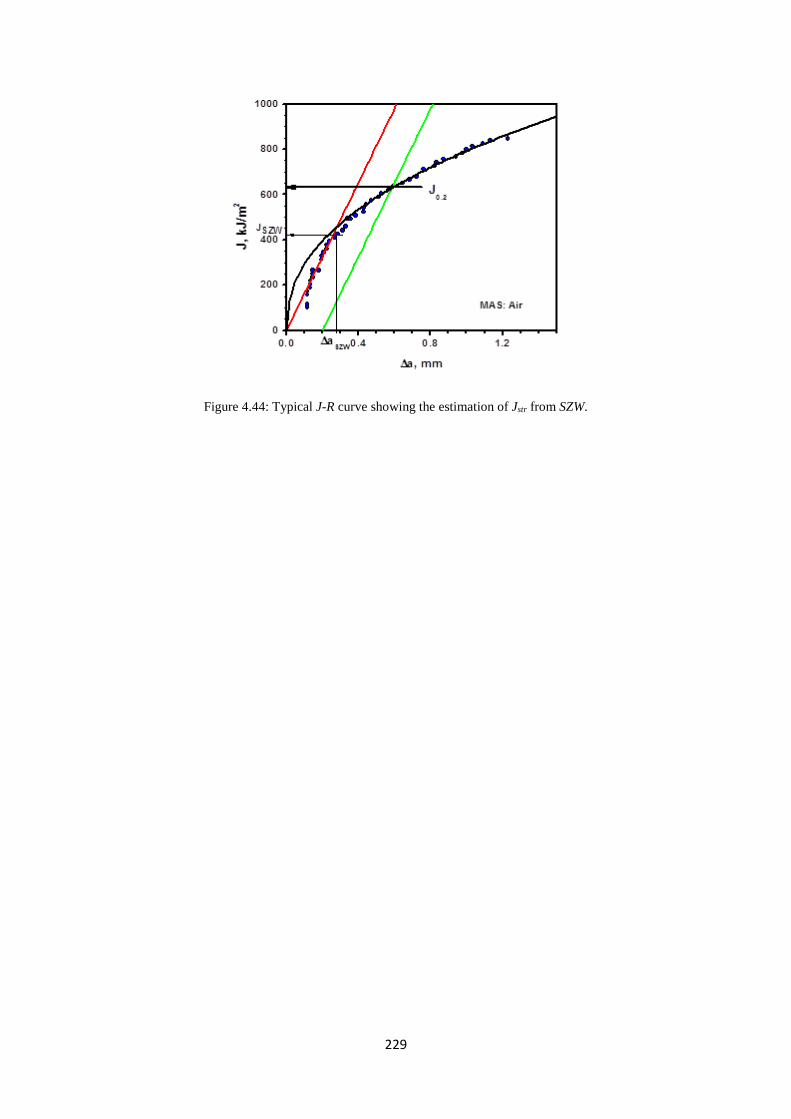
229
Figure 4.44: Typical J-R curve showing the estimation of Jstr from SZW.

230
(a)
(b)
Figure 4.45: Variation of Ji and Jstr of MAS specimens with (a) E20 and, (b) E80 test environment.
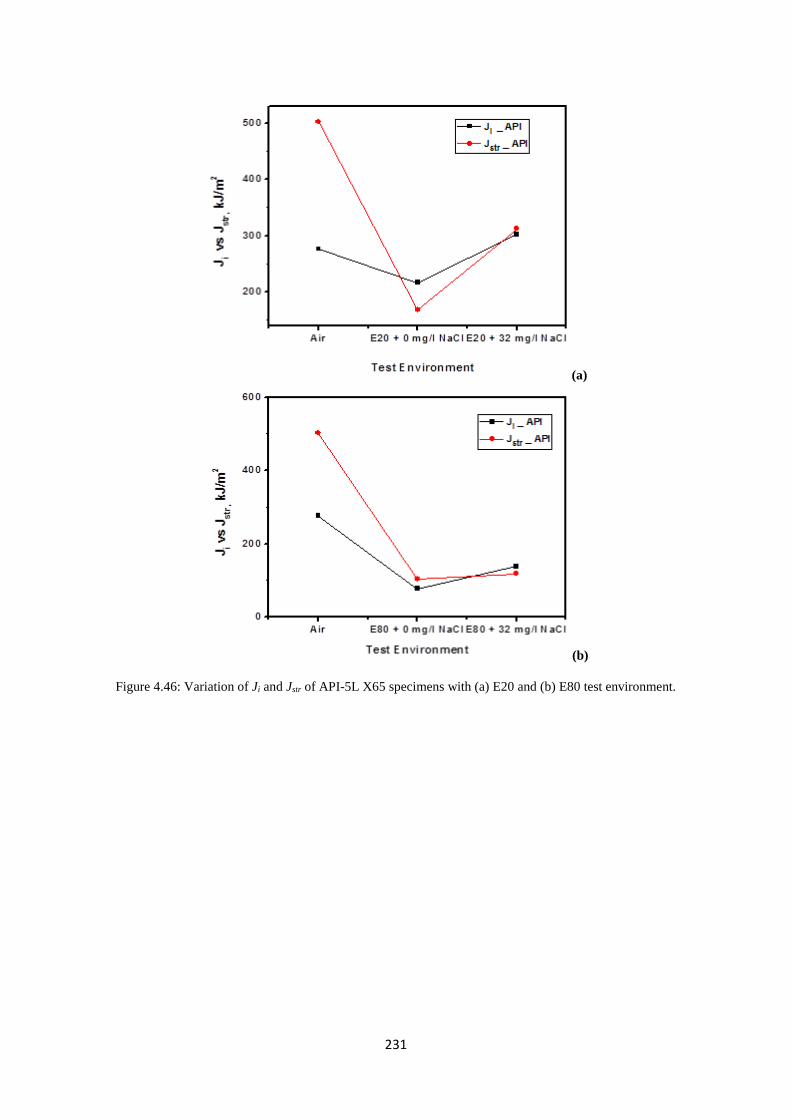
231
(a)
(b)
Figure 4.46: Variation of Ji and Jstr of API-5L X65 specimens with (a) E20 and (b) E80 test environment.
232
4.4.1 Summary
From the investigation carried out on initiation fracture toughness measurement via stretch
zone geometry in micro-alloyed and API-5L X65 steels, it can be concluded that:
1. There was occurrence of repeated stretching after the first initiation of ductile crack
extension for MAS specimen in air. This is because there were no mature voids ahead
of the crack to result in continued growth through coalescence due to absence of
adequate stress triaxiality at the crack tip that supports and promotes void generation
and growth. Jstr did not reflect the trend exhibited by Ji for MAS in E20.
Consequently, the Jstr obtained is unsuitable for representing the initiation toughness
of MAS in E20.
2. Jstr reflected the same trend exhibited by Ji for MAS in E80, therefore, Jstr can be said
to be suitable for representing the initiation toughness of MAS in E80.
3. There was increase in the expanse of stretch zone on API-5L X65 steel fracture
surfaces as reflected by the trend of fracture toughness values in the presence of E20
and E80 fuel ethanol environments. Furthermore, for all the test conditions, the stretch
zone could be readily identified. The nature of variation of Jstr with test environment
strongly qualifies the use of SZW for determining fracture toughness of API-5L X65
in E20 and E80.
233
CHAPTER FIVE
CONCLUSION AND RECOMMENDATION
5.1 Introduction
The aim of this work is to determine the suitability of micro-alloyed and API-5L X65 steels
for fuel ethanol applications. Specifically, the goals were to investigate the influence of
sodium chloride and ethanol concentrations on corrosion rate and polarization behaviour
using mass loss and potentiodynamic techniques. In addition, the investigations carried out
involved the determination of fracture toughness, blunting slope and tearing modulus of API-
5L X65 steel and MAS in simulated fuel ethanol environments using EPFM. Failure
mechanisms and morphology were also determined through fractography and microscopy.
In this chapter, conclusions are drawn with clear emphasis on the material possessing superior
compatibility with the fuel ethanol environments, based on the tested criteria.
5.2 Conclusion on Corrosion and Morphological Behaviour
1) When Cl- ion is present, pitting corrosion of MAS and API-5L X65 steel occurs in
E20, E40 and E80 fuel ethanol environments.
2) Comparing all the test conditions with and without chloride, there is an indication that
the presence of NaCl increased the overall corrosion rate in E20, E40, and E80. There
was a negative effect of NaCl, either in low or high concentrations on the behaviour
and surface chemistry of MAS in the three fuel ethanol environments.
3) For API-5L X65 steel, such effect of NaCl was revealed only in E80 showing
increasing corrosion rate with increasing chloride. Exposure of API-5L X65 to E20
and E40 showed passivation action of thick oxide films in slowing down corrosion
rate.
4) Corrosion rates of MAS and API-5L X65 steel were found to depend on changes in
ethanol concentration irrespective of chloride content. Very high concentration of
ethanol in fuel ethanol such as E80 tended to be very corrosive for both steels. In
unleaded gasoline, there was no mass loss; as a result, corrosion rate was zero.
5) Corrosion rate of API-5L X65 steel was increased by selective dissolution of ferrite.
With increasing ethanol concentration and concurrent decrease in gasoline
concentration, the dissolution of ferrite increased.
234
6) Electrochemical measurements showed no clear passivation and pitting potential for
MAS and API-5L X65 steel. The formation of iron hydroxide film on the surface of
tested specimens indicates the likely effect of water in the simulated fuel ethanol
environments on the steels.
5.3 Conclusion on Fracture behaviour and Failure Modes
1) There was decrease in fracture resistance of both Micro-alloyed and API-5L X65
steels in E20 and E80 fuel ethanol environments with respect to air. There is an
exception of improved fracture resistance in E20 with respect to air for MAS in E20
without chloride.
2) Fracture toughness (J0.2, Ji, and KJ0.2) of MAS decreased in the presence of NaCl but
increased for API-5L X65 steel. The failure mode of both micro-alloyed and API-5L
X65 steels in air is ductile fracture indicated by microvoid coalescence.
3) In E20, chloride resulted in increased resistance to ductile tearing for both steels
leading to transgranular fracture.
4) In E80 with 32 mg/l NaCl, the failure mode of MAS is pitting and quasi-cleavage
fracture while API-5L X65 steel shows cracks in addition to quasi-cleavage. The
fractographs displays comparable results with that of immersion tests which shows
that the extent of degradation of both steels is higher in E80 when compared to E20.
5) The presence of chloride increased the stress intensity of API-5L X65 steel at the
crack tip, by accelerating corrosion. Increasing the stress intensity at the crack tip
accounted for retarded anodic dissolution, increased crack tip blunting and
consequently increased fracture toughness of API-5L X65 steel. Conversely, in all
tests for MAS, chloride resulted in decreased crack tip blunting and decreased fracture
toughness.
6) Investigations on the effect of ethanol concentration showed that the materials were
more compatible with E20 environment. Anodic dissolution was higher in E80.
7) There is correlation between the results obtained from immersion tests and fracture
tests. Increasing corrosion rates were observed for MAS with increase in chloride and
ethanol concentrations, similarly, deterioration of fracture toughness was observed
with increase in chloride and ethanol concentrations. However, for API-5L X65 steel,
as the material was seen to display increased resistance to the diffusion of chloride in
the immersion tests, similar behaviour was observed in the fracture tests. Fracture
toughness of API-5L X65 steel increased with increase in chloride.
235
8) Fracture toughness values determined for API-5L X65 and MAS specimens in E20
were size dependent and so amenable to comparisons only with specimens of similar
size. J0.2 for API-5L X65 specimens in E80 + 0 mg/l NaCl and E80 + 32 mg/l NaCl
qualifies as critical fracture toughness JIC.
9) A comparison of the TR values for both steels show that resistance to crack extension
in API-5L X65 was generally lower than in MAS for all the test conditions.
10) On the whole, investigations on the influence of ethanol on the fracture behaviour of
the two steels in E20 and E80 environments (with and without chloride), reveals that
both steels are more compatible with E20 environment.
11) Micro-alloyed steel material exhibited overall superior fracture toughness in
comparison with API-5L X65 steel in both E20 and E80.
5.4 Contributions to Knowledge and Implications for the Fuel Industry
The kinetics of corrosion behaviour, fracture behaviour and crack growth depends on the
material-environment system. This work centered on E20, E40 and E80 blends, which contain
20, 40 and 80% ethanol respectively. Corrosion and fracture studies were carried out to
evaluate and predict the resistance of micro-alloyed and API-5L X65 steels in the fuel ethanol
environments. It is important to state that function, material, shape and process do interact.
The specification of process limits the materials you can use and the shapes they can take
(Ashby, 2005). In other words, the process of employing fuel ethanol in the fuel industry and
its associated corrosion and stress corrosion failures has invariably placed a limit on the
materials that can be used as pipes, storage tanks and the required automotive parts.
The contributions of this research study to knowledge are stated below:
1) The comparative assessments carried out in this work would be of optimal benefit to
designers in the fuel, automotive, aviation, and chemical industries. Micro-alloyed
steel is revealed as superior to API-5L X65 steel, with respect to compatibility with
air, E20 and E80 environments based on its corrosion rates, Ji, J0.2, TR, KJ0.2 values and
failure modes.
2) It is important to note that a designer must give considerable attention to crack
propagation resistance in order to ensure reliable performance of materials
(Steigerwald, 1969). In this work, the resistance to crack propagation (TR) in air, E20
and E80, has been determined for the two pipeline steels. Micro-alloyed steel showed
236
higher resistance to crack extension or propagation both in air and in the fuel ethanol
environments. Requirements for design, materials and inspection may then be
established in a conventional manner relative to the estimates of progressive crack
extension behaviour presented in this study.
5.5 Recommendations for Future Work
In the context of the major findings of this work, and the conclusions that have been arrived
at, further work needs to be carried out in order to comprehend the details of the materials’
degradation in E20 and E80 fuel ethanol environments. The following recommendations are
deemed desirable:
1. Correlation between the simulated fuel ethanol and commercial fuel ethanol should be
investigated for API-5L X65 and micro-alloyed steels.
2. Though the influence of chloride in the corrosion and fracture behaviour of API-5L
X65 and micro-alloyed steels is now understood, other contaminants causing
corrosion and stress corrosion cracking of steels in fuel ethanol still exist in literature.
It is therefore imperative that the influences of these contaminants are investigated in
the corrosion and fracture behaviour of the two steels.
3. In this work, monotonic stresses were used to study the fracture behaviour of API-5L
X65 and micro-alloyed steels. Since pipelines also undergo fluctuations in operating
pressure, the effects of cyclic stresses should be investigated in the fracture behaviour
of the steels.
237
REFERENCES
Abel, J., & Virtanen, S. (2015). Corrosion of martensitic stainless steel in ethanol-containing
gasoline: Influence of contamination by chloride, H2O and acetic acid. Corrosion
Science, 98, 318-326. doi:10.1016/j.corsci.2015.05.027
Akanji, O. L., Loto, C. A., Popoola, A. P. I., Abdulwahab, M., & Kolesnikov, A. V. (2016).
Anti-corrosion and computational study of mild steel in hydrochloric acid using
calcium gluconate as inhibitor. Asian Journal of Chemistry, 28(7), 1417-1423.
Amouzouvi, K. F., & Bassim, M. N. (1982). Determination of fracture toughness from stretch
zone width measurement in predeformed AISI type 4340 steel. Material Science and
Engineering, 55(2), 257-262.
Anderson, T. L. (1995). Fracture Mechanics, Fundamentals and Applications (2nd ed.).
USA: CRC Press Inc.
Anderson, T. L. (2004). Dynamics and vibrations. Electrical Engineering Handbook, (2nd
ed.). USA: CRC Press Inc.
Anderson, Ted L., & Anderson, T. L. (2005). Fracture mechanics: Fundamentals and
applications (3rd ed.). USA: CRC Press Inc.
API Bulletin 939E. (2013). Identification, Repair, and Mitigation of Cracking of Steel
Equipment in Fuel Ethanol Service (2nd ed.). Retrieved from www.techstreet.com
API Technical Report 939-D. (2007). Stress Corrosion Cracking of Carbon Steel in Fuel-
Grade Ethanol: Review, Experience Survey, Field Monitoring and Laboratory Testing
(2nd ed. Part I – IV). Retrieved from http://mycommittees.api.org
238
API Technical Report 939-D. (2013). Stress Corrosion Cracking of Carbon Steel in Fuel-
Grade Ethanol: Review, Experience Survey, Field Monitoring and Laboratory Testing
(2nd ed. Part V – VIII). Retrieved from http://mycommittees.api.org
Aravind, K. (2009). J-R behaviour of 20MnMoNi55 pressure vessel steel (Master’s thesis,
National Institute of Technology, Rourkela, India). Retrieved from
ethesis.nitrkl.ac.in/1395/2/bmdthesis.pdf
Ashby, M. F. (2005). Materials selection in mechanical design (3rd ed.). Oxford: Butterworth
Heinemann.
ASM International. (2000). Corrosion: Understanding the basics (#06691G). Ohio, USA:
ASM
ASTM Committee E24. (1965). STP 381 Fracture Toughness Testing and Its Applications.
Philadelphia. West Conshohocken, PA, USA: ASTM International.
ASTM-D-4806-01a. (2001). Annual Book of ASTM Standards. West Conshohocken, PA,
USA: ASTM International.
ASTM E1820-08a. (2008). Standard Test Method for Measurement of Fracture Toughness.
West Conshohocken, PA, USA: ASTM International.
ASTM E647-03. (2003). Standard Test Method for Measurement of Fatigue Crack Growth
Rates. West Conshohocken, PA, USA: ASTM International.
ASTM E8/E8M-15a. (2015). Standard Test Method for Tension Testing of Metallic
Materials. West Conshohocken, PA, USA: ASTM International.
ASTM G1-03. (2011). Standard Practice for Preparing, Cleaning and Evaluating Corrosion
Test Specimens. West Conshohocken, PA, USA: ASTM International.
239
ASTM Spec. Tech. (1966). Plane Strain Crack Toughness Testing of High Strength Metallic
Materials, 410. West Conshohocken, PA, USA: ASTM International.
Baena, L. M., Gomez, M., & Calderon, J. A. (2012). Aggressiveness of a 20% Bioethanol-
80% Gasoline mixture on autoparts: I Behaviour of Metallic Materials and Evaluation
of Their Electrochemical Properties. Fuel, 95, 320-328.
Balasubramaniam, R., Kumar, A. V. R., Dillmann, P. (2003). Characterization of rust on
ancient Indian iron. Current Science, 58, 1546-1555.
Baldev, R., Kamachi, M. U. & Rangarajan, S. (2009). Corrosion prevention and control.
India: Alpha Science International Limited.
Barr, T. L. (1979). An ESCA study of the termination of the passivation of elemental metals.
Journal of Physical Chemistry, 82(16), 1801–1810. Retrieved from
http://www.citeulike.org
Bassim, M. N. (1995). Use of stretch zone for the characterization of ductile fracture. Journal
of Materials Processing Technology, 54(1-4), 109-113. doi:10.1016/0924-
0136(95)01928-6
Bassim, M. N., Mathews, J. R., & Hyatt, C. V. (1992). Evaluation of fracture toughness of
HSLA 80 steel at high loading rates using stretch zone measurements. Engineering
Fracture Mechanics, 43, 297-303.
Beavers, J. A., Brongers, M. P., Agrawal, A. K., & Tallarida, F. A. (2008). Prevention of
internal SCC in ethanol pipelines. Paper presented at Corrosion 2008, NACE
Conference & EXPO, New Orleans, Louisiana. Retrieved from
https://www.onepetro.org/conference-paper/NACE-08153
240
Beavers, J. A., & Gui, F. (2010). Recent progress in understanding and mitigating SCC of
ethanol pipelines. Paper presented at Corrosion 2010, NACE International, San
Antonio, Texas. Retrieved from https://www.onepetro.org/conference-paper/NACE-
10072
Beavers, J. A., Gui, F., & Sridhar, N. (2011). Effects of environmental and metallurgical
factors on the stress corrosion cracking of carbon steel in fuel-grade ethanol.
Corrosion, 67(2), 025005-1-025005-15. doi: http://dx.doi.org/10.5006/1.3553341
Brian, C. L. & Banerji, S. K. (1978). Intergranular failure in steel: The Role of Grain-
Boundary Composition. International Metals reviews, 23(1), 164-199.
doi: http://dx.doi.org/10.1179/imtr.1978.23.1.16
Brown, K. R., & Baratta, F. I. (1992). Chevron-notch fracture test experience: Metals and
Non-Metals. Philadelphia, PA: ASTM STP 1172.
Cao, W. D., & Lu, X. P. (1984). On the relationship between the geometry of deformed crack
tip and crack parameters. In G. C. Sih, E. Sommer & W. Dahl (Eds.), Application of
Fracture Mechanics to Materials and Structures (pp. 525-545). Netherlands: Springer.
doi: 10.1007/978-94-009-6146-3_34
Cao, L. (2012). Corrosion and Stress Corrosion Cracking of Carbon Steel in Simulated Fuel
Grade Ethanol (Ph.D. thesis, Ohio State University, Ohio, USA). Retrieved from
http://rave.ohiolink.edu/etdc/view?acc_num=osu1345141634
Cao, L., Frankel, G. S., & Sridhar, N. (2013). Effect of chloride on stress corrosion cracking
susceptibility of carbon steel in simulated fuel grade ethanol. Electrochimica Acta,
104, 255–266. doi:10.1016/j.electacta.2013.04.112
241
Chowdhury, T., Sivaprasad, S., Bar, H. N., Tarafder, S., & Bandyopadhyay, N. R. (2015).
Stretch zone formation in cyclic fracture of 20MnMoNi55 pressure vessel steel.
Engineering Fracture Mechanics, 148, 60-72. doi:10.1016/j.engfracmech.2015.09.026
Concawe. (2008). Guidelines for handling and blending motor gasoline containing up to 10%
v/v ethanol (report number 3/08). Brussels: Special Task Force, FE/STF-24.
Cottis, R. A., & Loto, C. A. (1986). Electrochemical noise generation during stress corrosion
cracking. Materials Science Forum, 8, 201-214.
Cottis, R. A., & Loto, C. A. (1990). Electrochemical noise generation during SCC of a high-
strength carbon steel. Corrosion, 46(1), 12-19. doi: 10.5006/1.3585059
Das, S. K., Sivaprasad, S., Das, S., Chatterjee, S., & Tarafder, S. (2006). The effect of
variation of microstructure on fracture mechanics parameters of HSLA-100 steel.
Materials Science and Engineering A, 431, 68-79.
Dayal, R. K., & Parvathavarthini, N. (2003). Hydrogen embrittlement in power plant steels.
Sadhana, 28, 431–451. Retrieved from http://www.ias.ac.in
Desouky, H. E., & Aboeldahab, H. A. (2014). Effect of chloride concentration on the
corrosion rate of maraging steel. Open Journal of Physical Chemistry, 4, 147-165.
http://dx.doi.org/10.4236/ojpc.2014.44018
De Souza, J. P., Mattos, O. R., Sathler, L., & Takenouti, H. (1987). Impedance measurements
of corroding mild steel in an automotive fuel ethanol with and without inhibitor in a
two and three electrode cell. Corrosion Science, 27, 1351-1364.
242
Dezhi, Z., Rui, C., Zhi, Z., Liyun, S., Guoping, L., Gang, T., & Taihe, S. (2012). Research on
stress corrosion sensitivity of C110 casing in wellbore protection fluid. Energy
Procedia 16, 816 – 821.
Dieter, G. E. (1988). Mechanical Metallurgy, SI Metric Edition, London: McGraw-Hill Book
Company.
Dietzel, W. (2001). Fracture mechanics approach to stress corrosion cracking. Anales De
Mecanica De La Fractura, 18, 1-7. Retrieved from
http://www.gef.es/Congresos/18/pdf/
Dominic, R., & Rainer, J. (2007). Biofuels technology handbook. Sylvensteinstr. 81369
Munchen, Germany: WIP Renewable Energies.
Dong, Y. (2008). Factors affecting stress assisted corrosion cracking of carbon steel under
industrial boiler conditions (Ph.D thesis, Georgia Institute of Technology, Atlanta,
USA). Retrieved from http://smartech.gatech.edu
Dong-Jin, K., Hyuk, C. K., Hyun, W. K., Seong, S. H., & Hong, P. K. (2011). Oxide
properties and stress corrosion cracking behaviour for alloy 600 in leaded caustic
solutions at high temperature. Corrosion Science, 53, 1247–1253.
Ertekin, A., & Sridhar, N. (2010). Effects of sequential fuel transitions from ethanol blends to
neat gasoline on the performance of polymeric materials subjected to static loading.
Paper presented at the NACE International Annual Corrosion Conference, San
Antonio, Texas.. Retrieved from http://www.onepetro.org
Fessler, R. R., & Barlo, T. J. (1984). Threshold-stress determination using tapered specimens
and cyclic stresses, environment – sensitive fracture: Evaluation and Comparison of
243
Test Methods. ASTM STP 821, 368-382. Retrieved from www.emc-
sq.com/MaxeyLecture%20Slides%20091812%20Fessler.pdf
Fushimi, K., & Seo, M. (2001). Initiation of a local breakdown of passive film on iron due to
chloride ions generated by a liquid-phase ion-gun for local breakdown. Journal of
Electrochemical Society, 148(11), B459–B456.
Goodman, L., & Singh, P. M. (2009). Effects of chemical composition of ethanol fuel on
carbon steel pipelines. Paper presented at the 11th international Conference on
Advanced Materials (ICAM 2009), Rio de Janeiro, Brazil. Retrieved from
http://www.sbpmat.org.br/icam2009dir/submission/autor/arquivos/BB723.pdf
Goodman, L. R., & Singh, P. M. (2012). Repassivation behaviour of X65 pipeline steel in
fuel grade ethanol and its implications for the stress corrosion cracking mechanism.
Corrosion Science 65, 238-248.
Gui, F., Sridhar, N., Beavers, J. A., Trillo, E. A., & Singh, P. M. (2010). Effect of ethanol
composition on the SCC susceptibility of carbon steel. Paper presented at Corrosion
2010, NACE International, San Antonio, Texas.
Gupta, N., & Pachauri, P. (2012). Experimental and computational investigation of crack
growth initiation in compact tension (CT) specimen. International Journal of
Scientific and Research Publications, 2(8), 1-7. Retrieved from
http://www.ijsrp.org/research-paper-0812/ijsrp-p0825.pdf
Hanesch, M. (2009). Raman spectroscopy of iron oxides and (oxy)hydroxides at low laser
power and possible applications in environmental magnetic studies. International
Journal of Geophysics, 177, 941-948.
244
Hertzberg, R. W., Vinci, R. P. & Hertzberg, J. L. (2013). Deformation and fracture
mechanics of engineering materials (5th ed.). USA: John Wiley and Sons Inc.
Heusler, K. E., & Fisher, L. (1976). Kinetics of pit initiation at passive iron. Werkstoffe und
Korrosion, 27(8), 551–556.
Highina, B. K., Bugaje, I. M., & Umar, B. (2012). Liquid biofuels as alternative transport
fuels in Nigeria. Petroleum Technology Development Journal, 1, 1-15.
Hopkins, P., & Jolley, G. (1983). Limitations of the crack tip blunting line used in the JIC test
procedure. Engineering Fracture Mechanics, 18(1), 239-242. doi: 10.1016/0013-
7944(83)90110-8
Hugh, I. L. (1962). Studies of the stress-corrosion cracking of low-carbon steels, Journal of
Research of the National Bureau of Standards-C. Engineering and Instrumentation,
66C(4), 1-10. doi.org/10.6028/jres.066C.03.
Ian Milne, Ritchie, R. O., & Karihaloo, B. L. (2003). Comprehensive structural integrity.
London: Newnes.
Jegdic, B., Radovanovic, S. P., Ristic, S., & Alil, A. (2011). Corrosion processes, nature and
composition of corrosion products on iron artefacts of weaponry. Scientific Technical
Review, 61(2), 50-56.
Johnson, H. H., & Willner, A. M. (1965). Moisture and stable crack growth in high strength
steel, Applied Materials Research, 4(1), 34-40.
Kane, R. D., Maldonado, J. G., & Klein, L. J. (2004). Stress corrosion cracking in fuel
ethanol: a newly recognized phenomenon. Paper presented at Corrosion 2004, NACE

245
International, Houston, Texas. Retrieved from http://icorr.net/wp-
content/uploads/2011/01/Ethanol l_SCC.pdf
Kane, R. D., Sridhar, N., Brongers, M., Beavers, J. A., Agarwal, A. K., & Klein, L. (2005).
Stress corrosion cracking in fuel ethanol: a recently recognized phenomenon.
Materials Performance, 44(12), 50–55. Retrieved from
http://www.asminternational.org
Kane, R. D. (2007). A new approach to corrosion monitoring. Chemical Engineering, 34-41.
Retrieved from https://www.honeywellprocess.com
Kobayashi, A. S. (1973). Experimental techniques in fracture mechanics. Society for
Experimental Stress Analysis, Westport, Conn: Kobayashi Ed.
Kuri, S. E., Monteiro, M. R., & Ambrozin, A. R. P. (2010). Evaluation of metallic corrosion
caused by alcohol fuel and some contaminants. Material Science Forum, 636, 1024-
1029. Retrieved from www.scientific.net
Loto, C. A. (2012). Electrochemical noise measurement technique in corrosion research.
International Journal of Electrochemical Science, 7, 9248-9270.
Loto, C. A., & Cottis, R. A., (1987). Electrochemical noise generation during stress
corrosion cracking of alpha-brass. Corrosion, 43(8), 499-504. doi:
10.5006/1.3583893
Loto, C. A., & Cottis, R. A., (1989). Electrochemical noise generation during stress
corrosion cracking of the high-strength aluminium AA 7075-T6 alloy. Corrosion,
45(2), 136-141. doi: 10.5006/1.3577831
246
Loto, C. A., Joseph, O. O., & Loto, R. T. (2013). Inhibition effect of vernonia amygdalina
extract on the corrosion of mild steel reinforcement in concrete in 0.2M H2SO4
environment. European Journal of Environmental and Civil Engineering, 17(10),
1026-1038. doi:10.1080/19648189.2013.841596
Loto, C. A., Joseph, O. O., Loto, R. T., & Popoola, A. P. I. (2015). Effect of zinc oxide on the
corrosion inhibition of mild steel embedded in concrete in 3.5% NaCl solution. Der
Pharma Chemica, 7(12), 85-96.
Loto, R. T., Loto, C. A., Popoola, A. P., & Fedetova, T. (2016). Electrochemical studies of
the inhibition effect of 2-dimethylaminoethanol on the corrosion of austenitic stainless
steel type 304 in dilute hydrochloric acid. Silicon, 8(1), 145-158. doi 10.1007/s12633-
015-9344-1
Lou, X. (2010). Stress corrosion cracking and corrosion of carbon steel in simulated fuel-
grade ethanol. (Ph.D. thesis, Georgia Institute of Technology, Atlanta, USA).
Retrieved from https://smartech.gatech.edu/handle/1853/37279?show=full
Lou, X., Yang, D., & Singh, P.M. (2009). Effect of ethanol chemistry on stress corrosion
cracking of carbon steel in fuel-grade ethanol, Corrosion, 65(12), 785-797. Retrieved
from www.corrosionjournal.org/doi/pdf/10.5006/1.3319105
Lou, X., & Singh, P. M. (2010). Role of water, acetic acid and chloride on corrosion and
pitting behaviour of carbon steel in fuel-grade ethanol. Corrosion Science, 52, 2303-
2315. doi: 10.1016/j.corsci.2010.03.034
Lou, X., Yang, D., Goodman, R. L., & Singh, P. M. (2010). Understanding the stress
corrosion cracking of X-65 pipeline steel in fuel grade ethanol. Paper presented at
247
Corrosion 2010 Conference and Exposition, NACE International, San Antonio, Texas.
Retrieved from https://www.onepetro.org/conference-paper/NACE-10073
Lou, X., & Singh, P. M. (2011). Phase angle analysis for stress corrosion cracking of carbon
steel in fuel-grade ethanol: Experiments and simulation, Electrochimica Acta 56(4),
1835–1847.
Macdonald, D. D. (1992). The point defect model for the passive state, Journal of the
Electrochemical Society, 139(12), 3434–3449.
Maldonado, J. G., & Kane, R. D. (2008). Stress corrosion cracking of carbon steel in fuel
ethanol service. Environment-Induced Cracking of Materials, 2, 337-347.
doi:10.1016/B978-008044635-6.50070-4
McIntyre, D. R., Kane, R. D., & Venkatesh, A. (2009). SCC behavior of steel in fuel ethanol
and butanol. Paper presented at Corrosion 2009 Conference and Exposition, NACE
International, San Antonio, Texas. Retrieved from
https://www.onepetro.org/conference-paper/NACE-09530
McMahon Jr, C. J., & Cohen, M. (1965). Initiation of cleavage in polycrystalline iron. Acta
Metallurgica, 13(6), 591-604.
Micic, V., & Jotanovic, M. (2015). Bioethanol as fuel for internal combustion engines.
Zastita Materijala, 56(4), 403 – 408. doi: 10.5937/ZasMat1504403M
Minnesota Centre for Automotive Research. (2008). The effects of E20 on metals in
automotive fuel system components (SAE Paper 2-22-2008). USA: Jones, B., Mead,
G., Stevens, P., & Timanus, M.
248
Minnesota Pollution Control Agency. (2008). E20: the feasibility of 20 percent ethanol
blends by volume as a motor fuel, executive summary results of materials
compatibility and drivability testing. Minnesota, USA. Retrieved from
http://www.ethanolrfa.org/wp-content/uploads/2015/09/
Mohammad, S. A. (2005). Structural integrity and fatigue crack propagation life assessment
of welded and weld-repaired structures (Ph.D dissertation, Louisiana State University
and Agricultural and Mechanical College, Louisiana, USA). Retrieved from
http://etd.lsu.edu/
Munoz, M., Moreno, F., & Morea, J. (2004). Emissions of an automobile diesel engine
fuelled with sunflower methyl ester. Transactions of the American Society of
Agricultural and Biological Engineers, 47(1), 5-11. doi: 10.13031/2013.15859
Nageh, K., Allam, E., & Ashour, A. (2009). Electrochemical and stress corrosion cracking
behaviour of 67Cu-33Zn alloy in aqueous electrolytes containing chloride and nitrite
ions: effect of di-sodium hydrogen phosphate (DSHP), Materials Science and
Engineering B, 156, 84-89.
Narasaiah, N., Sivaprasad, S., Chattopadhyay, J., Kushwaha, H. S., Roos, E. & Tarafder, S.
(2010). Effect of constraint on fracture parameters of piping materials. Transactions of
Indian Institute of Metals, 63(2-3), 541-545. Retrieved from
http://www.gruppofrattura.it/
Narasaiah, N., Tarafder, S., & Sivaprasad, S. (2010). Effect of crack depth on fracture
toughness of 20MnMoNi55 pressure vessel steel. Materials Science and Engineering:
A 527(9), 2408-2411.
249
National Research Council. (2011). Research opportunities in corrosion science and
engineering. Washington D.C.: The National Academies Press.
Naval Research Laboratory. (1986). An investigation of stress-corrosion cracking
susceptibility in candidate steels for tension leg platform tendons. Washington, DC:
Hauser, J. A., & Crooker, T. W.
Newman, R. C. (2008). Review and hypothesis for the stress corrosion mechanism of carbon
steel in alcohols, Corrosion, 64(11), 819–823.
doi: http://dx.doi.org/10.5006/1.3279915
Nimmo, B., & Hinds, G. (2003). Beginners Guide to Corrosion. Middlesex, United Kingdom:
NPL.
Ohtsuka, T., Masuda, M., & Sato, N. (1985). Ellipsometric study of anodic oxide films on
titanium in hydrochloric acid, sulfuric acid and phosphate solution, Journal of the
Electrochemical Society, 132(4), 787–792.
Okeniyi, J. O., Popoola, A. P. I., Loto, C. A., Omotosho, O. A., Okpala, S. O., & Ambrose, I.
J. (2015). Effect of NaNO2 and C6H15NO3 synergistic admixtures on steel-rebar
corrosion in concrete immersed in aggressive environments. Advances in Materials
Science and Engineering, 2015, 1-11. http://dx.doi.org/10.1155/2015/540395
Oki, M., Oki, K., Otaigbe, J., & Otikor, S. (2013). Corrosion inhibition of aluminium in HCl
by amine modified epoxy resin. Journal of Materials, 2013, 1-5.
http://dx.doi.org/10.1155/2013/479728
Oki, M., & Anawe, P. A. (2015). A review of corrosion in agricultural industries. Physical
Science International Journal, 5(4), 216-222. doi: 10.9734/PSIJ/2015/14847

250
Pandey, R. K., Sundaram, S., & Kumar, A. N. (1992). Critical assessment of methods for JIC
evaluation. Journal of Testing & Evaluation, 20, 106-113.
Paul, N., & Kemnitz, D. (2006). Biofuels – plants, raw materials, products. Berlin: WPR
Communication.
Pranathi, P. P., Brian, M. De B., & Jeffrey, S. R. (2013). Determination of chloride and
sulphate in gasoline-denatured ethanol (Application note 1052). Sunnyvale, CA,
USA: Thermo Fisher Scientific.
QINETIQ. (2010). Assessing compatibility of fuel systems with bio-ethanol and the risk of
carburettor icing (Final report). Stephen, W.: Department for transport.
Quickel, G., Beavers, J., Gui, F., & Sridhar, N. (2012). Effects of fuel grade ethanol on pump
station and terminal facilities. Materials Challenges in Alternative and Renewable
Energy II: Ceramic Transactions, 239, 89-104(eds G. Wicks, J. Simon, R. Zidan, R.
Brigmon, G. Fischman, S. Arepalli, A. Norris and M. McCluer), John Wiley & Sons,
Inc., Hoboken, NJ, USA. doi: 10.1002/9781118585160.ch9
Ranganath, V. R., Kumar, A. N., & Pandey, R. K. (1991). Fracture toughness characterization
of a weldment in a microalloyed steel using resistance curves. Materials Science and
Engineering, 132, 153-160.
Read, D. T. (1982). Applied J-integral in HY130 tensile panels and implications for fitness
for service assessment (Report NBSIR 82-1670). USA: National Bureau of Standards,
Boulder, CO.
Rice, J. R. (1968). A path independent integral and the approximate analysis of strain
concentration by notches and cracks. Journal of Applied Mechanics, 35, 379-386.

251
Rincon, A., de Rincon, O. T., Haces, C., Furet, N. R., & Corvo, F. (1997). Evaluation of steel
corrosion products in tropical climates. Corrosion, 53(11), 835-841.
Ritchie, R. O., & Thompson, A. W. (1985). On macroscopic and microscopic analyses for
crack initiation and crack growth toughness in ductile alloys. Metallurgical
Transactions A, 16A, 233-248. Retrieved from http://www2.lbl.gov/
Rokuro, N., & Yasuaki, M. (2004). Stress corrosion cracking of Type 304 austenitic stainless
steel in sulphuric acid solution including sodium chloride and chromate. Corrosion
Science 46, 343–360.
Roman, J., Vera, R., Bagnara, M., Carvajal, A. M., & Aperador, W. (2014). Effect of chloride
ions on the corrosion of galvanized steel embedded in concrete prepared with cements
of different composition. International Journal of Electrochemical Science, 9, 580-
592.
Roy, H., Sivaprasad, S., Tarafder, S., & Ray, K. K. (2009). Monotonic vis-à-vis cyclic
fracture behaviour of AISI 304LN stainless steel. Engineering Fracture Mechanics,
76, 1822-1832. doi:10.1016/j.engfracmech.2009.04.001
Rydén, C., & Sunnerstedt, E. (2005). Storing and dispensing E85 and E95: Experiences from
Sweden and the US. Stockholm: Bioethanol for sustainable transport.
Samusawa, I., & Shiotani, K. (2015). Influence and role of ethanol minor constituents of fuel
grade ethanol on corrosion behaviour of carbon steel. Corrosion Science, 90, 266-275.
doi:10.1016/j.corsci.2014.10.020
Sato, N. (1976). Stochastic process of chloride-pit generation in passive stainless steel,
Journal of the Electrochemical Society, 123(8), 1197–1199.
252
Sato, N. (2011). Basics of corrosion chemistry. Green corrosion chemistry and engineering:
opportunities and challenges. doi: 10.1002/9783527641789.ch1 Retrieved from
http://www.researchgate.net/publication/
Savell, C. T., Scott, W., Maurizio, B., Jim, E., Craig, M., & Bill, N. (2011). Simulation and
modeling of pitting, SCC and exfoliation on aircraft. Paper presented at DoD
Corrosion Conference 2011, La Quinta Resort &Club, La Quinta, CA. Retrieved from
https://nace.confex.com/nace/DoD2011/webprogram/Paper20905.html
Saxena, S., Dutta, B. K., & Sasikala, G. (2016). Methodology for numerical assessment of
stretch zone width under mixed mode I/III fracture. Theoretical and Applied Fracture
Mechanics, in press, doi:10.1016/j.tafmec.2016.01.006
Saxena, S., Ramakrishnan, N., & Dutta, B. K. (2009). Determination of stretch zone width
using fem. Engineering Fracture Mechanics, 76(7), 911-920.
doi:10.1016/j.engfracmech.2008.12.015
Sei, J., Cook, D., & Townsend, H. (1998). Characterization of iron oxides commonly formed
as corrosion products on steel. Hyperfine Interact, 112, 59-66.
Seidel, M. O. (1971). The theory of stress corrosion cracking in alloys. Brussels, Belgium:
Scully J.C. Ed.
Sharma, S. K. (2011). Green corrosion chemistry and engineering: opportunities and
challenges (1st ed.). Wiley-VCH Verlag GmBH & Co.KGaA, Retrieved from
http://www.wiley-vch.de/books/sample/352
Shibata, T. (1990). Passivity of metals Part I. Corrosion Science, 31, 413–423. Retrieved
from https://books.google.com.ng/books?id=LIxQCbihhTIC&pg
253
Shipilov, S., Jones, R., Olive, J. M., & Rebak, R. (2007). Environment-induced cracking of
materials (1st ed.) USA: Elsevier.
Sivaprasad, S., Tarafder, S., Ranganath, V. R., & Ray, K. K. (2000). Effect of prestrain on
fracture toughness of HSLA steels. Materials Science and Engineering A, 284, 195-
201.
Sivaprasad, S., Tarafder, S., Ranganath, V. R., Das, S. K., & Ray, K. K. (2001). Can stretch
zone measurements provide a good estimate of fracture toughness? Paper presented at
10th International Conference on Fracture, Honolulu, Hawaii. Retrieved from
http://www.icfweb.org/documents/proceedings/icf10-honolulu-hawaii-2001
Sivaprasad, S., Tarafder, S., Ranganath, V. R., & Ray, K. K. (2004). Modelling ductile
fracture behaviour from deformation parameters in HSLA steels. Fatigue & Fracture
of Engineering Materials & Structures, 27, 897-909. doi: 10.1111/j.1460-
2695.2004.00805.x
Sowards, J. W., Weeks, T. S., & McColskey, J. D. (2013). The influence of simulated fuel-
grade ethanol on fatigue crack propagation in pipeline and storage-tank steels.
Corrosion Science, 75, 415-425. doi:10.1016/j.corsci.2013.06.026
Sreenivasan, P. R., Ray, S. K., Vaidyanathan, S., & Rodriguez, P. (1996). Measurement of
stretch zone height and its relationship to crack tip opening displacement and initiation
J-value in an AISI 316 stainless steel. Fatigue & Fracture of Engineering Materials &
Structures, 19(7), 855-868. doi: 10.1111/j.1460-2695.1996.tb01021.x.
Sridhar, N., Price, K., Buckingham, J., & Dante, J. (2006). Stress corrosion cracking of
carbon steel in ethanol. Corrosion, 62, 687–702.
254
Sridhar, N., Gui, F., Beavers, J. A., & James, J. (2010). Biofuels infrastructure, managing in
an uncertain future (DNV Research and Innovation - Position Paper 03). Hovik,
Norway: Det Norske Veritas.
Steigerwald, E. A. (1969). Selecting metals for fracture toughness. Paper presented at the
American Society of Mechanical Engineers, Design Engineering Conference and
Show, New York. Retrieved from
http://ntrs.nasa.gov/archive/nasa/casi.ntrs.nasa.gov/19750010553
Swathi. (2006). Metallic corrosion-Intergranular attack [Blog post]. Retrieved from
http://steelalloys.blogspot.com.ng/
Takeda, Y., & McMahon, C. J. (1981). Strain controlled vs. stress controlled hydrogen
induced fracture in a quenched and tempered steel. Metallurgical Transactions A,
12(7), 1255-1266. doi: 10.1007/BF02642339
Tarafder, S., Sivaprasad, S., & Ranganath, V. R., Johri, P., & Ray, K. K. (2005). Cyclic
fracture behaviour of PHT piping material. Paper presented at the 11th International
Conference on Fracture. Italy. Retrieved from
http://www.researchgate.net/publication/238093524
Tarafder, M., Dey, S., Sivaprasad, S., & Tarafder, S. (2006). A novel technique for extracting
stretch zone features from fractographs. Paper presented at 16th European Conference
of Fracture, Alexandroupolis, Greece. In Fracture of Nano and Engineering Materials
and Structures, 2T3, 145-146. doi:10.1007/1-4020-4972-2_70
Tarafder, S., Sivaprasad, S., & Ranganath, V. R. (2007). Comparative assessment of fatigue
and fracture behaviour of cast and forged railway wheels. Fatigue & Fracture of
255
Engineering Materials & Structures, 30, 863-876. doi: 10.1111/j.1460-
2695.2007.01158.x
Uh Chul, K., Kyung, M. K., & Eun, H. L. (2005). Effects of chemical compounds on the
stress corrosion cracking of steam generator tubing materials in a caustic solution.
Journal of Nuclear Materials, 341, 169–174.
Uhlig, H. H., & Cook, E. W. (1969). Mechanism of inhibiting stress corrosion cracking of 18-
8 stainless steel in MgCl2 by acetates and nitrates. Journal of Electrochemical Science,
116(2), 173-177.
Umit, C. (2006). High temperature deformation and fracture assessment of similar steel
welds (Ph.D dissertation, Technical university of Clausthal, Germany). Retrieved from
http://www.gbv.de/dms/clausthal
Venkatesh, A., Chambers, B., Kane, R. D., & Kirkham, K. (2010). Evaluation of stress
corrosion cracking behavior of steel in multiple ethanol environments. Paper
presented at Corrosion 2010, NACE International, San Antonio, Texas. Retrieved
from https://www.onepetro.org/conference-paper/NACE-10077
Wagner, C., & Traud, W. (1938). The interpretation of corrosion phenomena by superposition
of electrochemical partial reactions and the formation of potentials of mixed
electrodes. Zeitschrift fur Electrochemie, ZEELA, 44, 391-402. Retrieved from
https://books.google.com.ng/books?id=zLWjAgAAQBAJ&pg
Wiederhorn, S. M. (1996). Environment-sensitive mechanical behaviour. Paper presented at
Metallurgical Society Conference. New York: Westwood, A. R. C., Stoloff, eds. N. S.
William, F. B. (1970). Review of developments in plane strain fracture toughness testing.
ASTM STP 463, 269. Retrieved from http://books.google.com.ng

256
Yin, S. W., Gerbrands, R. A., & Hartevelt, M. (1983). An investigation of the blunting line.
Engineering Fracture Mechanics, 18(5), 1025-1036.
Zhenyu, C., Lingjie, L., Guoan, Z., Yubing, Q., & Xingpeng, G. (2013). Inhibition effect of
propargyl alcohol on the stress corrosion cracking of super 13Cr steel in a completion
fluid. Corrosion Science, 69, 205-210.
Zhu, X. K., & Joyce, J. A. (2012). Review of fracture toughness (G, K, CTOD, CTOA) testing
and standardization. U.S. Navy Research, Paper 49. Retrieved from
http://digitalcommons.unl.edu
Zuhair, M. G. (2013). ME 472: Corrosion engineering, environment assisted cracking.
Dhahran, Kingdom of Saudi Arabia: King Fahd University of Petroleum and Minerals.
Retrieved from http://ocw.kfupm.edu.sa/ocw_courses/user062/ME4720102/
257
LIST OF PUBLICATIONS
1. O.O. Joseph, C.A. Loto, J.A. Ajayi, S. Sivaprasad (2017): “Role of Chloride on the
Environmental Degradation of Micro-alloyed Steel in Simulated Fuel Grade Ethanol
Environment,” Materials Performance and Characterization, vol. 6, no. 3, pp. 334-
345, http://dx.doi.org/10.1520/MPC20160011. ISSN 2165-3992
2. O.O. Joseph (2017). Chloride effects on the electrochemical degradation of micro-
alloyed steel in E20 simulated fuel ethanol blend, Results in Physics, vol. 7, pp.
1446-1451
3. O.O. Joseph, C.A. Loto, S. Sivaprasad, J.A. Ajayi, & S. Tarafder (2016). Role of
chloride in the corrosion and fracture behaviour of micro-alloyed steel in E80
simulated fuel grade ethanol environment. Materials, 9, 463, doi:10.3390/ma9060463
4. O.O. Joseph, C.A. Loto, S. Sivaprasad, J.A. Ajayi, & O.S.I. Fayomi (2016).
Comparative assessment of the degradation mechanism of micro-alloyed steel in E20
and E80 simulated fuel grade ethanol environments. Paper presented at TMREES16
International Conference, Beirut-Lebanon.

258
APPENDIX A
Plate 4.43: Typical FEG-SEM for microstructural and fractographic examinations.
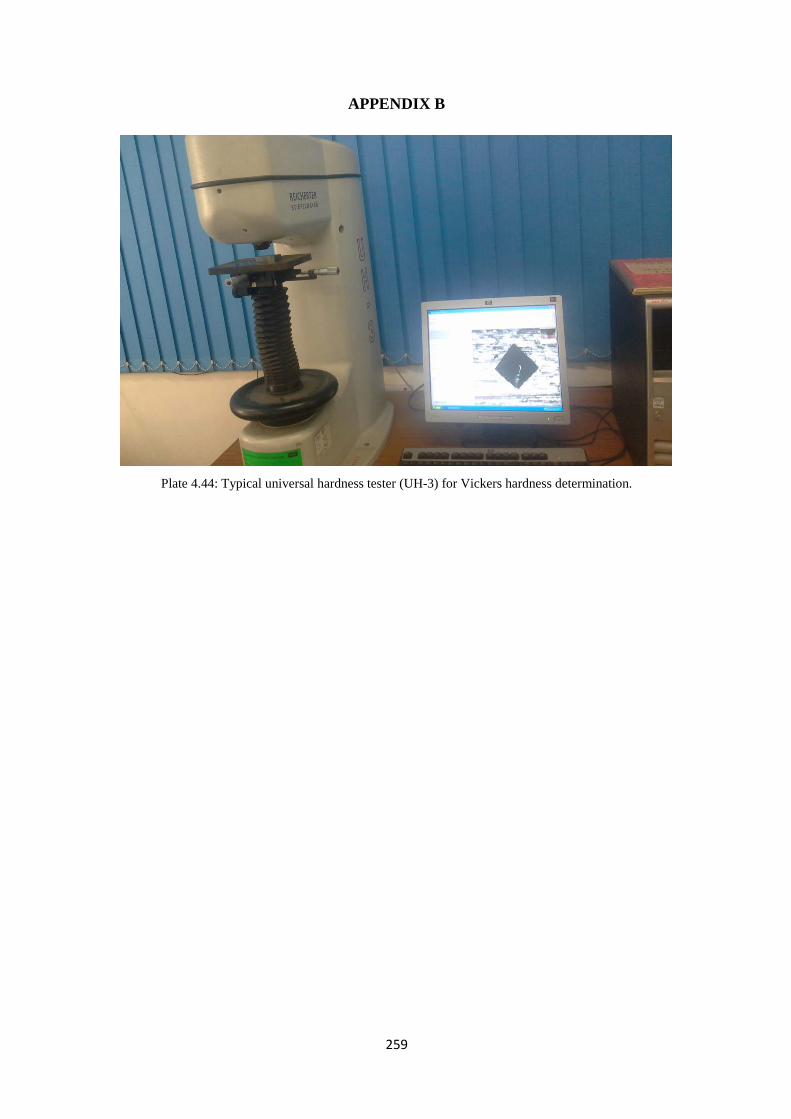
259
APPENDIX B
Plate 4.44: Typical universal hardness tester (UH-3) for Vickers hardness determination.
Related Documents


