Journal of KONES Powertrain and Transport, Vol. 23, No. 2 2016 CORRELATIONS OF WIEBE FUNCTION PARAMETERS FOR COMBUSTION SIMULATION IN SI ENGINE FUELLED WITH GASEOUS FUELS Grzegorz Przybyła, Stefan Postrzednik, Zbigniew Żmudka Silesian University of Technology, Institute of Thermal Technology Konarskiego Street 22, 44-100 Gliwice, Poland tel.:+48 94 3478344, fax: +48 94 3426753 e-mail: [email protected] Abstract Combustion simulation in SI engine fuelled with unconventional gaseous fuels becomes more necessary in last years. The reason is because the use of e.g. biogases from anaerobic digester process or gasification of biomass to produce "green energy". From the view of energy balance of small CHP units, the SI engine seems to be most efficient appliance as a part of this unit. Through 1D, simulation of in-cylinder pressure a fast prediction of engine performance is possible. In this case, the Mass Fraction Burn (MFB) function can be used. The MFB reflect the amount of fuel burned throughout the combustion process in an internal combustion engine. SI engine combustion simulation by using a Wiebe function to represent the MFB is very often used in a 1D-engine code that allow for fast calculations and a good accuracy of results. This paper deals with calculations of Wiebe function coefficients based on experimental data of four stroke naturally aspirated SI engine fuelled with natural gas and simulated producer gas. The Wiebe function parameters are determined over a range of fuel compositions and air excess ratio by fitting the Wiebe function curve to the experimentally obtained MFB data from a single-zone Heat Release Rate (HRR) analysis. Keywords: mass fraction burn, Wiebe function, producer gas, natural gas, SI engine 1. Introduction Global climate changes are some of the most significant challenges of the present time. Constantly increasing emissions as a result of fossil fuels combustion has contributed substantially to the greenhouse effect. Therefore, in consideration of the above, the reduction of carbon dioxide emissions has become critical goal. A possible solution to this problem is the utilisation of renewable energy sources. Among all the types of renewable fuels, biomass is considered the most important with respect to the Polish climate and geographical conditions [1, 4]. Liquid fuels derived from biomass processing such as vegetable oils (i.e. fatty acid methyl esters – FAME) and alcohols are currently common in use as a blend component or additive to conventional fuels [6, 8]. These fuels play an important role, and they can be considered as a possible alternative for the internal combustion engines. One approach to the efficient use of biomass (e.g., agricultural and forestry residues) is gasification and production of biogas so called producer gas (PG) or syngas. Cleaned from tars and solid particles producer gas can be used as a fuel in stationary internal combustion engines. In particular, the ICEs can tolerate tar contents up to 50-100 mg/Nm3. The particulate levels must be reduced to 50 mg/Nm³ or less for ICEs [3, 5]. Producer gas may be used as the fuel for spark ignition (SI) engines or compression ignition (CI) engines, assuming that the gasification plant is equipped with suitable gas cleaning systems in accordance with the parameters detailed above. Throughout the world, several dozen CHP plants exist, based on gasification and ICEs. Most of these are pilot plants, equipped with spark ignition engines. The most popular installations of plants with SI engines in Europe include Harboore (Denmark), Güssing (Austria), Spiez (Switzerland), Kokemäki (Finland). Commercial solutions based on the CI engine are offered by Mothermik Company (Germany). ISSN: 1231-4005 e-ISSN: 2354-0133 DOI: 10.5604/12314005.1213724

Welcome message from author
This document is posted to help you gain knowledge. Please leave a comment to let me know what you think about it! Share it to your friends and learn new things together.
Transcript
Journal of KONES Powertrain and Transport, Vol. 23, No. 2 2016
CORRELATIONS OF WIEBE FUNCTION PARAMETERS FOR COMBUSTION SIMULATION IN SI ENGINE FUELLED
WITH GASEOUS FUELS
Grzegorz Przybyła, Stefan Postrzednik, Zbigniew Żmudka
Silesian University of Technology, Institute of Thermal Technology Konarskiego Street 22, 44-100 Gliwice, Poland
tel.:+48 94 3478344, fax: +48 94 3426753 e-mail: [email protected]
Abstract
Combustion simulation in SI engine fuelled with unconventional gaseous fuels becomes more necessary in last years. The reason is because the use of e.g. biogases from anaerobic digester process or gasification of biomass to produce "green energy". From the view of energy balance of small CHP units, the SI engine seems to be most efficient appliance as a part of this unit. Through 1D, simulation of in-cylinder pressure a fast prediction of engine performance is possible. In this case, the Mass Fraction Burn (MFB) function can be used. The MFB reflect the amount of fuel burned throughout the combustion process in an internal combustion engine. SI engine combustion simulation by using a Wiebe function to represent the MFB is very often used in a 1D-engine code that allow for fast calculations and a good accuracy of results. This paper deals with calculations of Wiebe function coefficients based on experimental data of four stroke naturally aspirated SI engine fuelled with natural gas and simulated producer gas. The Wiebe function parameters are determined over a range of fuel compositions and air excess ratio by fitting the Wiebe function curve to the experimentally obtained MFB data from a single-zone Heat Release Rate (HRR) analysis.
Keywords: mass fraction burn, Wiebe function, producer gas, natural gas, SI engine
1. Introduction
Global climate changes are some of the most significant challenges of the present time.Constantly increasing emissions as a result of fossil fuels combustion has contributed substantially to the greenhouse effect. Therefore, in consideration of the above, the reduction of carbon dioxide emissions has become critical goal. A possible solution to this problem is the utilisation of renewable energy sources. Among all the types of renewable fuels, biomass is considered the most important with respect to the Polish climate and geographical conditions [1, 4]. Liquid fuels derived from biomass processing such as vegetable oils (i.e. fatty acid methyl esters – FAME) and alcohols are currently common in use as a blend component or additive to conventional fuels [6, 8]. These fuels play an important role, and they can be considered as a possible alternative for the internal combustion engines. One approach to the efficient use of biomass (e.g., agricultural and forestry residues) is gasification and production of biogas so called producer gas (PG) or syngas. Cleaned from tars and solid particles producer gas can be used as a fuel in stationary internal combustion engines. In particular, the ICEs can tolerate tar contents up to 50-100 mg/Nm3. The particulate levels must be reduced to 50 mg/Nm³ or less for ICEs [3, 5].
Producer gas may be used as the fuel for spark ignition (SI) engines or compression ignition (CI) engines, assuming that the gasification plant is equipped with suitable gas cleaning systems in accordance with the parameters detailed above. Throughout the world, several dozen CHP plants exist, based on gasification and ICEs. Most of these are pilot plants, equipped with spark ignition engines. The most popular installations of plants with SI engines in Europe include Harboore (Denmark), Güssing (Austria), Spiez (Switzerland), Kokemäki (Finland). Commercial solutions based on the CI engine are offered by Mothermik Company (Germany).
ISSN: 1231-4005 e-ISSN: 2354-0133 DOI: 10.5604/12314005.1213724

G. Przybyła, S. Postrzednik, Z. Żmudka
The present work describes study, conducted on the combustion of simulated producer gas in spark ignition engine. The investigations have been conducted with simulated PG, resembling real producer gas in composition except for the lack of tar, particulates, moisture and other less significant species. The aim of this work is to determine the Wiebe function coefficients for SI engine based on the experimental data. During experiment, the engine has been fuelled with natural gas and three mixtures of simulated PG.
2. Experimental test rig and fuel properties used in the experiment
A schematic view of the experimental test rig and measuring equipment is shown in Fig. 1. The
experimental test rig includes: − three cylinders SI engine with a capacity of 796 m3 and compression ratio equal to 9.3. The
engine is without turbocharging and originally powered by petrol. For the purpose of experiment and possibility of gaseous fuel application, the control and power supply system of the engine have been modified,
− electric motor with the power take-off system, capable of operating in two modes, the motor and generator. The main purpose of this system is to start the engine and then to apply load on the selected point of the operating cycle,
− high-pressure cylinders with gas mixtures and dual stage gas regulators, − measuring devices for flow rate, temperature and pressure evaluation including rotameters,
manometers and thermocouples.
CH4 N2
CO2O2COCmHnNox
R
ECU
ro
GZP
RGz50
Tg
Nel
Mel
twz
exhaust gases
pcyl
Fp
CO2 COH2
M
M
M1 M2
Z2
H2COCH4CO2
MG
GZ50
Z1
to the gas analyzer}
mf
RGmix BG
fuel
λ
ma
pdolTm,pm
Zr
encoder1024 impTDC
NI-PXIlabVIEW
tsp
technical gases
air
fuel
tww }to the exhaust gas analyzer
}
to the computer
Control and Data Acquisition System
SI engine (F8CV)
where: Zr, Z1, Z2 – control valves, MG – gas mixer, M1, M2 – air-fuel mixers, m – mass flow meter, BG – gas cylinders, RGmix, RGz50 – rotameters, R – braking resistor, M – electric motor
Fig. 1. The experimental test rig The gas fuel was supplied to the engine through the gas mixer. Two mixers were selected to
fuelling the engine by air-gas mixture, separately for natural gas and for producer gas. The volumetric flow of natural gas and each compound of producer gas have been manually adjusted by special valves to obtain demanded producer gas mixture composition and value of air excess ratio during combustion. Value of air excess ratio was controlled by wideband lambda sensor. The volumetric flows of the gases were measured by rotameters equipped in temperature and pressure
294

Correlations of Wiebe Function Parameters for Combustion Simulation in SI Engine Fuelled with Gaseous Fuels
sensors. Additionally the producer gas flow before air-fuel mixer was measured using Coriolis mass flow meter. The producer gas composition was controlled using gas analyser. During the experimental tests, the engine was fuelled with natural gas coming from the gas grid (GZ50 type). The producer gas was simulated by mixing hydrogen (H2), carbon monoxide (CO), methane (CH4), nitrogen (N2) and carbon dioxide (CO2) supplied from a gas cylinder. Three compositions of PG were selected to the tests. The main properties of fuels used during the experimental tests are presented in Tab. 1.
Tab. 1. Properties of tested fuels.
Fuel Mixture description
Composition (by volume)
LHV MJ/m3 Va,min, m3/m3
Natural Gas GZ50 CH4 = 98.5%,CO2 = 0.1%, N2 = 1%, other: C2H6, C3H8, C4H10
35.3 9.4
Producer gas HC1 H2 = 18.2%, CO = 18.5%, CH4 = 3% CO2 = 12%, N2 = 48.3% 5.38 1.16
Producer gas HC0.4 H2 = 10.5%, CO = 27.5%, CH4 = 2% CO2 = 8.5%, N2 = 51.5% 5.32 1.1
Producer gas HC0.2 H2 = 4.8%, CO = 23.2%, CH4 = 2.8% CO2 = 10.7%, N2 = 58.5% 4.45 0.93
All tests were performed at constant engine speed of ro = 1500 rpm. The study was conducted
for the full engine load (i.e. wide open air throttle). The engine operation control factors represent ignition advance angle (ignition timing) and composition of the gas-air mixture. Three values of air excess ratio was selected; λ = 1, λ = 1.25 and λ = 1.5. For each engine operating point, the ignition timing was adjusted to obtain MBT. The pressure measurements in the first cylinder were performed using piezoelectric pressure transducer. In addition, the absolute pressure within the intake manifold was recorded with piezoresistive absolute pressure transducer. At both measurement ducts, the pressure signal was sampled at predefined crank angle using encoder. Measurements were carried out with a resolution of 1024 measurement points per revolution of the crankshaft. The encoder was also equipped with a position marker signal for indicating the position of a piston in a cylinder. 3. Wiebe function parameters estimation
The modelling of combustion process plays a critical part in the engine cycle simulation. In one- dimensional engine simulations, the combustion process can be described by the burning rate of the fuel. The burning rate is commonly expressed using the mass fraction burned (MFB). The Wiebe function is very often used in one-dimensional SI engine cycle modelling to describe the MFB profile [11]. The Wiebe function is expressed as:
( )
−−=
+1
exp1)(m
k
axααα , (1)
where: α, αk, oCA – current and total value of cranck angle during combustion process, a, m – Wiebe function coefficients.
Most commercial software packages dedicated to the simulation of engine working cycle include Wiebe functions for both spark ignition and compression ignition engines. One-dimensional model give quick simulation of engine processes. For example, Gamma Technologies’ GT-Power provides single Wiebe function for spark ignition engine modelling and
295

G. Przybyła, S. Postrzednik, Z. Żmudka
multi-Wiebe function for compression ignition engine modelling. AVL’s Boost provides a single Wiebe function for modelling the combustion process [2].
To determine the Wiebe function parameters based on engine experimental data [7, 10, 11] there are a number of possible methods. One of the simplest and fast method is to share the MFB curve of experimental data for three periods and next fit the Wiebe function to experimental data using two characteristic points (e.g. for 10 and 90 per cent of MFB). For SI engine, the first period can be chosen as early flame development stage what means that 0 < MFB ≤ 0.1. The second one can describe the flame propagation period 0.1 < MFB ≤ 0.9. This period is dominated by turbulent combustion and the fuel-burning rate is highest. The rate of flame propagation is strongly dependent on the area that it occupies the composition of the air-gas mixture, the temperature and the pressure [9]. The final stage of combustion occurs when the flame front makes contact with the walls of the combustion chamber. Local flame quenching occurs in this period, significantly slowing the burn rate. Typically, flame termination is characterised as the period of 90 to 100 (99.9, in reality) per cent mass fraction burned. The flame front area in contact with the unburned mixture is reduced, and the remaining unburned mixture in the cylinder is burns more slowly. Consequently, the final stage of combustion is very slow; when it occurs incompletely, carbon monoxide and hydrocarbon emissions result. Described above method has been illustrated in the Fig. 2.
Cranck angle α,oCA after αz
Mas
s fra
ctio
n bu
rned
(MFB
) x, -
xA
xB
αB αA αk
x=1
A
B
Fig. 2. Characteristic periods of MFB function
Plotting the characteristic points (A and B) on the experimental MFB data (as shown in Fig. 2)
the crank angles αA and αB are determined. Thereby the equation (1) can be written in two forms and finally after transformation of them the Wiebe function coefficients can be described by:
( )( ) 1
ln
1ln1lnln
−
−−
=
B
A
B
A
xx
m
αα
, (2)
( )1
11ln
+
−
= m
c
A
Axa
αα
. (3)
296
Correlations of Wiebe Function Parameters for Combustion Simulation in SI Engine Fuelled with Gaseous Fuels
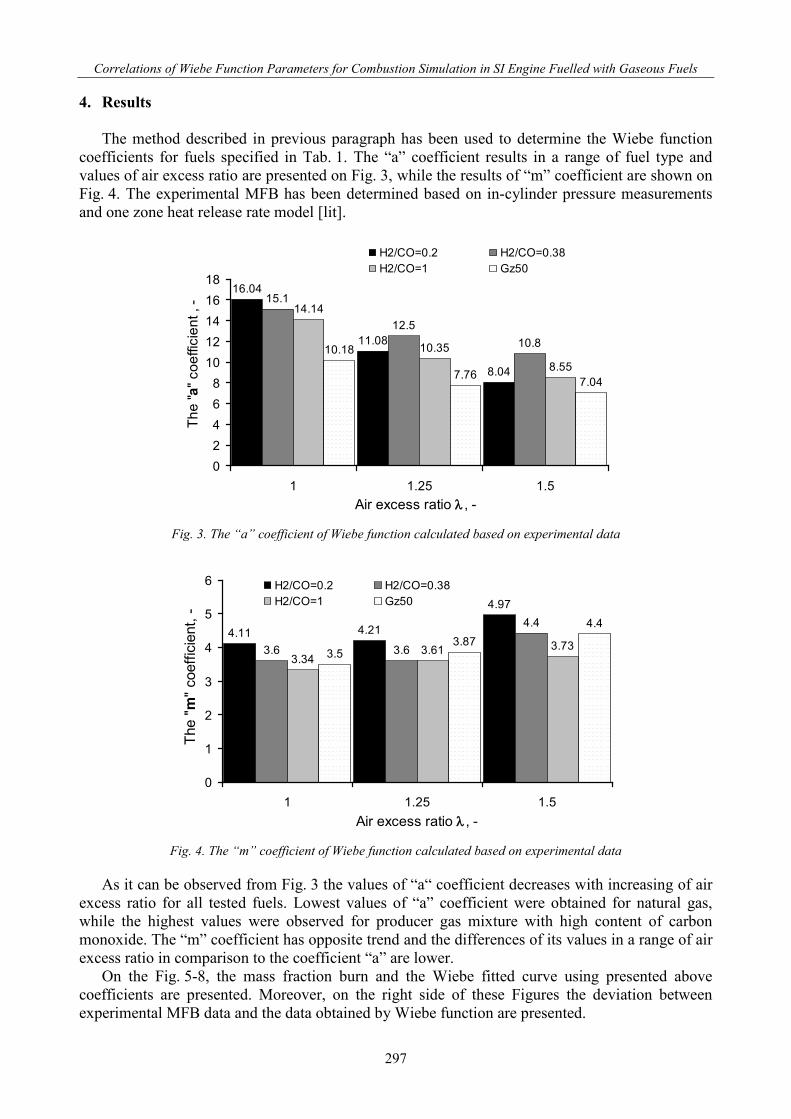
4. Results The method described in previous paragraph has been used to determine the Wiebe function
coefficients for fuels specified in Tab. 1. The “a” coefficient results in a range of fuel type and values of air excess ratio are presented on Fig. 3, while the results of “m” coefficient are shown on Fig. 4. The experimental MFB has been determined based on in-cylinder pressure measurements and one zone heat release rate model [lit].
16.04
11.08
8.04
15.1
12.510.8
14.14
10.358.55
10.18
7.76 7.04
02468
1012141618
1 1.25 1.5Air excess ratio λ , -
The
"a" c
oeffi
cien
t , -
H2/CO=0.2 H2/CO=0.38H2/CO=1 Gz50
Fig. 3. The “a” coefficient of Wiebe function calculated based on experimental data
4.11 4.21
4.97
3.6 3.6
4.4
3.343.61 3.73
3.53.87
4.4
0
1
2
3
4
5
6
1 1.25 1.5Air excess ratio λ , -
The
"m" c
oeffi
cien
t, -
H2/CO=0.2 H2/CO=0.38H2/CO=1 Gz50
Fig. 4. The “m” coefficient of Wiebe function calculated based on experimental data
As it can be observed from Fig. 3 the values of “a“ coefficient decreases with increasing of air
excess ratio for all tested fuels. Lowest values of “a” coefficient were obtained for natural gas, while the highest values were observed for producer gas mixture with high content of carbon monoxide. The “m” coefficient has opposite trend and the differences of its values in a range of air excess ratio in comparison to the coefficient “a” are lower.
On the Fig. 5-8, the mass fraction burn and the Wiebe fitted curve using presented above coefficients are presented. Moreover, on the right side of these Figures the deviation between experimental MFB data and the data obtained by Wiebe function are presented.
297

G. Przybyła, S. Postrzednik, Z. Żmudka
The deviation Dx is defined as bellow:
Ex
WiebeExx x
xxD −= , (4)
where: xEx, – experimental data of MFB, xWiebe, – MFB data calculated by Wiebe function.
0.0
0.1
0.2
0.3
0.4
0.5
0.6
0.7
0.8
0.9
1.0
0.0 0.1 0.2 0.3 0.4 0.5 0.6 0.7 0.8 0.9 1.0relative combustion duration α/αc, -
x(α)
, -
λ=1 (experiment)λ=1 (Wiebe)λ=1.25 (experiment)λ=1.25 (Wiebe)λ=1.5 (experiment)λ=1.5 (Wiebe)
-0.3
-0.2
-0.1
0.0
0.1
0.2
0.3
0.0 0.1 0.2 0.3 0.4 0.5 0.6 0.7 0.8 0.9 1.0relative combustion duration α/αc, -
devi
atio
n D x
, -
λ=1 λ=1.25 λ=1.5
Fig. 5. The experimental data of MFB and the Wiebe fitted curve – left side, deviation between experimental data and
Wiebe function – right side, (fuel: natural gas GZ50, spark advanced and combustion duration: λ=1, 21° BTDC, αc =59.4o, λ = 1.25, 26o BTDC, αc = 64o, λ = 1.5, 44o BTDC, αc =80.4o, speed = 1500 RPM)
0.0
0.1
0.2
0.3
0.4
0.5
0.6
0.7
0.8
0.9
1.0
0.0 0.1 0.2 0.3 0.4 0.5 0.6 0.7 0.8 0.9 1.0relative combustion duration α/αc, -
x(α)
, -
λ=1 (experiment)λ=1 (Wiebe)λ=1.25 (experiment)λ=1.25 (Wiebe)λ=1.5 (experiment)λ=1.5 (Wiebe)
-0.30
-0.20
-0.10
0.00
0.10
0.20
0.30
0.0 0.1 0.2 0.3 0.4 0.5 0.6 0.7 0.8 0.9 1.0
relative combustion duration α/αc, -
devi
atio
n D x
, -
λ=1 λ=1.25 λ=1.5
Fig. 6. The experimental data of MFB and the Wiebe fitted curve – left side, deviation between experimental data and
Wiebe function – right side, (fuel: producer gas HC1, spark advanced and combustion duration: λ=1, 21° BTDC, αc =58o; λ = 1.25, 30o BTDC, αc = 60.4o ;λ = 1.5, 34o BTDC, αc =69.4o; speed = 1500 RPM)
298

Correlations of Wiebe Function Parameters for Combustion Simulation in SI Engine Fuelled with Gaseous Fuels
0.0
0.1
0.2
0.3
0.4
0.5
0.6
0.7
0.8
0.9
1.0
0.0 0.1 0.2 0.3 0.4 0.5 0.6 0.7 0.8 0.9 1.0relative combustion duration α/αc, -
x(α)
, -λ=1 (experiment)λ=1 (Wiebe)λ=1.25 (experiment)λ=1.25 (Wiebe)λ=1.5 (experiment)λ=1.5 (Wiebe)
-0.30
-0.20
-0.10
0.00
0.10
0.20
0.30
0.0 0.1 0.2 0.3 0.4 0.5 0.6 0.7 0.8 0.9 1.0
relative combustion duration α/αc, -de
viat
ion
D x, -
λ=1 λ=1.25 λ=1.5
Fig. 7. The experimental data of MFB and the Wiebe fitted curve – left side, deviation between experimental data and
Wiebe function – right side, (fuel: producer gas HC0.4, spark advanced and combustion duration: λ=1, 24° BTDC, αc =58.4o; λ = 1.25, 31o BTDC, αc = 60o, λ = 1.5, 42o BTDC, αc =70.4o; speed = 1500 RPM)
0.0
0.1
0.2
0.3
0.4
0.5
0.6
0.7
0.8
0.9
1.0
0.0 0.1 0.2 0.3 0.4 0.5 0.6 0.7 0.8 0.9 1.0relative combustion duration α/αc, -
x(α)
, -
λ=1 (experiment)λ=1 (Wiebe)λ=1.25 (experiment)λ=1.25 (Wiebe)λ=1.5 (experiment)λ=1.5 (Wiebe)
-0.30
-0.20
-0.10
0.00
0.10
0.20
0.30
0.0 0.1 0.2 0.3 0.4 0.5 0.6 0.7 0.8 0.9 1.0
relative combustion duration α/αc, -
devi
atio
n D x
, -
λ=1 λ=1.25 λ=1.5
Fig. 8. The experimental data of MFB and the Wiebe fitted curve – left side, deviation between experimental data and
Wiebe function – right side, (fuel: producer gas HC0.2, spark advanced and combustion duration: λ=1, 33° BTDC, αc =72.4o, λ = 1.25, 41o BTDC, αc = 80.4o, λ = 1.5, 49o BTDC, αc =98.4o, speed = 1500 RPM)
Highest devotion between experimental data and the data calculated by Wiebe function was
observed in the first stage of MFB (0-5%) for all tested fuels. The best fitting of Wiebe function to experimental data using proposed algorithm has been obtained for producer gas composition HC1 and HC0.4 (high and medium content of hydrogen). For these PG compositions, the maximum deviation Dx in a range of 5% to 99.9% MFB does not exceed 10 per cent and the sensitivity on air excess ratio changes is low. A less fitted data are observed for natural gas but the sensitivity on air excess ratio changes is still low. The highest deviation between experimental MFB and Wiebe function occurs for rich in carbon monoxide PG mixture HC0.2. For this fuel the maximum deviation Dx in a range of 5% to 99.9%, MFB varies between 12 and 22% and is very sensitive on air excess ratio changes.
299

G. Przybyła, S. Postrzednik, Z. Żmudka
5. Conclusions The calculations of Wiebe function coefficients based on experimental data of four stroke
naturally aspirated SI engine fuelled with natural gas and producer gas has been presented. The Wiebe function parameters were determined over a range of fuel compositions and air excess ratio by fitting the Wiebe function curve to the experimentally obtained MFB data from a single-zone Heat Release Rate (HRR) analysis. Obtained data can be used in 1D simulation of in-cylinder pressure for fast predict the SI engine performance fuelled with natural gas or producer gas.
The best fitting of Wiebe function to experimental data has been achieved when producer gas mixtures HC1 and HC0.4 were utilized in the engine. These mixtures include highest content of hydrogen in PG composition 18.2 and 10.5 % by vol. respectively. Lowest correlation between experimental data and Wiebe function occurs when the HC0.2 mixture is utilised. This fuel includes low content of hydrogen and relatively high content of carbon monoxide in its composition, 4.8 and 23.2 % by vol. respectively. Probably a better fit can be achieved by introducing additional factor in Wiebe function as e.g. in work [11].
Acknowledgments
This work is supported by the Silesian University of Technology from the statutory research
source of Institute of Thermal Technology.
References [1] Berggren, M., Ljunggren, E., Johnsson, F., Biomass co-firing potentials for electricity
generation in Poland-Matching supply and co-firing opportunities, Biomass and Bioenergy Vol. 32, Elsevier, pp. 865-879, 2008.
[2] Ghojel, J. I., Review of the development and applications of the Wiebe function: A tribute to the contribution of Ivan Wiebe to engine research, International Journal of Engine Research, Vol. 11, No. 4, pp. 297-312, 2010.
[3] Herdin, G., Robitschko, R., Klausner, J., Wagner, M., GEJ Experience with Wood Gas Plants, Technical Paper for GE Jenbacher, www.gejenbacher.com.
[4] Igliński, B., Iglińska, A., Kujawski, W., Buczkowski, R., Cichosz, M., Bioenergy in Poland, Renewable and Sustainable Energy Reviews, Vol. 15, Elsevier, pp. 2999-3007, 2011.
[5] Ising, M., Gil, J., Unger, Ch., Gasification of biomass in a circulating fluidized bed with special respect to tar reduction, 1st World Conference and Exhibition on Biomass for Energy and Industry, Sevilla, Spain 2000.
[6] Mancaruso, E., Sequino, L., Vaglieco, B. M., First and second generation biodiesels spray characterization in a diesel engine, Fuel, Vol. 90, Elsevier, pp. 2870-2883, 2011.
[7] Maroteaux, F., Saad, C., Aubertin, F., Development and validation of double and single Wiebe function for multi-injection mode Diesel engine combustion modelling for hardware-in-the-loop applications, Energy Conversion and Management, Vol. 105, pp. 630-641, 2015.
[8] McKendry, P., Energy production from biomass (part 2): conversion technologies, Bioresource Technology, Vol. 83, Elsevier, pp. 47-54, 2002.
[9] Stone, R., Introduction to Internal Combustion Engines 3rd Edition, Society of Automotive Engineers Inc.,1999.
[10] Glewena, W. J., Wagner, R. M., Edwards, K. D., Daw, C. S., Analysis of cyclic variability in spark-assisted HCCI combustion using a double Wiebe function, Proceedings of the Combustion Institute, Vol. 32, Is. 2, pp. 2885-2892, 2009.
[11] Yeliana, C., Cooney, J., Worm, D., Michalek, J., Naber, Wiebe function parameter determination for mass fraction burn calculation in an ethanol-gasoline fuelled SI engine. Journal of KONES Powertrain and Transport, Vol. 15, No. 3, 2008.
300
Related Documents