Correlations of electrochemical noise, acoustic emission and complementary monitoring techniques during intergranular stress- corrosion cracking of austenitic stainless steel 1 Jaka Kovac a, *, Carole Alaux b , James Marrow b , Edvard Govekar c , Andraz Legat a , a Slovenian National Building and Civil Engineering Institute, Dimiceva 12, SI-1000 Ljubljana, Slovenia b Materials Performance Centre, School of Materials, The University of Manchester, Manchester, M13 9PL, United Kingdom c Faculty of Mechanical Engineering, University of Ljubljana, Askerceva 6, SI-1000 Ljubljana, Slovenia Abstract Specimens of sensitized type AISI 304 stainless steel were subjected to constant load and exposed to an aqueous sodium thiosulphate solution. Intergranular stress-corrosion cracking was monitored simultaneously for electrochemical noise, acoustic emission, and specimen elongation. A section of the gauge length was monitored optically with subsequent analysis by digital image correlation. Correlations between the results were observed and analysed. Electrochemical noise and elongation are associated with crack propagation from the early stages, whereas acoustic emission is associated with the final stages of fracture. Digital image correlation analysis is sensitive to crack development, and is used to measure crack length and crack openings. Keywords: A. Stainless steel; B. Electrochemical noise; Acoustic emission; Digital image correlation; C. Stress corrosion; ------- Corresponding author. Tel.: +386 1 280 44 22; fax: +386 1 436 74 49. E-mail address: [email protected] (J. Kovač) 1 This is the authors’ copy of a paper subsequently published as Kovac, J., Alaux, C., Marrow, T. J., Govekar, E., & Legat, A. (2010). Correlations of electrochemical noise, acoustic emission and complementary monitoring techniques during intergranular stressLcorrosion cracking of austenitic stainless steel. Corrosion Science, 52(6), 2015–2025. doi:10.1016/j.corsci.2010.02.035 Minor changes in text may have occurred up to publication.

Welcome message from author
This document is posted to help you gain knowledge. Please leave a comment to let me know what you think about it! Share it to your friends and learn new things together.
Transcript

Correlations of electrochemical noise, acoustic emission and
complementary monitoring techniques during intergranular stress-corrosion cracking of austenitic stainless steel1
Jaka Kovaca,*, Carole Alauxb, James Marrowb, Edvard Govekarc, Andraz Legata,
a Slovenian National Building and Civil Engineering Institute, Dimiceva 12, SI-1000 Ljubljana, Slovenia
b Materials Performance Centre, School of Materials, The University of Manchester, Manchester, M13 9PL, United Kingdom
c Faculty of Mechanical Engineering, University of Ljubljana, Askerceva 6, SI-1000 Ljubljana, Slovenia
Abstract Specimens of sensitized type AISI 304 stainless steel were subjected to constant load and exposed to an aqueous sodium thiosulphate solution. Intergranular stress-corrosion cracking was monitored simultaneously for electrochemical noise, acoustic emission, and specimen elongation. A section of the gauge length was monitored optically with subsequent analysis by digital image correlation. Correlations between the results were observed and analysed. Electrochemical noise and elongation are associated with crack propagation from the early stages, whereas acoustic emission is associated with the final stages of fracture. Digital image correlation analysis is sensitive to crack development, and is used to measure crack length and crack openings. Keywords: A. Stainless steel; B. Electrochemical noise; Acoustic emission; Digital image correlation; C. Stress corrosion; ------- Corresponding author. Tel.: +386 1 280 44 22; fax: +386 1 436 74 49. E-mail address: [email protected] (J. Kovač) 1 This%is%the%authors’%copy%of%a%paper%subsequently%published%as%Kovac,%J.,%Alaux,%C.,%Marrow,%T.%J.,%Govekar,%
E.,%&%Legat,%A.%(2010).%Correlations%of%electrochemical%noise,%acoustic%emission%and%complementary%
monitoring%techniques%during%intergranular%stressLcorrosion%cracking%of%austenitic%stainless%steel.%
Corrosion'Science,%52(6),%2015–2025.%doi:10.1016/j.corsci.2010.02.035%
Minor%changes%in%text%may%have%occurred%up%to%publication.

1 Introduction Stress corrosion cracking (SCC) is a well known degradation process of metals and alloys. The process is potentially dangerous and can lead to catastrophic failures of structural components [1-3]. Stress corrosion cracking occurs in specific combinations of three essential conditions: tensile stress or strain of a sufficient level, an aggressive electrolyte, and a susceptible material. Synergetic combination of mechanical and electrochemical processes could lead to two different modes of crack propagation: intergranular SCC (IGSCC) where cracks advance along crystal grain boundaries, and transgranular SCC (TGSCC) where cracks advance through crystal grains. Several decades of intensive SCC research activities have passed, yet the exact mechanism of the process in some critical environment-material combination is still unknown [4-5]. However, there are several mechanistic models that describe the SCC process for the various environment-material combinations that are understood. Among them there are three most known mechanistic models: slip-dissolution [6-7], anodic reaction induced cleavage (several different models: i.e. film-induced cleavage [8-10], etc.) and surface mobility [11-14]. Theses models agree well with specific experimental results, but there remain some issues and details that need to be explained. In order to obtain general knowledge and determine specific parameters in SCC processes various physical and electrochemical methods have been implemented since a couple of decades ago. As these dynamic processes can be relatively fast, the main emphasis has been focused on the “so-called” transient techniques. Electrochemical noise (EN) consists of current and potential fluctuations spontaneously generated by corrosion reactions, so non-intrusiveness is one of the main advantages of this technique [15-16]. Several studies have indicated that, on the basis of EN measurements, it is possible to detect and distinguish between different corrosion types, such as metastable and stable pitting [17], crevice corrosion [18], uniform corrosion [19], and stress-corrosion cracking [20]. The main properties of EN have been usually described by statistical parameters (e.g. noise resistance) [21], as well as by parameters obtained from spectral analysis (e.g. noise impedance) [22], and the theory of chaos (e.g. the correlation dimension and the largest Lyapunov exponent) [23]. All these parameters are, however, calculated by means of mathematical techniques that are based on the assumption of the stationarity of signals, so that the reliability of estimated parameters could be questionable in specific cases [24]. In cases where the non-stationarity of EN signals is caused by rare and irregular fluctuations, the analysis of individual phenomena that signify corrosion processes is still a very useful approach [25-26] (the term “noise” might, however, in such cases be questionable). After some positive results in the detection of SCC by EN in the 1980's [27-29], research efforts were oriented mainly into the differentiation between the non-active cracking and the active cracking period. Several studies performed on austenitic stainless steel under various conditions have indicated that it might be possible to measure the EN fluctuations generated by the initiation and propagation of SCC [29-31]. Specific oscillations in the EN current,
presumably connected to the periodic propagation of the crack, were measured on pre-cracked coated compact tension (CT) specimens [32]. In the authors' previous work [33], the EN transients measured during various SCC processes were compared to simultaneous measurements of elongation. A close relation between the current transients and the elongation rate, which is supposed to be inherently connected to the crack growth rate, was established. Two types of EN transients were found: sharp spikes, and shallow fluctuations of longer duration. It was suggested that these two types of EN transients could be related to different steps in SCC processes, but the actual source of these transients was not confirmed. Another technique that is suitable for the detection of individual events during SCC is acoustic emission (AE). This technique is based on measurements of elastic waves, which are the consequence of fast energy relaxation at a localized source (i.e. crack development in the material). The first measurements of acoustic emission waves by piezoelectric sensors were made in the 1940-1960’s [34], but the genesis of today’s technology of acoustic emission was achieved by Josef Kaiser [35-36] in 1950. Since then, the analysis of AE has become one of the most successful methods for the non-destructive monitoring of the initiation and progress of deformations in materials [34,37]. Due to its excellent capabilities, the AE technique has been used to detect and partly also characterize SCC processes over the last two decades [38-39]. Jones et al successfully detected transgranular (TGSCC) cracking on various metals, but their results concerning intergranular cracking (IGSCC) were not so conclusive. It was postulated that the transgranular fracture surfaces were the result of ligaments that fracture behind the advancing intergranular crack front. More recent 3D observations of IGSCC in sensitised stainless steels have confirmed that this occurs [57]. In several studies, AE activity was measured during various stages of SCC: in most cases reserachers found that the AE activity was the highest just above the yield point and before final fracture [40]. It was established that the AE activity during the propagation of TGSCC is generally of one order of magnitude higher than that of the AE activity during the IGSCC propagation [41]. On the other hand, the mean values of the amplitude and rise time of the AE signals registered during both processes were found to be similar [42]. In some studies [43-44] it was also indicated that the evolution of AE activity could be related to crack initiation, crack propagation and final failure [42]. Since SCC is a combination of electrochemical and mechanical processes, in some studies EN and AE techniques have been simultaneously implemented. A fundamental investigation of SCC by the combined use of EN and AE techniques was performed by Newman and Sieradzki [45], but had not been attempted again until quite recently [46]. In our previous studies [46-47], whose aim was to measure the sequence of electrochemical and mechanical events during various SCC processes, beside the combined use of EN and AE techniques, simultaneous elongation measurements were also performed. In the EN signals measured during TGSCC, several characteristic transients were observed. Most of these transients corresponded exactly with AE bursts and with discontinuous jumps in the measured elongation of specimen. On the other hand, the characteristics of the measured EN and AE signals, as well as the elongation during IGSCC, were quite different: no simultaneous transients among the measured signals were detected. It was observed that, during IGSCC, the DC part of the measured EN current significantly increased. It could be assumed that this increase in the DC value was generated by the enlargement of the entire anodic area due to the propagation of intergranular cracks. AE activity also significantly increased with crack propagation, and reached its maximum at failure. A similar observation was recently obtained in the case of combined use of EN and AE by Zhang et al [48]: SCC initiation and its early stage propagation can be detected by EN measurements, whereas the AE technique is only sensitive to rapid crack propagation involving a relatively large volume of plastic deformation.

This paper is a continuation of our previous work on detection and characterization of SCC with the use of electrochemical noise and acoustic emission [31-33,46-47,49-51]. As described above, certain questions concerning the detection and characterization of IGSCC processes remain open, especially those related to single events. Although, in some studies, there were indications of simultaneously increased activity of measured EN and AE signals during IGSCC, no correlation between individual EN transient and individual AE bursts has yet been reported. Apart from AE and EN, complementary detection and monitoring techniques have also been developed recently and used for detection, monitoring and characterization of specific specific corrosion processes: microscopy and imaging using the new techniques of digital image correlation [52-53] as well as computed tomography [54-57]. In order to upgrade our previous results, we performed measurements under similar experimental conditions, but with an enhanced measuring system and image analysis. According to the authors’ knowledge, the digital image correlation technique has not been yet implemented in combination with the EN and AE techniques. In the present study of IGSCC we focused on three main objectives:
- to achieve more reliable detection of the IGSCC process by simultaneous use of EN, AE, elongation measurements, and digital imaging, - to study correlations among data obtained by different techniques and their relations to the IGSCC process, - to characterize the IGSCC process and to detect possible individual steps in this process.
2 Materials and methods Austenitic stainless steel of type AISI 304 was used in the experiments. The carbon concentration of the steel was 0.042 wt%. In order to increase the susceptibility of the material to the IGSCC, sensitization of the material was performed in the following manner: the steel in as received condition was (1st) heated to 1050 °C in vacuum, maintained at this temperature for 1 hour, and quenched in oil; (2nd) heated to 650 °C in a vacuum and maintained at this temperature for 24 hours, and cooled down to room temperature in the open air. After sensitization of the steel, its microstructure was austenitic and chromium carbides were precipitated along the grain boundaries. As expected, no preferred orientation of the crystal structure was observed after heat treatment. Specimens were made from a steel plate with a thickness of 2 mm. They were 12 mm wide and 280 mm long. After the heat treatment, the surface was ground with 600 grit SiC paper. In order to localize the area of crack initiation, the specimens had semicircular notches at the middle of their lengths. The radius of each semicircular notch was 8 mm, reducing the gauge section width to 4 mm. Thus, the middle section was subject to a concentrated stress field. In order to reduce the corroded surface area, the specimens were additionally protected with paint and insulating tape. Only one side of the specimen’s middle section was exposed to electrolyte, with an area of 50 mm2. The exposed area of each reference electrode for EN measurements was also 50 mm2. A scheme of the specimen and references electrode is presented in Fig. 1 The tensile specimens were sealed in a corrosion cell and were exposed to the aqueous solution of 0.5 M sodium thiosulphate (Na2S2O3) at room temperature. The solution had a pH of 6.8. Specimens were loaded to different levels on a static mechanical loading machine, which had no electronic control. The purpose of this was to reduce any interference with the electrochemical noise and acoustic emission measurements. In all the performed experiments, the final loading levels ranged from yield stress (= 35 % of ultimate tensile strength) to 50 % of

ultimate tensile stress. The yield stress was 230 MPa and the ultimate tensile stress was 650 MPa. The research is focused on monitoring of IGSCC with the combined, simultaneous use of the following measuring techniques: electrochemical noise, acoustic emission, elongation of the specimen, and digital imaging. A schematic picture of the experimental set-up is presented in Fig. 2. Elongation of the stressed specimen was measured by an inductive probe, which was fixed to the weights that were hung directly on the tensile specimen. Elongation was therefore measured between the end of the weights and the rigid bracket on which the upper part of specimen was mounted. The whole measuring length was approximately 0.5 m. Due to the use of a very rigid bracket, there were no significant disturbances in the measured elongation. The resolution of the probe was 0.4 µm and the sampling frequency was 5 Hz. Electrochemical noise (EN) was measured in a freely corroding system with three electrodes made from the same stainless steel. The electrodes were in parallel positions, approximately 0.5 cm apart from one another. The EN current was measured between the working electrode and one neighbouring electrode with a ZRA (zero resistance ammeter), whereas the voltage electrochemical noise was measured between the working electrode and another neighbouring electrode using a high impedance voltmeter (the neighbouring electrodes acted as pseudo-reference electrodes). According to common practice, anodic reaction on the working (stressed) electrode is reflected in positive current and negative voltage shifts. EN data were collected using a sampling rate of 10 Hz. The resolution of the measured current was 30 pA, and 15 µV for measured voltage. Acoustic emission was measured by two AE sensors: one was fixed to the top of the stressed specimen outside the corrosion cell, whereas the other was fixed to the bottom of it, also outside the corrosion cell. Piezo-electric sensors with operating frequencies in range of 100 - 1000 kHz were used. The amplification was 40 dB and the maximum amplitude was 100 dB. The sampling frequency was 500 kHz. In order to eliminate mechanical and electro-magnetic disturbances, two frequency filters were used: a high-pass filter with a cut-off frequency of 1 kHz, and a low-pass filter with a cut-off frequency of 1 MHz. The trigger level was slightly above the background noise which was around 30 dB. Visualization of the monitored process was obtained with 2 mega pixels digital CCD camera that was connected to an optical system with a zoom of up to x45 magnitude. The CCD camera had an 8 bit pixel depth. The rate used for SCC process monitoring was one image per minute. After the experiment images were visually inspected and analyzed by digital image correlation (DIC) [52,58]. Digital image correlation is a technique for in-plane mapping of surface displacements by tracking of surface features in successive images. It is well suited to the observation and characterisation of surface breaking defects. Captured images are discretised into smaller interrogation windows across the time series. Individual interrogation windows in each image are converted via Fast Fourier Transform and then compared with the transform of interrogation windows in a subsequent image. The degree of correlation across various possible displacements is calculated and the maximum correlation is used to identify the actual interrogation window displacement vector. Displacements for each interrogation window across the whole image can then be mapped and strains calculated by differentiation. The accuracy of displacement determination depends on the interrogation window size, and hence mapping of strains has a spatial resolution that depends on the density and character of visible features in the image. Surface crack openings, including those that are smaller than the interrogation window size, are represented by a large apparent strain. Cracks that may not be visible by normal optical methods can therefore be visualized and their dimensions measured [52,58].

3 Results and Discussion
A set of five experiments were performed, under different constant load conditions. In some cases, the static load conditions were changed several times during the experiments. Although the final stress in the experiments was roughly constant (40 % or 50 % of the ultimate tensile strength) the time to failure varied by a factor of almost 3. It was not among the aims of this study to determine the specific sources of the differences in the time to failure, nor to perform exact statistics of the measured signals – these issues will addressed in our further research, together with some additional measurements. It should be mentioned, however, that despite, significant differences in the time to failure, the characteristics of the measured signals were similar for the different stages of the SCC experiment in all the experiments. In order to present the analysis of these characteristics, and especially to correlate them with different stages in the SCC processes, one typical measurement was selected: the time to failure was between the extreme values, and measured signals contained all the characteristic features. 3.1 Results of EN, AE, digital imaging and elongation measurement In the presented experiment the specimen was exposed to the following loading conditions: 1) initial loading to the stress equal to the yield strength (35 % of the ultimate tensile strength), 2) increase of loading after approximately 15 h to 45 % of the ultimate tensile strength stress, 3) increase of loading after approximately 25 h to 50 % of the ultimate tensile strength stress. Selected images captured by the digital imaging system are presented in Fig. 3 to illustrate the development of the IGSCC process. On the first picture taken after 25.54 h (immediately after the second increase of loading), no changes on the specimen were observed compared to the start of the experiment. An initiated crack is just noticeable in the second image of Fig. 3 at 25.78 hours. The subsequent images in Fig. 3 represent the development and propagation of the investigated crack. The last image was taken 5 minutes before the failure of the specimen. Fig. 4 shows typical results of the digital image correlation analysis of the same set of images (DIC). This was done within a region of the image (identified by a box), correlated against the same region in the image acquired at the start of the test. Profiles are shown for the horizontal displacements measured along a line close to the edge of the sample (indicated by a dotted line). These are compared with a strain map, obtained by differentiation of the horizontal displacements. Selected images are shown for times of 25.96 hours to 26.90 hours. There is a clear step in displacement at 25.96 hours at the location of the significant crack that subsequently develops. The crack opening displacement and crack length can thus be measured by DIC (Fig. 5). The displacement step at the initiation site is first observable by image correlation at 25.78 hours, whereas the crack is only visible after 25.96 hours. Crack length can be measured by DIC with confidence after 26.41 hours – this is due to background noise in the image. Improvements in image acquisition will reduce this noise and allow measurement of the crack length with greater precision. The sample load was increased at 25.54 hours. These data indicate that measurable crack initiation occurred within 0.24 hours of this load increase. Elongation, EN, and AE measurements are presented in Fig. 6. EN and elongation data are presented as raw data, whereas AE data are additionally filtered. In order to eliminate

experimental noise, a detection limit of 40 dB was used. Signals that were not captured by both AE sensors within the short time interval that corresponds to the possible distance difference of the source location were also filtered out. Due to the close similarity of the results obtained from both AE sensors, only the filtered signals from one sensor are presented. During the experiments it was observed that every loading increase caused an additional increase in elongation of the specimens. This increase was accompanied by the increase in direct current component and decrease in potential of measured EN signals. It is concluded that changes in EN signals occurred because of the exposure of the new bare surface, which emerged as a consequence of specimen elongation. In cases where no crack initiation or propagation occurred after the loading increase, EN signals returned to their original levels after a period of a few tens of minutes. The bursts of AE signal during loading could not be clearly related to the extension of specimen because a significant amount of AE noise was also produced. The bursts captured during load changes are therefore filtered out in the AE diagram presented in Fig. 6. The events identified by digital image correlation are well reflected in the measurements presented in Fig. 6. It also shows that initiation occurred soon after the second change of loading. Crack initiation was detected by a clear increase of measured direct current component and a decrease of voltage of measured EN. The exact time of initiation can not be detected in these measurements. The reason lies partly in the resolution abilities of EN technique but mainly in disturbances caused by the previous loading change. As previously mentioned, a change (increase) of loading caused an elongation of the specimen and consequently passive film ruptures that were also reflected in increased value of direct current and decreased potential of EN signals. The exact moment of SCC initiation was also difficult to detect by elongation, as the measured elongation increased significantly after each change in the loading due to plastic deformation (especially at higher loads). In order to eliminate these disturbances, the measured elongation was reset to zero after each such step. This is a reason why potentially small and rapid changes in the elongation, following the changes in the loading level, are not evident in the results. In such cases crack initiation would be very difficult to detect using the elongation data alone. SCC initiation could also not be detected from the AE measurements. Before the final stage of cracking there was only very low AE activity, but its source cannot be clearly identified (there is no correlation to any other signal). It might be possible that this low AE activity was related to the initial stages of SCC processes or plastic deformation, but it more likely was a part of acoustic noise from the environment (instrumental noise). The propagation of crack was clearly reflected in the measured EN signals. Crack propagation increases the direct current level and decreases the potential of the measured EN. Towards the final fracture some small sharp transients of EN current were observed and it is suggested that these are due to cracking. Crack propagation was also detected by increasing elongation, as can be seen in Fig. 6. The least sensitive technique for detection of intergranular SCC propagation was AE. Significant AE activity occurred only after the crack achieved a certain length, which was determined, on the basis of digital image correlation measurements, to be around 2 mm. The activity was higher towards the end of experiments and an increase of AE burst amplitudes, energies and durations was also observed. The highest AE activity and the highest amplitudes were detected during the final fracture of specimens. This AE activity is suggested to be partly related to the rupture of ligaments from branched crack, but is mainly a consequence of the fast ductile rupture of the remaining cross-section of the specimen.

The final fracture of the specimen was clearly detected with both EN and elongation measurements. In Fig. 6, a large jump in EN signals as well as a large jump in elongation, corresponding to a sudden increase of AE activity, could be seen. Those signals were a direct consequence of specimen final fracture and failure. 3.2 Metallographic and SEM analysis Metallographic analysis was performed before and after the experiments. Images of the structure of the specimen, the working electrode and final crack are presented in Fig. 7. The figure shows the microstructure after heat treatment. Measurement of grain size using the mean linear intercept method gave an average intercept length of 58 µm with a standard deviation of 7 µm. No predominant orientation or deformation of grains due to the rolling process was confirmed. SEM analysis was performed after the failure of the specimen. The working and reference electrodes were analyzed in order to find any damage caused by exposure to the electrolyte and loading. No visible changes of the reference electrodes were observed. Selected SEM images of the working electrode (i.e. the test specimen) are presented in Fig. 8. One major crack that caused failure of the specimen was found together with some small cracks (Fig. 8a). Approximately 60 % of the final fracture was predominantly intergranular (Fig. 8b,c) while the rest of the final crack surface was ductile, caused by overloading of the specimen due to the reduced cross-section. Even in the predominantly IG part of the crack, some small ductile parts can be observed (Fig. 8d). These parts are comparable with the grain size, and the typical sizes of these smaller ductile areas were in the range between 10-4 mm2 and 10-3 mm2. In the SEM analysis of the final fracture surface, around 50 small ductile areas were recognized. There are some indications that these ductile areas were denser in number and larger in area in the surfaces formed in the later phase of SCC propagation. In Fig. 8e some areas have been marked where larger ductile fractures occurred. Taking into account the digital image correlation analysis of crack length, it can be concluded that the main part of the fracture shown in Fig. 8f occurred during the last 1.5 h of the experiment (Fig. 4). 3.3 Correlations among signals Correlations between signals from 4 different techniques were studied. Correlations between EN, elongation and digital image correlation results (crack opening displacement and crack length) for the experiment presented and described in section 3.1 are presented in Fig. 9. The period around SCC initiation is shown. It can be seen that there is a turn in the mean value of measured voltage and current approximately at 25.8 h. There is also a significant change in the gradient (rate of increase) of elongation around that period (26 h). The crack opening displacement was detectable by image correlation after 25.78 h. EN and elongation measurements are well correlated it. A slower increase of crack opening was observed at the beginning and then at approximately 26.2 h the rate of increase of crack opening vs time increased. The slower changes of signals around 25.8 h, followed by faster changes later on, are also observed in the EN and elongation measurement, indicating that these are correlated with crack growth. After 26.5 h the rate of decrease in the mean value of voltage, and the
corresponding rate of increase of current both decelerated slightly. This can be related to the measured deceleration of crack length (Fig. 5). However, the rate of elongation increase corresponded with the rate of crack opening increase. It can be concluded that the elongation curve has approximately the same characteristics as the crack opening displacement curve, but with less accuracy. This is due to contributing factors such as plastic deformation of specimen after change of load, and the elongation measurement set up. The presented results of DIC (crack opening displacement and crack length) are reflected in the EN measurements. Correlations between electrochemical current noise, acoustic emission bursts and elongation measurement for the same experiment, taken about 1.5 hour later, are presented in Fig. 10. Two different sources related to the SCC process could be assumed on the basis of those correlations and also on the basis of results from SEM analysis. The slower rate of increase of the direct current component in the measured EN signal during crack propagation, without sudden peaks (transients) and with no accompanied AE activity was probably related to IGSCC by more or less continuous dissolution of the grain boundaries at the crack tip. This process is labelled with 1* in Fig. 10. It is assumed that the intergranular area of final fracture presented in Fig. 8c is a consequence of this process. The sudden sharp EN current transients (a sharp increase of current and a slower decrease of current), accompanied with a simultaneous AE burst are probably related to the fracture event (labelled with 2* in Fig. 10). The time resolution of the measuring systems and the nature of fast cracking did not supply more detailed information regarding the relation in time between electrochemical current noise transients and AE bursts. It was observed that typical EN transients had amplitudes of the order of 10 nA, duration of 1-3 seconds and a corresponding charge of around 10 nC. Typical AE transients had a duration of 1-3 ms, amplitude of 40-60 dB and energy around 10-1 pJ. These values are not universal and are highly dependent on the measurement set-up. It was assumed that in the detected process the cracking process forms new bare material at the crack tip, causing a sharp increase of current. Repassivation of this area causes the slower decrease of measured EN current. At the same time, the elastic energy released during the fracture event is captured as an AE burst. The rupture of non-sensitised grain boundaries [57] resulted in the ductile areas that were observed by SEM analysis of the final fracture surface (Fig. 8d and f). Comparison of the shape and frequency characteristics of discrete AE bursts captured during IGSCC propagation and ductile final fracture was also performed. It can be seen in Fig. 11 that these AE bursts, generated by both specific processes, have quite similar characteristics (waveforms and spectral amplitudes). The only significant differences in the measured AE bursts of both specific processes are in the parameters related to their intensity (amplitude, energy, duration): these parameters are considerably higher in the case of final fracture. Based on these observations, it can be assumed that the AE bursts were caused by similar processes (ductile fractures of various dimensions). Taking this into account, an estimate of the sizes of individual small ductile areas in the predominantly intergranular fractured surface was performed. The average energy of the discrete AE burst captured in the time interval between 27.3 h and 28.8 h was 1.2·10-1 pJ. From all the captured discrete AE bursts during the final fracture of the specimen, the total energy was estimated to be approximately 1 nJ. From the observation of the final fracture surface, it was estimated that the ductile part of final fracture caused by overloading had an area of approximately 3 mm2. Using the ratio of an average AE burst energy during predominantly intergranular advancing of the crack to the total AE energy captured during final fracture, it is therefore estimated that the average area of these small ductile fractures was 4·10-4 mm2. This is in quite good agreement with the SEM observations.

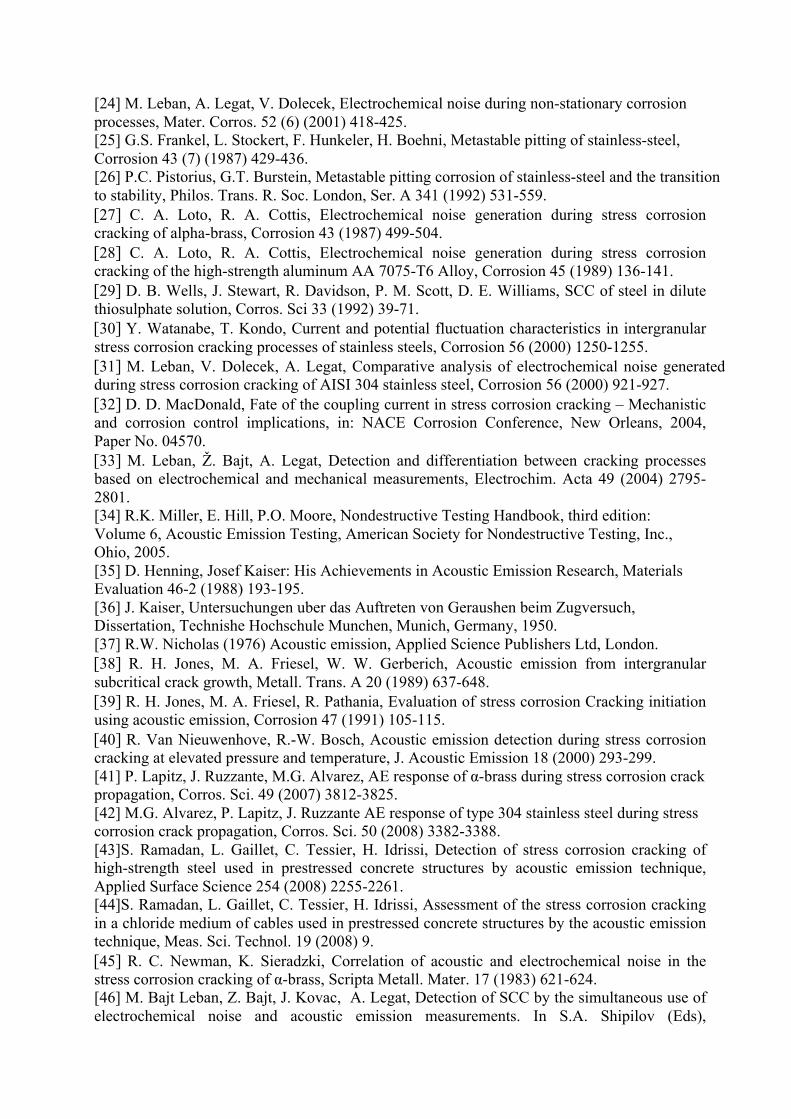
The number of AE bursts captured during crack propagation (Fig. 6) is also roughly the same as the observed number of small ductile areas. The gradual increase in the direct current component of the measured electrochemical current noise was also related to a gradual increase in elongation. On the other hand, the individual ductile fractures that were detected by the simultaneous EN transients and AE bursts, were not indicated in the elongation measurement. It follows that each individual fracture event resulted in an average elongation of less than 0.4 µm. However, the accumulation of several fractures could be seen as a shift in the rate of elongation increase (labelled as 3* on Fig. 10). Digital imaging of the process during this last period of the crack propagation was well related to the observed general trends in EN and elongation, and to some extent also to the cumulative curve of AE hits. The individual fractures were, however, probably too fast and too small to be detected by the image capturing for the time and spatial resolution used. 3.4 Relation to SCC model From the presented results of the experiment on SCC, a few suggestions about the SCC mechanism of initiation and propagation may be given. It can be observed from Fig. 6 that crack initiation in the performed experiment occurred soon after the change of the applied constant load: the load level that provoked the initiation was 50 % of the ultimate tensile strength of material (this value was similar for all other experiments). It is proposed that the SCC initiation occurred following rupture of the surface passive film at corrosion susceptible grain boundaries. The film rupture occurred due to local plastic strain caused by the change in the load level. The film rupture led to intergranular corrosion attack which developed in intergranular SCC by dissolution. The individual ductile fractures were related to the breakage of stress corrosion resistive grain boundaries, or those with geometries unfavourably oriented for stress corrosion cracking [43-44]. There were also some indications that these fractures were more frequent and larger at higher stresses, suggesting that crack velocity may also be a factor in the relative resistance of the grain boundaries. This was observed in the SEM analysis and could be related to an increase in AE activity and intensity (measured by the amplitudes of AE bursts) during crack propagation towards the final fracture. Our conclusion is that the crack propagation process consisted of predominantly intergranular SCC based on dissolution along susceptible grain boundaries. Ductile bridging occurred around the resistive crystal grain boundaries. Based on the assumed mechanism of SCC initiation and propagation, and also on the fact that detected simultaneous transients in electrochemical current noise and AE bursts showed a discontinuous nature, it can be assumed that IGSCC also propagated in discontinuous steps. Although exact statistical analysis of all performed experiments was not among the aims of this study, the basic parameters of the signals in the selected experiment were related to the different stages in SCC processes (Table 1). In general, it can be stated that the different stages of the experiment can be distinguished based on the monitoring of the chosen signal’s parameters. From the results and our previous research [31-33,46-47,49-51] it is evident that the values of the presented parameters are highly dependent on the selected corrosion system (electrolyte, material properties, temperature, pH, specimen shape, etc.) and on the experimental set-up. Table 1 indicates that detection of different periods during the experiment (for example, crack propagation) is possible on the basis of a proper selection of one or more parameters (i.e. direct current, elongation, AE activity, etc.). It is thus expected that with
knowledge of the monitoring corrosion system and with knowledge of the used monitoring techniques and their set-up it could be possible to use some of these techniques, or even better, a combination of them, for the detection and monitoring of the IGSCC process. 4 Conclusions On the basis of the presented experiments, the following conclusions have been made: 1. Simultaneous use of all 4 measuring techniques (AE, EN, digital imaging, elongation measurements) enables reliable detection of IGSCC propagation as well as final fracture of the specimen. Cracks, shortly after initiation, could be detected. The detection of IGSCC process could be made on the basis of a proper selection of one signal parameter or even better by combination of several parameters of 4 used monitoring techniques.
2. Crack initiation followed by short crack propagation caused an instant then gradual increase in direct current component, decrease in the potential of measured EN, as well as an increase in specimen elongation. Short cracks were also detected by application of the digital image correlation technique (DIC) to captured digital images. 3. Crack propagation was observed in all measured signals, although AE activity occurred only when the crack was large enough. The propagation was also successfully monitored with digital imaging. Crack opening displacement and crack length were calculated from the image correlation analysis. 4. Crack opening displacement and crack length were correlated with EN and elongation measurements. Correlations among EN, AE and elongation measurements were also related to the two different processes: IGSCC along corrosion susceptible crystal boundaries, presumably based on dissolution, and small individual ductile fractures. Results of SEM analysis of the fracture surface also could be well related to those two processes. Time resolution of measuring systems did not allow more detailed information regarding the relation of electrochemical current noise transients and AE bursts, especially about the exact sequences of individual events. 5. The detected simultaneous transients in the electrochemical current noise and acoustic emission bursts indicated the discontinuous nature of the monitored IGSCC processes. The results were in agreement with the assumption that the AE bursts that occur during IGSCC are caused by ruptures of ductile crack bridging ligaments behind the propagating crack tip. 6. Analysis of the signals obtained by different techniques, as well as their comparison, has provided some new insights into the IGSCC processes. However, due to the present limitations of these techniques and the relatively small amount of data, it is not possible to conclude that these observations are generally valid. In order to reach higher reliability, the basic signal parameters that are related to the different stages in SCC processes also need to be subjected to an exact statistic analysis from a larger group of experiments.

5 REFERENCES [1] F.P. Ford, P.L Andresen, Corrosion in nuclear systems: Environmental assisted cracking in light water reactors, in: P. Marcus (Eds.), Corrosion Mechanisms in Theory and Practice, Marcel Dekker, New York, 2002, pp. 605-642. [2] R. H. Jones, Stress-Corrosion Cracking – Material Performance and Evaluation, ASM International Materials Park, Ohio, 1992. [3] R. P. Gangloff, M. B. Ives (Eds.), Environmental - Induced Cracking of Metals, NACE Publication, Houston, 1990. [4] A. Turnbull, Modelling of environmental assisted cracking, Corros. Sci. 34 (1993) 921-969. [5] K. R Trethewey, Some observations on the current status in the understanding of stress-corrosion cracking of stainless steels, Mater Design 29 (2008) 501-507. [6] R.C. Newman, Developments in the slip-dissolution model of stress corrosion cracking, Corrosion 50 (1994) 682-686. [7] R.C. Newman, C. Healey, Stability, validity, and sensitivity to input parameters of the slip-dissolution model for stress corrosion cracking, Corros. Sci. 49 (2007) 4040-4050. [8] R.C. Newman, T. Shahrabi, K. Sieradzki, Film-induced cleavage of alpha-brass, Scripta Metallurgica 23 (1989) 71-74. [9] M. Saito, G.S. Smith, R.C. Newman, Testing the film-induced cleavage model of stress-corrosion cracking, Corros. Sci. 35 (1993) 411-417. [10] A. Barnes, N. Senior, R C. Newman, Revisiting the film-induced cleavage model of SCC, in: S.A. Shipilov, R.H. Jones, J.M. Olive, R.B. Rebak (Eds.), Environment-Induced Cracking of Materials, Elsevier, 2008, 47-57. [11] J.R. Galvele, A stress corrosion cracking mechanism based on surface mobility, Corros. Sci. 45 (1987) 1-33. [12] J.R. Galvele, Surface mobility mechanism of stress-corrosion cracking, Corros. Sci. 35 1993) 419-434. [13] J.R. Galvele, Recent developments in the surface-mobility stress-corrosion-cracking mechanism, Electrochim. Acta 45 (2000) 3537-3541. [14] S.B. Farina, G.S. Duffo, J.R. Galvele, Stress corrosion cracking of zirconium and Zircaloy-4 in halide aqueous solutions, Corros. Sci.45 (2003) 2497–2512. [15] K. Hladky, J.L. Dawson, The measurement of localized corrosion using electrochemical noise, Corros. Sci. 21 (1981) 317-322. [16] P.C. Searson, J.L. Dawson, Analysis of electrochemical noise generated by corroding electrodes under open-circuit conditions, J. Electrochem. Soc. 135 (8) (1988) 1908-1915. [17] A. Legat, C. Zevnik, The electrochemical noise of mild and stainless steel in various water solutions, Corros. Sci. 35 (1993) 1661. [18] P.R. Roberge, R. Beaudoin, V.S. Sastri, Electrochemical noise measurements for field applications, Corros. Sci. 29 (1989) 1231-1233. [19] D.A. Eden, Electrochemical noise-analysis of iron exposed to NaCl solutions of different corrosivity, Electrochem. Soc. 141 (5) (1994) 1402. [20] C.A. Loto, R.A. Cottis , Electrochemical noise generation during stress corrosion cracking of the high-strength aluminum AA 7075-T6 alloy, Corrosion, Volume 45, Issue 2, February 1989, Pages 136-141. [21] R.A. Cottis, Interpretation of electrochemical noise data, Corrosion 57 (2001) 265. [22] U. Bertocci, C. Gabrielli, F. Huet, M. Keddam, Noise resistance applied to corrosion measurements, J. Electrochem. Soc. 144 (1997) 31. [23] A. Legat, V. Dolecek, Chaotic analysis of electrochemical noise measured on stainless steel, J. Electrochemical Soc. 142 (6) (1995) 1851-1858.
[24] M. Leban, A. Legat, V. Dolecek, Electrochemical noise during non-stationary corrosion processes, Mater. Corros. 52 (6) (2001) 418-425. [25] G.S. Frankel, L. Stockert, F. Hunkeler, H. Boehni, Metastable pitting of stainless-steel, Corrosion 43 (7) (1987) 429-436. [26] P.C. Pistorius, G.T. Burstein, Metastable pitting corrosion of stainless-steel and the transition to stability, Philos. Trans. R. Soc. London, Ser. A 341 (1992) 531-559. [27] C. A. Loto, R. A. Cottis, Electrochemical noise generation during stress corrosion cracking of alpha-brass, Corrosion 43 (1987) 499-504. [28] C. A. Loto, R. A. Cottis, Electrochemical noise generation during stress corrosion cracking of the high-strength aluminum AA 7075-T6 Alloy, Corrosion 45 (1989) 136-141. [29] D. B. Wells, J. Stewart, R. Davidson, P. M. Scott, D. E. Williams, SCC of steel in dilute thiosulphate solution, Corros. Sci 33 (1992) 39-71. [30] Y. Watanabe, T. Kondo, Current and potential fluctuation characteristics in intergranular stress corrosion cracking processes of stainless steels, Corrosion 56 (2000) 1250-1255. [31] M. Leban, V. Dolecek, A. Legat, Comparative analysis of electrochemical noise generated during stress corrosion cracking of AISI 304 stainless steel, Corrosion 56 (2000) 921-927. [32] D. D. MacDonald, Fate of the coupling current in stress corrosion cracking – Mechanistic and corrosion control implications, in: NACE Corrosion Conference, New Orleans, 2004, Paper No. 04570. [33] M. Leban, Ž. Bajt, A. Legat, Detection and differentiation between cracking processes based on electrochemical and mechanical measurements, Electrochim. Acta 49 (2004) 2795-2801. [34] R.K. Miller, E. Hill, P.O. Moore, Nondestructive Testing Handbook, third edition: Volume 6, Acoustic Emission Testing, American Society for Nondestructive Testing, Inc., Ohio, 2005. [35] D. Henning, Josef Kaiser: His Achievements in Acoustic Emission Research, Materials Evaluation 46-2 (1988) 193-195. [36] J. Kaiser, Untersuchungen uber das Auftreten von Geraushen beim Zugversuch, Dissertation, Technishe Hochschule Munchen, Munich, Germany, 1950. [37] R.W. Nicholas (1976) Acoustic emission, Applied Science Publishers Ltd, London. [38] R. H. Jones, M. A. Friesel, W. W. Gerberich, Acoustic emission from intergranular subcritical crack growth, Metall. Trans. A 20 (1989) 637-648. [39] R. H. Jones, M. A. Friesel, R. Pathania, Evaluation of stress corrosion Cracking initiation using acoustic emission, Corrosion 47 (1991) 105-115. [40] R. Van Nieuwenhove, R.-W. Bosch, Acoustic emission detection during stress corrosion cracking at elevated pressure and temperature, J. Acoustic Emission 18 (2000) 293-299. [41] P. Lapitz, J. Ruzzante, M.G. Alvarez, AE response of α-brass during stress corrosion crack propagation, Corros. Sci. 49 (2007) 3812-3825. [42] M.G. Alvarez, P. Lapitz, J. Ruzzante AE response of type 304 stainless steel during stress corrosion crack propagation, Corros. Sci. 50 (2008) 3382-3388. [43]S. Ramadan, L. Gaillet, C. Tessier, H. Idrissi, Detection of stress corrosion cracking of high-strength steel used in prestressed concrete structures by acoustic emission technique, Applied Surface Science 254 (2008) 2255-2261. [44]S. Ramadan, L. Gaillet, C. Tessier, H. Idrissi, Assessment of the stress corrosion cracking in a chloride medium of cables used in prestressed concrete structures by the acoustic emission technique, Meas. Sci. Technol. 19 (2008) 9. [45] R. C. Newman, K. Sieradzki, Correlation of acoustic and electrochemical noise in the stress corrosion cracking of α-brass, Scripta Metall. Mater. 17 (1983) 621-624. [46] M. Bajt Leban, Z. Bajt, J. Kovac, A. Legat, Detection of SCC by the simultaneous use of electrochemical noise and acoustic emission measurements. In S.A. Shipilov (Eds),

Environment-induced cracking of materials. Vol. 2, Prediction, industrial developments and evaluation : proceedings of the Second International Conference on Environment-Induced Cracking of Metals (EICM-2), Elsevier, 2008, str. 449-458. [47] J. Kovac, M. Leban, A. Legat, An attempt to detect SCC by combined measurements of electrochemical noise and acoustic emission. Mater. Corros. 58 (2007) 970-976. [48] W. Zhang, L. Dunbar, D. Tice, Monitoring of stress corrosion cracking of sensitised 304H stainless steel in nuclear applications by electrochemical methods and acoustic emission, in: S. Ritter, A. Molander (Eds.), Energy Materials: Materials Science and Engineering for Energy Systems Volume 3, Issue 2, Maney Publishing, 2008, pp. 59-71. [49] M. Leban, A. Legat, V. Dolecek, V. Kuhar, Electrochemical noise as a possible method for detecting stress-corrosion cracking, Mater. Sci. Forum, 289 (1998) 157-161. [50] M. Leban, A. Legat, V. Dolecek, Electrochemical noise during non-stationary corrosion processes, Mater. Corros. 52 (2001) 418-425. [51] J. Kovac, M. Leban, A. Legat, Detection of SCC on prestressing steel wire by the simultaneous use of electrochemical noise and acoustic emission measurements, Electrochim. acta. 52 (2007) 7607-7616. [52] S. Rahimi, D.L. Engelberg, J.A.Duff, T.J. Marrow, In situ observation of intergranular crack nucleation in a grain boundary controlled austenitic stainless steel, Journal of Microscopy 233 (2009) 423-431. [53] P. M. Wood, J. A. Duff, T. J. Marrow (2009), Imaging Autoclave Development for In-Situ Optical Measurement of High Temperature Aqueous Corrosion Processes in: 12th International Conference on Fracture, ICF12, 12-17 July, Ottawa, Canada. [54] A. Steuwer, L. Edwards, S. Pratihar, S. Ganguly, M. Peel, M.E. Fitzpatrick, T.J. Marrow, P.J. Withers, I. Sinclair, K.D. Singh, N. Gao, T. Buslaps, J.-Y. Buffière, In situ analysis of cracks in structural materials using synchrotron X-ray tomography and diffraction, Nuclear Instruments and Methods in Physics Research Section B: Beam Interactions with Materials and Atoms 246 (2006) 217-225. [55] T.J. Marrow, L. Babout, A.P. Jivkov, P. Wood, D. Engelberg, N. Stevens, P.J. Withers, R.C. (2006), Three dimensional observations and modelling of intergranular stress corrosion cracking in austenitic stainless steel, Journal of Nuclear Materials 352 (2006) 62-74. [56] T.J. Marrow, L. Babout, B.J. Connolly, D. Engelberg, G. Johnson, J. -Y. Buffiere, P.J. Withers, R.C. Newman, High-resolution, in-situ, tomographic observations of stress corrosion cracking, in: S.A. Shipilov, R.H. Jones, J.M. Olive, R.B. Rebak (Eds.), Environment-Induced Cracking of Materials, Elsevier, 2008, pp. 439-447 [57] A. King, G. Johnson, D. Engelberg, W. Ludwig, T.J. Marrow, Observations of intergranular stress corrosion cracking in a grain-mapped polycrystal, Science 321 (2008) 382-385. [58] J. Quinta Da Fonesca, P.M. Mummery, P.J. Withers, Full field strain mapping by optical correlation of micrographs acquired during deformation, Journal of Microscopy 218 (2005) 9-21. [59] D.L. Engelberg, T.J. Marrow, R.C. Newman, L. Babouta, Grain boundary engineering for crack bridging: A new model for intergranular stress corrosion crack (IGSCC) propagation, in: S.A. Shipilov, R.H. Jones, J.M. Olive, R.B. Rebak (Eds.), Environment-Induced Cracking of Materials, Elsevier, 2008, pp. 69-79.

FIGURE CAPTIONS Fig. 1. Scheme of specimen and reference electrodes.
Fig. 2. Schematic picture of the experimental set-up. A digital camera, which is not presented on the picture, was mounted in front of corrosion cell. Fig. 3. A series of selected images of the specimen captured by the digital imaging system. The bright area is the unprotected exposed metal surface and the off-white area around the metal is the protective coating. The semicircular cut-out region is the bottom curve of the metal surface. The images show different stages of the experiment: a) immediately after loading, b) around initiation, c) one crack can be seen, d) several cracks can be seen, e) joining of the cracks, ) just (5 minutes) before failure. Fig. 4. Typical results of the DIC analysis. Left: strain maps, obtained by differentiation of the horizontal displacements maps measured between selected images (times of the images are indicated on the right side). Right: Profiles for the horizontal displacements measured along a line close to the edge of the sample (indicated by dotted line). Fig. 5. Results of DIC analysis: crack length and crack opening displacement with time. Fig. 6. Diagrams of measured elongation of specimen, EN (current and potential), and AE cumulative and amplitude of hits captured with sensor 1. Fig. 7. Metallographic images: a) before exposure, b) after exposure. Fig. 8. SEM images: a) a few short cracks were also observed on the side of the specimen (the cracks in Figure 7a were observed a few millimetres above the final fracture (the vertical centre of the semicircular area) in the horizontal centre of the specimen), b) final fracture where the semicircular cut-out region is on the left side of the image: ~ 60 % is caused by intergranular SCC, whereas the rest is ductile, caused by overloading of the specimen because of its reduced cross-section, c) an enlargement of an area of final fracture (the top marked small rectangular area in Fig 7b) produced by SCC, d) beside the predominantly intergranular fracture, an enlargement of the final fracture area (the bottom marked rectangular area in Fig 7b) shows that some small areas of the SCC part of the final fracture were ductile, as indicated by the ellipses, e) an enlargement where the parts with more dense and larger ductile areas have been marked, f) an enlargement of the ductile areas from the image shown in e), which are located within the rectangular area marked f*.
Fig. 9. Detail from the measurements around the crack initiation period. In the top graph EN measurements are presented. In the middle graph the elongation and its gradient are presented. In the bottom graph gradient of crack opening displacement is presented.
Fig. 10. Detail from the last part of measurements. In the top graph elongation and global polynomial fit of elongation are presented. In the bottom graph the amplitude of AE hits (circles) and EN current (curve) are presented. Fig. 11. AE bursts: waveforms (top diagrams) and spectral amplitudes (bottom diagrams) captured during intergranular crack propagation (left diagrams) and during final fracture (right diagrams).
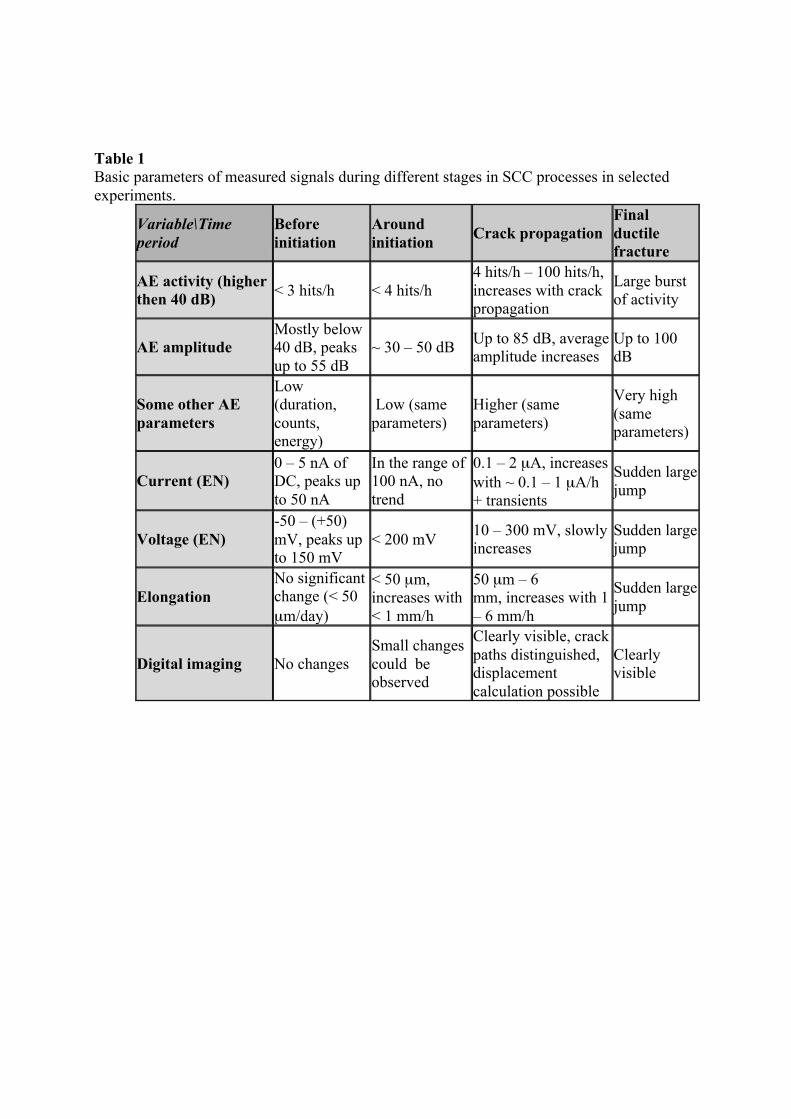
Table 1 Basic parameters of measured signals during different stages in SCC processes in selected experiments.
Variable\Time period
Before initiation
Around initiation Crack propagation
Final ductile fracture
AE activity (higher then 40 dB) < 3 hits/h < 4 hits/h
4 hits/h – 100 hits/h, increases with crack propagation
Large burst of activity
AE amplitude Mostly below 40 dB, peaks up to 55 dB
~ 30 – 50 dB Up to 85 dB, average amplitude increases
Up to 100 dB
Some other AE parameters
Low (duration, counts, energy)
Low (same parameters)
Higher (same parameters)
Very high (same parameters)
Current (EN) 0 – 5 nA of DC, peaks up to 50 nA
In the range of 100 nA, no trend
0.1 – 2 µA, increases with ~ 0.1 – 1 µA/h + transients
Sudden large jump
Voltage (EN) -50 – (+50) mV, peaks up to 150 mV
< 200 mV 10 – 300 mV, slowly increases
Sudden large jump
Elongation No significant change (< 50 µm/day)
< 50 µm, increases with < 1 mm/h
50 µm – 6 mm, increases with 1 – 6 mm/h
Sudden large jump
Digital imaging No changes Small changes could be observed
Clearly visible, crack paths distinguished, displacement calculation possible
Clearly visible

FIG1
FIG2
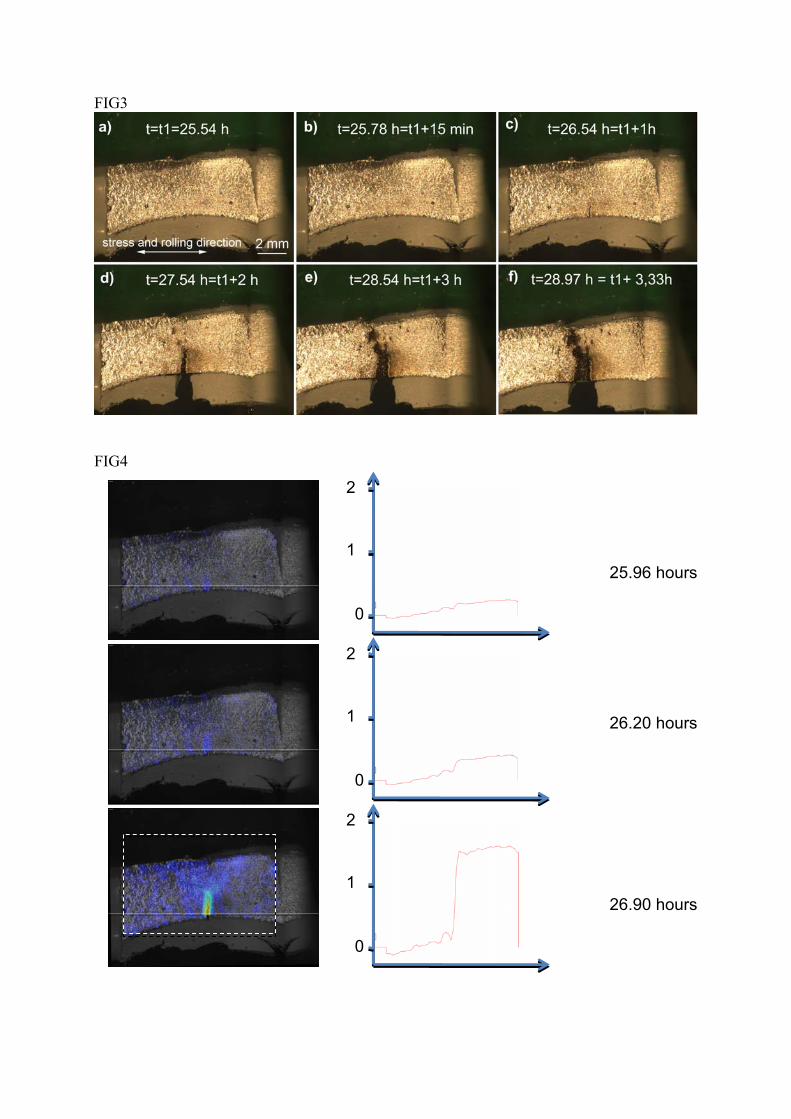
FIG3
FIG4
25.96 hours
26.20 hours
2
1
0
2
1
0
2
126.90 hours
0
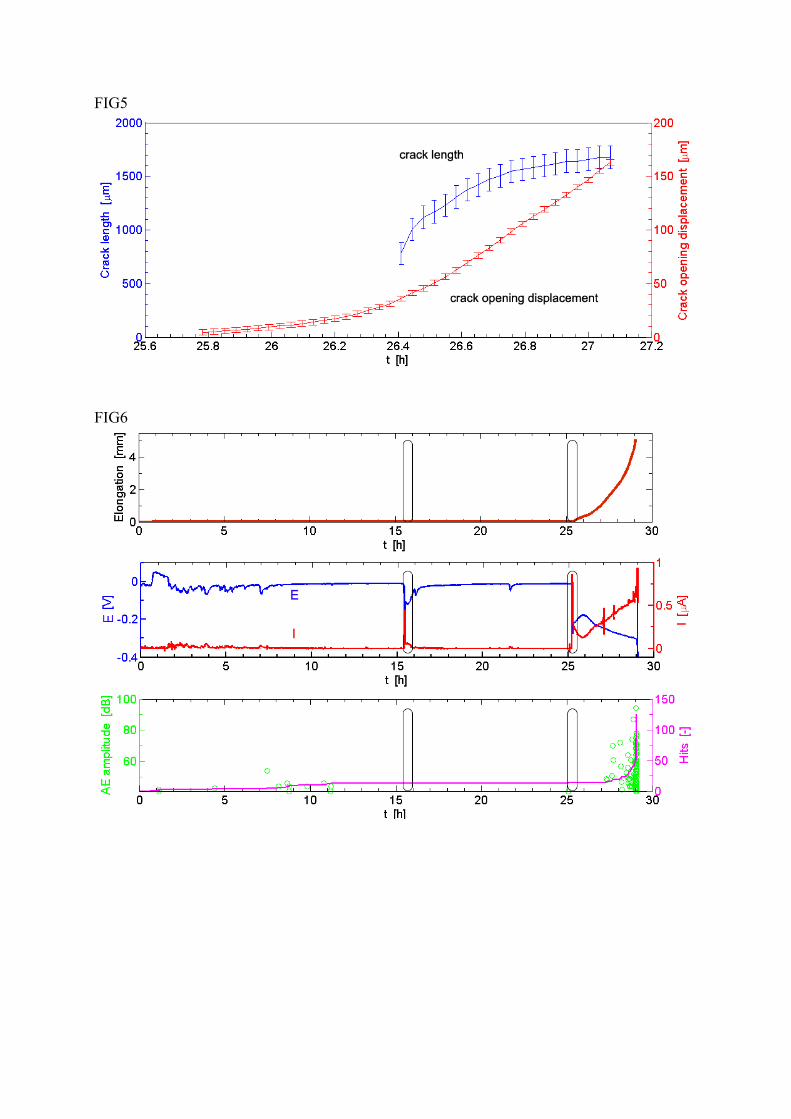
FIG5
FIG6

FIG7

FIG8

FIG9

FIG10

FIG11
Related Documents