Correlation of microstructure with tensile, creep and corrosion behaviour of AZ91 Mg alloy fabricated by three different casting techniques A thesis submitted in partial fulfilment of the requirements for the degree of Master of Technology (By Research) in Metallurgical and Materials Engineering by Hrishikesh Shastri (Roll No.: 612MM3011) Department of Metallurgical and Materials Engineering National Institute of Technology Rourkela, Odisha 2015

Welcome message from author
This document is posted to help you gain knowledge. Please leave a comment to let me know what you think about it! Share it to your friends and learn new things together.
Transcript

Correlation of microstructure with tensile, creep and
corrosion behaviour of AZ91 Mg alloy fabricated by three
different casting techniques
A thesis submitted in partial fulfilment of the
requirements for the degree of
Master of Technology (By Research)
in
Metallurgical and Materials Engineering
by
Hrishikesh Shastri
(Roll No.: 612MM3011)
Department of Metallurgical and Materials Engineering
National Institute of Technology Rourkela, Odisha
2015
Correlation of microstructure with tensile, creep and
corrosion behaviour of AZ91 Mg alloy fabricated by three
different casting techniques
A thesis submitted in partial fulfilment of the
requirements for the degree of
Master of Technology (By Research)
in
Metallurgical and Materials Engineering
by
Hrishikesh Shastri
(Roll No.: 612MM3011)
Under the supervision of
Prof. A. K. Mondal and Prof. K. Dutta
Department of Metallurgical and Materials Engineering
National Institute of Technology Rourkela, Odisha
2015
Contents
Certificate .................................................................................................................................. i
Acknowledgements .................................................................................................................. ii
Abstract .................................................................................................................................... iii
List of figures ........................................................................................................................... iv
Tables ....................................................................................................................................... vi
Chapter 1. Introduction ....................................................................................................... 1-3
1.1 Introduction ...................................................................................................................... 1
1.2 Objective of the present thesis ......................................................................................... 2
1.3 Outline of the thesis .......................................................................................................... 3
Chapter 2. Literature review ............................................................................................. 4-16
2.1 Mg and its alloys .............................................................................................................. 4
2.1.1 Pure Mg ..................................................................................................................... 4
2.1.2 AZ91 alloy ................................................................................................................. 6
2.1.3 Applications of Mg alloys ......................................................................................... 6
2.2 Tensile test ........................................................................................................................ 8
2.3 Creep ................................................................................................................................ 8
2.4 Corrosion ........................................................................................................................ 11
2.5 Casting techniques ......................................................................................................... 12
2.5.1 Ingot casting (IC)..................................................................................................... 12
Contents
2.5.2 Squeeze-casting (SC) .............................................................................................. 12
2.5.3 High pressure die-casting (HPDC) .......................................................................... 12
2.6 Tensile and creep behaviour of Mg alloys in different casting conditions .................... 14
2.7 Corrosion behaviour of Mg alloys in different casting conditions ................................. 16
Chapter 3. Experimental procedure ............................................................................... 17-21
3.1 Fabrication of the alloys ................................................................................................. 17
3.2 Specimen preparation ..................................................................................................... 19
3.3 Characterization of the alloys ......................................................................................... 19
3.3.1 X-ray diffraction (XRD) .......................................................................................... 19
3.3.2 Optical microscopy (OM) ....................................................................................... 19
3.3.3 Scanning electron microscopy (SEM) ..................................................................... 20
3.3.4 Mechanical characterization .................................................................................... 20
3.3.4.1 Tensile test .......................................................................................................... 20
3.3.4.2 Creep test ........................................................................................................... 20
3.3.5 Corrosion test ......................................................................................................... 20
Chapter 4. Microstructural characterization ................................................................. 22-29
4.1 As-cast microstructure .................................................................................................... 22
Chapter 5. Mechanical characterization......................................................................... 30-40
5.1 Tensile behaviour ........................................................................................................... 30
5.2 Creep behaviour ............................................................................................................. 37

Contents
Chapter 6. Corrosion behaviour ...................................................................................... 41-56
6.1 Corrosion response ......................................................................................................... 41
6.1.1 Open circuit potential (OCP) ................................................................................... 41
6.1.2 Electrochemical impedance spectroscopy (EIS) ..................................................... 43
6.1.3 Potentiodynamic polarization scan .......................................................................... 49
6.2 Microstructural observation after corrosion tests ........................................................... 51
Chapter 7. Conclusions ..................................................................................................... 57-58
References .......................................................................................................................... 59-61
Bio-data ................................................................................................................................... 62

i
Department of Metallurgical and Materials Engineering
National Institute of Technology Rourkela
Odisha-769008, India
CERTIFICATE
This is to certify that the thesis entitled “Correlation of microstructure with tensile, creep and
corrosion behaviour of AZ91 Mg alloy fabricated by three different casting techniques”
submitted by Hrishikesh Shastri (Roll No.: 612MM3011) in partial fulfilment of the
requirements for the award of Master of Technology (By Research) in Metallurgical and
Materials Engineering at National Institute of Technology, Rourkela is a bonafide research
work carried out by him under our supervision and guidance and is worthy of consideration for
the award of the degree. The candidate has fulfilled all prescribed requirements for the thesis.
To the best of our knowledge, the matter embedded in the thesis is based on candidate’s own
work and has not been submitted to any other university / institute for the award of any degree
or diploma.
Prof. Ashok Kumar Mondal Prof. Krishna Dutta
Principal Supervisor Co-Supervisor
Date:
Place:

ii
Acknowledgements
My sincere thanks to the present and past HOD, Department of Metallurgical and Materials
Engineering, National Institute of Technology Rourkela for providing the necessary facilities
for carrying out this work.
My heartfelt thanks goes to my principal supervisor Prof. A. K. Mondal for believing in me.
Without him this work would have not been possible. The discussion with him were
enlightening. I am also highly thankful to my co-supervisor Prof. K. Dutta for his constant
support and encouragement.
My sincere gratitude to MSC members Prof. S. C. Mishra, Prof. A. Basu, Prof. M. Masanta
and Prof. A. Mitra for their guidance throughout this work.
I am also thankful to my labmates Anil and Pranav for their support. I would like to thank all
the laboratory staffs of the Dept. of MM, NIT Rourkela for their constant practical assistance.
I am also grateful to the Biju Patnaik Central Library for providing me the required literatures
and books for carrying out this research work.
Thanks to all help and company I received from the Dept. of Materials Engineering, Indian
Institute of Science, Bangalore. It would have not been possible without the support extended
by the NRC-M. Prof. S. Kumar and Prof. S. Suwas have always been so helpful. My special
thanks goes to Chandra Shekhar P. and his labmates for their commendable help with the work.
I also thank Dr. H. Dieringa for helping me to carry out the creep tests.
Last but not the least, I feel grateful to have such a supportive family and friends.
Hrishikesh Shastri

iii
Abstract
In the present investigation an attempt has been made to correlate microstructure with tensile,
creep and corrosion behaviour of the AZ91 Mg alloy produced by three different casting
techniques. All the as-cast alloys consist of primary Mg (α-Mg) and β-Mg17Al12 phases. The
volume fraction of the β-Mg17Al12 phase is the highest in the ingot casting (IC), intermediate
in the squeeze-casting (SC) and the lowest in the high pressure die-casting (HPDC). The tensile
tests are performed at ambient, 150 and 200°C temperatures. The best tensile properties are
exhibited by the SC alloy at all the temperatures employed in the present investigation owing
to the presence of negligible porosity and relatively finer grain size. Fracture surfaces of the
broken tensile specimens reveal quasi-cleavage fracture. The creep tests are performed in
compression at a stress of 70 MPa and temperature of 150ºC. The best and worst creep
resistance are exhibited by the SC and HPDC alloys with the IC alloy exhibiting the
intermediate creep resistance. Poor creep resistance of the HPDC alloy is attributed to the
presence of relatively higher amount of porosity that allows easy crack initiation and growth
during creep tests. On the contrary, presence of negligible porosity and continuous network of
eutectic phase contributes to the superior creep resistance of the SC alloy. Electrochemical
corrosion tests of all the alloys are carried out at ambient temperature in 0.5 wt.% NaCl aqueous
solution with neutral pH. The best and worst corrosion resistance are exhibited by the HPDC
and IC alloys. The superior corrosion resistance of the HPDC alloy is attributed to the relatively
finer grain size and higher percentage of Al dissolved in α-Mg phase. Thus, the SC alloy
exhibits the best tensile and creep properties with intermediate corrosion resistance among the
alloys employed in the present investigation.
Keywords: AZ91 magnesium alloy; Casting technique; Microstructure; Tensile; Creep;
Corrosion
iv
List of figures
Fig. No. Caption Page No.
2.1 Schematic description of HCP crystal structure and major planes
of Mg.
5
2.2 Mg-Al phase diagram. 7
2.3 Schematic representation of an engineering stress-strain curve. 9
2.4 Schematic representation of a typical creep curve. 9
2.5 Schematic diagrams of various operations of direct SC process:
(a) pouring melt into die cavity, (b) solidification under pressure
and (c) removal of casting.
13
2.6 Schematic diagram of cold chamber HPDC. 13
3.1 Actual photograph of the SC setup employed to fabricate the IC
and SC alloys.
18
4.1 XRD patterns obtained from the AZ91 alloy in three different
casting conditions.
23
4.2 Optical micrographs of the (a) IC, (b) SC and (c) HPDC alloys. 24
4.3 SEM micrographs of the (a) IC, (b) SC and (c) HPDC alloys. 26
5.1 Stress vs. strain plots of the SC alloy tested at ambient, 150°C
and 200°C temperature.
31
5.2 Comparison of tensile properties of the IC, SC and HPDC alloys
at (a) ambient, (b) 150°C and (c) 200°C temperature.
32
5.3 Fracture surfaces of tensile specimens of the (a) IC, (b) SC and
(c) HPDC alloys tested at ambient temperature.
36
List of figures
v
5.4 (a) Strain vs. time plots for the IC, SC and HPDC alloys creep
tested at 70 MPa stress and temperature of 150°C for 50 h; (b)
Strain rate vs. time plots and (c) Calculation of strain rates by
linear fit to the plots shown in (a).
38
5.5 SEM micrograph of the HPDC alloy creep tested at 70 MPa
stress and temperature of 150°C for 50 h.
40
6.1 Variation of OCP with time of the HPDC, SC and IC alloys. 42
6.2 Comparison of OCP of the HPDC, SC and IC alloys. 42
6.3 Nyquist plots of the (a) HPDC, (b) SC and (c) IC alloys. 45
6.4 Nyquist plots of all the alloys at (a) 0 h, (b) 10 h and (c) magnified
view of (b).
46
6.5 Bode impedance plots of the (a) HPDC, (b) SC and (c) IC alloys. 47
6.6 Bode phase angle plots of the (a) HPDC, (b) SC and (c) IC alloys. 48
6.7 Potentiodynamic polarization plots for all the alloys. 50
6.8 Comparison of corrosion rate obtained from Tafel extrapolation. 50
6.9 SEM micrographs of the surfaces corresponding to the (a)
HPDC, (b) SC and (c) IC alloys before removal of corrosion
products.
52
6.10 XRD pattern obtained from the corroded surface of the SC alloy. 53
6.11 FTIR pattern of corrosion product obtained from the corroded
surface of the SC alloy.
53
6.12 SEM micrographs of the (a) HPDC, (b) SC and (c) IC alloys after
removal of corrosion products.
55
6.13 SEM micrograph of cross-section of the corroded surface of the
IC alloy.
56

vi
Tables
Table No. Caption Page No.
2.1 Applications of Mg alloys in automobiles. 6
4.1 Quantitative analysis of the microstructural features of all the
alloys.
28
5.1 Comparison of the calculated and experimentally determined
YS of all the alloys.
33
6.1 Values of various parameters obtained from the
potentiodynamic polarization plots.
49

1
Chapter 1. Introduction
1.1 Introduction
Environmental interest and exhaustible reserves of fossil fuel demands for weight-saving to
attain improved fuel efficiency in the automotive industry. In this regard, magnesium (Mg)
alloys possessing high specific strength are the most promising structural material for
applications in aerospace and automotive industries. Mg alloys are primarily used in as-cast
condition to fabricate intricate components and the casting conditions or parameters (i.e.,
solidification rate, volume fraction and morphology of intermetallic phases, grain size,
porosity, degree of solute supersaturation and so on) decides the achieved properties.
Among the various casting techniques available, ingot casting (IC) and high pressure die-
casting (HPDC) are widely used in automotive applications. IC is a conventional casting
process where the molten metal solidifies under the influence of gravity. In HPDC, molten
metal is injected at high speed into the mould and solidification occurs under high pressure.
The solidification in HPDC is very rapid (varies from milli-seconds to a few seconds) and gives
a net-shaped component. Recently, squeeze-casting (SC) gained popularity for the superior
properties exhibited by the castings produced following this route. In SC, the rate of molten
metal pouring is relatively slower, continuous and solidification takes place under high pressure
that ensures negligible porosity in the casting. The governing reason for low porosity in the
SC as compared to HPDC is that the former takes longer time for solidification (about a half-
second to three seconds) and lower velocity of die filling as compared to the latter ensuring
less air-entrapment.

Chapter 1. Introduction
2
Various Mg alloys with different alloying additions were produced. However, the AZ91 (Mg-
9Al-0.7Zn-0.2Mn) (wt.%) alloy is a cheaper alternative with decent properties and continues
to be a workhorse alloy. A review of the existing literature (presented in chapter 2) evidenced
that the tensile, creep and corrosion behaviour of Mg alloys differ significantly with cooling
rates and casting routes employed to fabricate the alloys. To the best of our knowledge, no
literature exists that correlates microstructure, mechanical properties and corrosion behaviour
of the AZ91 alloy with three different casting techniques i.e., IC, SC and HPDC side-by-side.
Consequently, it is worth correlating microstructure, mechanical properties and corrosion
behaviour of the AZ91 alloy fabricated by three different casting techniques in order to
ascertain the most suitable casting route for large-scale production.
1.2 Objective of the present thesis
The objective of the present investigation is to correlate microstructure with tensile, creep and
corrosion behaviour of the AZ91 Mg alloy fabricated by three different casting techniques.
The salient objectives of this investigation are as follows:
i. Fabrication of the AZ91 alloy by three different casting routes i.e., IC, SC and HPDC.
ii. Characterization of microstructures of all the fabricated alloys.
iii. Characterization of ambient and elevated temperature tensile properties as well as creep
behaviour of the alloys.
iv. Observation of microstructures of tensile and creep tested specimens in order to
understand the underlying deformation mechanisms.
v. Investigation of corrosion behaviour of all the fabricated alloys.

Chapter 1. Introduction
3
1.3 Outline of the thesis
The present thesis contains seven chapters and the contents of each chapter are mentioned as
follows:
Chapter 1 discusses the relevance of the problem.
Chapter 2 reviews the literature most relevant to the present investigation.
Chapter 3 describes the experimental procedures followed.
Chapter 4 presents the results and discussion on microstructural characterization of the as-cast
alloys.
Chapter 5 includes the results and discussion on tensile and creep behaviour of the alloys.
Chapter 6 deals with the investigation of corrosion behaviour of the alloys.
Chapter 7 concludes the present investigation.
The references cited throughout the thesis are listed in the reference section.
4
Chapter 2. Literature review
This chapter briefly discusses the literature most relevant to the present investigation. Section
2.1 is a brief introduction about Mg and its alloys. Section 2.2 and 2.3 provide summary about
tensile and creep tests. Section 2.4 includes fundamentals of corrosion. The details about
different casting techniques have been discussed in section 2.5. Literature covering mechanical
properties and corrosion behaviour of Mg alloys in different casting conditions is reviewed in
sections 2.6 and 2.7, respectively.
2.1 Mg and its alloys
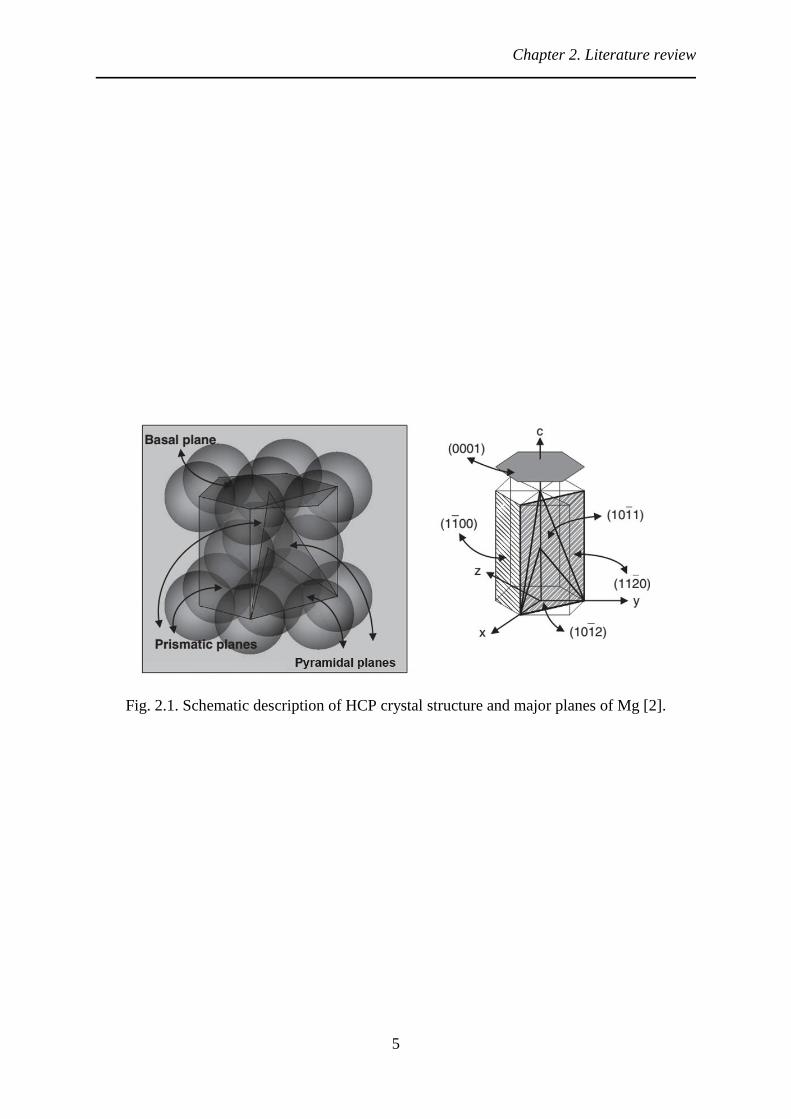
2.1.1 Pure Mg
Mg (density: 1.74 gm/cm3 and 35% lesser in weight than Al) is the lightest structural metal and
therefore, has the abundant possibilities for applications in automobile and aerospace sectors.
In addition, it has high specific strength, good castablity, good damping capacity, good
machinability, good weldability in controlled environment and considerably developed
corrosion resistance with high purity Mg [1]. Mg has HCP crystal structure as shown in Fig.
2.1 with lattice parameters a 3.18 Å and c 5.19 Å, which is nearly identical to the ideal c/a
ratio of 1.62354 (at 25°C) [2]. Mg has limited ductility at ambient temperature owing to three
active slip systems, however, at elevated temperature prismatic and pyramidal slip planes also
get activated resulting in higher ductility.
Chapter 2. Literature review
5
Fig. 2.1. Schematic description of HCP crystal structure and major planes of Mg [2].

Chapter 2. Literature review
6
2.1.2 AZ91 alloy
AZ91 Mg alloy (Mg-9Al-0.7Zn-0.2Mn) (wt.%) is the most commonly used alloy in as-cast
condition. It is economical and delivers excellent castablity and excellent ambient temperature
mechanical properties. Al as an alloying element in AZ91 improves its castablity by widening
the freezing range. It enhances strengthening by forming solid solution and by precipitation of
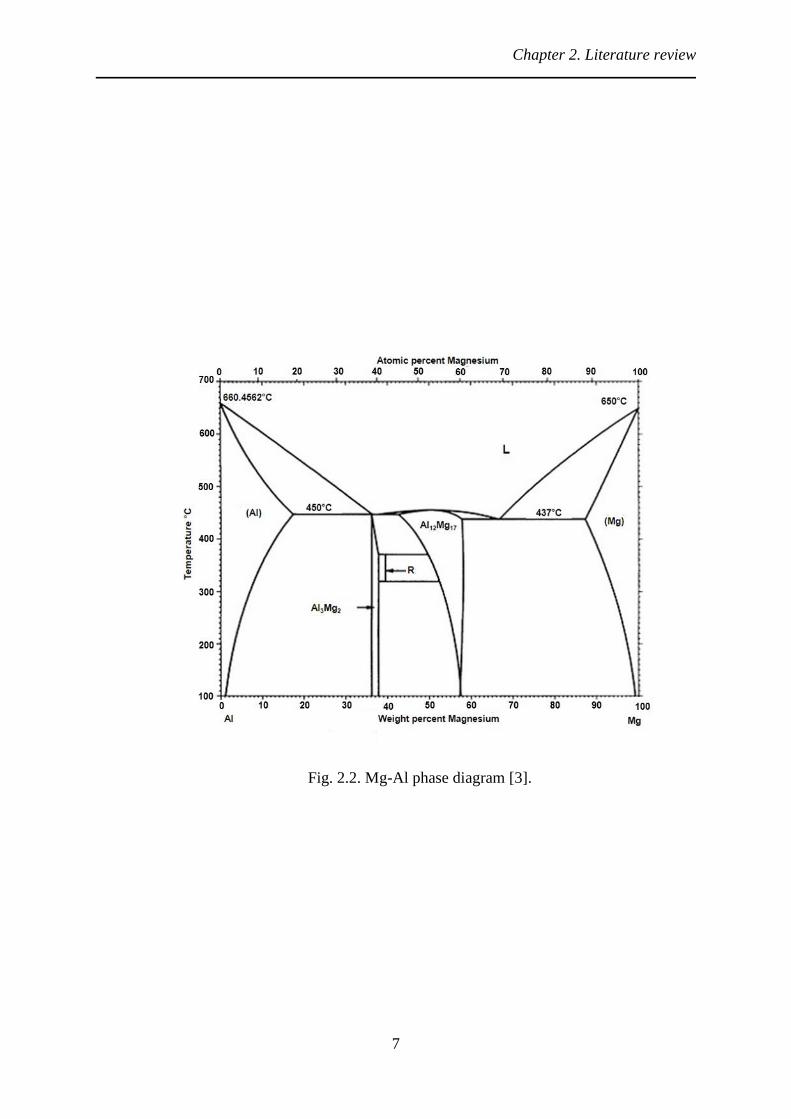
the intermetallic phase (Mg17Al12) at low temperatures (<120°C). The Mg-Al phase diagram
[3] is shown in Fig. 2.2. Zn also increases room-temperature strength. It counteracts the
corrosive effect of Ni and Fe impurities. Small amount of Mn is added to enhance saltwater
resistance by forming intermetallic compounds with impurities like Fe [4].
2.1.3 Applications of Mg alloys
Some automotive applications of Mg alloys are shown in Table 2.2.
Table 2.1. Applications of Mg alloys in automobiles [5].
System Product
Interior Instrument panel, seat frame, steering wheel
Body Door frame, roof frame
Chassis Wheel, brake pedal bracket
Powertrain Manual transmission case, oil pan
Chapter 2. Literature review
7
Fig. 2.2. Mg-Al phase diagram [3].
Chapter 2. Literature review
8
2.2 Tensile test
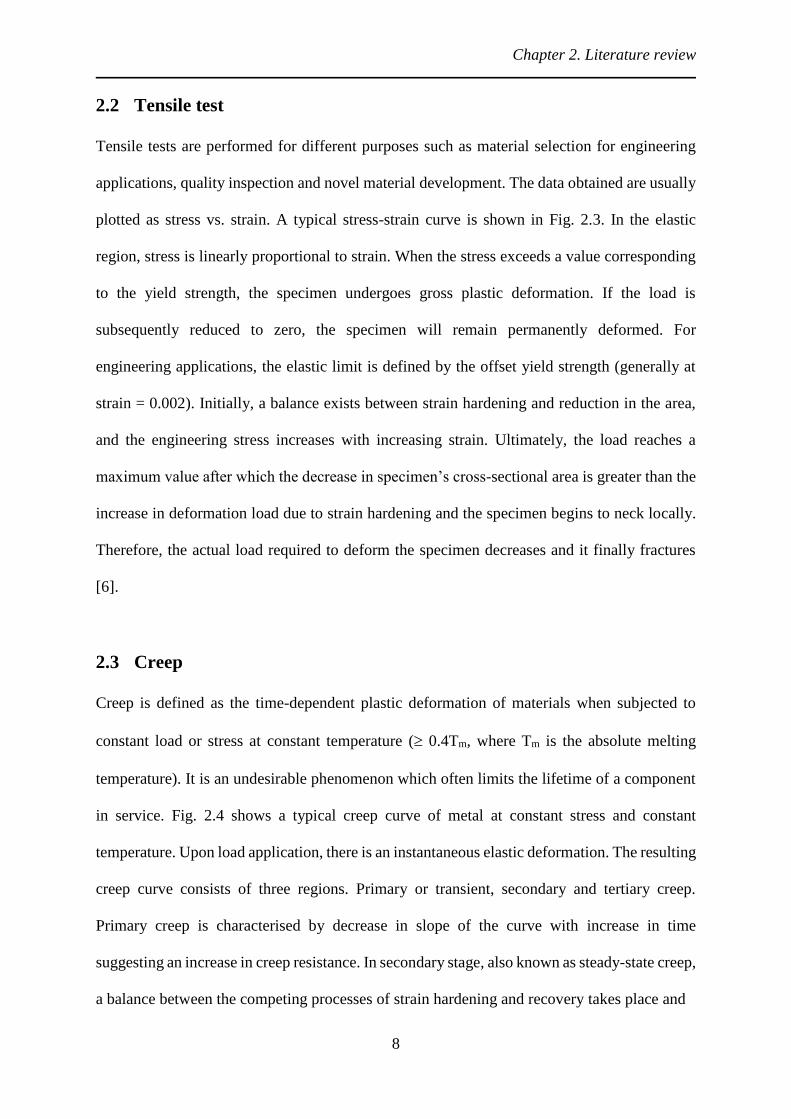
Tensile tests are performed for different purposes such as material selection for engineering
applications, quality inspection and novel material development. The data obtained are usually
plotted as stress vs. strain. A typical stress-strain curve is shown in Fig. 2.3. In the elastic
region, stress is linearly proportional to strain. When the stress exceeds a value corresponding
to the yield strength, the specimen undergoes gross plastic deformation. If the load is
subsequently reduced to zero, the specimen will remain permanently deformed. For
engineering applications, the elastic limit is defined by the offset yield strength (generally at
strain = 0.002). Initially, a balance exists between strain hardening and reduction in the area,
and the engineering stress increases with increasing strain. Ultimately, the load reaches a
maximum value after which the decrease in specimen’s cross-sectional area is greater than the
increase in deformation load due to strain hardening and the specimen begins to neck locally.
Therefore, the actual load required to deform the specimen decreases and it finally fractures
[6].
2.3 Creep
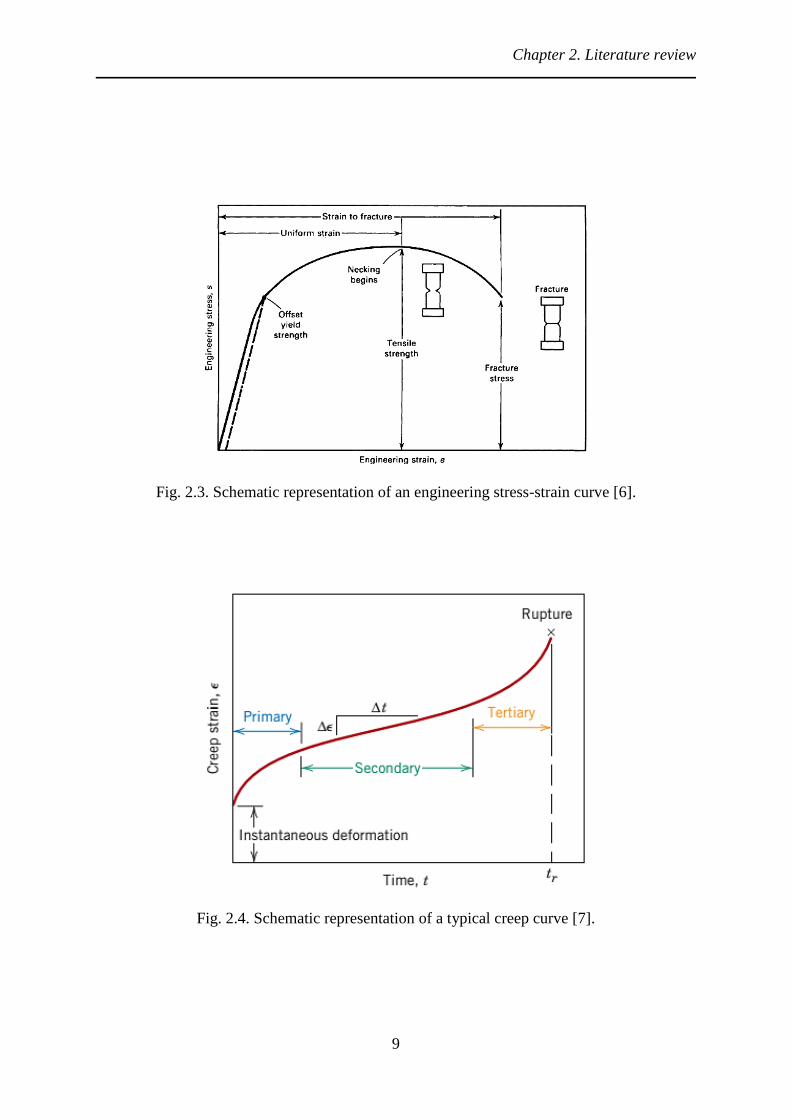
Creep is defined as the time-dependent plastic deformation of materials when subjected to
constant load or stress at constant temperature ( 0.4Tm, where Tm is the absolute melting
temperature). It is an undesirable phenomenon which often limits the lifetime of a component
in service. Fig. 2.4 shows a typical creep curve of metal at constant stress and constant
temperature. Upon load application, there is an instantaneous elastic deformation. The resulting
creep curve consists of three regions. Primary or transient, secondary and tertiary creep.
Primary creep is characterised by decrease in slope of the curve with increase in time
suggesting an increase in creep resistance. In secondary stage, also known as steady-state creep,
a balance between the competing processes of strain hardening and recovery takes place and
Chapter 2. Literature review
9
Fig. 2.3. Schematic representation of an engineering stress-strain curve [6].
Fig. 2.4. Schematic representation of a typical creep curve [7].

Chapter 2. Literature review
10
the plot becomes linear. In tertiary stage, creep rate increases and material fails. This failure
generally results from grain boundary separation, formation of internal cracks, cavities, voids
and so on [7].
Creep deformation is generally classified as:
1. Dislocation creep
2. Diffusional creep
3. Grain boundary sliding
Dislocation creep
The movement of dislocations during deformation overcoming the obstacles by either glide
and/or climb is called dislocation creep. This occurs by the help of thermally assisted
mechanisms involving the diffusion of interstitials or vacancies. The glide along the slip planes
are referred to as glide-controlled creep, whereas, the climbing up of dislocations to parallel
slip plane across hindrances is called climb controlled creep. At high temperatures, the key
mechanism for overcoming obstacles is dislocation climb and the creep rate is not dependent
on grain size. The creep rate is given as,
ε�̇� =A𝐷𝑣𝐺𝑏
𝑘𝑇(σ
𝐺)𝑛 (1)
where, A and n are the material constants, Dv is diffusion coefficient, G is shear modulus, b is
Burgers vector, k is Boltzmann’s constant and T is absolute temperature [9]. The value of n
varies from 3 to 8. The activation energy for climb-controlled creep is the same as the activation
energy for self-diffusion [8].
Chapter 2. Literature review
11
Diffusional creep
It involves motion of vacancies and atoms through a metal crystal under the influence of
applied stress. It occurs at relatively low stresses, σ/G < 10-4 [9]. If creep occurs by diffusion
through lattice, it is called Nabarro-Herring creep, whereas, grain-boundary diffusion
predominates in Coble creep.
Grain boundary sliding
It involves sliding of neighbouring grains with respect to the grain boundary separating them.
At temperatures above 0.5Tm, the grain boundaries have less viscosity and acts as a viscous
liquid allowing grain boundary sliding.
2.4 Corrosion
Corrosion is defined as the deterioration of materials due to reaction with environment. The
corrosion products may dissolve or remain in solid form. The corrosion tests are useful for
prediction of corrosion behaviour, material selection and study of corrosion mechanism. As
corrosion is an electrochemical process, therefore, electrochemical techniques are used for the
study of corrosion process. Electrochemical techniques are popular because they are fast,
accurate and versatile. The tests are carried out in a potentiostat which is an electronic
instrument that controls the potential difference between a working electrode (WE) and a
reference electrode (RE) present in a single electrochemical cell by introducing current into the
cell through an auxiliary or counter electrode. The potential of the WE relative to RE when no
current or potential is applied to the cell is called as open circuit potential (OCP) or corrosion
potential (Ecorr). At Ecorr, rate of oxidation is equal to the rate of reduction. Electrochemical
spectrum is obtained by the linear potential sweep technique also known as potentiodynamic
polarization scan. It offers significant information on the corrosion rate, passivity, as well as

Chapter 2. Literature review
12
the relative cathodic and anodic behaviour of an electrochemical system. Detailed examination
of reaction mechanisms including passive layer investigation can be carried out by
electrochemical impedance spectroscopy (EIS) method. EIS uses a scan of test frequencies
normally from a high to a low frequency to analyse resistive and capacitive characteristics of a
corrosion cell. Data is presented in either Nyquist, Bode Phase or Bode Impedance formats.
2.5 Casting techniques
2.5.1 Ingot casting (IC)
It is a type of gravity casting similar to conventional sand casting method. This process uses
metal mould. Compared to sand casting, it has advantages including superior surface finish,
greater dimensional control and better mechanical properties owing to faster solidification.
However, there are limitations on casting intricate components through IC.
2.5.2 Squeeze-casting (SC)
There are two types of SC processes: direct and indirect. In both processes, molten metal is
introduced in mould with minimum turbulence and solidification takes place under high
pressure (typically above 100 MPa) within closed dies. Direct SC is also called liquid metal
forging in which molten metal is poured into a preheated, lubricated die and the pressure is
applied till solidification takes place [10]. A schematic of SC setup is shown in Fig. 2.5.
2.5.3 High pressure die-casting (HPDC)
Intricate components of light metals can be easily cast by HPDC. The excellent castablity of
Mg alloys are fully utilized in this process. There are mainly two types of HPDC processes:
hot chamber HPDC and cold chamber HPDC. In the hot chamber HPDC method, the molten
metal is kept in a steel crucible, under a protective atmosphere, whereas, protective atmosphere
Chapter 2. Literature review
13
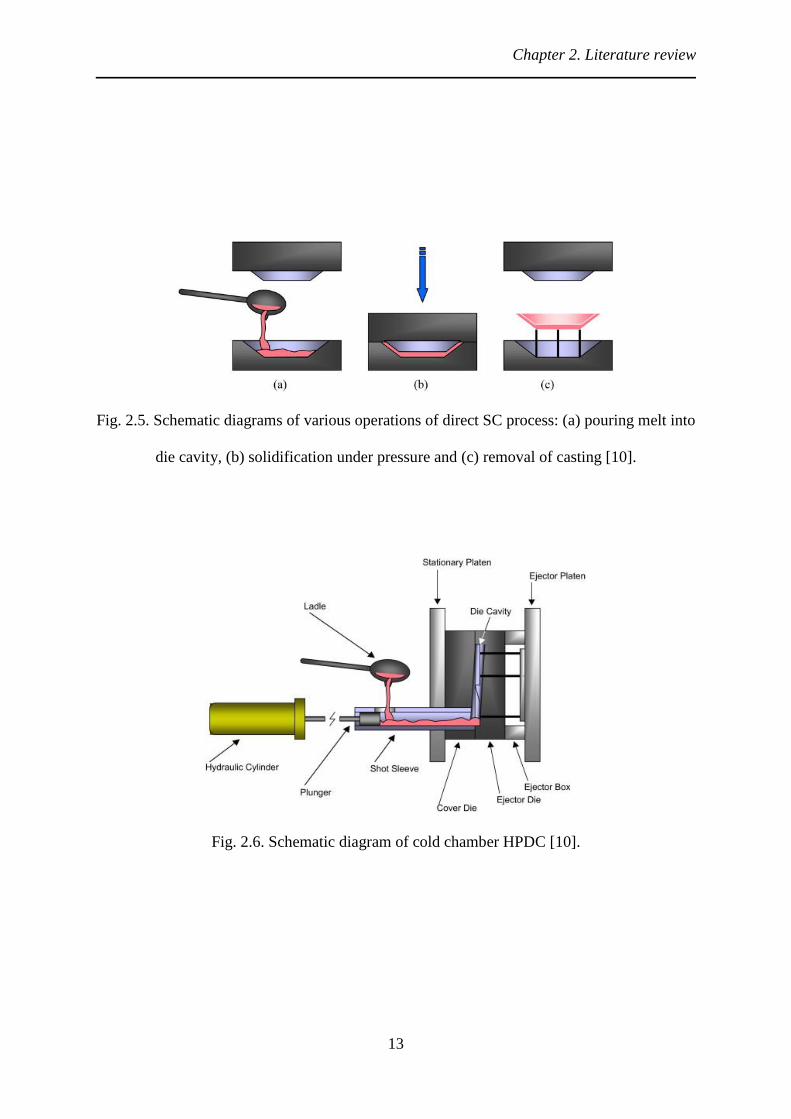
Fig. 2.5. Schematic diagrams of various operations of direct SC process: (a) pouring melt into
die cavity, (b) solidification under pressure and (c) removal of casting [10].
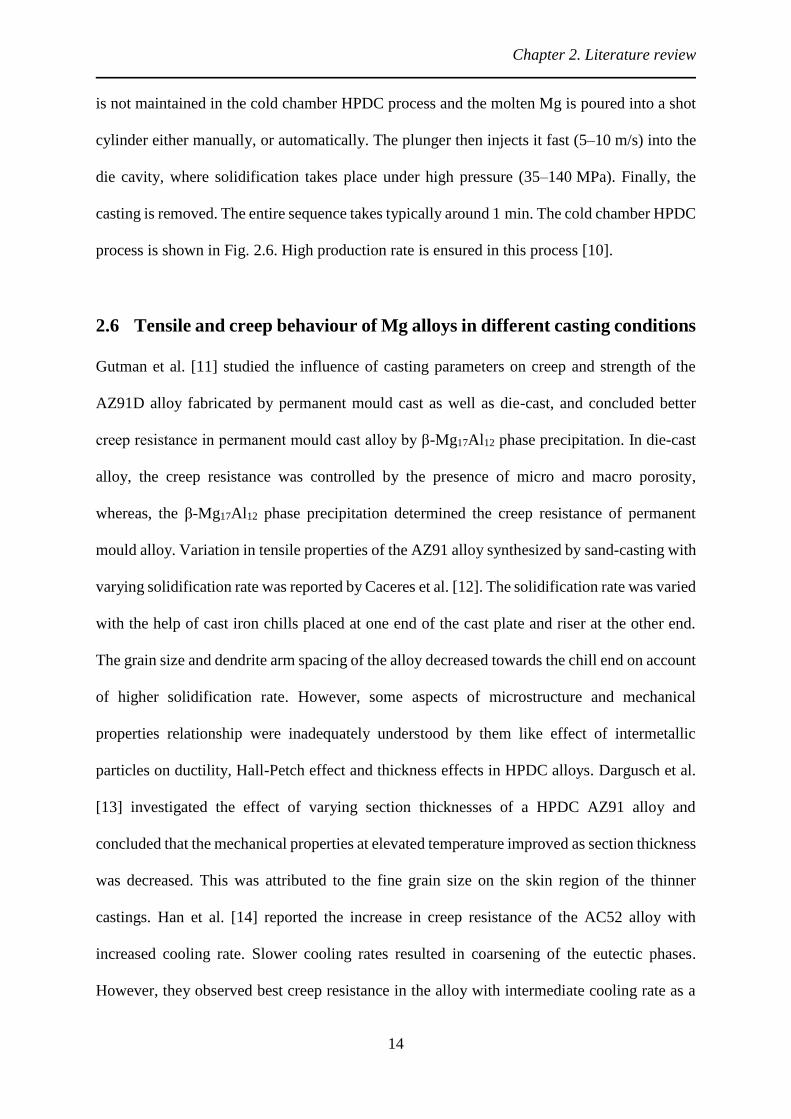
Fig. 2.6. Schematic diagram of cold chamber HPDC [10].
Chapter 2. Literature review
14
is not maintained in the cold chamber HPDC process and the molten Mg is poured into a shot
cylinder either manually, or automatically. The plunger then injects it fast (5–10 m/s) into the
die cavity, where solidification takes place under high pressure (35–140 MPa). Finally, the
casting is removed. The entire sequence takes typically around 1 min. The cold chamber HPDC
process is shown in Fig. 2.6. High production rate is ensured in this process [10].
2.6 Tensile and creep behaviour of Mg alloys in different casting conditions
Gutman et al. [11] studied the influence of casting parameters on creep and strength of the
AZ91D alloy fabricated by permanent mould cast as well as die-cast, and concluded better
creep resistance in permanent mould cast alloy by β-Mg17Al12 phase precipitation. In die-cast
alloy, the creep resistance was controlled by the presence of micro and macro porosity,
whereas, the β-Mg17Al12 phase precipitation determined the creep resistance of permanent
mould alloy. Variation in tensile properties of the AZ91 alloy synthesized by sand-casting with
varying solidification rate was reported by Caceres et al. [12]. The solidification rate was varied
with the help of cast iron chills placed at one end of the cast plate and riser at the other end.
The grain size and dendrite arm spacing of the alloy decreased towards the chill end on account
of higher solidification rate. However, some aspects of microstructure and mechanical
properties relationship were inadequately understood by them like effect of intermetallic
particles on ductility, Hall-Petch effect and thickness effects in HPDC alloys. Dargusch et al.
[13] investigated the effect of varying section thicknesses of a HPDC AZ91 alloy and
concluded that the mechanical properties at elevated temperature improved as section thickness
was decreased. This was attributed to the fine grain size on the skin region of the thinner
castings. Han et al. [14] reported the increase in creep resistance of the AC52 alloy with
increased cooling rate. Slower cooling rates resulted in coarsening of the eutectic phases.
However, they observed best creep resistance in the alloy with intermediate cooling rate as a
Chapter 2. Literature review
15
result of combined effect of dispersion and solid solution strengthening. Zhu et al. [15] too
studied the effect of varying cooling rate using chill at one end of the cast plate on the fraction
of β-Mg17Al12 phase in the sand cast AZ91 alloy and they observed that the fraction of eutectic
β-Mg17Al12 decreased and discontinuous β-Mg17Al12 increased towards the chill end of the
casting. However, they did not investigate the mechanical properties of the alloy. Superior
mechanical properties including creep behaviour were reported in the die-cast Mg-3Sm-0.5Zn-
0.4Zr (wt.%) alloy by Zheng et al. [16], whereas, ingot-cast alloy showed better tensile
properties at 200°C. Better creep resistance of the die-cast alloy was attributed to the dynamic
precipitation of fine platelets in the matrix of α-Mg, which resulted in hindering the dislocation
motion during creep deformation. Ferri et al. [17] also noticed improvement in strength of
ZAXLa05413 alloy subjected to unidirectional cooling as compared to the isothermal cooling.
The higher rate of heat extraction resulting in microstructural refinement attributed to enhanced
mechanical properties. Kim et al. [18] too asserted that the Mg-4Al-2Sn alloy in die-cast
condition exhibited better creep resistance than that in IC condition. The grain refinement and
finer intermetallic phases lead to superior creep resistance in the die-cast alloy. Bai et al. [19]
also observed the difference in tensile and creep properties with varying casting condition in
the Mg-4Al-(1-4) La alloy. The Mg17Al12 phase was supressed on increase of La addition
resulting in better creep resistance. Mondal et al. [20] reported better creep resistance in the
HPDC MRI230D alloy as compared to that of the IC alloy. The better creep resistance in the
HPDC alloy in their investigation was attributed to the presence of denser and finer network of
the C36 phase leading to effective dispersion strengthening.
Chapter 2. Literature review
16
2.7 Corrosion behaviour of Mg alloys in different casting conditions
Song et al. [21] investigated influence of microstructure on corrosion performance of the die-
cast AZ91D alloy and reported better corrosion resistance in the die-cast alloy as compared to
the high purity crucible cooled AZ91 alloy. Ambat et al. [22] too concluded higher corrosion
resistance and better passivation behaviour in the die-cast AZ91D alloy than in the IC alloy on
account of fine grain structure and β-Mg17Al12 phase. Mathieu et al. [23] investigated corrosion
behaviour of the AZ91 alloy and concluded that Al content of the α-Mg solid solution played
a major role in corrosion resistance. Ballerini et al. [24] in their work on die-cast and sand cast
AZ91D alloy claimed that the finer microstructure resulted in better corrosion resistance of the
die-cast alloy. However, reverse trend was also observed by Blawert et al. [25] in their
investigation on SC and thixocast MgZnRE alloys, i.e., thixocast alloy with coarser grain size
exhibited better corrosion resistance. Casting defects like porosity affects corrosion
performance of Mg alloys considerably. The effect of porosity on corrosion performance of
Mg alloys was investigated by Song et al. [21,26]. They reported that the effective surface area
may perhaps be considerably greater than the surface area exposed and due to confined
exchange of solution between inside and outside of the pores, corrosion may increase
considerably inside the pores. Cao et al. [27] too investigated effect of porosity on the corrosion
behaviour of the Mg-0.1Si alloy and deduced that corrosion rate increased due to the presence
of porosities.
17
Chapter 3. Experimental procedure
The AZ91 alloy is fabricated by three different casting techniques. Several characterization
techniques have been employed to investigate the microstructures and properties of these
alloys. In this chapter, the details of fabrication processes and characterization of these alloys
are described.
3.1 Fabrication of the alloys
The IC alloy was produced by melting commercially available AZ91D Mg alloy ingots with
nominal chemical composition of Mg-9Al-0.7Zn-0.2Mn (wt.%) in an electrical resistance
furnace inside a stainless steel crucible of capacity 1 Kg. Melting of the alloy was carried out
at 720°C up to 90 min. A mixture of SF6 (0.5 vol.%) and Ar (99.5 vol.%) was purged during
the whole process to protect the melt from oxidation. To ensure uniform distribution of the
alloying constituents, the melt was stirred for 10 min with a holding time of 3 min to allow the
oxide particles and other inclusions to settle at the bottom of the crucible. The melt was poured
at a pouring temperature of 700°C into a steel mould (dimension: 50 mm diameter and 250 mm
height) preheated to 210°C and allowed to cool till it attained room temperature. The same
melting practice was employed to fabricate the SC alloy. Solidification took place in around
60 s under a pressure of 120 MPa applied directly on the melt by a vertical hydraulic press till
the completion of solidification. The actual photograph of the setup employed in the present
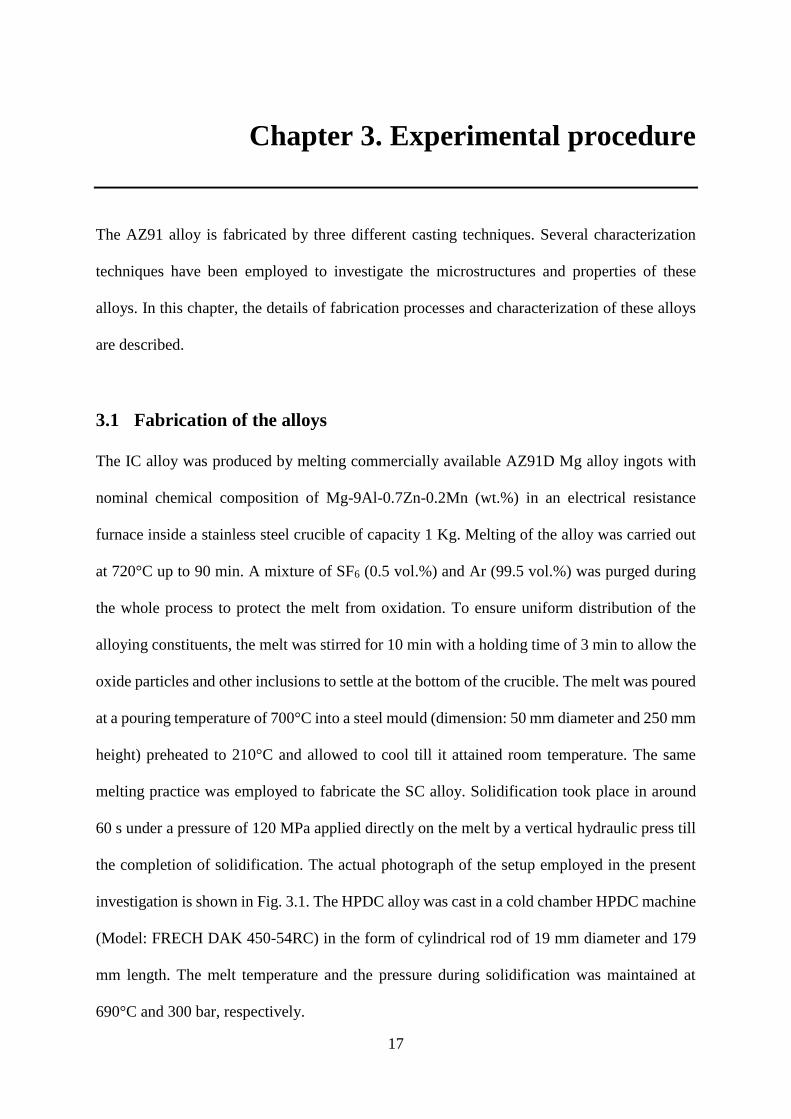
investigation is shown in Fig. 3.1. The HPDC alloy was cast in a cold chamber HPDC machine
(Model: FRECH DAK 450-54RC) in the form of cylindrical rod of 19 mm diameter and 179
mm length. The melt temperature and the pressure during solidification was maintained at
690°C and 300 bar, respectively.

Chapter 3. Experimental procedure
18
Fig. 3.1. Actual photograph of the SC setup employed to fabricate the IC and SC alloys.

Chapter 3. Experimental procedure
19
3.2 Specimen preparation
Standard metallographic procedure was followed to prepare the specimens for microstructural
analysis. The specimens were etched by acetic picral (a solution of 100 ml ethanol, 20 ml
distilled water, 10 ml acetic acid and 6 gm picric acid). Tensile specimens proportional to
standard dimensions were prepared in accordance with the ASTM E8M-03 standard. For creep
testing, specimens of dimension of 6 mm diameter and 15 mm length were machined from the
IC, SC and HPDC alloys by wire electrical discharge machining (EDM). Specimens for
electrochemical investigation were polished successively on 600, 800, 1000, 2000 and 3000
grit SiC emery paper followed by cleaning in distilled water and ultrasonic cleaning in ethanol.
3.3 Characterization of the alloys
3.3.1 X-ray diffraction (XRD)
The phases present in the alloys were identified by an X-ray diffractometer (XRD) (Model:
Rigaku Japan/Ultima-IV) employing CuKα (λ = 1.541 Å) radiation. A scan rate of 2º/min in
the scan range of 10-90º with step size of 0.05 was employed.
3.3.2 Optical microscopy (OM)
Microstructures of the alloys were observed using an optical microscopy (Model: ZEISS
AxioVision I10) equipped with an AxioVision image analyser software. The ASTM E1382
standard was followed for grain size measurement of the alloys in three different casting
conditions. The grain size, volume fraction of phases, secondary dendrite arm spacing (SDAS)
and porosity were quantified with the help of image analyser.

Chapter 3. Experimental procedure
20
3.3.3 Scanning electron microscopy (SEM)
Microstructures of the alloys were observed using scanning electron microscopy (SEM)
(Model: FEI Quanta 200) equipped with an energy dispersive X-ray spectroscopy (Model:
Oxford Instruments). Microstructures of tensile and creep tested specimens were also observed
under SEM in order to understand the underlying deformation mechanisms.
3.3.4 Mechanical characterization
3.3.4.1 Tensile test
Tensile specimens proportional to standard dimensions were prepared and tested in accordance
with the ASTM E8M-03 standard in a universal testing machine (Model: INSTRON 5967) at
ambient (≈ 25°C), 150 and 200°C temperature.
3.3.4.2 Creep test
Creep tests were carried out using a lever arm (10:1) creep setup (Model: ATS 2330) in
compression at a stress of 70 MPa and temperature of 150ºC for 50 h.
3.3.5 Corrosion test
Electrochemical corrosion tests were performed using Gill AC potentiostat/galvanostat
equipped with sequencer software. The setup was a conventional electrochemical cell equipped
with three electrodes. It consisted of the AZ91 alloy specimen as working electrode, Pt counter
electrode and Ag/AgCl (3 mol/L KCl) reference electrode. The tests were carried out at ambient
temperature in 0.5 wt.% NaCl solution at neutral pH. One experiment consisted of three tests
as listed below.

Chapter 3. Experimental procedure
21
i. OCP of each specimen was recorded for a duration of 30 min.
ii. After recording OCP, electrochemical impedance spectroscopy (EIS) was performed
by the application of a sinusoidal signal of amplitude 5 mV (root-mean-square value)
in the frequency range of 100 kHz to 0.01 Hz. The measurements were repeated after
every 2 h.
iii. Potentiodynamic polarization scans were carried out at -200 mV with respect to the free
corrosion potential with a scanning rate of 0.2 mV/s. The tests were terminated when
the current density reached 1 mA/cm2.
After completion of the corrosion tests, the specimens were cleaned by distilled water for
observation under microscope. The loose and non-adherent corrosion products were collected
for further analysis by XRD and Fourier Transform Infrared Spectroscopy (FTIR) (Model:
Shimadzu IRPrestige-21). FTIR spectra were recorded at ambient temperature in the mid-IR
region of 4000–400 cm-1. The adherent corrosion products from the specimens were removed
by using a solution prepared according to ASTM G1-03 standard (20 g chromic acid, 2 g
barium nitrate and 1 g silver nitrate dissolved in distilled water to yield 100 ml solution). The
specimens were immersed in the solution for about 60 s. They were immediately washed in
distilled water and ultrasonically cleaned in ethanol, and dried. The specimens were cut
perpendicular to the corroded surface in order to measure the depth affected by corrosion.
22
Chapter 4. Microstructural characterization
In this chapter the detailed microstructural characteristics of all the fabricated AZ91 alloys have
been discussed.
4.1 As-cast microstructure
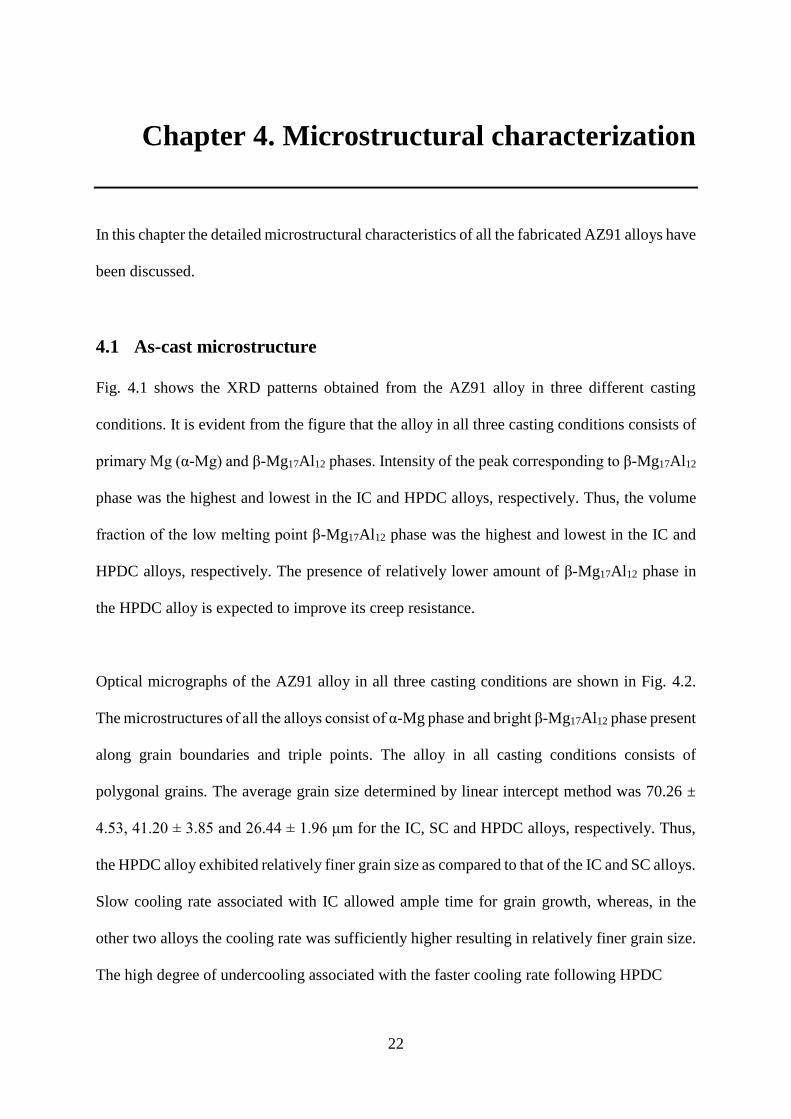
Fig. 4.1 shows the XRD patterns obtained from the AZ91 alloy in three different casting
conditions. It is evident from the figure that the alloy in all three casting conditions consists of
primary Mg (α-Mg) and β-Mg17Al12 phases. Intensity of the peak corresponding to β-Mg17Al12
phase was the highest and lowest in the IC and HPDC alloys, respectively. Thus, the volume
fraction of the low melting point β-Mg17Al12 phase was the highest and lowest in the IC and
HPDC alloys, respectively. The presence of relatively lower amount of β-Mg17Al12 phase in
the HPDC alloy is expected to improve its creep resistance.
Optical micrographs of the AZ91 alloy in all three casting conditions are shown in Fig. 4.2.
The microstructures of all the alloys consist of α-Mg phase and bright β-Mg17Al12 phase present
along grain boundaries and triple points. The alloy in all casting conditions consists of
polygonal grains. The average grain size determined by linear intercept method was 70.26 ±
4.53, 41.20 ± 3.85 and 26.44 ± 1.96 μm for the IC, SC and HPDC alloys, respectively. Thus,
the HPDC alloy exhibited relatively finer grain size as compared to that of the IC and SC alloys.
Slow cooling rate associated with IC allowed ample time for grain growth, whereas, in the
other two alloys the cooling rate was sufficiently higher resulting in relatively finer grain size.
The high degree of undercooling associated with the faster cooling rate following HPDC
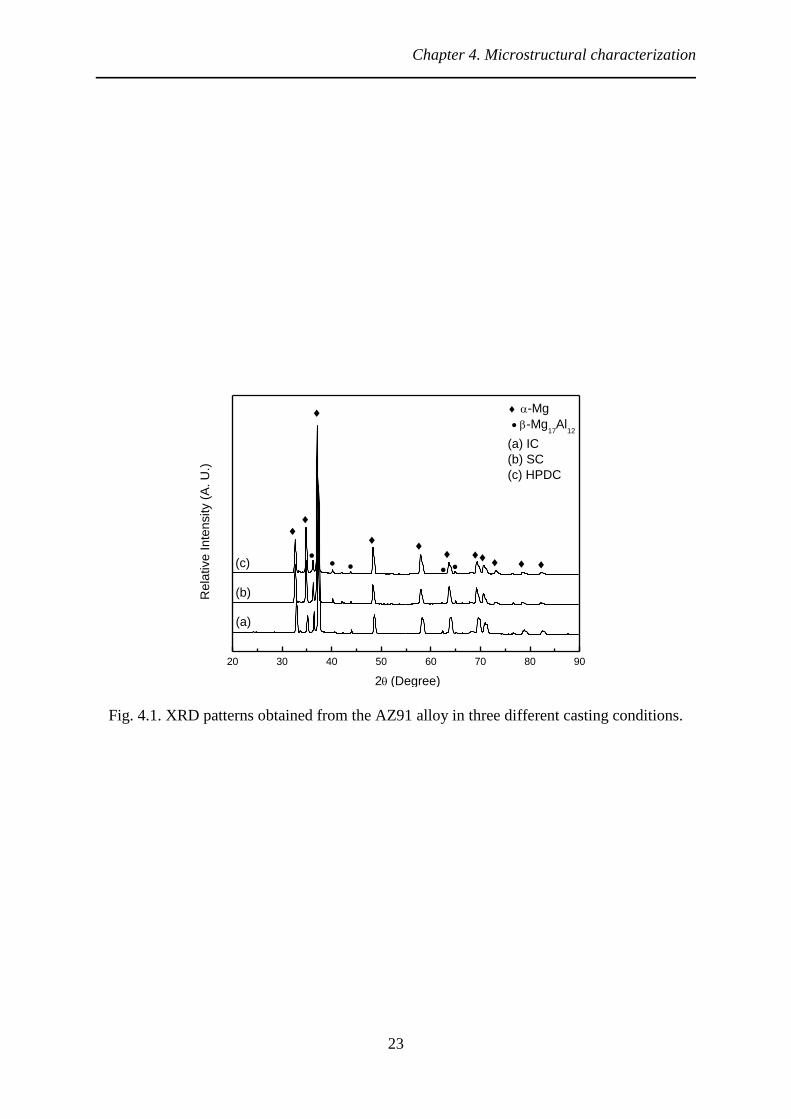
Chapter 4. Microstructural characterization
23
20 30 40 50 60 70 80 90
(c)
(b)
-Mg
-Mg17
Al12
Re
lative
In
ten
sity (
A. U
.)
2(Degree)
(a) IC
(b) SC
(c) HPDC
(a)
Fig. 4.1. XRD patterns obtained from the AZ91 alloy in three different casting conditions.
Chapter 4. Microstructural characterization
24
Fig. 4.2. Optical micrographs of the (a) IC, (b) SC and (c) HPDC alloys.
Chapter 4. Microstructural characterization
25
facilitated the formation of a large number of nuclei in the liquid Mg alloy. However, the
sluggish diffusion rate at the corresponding temperature leading to low growth rate resulted in
microstructural refinement [28]. The SDAS was measured by linear intercept method and the
values were 68.01 ± 6.53, 35.50 ± 5.09 and 31.99 ± 4.67 μm for the IC, SC and HPDC alloys.
It is obvious that the SDAS decreased with increase in solidification rate.
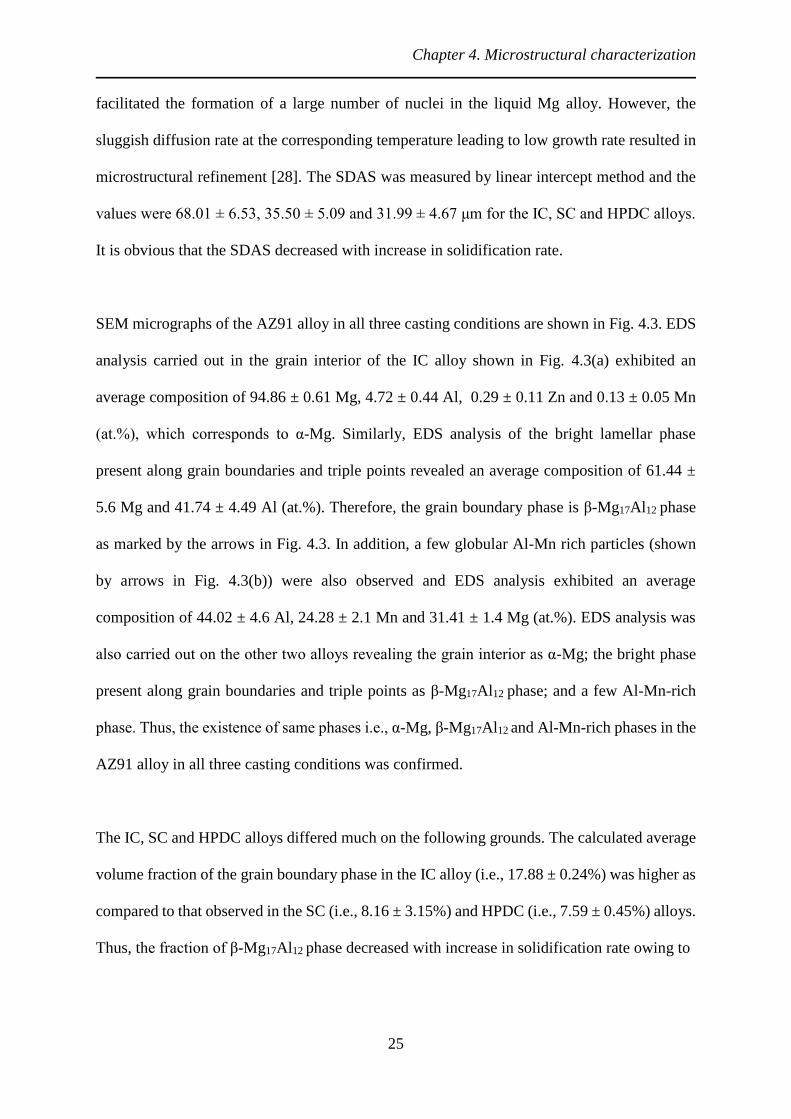
SEM micrographs of the AZ91 alloy in all three casting conditions are shown in Fig. 4.3. EDS
analysis carried out in the grain interior of the IC alloy shown in Fig. 4.3(a) exhibited an
average composition of 94.86 ± 0.61 Mg, 4.72 ± 0.44 Al, 0.29 ± 0.11 Zn and 0.13 ± 0.05 Mn
(at.%), which corresponds to α-Mg. Similarly, EDS analysis of the bright lamellar phase
present along grain boundaries and triple points revealed an average composition of 61.44 ±
5.6 Mg and 41.74 ± 4.49 Al (at.%). Therefore, the grain boundary phase is β-Mg17Al12 phase
as marked by the arrows in Fig. 4.3. In addition, a few globular Al-Mn rich particles (shown
by arrows in Fig. 4.3(b)) were also observed and EDS analysis exhibited an average
composition of 44.02 ± 4.6 Al, 24.28 ± 2.1 Mn and 31.41 ± 1.4 Mg (at.%). EDS analysis was
also carried out on the other two alloys revealing the grain interior as α-Mg; the bright phase
present along grain boundaries and triple points as β-Mg17Al12 phase; and a few Al-Mn-rich
phase. Thus, the existence of same phases i.e., α-Mg, β-Mg17Al12 and Al-Mn-rich phases in the
AZ91 alloy in all three casting conditions was confirmed.
The IC, SC and HPDC alloys differed much on the following grounds. The calculated average
volume fraction of the grain boundary phase in the IC alloy (i.e., 17.88 ± 0.24%) was higher as
compared to that observed in the SC (i.e., 8.16 ± 3.15%) and HPDC (i.e., 7.59 ± 0.45%) alloys.
Thus, the fraction of β-Mg17Al12 phase decreased with increase in solidification rate owing to
Chapter 4. Microstructural characterization
26
Fig. 4.3. SEM micrographs of the (a) IC, (b) SC and (c) HPDC alloys.

Chapter 4. Microstructural characterization
27
the fact that high cooling rate did not allow Al in α-Mg matrix to precipitate and therefore, it
formed Mg-Al-Zn solid solution during solidification. Barbagallo et al. [29] too observed the
decreased volume fraction of the grain boundary β-Mg17Al12 phase with increase in cooling
rate in the AZ91 alloy. Another noteworthy dissimilarity observed was the difference in
morphology of the eutectic β-Mg17Al12 phase, which is quite sensitive to small variations in
cooling conditions and alloy content. The observed eutectic phase was partially divorced,
coarse and discontinuous in the IC alloy. On the other hand, it was partially divorced and
constituted a continuous network along the grain boundaries and the triple points in the SC
alloy; fully divorced and discontinuous in the HPDC alloy. In addition, the IC alloy exhibited
wider eutectic structure as compared to that of the SC and HPDC alloys. The former alloy
allowed sufficient time for growth of the precipitates, thereby widening the structure of the
eutectic phase. Nave et al. [30] too reported similar microstructural characteristics i.e., the β-
Mg17Al12 phase was partially divorced in the IC Mg-9Al alloy. The reason behind the formation
of divorced eutectic in Mg alloys is well explained in the literature [30,31]. A binary Mg-Al
alloy of eutectic composition (i.e., Mg-33Al (wt.%)) typically solidifies with a regular lamellar
or fibrous morphology comprising of α-Mg and β-Mg17Al12 phases depending on cooling rates.
The tendency to form divorced eutectic is increased with increase in volume fraction of the
primary phase resulting from low Al content in the alloy. Thus, hypoeutectic Mg alloy with
low solute concentration generally exhibits divorced or partially divorced eutectic
microstructures [31]. The tendency to form divorced eutectic was enhanced by addition of
small amount of Zn that strongly segregated into the liquid as compared to Al. Further, this
tendency increased with the increase in cooling rate. In all alloys the α-Mg phase appeared as
light grey and it gradually became darker towards grain boundaries due to higher concentration
of Al and Zn that was detected by EDS analyses. A similar observation was made in the IC
AZ91 alloy by Nave et al. too [30].
Chapter 4. Microstructural characterization
28
In order to assess the segregation tendency of Al, the concentration of Al interior of α-Mg near
grain boundary was measured using EDS and the values were 6.29 ± 1.11, 9.39 ± 0.36 and
14.62 ± 5.13 (at.%) in IC, SC and HPDC alloys. Thus, the Al concentration interior of α-Mg
in the alloy in three different casting conditions was not same and it was the highest in the
HPDC alloy and the lowest in the IC alloy, as expected. The excess solubility of Al within α-
Mg grain is expected to exhibit difference in lattice parameter of the AZ91 alloy in three
different casting conditions. The rapid cooling rate associated with the HPDC process was
responsible for the formation of supersaturated solid solution of Al in α-Mg grains.
Consequently, the amount of Al available for the β-Mg17Al12 formation was lower and
therefore, the final volume fraction of the β-Mg17Al12 phase in the HPDC alloy at the end of
solidification was relatively less.
Table 4.1. Quantitative analysis of the microstructural features of all the alloys.
Alloy IC SC HPDC
Grain size (μm) 70.26 ± 4.53 41.20 ± 3.85 26.44 ± 1.96
Secondary dendrite arm
spacing (SDAS) (μm)
68.01 ± 6.53 35.50 ± 5.09 31.99 ± 4.67
Volume fraction of
β-Mg17Al12 (%)
17.88 ± 0.24 8.16 ± 3.15 7.59 ± 0.45
Al content in α-Mg
(at.%)
6.29 ± 1.11 9.39 ± 0.36 14.62 ± 5.13
Density (gm/cm3) 1.816 1.916 1.568

Chapter 4. Microstructural characterization
29
Another notable distinction witnessed was the difference in porosity content. The density
values of the IC, SC and HPDC alloys were 1.816, 1.916 and 1.568 gm/cm3, respectively. Thus,
the porosity (marked by arrows in Fig. 4.2(c)) content was the highest in the HPDC alloy and
it was not significant in the SC alloy with the IC alloy exhibiting the intermediate porosity. The
higher porosity observed in the HPDC alloy was attributed to the difference in liquid metal
temperature (i.e., casting temperature), die (mold) temperature, metal injection rate into the die
as well as casting conditions including the process of melt preparation and the possibility of air
entrainment during metal injection into the die [32]. In addition, the distinct difference in the
solidification pressure among the three casting technologies employed in the present
investigation might also influenced the microstructures of the three alloys.

30
Chapter 5. Mechanical characterization
In this chapter the tensile and creep properties of the AZ91 alloy fabricated by three different
casting techniques are compared and correlated with their microstructures. Observation of
microstructures of the tested specimens is also carried out to understand the underlying
mechanisms of deformation.
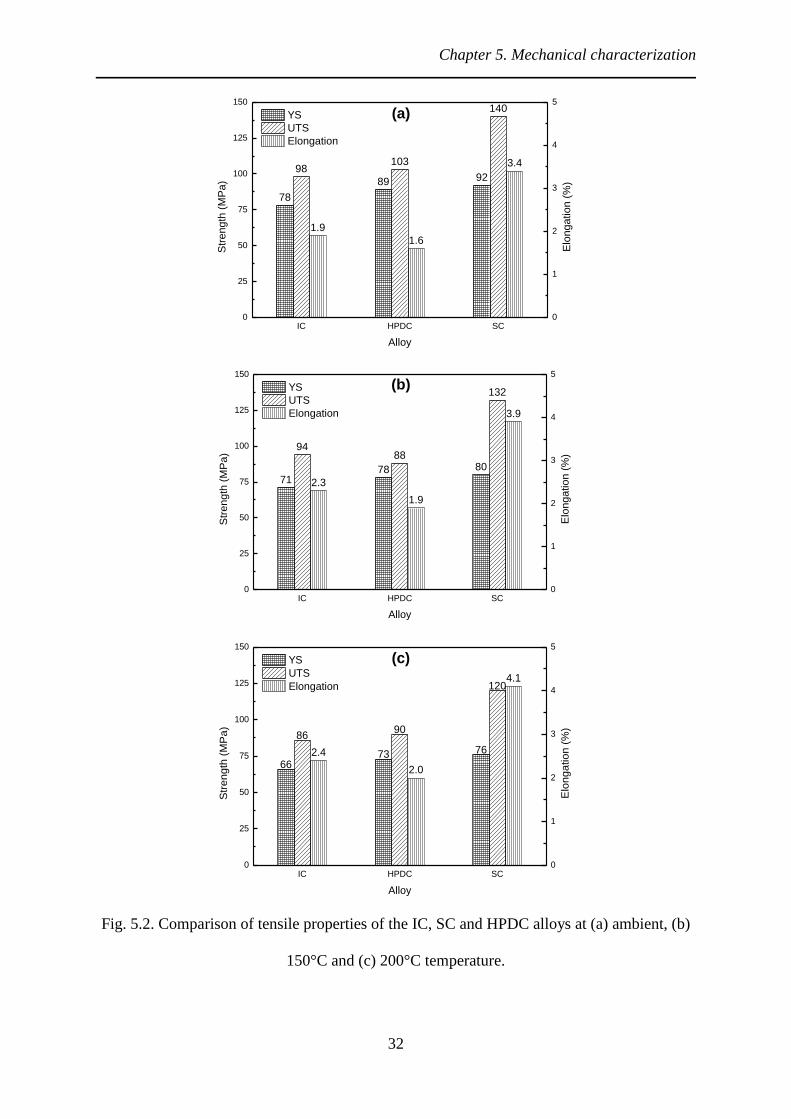
5.1 Tensile behaviour
Typical stress vs. strain curves of the SC alloy tested at ambient, 150 and 200°C temperature
is shown in Fig. 5.1 as a representative plot for all the alloys. Fig. 5.2(a) shows the tensile
properties derived from the stress vs. strain curves of the AZ91 alloy in three different casting
conditions tested at ambient temperature. It is observed that the casting condition significantly
influenced the tensile properties of the AZ91 alloy. The 0.2% proof stress (YS), ultimate tensile
strength (UTS) and ductility (% Elongation) were the lowest for the IC alloy, intermediate for
the HPDC alloy and the highest for the SC alloy.
The YS and UTS values decreased and correspondingly the ductility increased for the alloy in
all casting conditions when tested at 150 and 200°C temperature, as shown in Fig. 5.2(b&c).
The ductility of the IC, SC and HPDC alloys increased by 21.0, 14.7 and 15.7% at 150°C; and
by 26.3, 25.0 and 20.6% at 200°C, respectively from the ambient temperature. The best tensile
properties were observed in the SC alloy at all temperature levels employed in the present
investigation. It exhibited 3.4, 3.9 and 4.1% ductility with corresponding YS of 140, 132 and
120 MPa at ambient, 150 and 200°C temperature. The improved tensile behaviour of the SC
alloy could be associated with relatively finer grain size and negligible porosity present in the
casting.

Chapter 5. Mechanical characterization
31
0.00 0.01 0.02 0.03 0.04 0.050
20
40
60
80
100
120
140
160
3
2
Eng
g. str
ess (
MP
a)
Engg. strain (mm/mm)
1. Ambient temperature
2. 150°C
3. 200°C
1
Fig. 5.1. Stress vs. strain plots of the SC alloy tested at ambient, 150°C and 200°C
temperature.
Chapter 5. Mechanical characterization
32
78
89 9298
103
140
1.9
1.6
3.4
IC HPDC SC0
25
50
75
100
125
150
Str
en
gth
(M
Pa
)
Alloy
YS
UTS
Elongation
(a)
0
1
2
3
4
5
Elo
ng
atio
n (
%)
7178 80
9488
132
2.3
1.9
3.9
IC HPDC SC0
25
50
75
100
125
150
Str
en
gth
(M
Pa
)
Alloy
YS
UTS
Elongation
(b)
0
1
2
3
4
5
Elo
ng
atio
n (
%)
6673 76
8690
120
2.4
2.0
4.1
IC HPDC SC0
25
50
75
100
125
150
Str
en
gth
(M
Pa
)
Alloy
YS
UTS
Elongation
0
1
2
3
4
5
Elo
ng
atio
n (
%)
(c)
Fig. 5.2. Comparison of tensile properties of the IC, SC and HPDC alloys at (a) ambient, (b)
150°C and (c) 200°C temperature.

Chapter 5. Mechanical characterization
33
The relationship between YS (𝜎0.2) and average grain size (d) is expressed by Hall-Petch
equation as follows:
𝜎0.2 = 𝜎0 + kd−1/2 (1)
where 𝜎0 is the friction stress and k is the locking parameter, and they both depend on the
material [9]. The YS of all the alloys were calculated theoretically based on the grain size
employing Hall-Petch relation and the values are presented in Table 5.1. For calculation, k =
142.2 MPa√µm and 𝜎0 = 73 MPa were considered for the AZ91 alloy [33]. It is evident that
the calculated values of the YS were slightly higher than that determined by experiment. The
discrepancy in YS values might be attributed to several reasons. Firstly, the values of the
k and σ0 were corresponding to HPDC AZ91 alloy and not corresponding to IC and SC alloys.
Secondly, the microporosities present in the HPDC alloy might contributed negatively to
experimental YS of the alloys. The calculated YS of the SC alloy was in good agreement with
the experimentally obtained YS owing to the presence of negligible porosity in it.
Table 5.1. Comparison of the calculated and experimentally determined YS of all the alloys.
Alloy Calculated
grain size (µm)
Calculated
YS (MPa)
Experimentally
determined YS (MPa)
IC 70.26 ± 4.53 90 78
SC 41.20 ± 3.85 95 92
HPDC 26.44 ± 1.96 101 89
Evidently, the IC alloy revealed relatively low YS, UTS and ductility due to the presence of
higher volume fraction of brittle β-Mg17Al12 phase rendering the alloy brittle. The coarse grain
size also contributed to the inferior tensile properties of the IC alloy. The relatively poor tensile
properties of the HPDC alloy might be due to structural inhomogeneity comprising of

Chapter 5. Mechanical characterization
34
microporosities present in the casting. Dúl et al. [34] too in their investigation observed
inhomogeneity in the internal structure of the HPDC alloy. The existing pores where lattice of
the alloy was significantly distorted acted as stress raisers and crack initiated. Once the crack
formed, it connected the neighbouring pores and thus, allowing easy path for rapid crack
propagation.
Fig. 5.2(a-c) shows the micrographs of the fracture surfaces of the tensile specimens of the IC,
SC and HPDC alloys tested at ambient temperature. Features revealed are cracks (shown by
A), porosity (B), quasi-cleavage plane (C), steps (D), plastic deformation zone (E), shallow
dimples (F) and these were marked in the micrographs. The micrograph of the IC alloy
exhibited the presence of various cleavage steps. Slight deformation zone were also present.
Multiple cracks were observed in the micrograph of the HPDC alloy and these cracks were
initiated from the sharp edges of the pores. A few quasi-cleavage planes (C) with steps of
various sizes were also observed. These are the characteristic of brittle intergranular cleavage
fracture that took place along the grain boundaries. Owing to the limited number of slip systems
operated at ambient temperature, dislocation movement in the neighbouring grains was
restricted leading to reduced ductility of all the alloys. Quasi-cleavage fracture was the failure
mode in the SC alloy in which the cracks initiated and propagated locally forming a shallow
dimple like morphology on the fracture surface. Presence of second phases and their nature
played an important role behind the origin of micro cracks. During tensile test micro cracks
might initiated at the interfaces of brittle eutectic present along the grain boundaries, thus
rendering the alloy brittle. Patel et al. [35] also observed secondary cracks on the fracture
surface propagated along the interface of eutectic phase in the AZ91D alloy. The presence of
relatively more number of shallow dimples and plastic deformation zones on the fracture
surface of the SC alloy evidenced its higher ductility. Fracture surfaces of all the specimens of

Chapter 5. Mechanical characterization
35
the alloys tested at 150 and 200°C exhibited quasi-cleavage fracture as well. Mg alloy generally
exhibits limited ductility owing to limited slip systems operating at ambient temperature.
However beyond 225°C ductility of Mg alloy enhances owing to activation of additional slip
systems containing prismatic and pyramidal planes along which cross-slip takes place [36].
The elevated testing temperatures (i.e., 150 and 200°C) employed in the present investigation
were below 225°C and accordingly, additional slip systems were not completely activated,
which resulted less improvement in ductility.

Chapter 5. Mechanical characterization
36
Fig. 5.3. Fracture surfaces of the tensile specimens of the (a) IC, (b) SC and (c) HPDC alloys
tested at ambient temperature.

Chapter 5. Mechanical characterization
37
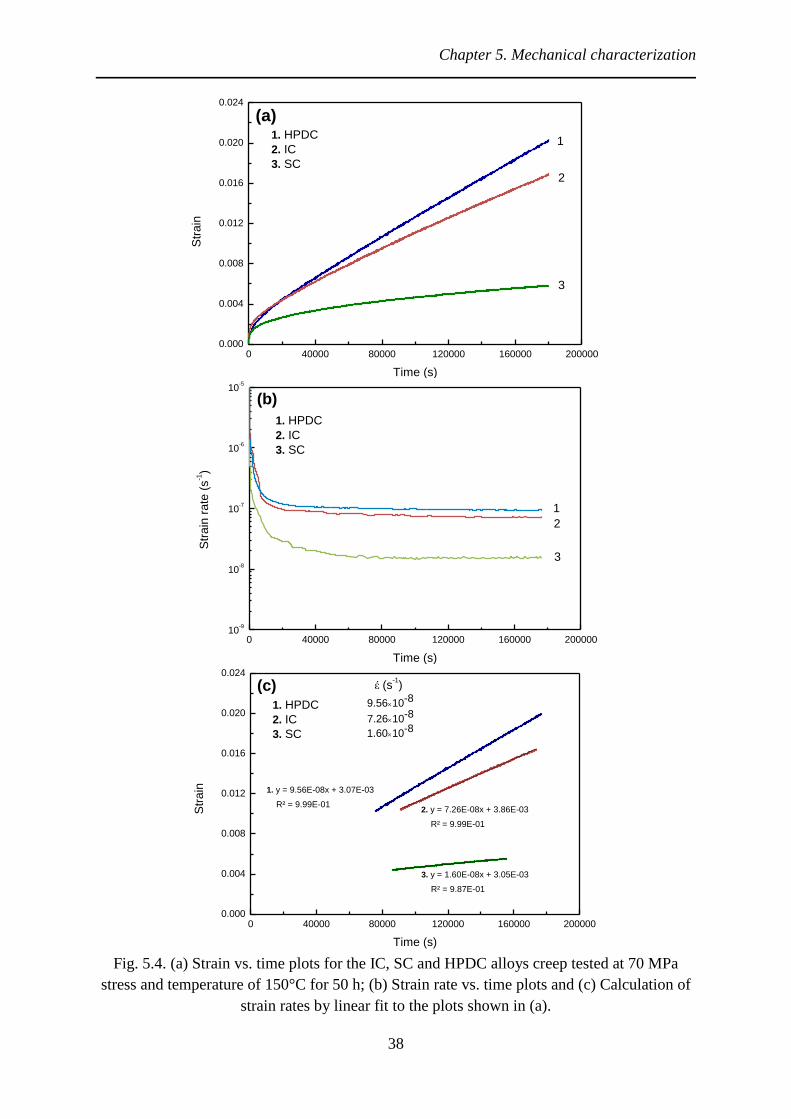
5.2 Creep behaviour
The characteristic creep curves (strain vs. time) of the AZ91 alloy in IC, SC and HPDC
conditions tested at 70 MPa stress and temperature of 150°C for a duration of 50 h are shown
in Fig. 5.4(a). The strain rate vs. time curves derived from the strain vs. time curves in Fig.
5.4(a) is shown in Fig. 5.4(b). Apparently, different cooling rates associated with the IC, SC
and HPDC alloys resulted varied creep characteristics. All the curves displayed a distinct
primary (transient) creep followed by a secondary (steady-state) creep. All the specimens were
tested under compression and therefore, the tertiary stage was not observed in the plots. The
creep rate (strain rate) (𝜀̇) was calculated from the steady-state part of the strain vs. time curves
for all the alloys by fitting straight line as shown in Fig. 5.4(c). The IC, SC and HPDC alloys
exhibited a creep rate of 7.26×10⁻⁸, 1.60×10⁻⁸ and 9.56×10⁻⁸ s−1, respectively. Obviously, the
creep rate was the highest in the HPDC, intermediate in the IC and the lowest in the SC alloys
in the present investigation. The creep rate of the HPDC and IC alloys; IC and SC alloys; HPDC
and SC alloys varies by a factor of 1.32, 5.97 and 4.53, respectively. Thus, the casting routes
significantly affected creep behaviour of the AZ91 alloy.
The observed differences in creep behaviour amongst the IC, SC and HPDC alloys were
attributed to several reasons. Different cooling conditions prevailing during castings resulted
varied microstructural features leading to the variation in creep behaviour. The difference in
amount and morphology of the β-Mg17Al12 phase present along grain boundaries of the IC, SC
and HPDC alloys resulted in the variation. It is speculated based on the review of literature on
creep behaviour of Mg alloys and especially of AZ91 alloy that dislocation creep is the
Chapter 5. Mechanical characterization
38
0 40000 80000 120000 160000 2000000.000
0.004
0.008
0.012
0.016
0.020
0.024
Str
ain
Time (s)
1. HPDC
2. IC
3. SC
1
2
3
(a)
0 40000 80000 120000 160000 20000010
-9
10-8
10-7
10-6
10-5
(b)
1. HPDC
2. IC
3. SC
Str
ain
ra
te (
s-1)
Time (s)
1
2
3
0 40000 80000 120000 160000 2000000.000
0.004
0.008
0.012
0.016
0.020
0.024
(c)
1.6010-87.2610-8
3. y = 1.60E-08x + 3.05E-03
R² = 9.87E-01
2. y = 7.26E-08x + 3.86E-03
R² = 9.99E-01
Str
ain
Time (s)
1. HPDC
2. IC
3. SC
1. y = 9.56E-08x + 3.07E-03
R² = 9.99E-01
9.5610-8
έ (s-1)
Fig. 5.4. (a) Strain vs. time plots for the IC, SC and HPDC alloys creep tested at 70 MPa
stress and temperature of 150°C for 50 h; (b) Strain rate vs. time plots and (c) Calculation of
strain rates by linear fit to the plots shown in (a).

Chapter 5. Mechanical characterization
39
proposed creep mechanism in the present alloy in all three casting conditions at the stress and
temperature level employed [20,37,38]. Creep resistance increases if the dislocation glide
and/or dislocation climb faces hindrance on the basal and/or non-basal plane leading to
increased work hardening. The presence of discontinuous β-Mg17Al12 phase in the HPDC alloy
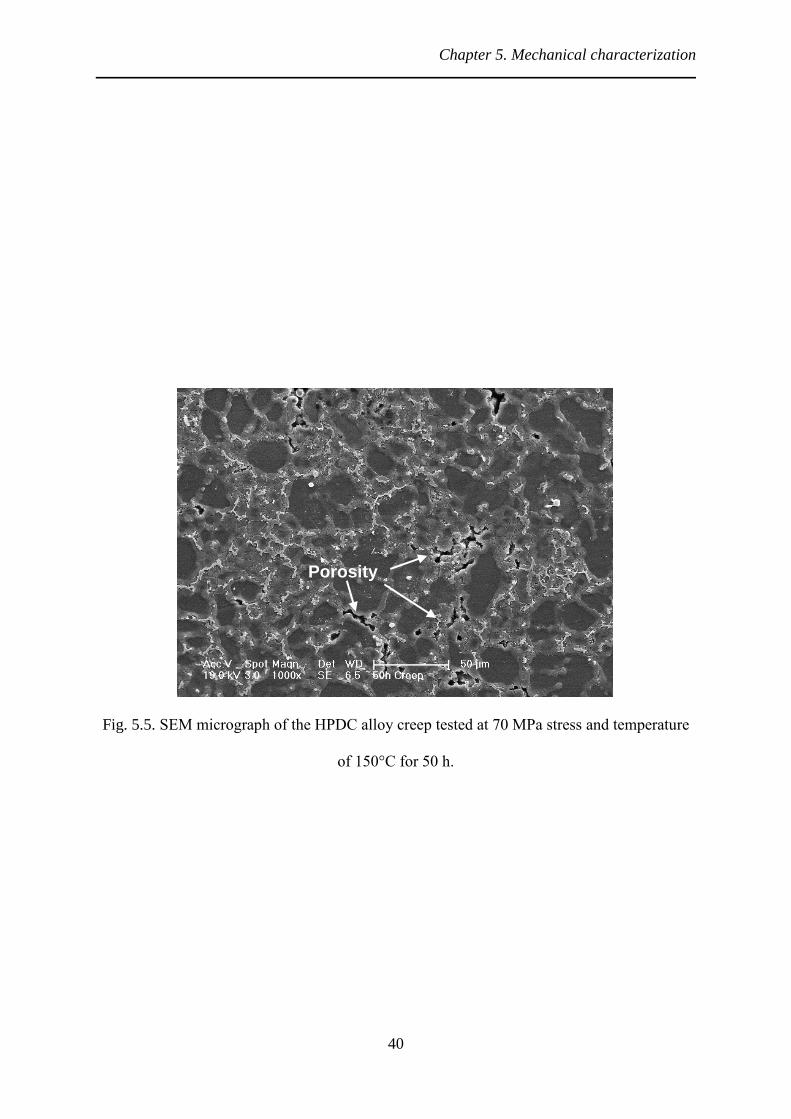
could not effectively provide obstacle to dislocation motion. The SEM micrograph of the
HPDC alloy creep tested at a stress of 70 MPa and temperature of 150ºC is shown in Fig. 5.4.
It is evident that the existing porosities in the alloy joined together providing easy path for
crack initiation and growth during creep test. A similar observation was also made by Mondal
et al. [20] on the creep tested die-cast MRI230D alloy. Therefore, higher porosity content of
the HPDC alloy deteriorated its creep resistance. Thus, the extent of porosity played a crucial
role in the creep behaviour of the HPDC alloy, which was verified by Gutman et al. [11,32] as
well. They observed that the minimum creep rate under the comparable condition increased
considerably with increase in porosity. As a consequence, easy crack initiation and growth
during the creep test took place, reducing creep performance of the HPDC alloy. On the
contrary, presence of negligible porosity and continuous network of eutectic phase in the SC
alloy contributed to its superior creep resistance. Amberger et al. [39] too concluded that the
continuous and interconnected network of the intermetallic phase enhanced creep resistance in
the modified AZ91 and MRI230D alloys. The intermediate creep performance exhibited by the
IC alloy was attributed to the presence of relatively lesser porosity as well as coarser and
discontinuous eutectic phase. The creep resistance of the IC alloy was better than that of the
HPDC alloy owing to the relatively lower porosity content. On the other hand, it was slightly
inferior as compared to that of the SC alloy due to the presence of coarser and discontinuous
eutectic phase. The coarse and discontinuous eutectic phase contributed negatively to creep
resistance due to lower pinning of dislocations. Kim et al. [18] also concluded that coarse
eutectic phase favoured the formation of cracks allowing easy dislocation movement.
Chapter 5. Mechanical characterization
40
Fig. 5.5. SEM micrograph of the HPDC alloy creep tested at 70 MPa stress and temperature
of 150°C for 50 h.
Porosity

41
Chapter 6. Corrosion behaviour
This chapter presents the electrochemical corrosion behaviour of all the alloys. The observed
corrosion behaviour is correlated with their microstructures.
6.1 Corrosion response
6.1.1 Open circuit potential (OCP)
Fig. 6.1 shows the OCP of all the three alloys recorded for 30 min. OCP of the SC alloy initially
increased continuously with increase in time i.e., it shifted towards more noble potential, which
indicates that the passive film is continuously growing with time. It then drops off indicating
sudden breakdown of the film and continued with fluctuations implying several cycles of
formation and subsequent dissolution of the passive film. OCP of the IC alloy too initially
increased slowly and after that it became almost stable. On the other hand, OCP of the HPDC
alloy initially decreased followed by a slight increase with increase in time. The fluctuations in
OCP values of these two alloys were relatively less as compared to that of the SC alloy. Thus,
the passive films formed on the surfaces of the IC and HPDC alloys were relatively more
protective.
Average values of OCP were calculated and these were -1476, -1494 and -1494 mV for the
HPDC, SC and IC alloys, respectively as shown in Fig. 6.2. The characteristic corrosion
behavior of the alloys cannot be predicted from OCP values, however, it serves as a reference
for the subsequent tests i.e., EIS and potentiodynamic polarization scan.

Chapter 6. Corrosion behaviour
42
0 400 800 1200 1600 2000-1600
-1550
-1500
-1450
-1400
3
2
Pote
ntia
l (m
V v
s. A
g/A
gC
l)
Time (Sec)
1. HPDC
2. SC
3. IC
1
Fig. 6.1. Variation of OCP with time of the HPDC, SC and IC alloys.
HPDC SC IC-1600
-1550
-1500
-1450
-1400
OC
P (
mV
vs. A
g/A
gC
l)
Alloy
Fig. 6.2. Comparison of OCP of the HPDC, SC and IC alloys.
Chapter 6. Corrosion behaviour
43
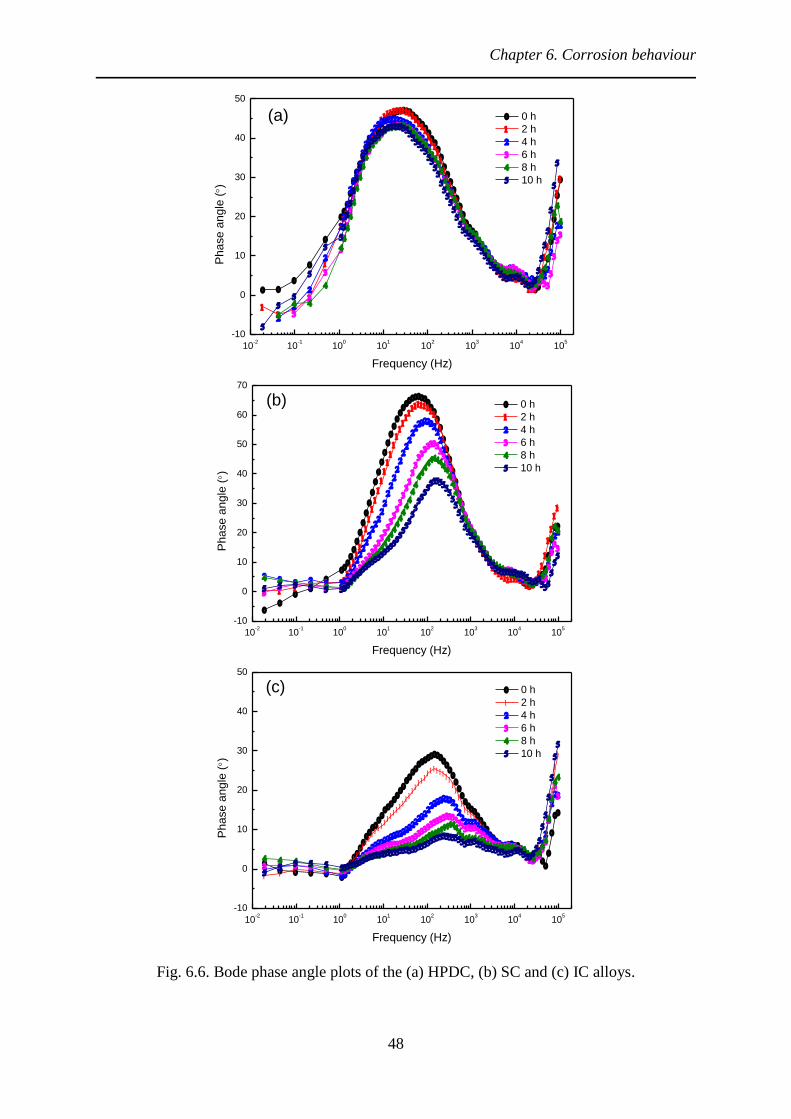
6.1.2 Electrochemical impedance spectroscopy (EIS)
Nyquist plots of all the three alloys are shown in Fig. 6.3. For comparison the data
corresponding to 0 and 10 h for all the alloys are plotted separately and shown in Fig. 6.4. The
HPDC and IC alloys exhibited the best and worst long-term corrosion resistance with the SC
alloy exhibiting intermediate corrosion rate. The Nyquist plots in all the cases consists of two
capacitive loops and one inductive loop. The high-frequency (HF) capacitive loop indicates
charge transfer resistance (Rct) from the surface to the electrolyte. In other words, the HF loop
can be considered as the diffusion of ions through passive film consisting of oxides or
hydroxides of Mg. The low-frequency (LF) capacitive and inductive loops indicated localized
corrosion attack on the surface. Considering a simple Randles circuit model for the long-term
corrosion behaviour of the alloys, the highest and lowest polarization resistance were exhibited
by the HPDC and IC alloys, respectively. Thus, passive film formed on the surface of the IC
alloy was not protective due to localized corrosion attack. Higher polarization resistance in the
HPDC and SC alloys resulted in greater deposition of corrosion products on the β-Mg17Al12
phase and lesser dissolution of α-Mg phase. This indicated weak galvanic coupling in the SC
and HPDC alloys. Diameter of capacitive loops obtained for all the alloys progressively
decreased, which implies that corrosion resistance decreased with increase in time i.e., from 0
to 10 h, as shown in Fig. 6.3 and 6.4. The same behaviour as observed in Nyquist plots was
also observed in Bode magnitude plots (BMPs) and Bode phase plots (BPPs) shown in Fig. 6.5
and 6.6, respectively. Positive slope at low-frequency (LF) depicted inductive behaviour,
whereas, negative slope indicated capacitive behaviour in BMP. Reverse is true in BPPs i.e.,
negative slope at LF represented inductive behaviour and positive slope at HF depicted
capacitive behaviour. Straight lines parallel to frequency-axis in BMPs and BPPs indicated
resistive behaviour. Drastic decrease in impedance was observed at the LF region of the BMPs

Chapter 6. Corrosion behaviour
44
for all the alloys, as shown in Fig. 6.5. The breakpoint frequencies for all the sequences for all
the alloys were nearly same indicating constant rate of hydrogen emission [40].

Chapter 6. Corrosion behaviour
45
0 500 1000 1500 2000 2500-400
-200
0
200
400
600
800
(a)
Z"
(oh
m.c
m²)
Z' (ohm.cm²)
0 h 2 h 4 h 6 h 8 h 10 h
0 500 1000 1500 2000 2500 3000 3500-400
0
400
800
1200
1600
(b)
Z"
(oh
m.c
m²)
Z' (ohm.cm²)
0 h 2 h 4 h 6 h 8 h 10 h
0 100 200 300 400 500-25
0
25
50
75
100
125
150
(c)
Z"
(oh
m.c
m²)
Z' (ohm.cm²)
0 h 2 h 4 h 6 h 8 h 10 h
Fig. 6.3. Nyquist plots of (a) HPDC, (b) SC and (c) IC alloys.

Chapter 6. Corrosion behaviour
46
0 500 1000 1500 2000 2500 3000 3500-400
0
400
800
1200
1600
Z"
(oh
m.c
m²)
Z' (ohm.cm²)
HPDC
SC
IC
(a)
0 500 1000 1500 2000 2500 3000 3500-400
0
400
800
1200
1600
(b)
Z"
(oh
m.c
m²)
Z' (ohm.cm²)
HPDC
SC
IC
0 200 400 600 800 1000 1200 1400 1600-260
-130
0
130
260
390
520
650
(c)
Z"
(oh
m.c
m²)
Z' (ohm.cm²)
HPDC
SC
IC
Fig. 6.4. Nyquist plots of all the alloys at (a) 0 h, (b) 10 h and (c) magnified view of (b).

Chapter 6. Corrosion behaviour
47
10-2
10-1
100
101
102
103
104
105
102
103
(a)
Imp
ed
an
ce
(o
hm
.cm
²)
Frequency (Hz)
0 h 2 h 4 h 6 h 8 h 10 h
10-2
10-1
100
101
102
103
104
105
102
103
(b)
Imp
ed
an
ce
(o
hm
.cm
²)
Frequency (Hz)
0 h 2 h 4 h 6 h 8 h 10 h
10-2
10-1
100
101
102
103
104
105
102
103
(c) 0 h 2 h 4 h 6 h 8 h 10 h
Imp
ed
an
ce
(o
hm
.cm
²)
Frequency (Hz)
Fig. 6.5. Bode impedance plots of the (a) HPDC, (b) SC and (c) IC alloys.
Chapter 6. Corrosion behaviour
48
10-2
10-1
100
101
102
103
104
105
-10
0
10
20
30
40
50
Ph
ase
an
gle
()
Frequency (Hz)
0 h 2 h 4 h 6 h 8 h 10 h
(a)
10-2
10-1
100
101
102
103
104
105
-10
0
10
20
30
40
50
60
70
(b)
Ph
ase
an
gle
()
Frequency (Hz)
0 h 2 h 4 h 6 h 8 h 10 h
10-2
10-1
100
101
102
103
104
105
-10
0
10
20
30
40
50
(c)
Ph
ase
an
gle
()
Frequency (Hz)
0 h 2 h 4 h 6 h 8 h 10 h
Fig. 6.6. Bode phase angle plots of the (a) HPDC, (b) SC and (c) IC alloys.

Chapter 6. Corrosion behaviour
49
6.1.3 Potentiodynamic polarization scan
The results of potentiodynamic polarization scans for all the alloys are shown in Fig. 6.7.
Corrosion rates were determined by Tafel extrapolation method from the cathodic branch of
the polarization curves and shown in Fig. 6.8. Corrosion rates were 0.52, 2.97 and 11.71 mm/y
for the HPDC, SC and IC alloys, respectively. The values of various parameters obtained from
the plots shown in Fig. 6.7 are summarized in Table 6.1. The HPDC alloy exhibited more
positive Ecorr and the lowest corrosion rate owing to higher Al content in the α-Mg phase.
However, among the three alloys the IC alloy containing lowest concentration of Al in the α-
Mg phase revealed intermediate corrosion resistance. The maximum shift in Ecorr from OCP
towards more positive potential indicated the best corrosion resistance of the HPDC alloy
among the alloys employed in the present investigation.
Table 6.1. Values of various parameters obtained from the potentiodynamic polarization
plots.
Alloy Ecorr
(mV) a
(mV) c
(mV) Icorr
(mA/cm2) Corrosion rate
(mm/y)
HPDC -1306 58 392 0.02 0.52
SC -1382 171 380 0.13 2.97
IC -1420 262 386 0.51 11.71

Chapter 6. Corrosion behaviour
50
-1700 -1600 -1500 -1400 -1300 -1200
10-4
10-3
10-2
10-1
100
101
1
2
Cu
rre
nt d
en
sity (
mA
/cm
2)
Potential (mV vs. Ag/AgCl)
1. HPDC
2. SC
3. IC3
Fig. 6.7. Potentiodynamic polarization plots for all the alloys.
HPDC SC IC0
2
4
6
8
10
12
14
Co
rro
sio
n r
ate
(m
m/y
)
Alloy
Fig. 6.8. Comparison of corrosion rate obtained from Tafel extrapolation.

Chapter 6. Corrosion behaviour
51
6.2 Microstructural observation after corrosion tests
Representative micrographs of passive films formed on the corroded surfaces of all the alloys
are shown in Fig. 6.9. It is obvious from Fig. 6.9(a) that the surface of the HPDC alloy was
least affected by corrosion. The surface of the IC alloy shown in Fig. 6.9(c) exhibited
discontinuous passive film with large number of cracks and microvoids on it. In contrast, the
film on the SC alloy was relatively uniform and almost free from microvoids as shown in Fig.
6.9(b).
The XRD pattern obtained from the corroded surface of the SC alloy is shown in Fig. 6.10 as
a representative picture for all the alloys. The pattern consists of Mg(OH)2 phase as corrosion
product along with the α-Mg and β-Mg17Al12 phases. The non-adherent corrosion product
obtained from the corroded specimen was collected for FTIR analysis. The representative FTIR
pattern obtained from the corrosion product of the SC alloy is shown in Fig. 6.11. Presence of
Mg(OH)2 (brucite) and Mg5(CO3)4(OH)2.4(H2O) (hydromagnesite) was confirmed in the
corrosion product [41]. The very distinct –OH peaks at 3698 and 473 cm−1 confirmed the
presence of Mg(OH)2. The sharp CO32− asymmetric bending peaks at 1484 and 1426 cm−1 was
attributed to hydromagnesite. The peak at 854 cm−1 was due to the CO32− bending vibration
band. The peak at 3451 cm−1 was also observed in the reference spectra of hydromagnesite.

Chapter 6. Corrosion behaviour
52
Fig 6.9. SEM micrographs of the surfaces corresponding to the (a) HPDC, (b) SC and (c) IC
alloys before removal of corrosion products.
Chapter 6. Corrosion behaviour
53
10 20 30 40 50 60 70 80 90
In
ten
sity (
A. U
.)
2 (Degree)
Mg
Mg17
Al12
Mg(OH)2
20 40 60 80
Mg
Mg17
Al12
Inte
nsity (
A. U
.)2 (Degree)
Fig. 6.10. XRD pattern obtained from the corroded surface of the SC alloy.
4000 3500 3000 2500 2000 1500 1000 5000.0
0.5
1.0
1.5
2.0
2.5
3.0
Ab
so
rba
nce
(A
. U
.)
Wavenumber (cm-1)
-OH bond
-CO2-
3 bond
Fig. 6.11. FTIR pattern of corrosion product obtained from the corroded surface of the SC
alloy.

Chapter 6. Corrosion behaviour
54
Fig. 6.12(a-c) shows the corroded surfaces of all the alloys after removal of corrosion products.
It is evident that the α-Mg phase was preferentially dissolved and a network of β-Mg17Al12
phase is standing as a corrosion resistant barrier in all the alloys. SEM micrograph of cross-
section of the corroded surface of the IC alloy is shown in Fig. 6.13. It is obvious that the β-
Mg17Al12 phase remained as a corrosion resistant barrier and the α-Mg phase was selectively
removed by corrosion. Thus, preferential dissolution of the α-Mg phase was also confirmed
from the observation of cross-section. Corrosion initiated at the interface of α-Mg and β-
Mg17Al12 phases, which is reported in literature as well [45]. There is a potential difference
between the α-Mg and β-Mg17Al12 phases resulting in micro-galvanic coupling between them
[42-44]. The β-Mg17Al12 phase is cathodic to α-Mg. Thus, the α-Mg phase was removed by
galvanic corrosion. The β-Mg17Al12 phase acted as a barrier to corrosion up to some extent,
however, it was undermined owing to the selective dissolution of α-Mg phase. Thus, the
superior corrosion resistance exhibited by the HPDC alloy in the present investigation was
attributed to: the higher concentration of Al in the α-Mg phase; the observed smallest grain size
in it. The beneficial effects of finer grain size to corrosion resistance of Mg alloys was well
explained elsewhere [21,46].

Chapter 6. Corrosion behaviour
55
Fig. 6.12. SEM micrographs of the (a) HPDC, (b) SC and (c) IC alloys after removal of
corrosion products.
Chapter 6. Corrosion behaviour
56
Fig. 6.13. SEM micrograph of cross-section of the corroded surface of the IC alloy.
57
Chapter 7. Conclusions
The relationships of microstructure with tensile, creep and corrosion behaviour of the AZ91
Mg alloy produced by three different casting techniques was investigated. The following
conclusions are drawn:
i. All the as-cast alloys consisted of primary Mg (α-Mg) and β-Mg17Al12 phases. The
volume fraction of the β-Mg17Al12 phase was the highest in the ingot casting (IC),
intermediate in the squeeze-casting (SC) and the lowest in the high pressure die-casting
(HPDC).
ii. The best tensile properties were exhibited by the SC alloy at all the temperatures
employed in the present investigation owing to the presence of negligible porosity and
relatively finer grain size. Fracture surfaces of the broken tensile specimens revealed
quasi-cleavage fracture.
iii. The best and worst creep resistance were exhibited by the SC and HPDC alloys with
the IC alloy exhibiting the intermediate creep resistance. Poor creep resistance of the
HPDC alloy was attributed to the presence of higher amount of porosity that allowed
easy crack initiation and growth during creep test. The presence of negligible porosity
and continuous network of eutectic phase contributed to superior creep resistance of the
SC alloy.
iv. The best and worst corrosion resistance were exhibited by the HPDC and IC alloys.
The superior corrosion resistance of the HPDC alloy was attributed to the relatively
finer grain size and higher percentage of Al content in the α-Mg phase.

Chapter 7. Conclusions
58
v. The SC alloy exhibited the best tensile and creep properties with intermediate corrosion
resistance among the alloys employed in the present investigation. Therefore, the SC
technique is recommended for mass production of the AZ91 alloy.

59
References
[1] B.L. Mordike, T. Ebert, 302 (2001) 37-45.
[2] M.O. Pekguleryuz, K.U. Kainer, A.A. Kaya, eds., Fundamentals of Magnesium Alloy
Metallurgy, Woodhead Publishing Limited, 2013.
[3] H. Baker, ed., ASM Handbook, Volume 3, Alloy Phase Diagrams, ASM International,
1992.
[4] M.M. Avedesian, H. Baker, eds., Magnesium and Magnesium Alloys, ASM
International, 1999.
[5] A.A. Luo, JOM 54 (2002) 42-48.
[6] J.R. Davis, ed., Tensile Testing, ASM International.
[7] J.W.D. Callister, Materials Science and Engineering: An Introduction, 7th ed., John
Wiley & Sons, Inc.
[8] W.F. Hosford, Mechanical Behavior of Materials, 2nd ed., Cambridge university press,
2009.
[9] G.E. Dieter, Mechanical Metallurgy, Third, McGraw-Hill, 2013.
[10] E.J. Vinarcik, High Integrity Die Casting Processes, John Wiley & Sons, Inc., 2003.
[11] E.M. Gutman, Y. Unigovski, M. Levkovich, Z. Koren, E. Aghion, M. Dangur, Mater.
Sci. Eng. A 234-236 (1997) 880-883.
[12] C.H. Cáceres, C.J. Davidson, J.R. Griffiths, C.L. Newton, Mater. Sci. Eng. A 325 (2002)
344-355.
[13] M.S. Dargusch, M.A. Easton, S.M. Zhu, G. Wang, Mater. Sci. Eng. A 523 (2009) 282-
288.
[14] L. Han, D.O. Northwood, X. Nie, H. Hu, Mater. Sci. Eng. A 512 (2009) 58-66.
[15] T. Zhu, Z.W. Chen, W. Gao, J. Alloys Compd. 501 (2010) 291-296.
[16] J. Zheng, Q. Wang, Z. Jin, T. Peng, J. Alloy. Compd. 496 (2010) 351-356.

References
60
[17] T.V. Ferri, A.P. Figueiredo, C.R.F. Ferreira, W. Hormaza, C.A. Santos, J.A. Spim,
Mater. Sci. Eng. A 527 (2010) 4624-4632.
[18] B.H. Kim, S.M. Jo, Y.C. Lee, Y.H. Park, I.M. Park, Mater. Sci. Eng. A 535 (2012) 40-
47.
[19] J. Bai, Y. Sun, F. Xue, J. Qiang, Mater. Sci. Eng. A 552 (2012) 472-480.
[20] A.K. Mondal, A.R. Kesavan, B.R.K. Reddy, H. Dieringa, S. Kumar, Mater. Sci. Eng. A
631 (2015) 45-51.
[21] G. Song, Corros. Sci. 41 (1998) 249-273.
[22] R. Ambat, N.N. Aung, W. Zhou, Corros. Sci. 42 (2000) 1433-1455.
[23] S. Mathieu, C. Rapin, J. Steinmetz, P. Steinmetz, Corros. Sci. 45 (2003) 2741-2755.
[24] G. Ballerini, U. Bardi, R. Bignucolo, G. Ceraolo, Corros. Sci. 47 (2005) 2173-2184.
[25] C. Blawert, E.D. Morales, W. Dietzel, K.U. Kainer, Mater. Sci. Forum 488-489 (2005)
697-700.
[26] G.L. Song, D.H. St John, T. Abbott, Int. J. Cast Met. Res. 18 (2005) 174-180.
[27] F. Cao, Z. Shi, G.L. Song, M. Liu, M.S. Dargusch, A. Atrens, Corros. Sci. 94 (2015)
255-269.
[28] E.J. Lavernia, T.S. Srivatsan, J. Mater. Sci. 45 (2010) 287-325.
[29] S. Barbagallo, H.I. Laukli, O. Lohne, E. Cerri, J. Alloys Compd. 378 (2004) 226-232.
[30] M.D. Nave, A.K. Dahle, D.H. StJohn, in:, H.I. Kaplan, J. Hryn, B. Clow (Eds.), Magnes.
Technol., TMS 2000, 2000, pp. 233–242.
[31] J.A. Dantzig, M. Rappaz, Solidification, First, EPFL, 2009.
[32] E.M. Gutman, Y. Unigovski, M. Levkovitch, Z. Koren, J. Mater. Sci. Lett. 17 (1998)
1787-1789.
[33] P. Sharifi, Y. Fan, J.P. Weiler, J.T. Wood, J. Alloys Compd. 605 (2014) 237-243.
[34] J. Dúl, R. Szabó, A. Simcsák, Mater. Sci. Forum 649 (2010) 473-479.

References
61
[35] H.A. Patel, D.L. Chen, S.D. Bhole, K. Sadayappan, J. Alloys Compd. 496 (2010) 140-
148.
[36] M. Regev, E. Aghion, A. Rosen, M. Bamberger, Mater. Sci. Eng. A 252 (1998) 6-16.
[37] S. Spigarelli, M. Regev, E. Evangelista, A. Rosen, Mater. Sci. Technol. 17 (2001) 627-
638.
[38] B. Nami, S. Rashno, S.M. Miresmaeili, J. Alloys Compd. 639 (2015) 308-314.
[39] D. Amberger, P. Eisenlohr, M. Goken, Acta Mater. 60 (2012) 2277-2289.
[40] G. Walter, Corros. Sci. 26 (1986) 681-703.
[41] M. Jönsson, D. Persson, D. Thierry, Corros. Sci. 49 (2007) 1540-1558.
[42] O. Lunder, J.E. Lein, S.M. Hasjevik, T.K. Aune, K. Nisanciglu, Werkstoffe Und
Korrosion 45 (1994) 331-340.
[43] G.L. Song, A. Atrens, X. Wu, B. Zhang, Corros. Sci. 40 (1998) 1769-1791.
[44] G.L. Song, A.L. Bowles, D.H. StJohn, Mater. Sci. Eng. A 366 (2004) 74-86.
[45] G.L. Song, A. Atrens, Adv. Eng. Mater. 5 (2003) 837-858.
[46] A.K. Mondal, S. Kumar, C. Blawert, N.B. Dahotre, Surf. Coatings Technol. 202 (2008)
3187-3198.

62
Bio-Data
Name Hrishikesh Shastri
Date of birth 25 August 1990
Permanent home address Plot No. 1200/13, Kelo Vihar Colony,
Raigarh, Chhattisgarh-496001.
Email [email protected]
Educational qualification
Course Institution Board /University Year of
Completion
Performance
% / CGPA
B.E.
(Metallurgy)
O.P. Jindal Institute of
Technology, Raigarh
(C.G.)
Chhattisgarh Swami
Vivekanand Technical
University, Bhilai, (C.G).
2012 8.53
12th O.P. Jindal School,
Raigarh CBSE 2008 73.3
10th O.P. Jindal School,
Raigarh CBSE 2006 85.6
Proposed publications from this work
1. H. Shastri, A. K. Mondal, K. Dutta, H. Dieringa and S. Kumar, Correlation of
microstructure with tensile and creep behaviour of AZ91 Mg alloy fabricated by three
different casting techniques (Manuscript under preparation)
2. H. Shastri, A. K. Mondal, K. Dutta, H. Dieringa and S. Kumar, Correlation of
microstructure with corrosion behaviour of AZ91 Mg alloy fabricated by three different
casting techniques (Manuscript under preparation)
Related Documents